


Languages
Pages
Legal


Teacher autonomy: how does it relate to job satisfaction and retention?
Jack Worth and Jens Van den Brande

Acknowledgements
We are very grateful for the support of the Teacher Development Trust, who arranged the practitioner focus group and contributed their knowledge of teacher professional development to the project. We thank the teachers and senior leaders who participated in the focus group very much for giving up their time to give their feedback on the research.
We also thank the Institute of Physics for hosting the roundtable, and the participants for attending and giving us their feedback on the research, from: the Department for Education, Ofsted, NAHT, National Education Union, NASUWT, Chartered College of Teaching, National Association of School-Based Teacher Trainers (NASBTT), Confederation of School Trusts and Ambition Institute.
In partnership with the Teacher Development Trust.Published in January 2020 by:
National Foundation for Educational Research The Mere, Upton Park, Slough SL1 2DQ
www.nfer.ac.uk
© 2020 National Foundation for Educational Research
Registered Charity No. 313392
ISBN: 978-1-911039-98-3
How to cite this publication:Worth, J. and Van den Brande, J. (2020) Teacher autonomy: how does it relate to job satisfaction and retention? Slough: NFER.
www.nfer.ac.uk02 www.nfer.ac.uk

Overview
Retaining more teachers is crucial for the education system when there are not enough teachers coming in to the profession to meet the growing need from rising pupil numbers. Unmanageable workload and low job satisfaction are significant factors determining teachers’ decision to stay in the profession or leave.
Our research is the first large-scale quantitative study to look at teacher autonomy and its importance for retention in England. We find that teacher autonomy is strongly correlated with job satisfaction, perceptions of workload manageability and intention to stay in the profession. We also find that the average teacher has a lower level of autonomy compared to similar professionals.
Teachers’ autonomy over their professional development goal-setting is particularly low, and is the most associated with higher job satisfaction. Increasing teachers’ autonomy, particularly over their professional development goals, therefore has great potential for improving teacher job satisfaction and retention.
School leaders and the Department for Education should consider how to adapt policy and practice to harness the benefits of teachers having greater involvement in their professional development goal-setting and making decisions more widely.
03www.nfer.ac.uk

Key findings
z Teachers are 16 percentage points less likely than similar professionals to report having ‘a lot’ of influence over how they do their job
The average teacher in England also reports a lower level of autonomy over what tasks they do, the order in which they carry out tasks, the pace at which they work and their working hours, compared to similar professionals.
z 38 per cent of teachers say that they have ‘a little’ or ‘no’ influence over their professional development goals
Teachers also report relatively low autonomy over assessment and feedback, pupil data collection and curriculum content in their phase or subject. Teachers report relatively high autonomy in areas associated with classroom management and practice, such as classroom layout, teaching methods, planning and preparing lessons, use of classroom time and rules for behaviour.
z Teacher autonomy is lower among early career teachers and higher among senior leaders
In general, teachers who stay in the classroom after their first five years do not experience increased autonomy as their careers progress and are likely to only if they enter leadership roles.
z Teacher autonomy is strongly associated with improved job satisfaction and a greater intention to stay in teaching
While correlation does not necessarily imply a causal relationship, these associations strongly suggest that teacher autonomy is an important influence on job satisfaction and retention. Teacher autonomy is also strongly associated with workload being more manageable, but is not associated with working hours.
z Increasing teachers’ reported influence over their professional development (PD) goals from ‘some’ to ‘a lot’ is associated with a nine‑percentage‑point increase in intention to stay in teaching
This presents a significant opportunity for school leaders to consider how they design and deliver PD in their schools, harnessing the benefits of increased motivation from teachers having greater involvement in their PD goal-setting.
Recommendations
Department for Education (DfE)
The DfE should produce guidance around the Teacher CPD Standards to emphasise how teachers can be given greater involvement in designing content, processes and goals.
The DfE should embed the principles of teacher autonomy into the implementation of the Early Career Framework. When rolled out, the framework should act as a ‘menu’ for early‑career teachers’ professional development, rather than a ‘prescription’.
School leaders
School leaders should consider incorporating a teacher autonomy lens to regular reviews of teaching and learning policies.
School leaders should explore how teachers can be meaningfully involved and engaged in the way the school defines its organisational development priorities and makes decisions more widely.
www.nfer.ac.uk04

About this research
1 By autonomy, we mean the capacity to make informed decisions and/or act independently. The term ‘agency’ is also used in the research literature to refer to a similar, although not identical, concept. Another occasionally used term is ‘job control’ (see for example, Bryson et al., 2019). We use the term ‘autonomy’, following the convention used by self-determination theory (Deci and Ryan, 2008) and the Taylor Review of Modern Working Practices (HM Government, 2018).
Aims of the research
England’s school system faces a substantial and growing challenge of ensuring there are sufficient numbers of high-quality teachers employed in schools. At a time when recruitment to secondary teacher training is below the required level, retaining teachers in the profession plays a pivotal role in teacher supply. The proportion of working-age teachers leaving the profession has risen from 5.8 per cent in 2011 to 8.3 per cent in 2018.
Our previous research has demonstrated that teachers’ engagement and job satisfaction are key factors explaining why many teachers leave the profession (Lynch et al., 2016; Worth et al., 2018). Previous research has drawn a strong link between autonomy and job satisfaction in many occupations. Our research is the first large-scale quantitative study in England to look at teacher autonomy1 and its importance for retention.
We aim to answer these five research questions:
z How does teacher autonomy compare to those in other professional occupations?
z How does teacher autonomy differ between types of teachers and schools?
z How has teachers’ professional autonomy changed over time?
z Does a greater sense of professional autonomy relate to higher job satisfaction and retention in teaching?
z In which aspects of their practice do teachers feel they have least and most autonomy over?
In the light of our findings, we draw out the implications for policy and practice and make recommendations for school leaders and policymakers.
Data and methodology
We explore teachers’ professional autonomy using data from two surveys.
First, we analyse data from the UK Household Longitudinal Study (UKHLS), which is also known as Understanding Society (University of Essex, et al., 2018). The household survey asks respondents about their self-reported work-related autonomy, as well as other aspects of their work such as job satisfaction and working hours.
We compare state-sector teachers in England to individuals in other professional occupations with similar characteristics and measure how autonomy has changed over time, as the survey has regularly included questions on autonomy since 2009 (see the methodology appendix for further details).
Second, we analyse data from NFER’s nationally representative Teacher Voice survey. In March 2019, we asked a sample of state-sector teachers and middle leaders in England about their autonomy in specific areas of classroom practice, as well as their job satisfaction and intention to leave teaching. Asking about teachers’ perceived influence over different aspects of their practice gives greater insight into the nuance of teachers’ sense of their professional autonomy. It also helps identify the areas of teachers’ practice where extending their autonomy is likely to be most effective for improving teacher satisfaction and retention.
Further detail on the data and methodology used in this report is in the methodology appendix.
05www.nfer.ac.uk

Autonomy plays an important role in teachers’ motivation and professionalism
One of the most important challenges facing any employer or leader is deciding how best to create working conditions that maximise staff motivation to perform well in their role. This challenge is easier where staff are intrinsically motivated to perform well at what leaders want them to achieve. However, some degree of direction is always necessary and staff being extrinsically motivated is where leaders enforce their direction through some form of regulation, control or reward/ punishment system.
Self-determination theory (Deci and Ryan, 2008) provides a theoretical framework for understanding motivation and its implications for staff. The theory hypothesises that while both forms of motivation can drive job performance, they have different implications for staff well-being and job satisfaction. Staff working in conditions that emphasise a greater reliance on intrinsic motivation are thought to be more likely to have high well-being and job satisfaction, and be more likely to stay. Conversely, greater reliance on extrinsic motivation is thought to risk undermining staff members’ sense of feeling trusted and their own intrinsic motivation, potentially leading to disengagement, burnout and leaving.
Deci and Ryan outline three basic psychological needs that underpin intrinsic motivation:
z Competence – skills to perform well in one’s job
z Autonomy – direction over one’s own decisions and actions
z Relatedness – connection with, and support from, colleagues.
The theory suggests that these needs are interdependent. In other words, intrinsic motivation is likely to increase more if you have all three (competence, autonomy and relatedness) at the same time. One implication of this interdependence is that too much autonomy for novices risks overwhelming them, as they are early in the process of establishing their competence and forming working relationships.
This theory of motivation underlies our interest in the professional autonomy of teachers and our findings support the theory that there is a positive relationship between autonomy, job satisfaction and retention.
www.nfer.ac.uk06
Autonomy RelatednessCompetence
Intrinsic motivation
Job performance
Satisfaction and retention
Burnout and stress
Extrinsic motivation
RewardsRegulation

There is limited existing evidence on teacher autonomy and its importance for retention in England
The existing base of large-scale quantitative evidence on our research questions on teacher autonomy, especially focusing on England, is very limited. This study is, to our knowledge, the first to provide large-scale quantitative evidence on the self-reported autonomy of England’s teachers and answers to the research questions we identify. We summarise some of the previous research that relates to our study.
Existing quantitative research
Skaalvik and Skaalvik (2014) measure work-related autonomy among Norwegian teachers and find a positive association between perceived autonomy and job satisfaction, and a negative association between autonomy and burnout. This confirms the theoretical prediction that autonomy is associated with positive teacher outcomes. Other studies have also demonstrated this relationship with positive outcomes among UK workers more generally (for example, Wheatley (2017), which uses the same UKHLS-based measures as in this study).
The OECD conceptualises teacher professionalism similarly to self-determination theory, as encompassing a teacher’s knowledge base, peer networks and autonomy. The OECD’s report on teacher professionalism presents cross-country data on all three domains from the 2013 OECD Teaching and Learning International Survey (TALIS) (OECD, 2016).
Teachers in England’s secondary schools are characterised as having an above-average level of autonomy, with several countries such as Estonia, Italy, Iceland, Czech Republic and Denmark having higher levels.
However, the autonomy measure is based on headteachers’ perceptions of teachers’ exertion of decision-making authority. This may not be a reliable guide to how teachers themselves feel about their influence over their own work. Indeed, England’s secondary teachers had the lowest level of agreement with the statement “this school provides staff with opportunities to actively participate in school decisions” among all the countries that took part in TALIS 2013 (see chart, comparing England and selected countries).
The 2013 TALIS survey included an England-only question on teachers’ autonomy. Teachers in lower secondary schools were asked their extent of agreement with the statement: “I do not have the autonomy I need to do a good job as a teacher.” Seven out of ten teachers (71 per cent) disagreed or strongly disagreed, implying that they do have the autonomy they need to do a good job (Micklewright et al., 2014).
The responses did not differ substantially by teacher gender, age, subject or type of state-funded school.
However, teachers in independent schools were more likely to say they had the autonomy they needed, and teachers in schools rated requires improvement or inadequate by Ofsted less likely.
Filling the evidence gap
We aim to fill the significant evidence gap in quantitative research on teacher autonomy in England. The next sections of the report present our findings and draw out the implications for school leaders and policymakers.
07www.nfer.ac.uk
Proportion of lower secondary school teachers agreeing that their school provides staff with opportunities to actively participate in school decisions (%)
0% 20% 40% 60% 80% 100%
83
83
81
57
76
75
75
71
64
Norway
Estonia
Alberta (Canada)
Japan
Finland
Singapore
Netherlands
Australia
England
Source: OECD Teaching and Learning International Survey (TALIS) 2013

Teachers have a lower level of professional autonomy compared to other professions
Using data from the UKHLS, we compare the self-reported autonomy of teachers with a group of individuals in professional occupations (including scientists, researchers, engineers, doctors, nurses, lawyers, librarians) to benchmark teaching within a wider context. We adjust the composition of age, gender, region and highest qualification in the group of professionals to ensure that these characteristics are as similar as possible to the group of teachers (see appendix for details).
We find that teachers report a lower level of autonomy over their working hours relative to similar professionals: half of teachers report having no autonomy, compared to only 15 per cent of similar professionals. This is to be expected, given the set term times and school hours when teachers are required to be teaching. In contrast, more than half of teachers report that they have ‘a lot’ or ‘some’ autonomy over the pace of their work, job tasks, task order and work manner.
Overall the average teacher has a lower level of autonomy for every aspect of work that is measured by the survey, compared to similar professionals. All the differences are statistically significant. The autonomy gap between teachers and other professionals (the likelihood of reporting ‘a lot’ of influence) is:
z 19 percentage points over the pace at which they work (work pace)
z 12 percentage points over what tasks they do (job tasks)
z 20 percentage points over the order in which they carry out tasks (task order)
z 16 percentage points over how they do their job (work manner).
Teacher autonomy is likely to be influenced, at least in part, directly by the nature of the job of teaching. However, we should be cautious about interpreting the findings as the impact of the teaching job, because the comparisons presented here may also reflect other underlying differences between those who go into teaching and those who do not.
www.nfer.ac.uk08
In your current job, how much influence do you have over your ... (proportion of respondents, %)
0% 20% 40% 60% 80% 100%
None A little Some A lot
51 23 17 9Teachers
15 18 31 36Professionals
14 23 35 28Teachers
7 13 33 47Professionals
8 18 42 32Teachers
7 13 36 44Professionals
4 15 37 44Teachers
2 6 27 64Professionals
2 12 40 46Teachers
2 7 28 62Professionals
10% 90%70%30% 50%
Work manner
Taskorder
Jobtasks
Workpace
Workhours
Source: NFER analysis of UKHLS data
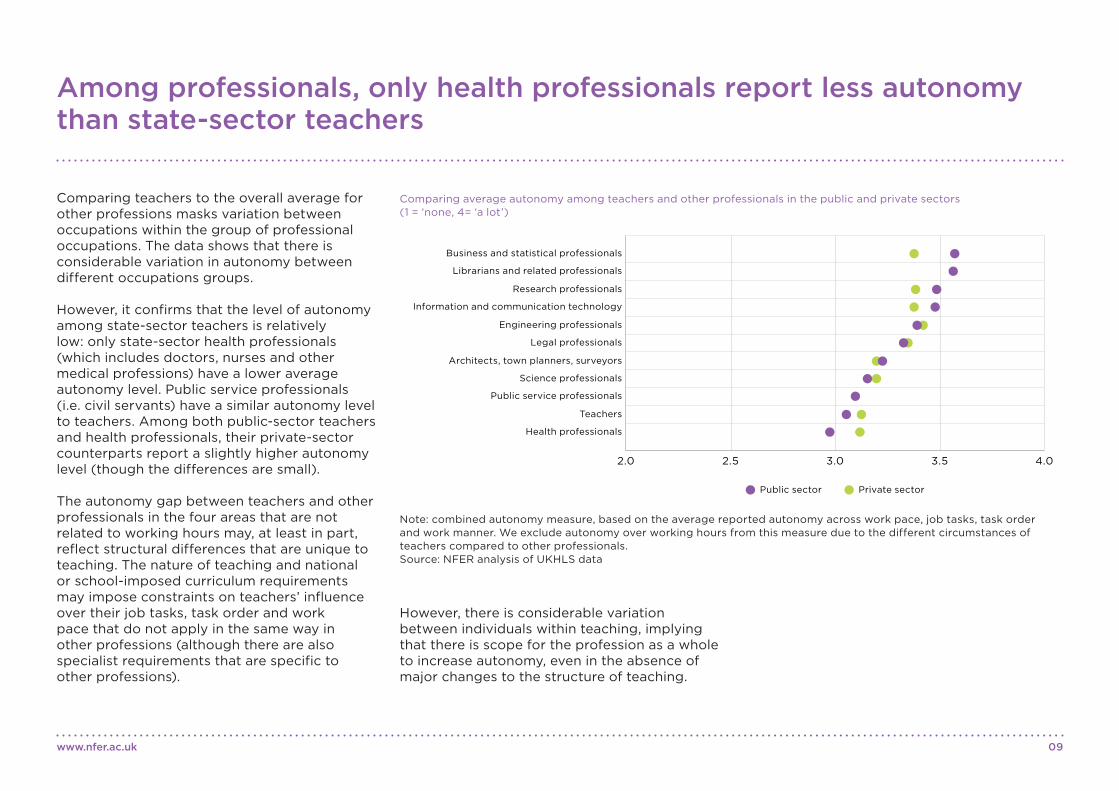
Among professionals, only health professionals report less autonomy than state‑sector teachers
Comparing teachers to the overall average for other professions masks variation between occupations within the group of professional occupations. The data shows that there is considerable variation in autonomy between different occupations groups.
However, it confirms that the level of autonomy among state-sector teachers is relatively low: only state-sector health professionals (which includes doctors, nurses and other medical professions) have a lower average autonomy level. Public service professionals (i.e. civil servants) have a similar autonomy level to teachers. Among both public-sector teachers and health professionals, their private-sector counterparts report a slightly higher autonomy level (though the differences are small).
The autonomy gap between teachers and other professionals in the four areas that are not related to working hours may, at least in part, reflect structural differences that are unique to teaching. The nature of teaching and national or school-imposed curriculum requirements may impose constraints on teachers’ influence over their job tasks, task order and work pace that do not apply in the same way in other professions (although there are also specialist requirements that are specific to other professions).
However, there is considerable variation between individuals within teaching, implying that there is scope for the profession as a whole to increase autonomy, even in the absence of major changes to the structure of teaching.
09www.nfer.ac.uk
Comparing average autonomy among teachers and other professionals in the public and private sectors (1 = ‘none, 4= ‘a lot’)
2.0 2.5 3.5 4.03.0
Librarians and related professionals
Business and statistical professionals
Research professionals
Engineering professionals
Information and communication technology
Legal professionals
Architects, town planners, surveyors
Public service professionals
Science professionals
Teachers
Health professionals
Public sector Private sector
Note: combined autonomy measure, based on the average reported autonomy across work pace, job tasks, task order and work manner. We exclude autonomy over working hours from this measure due to the different circumstances of teachers compared to other professionals.Source: NFER analysis of UKHLS data

The teacher autonomy gap compared to other professions is a long‑standing one
The overall findings so far are based on averages across the four survey waves in which these questions featured: every two years between 2010–11 and 2016–17. We find that the level of professional autonomy among both teachers and similar professionals has not changed significantly during this period from 2010–11 to 2016–17.
The size of the autonomy gap between teachers and other professionals is a long-standing one, not one that has emerged recently. This suggests that teacher autonomy in England has not been significantly affected by policy changes since 2010. For example, the increase in school autonomy since 2010 through the growth of academy schools does not seem to have resulted in any changes to the overall levels of teacher autonomy.
The most notable change over time is the steady fall in the proportion of teachers reporting that they have ‘a lot’ of influence over how they do their work (work manner) between 2010–11 and 2016–17. The five-percentage point change is not statistically significant, but it could represent an emerging downward trend that will continue in the future.
NFER will track the future trends for teachers and similar professionals when the next set of data, covering 2018–19, is released in November 2020.
www.nfer.ac.uk10
Comparing levels of autonomy among teachers and other professionals for aspects of work across four biennial surveys, showing proportion reporting ‘a lot’ of autonomy (%)
Working hours Work pace Job tasks Task order Work manner
2012
–13
2010
–11
2016
–17
2014
–15
0
20
40
60
80
100
2012
–13
2010
–11
2016
–17
2014
–15
2012
–13
2010
–11
2016
–17
2014
–15
2012
–13
2010
–11
2016
–17
2014
–15
2012
–13
2010
–11
2016
–17
2014
–15
Similar professionalsTeachers
Source: NFER analysis of UKHLS data

Teacher autonomy does not increase with age/experience, as in other professions
2 A proxy for experience, which is not measured directly in the UKHLS.3 A proxy that is likely to identify middle and senior leaders.4 After accounting for other teacher (gender) and school (phase, Ofsted rating, school type) characteristics.
Self-determination theory predicts that autonomy grows with experience, as people become more competent, respected and trusted throughout their career. However, we find that for teachers in non-managerial roles there is a slightly decreasing relationship between age 2 and autonomy. Teachers in a ‘manager’ or ‘supervisor’ role3 have higher average autonomy than teachers in non-managerial roles.
This is in contrast to those in other professions, for whom autonomy increases between their 20s and 30s, even for those who do not enter management roles (where autonomy is also higher than in non-managerial roles). Our analysis shows that teachers and other professionals in non-managerial roles in their 20s have similar levels of autonomy, but that teachers have lower average autonomy at all other ages, in both managerial and non-managerial roles, compared to similar professionals.
The Teacher Voice data (see next page for details) provides further evidence that autonomy remains at a similar level over a classroom teacher’s career, except for the first few years. The data shows that teachers with fewer than six years of experience have lower autonomy compared to teachers with more experience.4 There are no significant differences in the average level of autonomy among teachers with more years of experience.
This suggests that, in general, teachers who stay in the classroom after their first five years do not experience increased autonomy as their careers progress and are likely to only if they enter leadership roles.
11www.nfer.ac.uk
Comparing average levels of autonomy among teachers in non-managerial roles with those in ‘manager’ or ‘supervisor’ roles, by age group (1 = ‘none, 4= ‘a lot’)
Teachers Similar professionals
2.0
2.5
3.0
3.5
4.0
20
–29
30
–39
40
–49
50
–59
20–2
9
30
–39
40
–49
50
–59
Non-managerialManager/supervisor
Ag
e
Source: UKHLS data
Difference in autonomy associated with experience
-0.4 -0.2 0 0.2 0.4
0–5 years
6–10 years
16–20 years
More than 20 years
11–15 years (reference)
Source: NFER analysis of Teacher Voice data

Over which areas of their work do teachers report having the most autonomy?
The UKHLS autonomy measures on which the previous sections are based are useful for understanding teachers’ level of autonomy relative to other professions. However, the measures provide only limited insight into the detail of teacher autonomy because the survey questions are worded generically. We wanted to look further into the detail of teacher autonomy, so we asked teachers and middle leaders questions about their autonomy over 12 aspects of their work in NFER’s Teacher Voice survey.
We find that autonomy varies considerably between these different areas of teachers’ work. Teachers report relatively high autonomy in areas associated with classroom management and practice such as classroom layout (65 per cent reporting ‘a lot’ of influence), teaching methods (55 per cent), planning and preparing lessons (54 and 52 per cent, respectively), use of classroom time (43 per cent) and rules for behaviour (40 per cent).
Teachers report lower autonomy over assessment and feedback (between 29 and 33 per cent) and pupil data collection (12 per cent). Most schools have policies covering their expectations in this area, which direct teachers to some extent.
Teachers also report low levels of autonomy over curriculum content in their phase or subject (26 per cent). Schools in England have, since the introduction of the National Curriculum, standardised their curriculum offer across teachers, and typically senior teaching staff, especially subject/phase leaders, have most influence over changes to curriculum content.
Teachers report a low level of autonomy over their professional development goals. A quarter (23 per cent) report having ‘a lot’ of influence and 38 per cent report ‘a little’ or ‘none’. This may include some teachers interpreting the question as relating to performance appraisal goals. Nonetheless, it is interesting that a substantial proportion of teachers report having little direction over how they intend to improve their practice and grow as professionals in future.
www.nfer.ac.uk12
In general, how much influence do you have over the following in your job? (%)
0% 20% 40% 60% 80% 100%
None A little Some A lot
8
2
4
5
8
7
13
10
10
18
10
33
9
11
13
12
19
17
20
23
22
21
28
29
18
32
29
30
30
35
34
36
39
35
39
26
65
55
54
52
43
40
33
31
29
26
23
12
How your classroom is physically laid out
What teaching methods or strategies you use
How you prepare your lessons/ schemes of work
How you plan your lessons/ schemes of work
How the use of time in your classroom is scheduled
What the standards and rules for behaviour in your classroom are
How often you provide feedback to your pupils
How you assess pupils’ learning to your inform teaching
How you provide feedback to your pupils
The content of the curriculum in your phase/ subject
Your professional development goals
What data you collect on pupils’ attainment
Source: NFER analysis of Teacher Voice data

Teacher autonomy is lower in School Trusts, particularly those with more than ten schools
5 Confidence intervals are shown to demonstrate the level of uncertainty around the results. If the confidence interval does not overlap the axis, then the average difference between the specified group and the reference group is statistically significant. Differences after accounting for other teacher (gender, experience) and school (phase, Ofsted rating) factors.
We also analyse the Teacher Voice data to explore the variation in teacher autonomy between different school types. We combine the 12 autonomy items into a single scale, and confirm its reliability using factor analysis (see methodology appendix for details).
We find that autonomy is significantly lower for teachers in small (2–10 schools) and large (more than 10 schools) School Trusts, compared to local authority maintained schools.5
This may be linked to Trusts standardising or aligning practices across schools as they develop, although the approach to, and extent of, standardisation/alignment differs considerably by Trust (Finch et al., 2016; Greany, 2018). Teacher autonomy is also likely to vary between Trusts with different operating models, although our sample size is not sufficient to explore this further.
Teachers in schools with Requires Improvement or Inadequate Ofsted ratings have lower autonomy compared to schools rated Good, although the difference is not statistically significant. Senior leaders in these schools are under greater pressure to make rapid improvements, which may be associated with less autonomy for teachers as a result of the measures implemented.
It is challenging to interpret this finding from this data alone: some may see this as evidence of a necessary step on the path to school improvement, whereas others may see it as the negative consequences of high-stakes accountability on teachers.
Teachers in primary schools report very slightly lower autonomy than teachers in secondary schools, but the difference is not statistically significant. Small sample sizes of teachers in different types of school limit the insights possible for this analysis, and future research should explore autonomy differences across school types using larger sample sizes.
13www.nfer.ac.uk
Difference in autonomy associated with school characteristic (compared to reference group)
-0.4 -0.2 0 0.2 0.4
Secondary (reference)
Primary
Requires Improvement/Inadequate
Good (reference)
Outstanding
Small School Trusts (2–10 schools)
Maintained (reference)
Large School Trusts (11+ schools)
Single-academy trusts
School phase
School type
Ofsted rating
Source: NFER analysis of Teacher Voice data

Autonomy is strongly associated with higher teacher job satisfaction and retention
Our analysis of both UKHLS and Teacher Voice data confirms that there is a positive relationship between autonomy and job satisfaction for teachers, as Deci and Ryan’s self-determination theory suggests. Around four in ten of the small number of teachers with the lowest autonomy report low job satisfaction, compared to less than one in ten among those with the highest autonomy. Our analysis also finds that greater teacher autonomy is associated with lower job-related stress (see chart in the appendix).
Job satisfaction is an important factor associated with teachers’ intentions and decisions to stay in the profession (Lynch et al., 2016; Worth et al., 2018). Our analysis finds that autonomy is also strongly correlated with the proportion of classroom teachers intending to stay in the profession in the next 12 months. Only around half of those with the lowest autonomy are intending to stay in teaching in the short term, compared to more than 85 per cent of those with the highest autonomy.
6 It may be that, for example, teachers recognised for their competence feel more satisfied and are also given more autonomy, but the increased satisfaction comes from feelings of competence and recognition and not directly from the autonomy.
Teachers’ stated intentions that they are considering leaving are not the same as their actions (Worth et al., 2015). Nonetheless, a stated intention to leave is likely to be associated with an increased risk of leaving in the short or medium term, so can be regarded as a proxy for teacher retention. Future research should explore the relationship between autonomy and retention outcomes to confirm this.
While correlation does not necessarily imply a causal relationship,6 these associations strongly suggest that teacher autonomy is an important influence on job satisfaction and retention.
www.nfer.ac.uk14
Comparing teachers’ autonomy levels with proportion intending to stay teaching in the next 12 months (%)
1 2 3 40
20
40
100
Inte
nd
ing
to
sta
y te
ach
ing
Autonomy
60
80
Source: NFER analysis of Teacher Voice data
Comparing teachers’ autonomy levels (1 = ‘none’, 4= ‘a lot’) with proportion reporting low job satisfaction (%)
1 2 3 40
20
40
60
Lo
w jo
b s
atis
fact
ion
Autonomy
Source: NFER analysis of Understanding Society data
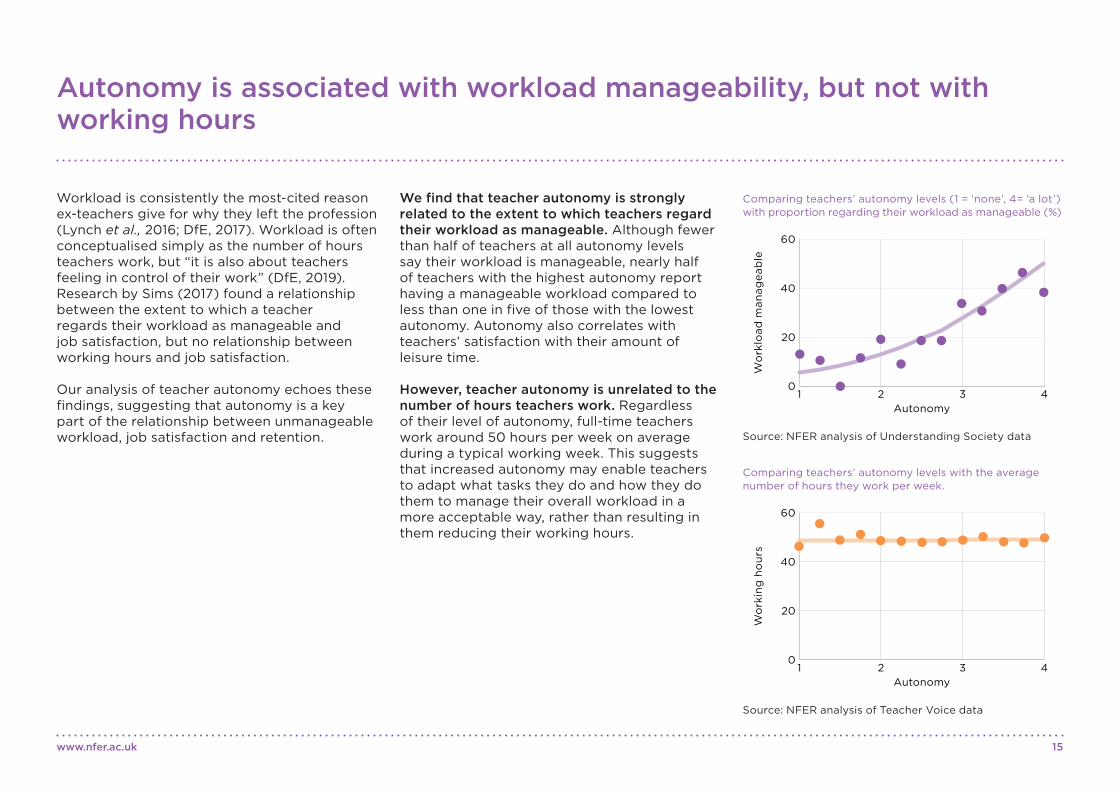
Autonomy is associated with workload manageability, but not with working hours
Workload is consistently the most-cited reason ex-teachers give for why they left the profession (Lynch et al., 2016; DfE, 2017). Workload is often conceptualised simply as the number of hours teachers work, but “it is also about teachers feeling in control of their work” (DfE, 2019). Research by Sims (2017) found a relationship between the extent to which a teacher regards their workload as manageable and job satisfaction, but no relationship between working hours and job satisfaction.
Our analysis of teacher autonomy echoes these findings, suggesting that autonomy is a key part of the relationship between unmanageable workload, job satisfaction and retention.
We find that teacher autonomy is strongly related to the extent to which teachers regard their workload as manageable. Although fewer than half of teachers at all autonomy levels say their workload is manageable, nearly half of teachers with the highest autonomy report having a manageable workload compared to less than one in five of those with the lowest autonomy. Autonomy also correlates with teachers’ satisfaction with their amount of leisure time.
However, teacher autonomy is unrelated to the number of hours teachers work. Regardless of their level of autonomy, full-time teachers work around 50 hours per week on average during a typical working week. This suggests that increased autonomy may enable teachers to adapt what tasks they do and how they do them to manage their overall workload in a more acceptable way, rather than resulting in them reducing their working hours.
15www.nfer.ac.uk
Comparing teachers’ autonomy levels with the average number of hours they work per week.
1 2 3 40
20
40
60
Wo
rkin
g h
ou
rs
Autonomy
Source: NFER analysis of Teacher Voice data
Comparing teachers’ autonomy levels (1 = ‘none’, 4= ‘a lot’) with proportion regarding their workload as manageable (%)
1 2 3 40
20
40
60
Wo
rklo
ad m
anag
eab
le
Autonomy
Source: NFER analysis of Understanding Society data

Teachers’ autonomy over their professional development goals is most associated with higher job satisfaction
7 Differences are after accounting for other teacher (gender, experience) and school (phase, type, Ofsted rating) factors. Confidence intervals are shown to demonstrate the level of uncertainty around the results. If the confidence interval does not overlap the axis, then the average difference between the specified group and the reference group is statistically significant.
Finding a strong association between teacher autonomy and their job satisfaction and retention suggests that increasing autonomy may increase satisfaction and retention. To inform policymakers and school leaders on how they can best harness autonomy to improve teacher satisfaction and retention, we explore the nuances behind which areas of teachers’ work are most associated with positive teacher outcomes. We explore this through statistical analysis of the Teacher Voice data, identifying the extent to which changes in each autonomy area are independently associated with changes in job satisfaction and intention to stay in teaching.7
We find that teachers’ autonomy over their professional development goals is the most associated with higher job satisfaction. We also find that a one point increase (e.g., changing from ‘some’ influence to ‘a lot’) in influence over teachers’ professional development goals is associated with a nine percentage point increase in their intention to stay in teaching (see chart in the appendix).
We find above that teachers’ reported autonomy over their professional development goals is relatively low, which suggests there is plenty of scope for it to increase.
Teachers’ autonomy over the standards and rules for classroom behaviour is the only other area that has a statistically significant association with job satisfaction and intention to stay in teaching, over and above changes in other areas of autonomy. While most autonomy areas have a slightly positive association with job satisfaction, none of the other areas are individually associated with higher teacher satisfaction or retention with statistical significance.
These findings suggest that increasing teachers’ autonomy over their professional development goals has the greatest potential for increasing teacher job satisfaction and retention.
www.nfer.ac.uk16
Change in job satisfaction associated with a one-point increase in autonomy (e.g. ‘some’ to ‘a lot’)
-0.2 0 0.2 0.4 0.6
Your professional development goals
What the standards and rules for behaviour in your classroom are
How you plan your lessons/schemes of work
How you provide feedback to your pupils
How the use of time in your classroom is scheduled
How you prepare your lessons/schemes of work
How often you provide feedback to your pupils
What teaching methods or strategies you use
How you assess pupils’ learning to your inform teaching
How your classroom is physically laid out
What data you collect on pupils’ attainment
The content of the curriculum in your phase/subject
Source: NFER analysis of Teacher Voice data

School leaders can harness teacher autonomy to benefit both pupils and staff
Our analysis establishes a relationship between teachers’ autonomy and their satisfaction and retention. However, this is only one part of the picture for school leaders, who are responsible for ensuring the school operates with the necessary coherence to deliver good pupil outcomes.
School leaders can and should shape what teachers do to some extent and this can involve balancing autonomy and alignment. But saying there is a trade-off risks framing the dilemma as a straight choice between high alignment/low autonomy and low alignment/high autonomy, or somewhere in the middle. This need not always be the case and effective leadership can combine high alignment with high autonomy.
The diagram opposite is adapted from the Dixons Academies Trust ‘aligned autonomy’ approach, which Executive Principal Luke Sparkes describes as “the optimal balance between consistency and self-determination” (Sparkes, 2019). The article discusses the balance between school autonomy and consistency within a Trust, but the same principles can be applied to teachers within a school or a Trust.
As an extreme case, authoritatively establishing conformity can lead to a lack of motivation as teachers have little autonomy. While good outcomes for pupils might be achieved in the short term, it may lead to higher staff turnover and greater medium-term challenges. In another extreme case, high autonomy without alignment could lead to a chaotic culture in which all staff are experimenting. This may also be a demotivating environment as there is no common cause or coherent approach.
The ideal is therefore to combine high autonomy with coherence and alignment, where possible, to maximise the benefits that flow from both. Such an approach needs to be underpinned by both a compelling overarching vision and meaningful staff involvement and engagement, to ensure their buy-in.
Low autonomy High autonomy
High alignment Authoritative conformity
Innovative collaboration
Low alignment Micromanaged indifference
Chaotic experimentation
Adapted from Sparkes (2019).
Behaviour policy is a good example. The research evidence highlights the importance of consistent enforcement of behavioural expectations for pupils coupled with visible support from senior leaders (Kraft and Papay, 2014; Bennett, 2017). However, staff may regard a behaviour policy as restrictive if leaders enforce the use of overly rigid or poorly explained behaviour routines.
Teachers in situations where the routine set out by the school’s behaviour policy conflicts with what they regard as a different approach for an individual pupil with a particular need are likely to feel frustrated. This may partly explain our finding that more teacher autonomy over standards and rules of classroom behaviour is associated with higher job satisfaction.
The Bennett Review of school behaviour recommends that the most successful schools combine consistent practices and detailed expectations (alignment) with staff engagement and clarity of culture (negotiating and establishing where professional judgement sits). School leaders can combine all these features to ensure that teachers feel able to apply their professional autonomy appropriately, while expectations of pupil behaviour are consistently high.
The Teacher Development Trust support resource gives further guidance for leaders on balancing autonomy and alignment.
17www.nfer.ac.uk

Greater teacher involvement in professional development goal‑setting can improve their motivation
8 We use the term ‘professional development’ to mean activities that teachers engage in to develop and enhance their teaching abilities, after having completed initial teacher training or education. The research literature uses a range of terms with subtle differences in definition, such as continuing professional development (CPD), professional learning (PL). We use PD as a catchall term for these concepts, as the subtle distinctions between the various terms are not relevant for interpreting these findings.
We find that teachers’ perceived autonomy over their professional development (PD) goals8 has the greatest association with improved satisfaction and intention to stay in teaching. This presents a significant opportunity for school leaders to consider how they design and deliver PD in their schools, harnessing the benefits of increased motivation from teachers having greater involvement in their PD goal-setting.
Autonomy over professional development goals does not necessarily mean teachers having total freedom to choose their PD goals and activities. Indeed, there is mixed evidence about whether complete choice is effective. While Kennedy (2016) and Mandaag, et al. (2016) interpreted their systematic reviews as giving evidence for teacher choice to participate in PD being associated with greater impact on pupil attainment, Cordingley et al. (2015) suggested that being a volunteer or conscript was not as important as other factors, including whether “teachers understood the relevance of their CPD to wider activities”.
These findings suggest that school leaders need to think, in particular about helping teachers see the relevance of PD to their individual needs, their pupils’ needs and the wider organisational goals. It suggests a benefit in involving teachers in choosing goals, albeit not necessarily giving them total control, and ensuring that teachers can have some autonomy in how they choose to meet these goals.
The Teacher Development Trust support resource for school leaders that accompanies this report develops these ideas and suggestions further.
www.nfer.ac.uk18
“ People are more likely to engage if they feel it is an area they need to develop. We have had times where we have had whole school CPD delivered and people just switch off, they are not interested because they don’t feel it is relevant to their area of practice. ”
Practitioner focus group member (leader of CPD provision)

Recommendations for school leaders and policymakers
www.nfer.ac.uk
School leaders
School leaders should consider incorporating a teacher autonomy lens to regular reviews of teaching and learning policies.
These reviews should cover both the written policies and, more importantly, the culture around how they are enacted in practice. Reviewing the school’s approach to the design and delivery of professional development should be a priority. Within that, reviewing the extent to which teachers feel that professional development is relevant and that they have input into the design and content is key.
School leaders should explore how teachers can be meaningfully involved and engaged in the way the school defines its organisational development priorities and makes decisions more widely.
Department for Education (DfE)
The DfE should produce guidance around the Standards for teachers’ professional development to emphasise how teachers can be given greater involvement in designing content, processes and goals.
The DfE should embed the principles of teacher autonomy into the implementation of the Early Career Framework (ECF).
The framework sets out ‘what early career teachers should be entitled to learn about’. When rolled out, the framework should act as a ‘menu’ for early-career teachers’ professional development, rather than a ‘prescription’.
The role of the mentor will be important in ensuring this, by helping teachers to identify their top development needs. The ECF’s successful implementation depends to a great extent on how teachers and their mentors see the relevance of the professional development they undertake to their practice.
DfE should continue delivering on its objective to develop specialist national professional qualifications.
Formal professional development opportunities like NPQs have tended to focus on training for leadership roles. In its recruitment and retention strategy, the DfE committed to developing “specialist qualifications to support clearer non-leadership career pathways for teachers that want to stay and excel in the classroom” (DfE, 2019). Specialist qualifications could offer teachers a wider range of development options that meet their development needs.
“ People seem to think that the only CPD route that is available to them is to get on that leadership track to headteacher. And actually most people don’t want that and that isn’t right for them. ”
Practitioner focus group member (Leader of CPD in a School Trust)
19

Opportunities for future research
This report presents new evidence on teacher autonomy in England that answers several important research questions. However, the datasets used cannot answer every research question on this topic, so important questions remain unanswered. We set out a few of the key outstanding questions for future research to explore.
Behaviour policies in schools
We find that teacher autonomy over the standards and rules for classroom behaviour has a statistically significant association with job satisfaction and intention to stay in teaching, over and above changes in other areas of autonomy. These findings potentially contradict the findings of previous research, which highlights the importance of consistent enforcement of behaviour policies. However, as discussed above, autonomy and consistency are not necessarily contradictory. Future research should explore how behaviour policies are implemented in schools in greater detail, to understand the nuance of these findings.
Autonomy in School Trusts
Our research finds that autonomy is lower in School Trusts, particularly Trusts with 10 or more schools. Teacher autonomy is likely to vary between Trusts with different operating models. The sample sizes in our data are not sufficient to explore this in detail.
Getting the right balance between alignment and autonomy at multiple levels (Trust, school, subject/phase, teacher) is an important issue for leaders of School Trusts as the system develops. Future research should explore how autonomy is (and is perceived to be) distributed at different levels within School Trusts, and how this differs between Trusts with different operating models.
Interactions between autonomy, competence and relatedness
Our data did not measure teacher competence or their sense of relatedness, which could more formally test the predictions of Deci and Ryan’s self-determination theory for teachers in England. For example, are the benefits of increasing autonomy different for teachers with high or low competence or teachers in schools with supportive colleagues and a collaborative culture?
Teacher goal‑setting, appraisal and performance management
Teachers’ professional development goal-setting often takes place as part of a performance appraisal and objective-setting process. Applying the insights from this research study to a more detailed exploration of the role of teachers in their own performance management process in schools could provide useful insights for school leaders. This is particularly the case since the widespread adoption of performance-related pay for teachers in England (Sharp et al., 2017).
Future research could explore the extent to which greater teacher involvement in all forms of goal-setting (performance, development and organisational) are associated with positive outcomes for teachers.
www.nfer.ac.uk20
OECD 2018 TALIS study
The 2018 TALIS survey presents a valuable opportunity for further research to explore teacher autonomy in England. Conducted in primary and secondary schools in England and more than 40 countries internationally, TALIS includes a set of international questions on teacher self-reported autonomy over aspects of classroom practice, which will be released in March 2020.
Research using this TALIS data could explore:
z the association between autonomy and actual, rather than stated, retention outcomes
z variation in autonomy within and between different schools
z comparing autonomy in England with other countries
z interactions between autonomy, self-efficacy and other aspects of school culture.

Datasets and measures used in the analysis
UK Household Longitudinal Survey
Data
The UK Household Longitudinal Survey (UKHLS), also known as Understanding Society, is the largest longitudinal household survey in the UK, based on a sample of 40,000 households (University of Essex, 2018). The survey contains extensive data on individuals’ employment, education, family life, health and well-being, as well as linking to the characteristics of other individuals within the household.
We identify 1,243 individuals who were teachers in a school in England’s state sector at some point across the eight waves of data. We define teachers as individuals whose main job is teaching in an English state-funded school, by looking at the industry in which each individual works, their occupation, their country of work, and whether they work in the public sector.
In four waves of the survey (waves 2, 4, 6, and 8), employed individuals were asked questions about their work-related autonomy. These questions form the basis of our analysis of teacher autonomy in the UKHLS. We compare teachers to individuals in professional occupations with similar characteristics (see next section for details about the matching methodology) and explore the relationship between autonomy and a range of factors including job satisfaction, working hours and leisure time satisfaction.
Measures
The autonomy questions we use in the analysis are: “In your current job, how much influence do you have over ...”
z The time you start or finish your working day (working hours)
z The pace at which you work (work pace) z What tasks you do in your job (job tasks) z The order in which you carry out task
(task order) z How you do your work (work manner)
The response options were ‘none’, ‘a little’, ‘some’ and ‘a lot’.
Other survey questions we use include:
z Job satisfaction: “On a scale of 1 to 7, where 1 means ‘Completely dissatisfied’ and 7 means ‘Completely satisfied’, how dissatisfied or satisfied are you with your present job overall?”
z Satisfaction with life overall, health and amount of leisure time: “On a scale of 1 to 7, where 1 = ‘Completely dissatisfied’ and 7 = ‘Completely satisfied’, please tell me the number which you feel best describes how dissatisfied or satisfied you are with the following aspects of your current situation.”
21www.nfer.ac.uk
Methodology appendix

z Working hours: sum of “Thinking about your (main) job, how many hours, excluding overtime and meal breaks, are you expected to work in a normal week?” and “And how many hours overtime do you usually work in a normal week? Please include unpaid overtime.”
z Management: “Do you have any managerial duties or do you supervise any other employees? (Responses: ‘Manager’, ‘Foreman/supervisor’, ‘Not manager/supervisor’).
NFER Teacher Voice survey
Data
Teacher Voice (TV) is NFER’s termly nationally representative survey of teachers and leaders in England. We added questions to the March 2019 survey on teacher autonomy, job satisfaction and intention to leave teaching. These add to the depth of understanding of autonomy from the UKHLS data, as the TV questions are specifically tailored to teachers.
The survey data is limited to some extent by sample sizes, which are relatively small when looking at subgroups. Confidence intervals are presented to demonstrate the level of uncertainty around the results. In the charts presented, if the confidence interval does not overlap the axis, then the average difference between the specified group and the reference group is statistically significant.
The autonomy questions were only asked of classroom teachers and middle leaders, and not senior leaders. The analysis sample was based on 1,144 teachers and middle leaders.
For more information about Teacher Voice, visit: https://www.nfer.ac.uk/key-topics-expertise/teacher-voice-omnibus-survey/
Measures
The autonomy questions used in the analysis are: “In general, how much influence do you have over the following in your job:”
z How you provide feedback to your pupils z How often you provide feedback to your pupils z How you plan your lessons/schemes of work z How you prepare your lessons/schemes
of work z How you assess pupils’ learning to your
inform teaching z What data you collect on pupils’ attainment z How your classroom is physically laid out z What teaching methods or strategies you use z What the standards and rules for behaviour
in your classroom are z Your professional development goals z The content of the curriculum in your
phase/subject z How the use of time in your classroom is
scheduled
The response options were ‘none’, ‘a little’, ‘some’ and ‘a lot’.
We also asked questions about:
z Job satisfaction: “How much do you agree with the following statements? I am satisfied with my job at this school”, (responses were a five-point scale from ‘strongly disagree’ to ‘strongly agree’)
z Manageability of workload: “How much do you agree with the following statements? My workload is manageable”, (responses were a five-point scale from ‘strongly disagree’ to ‘strongly agree’)
z Intention to leave: “Are you considering leaving teaching within the next academic year?”, (Responses: Yes/No). As we are most interested in the retention of working-age teachers, we coded teachers who responded “Retirement” to the follow-up question “What will you do instead?” as not intending to leave teaching.
www.nfer.ac.uk22

Methodology used for the analysis
Identifying ‘similar professionals’ in UKHLS
Comparing teachers to all employees in professional occupations in a meaningful way is challenging because the two groups are likely to differ in a number of important ways. They may be different because people with different characteristics or motivations select to go into different occupations. No comparison of different occupations should therefore be interpreted as the effect of entering that profession, although working conditions, and employees’ perceptions of them, can be influenced by entering that occupation rather than another.
We have aimed to improve the comparability of our analysis as much as we can. Instead of comparing all teachers to all employees in professional occupations, we derive a group of professionals with similar characteristics to teachers. The group includes professionals from the private and public sector, including scientists, researchers, engineers, IT professionals, health and nursing professionals, lawyers, accountants, statisticians, economists, social workers, librarians, and journalists.
First, we identify all individuals across all waves/years coded as having a professional occupation according to their Standard Occupational Classification (SOC) code. We use the SOC 2010 definition to identify the occupation codes which relate to our group of professionals.
We remove those employed in the wider education sector, and those employed outside England from the ‘other professionals’ group.
Second, we re-weight the ‘other professionals’ group so that the distribution of gender, age, region and highest qualification is the same amongst the teachers and the group of ‘other professionals’. We use a technique called entropy balancing, to re-weight the ‘other professionals’ group within each wave and derive a ‘similar professionals’ group (Hainmueller, 2012). We also separately derive a group of ‘full-time similar professionals’, which have similar characteristics to full-time teachers.
This re-weighting approach does not remove all the underlying differences in characteristics and motivations between teachers and ‘other professionals’. However, it minimises the risk that any observed differences in working conditions are driven by differences in the distribution of gender, age, region and highest qualification between the two groups.
Factor analysis of the ‘autonomy’ scales
Factor analysis is a statistical method for analysing correlations among a number of different variables to reveal or confirm the underlying constructs (i.e. that they are all measuring the same concept in slightly different ways).
We verify the reliability of the autonomy scales that we use in our analysis using factor analysis and the Cronbach’s alpha reliability measure. The factor analysis suggests that all 12 autonomy items from the Teacher Voice data load on to the same factor, confirming that they represent an underlying ‘autonomy’ construct. The reliability statistic of the 12-item autonomy scale is 0.9, which is a high correlation.
All five autonomy items from the UKHLS data load on to the same factor, also confirming that they represent an underlying ‘autonomy’ construct. The main scale we use excludes influence over working hours. The reliability statistic of the four-item autonomy scale among teachers is 0.80. The reliability statistic of the five-item autonomy scale (including working hours) among teachers (0.75) is lower than for the four-item scale. By comparison, the reliability statistic of the four-item autonomy scale among all working respondents in the UKHLS is 0.87 and the five-item scale only marginally lower at 0.85. This suggests that our exclusion of working hours is justified statistically as well as intuitively.
We drop 17 cases (14 professionals and three teachers) from the analysis because they have missing data for at least one of the four autonomy items in the autonomy scale.
23www.nfer.ac.uk

Scatter charts
We present charts showing the relationship between teacher autonomy and outcome variables, such as job satisfaction, working hours and intention to leave. The points on the chart represent the average of the outcome variable among all the teachers with that autonomy level. The table below shows the number of teachers underlying each data point in those charts. The line in the chart shows the prediction from a simple linear or logistic regression model, including autonomy as the only explanatory variable.
Regression model
We use a regression model to explore the relationship between the individual Teacher Voice autonomy items and job satisfaction/ retention. The regression model examines the relationship between many variables of interest and the outcome variable (job satisfaction/ retention), crucially focusing on the association between each variable and the outcome while holding constant the values of all the other variables in the model.
We use a linear regression model to explore job satisfaction (treating the job satisfaction scale as a continuous variable, where strongly disagree=1 and strongly agree=5). We test the sensitivity of the findings to instead using an ordered logistic regression model, and find that the results are very similar. We present the linear regression results for ease of interpretation. We use a logistic regression model to explore the relationship between autonomy and intention to leave.
We include a number of teacher and school characteristics to control for other variation that may influence job satisfaction independently of autonomy. These were gender, experience in teaching (five-year bands), phase (primary/ secondary), school type (local authority maintained, single-academy Trust, small and large School Trust) and Ofsted rating.
The factor analysis mentioned above suggests the autonomy items are correlated with one another. We checked the validity of including them each separately in the regression models by testing for multicollinearity. The highest variance inflation factors were less than 3, suggesting that while there was, as expected, correlation between some of the items, there was sufficient variation to include them separately with validity.
www.nfer.ac.uk24
The number of teachers underlying each data point in the scatter charts
Number of teachers in the analysis
Autonomy scale value
Teacher Voice 12‑item autonomy scale
UKHLS 4‑item autonomy scale
1 7 14
1.25 12 18
1.5 17 38
1.75 48 61
2 38 108
2.25 85 146
2.5 84 188
2.75 148 213
3 179 363
3.25 173 252
3.5 157 245
3.75 139 231
4 56 352
Note: The values in the UKHLS autonomy scale are the average from the four autonomy items. The values in the Teacher Voice autonomy scale, derived from the average of the 12 autonomy items, are rounded to the nearest unit of 0.25.
References
Bennett, T. (2017). Creating A Culture: How School Leaders Can Optimise Behaviour [online]. Available: https://www.gov.uk/government/publications/behaviour-in-schools [18 November, 2019].
Bryson, A., Stokes, L. and Wilkinson, D. (2019). Better Schools for All? [online]. Available: https://www.niesr.ac.uk/publications/better-schools-all [18 November, 2019].
Cordingley, P., Higgins, S., Greany, T., Buckler, N., Coles-Jordan, D., Crisp, B., Saunders, L. and Coe, R. (2015). Developing Great Teaching: Lessons From The International Reviews Into Effective Professional Development [online]. Available: http://TDTrust.org/dgt [18 November, 2019].
Deci, E. and Ryan, R. (2008). ‘Self-determination theory: A macrotheory of human motivation, development, and health’. Canadian Psychology, 49, 182–185 [online]. DOI: 10.1037/a0012801
Department for Education (2017). Teachers Analysis Compendium 2 [online]. Available: https://www.gov.uk/government/statistics/teachers-analysis-compendium-2 [18 November, 2019].
Department for Education (2019). Teacher Recruitment and Retention Strategy [online]. Available: https://www.gov.uk/government/publications/teacher-recruitment-and-retention-strategy [18 November, 2019].
Finch, A., Dobson, B., Fischer, E. and Riggs, A. (2016). Academy Chains Unlocked [online]. Available: https://reform.uk/research/academy-chains-unlocked [18 November, 2019].
Greany, T. (2018). Sustainable Improvement in Multi-School Groups [online]. Available: https://www.gov.uk/government/publications/sustainable-improvement-in-multi-school-groups [18 November, 2019].
Hainmueller, J. (2012). ‘Entropy balancing for causal effects: a multivariate reweighting method to produce balanced samples in observational studies’, Political Analysis 20, 25–46. [online]. Available: https://ssrn.com/abstract=1904869 [18 November, 2019].
Kraft, M.A. and Papay, J.P. (2014). ‘Can professional environments in schools promote teacher development? Explaining heterogeneity in returns to teaching experience’. Educational Effectiveness and Policy Analysis, 36, 4, 476–500. https://scholar.harvard.edu/mkraft/publications/can-professional-environments-schools-promote-teacher-development-explaining [18 November, 2019].
Kennedy, M. (2016). ‘How does professional development improve teaching?’, Review of Educational Research. 86 [online]. DOI: 10.3102/0034654315626800. https://www.researchgate.net/publication/292675761_How_Does_Professional_Development_Improve_Teaching [18 November, 2019].
Lynch, S., Worth, J., Bamford, S. and Wespieser, K. (2016). Engaging Teachers: NFER Analysis of Teacher Retention [online]. Available: https://www.nfer.ac.uk/engaging-teachers-nfer-analysis-of-teacher-retention/ [18 November, 2019].
Maandag, D., Helms-Lorenz, M., Lugthart, E., Verkade, A. and van Veen, K. (2017). Features of Effective Professional Development Interventions in Different Stages of Teacher’s Careers: NRO Report [online]. Available: https://www.nro.nl/wp-content/uploads/2017/08/Effectiveness-of-professional-development-interventions-in-different-teacher-career-stages.pdf [18 November, 2019].
Micklewright, J., Jerrim, J., Vignoles, A., Jenkins, A., Allen, R., Ilie, S., Bellarbre, E., Barrera, F. and Hein, C. (2014). Teachers in England’s Secondary Schools: Evidence from TALIS 2013 [online]. Available: https://www.gov.uk/government/publications/teachers-in-secondary-schools-evidence-from-talis-2013 [18 November, 2019].
25www.nfer.ac.uk

OECD (2016). Supporting Teacher Professionalism: Insights from TALIS 2013 [online]. Available: https://doi.org/10.1787/9789264248601-en [18 November, 2019].
Sharp, C., Walker, M., Lynch, S., Puntan, L., Bernardinelli, D., Worth, J., Greaves, E., Burgess, S. and Murphy, R. (2017). Evaluation of Teachers’ Pay Reform. (DfE Research Report) [online]. Available: https://www.gov.uk/government/publications/teachers-pay-reform-evaluation [18 November, 2019].
Sims, S. (2017). TALIS 2013: Working Conditions, Teacher Job Satisfaction and Retention [online]. Available: https://www.gov.uk/government/publications/teachers-in-secondary-schools-evidence-from-talis-2013 [18 November, 2019].
Skaalvik, E. M. and Skaalvik, S. (2014). ‘Teacher Self-Efficacy and Perceived Autonomy: Relations with Teacher Engagement, Job Satisfaction, and Emotional Exhaustion’, Psychological Reports, 114, 68–77.
Sparkes, L. (2019). How Dixons Academies Trust Took Tips From Silicon Valley on Structuring Their MAT [online]. Available: https://arbor-education.com/blog-how-dixons-academies-trust-took-tips-from-silicon-valley-on-structuring-their-mat/ [18 November, 2019].
Taylor, M., Marsh, G., Nicol, D. and Broadbent, P. (2017). Good Work: The Taylor Review of Modern Working Practices [online]. Available: https://www.gov.uk/government/publications/good-work-the-taylor-review-of-modern-working-practices [18 November, 2019].
University of Essex. Institute for Social and Economic Research, NatCen Social Research, Kantar Public (2018). Understanding Society: Waves 1-8, 2009-2017 and Harmonised BHPS: Waves 1-18, 1991-2009. [data collection]. 11th Edition. UK Data Service. SN: 6614, [online]. Available: http://doi.org/10.5255/UKDA-SN-6614-12 [18 November, 2019].
Wheatley, D. (2017). ‘Autonomy in paid work and employee subjective well-being’, Work and Occupations, 44, 3, 296–328 [online]. DOI: 10.1177/0730888417697232
Worth, J., Lynch, S., Hillary, J., Rennie, C. and Andrade, J. (2018). Teacher Workforce Dynamics in England [online]. Slough: NFER. Available: https://www.nfer.ac.uk/teacher-workforce-dynamics-in-england/ [18 November, 2019].
Worth, J., Bamford, S. and Durbin, B. (2015). Should I Stay or Should I Go? NFER Analysis of Teachers Joining and Leaving the Profession [online]. Available: https://www.nfer.ac.uk/should-i-stay-or-should-i-go-nfer-analysis-of-teachers-joining-and-leaving-the-profession [18 November, 2019].
www.nfer.ac.uk26

Additional charts
This section presents three charts that we refer to in the report text, but where there was insufficient space on the respective pages to display them.
27www.nfer.ac.uk
Comparing teachers’ autonomy levels with proportion reporting low satisfaction with amount of leisure time (%)
1 2 3 40
20
40
100
Lo
w s
atis
fact
ion
Autonomy
60
80
Source: NFER analysis of UKHLS data
Comparing teachers’ autonomy levels with proportion feeling job-related stress, most or all of the time (%)
1 2 3 40
20
40
60
Job
-rel
ated
str
ess
Autonomy
Source: NFER analysis of UKHLS data
Change in intention to stay in teaching (percentage points) associated with an increase in autonomy
-15 0 5 10 15-10 -5
Your professional development goals
How you prepare your lessons/schemes of work
What the standards and rules for behaviour in your classroom are
How the use of time in your classroom is scheduled
What teaching methods or strategies you use
How you provide feedback to your pupils
What data you collect on pupils’ attainment
How your classroom is physically laid out
The content of the curriculum in your phase/subject
How often you provide feedback to your pupils
How you assess pupils’ learning to your inform teaching
How you plan your lessons/schemes of work
Source: NFER analysis of Teacher Voice data

Public
© National Foundation for Educational Research 2020
All rights reserved. No part of this document may be reproduced or transmitted in any form or by any means, electronic, mechanical, photocopying, or otherwise, without the prior written permission of NFER.
NFER Head OfficeThe Mere, Upton Park, Slough SL1 2DQT: +44 (0)1753 574123 • F: +44 (0)1753 691632 • [email protected]
www.nfer.ac.ukTwitter: @TheNFER
NFER ref. DP19AUTO
ISBN 978-1-911039-98-3
Top Related