


Languages
Pages
Legal


© Tasktop 2016© Tasktop 2016
Target DevOps Bottlenecks with Connected Lifecycle Data
Jeff Downs

© Tasktop 2016
• The Focus on Team Reporting and Release Readiness
• Understanding and Connecting the Value Chain
• Measuring the Value Chain
• Continuous Improvement
Agenda

© Tasktop 2016
Tactical MetricsTeam Reports“Because I can” Metrics
© Tasktop 2016
Tactical Metrics
• Are we ready to release?• Open Defects by Severity• Tests Executed
Team Reporting
• How did my team do this sprint?• Story Points Delivered• % New Features vs Defects vs Tech Debt• Burn up/down
“Because I can” metrics
• I don’t know what to measure so I found these on Google
• I measure this because I know I can access that data
Technical Metrics

© Tasktop 2016
We are measuring effort. That’s like measuring a sports team based on the number of hours practiced instead of the number of wins. We need to measure outcome.
Effort vs Outcome

© Tasktop 2016
Measuring software deliveryCost
Cost per story point
Data from: PPM, Agile, QA
TimeLead time (to deliver business value)
Data from: PPM, RM, Agile, QA, ITIL
QualityMean time to resolution (MTTR)
Data from: ITSM, DevOps, Agile
ProductivityBiz value stories/reqs delivered
Data from: RM, Agile, Ops

© Tasktop 2016
How many handoffs are necessary to get ideas into production?
Software delivery is a relay race

© Tasktop 2016

© Tasktop 2016
Understand and Connect the Value Chain

© Tasktop 2016
Identify the Value Chain

© Tasktop 2016
Identify the Value Chain

It’s a Software EconomyBut 30-70%* of software projects fail

© Tasktop 2016
Connect the Value Chain
© Tasktop 2016
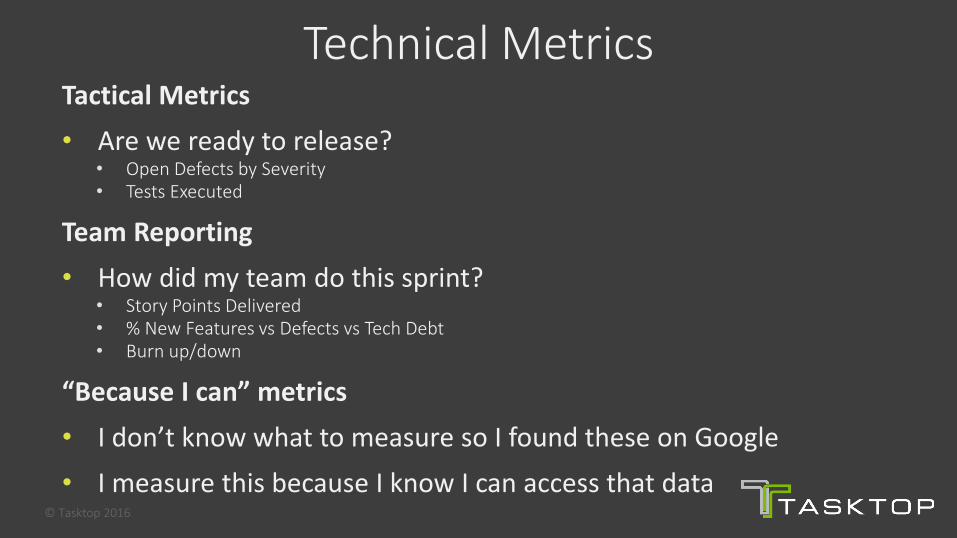
Automated Traceability
Demand
Other Demand
New Feature
Other New Features
Epic 1
Application = App ARelease = Aug Release
Epic 2
Application = App BRelease = Aug Release
Epic 3
Application = App BRelease = Sept Release
September Release
August Release
App B
Dev Environment
Prod Environment
App A
Dev Environment
Prod Environment
App B
Dev Environment
Prod Environment
© Tasktop 2016
Measurethe Value Chain

© Tasktop 2016
Demand Created
Demand Approved
Epic Created
Epic Approved
Epic Scheduled
Deployed to Dev
Deployed to Prod

© Tasktop 2016
The Output

© Tasktop 2016
Continuous Improvement

© Tasktop 2016
Where is the Bottleneck

© Tasktop 2016
Business Value
Defects from Testing
Operations Work: Problems and Incidents from ITSM
What are the other sources of work?

© Tasktop 2016
Top Related