


Languages
Pages
Legal


REPUBLIC OF KENYA
TANA RIVER COUNTY
SECOND COUNTY INTEGRATED
DEVELOPMENT PLAN
APRIL 2018
2018 –2022

ii
COUNTY VISION AND MISSION
Vision: A Peaceful, Cohesive and Prosperous County offering high quality of life to its residents.
Mission: To ensure effective and accountable leadership, promote a just, democratic and secure
environment and establish strong governance institutions to empower citizens, for the
achievement of socio-economic and political development.

iii
FOREWORD One of the most significant changes introduced to Kenya‘s national governance framework under
the new constitutional dispensation is 47 new county governments with significant
responsibilities in agriculture, health, trade, roads, county planning and other functions being
devolved to the county level. The Constitution of Kenya 2010, the Kenya Vision 2030 and its
Medium Term Plans, the 2013 CIDP End Term Review report, Ending Drought Emergencies by
2022 and its Common Program Framework, provided the foundation for the preparation of the
Second County Integrated Development Plan (CIDP II) for Tana River County. This Second
Tana County Development Plan, will be used in the allocation of scarce resources to priority
programmes and projects.
The Kenya Vision 2030 is the country‘s development blueprint covering the period 2008 to 2030.
It aims to transform Kenya into a newly industrializing, middle-income country providing a high
quality life to all its citizens by the year 2030. The Vision is based on three pillars: Economic,
Social and Political Pillar. The pillars are supported by key enablers and macro foundations of
the Vision. For each of the Pillars and the key enablers and macro foundations, priority sectors
have been identified to drive the aspirations of the Vision. The Vision has also identified a
number of flagship projects to be implemented across the country for all sectors. The County
Government has identified county-specific flagship projects and programmes that will be
implemented at county level and work with the national government to ensure these projects are
implemented.
The preparation of this Second County Integrated Development Plan is based on the County
Governments Act, 2012 and Public Finance Management Act, 2012. These laws require every
county to prepare a County Integrated Development Plan (CIDP) upon which utilization of funds
earmarked for the counties will be expended. The County Government of Tana River like any
other County Government, is required to prepare an Integrated Development Plan to enable
prioritization of local socio-economic development issues.
This Second County Integrated Development Plan is a five-year blue print that highlights the
socio-economic challenges faced by the County, strategies for resources mobilization, projects
and programmes to be implemented in order to address the socio-economic challenges.
The County government is composed of the County Executive and County Assembly. The
County Executive is expected to supervise the administration and delivery of services to citizens

iv
as well as conceptualize and implement policies and county legislation. On the other hand, the
County Assembly is a legislative organ and plays an oversight role over the Executive. The
County Government of Tana River like any other County Government, is required to prepare an
Integrated Development Plan to enable prioritization of local socio-economic development
issues.
The preparation of this CIDP II was done through a participatory process that involved various
stakeholders including; county and national government officers, community members, private
sector, Public Benefit Organizations (PBOs), Civil Society Organizations (CSOs) and
development partners. The identification of the projects and programmes in the CIDP II also
involved various public consultative forums held at ward level. The views collected in the forums
were consolidated by the CIDP II technical team (secretariat) and subjected to the stakeholders
for validation. Subsequently the document was handed over to the County Executive for onward
forwarding to the County Assembly for approval and adoption.
SIGNED BY;
H.E. RTD. MAJOR DHADHO GADAE GODHANA, Governor, Tana River County.

v
ACKNOWLEDGEMENTS
The Second Tana River County Integrated Development Plan was prepared with the support and
generous contribution of many individuals and organizations. I would like to appreciate the
efforts made by H.E the Rtd. Major Dhadho Gadae Godhana, the deputy Governor Mr. Salim
Kea Batuyu, members of the County Assembly, members of the county executive, heads of
county and national government officials, representatives of Public Benefit Organization
(PBOs), Private Sector players and members of the public for their selfless contribution towards
the preparation of this blue print.
I would also like to thank Hon. Juma Wario the Senator of Tana River County, Hon. Michael
Nkaduda, the speaker of Tana River County Assembly, various heads of departments for their
support and leadership. I would like to appreciate the role played by the entire county government
staff for their respective roles in this process. More gratitude goes to the CIDP II Technical Team
(secretariat) for coordinating the whole process led by the County Secretary, Mr. Salim Bagana
and the County Director for Economic Planning and Budgeting; Mr. Lennox Chilumo Mbwana.
Special mention is made to the CIDP II technical team members; Arnold Odipo, Dr. Oscar
Endekwa, Tom Masanga, Kase Ddaiddo, Hussein Bakero, Francis Ngigi, and Mohammed
Mwatunza. I would like to appreciate the inputs and technical support received from the
following officers; Mr. Samuel Kimote, Mr. Joseph Malonza, Sylvester Saburi, and Daniel
Odhiambo.
I am also grateful for the support received from the following partners; National Drought
Management Authority (NDMA), United Nations Development Programme (UNDP) and Food
and Agriculture Organization (FAO) for both technical and financial support.
MATHEW BUYA BABWOYA,
CECM, Finance and Economic Planning.

vi

vii
EXECUTIVE SUMMARY
Tana River County is one of the six Counties in the Coast Region. It borders Kitui County to
the West, Garissa County to the North East, Isiolo County to the North, Lamu County to the
South East and Kilifi County to the South. The county lies between latitudes 000’53” and
200’41’’ South and longitudes 38025’43” and 40015’ East. The county has a total area of
38,862.2 Km2 with a projected population of 349,338(KNBS, 2018) and covers about 76 kms
of the coastal strip.
The County is composed of three administrative sub-counties namely: Bura, Galole and Tana
Delta, and three constituencies namely: Galole, Bura and Garsen with 15 electoral wards.
The CIDP II articulates medium term policies and objectives which are further translated into
short term strategies, programmes and projects to be implemented under the Medium Term
Expenditure Framework (MTEF). The latter is part of the financial reforms to strengthen
financial discipline, accountability and efficient and effective delivery of services to the
people.
The CIDP II is organized in Six Chapters (6). These are as follows;
Chapter One: The chapter gives the background information on the socio-economic and
infrastructural information that has a bearing on the development of the county. It provides
description of the county in terms of the location, size, physiographic and natural conditions,
demographic profiles as well as the administrative and political units. In addition, it provides
information on infrastructure and access; land and land use; community organizations/non-
state actors; crop, livestock and fish production; forestry, environment and climate change;
mining, tourism, employment and other sources of income; water and sanitation; health access
and nutrition, education and literacy, trade, energy, housing, transport and communication,
community development and Social Welfare.
Chapter Two: This chapter describes the linkages of the Second County Integrated
Development Plan with the county sectoral plans, county spatial plans, the Third Medium Term
Plan (MTP III) of the Kenya Vision 2030 and international commitments made by the National
Government such as the Sustainable Development Goals (SDGs), and the African Union
Agenda 2063 and how they apply to the county.
Chapter Three: Presents a review of the first CIDP (2013-2017), highlighting the challenges,
achievements, and emerging issues that were realized. It includes an analysis of performance
on revenue expenditure versus the actual allocations and draws appropriate conclusions.
Chapter Four: This chapter contains a spatial framework of social and economic projects and
programs in the county setting out objectives of the county in a spatial form indicating the land
use patterns, the spatial reconstruction of the county, guidance to the location of the projects,
basic guidelines for land use, the environmental impact assessment of projects, public and
private development areas for towns.
It also highlights the priority areas that the County Government of Tana River will focus on
and identifies the strategies, programmes and projects as identified by stakeholders in the
county during the public participation. Flagship projects in the various sectors have also been
identified aimed at transforming the county economy to meet the needs and aspirations of
citizens of Tana River.

viii
The information is presented based on the Medium Term Expenditure Framework budgeting
system. Nine sectors have been used, namely, Agriculture, Rural and Urban Development;
General Economic, Commercial and Labour Affairs; Energy, Infrastructure and ICT;
Environmental Protection, Water and Natural Resources; Health; Education; Governance,
Justice, Law and Order; Public Administration and Inter-Governmental Relations; and Social
Protection Culture and Recreation.
Chapter Five: The chapter provides the institutional framework and organizational flow chart
that will guide the implementation of the Second County Integrated Development Plan. It
outlines the stakeholders in the County, and the roles that they will play and how their functions
are accommodated to avoid duplication of efforts.Resource requirements and mobilization is
also outlined in this chapter.
Chapter Six: Specifies verifiable indicators, data collection, analysis and reporting that will
be used to monitor projects and programs and sets medium term milestones for impact
assessment. The monitoring and evaluation framework that will be used at the County level to
track progress on implementation of projects and programmes is discussed under this section.
Annex I: The Annex provides information on the sector projects derived from programmes. It
specifies objectively verifiable indicators that shall be used to monitor the implementation of
the programmes and projects. It also sets mid-term milestones for impact assessment.

ix
TABLE OF CONTENTS
COUNTY VISION AND MISSION ........................................................................................................................ II
FOREWORD ....................................................................................................................................................III
ACKNOWLEDGEMENTS ................................................................................................................................... V
EXECUTIVE SUMMARY .................................................................................................................................. VII
TABLE OF CONTENTS ...................................................................................................................................... IX
LIST OF TABLES ............................................................................................................................................. XII
LIST OF FIGURES ............................................................................................................................................ XII
ABBREVIATIONS AND ACRONYMS ............................................................................................................... XIII
CHAPTER ONE COUNTY GENERAL INFORMATION ........................................................................................... 1
1.0 INTRODUCTION ............................................................................................................................................. 1 1.1 POSITION AND SIZE ........................................................................................................................................ 1 1.2 PHYSIOGRAPHIC AND NATURAL CONDITIONS ...................................................................................................... 2
1.2.1 Physical and Topographic Features ................................................................................................ 2 1.2.2 Ecological Conditions ...................................................................................................................... 2 1.2.3 Climatic Conditions ......................................................................................................................... 2
1.3 ADMINISTRATIVE UNITS .................................................................................................................................. 3 1.3.1 Administrative Subdivision .............................................................................................................. 3
1.4 POLITICAL UNITS (CONSTITUENCIES, ELECTORAL WARDS) ..................................................................................... 3 1.4.1 Eligible and Registered Voters by Constituency .............................................................................. 4
1.5 DEMOGRAPHIC FEATURES ............................................................................................................................... 5 1.5.1 Population Size and Composition .................................................................................................... 5 1.5.2 Urban Population ............................................................................................................................ 9 1.5.3 Rural Population ........................................................................................................................... 10 1.5.4 Population Distribution and Density by Constituency/Sub-county ............................................... 10 1.5.5 Demographic Dividend (DD) ......................................................................................................... 10
1.6 HUMAN DEVELOPMENT INDICATORS (HDI) ...................................................................................................... 11 1.7 INFRASTRUCTURE AND ACCESS ....................................................................................................................... 11
1.7.1 Road, Rail Network, Ports and Airports, Airstrips and Jetties ....................................................... 11 1.7.2 Posts and Telecommunications: Post Offices, Mobile Telephony & Landline. .............................. 12 1.7.3 Financial Institutions: Banks, SACCOs, Micro Finance Institutions ............................................... 12 1.7.4 Education Institutions: Primary/Secondary schools, Polytechnics, Colleges, Universities ............ 12 1.7.5 Energy Access (Main Sources of Energy, Electricity Coverage) ..................................................... 12 1.7.6 Markets and Urban Centres .......................................................................................................... 12 1.7.7 Housing Types ............................................................................................................................... 12
1.8 LAND AND LAND USE ................................................................................................................................... 13 1.8.1 Mean Holding Size ........................................................................................................................ 13 1.8.2 Percentage of Land with Title Deeds............................................................................................. 13 1.8.3 Incidence of Landlessness ............................................................................................................. 13 1.8.4 Land Tenure System ...................................................................................................................... 13
1.9 EMPLOYMENT AND OTHER SOURCES OF INCOME ............................................................................................... 13 1.9.1 Wage Earners ................................................................................................................................ 13 1.9.2 Self-Employed ............................................................................................................................... 13 1.9.3 Labour Force ................................................................................................................................. 14 1.9.4 Unemployment Levels ................................................................................................................... 14
1.10 IRRIGATION INFRASTRUCTURE AND SCHEMES ............................................................................................... 14 1.10.1 Irrigation Potential ................................................................................................................... 14 1.10.2 Performance Review ................................................................................................................ 14
1.11 CROPS, LIVESTOCK AND FISH PRODUCTION .................................................................................................. 15 1.11.1 Main Crops Produced ............................................................................................................... 15 1.11.2 Acreage under Food Crops and Cash Crops .............................................................................. 15 1.11.3 Average Farm Sizes .................................................................................................................. 15

x
1.11.4 Main Storage Facilities ............................................................................................................. 15 1.11.5 Agricultural extension, training, research and information services ....................................... 15 1.11.6 Main Livestock Bred ................................................................................................................. 15 1.11.7 Poultry keeping ........................................................................................................................ 16 1.11.8 Ranches .................................................................................................................................... 16 1.11.9 Main Fishing Activities, Types of Fish Produced, Landing Sites ................................................ 16
1.12 MINING ................................................................................................................................................ 16 1.12.1 Ongoing Activities .................................................................................................................... 16 1.12.2 Mining Potentials ..................................................................................................................... 16
1.13 TOURISM AND WILDLIFE .......................................................................................................................... 16 1.13.1 Main Tourist Attractions, National Parks/Reserves ................................................................. 16 1.13.2 Main Wildlife ............................................................................................................................ 17 1.13.3 Tourist Class Hotels/Restaurants, Bed Occupancy ................................................................... 17
1.14 INDUSTRY .............................................................................................................................................. 17 1.15 THE BLUE ECONOMY ............................................................................................................................... 17 1.15.1. AQUACULTURE (SEA WEED FARMING) .................................................................................................... 17 1.15.2. MAIN FISHING ACTIVITIES, TYPES OF FISH PRODUCED, LANDING SITES ........................................................... 17 1.15.3. MARINE TRANSPORT AND TOURISM ...................................................................................................... 17 1.16 FORESTRY AND AGRO FORESTRY ................................................................................................................ 17
1.16.1 Main Forest Types and Sizes .................................................................................................... 17 1.16.2 Main Forest Products in Gazetted and Ungazetted Forests ..................................................... 18 1.16.3 Promotion of Agro-Forestry and Green Economy .................................................................... 18
1.17 FINANCIAL SERVICES ................................................................................................................................ 19 1.17.1 Number of banks, Micro finance institutions, mobile money agents and SACCOs with FOSAs 19 1.17.2 Distribution/coverage of financial services by sub-county ....................................................... 19
1.18 ENVIRONMENT AND CLIMATE CHANGE ....................................................................................................... 19 1.18.1 Major Contributors of Environmental Degradation ................................................................. 19 1.18.2 Major Degraded Areas/Hotspots and Major Contributions to Environmental Degradation ... 19 1.18.3 Environmental Threats ............................................................................................................. 20 1.18.4 High Spatial and Temporal Variability of Rainfall .................................................................... 20 1.18.5 Change in Water Levels ............................................................................................................ 20 1.18.6 Solid Waste Management Facilities ......................................................................................... 20 1.18.7 Effects of Environmental Degradation ..................................................................................... 21 1.18.8 Climate Change and its Effects in the County .......................................................................... 21 1.18.9 Climate Change Mitigation Measures and Adaptation Strategies........................................... 21
1.19 WATER AND SANITATION ......................................................................................................................... 21 1.19.1 Water Resources and Quality ................................................................................................... 21 1.19.2 Water Supply Schemes ............................................................................................................. 21 1.19.3 Actors in the water sector ........................................................................................................ 22 1.19.4 Water Sources (Average Distance to the Nearest Water Points) ............................................. 22 1.19.5 Water Management ................................................................................................................ 23 1.19.6 Sanitation ................................................................................................................................. 23
1.20 HEALTH ACCESS AND NUTRITION ............................................................................................................... 23 1.20.1 Health Access (Health Facilities, Personnel) ............................................................................. 23 1.20.2 Morbidity: Five Most Common Diseases in Order of Prevalence ............................................. 25 1.20.3 Nutritional Status ..................................................................................................................... 25 1.20.4 Immunization Coverage ........................................................................................................... 25 1.20.5 Access to Family Planning Services/Contraceptive Prevalence ................................................ 25
1.21 EDUCATION AND LITERACY ....................................................................................................................... 25 1.21.1 Pre-School Education ............................................................................................................... 25 1.21.2 Primary Education .................................................................................................................... 25 1.21.3 Literacy ..................................................................................................................................... 25 1.21.4 Secondary Education ................................................................................................................ 25 1.21.5 Tertiary Education .................................................................................................................... 25
1.22 SPORTS, CULTURE AND CREATIVE ARTS ....................................................................................................... 26 1.23 COMMUNITY ORGANIZATIONS/NON-STATE ACTORS ..................................................................................... 26
1.23.1 Cooperative Societies ............................................................................................................... 26

xi
1.23.2 Non-Governmental Organizations ........................................................................................... 26 1.23.3 Self Help Women & Youth Groups............................................................................................ 26
1.24 SECURITY, LAW AND ORDER ..................................................................................................................... 26 1.25 SOCIAL PROTECTION ............................................................................................................................... 27
CHAPTER TWO LINKAGES WITH VISION 2030 AND OTHER PLANS ................................................................. 28
2.1 OVERVIEW ................................................................................................................................................. 28 2.2 LINKAGE OF THE CIDP WITH THE KENYA VISION 2030, ITS MEDIUM TERM PLANS AND OTHER PLANS, POLICIES AND
STRATEGIES ......................................................................................................................................................... 28 2.2.1 CIDP linkages with the Kenya Vision 2030 .................................................................................... 28 2.2.2 Linkage of the CIDP with the Medium Term Plans ........................................................................ 29 2.2.3 Linkage with ‘Big Four’ Plan and Governors Manifesto ................................................................ 29 2.2.4 Linkage with Sectoral Plans, Urban and City Plans within the County .......................................... 30 2.2.5 Linkage of the CIDP with Jumuia Ya Kaunti za Pwani ................................................................... 31 2.2.6 Integration of the Sustainable Development Goals (SDGs) into the CIDP ..................................... 31 2.2.4.2 Sectors and Related SDGs ........................................................................................................ 32 2.2.7 Mainstreaming Sendai Framework for Disaster Risk Reduction 2015 – 2030 in Development Planning 34 2.2.7.1 Major disaster risk categories and likely locations; ................................................................. 35
CHAPTER THREE REVIEW OF IMPLEMENTATION OF PREVIOUS CIDP ............................................................. 36
3.1 INTRODUCTION ........................................................................................................................................... 36 3.2 STATUS OF IMPLEMENTATION OF THE PREVIOUS CIDP ....................................................................................... 36
3.2.1 Analysis of the county Revenue Streams ...................................................................................... 36 3.2.2 Summary of Key Achievements ..................................................................................................... 38 3.2.3 Challenges in the Implementation of the Plan .............................................................................. 40 3.2.4 Lessons Learnt and Recommendations ......................................................................................... 40
CHAPTER FOUR COUNTY DEVELOPMENT PRIORITIES AND STRATEGIES ........................................................ 42
4.1 INTRODUCTION ........................................................................................................................................... 42 4.2 SPATIAL DEVELOPMENT FRAMEWORK ............................................................................................................. 42 4.3 NATURAL RESOURCE ASSESSMENT.................................................................................................................. 44 4.4 DEVELOPMENT PRIORITIES AND STRATEGIES ..................................................................................................... 45
4.4.1 Agriculture Rural and Urban Development ................................................................................... 45 4.4.2 General Economic, Commercial and Labour Affairs ...................................................................... 74 4.4.3 Energy, Infrastructure & ICT ......................................................................................................... 83 4.4.4 Health ........................................................................................................................................... 90 4.4.5 Education .................................................................................................................................... 117 4.4.6 Social Protection, Culture, Recreation and Special Programmes Sector ..................................... 125 4.4.7 Environmental Protection, Water and Sanitation ....................................................................... 138 4.4.8 Public Administration and Intergovernmental Relations Sector ................................................. 162 Cross Sectoral Impacts .............................................................................................................................. 175 4.4.9 Governance Justice Law and Order ............................................................................................. 175
4.5 FLAGSHIP / COUNTY TRANSFORMATIVE PROJECTS ........................................................................................... 180
CHAPTER FIVE IMPLEMENTATION FRAMEWORK ........................................................................................ 189
5.0 INTRODUCTION ......................................................................................................................................... 189 5.2 INSTITUTIONAL FRAMEWORK ....................................................................................................................... 189 5.3 RESOURCE REQUIREMENTS BY SECTOR .......................................................................................................... 190 5.4 THE RESOURCE MOBILIZATION FRAMEWORK .................................................................................................. 192
5.4.1 Asset Management ..................................................................................................................... 192
CHAPTER SIX MONITORING AND EVALUATION FRAMEWORK .................................................................... 194
6.1 INTRODUCTION ......................................................................................................................................... 194 6.2 INSTITUTIONAL FRAMEWORK FOR MONITORING AND EVALUATION IN THE COUNTY ................................................ 194 6.3 DATA COLLECTION, ANALYSIS, AND REPORTING ............................................................................................... 194 6.4 M&E OUTCOME INDICATORS ...................................................................................................................... 194

xii
ANNEX 1: SECTOR PROJECTS DERIVED FROM PROGRAMMES .................................................................................. 207 ANNEX II: NEW PROJECT PROPOSALS ................................................................................................................ 214 ANNEX III: STALLED PROJECTS ........................................................................................................................... 244
LIST OF TABLES Table 1-1: Area of the County by Administrative Units............................................................ 3 Table 1-2: County’s Electoral Wards by Constituencies ........................................................... 4 Table 1-3: County’s Electoral Wards by Constituencies ........................................................... 4
Table 1-4: Eligible and Registered Voters by Constituency ...................................................... 4 Table 1-5: Population Projection by Age Cohorts ..................................................................... 5 Table 1-6: Population Projections for Selected Age Groups ..................................................... 6 Table 1-7: Population Projections by Urban Centres .............................................................. 10 Table 1-8: Population Distribution and Density by Constituency ........................................... 10
Table 1-9: Population Projections by Constituency................................................................. 10 Table 1-10: Demographic Dividend Potential ......................................................................... 11
Table 3-1: Projected Revenue Vs. Actual Revenue ................................................................. 37
Table 3-2: Analysis of Revenue Collection Vs. Actual Expenditure ...................................... 37
Table 3-3: Analysis of Approved Expenditure Vs. Actual Expenditure ................................. 37
Table 3-4: Average Departmental Absorption of Development Budget ................................. 38
Table 3-5: A Summary of County Key Performance Indicators ............................................. 39
Table 4-1: County Spatial Development Strategies by Thematic Areas ................................. 42
Table 4-2: Natural Resource Assessment ................................................................................ 44
Table 5-1: Summary of Proposed Budget by Sector ............................................................. 190
Table 6-1: Summary of M&E Outcome indicators................................................................ 194
LIST OF FIGURES Figure 1-1: Map of Kenya Showing the Location of the County (Marked in Red) ................... 1
Figure 1-2: Map of the Country's Administrative/Political Units .............................................. 3
Figure 3-1: Targeted Local Revenue against Actual Local Revenue ..... Error! Bookmark not
defined.

xiii
ABBREVIATIONS AND ACRONYMS
ACU AIDS Control Unit
AIDS Acquired Immune Deficiency Syndrome
ALLPRO ASAL Based Livestock and Rural Livelihood Support Programme
ALRMP Arid Lands Resource Management Programme
ART Anti-Retroviral Therapy
ASAL Arid and Semi-Arid Lands
ATM Automated Teller Machine
BCC Behavioural Change Campaign
C-YES Constituency Youth Enterprise Scheme
CACC Constituency Aids Control Coordinator
CAEO County Adult Education Officer
CAP Community Action Plan
CBO Community Based Organisation
CCC Comprehensive Care Centre
CDA Coast Development Authority
CDC Constituency Development Committee
CDF Constituency Development Fund
CDO County Development Officer
CDP County Development Plan
CDTF Community Development Trust Fund
CEC County Executive Committee
CFRD County Focus for Rural Development
CHW Community Health Worker
CIDC County Information Documentation Centre
CIDP County Integrated Development Plan
CIG Common Interest Group
CIP Community Implementation Plan
CLPO County Livestock Production Office
CMEC County Monitoring and Evaluation Committee
CNSP Children in Need of Special Protection
CoDC Community Development Committee
CPMR Community Project Monitoring Report
CPU County Planning Unit
CRMLF County Roads Maintenance Levy Fund
CVO County Veterinary Office
CWSB Coast Water Services Board
DANIDA Danish International Development Agency
ECDE Early Childhood Development Education
ERS Economic Recovery Strategy
FBO Faith-Based Organisation
FPE Free Primary Education
FSE Free Secondary Education
GOK Government of Kenya
HCDA Horticultural Crops Development Authority
HIV Human Immunodeficiency Virus
ICT Information Communication Technology
IMCI Integrated Management of Childhood Illnesses
I.T Information Technology

xiv
KAPP Kenya Agriculture Productivity Programme
KEPI Kenya Expanded Programme on Immunization
KESHA Kenya Sustainable Health Aid
KFS Kenya Forest Service
KPLC Kenya Power and Lighting Company
KRB Kenya Roads Board
KTB Kenya Tourist Board
KWS Kenya Wildlife Services
LATF Local Authority Transfer Fund
LDC Locational Development Committee
MDG Millennium Development Goals
MOH Ministry of Health
MoR&PW Ministry of Roads and Public Works
MTEF Medium Term Expenditure Framework
NACC National AIDS Control Council
NALEP National Agricultural and Livestock Extension Programme
NCPB National Cereals and Produce Board
NEMA National Environmental Management Authority
NGO Non-Governmental Organization
OPEC Organisation of the Petroleum Exporting Countries
OVC Orphans and Vulnerable Children
PEP Post Exposure Prophylaxis
PICD Participatory Integrated Community Development
PLWHAs People Living with HIV and AIDS
PMC Project Management Committee
PMTCT Prevention of Mother to Child Transmission
PM&E Participatory Monitoring and Evaluation
PRA Participatory Rural Appraisal
PRSP Poverty Reduction Strategy Paper
RPD Rural Planning Directorate
PWD People with Disabilities
SACCO Savings and Credit Cooperative Society
SIDA Swedish International Development Agency
SIP Sectoral Investment Programmes
SRA Strategy for Revitalising Agriculture
SWG Sector Working Groups
SWOT Strengths, Weaknesses, Opportunities and Threats Analysis
TARDA Tana and Athi River Development Authority
TBA Traditional Birth Attendant
TRCG Tana River County Government
UNICEF United Nations Children's Fund
VCT Voluntary Counselling and Testing
VDC Village Development Committee
WARMA Water Resource Management Authority
WRUA Water Resource User Association

1
CHAPTER ONE
COUNTY GENERAL INFORMATION
1.0 Introduction This chapter gives the background information on the socio-economic and infrastructural
information that has a bearing on the development of the county. It provides description of
county overview, position and size, physiographic and natural conditions, administrative and
political units, political units (constituencies and wards), demographic features, human
development approach, infrastructure development, land and land use, employment, irrigation
infrastructure and schemes, crop, livestock, fish production and value addition, tourism and
wildlife, industry and trade, the blue economy (including fisheries), forestry, agro forestry and
value addition, financial services, environment and climate change, water and sanitation, health
access and nutrition, education, skills, literacy and infrastructure, sports, culture and creative
arts, community organizations/non-state actors, security, law and order, and social protection.
1.1 Position and Size
Source: Tana River County Development Planning Office, 2018 Figure 1-1: Map of Kenya Showing the Location of the County (Marked in Red)

2
Tana River County is located in the coastal region of Kenya. The county borders Kitui County
to the West, Garissa County to the North East, Isiolo County to the North, Lamu County to the
South East and Kilifi County and Indian Ocean to the South. The county straddles between
latitudes 000’53” and 200’41’’ South and longitudes 380 30’ and 40015’ East and has a total
area of 38,862.20 Km2. The county has a coastal strip of only 76 Km.
1.2 Physiographic and Natural Conditions
1.2.1 Physical and Topographic Features
The major physical features in Tana River County is an undulating plain that is interrupted in
a few places by low hills at Bilibil (around Madogo) and Bura administrative sub-units which
are also the highest points in the county. The land in Tana River generally slopes south
eastwards with an altitude that ranges between 0m and 200m above sea level.
The most striking topographical feature is the river Tana that traverses the county from the
Aberdares in the North to the Indian Ocean in the South covering a stretch of approximately
500km. Besides the river Tana, there are several seasonal rivers in the county popularly known
as lagas, which flow in a west-east direction from Kitui and Makueni Counties draining into
river Tana and eventually into the Indian Ocean. The river beds support livestock as well as
wildlife during the dry season since they have high ability to retain water. River beds are most
appropriate sites for shallow wells, sub-surface dams as well as earth pans.
1.2.2 Ecological Conditions
The county is divided into four agro- ecological zones namely: CL 3 Coconut – Cassava zone
(non ASAL), CL4 Cashew nuts- Cassava zones where the main economic activity is peasantry
mixed farming; CL5 Lowland Livestock zone and CL6 Lowland Ranching zones where the
locals are involved in pastoral activities. The soils range from sandy, dark clay and sandy loam
to alluvial deposits. The soils are deep around the riverine environments but highly susceptible
to erosion by water and wind. Soils in the hinterlands are shallow and have undergone seasons
of trampling by livestock, thus are easily eroded during rainy seasons.
The vegetation ranges from scrubland to thorny thickets within the riverine area. Shrubs and
annual grasses dominate most parts of the region. However, there are enclaves of trees and
perennial grasses dominating wetter parts. An invasive tree species called Prosopis Juliflora,
commonly known in the area as ‘Mathenge’ (named after the person who introduced it) has
spread rapidly in the area and is threatening to replace most of the indigenous vegetation. It
was introduced for fuel-wood production in the Bura Pilot Irrigation Scheme. It grows fast and
chokes other vegetation, watering points and the canals, and is colonizing most of the areas
that are not cropped, including the riparian environments.
1.2.3 Climatic Conditions
The region has a hot and dry climate within ecological zones ranging from III (in the very high
grounds) to VII (in the plains or lowlands). Average annual temperatures are about 300C with
the highest being 410C around January-March and the lowest being 20.60C around June-July.
Rainfall is low, bimodal, erratic and conventional in nature. The total annual rainfall ranges
between 280 mm and 900 mm with long rains occurring in April and May, short rains in
October and November with November being the wettest month. The Inter Tropical
Conventional Zone (ITCZ), which influences the wind and non-seasonal air pattern for the
river Tana, determines the amount of rainfall along the river line. The dry climate in the
hinterland can only support nomadic pastoralism.

3
1.3 Administrative Units
1.3.1 Administrative Subdivision
The county is divided into three (3) administrative units namely; Bura, Galole and Tana Delta,
15 wards; 54 locations; and one hundred nine (109) sub-Locations. Table 1-1 shows the area
of the county by administrative units.
Table 1-1: Area of the County by Administrative Units Constituency Area(km2) No. of wards No. of Locations No. of Sub-Locations
Bura 13,191.5 5 16 25
Galole 9,657.3 4 21 45
Tana Delta 16,013.4 6 17 41
Total 38,862.2 15 54 109
Source: Tana River County Development Planning Office, 2018
Tana Delta is the largest with 16,013.4 Km2 followed by Bura and Galole with 13,191.5Km2
and 9,657.3Km2 respectively. Figure 1-2 below is a map showing the administrative/political
boundaries of Tana River County.
Source: Tana River County Development Planning Office, 2018 Figure 1-2: Map of the Country's Administrative/Political Units
1.4 Political Units (Constituencies, Electoral Wards) Tana River County has three constituencies namely; Galole, Bura and Garsen with 15 county
electoral wards. Table 1-2 and 1-3 shows the county political units by constituency and
electoral wards.

4
Table 1-2: County’s Electoral Wards by Constituencies
Constituency Number of Electoral Wards
Bura 5
Galole 4
Garsen 6
Total 15 Source: IEBC Office, 2018
Table 1-3: County’s Electoral Wards by Constituencies Constituency Wards
Bura Hirimani
Chewele
Sala
Madogo
Babgale
Galole Wayu
Chewani
Mikindunu
Kinakomba
Garsen Kipini East
Kipini West
Garsen Central
Garsen West
Garsen South
Garsen North
Source: IEBC Office, 2018
1.4.1 Eligible and Registered Voters by Constituency
In 2017, there were 73,037 registered voters representing about 65.3 per cent of the eligible
voters in the county as shown in Table 1-4. The table also indicates the proportion of registered
voters to eligible voters.
Table 1-4: Registered Voters by Constituency Constituency Registered Voters (2012)
Bura 38,152
Galole 33,356
Garsen 46,819
Total 118,327
Source: IEBC Office, 2018
Garsen constituency with 46,819 registered voters had the highest number of voters followed by
Bura and Galole with 38,152 and 33,356 respectively.
5
1.5 Demographic Features
1.5.1 Population Size and Composition
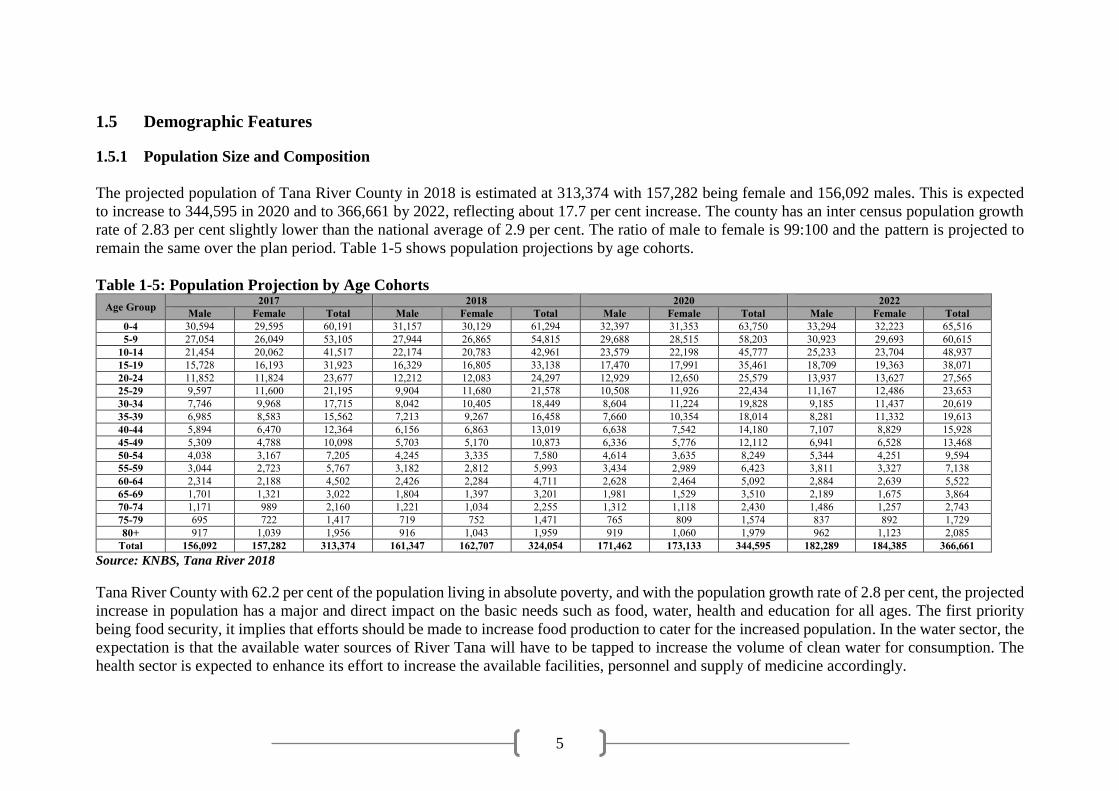
The projected population of Tana River County in 2018 is estimated at 313,374 with 157,282 being female and 156,092 males. This is expected
to increase to 344,595 in 2020 and to 366,661 by 2022, reflecting about 17.7 per cent increase. The county has an inter census population growth
rate of 2.83 per cent slightly lower than the national average of 2.9 per cent. The ratio of male to female is 99:100 and the pattern is projected to
remain the same over the plan period. Table 1-5 shows population projections by age cohorts.
Table 1-5: Population Projection by Age Cohorts
Age Group 2017 2018 2020 2022
Male Female Total Male Female Total Male Female Total Male Female Total
0-4 30,594 29,595 60,191 31,157 30,129 61,294 32,397 31,353 63,750 33,294 32,223 65,516
5-9 27,054 26,049 53,105 27,944 26,865 54,815 29,688 28,515 58,203 30,923 29,693 60,615
10-14 21,454 20,062 41,517 22,174 20,783 42,961 23,579 22,198 45,777 25,233 23,704 48,937
15-19 15,728 16,193 31,923 16,329 16,805 33,138 17,470 17,991 35,461 18,709 19,363 38,071
20-24 11,852 11,824 23,677 12,212 12,083 24,297 12,929 12,650 25,579 13,937 13,627 27,565
25-29 9,597 11,600 21,195 9,904 11,680 21,578 10,508 11,926 22,434 11,167 12,486 23,653
30-34 7,746 9,968 17,715 8,042 10,405 18,449 8,604 11,224 19,828 9,185 11,437 20,619
35-39 6,985 8,583 15,562 7,213 9,267 16,458 7,660 10,354 18,014 8,281 11,332 19,613
40-44 5,894 6,470 12,364 6,156 6,863 13,019 6,638 7,542 14,180 7,107 8,829 15,928
45-49 5,309 4,788 10,098 5,703 5,170 10,873 6,336 5,776 12,112 6,941 6,528 13,468
50-54 4,038 3,167 7,205 4,245 3,335 7,580 4,614 3,635 8,249 5,344 4,251 9,594
55-59 3,044 2,723 5,767 3,182 2,812 5,993 3,434 2,989 6,423 3,811 3,327 7,138
60-64 2,314 2,188 4,502 2,426 2,284 4,711 2,628 2,464 5,092 2,884 2,639 5,522
65-69 1,701 1,321 3,022 1,804 1,397 3,201 1,981 1,529 3,510 2,189 1,675 3,864
70-74 1,171 989 2,160 1,221 1,034 2,255 1,312 1,118 2,430 1,486 1,257 2,743
75-79 695 722 1,417 719 752 1,471 765 809 1,574 837 892 1,729
80+ 917 1,039 1,956 916 1,043 1,959 919 1,060 1,979 962 1,123 2,085
Total 156,092 157,282 313,374 161,347 162,707 324,054 171,462 173,133 344,595 182,289 184,385 366,661
Source: KNBS, Tana River 2018
Tana River County with 62.2 per cent of the population living in absolute poverty, and with the population growth rate of 2.8 per cent, the projected
increase in population has a major and direct impact on the basic needs such as food, water, health and education for all ages. The first priority
being food security, it implies that efforts should be made to increase food production to cater for the increased population. In the water sector, the
expectation is that the available water sources of River Tana will have to be tapped to increase the volume of clean water for consumption. The
health sector is expected to enhance its effort to increase the available facilities, personnel and supply of medicine accordingly.

6
Additionally, there are special age groups that need targeted interventions because of their special characteristics. These include the under one
year, the under five years, 3-5 years, primary school going age, secondary school going age, youth population, female reproductive age, labour
force and aged population as shown in Table 1-6 below shows the Tana River County population projection for selected age groups.
Table 1-6: Population Projections for Selected Age Groups
Age Group 2018 2020 2022
Male Female Total Male Female Total Male Female Total
Under 1 6,618 6,235 12,854 6,881 6,488 13,369 7,072 6,668 13,740
Under 5 31,157 30,129 61,294 32,397 31,353 63,750 33,294 32,223 65,516
6-9 21,578 20,723 42,306 22,924 21,996 44,921 23,878 22,905 46,782
10-13 18,160 17,061 35,225 19,310 18,223 37,533 20,665 19,460 40,124
6-13 39,738 37,784 77,530 42,235 40,219 82,454 44,542 42,364 86,907
14 4,014 3,722 7,737 4,269 3,975 8,244 4,568 4,245 8,813
15-17 10,220 9,424 19,631 10,934 10,089 21,007 11,710 10,859 22,554
14-17 14,235 13,146 27,368 15,203 14,064 29,251 16,278 15,103 31,367
Under 15 81,276 77,777 159,070 85,664 82,066 167,730 89,450 85,619 175,069
15-30 38,445 40,568 79,013 40,907 42,567 83,474 43,813 45,476 89,289
15-64 75,411 80,704 156,097 80,821 86,551 167,372 87,365 93,818 181,172
65 + 4,660 4,226 8,887 4,977 4,516 9,493 5,474 4,947 10,421
Women 15-49 72,274 77,463 83,602
Source: KNBS, Tana River, 2018
Under One Year: The county has an estimtated population of 12,854 infants in 2018 and is projected to increase to 13,369 by 2020 and 13,740
by 2022. This calls for special interventions in order to significantly reduce the high Infant Mortality Rate (IMR) which stands at 91/1000 (2018),
higher than the national figure of 39/1000 in 2016.
Under Five Years: This population comprises of 20 per cent of the total. The population is estimated at 61,294 in 2018 and is projected to increase
to 63,750 in 2020 and 65,516 in 2022. The county will implement projects and programmes which are aimed at enhancing immunization coverage
and health care. The county will also work towards expanding, equipping and staffing Early Childhood Development Centres (ECDCs) to cater
for this group.

7
Pre-School Education: The County has 322 public ECD centres. Among these, 167 are stand-alone ECDs while 155 are integrated with primary
schools. There are 52 private ECDs. The total number of EDC teachers is 298. The teacher - pupil ratio in pre-primary school is 1:82. The total
enrolment in public ECDs is 24,666 and 446 in private ECDs. The pre-primary retention rate is 87 per cent with a drop-out rate of 13 per cent
while transition rate is 87 per cent. However, this indicates that about 60 per cent of the pre-primary school aged children are at home. There is
need for the government to up-scale efforts to ensure all these children access school.
Primary School Age-group (Age Group 6-13): The primary school going age population (6-13 years) in 2018 was estimated at 77,530 and
projected to increase to 82,454 and 86,907 in 2020 and 2022, respectively. The increase is expected to put pressure on the existing 165 primary
schools in the county. Given this is a national government function, it calls for the construction of more primary schools, improve the facilities in
the existing schools and employ more teachers to maintain a reasonable teacher-pupil ratio. The current enrolment stands at 50,348 for public schools
and 1,450 for private primary schools, with a total enrolment of 51,798. The teacher-pupil ratio in primary level is 1:55 while dropout rate stands at 40 per cent.
The average years of attendance for primary school is 8, retention rate is 60 per cent while transition rate to secondary level is 48 per cent. Efforts need to be
put in place to ensure improved retention and transition.
Secondary School Age-group (Age Group 14-17): The population in the age group of 14-17 years (secondary school age) was estimated at
27,368 in 2018 and projected to increase to 29,251 and 31,367, in 2020 and 2022 respectively. This poses a major challenge as the county currently
has 32 public and 3 private secondary schools. The number of teacher stands at 224, making teacher - student ratio1:32 with a total enrolment of 7,215.
The dropout rate is 15per cent; while the retention rate is 85 percent.
With the introduction of free day secondary education and increase in bursaries from various devolved funds, the existing schools will not be able
to cope with the high demand. There is a need for education stakeholders to invest in constructing more secondary schools, improving the existing
facilities and employment of teachers. Further, investments are required in Youth Polytechnics to absorb those who will not be able to join
secondary schools. Secondary school students are vulnerable to HIV infection and drug abuse. The education department, religious leaders and
development partners will strengthen in-school counselling and Behavioural Change Campaigns (BCC).
There are six vocational centres in the county with total enrolment of 375 students with 35 vocational training instructors. The teacher student ratio
is 1:11; transition rate is 42 per cent while retention rate is 50 percent.
The county has one medical training college in operation and three technical training colleges currently under construction in the three sub-counties.
Special Needs Education: Enrolment of children with special needs remains low. Currently, there are 2 Special units with an enrolment of 152.

8

9
Youth (Age Group 15-30): This age group (15-30 years - youth) represents 25 per cent of the
whole county population. The population is estimated to be 79,013 in 2018 and will continue
increasing to 83,474 and 89,289 in 2020 and 2022 respectively. This population constitutes 58
per cent of the potential labour force thus effective strategies for creating job opportunities
should be developed. This is a very active group that needs to be occupied through income
generating and sporting activities; investment in skills development so that they can exploit
their potential; and information on career opportunities and business development service. The
county is challenged in the construction and equipping tertiary institutions and providing
bursaries for needy students entering post-secondary school education institutions.
The county will provide this group with behavioural change information and facilities such as
youth friendly VCT centres. The county will also invest in expanding sports infrastructure and
recreational facilities to make them fully occupied.
Reproductive Age for Women (Age Group 15-49): Women in Age Group 15-49
(Reproductive Age) constitute about 23 per cent (72,274) of the total projected population in
2018. This population is projected to increase to 77,463 and 83,602 in 2020 and 2022
respectively. With total fertility rate of 6.5 births per woman and low levels of contraceptive
adoption rates, currently at 21 per cent, the rapid population growth rate of 2.8 per cent is
expected to continue. To cater for the increase in females in the reproductive age, investment
in health services and facilities is required in the county. Important programmes on family
planning, maternal health care and girl child education will be scaled-up.
Labour Force (Age group 15-64 years): This is the economically active age group whose
increase will require a commensurate increase in creation of job opportunities. This population
stands at 156,097 in 2018, representing about 49.8 per cent of the county total population. This
age group is projected to grow to 167,372 and 181,172 in 2020 and 2022 respectively. Of the
total labour force, 51 per cent are female and are projected to dominate the age group. Due to
the expected increase in the labour force, the county will need to spur growth of many other
sectors including manufacturing, processing and trade so that they become more productive.
Currently, 83 per cent of the labour force is engaged in subsistence agricultural and livestock
activities. There is therefore a need to ensure that these economic activities are profitable
through the support of modern methods and value addition ventures.
The Dependent Population: The dependent population (under 15 years and above 64 years)
stands at 164,984 in 2018 and is projected to increase to 177,223 and 185,490 in 2020 and 2022
respectively. The challenge facing the county is to ensure that this dependent population has
adequate food, water and social amenities such as schools and hospitals. The older persons
cash transfer and OVC cash transfer programs will be scaled up to take care of the growing
needs of the county’s old people and vulnerable children respectively.
1.5.2 Urban Population
The county has two urban areas namely Hola and Madogo having a total projected population
of 41,586 in 2018 as indicated in Table 1-7. This population represents 13.8 per cent of the
total population and is expected to increase at the same rate by the year 2022. This therefore
calls for proper town planning.

10
Table 1-7: Population Projections by Urban Centres
Urban Centres
2009 2018 2020 2022
Male Female Total Male Female Total Male Female Total Male Female Total
Hola 8,470 8,867 17,337 11,095 11,615 22,711 11,782 12,334 24,115 12,510 13,096 25,606
Madogo 8,152 7,672 15,824 10,679 10,050 20,729 11,339 10,672 22,011 12,040 11,331 23,372
Garsen 1,484 1,420 2,904 1,944 1,860 3,804 2,064 1,975 4,039 2,192 2,097 4,289
Total 18,106 17,959 36,065 23,718 23,526 47,244 25,185 24,980 50,165 26,742 26,525 53,267
Source: KNBS, County Development Planning Office Tana River, 2013
1.5.3 Rural Population
The total rural population is estimated at 47,244 in 2018 representing about 15 per cent of the
total population of the county. This population is projected to increase to 50,165 in 2020 and
to 53,267 by 2022. Relevant programmes need to be initiated to improve the livelihoods of
rural communities and discourage the rural-urban migration.
1.5.4 Population Distribution and Density by Constituency/Sub-county
In 2018, the estimated population density of Tana River County is eight (8) persons per square
kilometre. This is however expected to increase to nine (9) persons per square kilometre by
2022.
Table 1-8: Population Distribution and Density by Constituency Constituency Area Sqkm 2009 Density 2018 Density 2020 Density 2022 Density
Galole 9657.3 60,866 6 79,732 8 84,663 8 89,898 9
Bura 13191.5 82,545 6 108,131 8 114,817 8 121,917 9
Garsen 16013.4 96,664 6 126,626 8 134,457 8 142,771 9
Total 38862.2 240,075 6 314,490 8 333,937 8 366,661 9
Source: KNBS, County Development Planning Office - Tana River, 2013
Table 1-9 indicates the population projections of the county by constituency. In 2018, the
estimated populations for Bura, Galole and Garsen are 108,131, 79,732 and 126,626
respectively. The population for Garsen Constituency is highest, representing 40.2 per cent,
followed by Bura (34.4%) and Galole (25.4%). This trend is expected to remain the same in
2020 and by 2022.
Table 1-9: Population Projections by Constituency
Constituency
2009 2018 2020 2022
Male Female Total Male Female Total Male Female Total Male Female Total
Bura 41,686 40,859 82,545 54,607 53,524 108,131 57,984 56,834 114,817 61,569 60,348 121,917
Galole 29,467 31,399 60,866 38,601 41,132 79,732 40,988 43,675 84,663 43,522 46,376 89,898
Garsen 48,700 47,964 96,664 63,795 62,831 126,626 67,740 66,716 134,457 71,929 70,842 142,771
Total 119,853 120,222 240,075 157,003 157,487 314,490 166,712 167,225 333,937 177,021 177,566 366,661
Source: KNBS, County Development Planning Office Tana River, 2013
1.5.5 Demographic Dividend (DD)
The Demographic Dividend is the accelerated economic growth that may result from a decline
in a country’s mortality and fertility and the subsequent change in the age structure of the
population. It is evident that demographic transition is taking place at the county, creating a
demographic window of opportunity to harness the Demographic Dividend.

11
Table 1-10: Demographic Dividend Potential
Indicators 2009 2014 2017 2020 2022 2030 2064
Population Size 240,008 277,734 303,590 332,156 352,822 446,326 898,177
% Population below 15 50.87 48.34 46.36 43.96 42.62 41.77 29.96
% Population 15-64 46.22 49.19 51.32 53.78 55.22 55.77 64.88
%Population above 64 2.90 2.46 2.31 2.26 2.16 2.46 5.16
Dependency ratio 116.34 103.28 94.84 85.96 81.09 79.32 54.13
Total Fertility Rate 6.20 5.8 5.6 5.40 5.3 4.8 2.7
Source: NCPD, 2018
This demographic window will be achieved when those aged below 15 years in the county are
less than 30% of the total population and those aged 65 years and above in the county are less
than 15% of the population. The county is expected to achieve this by 2064 as shown in Table
1-10. By then, the population below 15 years will be approximately 29.96 per cent while total
fertility will have, on average, dropped to 2.7 per woman of reproductive age. While working
age population will have hit 64.88 per cent, only 5.16 per cent of the population will be above
64 years. With this scenario, dependency will drop to 54.13 per cent compared to 116.34 per
cent in 2009.
Given the performance of its indicators, Tana River County has two decades in which its
leadership can take positive steps in prioritizing youth issues for wealth creation and sustained
economic growth.
To harness the DD, the county will implement various interventions in the socio-economic
sectors as provided in Chapter Four (4).
1.6 Human Development Indicators (HDI)
The HDI measures human development based on the basic factors of a long and healthy life,
the acquisition of knowledge, and a reasonable standard of living. These factors are measured
by life expectancy at birth, adult literacy rate and the combined enrolment ratio at primary,
secondary and tertiary levels and GDP per capita measured in purchasing power parity (PPP)
in US dollars. The county has a life expectancy of 53.8 years compared to the national life
expectancy of 57.9 years. The adult literacy rate of the county is 33.9 per cent compared to
national adult literacy rate of 87.38 per cent.
1.7 Infrastructure and Access
1.7.1 Road, Rail Network, Ports and Airports, Airstrips and Jetties
The total road network in the county is 3,377km with about 55 per cent in motorable condition.
The total road network is composed of 1,108km (class A – E) of classified roads and 2,269km
(class U) of unclassified roads. Out of this only 449km is bitumen surfaced. The major roads
in the county include the Madogo – Hola – Malindi road which is dilapidated and impassable
at various points during rains. The Kenya National Highways Authority (KeNHA) has however
put in place plans to upgrade the 330km stretch to bitumen standard, and the project is in the
design phase and construction is set to begin as soon as funds are available. The county boasts
of seven airstrips with major ones located at Hola, Bura and Garsen. The county has a 76Km
sea front with Kipini operating as a fish landing site which can be potential sea port for fishing
vessels. The LAPSSET project will potentially open up the county with road and rail network.

12
1.7.2 Posts and Telecommunications: Post Offices, Mobile Telephony & Landline.
The county is served by three mobile phone service providers that cover 55 per cent of the
county. These services are however concentrated along the Garissa- Malindi road. There are
three post offices in the whole county located at Bura, Hola and Garsen. The landline is in
deplorable state and does not function in most areas. There are five courier service providers
in the county. Internet connectivity is still low with most people using modems from mobile
phone service providers. Investments in DSTV, Zuku and other free to air satellite television
has nevertheless made access to local and international broadcasts possible in the county . The
Kenya Broadcasting Corporation (KBC) Radio is the only media house which has a signal in
the county.
1.7.3 Financial Institutions: Banks, SACCOs, Micro Finance Institutions
There are two banks (KCB and Equity bank), three bank agencies (KCB, Equity bank and Coop
bank), one SACCO, one Micro-Finance Institution (MFI) and 10 village banks in the county.
The banks, SACCO and the microfinance institutions are located in Hola and Garsen as these
areas have electricity connection with many commercial activities. These institutions will help
to boost the county’s economy through provision of various financial services and credit
facilities.
1.7.4 Education Institutions: Primary/Secondary schools, Polytechnics, Colleges,
Universities
The County has 315 ECDE centres, 152 primary schools and 13 secondary schools. Some of
the structures in the institutions are dilapidated. Although the National Government
Constituencies Development Fund (NG-CDF) from the three constituencies in the county has
been putting concerted efforts to build classrooms, administration blocks, dining halls,
laboratories and even dormitories, there is still a glaring shortage of the aforementioned
structures. There are three youth polytechnics in the county that need to be expanded to
accommodate the rising numbers in enrolment.
1.7.5 Energy Access (Main Sources of Energy, Electricity Coverage)
Majority of the population (87.5%) use wood fuel for cooking and 78.2 per cent use kerosene
for lighting. Only 0.9 per cent of the households are connected with electricity. There is a lot
of potential for the exploitation of renewable energy sources such as solar and wind, and
expansion of electricity transmission in the county through the main grid.
1.7.6 Markets and Urban Centres
There are 10 major trading centres in the county with 24 registered wholesale traders and 773
registered retail traders. There are two registered Jua Kali associations in the county with 31
members. These trading centres are the main economic hubs of the county since major business
activities are done here.
1.7.7 Housing Types
Tana River County has 547 pool institutional/government houses that accommodate civil
servants. The houses are however, inadequate and not properly maintained. This is due to
insufficient funds, lack of cheap and durable raw materials, among others.
Addressing the housing issue in the county will require the operationalization of the National
Housing Policy in the county, identification and disseminating of low cost building materials
and appropriate building technology, and creation of enabling environment to encourage
investors to venture into housing sub-sector.

13
Majority of the people (41.1 per cent) of Tana River live in mud/wood walled houses, with
about 29.5 per cent living in grass straw houses. Twenty six per cent of the roofing materials
used are corrugated iron sheets and 13.9 per cent makuti.
1.8 Land and Land Use
The land in the county is largely non-arable covering 29,798.7 km2. The rest is either under
forest 3,457 km2, arable land covering 2,547 km2, and 3,059.5 km2 under national reserves.
1.8.1 Mean Holding Size
The mean holding land size in the county is 4 ha, especially in the irrigation schemes of Hola
and Bura. In the settlement schemes of Witu I and Witu II, the mean land holding size is 15
acres while Ngao adjudication area, the mean holding size is 5 acres. Though the mean holding
land size is 4 ha, there is a variation on land holding with some farmers in Bura and Hola
irrigation schemes having between 0.6 ha and 3 ha.
1.8.2 Percentage of Land with Title Deeds
Only about 4.3 per cent of the land in the county has title deeds. Most land owners have no title
deeds since the land is communally held in trust by the County Government/Government of
Kenya.
1.8.3 Incidence of Landlessness
The incidence of landlessness is high at 95.7 per cent with a majority of the communities in the
county living as squatters since they hold no titles to the land they occupy. There has been a
major invasion by squatters into Chakamba area of Tana Delta which is a designated grazing
corridor; Kurawa holding grounds, a Government land for livestock holding; Majengo area by
Ijara people and Madogo area is also invaded by people from Garissa in search of pasture and
water for their animals. Spatial planning is therefore necessary to determine the land use
patterns in the county.
1.8.4 Land Tenure System
About 90% of land in Tana River County has not been registered, and is either community land
or government land. The inhabitants do not therefore have title deeds which can be used as
security to acquire loans from banks. This is a major loophole which land prospectors and the
National Government take advantage of acquiring land at the expense of the locals this has and
can be potential source of conflicts, especially land within and around the county headquarters
and along the coast line. The absence of individual or group parcels land title deeds has in some
cases led to underutilization of land resources. The challenge for the county is therefore to
ensure that land regimes in the county are favourable for productive activities.
1.9 Employment and Other Sources of Income
1.9.1 Wage Earners The county has an average of about 3.2 per cent under wage employment in the agricultural
sector, in government and non-governmental organisations.
1.9.2 Self-Employed About 7.3 per cent of the population in the county is self-employed in agricultural sector, jua
kali sector, boda boda and businesses.

14
1.9.3 Labour Force The county has labour force of 46 per cent of the total population. The male and female
composition is 48.9 and 51.1 per cent respectively.
1.9.4 Unemployment Levels A majority of the labour force composed of 42.8 per cent in the county is unemployed.
Unemployment levels are still very high in the county with poverty incidence standing at 76.9
per cent.
1.10 Irrigation Infrastructure and Schemes
1.10.1 Irrigation Potential Irrigation sector in Agriculture department has a commitment in enhancing agricultural
productivity through irrigation development. Although irrigation will include private and
public participation and partnership, the mandate to provide policy guidelines rests with the
department.
Tana River County is endowed with great Irrigation potential. The county irrigation potential
areas range between 180,000ha - 200,000ha, out of which only 2% has been put under irrigation
development. On the other hand, about 10% of the exploited potential is under the large scale
irrigation schemes (Bura, Hola and Tana Delta).
Out of all area identified and developed for Irrigation, only about 50% is under effective and
efficient Irrigation agriculture.
Most of the on-going irrigation practice in Tana River County is group based, under the pump-
fed group irrigation category, where by groups of between 10- 200 households have been
formed and have invested in irrigation. Most of these groups cannot afford to develop their
farms due to high cost associated.
Previous efforts by the county and other development partners, irrigation development has
produced inconsistent results due to various socio-economic problems which need to be
overcome. The main socio-economic problems and constraints which hinder irrigation
development are issues related to; skills, weak farmers organizations, infrastructure, resource
use conflicts, drought and floods, gender, and dependency syndrome
1.10.2 Performance Review There are over 100 common interest groups, mainly along the river Tana (the main irrigation
water source) which have been formed in the county and started minor irrigation schemes.
These groups, whether active or dormant remain good entry points for any future community
irrigation development in their respective areas. Name of Sub-
County
Gross Irrigation
Potential
Ha
Number of Small Scale
Projects Identified CIGs
Number of
Projects
Developed
Total Area Under
Irrigation
Ha
Bura North 67,000 35 12 15,000
Galole 64,000 31 10 12,000
Tana Delta 69,000 34 15 13,000
Total 200,000 100 37 40,000

15
1.11 Crops, Livestock and Fish Production
1.11.1 Main Crops Produced
The main crops produced in the county are mangoes, cowpeas, bananas and green grams.
Farmers in the county mainly rely on rain fed and flood recession farming systems with only a
few practicing irrigated farming. Maize production also takes place in the irrigation scheme.
1.11.2 Acreage under Food Crops and Cash Crops
The total acreage of farms under food crop production is 7,527 hectares while that under cash
crop production is 7,063 hectares.
1.11.3 Average Farm Sizes
The arable area in the county is 2,547 Km2 with the average farm size being 0.71 ha. Farmers
normally grow subsistence crops.
1.11.4 Main Storage Facilities
The main storage facilities for farm produce in the county include houses, barns and granaries.
The NCPB depot is located in Bura and Garsen with capacities of 10,000 bags each. One
storage facility with similar capacity has been constructed at Hola Irrigation scheme by the
county government. There is need for more storage facilities to be constructed to accommodate
the increase in food production.
1.11.5 Agricultural extension, training, research and information services
The department of agriculture is mandated to provide agricultural extension activities in the
county. Currently there are 27 field extension officers to cover 31,055 farmers spread in 15
wards in 3 sub counties. This gives a staff to farmer ratio of 1:817 which is lower than the ideal
1: 400. There is urgent need to recruit more personnel in this field so as to increase the ratio
and also replace those staff who by attrition have left or are leaving the service in the next five
years. 65% of the current extension staff are beyond the age of 50 and, therefore, prudent
human resource management is required so as to have a smooth succession.
Extension staff requires regular training to keep up with fast changing farming technologies.
More resources should be directed toward capacity building of staff so as to make them
relevant.
All agricultural research for the region is under the mandate of KALRO in Kilifi County. Our
county relies on research information from this institution and also sister institution in
Machakos (Katumani). Other services like soil analysis and maize aflatoxin level determination
are referred to the National Agricultural Labs, Kabete.
Market Information services are still undeveloped in the county. One of the stakeholders in the
county namely WHH/GAA has however started collecting market information in 3 major
markets in the county.
1.11.6 Main Livestock Bred
Livestock keeping is practised mainly through pastoralism by the Orma, Borana, Wardei and
Somali. The main livestock types are cattle, donkey, camel and goat. The most common breed
are Orma-boran, Galla goats, black head Persian sheep.

16
1.11.7 Poultry keeping
Poultry is kept at household level by all communities in the county. The main type of poultry
kept is indigenous chicken and ducks.
1.11.8 Ranches
There are about seven ranches in the whole county namely Wachu-30,725ha, Kibusu-25,000ha,
Haganda-12,000ha, Kitangale-20,000ha, Idasa Godana-51,000ha, Giritu-43,340ha and
Kondertu-20,000ha. Out of the seven ranches only Idasa Godana ranch is active with about ten
per cent area being exploited.
1.11.9 Main Fishing Activities, Types of Fish Produced, Landing Sites
The main types of fish produced in the county include Tuna, Catfish and Rabbit fish (marine
species), Tilapia, and Synodontis. There are three landing sites namely Chara, Ozi and Kipini
with the main fishing gear being traps, fishing nets, hooks/lines, fishing boats and marine seine
nets. Fishing activities are carried along the river Tana and at the ocean at Kipini, Ozi and
Chara. There is potential for fish farming in the area as was demonstrated by the Economic
Stimulus Project where about 900 fish ponds were established across the county. Main fishing
activities currently being undertaken in the county range from use dugout canoes, anglers, use
of fish traps and modern fish boats (trawlers). The main fish species harvested range from fresh
water fishes like protopterus, catfish, tilapia species and marine species including fin fishes and
crustaceans (crabs, prawns, lobsters and octopuses).
1.12 Mining
1.12.1 Ongoing Activities
The county has four quarry sites where sand and murram are harvested at Madogo and Meti
areas in Bura. Sand harvesting is currently heavily practised in Bura and Galole sub-counties.
There are two sites where gypsum mining is carried out at Bangale and Nanighi areas in Bura.
1.12.2 Mining Potentials
The county has three more potential gypsum sites located in Bura which have not been fully
exploited. Sand is mainly harvested along the dry river beds and lagas and there is a huge
potential for exploitation across the county.
1.13 Tourism and Wildlife
Tourism plays a very crucial role in the Kenyan economy and is a major source of potential
growth and employment. As such, the County Government of Tana-River is committed in
working with the private sector in removing the bottlenecks that hinder its growth by
strengthening the linkages between tourism and other sectors of the economy.
To diversify tourism the county government will implement marketing campaign of Tana-
River county as a major tourism destination by marketing domestic tourism, rehabilitate
tourism infrastructure, diversify and develop tourism products , develop high value cultural
centres and festivals and develop niche products such as conference, eco based, cultural, bird
watching and heritage tourism.
1.13.1 Main Tourist Attractions, National Parks/Reserves
The main tourist attractions in the county are Kora National Reserve, Arawale National
Reserve and Tana Primate National Reserve.

17
1.13.2 Main Wildlife
The main wildlife found in the county is Red Columbus Monkey, Tana River Crested
Mangabey monkeys, Elephants and Heartbeast (Hirola). Tana River delta is one of the six
deltaic areas of Eastern Africa and the largest freshwater wetland systems in Kenya. The Delta
is rich in biodiversity supporting diverse species of flora and fauna. It is internationally
important for the survival of no less than 22 species of birds making the delta one of the key
sites in the country for water bird conservation. It also holds the breeding sites of valuable
edible fish and shellfish and a rich biodiversity of other wildlife.
1.13.3 Tourist Class Hotels/Restaurants, Bed Occupancy
There are no tourist class hotels in Tana River County. All hotels in the county fall under
unclassified category.
1.14 Industry
There is a mango and honey processing factory in Tana River County though there is a great
potential for agro-based industries for maize, milk and meat processing.
1.15 The Blue Economy
Tana River County has a coastline of about 76 km and forms one of the richest fishing areas of
crustaceans around Malindi – Ungwana Bay especially prawns which are highly valued
crustaceans. The county needs to tap into it by having right investment towards value addition
and use of modern fishing technologies to increase fish catches thus improving household
incomes, food security and employment creation to fisher folk. This will boost the county share
of revenue.
1.15.1. Aquaculture (Sea weed farming)
Marine conservation for sustainable utilization of fisheries resources; and cushioning of fishing
communities from climate change aspects will ensure they adapt to the available technologies
for sea weed farming
1.15.2. Main fishing activities, types of fish produced, landing sites
The sub-sector has more potential although the fishermen have limited themselves within the
12nm due to small sizes of their fishing vessels. The county will invest more resources in the
following areas. Mariculture development (prawn fattening, crab fattening, culturing of milk
fish and construction of marine fish species hatchery); provision of modern and right fishing
gears to fisher folk with the right technology; development of cage culture within the brackish
waters; construction of a modern fish depot at Kipini to ensure Fish and Fish products are
handled in hygienic conditions.
1.15.3. Marine transport and Tourism
The county is endowed with serene natural scenic features which can attract tourists hence
will enhance our county revenue; value addition of fish like packaging, filleting and branding
of fish and fish products from Tana River County.
1.16 Forestry and Agro Forestry
1.16.1 Main Forest Types and Sizes
The county is dominated by complex ecosystem of high canopy coastal, riverine forests,
wooded bush land and thickets as well as the grasslands and mangrove forests covering
355,688.65 ha. The species that are dominant in high canopy forest area include Chlorophora
excelsa, Penicum spp, Manilkara zasibarensis, Brachilina brichantha, Terminalia spp.

18
Wooded bush is dominated by Hyphaene coriacea, Terminalia spinosa, Digitaria milinjiana,
Panicum infestum. Grassland is dominated by Echinochika spp,Sporobolus halvolus, Panicum
spp, Cynodo dactylon. Mangrove swamps forests include Brugeira spp, Avecenia spp. In the
dry lands dominant species include the Acacia spp, Dobera glabla, Salvodora persica and the
invasive Prosopis spp.
1.16.2 Main Forest Products in Gazetted and Ungazetted Forests
The Zone is endowed with natural and man-made resources that support forestry based socio-
economic investments. The forests support ecotourism due to its rich potentials in diversity of
fauna and flora, and livestock production as well as a habitat to rare and endangered wildlife.
There is a wide range of tree species including the invasive Prosopis species that support
production of non-timber forest products like gum and resins. Charcoal trade can be sustained
through organized and licensed Charcoal Producers Associations (CPAs). Provision of a range
of building products that include poles, posts and timber, herbal medicine used on subsistence
and commercial level, and supports the building of cottage industries.
1.16.3 Promotion of Agro-Forestry and Green Economy
a) Income generating activities including farm forests
Attention has been focused on the provision of the on-farm investment form of production of
fruits, honey, horticultural crops, woodlots, silage and fodder.
b) Protection of water catchment areas The water catchment areas in the county include riparian forests areas, springs, rivers, ponds
and lakes.
c) Prevention of soil erosion
There is deliberate integration of tree crops and the physical structures like the Fanya Juu Fanya
Chini earthworks and terracing, and water harvesting efforts to reduce soil erosion. Planting of
the shelter belts and alleys is being done in the county to control both water and wind erosion.
d) Provision of wood fuel and generation of energy for industries:
The county has introduced fast growing trees species of high calorific value that can supply
industrial energy.
e) Improvement of Soil fertility by growing fertilizer trees: The integration of carbon fixing tree species that nourishes and conditions soil in the county.
f) Growing of fruit trees for improved nutrition both for Domestic use and surplus for
markets There have been efforts to introduce value fruit trees, for example through budding and
grafting.
g) Provision of carbon sinks like Carbon Trading The county has been intensifying and planting carbon sequesters tree species that purify air.
h) Beautification activities in Towns, highways, schools, Homes and other public places:

19
This entails the undertaking of roadside alley planting of trees on paths and highways,
establishment of recreation parks, arboretum and botanical gardening in private and public
utilities. In this aspect, efforts need to be stepped up to realise this objective.
i) Animal feeds production ventures: There county is in pursuit of intensify irrigable fodder trees and grass like Napier planting in
farms and conservation areas for the mainstay of livestock.
j) Growing and processing for medicinal purposes/Value plants and products This involves promoting domestication and large scale production of tree species of
pharmaceutical value such as Sandal wood both for subsistence and commercialization.
1.17 Financial services
The financial services in the county is still low, this is basically due to low income of
households within the county.
1.17.1 Number of banks, Micro finance institutions, mobile money agents and
SACCOs with FOSAs
The county has a few banking services and other financial institutions. The entire county has
only two banks i.e. Kenya commercial Bank and equity bank. The Kenya women finance Trust
also has a branch at Holla. However, the mobile banking is relatively well distributed within
the county. The safaricom’s Mpesa is the most dominant within the county.
1.17.2 Distribution/coverage of financial services by sub-county
The distribution of financial services in the county is basically skewed in favour of urban
centres. Kenya commercial bank has only two branches in the whole county i.e. in Holla and
Garsen. Equity Bank has a branch at Holla as well as Kenya women finance Trust. Mpesa
services is well distributed in all sub-counties. Efforts should be made to ensure that the local
populace
1.18 Environment and Climate Change
Shifting weather patterns, for example, threaten food production through increased
unpredictability of precipitation, rising sea levels contaminate coastal freshwater reserves and
increase the risk of catastrophic flooding, and a warming atmosphere aids spread of pests and
diseases once limited to the tropics.
1.18.1 Major Contributors of Environmental Degradation
Environmental degradation is caused by over exploitation of natural resources such as forests,
mining, overstocking and overgrazing, population increase and cultivation along the river
banks, urbanization and increase in food insecurity as a result of destroying water catchment
areas.
1.18.2 Major Degraded Areas/Hotspots and Major Contributions to Environmental
Degradation
Environmental degradation is caused by over exploitation of forest through excessive charcoal
burning supported by illegal and unstructured licensing systems; mining practices that do not
follow the Environmental Management Plans as outlined in Environmental Impact
Assessments and mining licenses e.g. failing to backfill the mining pits; overstocking and
overgrazing by livestock, population increase and cultivation along the river banks,

20
urbanization and increase in food insecurity as a result of destroying water catchment areas. In
the past years, forest destructions have occurred mainly along the riverine areas where
destructions are mainly attributed to human activities especially farming. Many parts of Tana
North sub county especially the areas of Kalalani bordering Kitui County.
1.18.3 Environmental Threats
Environment degradation in the county has contributed to loss of biodiversity, degradation of
rangelands, and soil erosion particularly on farm lands, deforestation floods, and destruction of
habitats along river basins. It has also led to diminishing health and sanitation standards as a
result of environmental pollution. Invasive species especially Prosopis juliflora (Mathenge)
threatens local livelihoods especially livestock keeping by taking almost all the grazing land.
1.18.4 High Spatial and Temporal Variability of Rainfall
Rainfall is low, bimodal, erratic and conventional. Mean annual rainfall varies between 350-
450mm, mean annual evaporation is 2,366 mm. Rainfall is highly variable, patchily distributed
and often intense which can lead to sheet and gully erosion. Long rains occur in April and May
and the short rains fall in October and November. November is the wettest month with the little
erratic rainfall especially in the hinterland, the county experiences drought almost every year.
The coastline is therefore wetter than the hinterland. Higher rainfall at the coast supports crop
production especially around Kipini where cash crops like cashew nuts, cotton, mangoes and
food crops like bananas and maize are grown.
1.18.5 Change in Water Levels
The main water sources currently are River Tana, water pans/dams, shallow wells, pipeline and
boreholes which are the normal water sources at this time of the year. All the main water
sources in the county are not operating at their optimum levels due to failed two consecutive
rainfall seasons that is 2015-2016 and 2016-2017. River Tana is the most relied upon source
of water in the county. In the mixed farming livelihood zones, the main sources of water are
River Tana, shallow wells and a few piped water supplies. In the pastoral and marginal mixed
livelihood zones, main water sources include River Tana, shallow wells and water pans.
The recharge level of all the water sources in the county is very low due to prolonged drought
spell. The level of flow of River Tana is at 25 percent of its normal level. Water pans had a
recharge of less than 50 percent of their normal level. Underground water sources including
boreholes and shallow wells were equally affected by poor recharge (Less than 50 percent of
normal). It is alarming in the Tana delta area especially the Ngao water works intake where the
river is almost drying up due to drying of Matomba channel mouth. Water stressed areas are
Chifiri, Hakoka, Kesi, Roka, Koticha Mlima and Koticha odwani in Tana River sub-county.
Other water stressed wards are Bangale, Hirimani and Sala Wards in Tana north sub county as
well as Kipini west ward in Tana delta sub- county.
1.18.6 Solid Waste Management Facilities
The county has identified dumping sites for major urban areas and is in the process of
developing the sites. Previously, a private contractor was engaged to help with collection and
dumping of solid waste materials generated from the towns. Moving forward, the county plans
to purchase its own garbage collection trucks and engage services of the local people in
ensuring that the towns and other residential areas are clean, secure and healthy. Waste
recycling will also be prioritized.

21
1.18.7 Effects of Environmental Degradation
The effects of environmental degradation include degradation of rangelands, soil erosion on
farmlands, water and air pollution, deforestation, loss of biodiversity, frequent droughts and
occasional flooding, spread of diseases both human and livestock diseases and loss of aquatic
life.
1.18.8 Climate Change and its Effects in the County
Effects of climate change affecting the county include droughts, flooding, rise in sea levels
along the coastal parts, intrusion of salt waters upstream, reduced fish population in the sea,
drying of the ox bow lakes, reduced crop productivity, loss of biodiversity, changing
ecosystems and destruction of infrastructure.
1.18.9 Climate Change Mitigation Measures and Adaptation Strategies
The county is putting in place some climate change mitigation measures which include good
governance, practicing sustainable approaches to development, developing a comprehensive
land use planning, creation of awareness on the effects of climate change among the population,
identifying and protecting ecologically sensitive and fragile areas and discarding old practices
and embracing modern and sustainable practices/technologies.
1.19 Water and Sanitation
1.19.1 Water Resources and Quality
River Tana is the longest river in Kenya covering about 850 Km long with catchments area of
about 95,000 Km2 traversing the landscape from its source in Aberdare Ranges in central
Kenya to the Indian Ocean. It discharges on average 4,000 million litres of fresh water annually
into the ocean near Kipini at Ungwana Bay. The Seven Folks Hydro Electric power Stations
and Bura and Hola irrigation schemes are located upstream of the delta. Tana River supports
industrial and other socioeconomic functions such as power generation upstream, agriculture,
livestock, tourism and micro-enterprises found within the basin.
Water in the county remains a problem for domestic use, livestock and irrigation. The county
has 492 shallow wells, 120water pans, 8 Small earth dams and 36 boreholes. The proportion
of households with access to piped water is 17% while proportion of households with access
to portable water is 40%.
1.19.2 Water Supply Schemes
Tana River County has a total of five (5) Gazetted Water Supplies, three (3) community water
supplies, 36 Boreholes, 492 shallow wells and 120 water pans. Some of these water supplies
were done by the County Government and other by the National Government through
development partners. The major water supplies serve a total area of 140Km2, with a total
production of 6610.m3/day. The total population served is 50,000 directly by these water
supplies. The number of storage tanks in these water supplies range between 10m3 to 500m3.
This gives the County a total storage capacity of 2265m3 with a total pipe network covering
200Km.
The county is served by two Water Service Providers (WSP) namely Tana Water and Sanitation
Company and Lamu Water and Sanitation Company and Community managed supplies with
majority of these water supplies concentrated in Tana Delta Sub-County. In its effort to ensure
an integrated water resources management and development through stakeholder’s
participation to ensure availability and accessibility to water, The Ministry of Water &
Irrigation through Coast Water Services Board (CWSB) and development partners have been
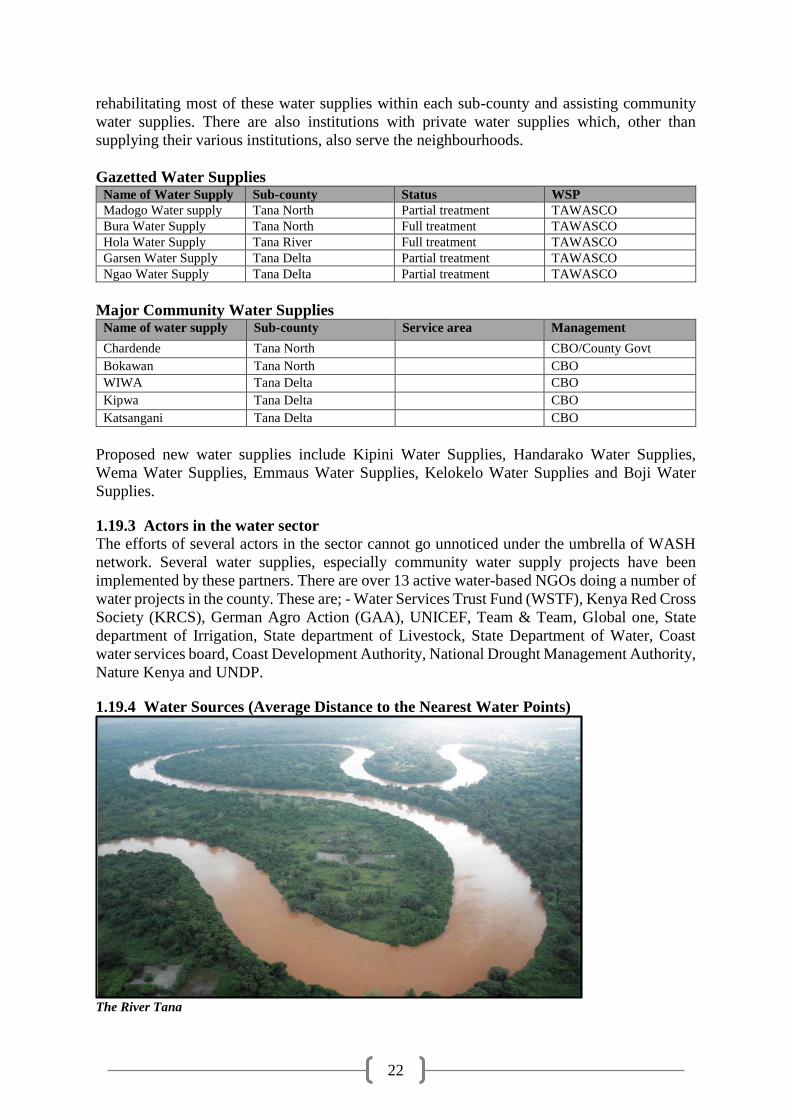
22
rehabilitating most of these water supplies within each sub-county and assisting community
water supplies. There are also institutions with private water supplies which, other than
supplying their various institutions, also serve the neighbourhoods.
Gazetted Water Supplies Name of Water Supply Sub-county Status WSP
Madogo Water supply Tana North Partial treatment TAWASCO
Bura Water Supply Tana North Full treatment TAWASCO
Hola Water Supply Tana River Full treatment TAWASCO
Garsen Water Supply Tana Delta Partial treatment TAWASCO
Ngao Water Supply Tana Delta Partial treatment TAWASCO
Major Community Water Supplies Name of water supply Sub-county Service area Management
Chardende Tana North CBO/County Govt
Bokawan Tana North CBO
WIWA Tana Delta CBO
Kipwa Tana Delta CBO
Katsangani Tana Delta CBO
Proposed new water supplies include Kipini Water Supplies, Handarako Water Supplies,
Wema Water Supplies, Emmaus Water Supplies, Kelokelo Water Supplies and Boji Water
Supplies.
1.19.3 Actors in the water sector
The efforts of several actors in the sector cannot go unnoticed under the umbrella of WASH
network. Several water supplies, especially community water supply projects have been
implemented by these partners. There are over 13 active water-based NGOs doing a number of
water projects in the county. These are; - Water Services Trust Fund (WSTF), Kenya Red Cross
Society (KRCS), German Agro Action (GAA), UNICEF, Team & Team, Global one, State
department of Irrigation, State department of Livestock, State Department of Water, Coast
water services board, Coast Development Authority, National Drought Management Authority,
Nature Kenya and UNDP.
1.19.4 Water Sources (Average Distance to the Nearest Water Points)
The River Tana

23
The county’s water resource comprises of both ground and surface water. Surface water
consists of permanent rivers such as River Tana and ground water sources that include;
boreholes, shallow wells, and earth pans. In Tana River County, the average distance to nearest
water point (either surface or underground) is four kilometres.
1.19.5 Water Management
The responsibility for water supply and sewerage in Tana River falls under Tana Water and
Sanitation Company (TAWASCO). Also, some of water is managed by CBOs like Witu Water
Users Association (WIWA) in Kipini. Sewerage services in the county is yet to be developed.
Coast Water Services Board carried out a feasibility study on solid waste management and
gave out some recommendations for implementation of urban solid waste management which
is yet to be implemented. Service standards are set and monitored by a national water regulatory
agency called the Water Services Regulatory Board (WASREB).
1.19.6 Sanitation
The reference on sanitation is on housing-ventilation and rendering of floors and walls of
buildings, provision of dish-racks, cloth hang-line, waste disposal at household level and public
in general at market centres. At the market centre level the attention is on waste disposal. Of
all the centres, only Hola has a Public toilet, collection of waste is done by the county
government within Hola town and there is no designated disposal point for the waste. The
situation in most of our institutions especially schools, is reasonably good as they have latrines
albeit not adequate.
Generally, the average sanitation level in the county is at 48 per cent. As much as 40 percent
of the households in the county have pit latrines, five percent of which are uncovered. Open
defecation by adults and disposal of children feaces in the open is still rampant in most rural
areas of the county. The use of buckets is disappearing and only three households still use them.
The County has never developed a sewerage system but Coast Water Services Board
commissioned a feasibility study on Water and Sanitation Improvement. The project objective
was to identify sound, feasible and rational strategies through to 2040 for the development of
wastewater management services for the growing urban centres on the Coast region including
developing logical Framework Matrix for Planning, Design, implementation and Evaluation of
the Wastewater Management Strategies.
1.20 Health Access and Nutrition
1.20.1 Health Access (Health Facilities, Personnel)
There are 71 health facilities in the county with two level four public hospitals located in Hola
and Ngao. There is one sub-county hospital in Bura, five public health centres, 40 dispensaries
and 20 private clinics, two mission dispensaries and one private health centre. The bed capacity
is 158 while the average distance to a health facility is six kilometres. The county has six
doctors, 126 nurses, 1,149 CHEWs, 25 PHOs, and three nutritionists against a projected
population of 265,854.
Tana River County has low numbers of healthcare providers owing to difficulties in attracting
and retaining them. There is a chronic shortage personnel in almost all areas of medical practice
and management. There has never been a medical officer specialist in the county. However,
the situation has been steadily improving since devolution, with core clinical staff numbers
growing in almost twofold. There still remains a big room for improvement as shortage of staff
exists in all critical areas.

24
In service capacity building has been weak, both in technical and management areas. There is
need to provide opportunities for training in specialty areas for all technical staff. Management
staff need to be offered opportunities to build their capacity in training.
On the advent of devolution, the number of health facilities has tremendously increased.
However there is need for expansion of the current facilities to enable them offer services in
line with best practices. Some existing facilities need to be improved. Laboratories need to be
refurbished to mirror current best practices in infection control and meet standards towards
accreditation. Hospitals need to be improved to offer more patient friendly environment to
clients. Supportive infrastructure like offices need to be equipped with furniture and other
office equipment to enable management officers discharge their duties in a supportive
environment. There is need to take inventory of exiting laboratory, pharmacy and other hospital
equipment with the view of establishing obsolescence and shortage of critical equipment due
for replacement. This will increase quality service delivery and will significantly reduce
referrals.
There is need to increase staff houses in most facilities, being a factor towards retention of the
health workforce.
The table below illustrated the state of health workforce and respective gap for each cadre.
Cadre Number
available Gap Cadre
Number
Available Gap
Medical Doctors 10 10 Physiotherapists 2 8
Specialized clinical officers 4 15 Medical Laboratory Technologist 32 18
General clinical officers 71 30 Medical Laboratory Technicians 10 16
Community Oral Health officers 2 18 Health Record & Information Officers 7 13
Dentists 1 4 Health Record & Information
Technicians 0 10
Dental Technologists 1 11 Occupational Therapists 1 9
Nursing officers (BSN) 7 13 Medical Engineering Technicians 1 6
Kenya Registered community Health
Nurses 164 76 Medical Engineering Technologists 2 6
Kenya Enrolled community Health
Nurses 22 38 Trained Community Health Workers 0 10
Public Health Officers 22 58 Community health officers 0 10
Public Health Technicians 11 25 Assistant Community Health Officers 0 25
Radiographers 5 7 Community Health Assistant 55 43
Pharmacists 3 6 Non-Medical personnel 10 15
Pharmacist Technologists 8 22 Administrators 7 10
Orthopedic Technologists 1 8 Accountants 3 6
Plaster technicians 2 10 Secretaries 2 8
Cooks 14 10 Social health workers 0 6
Drivers 20 0 Clerks 0 9
Security officers 25 0 Mortuary attendants 1 6
All others non-technical HR 10 0 Cleaners 10 20

25
1.20.2 Morbidity: Five Most Common Diseases in Order of Prevalence
The most prevalent diseases in the county in order of priority are respiratory track infections,
diarrhoea, malaria, skin diseases and pneumonia.
1.20.3 Nutritional Status
As shown below, the percentage underweight for 2012 has reduced due to the various
interventions put in place. That is increased nutrition surveillance, SFP/OTP programmes and
Infant and Young Child Feeding (IYCF) activities.
Year Jan Feb Mar Apr May Jun Jul Aug Sep Oct Nov Dec
2011 12.4 13.7 16.2 15.2 13.9 14.9 14.1 10.3 17.4 11.2 11.6 12.1
2012 12.2 11 10.3 12.8 13 10.3 11.5 12.2 9.8 11.9 9.7 17.5
Source: MOH Tana River, 2018
1.20.4 Immunization Coverage
The county has an average immunization coverage of 76 per cent which is below the World
Health Organisation/National average of 90 per cent. The major challenges for low
immunisation coverage are attributed to nomadic lifestyle and frequent depletion of stock of
the required antigens.
1.20.5 Access to Family Planning Services/Contraceptive Prevalence
The county target for Family Planning (FP) services is to the women of child bearing age (15-
49 years). The county’s average uptake of FP services is 34.3 per cent. The uptake is low due
to the religious faith of the communities. Otherwise all FP methods are available in the county.
1.21 Education and Literacy
1.21.1 Pre-School Education
The county has 315 ECDE centres with 462 teachers. The gross enrolment rate is at 56.3 per
cent with a teacher pupil ratio of 1:51. The enrolment of boys and girls is at 55.6 and 42.7 per
cent respectively.
1.21.2 Primary Education
The county has 152 primary schools with 1,219 teachers giving rise to a teacher pupil ratio of
1:40. However, the available schools are not evenly distributed. The average gross enrolment
is at 60.4 per cent with boys’ enrolment rate standing at 68.5 per cent while that of girls stands
at 51.9 per cent.
1.21.3 Literacy
The literacy rate for the county is 33.7 per cent and the illiteracy rate is at 66.3 per cent.
However, this data is not disaggregated between male and female.
1.21.4 Secondary Education
The county has 52 secondary schools with 150 teachers. The teacher/student ratio is 1:32. The
net enrolment is 4,903 with 1,603 being girls and 3,300 boys. The girl population is so low due
the high drop-out rate arising from early marriages and pregnancies.
1.21.5 Tertiary Education
There are no colleges or universities in the county. Concerted efforts need to be directed
towards the construction of tertiary institutions in the county to boost transition rates and build
on the human resource base.

26
1.22 Sports, Culture and Creative Arts
The county has one community cultural centre and one social hall situated in Tana Delta Sub
County and both still under construction
1.22.1 Heritage and Cultural sites
There are several unexploited cultural sites
1.22.2 Talent Academies
Despite having a huge potential for talent development, the county has no talent academy.
1.22.3 Sports facilities
The county has a huge talent base for sporting activities but is hampered by limited technical
personnel and facilities. There is one County Sports Office with only three staff members, three
sports grounds one each in Tana River, Tana North and Tana Delta Sub Counties.
1.22.4 Libraries /information documentation centres/ Citizen service centres
There are no community libraries. The County has and on Documentation and Information
Centre and one newly launched Huduma Centre both in Hola
1.22.5 Registered traditional herbalists and medicine-men
The county has a presence of traditional herbalists and medicine men but data on their
registration status is unavailable.
1.23 Community Organizations/Non-State Actors
1.23.1 Cooperative Societies
There are 28 cooperative societies in the county with only 12 being active. The cooperative
societies in the county are composed of six SACCOs, seven agriculture based societies, eight
livestock cooperative societies, two consumer societies and five multipurpose societies. The
cooperative movement in the county needs to be strengthened to improve on the levels of
income and reduce the poverty levels in the county.
1.23.2 Non-Governmental Organizations
There are 18 NGOs which include among others German Agro Action, Samaritans’ Purse, Girl
Child Network, Nature Kenya, International Medical Corps, Action Against Hunger, and
Catholic Relief Services that are actively operating in the county. These NGOs undertake
development activities including; provision of drinking water for humans and animals,
construction of water facilities and Water, Sanitation and Hygiene (WASH) in schools.
1.23.3 Self Help Women & Youth Groups
The county has 405 self-help groups, 340 women groups and about 385 youth groups. These
groups, however, require training in order to equip them with entrepreneurial skills for self-
employment. This shall facilitate them to benefit from the Youth and Women Enterprise
Funds.
1.24 Security, Law and Order
1.24.1 Number of police stations and posts by sub county
The county has five police stations at Hola, garsen, Bura, Madogo and wenje. However there
are several police posts distributed within the county
1.24.2 Types, trends and crime prone areas
27
Tana River has a crime index of 259 per 100,000 people, implying that it is among the counties
with the highest crime rate in Kenya. The most common crime is theft of vehicles and other
parts, offences against morality, breakings, use of dangerous drugs and stealing. The urban
areas constitute the most crime prone areas i.e. Hola, Bura and Madogo.
1.24.3 Types and number of courts
The county courts at Hola and Garsen. In garsen we have the High court, senior principal
magistrate’s court, principal margistrates court and resident magistrate’s court. In Hola we only
have principal magistrates court. We also have the Kadhis courts at Hola and Garsen.
1.24.4 Prisons and probation services
There is a prison facility within the county located at Hola. The probation services are also in
Hola
1.24.5 Number of public prosecution offices
There is an established office of the director of public prosecutions in at Hola and Garsen.
1.24.6 Community policing activities
The county has an established community policing. This is a collaboration between the national
police service, the county government and the local public.
1.25 Social Protection
1.25.1 Number of Orphans and Vulnerable children (OVCs)
The county has a total of 3099 orphans and vulnerable children households, 797 in Tan River,
1203 in Tana North Sub and 1099 in Tana Delta Sub Counties.
1.25.2 Cases of Street children
The county has 10 families hosting retarded children but no documented cases of street
children.
1.25.3 Child care facilities and Institutions by sub-county (children offices, Number of
orphanages, rescue centres, and correction/rehabilitation facilities
The county has 4 Children Officers but lacks children facilities like children offices,
orphanages, rescue centres, and correction/rehabilitation facilities.
1.25.4 Social net programmes in the county
The following social safety net programmes are offered in the County -Cash Transfer to Older
Persons (OPCT) of above 65+ years, Cash Transfer to Orphans and Vulnerable Children (CT-
OVC) and Cash Transfer to Persons with Severe Disabilities (CT-PWSD). According to the
provisional 2013 and 2014 statistical abstracts from the Department of Social Services, Tana
River County had 293 and 302 consolidated number of beneficiaries with an annual
disbursement of Kshs.4,711,000 and Kshs. 1,120,000 respectively.

28
CHAPTER TWO
LINKAGES WITH VISION 2030 AND OTHER PLANS
2.1 Overview
This chapter describes the linkages of the County Integrated Development Plan with the
Kenya Vision 2030, Mid Term Plan (MTP) III, Jumuia ya Kaunti za Pwani (JKP) Regional
Economic Bloc and other long term plans, strategies and policies. The linkage with the
Sustainable Development Goals (SDGs)has also been provided. Further, the chapter
highlights the linkage of the CIDP with the National government transformation priorities on
Food security, Universal health care, Manufacturing and Housing (“the Big four”).
2.2 Linkage of the CIDP with the Kenya Vision 2030, its Medium Term
Plans and Other Plans, Policies and Strategies
2.2.1 CIDP linkages with the Kenya Vision 2030
Vision 2030 is the Kenya’s long-term development blue print that aims to transform the country
into a globally competitive and prosperous nation offering a high quality of life for all citizens
by the year 2030. Sessional Paper Number 10 of 2012 on Kenya Vision 2030 entrenches Kenya
Vision 2030 as the long term development strategy. The vision is anchored on three pillars:
economic, social and political.
Economic Pillar: The Economic Pillar aims at providing prosperity for all Kenyans through
an economic development programme meant to achieve sustainable growth at an average rate
of 10% per annum over a period of 25 years. The county will work towards ensuring a double
digit national economic growth by: increasing agricultural, livestock and fish production, and
also enhancing resilience and market access in agriculture sector through market development
and crop value addition, provision of agricultural extension services, and establishing
agricultural research centre; promoting and diversification of tourism products that leads to
increased tourist arrival and spending through establishment of cultural research centre, and
development of new tourism products; establishing industrial parks and business centres;
increasing use of internet t use; and promoting fair trade practice within the county.
Social Pillar: This pillar seeks to build a just and cohesive society enjoying equitable social
development in a clean and secure environment based on the transformation of eight selected
social sectors namely, education and training, water and sanitation, the environment, housing
and urbanization, gender, youth, sports and culture. To achieve the goal of this pillar the county
will ensure quality education especially in ECD and polytechnics through equipping and
recruiting technical personnel, and increase the ennoblement rates in schools by lowering the
cost of acquiring education and constructing more education infrastructures; increase access to
quality healthcare services by constructing new referral hospital, diagnostic centre, equipping
the existing health care facilities, and upgrading health facilities; promoting talent
improvement in sport by constructing sports stadium, and improving village stadiums;
increasing water supply to the county residents; conserving and protecting the environment.
Political Pillar: Political Pillar aims at realizing a democratic political system founded on issue
based politics that respect the rule of law, and protects the fundamental rights and freedoms of
every individual in the Kenyan society. In attainment of its agenda, the county administration
will ensure that the two levels of government coexist in cooperation and consultation on all

29
development matters. The county government will promote and ensure adherence to the rule
of law in its operations. It will also endeavour to ensure peaceful coexistence among the
residing communities in the county.
2.2.2 Linkage of the CIDP with the Medium Term Plans
The Kenya Vision 2030 is implemented through successive five year Medium Term Plans. The
national government has developed the third medium term plan (2018 – 2022) to which county
governments must align their Integrated Development Plans in order to realize the aspiration
of Kenya Vision 2030. The MTP III prioritizes the development of infrastructure and creation
of an enabling environment to ensure realization of the goals of the three pillars of Vision 2030.
The County Government of Tana River has ensured that all its development priorities are
aligned to the National Development Agenda. Therefore, the County Integrated Development
Plan is aligned to the MTP III. It is therefore imperative that within a context of competing
priorities, all resources are geared towards achieving core priorities that will have broad based
benefits for all. The Lamu Port South Sudan Ethiopia Transport corridor (LAPSSET) project
and the agricultural development of Galana Kulalu are two flagship projects under the Vision
2030 which could impact the county development.
2.2.3 Linkage with ‘Big Four’ Plan and Governors Manifesto
"The Big four" plan for Kenya, is a presidential decree on what the government plans to
achieve for the next five years arising from the development needs of the Kenyan people. The
government recognizes the fact that a jobless Kenyan is a desperate Kenyan; a hungry Kenyan
is a negative Kenyan; a sick Kenyan is a weak Kenyan; and a homeless Kenyan is a person
without hope.
The Big Four agenda are: food security, affordable housing, manufacturing and affordable
healthcare for all. "The Big Four are expected to create jobs, which will enable Kenyan Citizens
to meet their basic needs that will transform their lives to a new status of greater comfort and
wellbeing.
Under manufacturing, the government will focus on boosting four manufacturing sub sectors
namely: the Blue Economy, Agro-Processing, Leather and Textiles. The fishing industry is
expected to grow seven fold and a ready market of leather products will be guaranteed from
government departments notably the armed forces and other agencies. Further, the tea, coffee,
meat, fruits and vegetables will be processed locally to obtain more value from the produce,
and create more jobs and wealth for Kenyans. The government will also make arrangements
with expatriates in manufacturing to ensure Kenyans receive proper training and safeguard
protection of intellectual property rights.
The government targets to ensure that half a million Kenyans will be able to own affordable
and decent homes by 2022 by reducing mortgage and construction costs. Universal health care
will be realized by policy and administrative reforms in the medical sector. The government
will enforce collaboration between National Hospital Insurance Fund (NHIF) and private
medical insurance providers so as to ensure wider coverage. On food security all idle arable
land will be put to use where the Ministry of Agriculture and Irrigation will publish terms which
commercial farmers can lease agricultural land owned by the government.

30
The County Government of Tana River has designed programmes in the CIDP address issues
of housing, food insecurity and value addition , and health which are all aligned to the big four
agenda.
The governor in his manifesto has outlined his key priorities for the county with a vision to
have community that is capable of determine her own destiny. The manifesto outlines areas of
Tourism, environment, education and health as key sectors of focus for the governor with
women and youth being at the centre of his interventions. The governor is also focussed on
addressing issues of leadership and corruption which are critical to delivery of planned
programmes and projects in the CIDP.
2.2.4 Linkage with Sectoral Plans, Urban and City Plans within the County
The law provides that county departments prepare ten year sectoral plans as a component part
of the county integrated development plan. The County sectoral plans are programme-based
and are the basis for budgeting and performance management. The plan will be reviewed after
every five years by the county executive and approved by the county assembly.
The County Government Act 2012 also stipulates that each county develop a 10year spatial
plan that is based on GIS database reflecting a spatial depiction of the social and economic
development programmes of the county as articulated in the CIDP. The spatial plan will be
updated annually and is linked to the regional, national and other county plans with clear
clarifications on the anticipated sustainable development outcomes of the plan. Spatial
planning identifies development projects and programmes and locates them on specific
geographic areas in a county. Spatial plans also display the necessary coordination between
various sectors, like transport networks and their relationship to agricultural production and
markets; industrial areas and energy projects that supply them; zoning of urban-versus-rural
areas; public facilities and private home developments. The county has included the
development of county spatial plan in the CIDP.
The Urban Areas and Cities Act, 2011 is also emphatic on the need for five year cities and
urban areas integrated development planning and the need to align annual budgeting to the
plan. These plans are separate from those of the county but they must be aligned to county
integrated development plans. Section 36(2) of the Act states that, an integrated urban or city
development plan shall bind, guide, and inform all planning for development and decision-
making and ensure comprehensive inclusion of functions.
Section 37(1) of the Urban Areas and Cities Act, 2011 requires that urban area integrated
development plan shall be aligned to the development plans and strategies of the county
governments. The urban area integrated development plan is expected to be the basis for:
i. The preparation of environmental management plans; the preparation of valuation rolls
for property taxation;
ii. Provision of physical and social infrastructure and transportation;
iii. Preparation of annual strategic plans for a city or municipality;
iv. Disaster preparedness and response;
v. Overall delivery of service including provision of water, electricity, health,
telecommunications and solid waste management; and
vi. The preparation of a geographic information system for a city or municipality.
31
2.2.5 Linkage of the CIDP with Jumuia Ya Kaunti za Pwani
Six Counties from coastal region (Mombasa, Kwale, Kilifi, Tanariver, Lamu and Taita Taveta)
came together to form the Jumuia ya Kaunti za Pwani (JKP), an economic and
intergovernmental regional bloc with an objective to promote infrastructural development,
tourism, education, youth employment and tap into the coast blue economy. JKP seeks to
exploit the strategic connection between the member counties with shared interests in forming
a viable unit for sustainable socio-economic development. The regional approach also seeks to
ensure access to new expanded markets, economies of scale, larger labour force and shared
natural and infrastructural resources. The county will develop strategies and that will support
the implementation of the proposed programmes and transformative projects as enshrined in
JKP economic plan.
The County Integrated Development Plan (CIDP) is meant to link the socio-economic and
spatial development of the county to achieve sustainable development of the county. The plan
shall explore sectoral linkages to advance synergy building in order to mitigate against wastage
of resources while encouraging efficiency in service delivery. The CIDP shall identify and
consider various short and medium-term sectoral plans as well as the appropriate national
policy and legal frameworks.
2.2.6 Integration of the Sustainable Development Goals (SDGs) into the CIDP
The Sustainable Development Goals (SDGs) are internationally accepted development agenda
agreed on by United Nations (UN) member states and comprise 17 goals and 169 indicators.
The SDGs build on the Millennium Development Goals (MDGs), the global agenda that was
pursued from year 2000 to 2015. The SDGs are to guide global action on sustainable
development until 2030. The SDGs are action oriented, global in nature and universally
applicable. Kenya is a signatory to the SDGs, and has made commendable efforts in
achievement of the 17 goals as outlined in the Voluntary National Report (VNR) for Kenya
submitted to the High Level Political Forum on SDGs in June 2017. Kenya also developed a
roadmap to guide SDGs implementation that includes mainstreaming SDGs in all development
planning.
The full realization of SDGs benefits will occur in the context of the county government and
that County governments are the basic local governance units that can support localization,
mainstreaming and implementation of Sustainable Development Goals. All the SDGs have
targets that are directly or indirectly related to the devolved functions as enshrined in schedule
four of the Constitution of Kenya 2010.
The county governments are key in the realization of the SDGs by mainstreaming the SDGs
into its development planning process, in the design of County programmes and projects and
by availing adequate resources to the sectors programmes and projects addressing SDGs. Tana
River County will seek partnership with National Government, Development Partners,
Philanthropists, Foundations, United Nations Agencies, Civil society and private sectors in
implementation and tracking of the SDGs. Further, the County has integrated the nationally
prioritized SDGs indicators in the County Integrated Monitoring and Evaluation System
(CIMES) and will allocate resources to support periodic monitoring and reporting.
There are 17 Sustainable Development Goals (SDGs) and 169 targets which have been
mainstreamed into sectoral programmes and projects. These goals are:
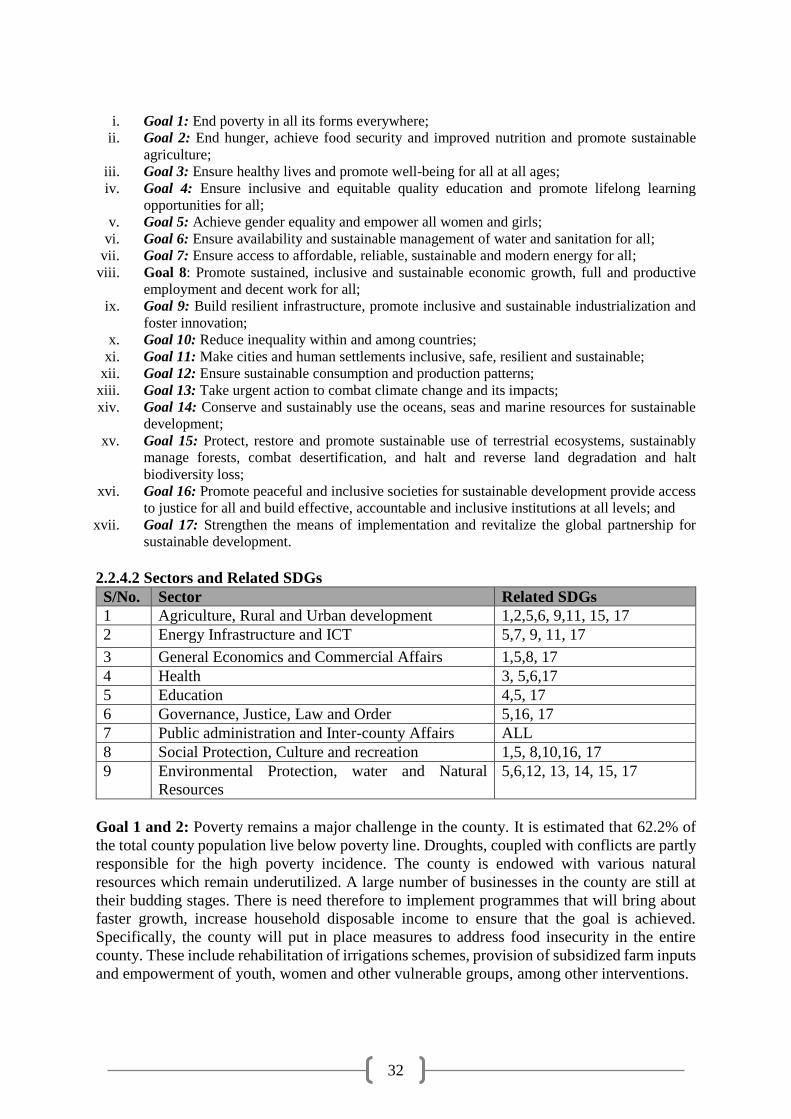
32
i. Goal 1: End poverty in all its forms everywhere;
ii. Goal 2: End hunger, achieve food security and improved nutrition and promote sustainable
agriculture;
iii. Goal 3: Ensure healthy lives and promote well-being for all at all ages;
iv. Goal 4: Ensure inclusive and equitable quality education and promote lifelong learning
opportunities for all;
v. Goal 5: Achieve gender equality and empower all women and girls;
vi. Goal 6: Ensure availability and sustainable management of water and sanitation for all;
vii. Goal 7: Ensure access to affordable, reliable, sustainable and modern energy for all;
viii. Goal 8: Promote sustained, inclusive and sustainable economic growth, full and productive
employment and decent work for all;
ix. Goal 9: Build resilient infrastructure, promote inclusive and sustainable industrialization and
foster innovation;
x. Goal 10: Reduce inequality within and among countries;
xi. Goal 11: Make cities and human settlements inclusive, safe, resilient and sustainable;
xii. Goal 12: Ensure sustainable consumption and production patterns;
xiii. Goal 13: Take urgent action to combat climate change and its impacts;
xiv. Goal 14: Conserve and sustainably use the oceans, seas and marine resources for sustainable
development;
xv. Goal 15: Protect, restore and promote sustainable use of terrestrial ecosystems, sustainably
manage forests, combat desertification, and halt and reverse land degradation and halt
biodiversity loss;
xvi. Goal 16: Promote peaceful and inclusive societies for sustainable development provide access
to justice for all and build effective, accountable and inclusive institutions at all levels; and
xvii. Goal 17: Strengthen the means of implementation and revitalize the global partnership for
sustainable development.
2.2.4.2 Sectors and Related SDGs
S/No. Sector Related SDGs
1 Agriculture, Rural and Urban development 1,2,5,6, 9,11, 15, 17
2 Energy Infrastructure and ICT 5,7, 9, 11, 17
3 General Economics and Commercial Affairs 1,5,8, 17
4 Health 3, 5,6,17
5 Education 4,5, 17
6 Governance, Justice, Law and Order 5,16, 17
7 Public administration and Inter-county Affairs ALL
8 Social Protection, Culture and recreation 1,5, 8,10,16, 17
9 Environmental Protection, water and Natural
Resources
5,6,12, 13, 14, 15, 17
Goal 1 and 2: Poverty remains a major challenge in the county. It is estimated that 62.2% of
the total county population live below poverty line. Droughts, coupled with conflicts are partly
responsible for the high poverty incidence. The county is endowed with various natural
resources which remain underutilized. A large number of businesses in the county are still at
their budding stages. There is need therefore to implement programmes that will bring about
faster growth, increase household disposable income to ensure that the goal is achieved.
Specifically, the county will put in place measures to address food insecurity in the entire
county. These include rehabilitation of irrigations schemes, provision of subsidized farm inputs
and empowerment of youth, women and other vulnerable groups, among other interventions.

33
Goal 3: In 2012, immunization coverage was 76% which was below the WHO/National
average of 90 per cent. In meeting the required coverage, the county is constrained by nomadic
life style and frequent depletion of stock of the antigens. The child mortality rate (below five
years) is 87 per 1000 and infant mortality rate is at 71 per 1000. The proportion of births
attended by skilled health personnel stands at 23.2%. This implies that many mothers deliver
at homes and the chances of achieving this goal are very low. The contraceptive prevalence
rate is 34.3%.
The HIV and AIDS prevalence rate among the population aged 15-24 years is 1.3%. The
proportion of population aged 15-24 years with comprehensive correct knowledge of HIV and
AIDS is 55.2%. Free Voluntary Counselling and Testing services are available at all public
health facilities with mobile Voluntary Counselling and Testing services are also offered. There
is significance access to HIV and AIDs treatment services and Anti-Retroviral Drugs being
made available in all the public health facilities. Though the health department continues to
supply insecticide treated mosquito nets for use by children and pregnant women, only 15% of
children under five sleep under insecticide treated mosquito nets. Thus malaria continues to be
the most prevalent disease affecting over 60% of all reported causes of morbidity.
Goal 4: The county is not on course in ensuring that school going age have access to primary
education. This is indicated by the low net enrolment rate of 49.2 per cent. This means that
many children of school-going age are still at home despite the free primary education and
other programmes that are meant to boost enrolment levels. The transition rate from primary
to secondary is 87.3 per cent and this can be attributed to improved infrastructure, new schools,
bursaries and school feeding programmes. Literacy rate of 15-24 year-olds, women and men is
at 27.6% and 40.2 % respectively. To improve ion enrolment rate and literacy, the county will
heavily invest in education programmes within the plan period.
Goal 5: The girl to boy ratio in primary and secondary schools stands at 0.757 and 0.486
respectively, which compares very lowly with the national level of 0.958 and 0.834
respectively. Thus indicating that gender parity in both primary and secondary education is
likely not to be achieved.
Goal 6: Sanitation is still very low and attention is on waste disposal, whereby of all the centres
across the county, only Hola has a public toilet. Collection of waste is done by the council
within Hola Town though there is no designated disposal point for the waste. The households
accessing clean drinking water are about 45 per cent. Efforts are being made to bring water
close to community especially those living in the hinterland.
Most urban/trading centres within the county have no drainage systems with no definite
systems of clearing solid and liquid waste material with a biggest percentage being disposed
anyhow. There has been slow pace in implementing environmental policy aimed at
environmental sustainability.
Goal 9: The County’s telecommunication coverage is growing especially within towns/centres
that have electricity with almost 65 per cent having access to mobile phone services. The
mobile network covers only parts of centres along the Garsen-Hola-Garissa road while most of
the hinterland is not covered. The landline telephone communication connectivity is 0.35 per
cent. There has been an increase uptake of internet usage both in the public and the private
sector. The county is yet to be connected to the fibre optic cable and internet access charges
are still high. Accessibility to computer by the general public is very low due a low presence

34
of cyber cafes. Further, the county will continue to develop climate-proofed infrastructure to
mitigate flood-related damages.
Goal 15: Management of natural resources has continued to dog the communities in the county
due to illiteracy as is manifested in the wanton destruction of forests and catchment areas,
natural disasters like droughts and harsh climatic conditions. Rehabilitation of catchment
points, afforestation of degraded land, formation and training of Community Environment
Committees (CEC), as well as formation of Community Forest Associations (CFA) to protect
forest cover remain key strategies that need to be undertaken to address environmental
sustainability. The area undergazatted forest cover is about 236,344.6ha,representing only 6.7
per cent of the county’s land mass. Theprovisional forests cover is about 22,016ha. The
gazetted and ungazzeted forests translates into 9.2 per cent of the total county area.
2.2.7 Mainstreaming Sendai Framework for Disaster Risk Reduction 2015 – 2030 in
Development Planning
The occurrence of any disaster either natural or otherwise leads to serious destabilization of the
political, social and economic order of a region. The overall policy guidance is contained in the
National commitment under the Sendai Framework for DRR for the period 2015-2030. This
policy initiative aims at renewing commitment to address DRR, building resilience to disasters
with a sense of urgency within the context of sustainable development; and integration of DRR
policies into plans, programmes and budget.
Therefore, mainstreaming of DRR in development planning helps in reducing the impacts of
such occurrences if and when they do happen. This will be achieved through mainstreaming
DRR in policy initiatives; institutionalization of DRR; budgetary provision for emergency
support; advocacy and community outreach; and mapping out the role of the community.
The institutional framework for DRR will be spearheaded by the Office of the Governor under
special program. The department of Roads & Public works will be key in forestalling the
impassable roads while the County Department of Health services will lead in provision of
emergency medical support.
On funding the County Government will embark on establishing the County Emergency Fund
under public finance management guidelines in order to facilitate emergency support activities.
The County shall continue to carry out advocacy on possible early warning systems;
sensitization of the community on disaster prone areas; identification of disaster prone areas
formulating policies aimed at reducing new risk e.g. the Climate Change Action programme
and strengthening the resilience of communities through the provision of necessary
infrastructure.
Further the County Government will continue to empower its citizenry for them to be aware of
their responsibilities before, during and after the occurrence of any disaster.

35
2.2.7.1 Major disaster risk categories and likely locations;
S/No. Risk Category Probable Areas Severity
1. Drought Countywide High
2. Floods Tana Delta, Tana North
and Tana river Sub county
High

36
CHAPTER THREE
REVIEW OF IMPLEMENTATION OF PREVIOUS CIDP
3.1 Introduction This chapter provides a brief overview on status of implementation of the previous CIDP (2013
- 2017). The chapter presents analysis the county revenue streams, resources allocation versus
utilization by sectors, summary achievements in the last five years, challenges faced during the
implementation of the previous CIDP and lessons learnt.
3.2 Status of Implementation of the Previous CIDP 3.2.1 Analysis of the county Revenue Streams
Tana River County Government in the plan period 2013 - 2017 had an estimated budget of
about Ksh. 25 billion. To meet this budget, the county relied on local revenue, transfer from
national government, and development partners. The identified local revenue sources included
fees and fines, revenue from fishing, mango processing, livestock products, milk processing,
tourism, carbon financing scheme, cess, land and plot rent, advertising levy and parking fees
in towns. Apparently, the county government did not implemented most of the revenue
generating projects envisaged in the CIDP but heavily relied on central government
disbursement which had proved inadequate over time. The performance of each revenue source
over the plan period is discussed below.
Local Revenue
The Tana River County expected to raise over Ksh. 300 million local revenue during the plan
period 2013 to 2017. However, the county managed to raise Ksh. 66.8 million. Figure 3-1
compares targeted revenue with actual revenue collected from local sources. Data for the fiscal
year 2013/2014 was not available.
Except for revenue from charcoal which almost doubled compared to its targets, all other
sources of revenue grossly underperformed. For instance, slaughtering fees for the fiscal year
2015/2016 had been projected at Ksh. 2,600,000 and for 2016/2017 at Ksh. 2,860,000. Of this,
only Ksh. 53,600 and Ksh. 24,700, respectively, was reported to have been collected. Over
Ksh. 60,000,000 had been projected to accrue from the provision of health services but the total
collection was less than Ksh. 5,000,000. Revenue from plot rent, plot registration, plot transfer,
land application, leasing and area rates, had been projected to exceed Ksh. 100,000,000 but
only about Ksh. 10,000,000 was collected. Revenue from single business permits had been
projected at about Ksh. 22,000,000, however, only Ksh. 10,000,000 was collected. Other
notable sources of revenue during the period include Gypsum, crocodile eggs, cess (sand, fruits,
maize and other agricultural produce), export levies and auction of used vehicles.
Other Revenue Sources
In addition to local revenue, the county also projected on receiving revenue from equitable and
conditional grants from the national government. The conditional grants comprised leasing of
medical equipment, maternal healthcare, road maintenance levy fund, User Fees Foregone,
World Bank grant to support health facilities, and conditional grant from DANIDA. In the
fiscal year 2014/2015, the county had total projected revenue from above sources of Ksh.
4,114,500,000 but received Ksh. 4,696,465,786; for the 2015/2016 fiscal year, the county
projected to receive Ksh. 4,482,725,601 in revenue but received Ksh. 3,267,380,000; while for
the 2016/2017 fiscal year, the county had a forecasted to get Ksh. 4,966,766,552 but got Ksh.
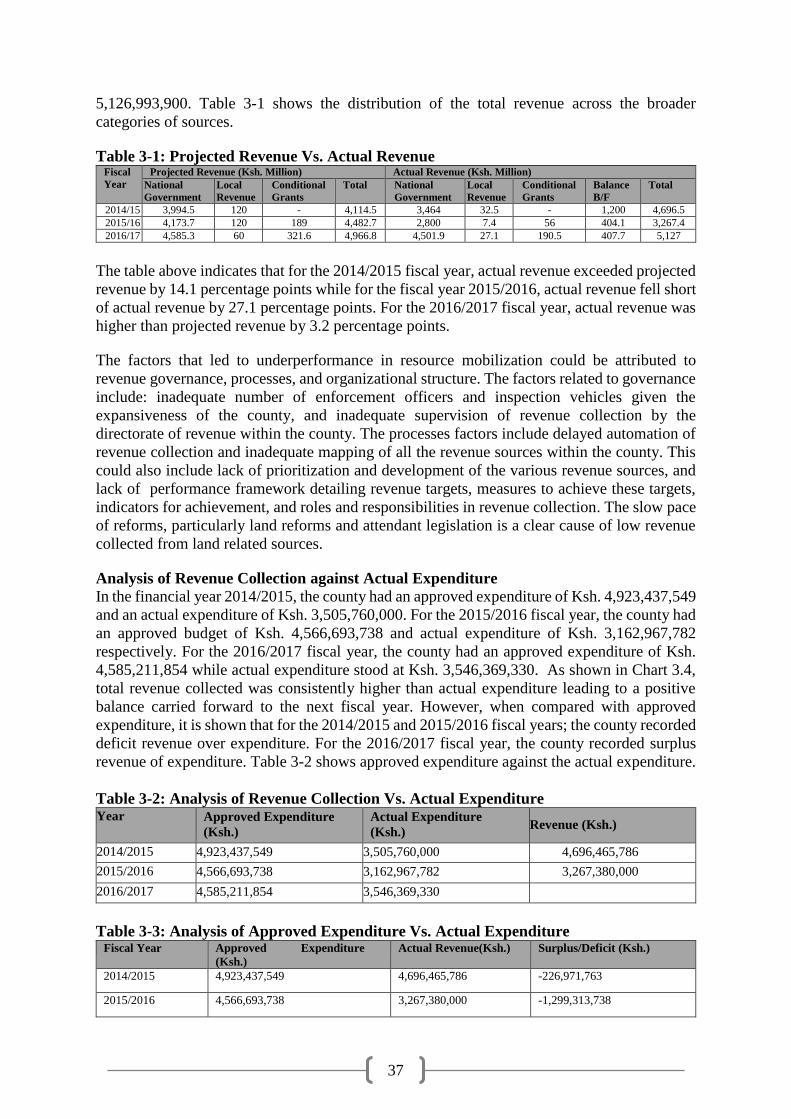
37
5,126,993,900. Table 3-1 shows the distribution of the total revenue across the broader
categories of sources.
Table 3-1: Projected Revenue Vs. Actual Revenue Fiscal
Year
Projected Revenue (Ksh. Million) Actual Revenue (Ksh. Million)
National
Government
Local
Revenue
Conditional
Grants
Total National
Government
Local
Revenue
Conditional
Grants
Balance
B/F
Total
2014/15 3,994.5 120 - 4,114.5 3,464 32.5 - 1,200 4,696.5
2015/16 4,173.7 120 189 4,482.7 2,800 7.4 56 404.1 3,267.4
2016/17 4,585.3 60 321.6 4,966.8 4,501.9 27.1 190.5 407.7 5,127
The table above indicates that for the 2014/2015 fiscal year, actual revenue exceeded projected
revenue by 14.1 percentage points while for the fiscal year 2015/2016, actual revenue fell short
of actual revenue by 27.1 percentage points. For the 2016/2017 fiscal year, actual revenue was
higher than projected revenue by 3.2 percentage points.
The factors that led to underperformance in resource mobilization could be attributed to
revenue governance, processes, and organizational structure. The factors related to governance
include: inadequate number of enforcement officers and inspection vehicles given the
expansiveness of the county, and inadequate supervision of revenue collection by the
directorate of revenue within the county. The processes factors include delayed automation of
revenue collection and inadequate mapping of all the revenue sources within the county. This
could also include lack of prioritization and development of the various revenue sources, and
lack of performance framework detailing revenue targets, measures to achieve these targets,
indicators for achievement, and roles and responsibilities in revenue collection. The slow pace
of reforms, particularly land reforms and attendant legislation is a clear cause of low revenue
collected from land related sources.
Analysis of Revenue Collection against Actual Expenditure
In the financial year 2014/2015, the county had an approved expenditure of Ksh. 4,923,437,549
and an actual expenditure of Ksh. 3,505,760,000. For the 2015/2016 fiscal year, the county had
an approved budget of Ksh. 4,566,693,738 and actual expenditure of Ksh. 3,162,967,782
respectively. For the 2016/2017 fiscal year, the county had an approved expenditure of Ksh.
4,585,211,854 while actual expenditure stood at Ksh. 3,546,369,330. As shown in Chart 3.4,
total revenue collected was consistently higher than actual expenditure leading to a positive
balance carried forward to the next fiscal year. However, when compared with approved
expenditure, it is shown that for the 2014/2015 and 2015/2016 fiscal years; the county recorded
deficit revenue over expenditure. For the 2016/2017 fiscal year, the county recorded surplus
revenue of expenditure. Table 3-2 shows approved expenditure against the actual expenditure.
Table 3-2: Analysis of Revenue Collection Vs. Actual Expenditure Year Approved Expenditure
(Ksh.)
Actual Expenditure
(Ksh.) Revenue (Ksh.)
2014/2015 4,923,437,549 3,505,760,000 4,696,465,786
2015/2016 4,566,693,738 3,162,967,782 3,267,380,000
2016/2017 4,585,211,854 3,546,369,330
Table 3-3: Analysis of Approved Expenditure Vs. Actual Expenditure Fiscal Year Approved Expenditure
(Ksh.)
Actual Revenue(Ksh.) Surplus/Deficit (Ksh.)
2014/2015 4,923,437,549 4,696,465,786 -226,971,763
2015/2016 4,566,693,738 3,267,380,000 -1,299,313,738

38
2016/2017 4,585,211,854 5,126,993,906 541,782,052
Table 3-4: Average Departmental Absorption of Development Budget Department % Absorption of Development
Budget
Average
Absorption
2014/2015 2015/2016 2016/2017
County Assembly 32.3 27.6 88.1 49.3
Office of the Governor 44.3 83.5 98.8 75.5
Finance and Economic Planning 99.4 18.1 89.2 68.9
Education, Vocational Training and
Sports
42.8 38.3 91.2 57.4
Health, Water and Sanitation 28.5 57.2 98.5 61.4
Agriculture, Lands, Livestock and
Fisheries
99.3 15.5 36.2 50.3
Environment & Natural Resources 96.5 7.5 84.2 62.7
Cohesion & Special Programme 99 81.6 80.4 87.0
Gender ,Culture &Social Services 99.1 40.4 40 59.8
Trade, Tourism, Cooperative
Development and Industry
95.5 85.2 36.8 72.5
Roads and Public Works 69.9 109 97.5 92.1
The analysis of average absorption rate under the development budget by sectors shows that
Roads and Public works recorded the highest absorption of the development budget with an
average absorption rate of 92.1% over the three fiscal years. This was followed by the Cohesion
and Special Programmes which recorded an average of 87%. The Office of the Governor came
in third with a recorded average absorption rate of 75.5% while Trade, Tourism, Cooperative
Development and Industry recorded an average absorption of 72.5%. The lowest average
absorption of the development budget was recorded by the County Assembly at 49.3%
followed by Agriculture, Lands, Livestock and Fisheries at 50.3%. Education, Vocational
Training and Sports recorded 57.4% average absorption while that of Gender, Culture and
Social Services averaged 59.8%. On average, no department achieved 100% absorption of the
development budget. Table 3.7 shows these data.
3.2.2 Summary of Key Achievements
Tana River County has made key milestones in service delivery to its residents. The key
achievements realized during the implementation of the CIDP (2013 - 2017) under each sector
include:
1. Roads and Transport: There is a remarkable improvement in the road network with at
least 20 kilometres of tarmac roads within Hola town. Several access roads were
constructed across the county thereby opening up remote areas. Constructed Kurawa
Bridge connecting Kurawa to Kasangani Island has connected six villages along the Indian
Ocean to the main road thereby enhancing and improving transport.
2. Water and Environment: Dams and water pans have been dug in places where perennial
water shortage was always experienced. Even though these dams dry up at times of
drought, they provide a quick fix to water shortage.
3. Education: Over 100 ECD centres were constructed across the county allowing early
childhood education in areas where long distances from learning centres deterred high
enrolment
4. Health: Health services have greatly improved in the county with 50 dispensaries
constructed within the last 5 years across the county. Further, staffing for these health
facilities has greatly improved with several of them being run with clinical officers

39
compared to the years before when nurses were the main service providers. The
construction of the Maternity wing at Odha Dispensary is a huge success story. The
Construction of staff house at Galili Dispensary in Galili Location of Garsen Central has
enabled the facility to offer 24 hour health services since staff are now housed at the facility.
It is noted however that the health sector continues to experience problems related to staff
turnover and poor equipment with only two of the 50 health facilities properly equipped.
5. Security: The street lighting project has helped improve security in various towns at night.
For instance, according to Gamba Police station OCS in Garsen, the flood lights and street
lighting projects and activity under the Urban Development Sector have enhanced their
security measures at the station at night.
6. Agriculture, livestock and Cooperatives: Veterinary services have improved due to
enhanced extension services with extension officers now being based in the sub-counties.
For instance, vaccination of livestock done at Kiembeni, Tawakal, Kor Label, Maziwa and
Manyatta Sub locations in Salama Location in Garsen North Ward have led to reduction of
disease prevalence hence leading to increased production of milk and meat. Purchase and
issuance of two tractors to Hewani and Wema Gatana Cooperative Societies of Wema
Location in Garsen North Ward has reduced the time used for farm preparation, increasing
ploughing per acreage and output per day leading to increased revenue collection for the
two cooperative societies.
7. Trade: A modern market has been put up in Garsen town and it is hoped that when this
market is opened, trade will be greatly boosted. Likewise, the construction of Bangale and
Bika livestock markets, and Bura household fresh market, is hailed as critical in promoting
trade and marketability of farmer produce.
8. Public administration and Intergovernmental Relations: The level of information and
awareness among individuals, communities and groups has improved due to installation of
a radio station through the effort of the county government. Delivery of government
services has improved as a result of construction of Huduma Centre in the county.
Table 3-5: A Summary of County Key Performance Indicators Sector/Indicators 2012 2015 2018
Human Development
Infant mortality rate 91.3/1000 91/1000 91/1000
Immunization for under 1 year olds 62.2% 56% 90%
Doctor/population ratio 1:60976 1:26115 1:26115
Primary school Gross Enrolment Rate 60.4 48790 49885
Secondary school Enrolment Rate 16.7 6058 6986
Pre-primary school Gross Enrolment Rate 56.3% 61% 65%
Primary school teacher /pupil ratio 1:48 1:109 1:109
Secondary school teacher/pupil ratio 1:18 1:88 1:101
County Literacy level 33.9% 34.5% 35.8%
Physical Infrastructure
Bitumen, Murram /graveled roads(Kms) 300 150 300
Households with electricity connection 761 1511 2011
Households using solar power 0.9%
Households using firewood/charcoal 87.5%
Households using kerosene/gas(cooking) 0.4%

40
Research, Innovation and Technology
Mobile coverage 45% 50% 75%
Internet connections - 7% 25%
Agriculture and Rural Development
Gazetted forests 1 4 7
Agricultural and livestock cooperatives 15 18 22
SACCOs 6 10 15
Wage employment 3.2% 4.2% 6%
Absolute poverty 76.9% 74% 70%
Environment, Water and Sanitation
Access to potable water 30% 60% 70%
Total % of area explored for irrigation 10% 15% 20%
Trade, Tourism and Industry
Average number of International tourists to
Tana
National Primate Reserve
Special Programmes
HIV/AIDS incidence (annual infection) 40 40 40
Population relying on relief food 56.3% 56.3% 56.3%
3.2.3 Challenges in the Implementation of the Plan
i. Weak M&E system in the county to enable coordination, tracking and reporting of
results;
ii. Low capacity in programmes and projects implementation in most of the county
departments;
iii. Weak linkage between the national and county governments' institutions;
iv. Low participation levels by all stakeholders in projects implementation;
v. Weak linkages between planning and budgeting processes;
vi. Dependency on rain-fed agriculture has posed a great challenge to agriculture hence
affecting food security in the county;
vii. Dams and water pans dug by the county government dry up during drought seasons;
and
viii. Lack of disaster management system.
3.2.4 Lessons Learnt and Recommendations
i. There is a general sense of lack of ownership of county development plans at the
county and community levels hence affecting projects sustainability. To solve
this, the county governments should conduct sensitization to the stakeholders both
at county and community level to enable them participate in projects
identification, formulation, implementation and monitoring, and develop and
implement a robust operations and maintenance plan (benefits review plan) that
will be used as a basis of engaging stakeholders during implementation and post
project.
ii. Implementation of the CIDP requires integration of the county and national
government functions and thus there should be a good working relationship
between the two levels. A good working relationship should be created to harness
the synergies created during projects and programmes implementation.
iii. There is need to strengthen monitoring and evaluation system. This should be
actualized by ensuring that there is a functional monitoring and evaluation to

41
support delivery of the CIDP, designating M&E ,officers in each department,
establishing and operationalizing M&E committees
iv. There is need to build capacity of all line departments to ensure that projects and
programmes are implemented as expected.

42
CHAPTER FOUR
COUNTY DEVELOPMENT PRIORITIES AND STRATEGIES
4.1 Introduction This chapter provides spatial development framework, it also analyses the key development
challenges and cross-cutting issues that affect the development of the County. This chapter also
includes the key county development priorities, strategies and programmes and projects as
identified by stakeholders in the county.
4.2 Spatial Development Framework This section establishes the county spatial development framework for the primary purposes of
achieving county competitiveness. The framework sets out the general direction of spatial
development of the county and indicates the distribution and organization of population and
activities in the county. The framework ensures that land and natural resources of the county
are optimally used. Further, the plan promotes equitable and planned development and
mechanisms for conservation of the environment.
Table 4-1: County Spatial Development Strategies by Thematic Areas Thematic Areas Overview/ Current
Status
Policy Strategy Potential
Geographical
Areas
Lead Agencies /
Departments
Industrialization County has one
undeveloped agro-
processing industry
Lower land rates and taxes payable
by industrial investors.
Ease the licensing process.
Develop transportation infrastructure
to facilitate movement of
commodities;
Diversify energy production sources
to reduce costs of production and
enhance its reliability.
Adapt appropriate technology and
promote the formation of
cooperatives and SACCOs to
advance marketing in small urban
centres; and establish industrial zones
with supporting infrastructure (water,
transport & energy).
Garsen, Hola and
Bura towns
Physical Planning,
Agriculture, public
works, Trade,
Energy and water
Modern
Agriculture
Food production still
low and county relies
on imported foods
County government to create an
enabling environment for urban
agricultural development.
Increase dissemination of agricultural
information.
Promote output and productivity of
crops, livestock and fisheries.
Invest in value addition and value
chain development
of crop, livestock and fisheries for
local, regional and international
markets and promote animal health
and welfare. Establish bigger
irrigation projects and rehabilitate old
ones
The Delta and the
vast plains west of
River Tana
Agriculture. Water,
Lands, Investors
Diversified
Tourism
Despite the county
having lots of
potential in Tourism,
little has been done to
exploit this resource
Develop and implement aggressive
marketing of Tana River County as a
major tourist destination.
Encourage and market domestic
tourism; rehabilitate tourism
infrastructure; diversify and develop
tourism products; develop high value
Entire County Tourism, ICT

43
Thematic Areas Overview/ Current
Status
Policy Strategy Potential
Geographical
Areas
Lead Agencies /
Departments
cultural centres and festivals; develop
niche products such as; conference
tourism, eco-tourism, cultural
tourism, sports tourism, wildlife
watching and heritage and historic
sites; collaborate with the ministry of
information and tourism and the
Kenya wildlife service to embark in a
major promotion campaign and
improve information systems
Human
Settlement
Informal settlements
have sprouted up in
urban areas due to
high population,
inadequate physical
planning, and cost of
housing.
Ensure that land subject to informal
settlement is developed in an orderly
and sustainable manner.
Collaboration between the national
and county governments in provision
of housing for low income people.
Kipini, Garsen,
Minjila,Hola,Bura,
Madogo and
Bangali towns
Lands, Roads and
public works, public
health, urban
Development and
Housing
Enhancing
County
Competitiveness
The County to improve public safety
by collaborating with national
government in enhancing police
activities, police posts and
community policing. Increase
security lighting in urban centres.
Improve service delivery and provide
improved public facilities, amenities
and superior infrastructure.
Generate employment through trade,
tourism, agriculture and sports and
arts sectors. Strengthen
anticorruption measures and reduce
the cost of doing business.
Entire County Trade, public works
Conserving
Natural
Environment
The County has not
yet fully addressed
challenges facing
conservation of
natural environment
(inadequate solid
waste
Management, human
wildlife conflict,
population pressure;
and poaching)
Integrate environmental issues in
development planning.
Develop and implement solid waste
management plan. Increase tree cover
in the County, through plant nursery
management, planting and
controlling cutting of trees. Develop
and enforce environmental standards
and regulation; create environmental
awareness through public education
and sensitization. Improve garbage
collection, back filling of abandon
quarries, and prevention of flooding
and expansion of storm water
drainage system.
Entire county Environment
Transportation
network
Most roads traversing
through the county
are corrugated.
Increase financial resources for road
construction and maintenance.
Construction of new roads where
necessary. Fast track road
construction works and improve
drainage along the roads
Entire County Public works
Providing
appropriate
infrastructure
Most of the
infrastructure face the
issue of geographical
inequality
Lay down infrastructure (health,
education, roads, ICT, water and
sanitation, tourism, energy and
environment) in areas where they are
lacking to address the issue of
geographical inequality.
Entire County Public works,
health, education,
ICT, water and
sanitation, tourism,
energy and
environment.

44
4.3 Natural Resource Assessment
Table 4-2: Natural Resource Assessment Name of
Natural
Resource
Dependent
Sectors
Status, Level of
Utilization &
Scenarios for
Future
Opportunities
for Optimal
Utilization
Constraints to
Optimal Utilization
Sustainable Management
Strategies
River Tana Agriculture
and Rural
Development
Water &
Sanitation
Fisheries
Tourism
Irrigation
Agriculture
Reduced flooding
incidences;
Water abstraction by
pumping is expensive
Declining water
levels – expected to
further decline with
the continued drought
Water quality
expected to decline
due to increased
farming activities
Turbidity to increase
due to flood and
release of excess
water from the
hydro-dams
Damming of the
river and using
gravity for
irrigation
Best practices in
waste water
management and
related and
wetland
conservation in
some farms
Damming possible in
the higher altitudes
where the land is
steep. These sites are
300 km away from
the targeted plains
downstream
Decline of water
levels. Declining
water levels
High turbidity
High levels of
organic matter
Salt water intrusion
Small barrages along the
river to irrigate suitable
scheme areas by gravity.
Monitoring of water levels
and quality
Extension services to
cover waste water
treatment management
Nutrients enrichment
Legal and policy
enforcement
River rehabilitation
programme
Solar Energy Agriculture
and Rural
Development
Security
Water
Environment
Low use of green
energy
Solar powered
pumps for
irrigation,
Establishment of
a green park for
demonstration on
solar utilization
Expensive solar
equipment
Medium sized solar
projects to irrigate 50
hectares of land
Sea Fisheries Overexploited within
5nautical miles and
underutilized in the
territorial waters
(EEZ)
Development of
deep sea fishing
through provision
of modern gears
Lack of modern
fishing skills and
equipment
Sustainable utilization of
fisheries resources
focusing on Maximum
Sustainable Yield;
Carrying out of routine of
fish stock assessment
Range
resources
Livestock Degraded, 60%
utilized and trend
looks downwards due
to impacts of climate
change
Reseeding of
rangelands
Influx of animals
from outside and
uncontrolled grazing
Grazing blocks for
controlled grazing
Land
Agriculture Vast land suitable for
irrigation and
mechanization
Availability of
Agricultural
Mechanization
Station and
irrigation water
Lack of irrigation
infrastructure and
machinery
Encourage individual
ownership versus
community owned land
Urban
Development
Urban areas are not
planned, developed
haphazardly, need for
proper planning
Integrated
planning for
urban and peri-
urban
development
Lack of spatial plan
Lands Most of the land has
not been demarcated
Land demarcation
and issuance of
title deeds
Culture of communal
land ownership
Lack of sensitization
on issues of land
Continuous sensitization
on Land tenure system and
land laws
Environment,
Trade, NEMA
Water Tourism
KFS
Agriculture
Shoreline
degradation Kipini
Land degradation
along the riverine
Double allocation;
Resource use
conflicts
Plots
demarcations for
agricultural and
settlement
Revenue
provision
Provision of
livelihood
Resource use
conflicts; Land
degradation along the
Shoreline and
riparian riverine
areas; Overstocking
of livestock
Initiate conflicts
management mechanism;
Initiate land reclamation
programs;
Promote extension
services to create
awareness on the
important of protection of

45
Name of
Natural
Resource
Dependent
Sectors
Status, Level of
Utilization &
Scenarios for
Future
Opportunities
for Optimal
Utilization
Constraints to
Optimal Utilization
Sustainable Management
Strategies
through sale of
plots
the shorelines and
riparian areas;
Establish best practices on
livestock
Ox-bow
Lakes
Environmental
Protection,
Water and
Sanitation
Declining water
levels – expected to
further decline with
expansion of
horticulture sector
Water quality
expected to decline
due to increased
farming activities
Water for
agriculture.
Domestic use,
creation of
tourism and fish
production create
employment
Water levels declined
Water quality
deteriorated from
horticulture
(affecting quality of
fish, and quality of
tourism)
Monitoring of water levels
and quality
Regulate waste water and
effluents from farms and
towns
Extension services to
cover waste water
treatment management
Nutrient enrichment
Forest Water,
Wildlife,
Tourism,
Agriculture
and
Environment
NEMA
The forest cover is
decreasing due to
encroachment for
agricultural activities
Water catchment are
being depleted as
result of human
activities (charcoal
burning, logging)
Retention of the
water catchment
which improve
water flow and
level; Creation of
employment from
nature-based
enterprises;
Encourage agro
forest reduce the
demand from the
natural forest.
Loss of water bodies;
Reduction of forest
cover and wildlife
habitat;
Increase the adverse
effects of climate
change;
Increase human
wildlife conflicts
Increase extension
services; Increase patrols;
Involve the community in
forest management CFAs
{participatory forest
management)
Mining and
sand
harvesting
Environment,
Trade, NEMA
Water Tourism
KFS
Agriculture
Increase the number
of land fill
Loss of forest cover
and animal habitat
Land degradation
Creation of
employment;
Provision of
revenue
Degradation of river
banks and shoreline
Loss of forest cover
and wildlife habitat;
Accident of human
being/livestock/wildli
fe in the mining
holes; Increase the
adverse effects of
climate change
Increase patrols;
Advise the investor on
best practices and ensure
compliance (mining,
EMCA acts)
Involve the community
participation in decision
making processes
Wildlife
Environment,
NEMA,
Tourism,
Agriculture
Loss of endangered
species (Tana
crescent mangabey,
red Columbus,
Elephant, and Hilola
Provision of
revenue;
Researchers come
study
Depletion of
endangered species
Increase human
wildlife conflicts
Loss of indigenous
plant which also food
for primate
Awareness creation of the
important wildlife
protection;
Increase human wildlife
conflicts patrols
Establishment of
management plan for
wildlife area
4.4 Development Priorities and Strategies
4.4.1 Agriculture Rural and Urban Development
The sector is composed of the following sub-sectors: Agriculture; Livestock Development;
Urban Development and Housing; Veterinary; Fisheries Development; Co-operative; Housing
and Urbanisation; and Lands.
Vision: A leading sector in innovative commercially-oriented Agriculture, sustainable Rural
and urban Development.
Mission: To improve livelihoods of Tanararians through promotion of sustainable, competitive
agriculture, livestock and fisheries development, growth of a viable cooperative sub sector,

46
equitable distribution and management of land resources, provision of quality and adequate
human settlements and ibrant urban development.
Goal
Rapid development in the county will require that the county attains food security and
sufficiency. For this to happen, there is need to improve crop production through crop, pests
and disease control and management, increase livestock production, fisheries development, co-
operative development, land management, development of improved livestock marketing and
infrastructure as well as agricultural products marketing. This can be achieved through
promotion of private investment in value addition of agricultural and livestock products. There
will also be livestock disease control and improvement of breeds.
The county will develop strategies which focus on development and coordination of
programmes and projects in agriculture and livestock development, continuous monitoring and
management of food security, provision and facilitation of extension services in the county and
promotion of modern methods of crop farming and livestock production.
There will be focus on proper management and conservation of natural resources base,
enhancement of land administration and management process. Projects that aim at protection
of water catchments, disaster management and early warning systems will also be supported.
The county aims at provision of adequate and quality urban development services, decent
housing for sustainable human settlements.
Sector Development Needs, Priorities and Strategies Developmental issues Cause Development
Objective
Immediate Objective Strategies
Agriculture
Food insecurity Low acreage under
irrigation; Low
productivity
Improve food
security
Increase area under
irrigation to ensure
availability and supply
of appropriate seeds
Rehabilitation (desilting,
canal repairs, water pump
servicing or purchase ) of
minor irrigation schemes;
Establish new minor
irrigation scheme;
purchase of irrigation
machinery and
equipment;
Purchase solar powered
irrigation system;
Purchase farm machinery
e.g. tractors;
Purchase of high yielding
seed varieties
High cost of farm inputs Improve food
security
Enhance subsidy on
farm inputs
Provision of subsidized
farm inputs; Provision of
farm inputs to vulnerable
groups
Post-harvest losses and
limited value addition
Improve food
security
Reduce post-harvest
losses; Increase value
addition;
Increase market access
Training farmers on
value addition, proper
post-harvest handling
(packaging & storage,
proper drying of grain,
Aflatoxin control;
exchange visits )
Construct county
managed storage facility;
Establish village grain
bank; Construction of

47
Developmental issues Cause Development
Objective
Immediate Objective Strategies
regional fruit processing
plant; Convene market
linkage forums
(mangoes, melons,
bananas);
Market information
collection and
dissemination (through
local radio, barazas)
Inadequate extension
staff and limited capacity
Improve food
security
Improve extension
services
Organization capacity
assessment;
Training of staff &
farmers;
Increase number of staff;
Purchase motorcycles
and accessories
High incidence of pests
and diseases
Improve food
security
Reduce incidences of
pests and diseases
Timely procurement and
proper and application of
pesticides
Constant monitoring and
surveillance of notifiable
pests e.g. install traps
Establish disease free
zone especially on
mangoes
Train farmers on safe use
of pesticides
Malnutrition (high
levels of malnutrition
in children under 5)
Low literacy levels
limited knowledge
regarding proper diet
Cultural beliefs and
practices; Limited access
to nutritious food;
Limited finances at
household level;
Households sizes
Reduce levels of
malnutrition
Improve awareness on
benefits of nutrition &
household sizes;
Increase Production of
high nutrient foods;
Diversify income
generating activities
Conduct a nutrition
survey; Community
sensitization forums;
Recruit skilled staff;
Develop a harmonized
inter-county approach to
address staff;
Recruitment, training and
retention challenges;
Establishment of kitchen
gardens; Training
farmers on nutrition;
Plant traditional high
value drought tolerant
crops
Unsustainable
agricultural practices
Poor soil tillage practices
Limited involvement of
youth and women
Inadequate financing
system
Improper use of
chemical fertilizers
Persistent and severe
drought
Promote sustainable
agriculture
Enhance proper land
management practices
To make agriculture
attractive to the youth
Establish a functional
financing system
To reduce drought
risks
Avail grants and
incentive
Establish a revolving
fund; Establish gene
bank;
Enhance crop and
livestock insurance;
Agro-forestry Adopt IPM
such as through use of
pheromone traps to detect
invasive insects
Land degradation As above Improve soil
productivity
Increase fertilizer usage
in poor soils;
Prevent run off through
water harvesting;
Introduce soil water
retention methods
Planting of tree seedlings
along erosion prone areas
Use of dry land crop
production technologies
Livestock

48
Developmental issues Cause Development
Objective
Immediate Objective Strategies
Low adoption in the
use of livestock
production
technologies
Inadequate technical
advice in animal
production, range
management, apiculture
and marketing
To ensure efficiency
and effectiveness in
livestock production
in order to improve
productivity
To provide technical
advice on animal
production, livestock
marketing, range
management,
apiculture and
ranching
Farm visits
Trainings
Field days &
demonstrations
Trade fairs and shows
Low production and
productivity in
livestock enterprises
Poor breeding practices To increase
livestock
productivity and
production to
contribute to food
and nutrition
security while
ensuring realization
of sustainable
development goals
To promote
improvement of breeds
well adapted to
pastoral production
systems
Establishment of bull
camps; Introduction of
Boran bulls;
Establishment of goat
multiplication centres
Supply of German alpine
dairy goats;
Establishment of
cockerel exchange units
Distribution of improved
cockerels
Establishment of
community managed
model apiaries
Training of carpenters on
hive manufacture
Reduced incomes of
livestock producers
Poor market
infrastructure and poorly
maintained access roads
To increase access to
livestock markets
To increase efficiency
in livestock trade
To improve welfare of
livestock traders
To increase trade
volumes
To increase incomes
from livestock exports
Construction of auction
yards; Construction of
market shades;
Upgrading of access
roads
Construction of LMD
offices; Revival of LMD
holding grounds
Loss of livestock due
to prolonged and
frequent droughts
Lack of drought
preparedness initiatives
and response strategies
To enhance
community drought
resilience and
adaptation to climate
change
To enhance drought
preparedness
To reduce livestock
losses
Provision of drought
resistant livestock species
to most vulnerable
households
Provision for drought
contingency fund
Insurance of livestock
against drought
Fodder production and
conservation
Rehabilitation of grazing
blocks and ranches
Capacity building of
community on CMDRR
Veterinary
Poor animal breeds Inbreeding
To improve on
quality animal
resource
To introduce superior
and tolerant breeds
Artificial insemination
Introduction of superior
bulls
Wastage of livestock
by products
Low involvement of
women, youth and
people living with
disability
To improve food
security
To create employment
for youth, women and
people living with
disability
Cottage industries e.g.
tanneries
Disease outbreaks Presence of vectors and
pathogens(disease
causing organisms)
To reduce disease
incidences
To control the vectors
and pathogens
Dipping/spraying
facilities
Tsetse traps
Treatment
Vaccinations
Early warning and
preparedness
Weather
extremes(floods)
To reduce losses of
animals due to
disasters
To increase
awareness levels
to the public
Strategic vaccination and
sensitization of public on
disease reporting

49
Developmental issues Cause Development
Objective
Immediate Objective Strategies
Animal migration To reduce spread of
diseases
To control livestock
movement
Livestock routes
Enforce livestock
movement rules
Poor handling of
livestock and livestock
products
Poorly constructed
slaughter premises
To ensure
availability of
hygiene compliant
slaughter premises
To ensure wholesome
meat is available for
public consumption
Construction of modern
slaughter premises
Community sensitization
meat hygiene
Illegal slaughter To ensure
slaughtering is done
in designated
premises
To Sensitization of the
public meat hygiene and
zoonoses
Cruelty to animals To reduce animal
cruelty incidences
To enforce animal
welfare legislation
Sensitisation of public on
animal welfare
Fisheries
Low production of
fish
Lack of quality
fingerlings, fish feeds
To increase fish
production
To provide fingerlings
and fish feeds to fish
farmers
Rehabilitation of fish
ponds; Purchasing of
fingerlings; Installation
of a fish feed production
unit;
Restocking of
rehabilitated fish ponds;
Sensitizing fishers and
fish farmers;
Construction of new fish
ponds;
Establishment of fish
hatcheries
Lack of modern
fishing gears
Low income To modernize
fishing industry
Sensitization of fishers
Provision of fishing
gears
Purchasing of modern
fishing boats and gears
Sensitizing and training
of fishers on new
technologies
Enhancement in adoption
of new technologies
Inadequate skills in
value addition and fish
markets
Poor markets
Low levels of skill
adoption
To enhance value
addition skills and
open new markets
To sensitize and
capacity build fishers
on value addition
Capacity build fishers
on internal governance
and organization
Capacity build fishers on
value addition skills;
Establish market linkages
like contracts;
Establishment of fish co-
operative; provision of
cold storage
Post-harvest care
Encroachment of
fisheries plots
Encroachment of beach
plots and office land
To safeguard beach
plots and office land
To sensitize fishers
and capacity build
fishers on land
management
Land demarcation and
adjudication
Surveying and
development of PDP
Inadequate extension
services and capacity
building
Low facilitation from
the county government
Low mobility
To improve fisheries
extension services
Sensitize fishers and
fisheries staff
Capacity build fish
farmers and fishers
Increase number of
staff per fisher/farmer
Purchase of motor cycles
and vehicles
Provision of fuel for the
vehicles
Hiring more extension
officers
Capacity building and
training of farmers
Field days/on farm trials
Limited access to
financial services
Low skills in financial
literacy
Poor record keeping
Low linkage forum with
financial services
Few institutions offering
credit services
Improved access to
financial services
To capacity build of
fishers and fish
farmers on financial
management
Capacity building of
fishers
On financial management
Linkage of fishers to
financial institutions

50
Developmental issues Cause Development
Objective
Immediate Objective Strategies
Limited access to
insurance services
Lack of linkage
Most fishers lack
knowledge on insurance
To spread risks
along the fish value
chain
Sensitize fishers on
fish insurance
Capacity building of
fishers on insurance
uptake
Insurance linkage to
fishers
Insecurity at the
landing sites
Low enforcement
Use drugs
Safeguarding of
landing beaches
To capacity build
fishers on importance
of maintaining security
Conducting monitoring,
control and assurance
Patrols
Low involvement of
women and youth in
Fisheries
Low empowerment of
youth and women groups
To empower
women and youth
groups in fishing
industry
To sensitize women
and youth on
involvement in fishing
industry
Capacity building and
provision of grants to
youth and women groups
Lands
Uncontrolled
developments
Lack of proper
development plans
Guided
developments
Preparation and
implementation of
development plans
Planning and survey of
all urban areas and
settlement schemes
Unawareness on land
laws
Lack of sensitization of
land laws
Awareness of land
laws
Land laws
sensitization forums
sensitization of land laws
in a ward (desegregated
by gender, age, PLWD)
Lack of up to date
lands data
Lack of modern lands
technology
up to date lands data Establishment of GIS
lab
Installation of GIS and
staff training on the
software
Inadequate security of
land tenure
Lack of registration of
community lands
To settle landless
and increase land
tenure
registration of
community lands
Identification and
registration of
community lands
Inadequate lands
office space
No established lands
office block
To accommodate
lands departments in
one block
A complete office
block
construction of lands
office block
Co-operative Development
Low Cooperative
awareness
Inadequate extension
staff hence pre-
cooperative education
Training of the
general public on
cooperative
awareness
Develop training
programmes on
cooperative awareness
Training to be conducted
in the 3 subcounties
Poor management and
low capitalisation
Low income levels and
subsistence production
Training of
management
committees,
members and staff
on prudent
management and
modern means of
production
Organise trainings Trainings on mgt skills
and value additions
Poor record keeping Lack of trained
bookkeepers
Training of staff on
proper bookkeeping
and records
Organise trainings on
book keeping, on-job
trainings
Conduct seminars of all
movement staff on proper
record keeping
Weak cooperatives not
able to contribute
towards the events
Low income generating
activities
Sensitize of
importance of the
events and also
capacity build the
cooperative leaders
on events
preparation
Organise trainings for
cooperative leaders
Creation of County
Health Services Account
Housing and Urbanisation
Insecurity Dark streets To lighten the urban
centres
Lighten two major
streets in each urban
centre
Construct street
lights poles
Connect with
national grid /solar
energy
Poor hygiene in urban
centres
Uncollected garbage
(including e-waste)
To clean the urban
centres Collect garbage
Dispose liquid
waste
Sweeping the streets
Unblocking drainage
systems

51
Developmental issues Cause Development
Objective
Immediate Objective Strategies
Liquid waste not
disposed properly
Uncleaned drainage
Uncleared bushes
Clean drainage
Clear bushes
Clear bushes
Collecting and
recycling of e-waste
Transporting
garbage and liquid
waste to transfer
stations
Unplanned urban
centres Town management
committees not
established
Budgetary
constraints
Inadequate gender
representation
To have well planned
and managed urban
centres
Provide funds for
integrated urban
development
Establish gender
inclusive Town
Management
Committees
Gender responsive
budget for integrated
urban development
plans
Disaster risk
unpreparedness Poor response to fire
fighting
Storm water drains
uncleaned
Buildings
constructed without
approved plans
To ensure well
preparedness for
disaster risk
Provide funds for
combating disaster Construct fire station
Purchase fire
engines
Recruit and train
firefighting
personnel
Roads built with
drainages and
cleaned regularly
Ensure buildings
constructed are
approved
Inadequate housing Poor gender inclusive
planning for housing
needs
Budgetary constraints
To ensure proper
planning and funding
for houses
Provide funds for
construction and
rehabilitation of houses
Gender inclusive
planning
Rehabilitation of
houses
Construction of
houses

52
a. Sub-Sector Programmes - Agriculture Sub Programme Key Output Key performance Indicators Baseline (2017) Planned Targets Total Budget
(M) Year 1 Year 2 Year 3 Year 4 Year 5
Programme 1: Administrative and Support Services
Objective: To provide favorable environment for service delivery
Outcome: Improved service delivery
Transport Improved extension
services
No. Motor vehicle per sub county 1 1 1 1 0 0 30
No. motor cycle per field staff 1 10 5 5 5 2 13.5
No. of vehicle/cycles serviced and
repaired
6 12 24 36 48 6.3
Office
administration
Improved office
environment
No. of Bills settled 3 3 3 3 3 1.8
No of laptops and desktops purchased 4 12 12 12 12 12 6
Human resources
management
Improved work
productivity
No. of office staff trained 1 10 15 15 15 15 10.5
No. of office staff employed 27 5 6 6 3 3 4.14
No. of technical staff employed 35 0 45 - - - 75.6
Policy development Enabling political,
social and economic
environment
No. of policies formulated - 0 1 2 2 2 1.5
Monitoring and
evaluation
Improved service
delivery
No of M&Es conducted - 12 12 12 12 12 3
Programme 2: Food security, improved nutrition and sustainable agriculture
Objective: To increase food security and income
Outcome: Increased agricultural production and productivity Food security
(Irrigation
development)
Minor irrigation
schemes established
and rehabilitated
No. of minor irrigation schemes
rehabilitated and established
3 6 6 12 12 12 816
No of major irrigation schemes
established
- - 1 - 1 - 200
Green irrigation
technologies
established
No of groups using green irrigation
technologies (i.e. solar powered water
pumps)
- 30 40 50 60 70 12.5
Tractors purchased No of Tractors purchased - 6 6 6 6 6 225
No. of hectare ploughed 800 1,600 2,400 3,200 4,000 60
Food security
(Asset Creation)
Trainings, assets
created, income & food
supply increased
Quantity of non-food items distributed
by type e.g. equipment
- 10,000 10,000 10,000 10,000 10,000 25
Ha of land developed for pasture and
fodder
50 50 50 50 50 5
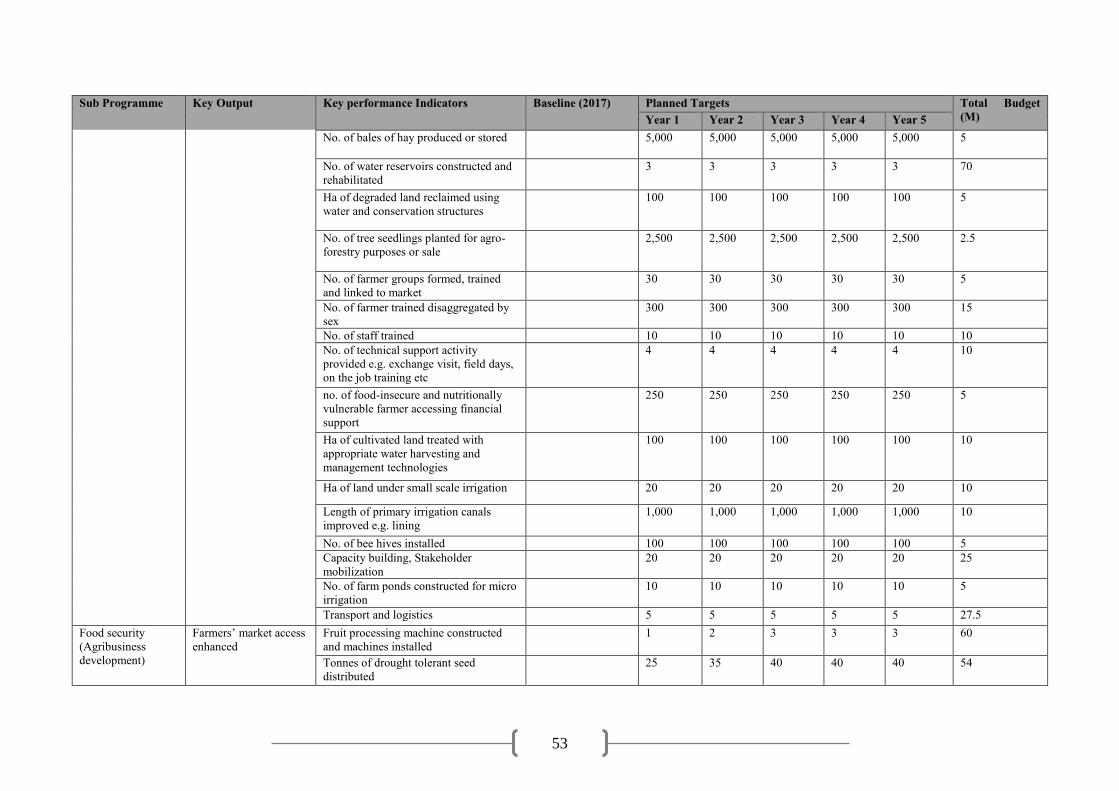
53
Sub Programme Key Output Key performance Indicators Baseline (2017) Planned Targets Total Budget
(M) Year 1 Year 2 Year 3 Year 4 Year 5
No. of bales of hay produced or stored 5,000 5,000 5,000 5,000 5,000 5
No. of water reservoirs constructed and
rehabilitated
3 3 3 3 3 70
Ha of degraded land reclaimed using
water and conservation structures
100 100 100 100 100 5
No. of tree seedlings planted for agro-
forestry purposes or sale
2,500 2,500 2,500 2,500 2,500 2.5
No. of farmer groups formed, trained
and linked to market
30 30 30 30 30 5
No. of farmer trained disaggregated by
sex
300 300 300 300 300 15
No. of staff trained 10 10 10 10 10 10
No. of technical support activity
provided e.g. exchange visit, field days,
on the job training etc
4 4 4 4 4 10
no. of food-insecure and nutritionally
vulnerable farmer accessing financial
support
250 250 250 250 250 5
Ha of cultivated land treated with
appropriate water harvesting and
management technologies
100 100 100 100 100 10
Ha of land under small scale irrigation 20 20 20 20 20 10
Length of primary irrigation canals
improved e.g. lining
1,000 1,000 1,000 1,000 1,000 10
No. of bee hives installed 100 100 100 100 100 5
Capacity building, Stakeholder
mobilization
20 20 20 20 20 25
No. of farm ponds constructed for micro
irrigation
10 10 10 10 10 5
Transport and logistics 5 5 5 5 5 27.5
Food security
(Agribusiness
development)
Farmers’ market access
enhanced
Fruit processing machine constructed
and machines installed
1 2 3 3 3 60
Tonnes of drought tolerant seed
distributed
25 35 40 40 40 54

54
Sub Programme Key Output Key performance Indicators Baseline (2017) Planned Targets Total Budget
(M) Year 1 Year 2 Year 3 Year 4 Year 5
No of Bags fertilizer distributed 1200 2400 3600 4800 6000 90
No of pheromone traps for maize and
mangoes
2500 7500 10000 10000 7500 100
No of grain stores constructed 4 8 12 15 20 50.15
No of plastic silos purchased 100 100 200 300 500 4.8
No of produce collection centres
constructed
3 6 12 12 12 54
No of farmer groups linked to market 8 16 32 50 100 103
No of farmers registered 7500 9000 10500 12000 13000 0.69
No. of farmer trained 600 600 600 600 600 5
No. of Stakeholder forum held 2 2 2 2 2 1,25
Revolving fund
established
No of farmer groups having access to
financial services
30 30 40 50 100 75
Extension and
capacity building
Agricultural
information
disseminated to farmers
No of farmers visited 7500 9000 9500 10000 11000 47
No of field days held 3 6 12 15 15 5.1
No of shows held/attended 1 1 2 2 2 11.5
No of agri-information resource centres
established
3 3 3 3 3 3.15
No. of motor cycles purchased 10 5 5 5 2 13.5
Administration 45 - - - - 94.5
No of staff trained 10 27 35 30 30 19.8
No of professional group meetings held 6 6 6 6 6 2
No of stakeholder forums held 3 6 6 6 6 13.5
No of demonstration plots put up 15 30 45 60 90 2.4
No of exchange visits held 1 1 1 1 1 4
No of solar audio visual equipment
acquired
0 3 15 - - 3.6
No. of staff employed
No. of kitchen gardens formed 30 30 30 30 30 0.25
Nutrition and food
safety
New staff employed Ha under traditional crops e.g. sweet
potato
10 10 10 10 10 0.5
Kitchen gardens
established
No of blue boxes for aflatoxin testing 1 3 5 6 2 1.7

55
Sub Programme Key Output Key performance Indicators Baseline (2017) Planned Targets Total Budget
(M) Year 1 Year 2 Year 3 Year 4 Year 5
Traditional high value
crops cultivated
No. of km protected 10 10 10 10 10 0.5
Food quality and safety
enhanced
No. of bulking sites established 15 15 15 15 15 2.5
Sustainable
agriculture
River bank protected No. of water harvesting structures
created e.g. pans, ditches, pits
15
Seed bulking sites
established
No. of groups assisted to access credit 50 50 50 50 50 125
Ha of degrade land
reclaimed
No. of trees planted 10,000 10,000 10,000 10,000 10,000 5
Revolving fund created No of School youth engaged in
agriculture by gender
12 24 36 42 60 52.2
Agro-forestry enhanced No of Women engaged in sustainable
agriculture by age
60 120 150 150 180 6.6
4-K clubs formed and
trained
No of School youth engaged in
agriculture by gender
12 24 36 42 60 52.2
Women farmers
capacity and skills
enhanced
No of Women engaged in sustainable
agriculture by age
60 120 150 150 180 6.6
Programme 3: Agricultural infrastructure Development
Objective: To have an infrastructure that will spur productivity
Outcome: Improved value addition of produce, market access and linkages
County grain store
and value addition
facility
Food security improved High capacity grain stores constructed - 1 - 1 - 200
Flour/Rice mill and livestock feed plant
in place
- - - 1 - 200
Hola agricultural
show
Improved food security Showground fence constructed - - 1 - - 30
No of show stands constructed - - 10 30 - 60
Agricultural
Training Centre
Improved food security No of centres constructed - 1 1 1 - 150
No of farmers trained in the centres - 500 1000 1500 2000 8
Soil testing
Laboratory
Improved food security Soil testing facility constructed and
equipped
- - - 1 - 25
No of soil samples tested - - - 300 300 0.6
Ward offices
construction
Enhance work
productivity
No of ward offices built 2 2 2 2 2 100

56
Sub Programme Key Output Key performance Indicators Baseline (2017) Planned Targets Total Budget
(M) Year 1 Year 2 Year 3 Year 4 Year 5
Agricultural
Mechanization
Workshop
Improved food security One workshop constructed - 1 - - - 25
Green energy parks Improve food security One green park constructed and
equipped
- - 1 - - 150
b. Sub-Sector Programmes - Livestock
Sub
Programme
Key Output Key Performance
Indicators
Baseline Planned Targets Total
Budget
(M) Year 1 Year 2 Year 3 Year 4 Year
5
Objective: To facilitate general administrative, planning and support services
Outcome: Enhanced institutional capacity and efficient service delivery
Institutional
capacity
3 offices & toilets constructed No offices & toilets
constructed
1 One
office &
toilets at
Bura
One office
& toilets
at
Madogo
- - 30.0
5laptops and 5desktops issued No office equipment
& stationery issued
to staff
5 - - - - 1.0
1 motor vehicle & 6 motorbikes purchased No motor vehicles
and motorbikes
purchased
1 2 2 2 - 8.0
9 new officers recruited No new staff
recruited
2 2 2 2 1 6.48
10 officers trained at the KSG No staff trained 2 2 2 2 2 3.0
Staff welfare 20 officers remunerated every year No staff recruited 20 20 20 20 20 75.0
150 beneficiaries medically insured every
year
No beneficiaries
with medical cover
150 150 150 150 150 37.5
Programme 2: Livestock Extension Services
Objective: To provide technical advice in animal production, livestock marketing, range management, apiculture and ranching
Outcome: Improved livestock production and productivity
Livestock
extension
2,200 Farm visits conducted per year No farm visits 2,200 2,200 2,200 2,200 2,200 15.0
9 Field days held every year No field days 9 9 9 9 9 7.5
1000 Demonstrations done every year No demonstrations
done
1,000 1,000 1,000 1,000 1,000 5.0
3 Agricultural shows held every year No agricultural
shows held
3 3 3 3 3 5.0

57
Sub
Programme
Key Output Key Performance
Indicators
Baseline Planned Targets Total
Budget
(M) Year 1 Year 2 Year 3 Year 4 Year
5
20 Supervision and backstopping mission
conducted every year
No Supervisions &
backstopping
mission
20 20 20 20 20 5.0
Programme 3: Livestock marketing
Objective: To increase access to livestock markets
Outcome: Increased income to livestock producers and increased county revenue
Livestock
auction yards
5 Livestock auction yard constructed No auction yards
constructed
1 1 1 1 1 75.0
Market shades 9 Market shades constructed No market shades
constructed
9 - - - - 30.0
Access roads Access road to Madingo upgraded to be all
weather
No access roads
upgraded
1 - - - - 7.0
LMD Holding
grounds
2 LMD offices constructed No of LMD offices
constructed
1 1 - - - 10.0
2 LMD Access roads upgraded to be all
weather
No access roads
upgraded
1 1 - - - 14.0
5 Boreholes constructed at Kurawa and
Wenje
No boreholes
constructed
- - 2 3 - 35.0
2 tractors Hay cutter and balers purchased No of hay harvesting
equipment purchased
1 1 - - - 60.0
3 Cattle dips constructed at Wenje & Kurawa No cattle dips
constructed
1 2 - - 15.0
Programme 4: Livestock improvement
Objective: To enhance livestock productivity
Outcome: Increased income for livestock producers
Breeding 3 Bull camps established and 30 boran bulls
supplied
No of Boran bulls
introduced & No
bull camps
established
- 10 10 10 15.0
2 Goat multiplication centres established &
500 German Alpine goats supplied
No goat
multiplication
centres established
&No German Alpine
goats supplied
Multiplication
centre
- - 1 - 40.0
250 goats in
Galole
- - 250 -
3 Cockerel exchange units formed & 500
Cockerels distributed
No cockerel
exchange units
established & No
cockerels distributed
- 1 1 1 - 5.4
- - 250
cockerels
distributed
in Galole
250
cockerels
distributed
-

58
Sub
Programme
Key Output Key Performance
Indicators
Baseline Planned Targets Total
Budget
(M) Year 1 Year 2 Year 3 Year 4 Year
5
in Tana
Delta
Apiculture 5 Model apiaries established No community
managed model
apiaries established
1 1 1 1 1 7.0
10 carpenters trained on bee hive
manufacture
No of carpenters
trained on bee hives
manufacture
10 - - - - 1.2
Programme 5: Drought mitigation
Objective: To enhance preparedness in anticipation of a drought scenario
Outcome: Community drought resilience improved
Climate change
adaptation
600 Galla goats purchased and distributed to
most vulnerable households
No. of Galla goats
distributed to most
vulnerable
households
300 - 300 - - 6.0
120 camels purchased and distributed to most
vulnerable households
No. of camels
distributed to most
vulnerable
households
- 60 - 60 - 12.0
Drought
response
100 million Drought contingency fund
established every year
Amount of
contingency fund set
aside for purchase of
livestock
supplementary feeds
100 100 100 100 100 500
15 groups trained on CMDRR every year No. community
groups trained on
CMDRR
(disaggregated by
gender)
15 15 15 15 15 30.0
Livestock
insurance
12,500 TLUs insured against drought every
year
No. TLUs insured 12,500 12,500 12,500 12,500 s 12,500 125.0
Fodder
production
20Hectare of land irrigated with fodder No Ha of land under
irrigated fodder
20
20
20
20
20
7.5
5 tractors with hay cutting and baling
equipment supplied
No hay balers and
tractors bought
1
1 1 1
1
50.0
Range
management
25grazing management committees formed
and trained
No grazing
committees formed
and trained
5 5 5 5 5 15.0

59
Sub
Programme
Key Output Key Performance
Indicators
Baseline Planned Targets Total
Budget
(M) Year 1 Year 2 Year 3 Year 4 Year
5
25grazing blocks rehabilitated No grazing blocks
rehabilitated
5 5 5 5 5 50.0
Rehabilitation
of Ranches and
introduction of
community
conservancies
10ranches rehabilitated No of ranches
rehabilitated
2 2 2 2 2 250.0
c. Sub-Sector Programmes - Veterinary Sub-programme Key output
Key performance
Indicators
Targets Total Budget
(M) Year 1 Year 2 Year 3 Year 4 Year 5
Target Cost (M) Target Cost (M) Target Cost (M) Target Cost (M) Target Cost (M)
Programme 1: Administrative support services
Objective: Strengthen capacity for services
Outcome: Service delivery improved
Administrative and
support services
Staff facilitate
to perform
79.07 81.47 76.64 77.83 91.06 406.07
Programme 2: Veterinary disease prevention services
Objective: To control trade sensitive and zoonotic diseases
Outcome: Enhance access to markets and safeguard human health
Disease and vector
control infrastructure
Crushes
constructed
No of crushes
built
30 25.5 30 25.5 30 25.5 30 25.5 30 25.5 127.5
Dips
constructed
No. of dips
constructed
2 6 2 6 2 6 1 3 1 3 24
Animals
vaccinated
against CCPP,
CBPP and PPR
Proportion of
animals
vaccinated
50 10.5 60 12.38 70 14.25 80 16.125 90 18 71.255
Dogs
vaccinated
against rabies
No. of dogs
vaccinated
500 1 750 1 1,000 1.2 1,200 1.5 1,200 2 6.7
Tsetse traps laid No. of traps laid 500 5.01 600 4.56 1,000 2.26 1,200 2.38 1,500 2.58 16.79
Disease Surveillance Markets and
stock routes
visited
No. of market and
stock route visits
12 1.3 12 1.3 12 1.3 12 1.3 12 1.3 6.5
Veterinary public
health
Modern
slaughter
premises built
No. of new
slaughter premises
built
2 30 2 30 2 20 1 5 1 5 90

60
Sub-programme Key output
Key performance
Indicators
Targets Total Budget
(M) Year 1 Year 2 Year 3 Year 4 Year 5
Target Cost (M) Target Cost (M) Target Cost (M) Target Cost (M) Target Cost (M)
Meat inspection
done
No. of carcasses
inspected
32 1.5 32 1.5 32 1.5 32 1.5 32 1.5 7.5
Monitoring &
Evaluation
Project sites
visited
No. of reports for
inspection and site
meetings
24 1.2 24 1.2 24 1.2 24 1.2 24 1.2 6
Programme : Veterinary services
Objective: To provide quality veterinary services, improve breeds of cattle, enhance animal welfare and quality assurance.
Outcome: Enhanced income, improved livelihoods and employment creation
Clinical and
laboratory services
Clinic and
laboratory block
constructed
% of construction
work
50 20 - - 50 10 - - - - 50
Animals treated Proportion of the
livestock treated
- - 100 10 - - 100 10 - - 20
Diseases
correctly
diagnosed early
No. of samples
collected and
analysed
500 0.6 1,000 1 1,500 1.2 2,000 1.5 2,500 1’75 6.05
Veterinary extension
services
Adoption of
new
technologies
enhanced
No. of farmers,
butchers, flayers
and CDR trained
600 2 1,000 2.4 1,500 2.8 1,500 3 2,000 3.5 13.7
Leather development
services
High grade
hides and skins
No. of visits to
curing premises
12 1.5 12 1.5 12 1.5 12 1.5 12 1.5 7.5
Animal breeds
improvement
Animals
inseminated
No. of
inseminations
done
200 1.5 500 2 600 2.2 700 2.4 1,000 2.6 10.7
Animal welfare and
rabies control
Cases of cruelty
to animals
observed
No. of awareness
barazas/meetings
36 1.2 36 1.2 36 1.2 36 1.2 36 1.2 6
Value addition
services
Cottage tannery
and horn value
addition
facilities built
No of factories
constructed
1 20 1 20 - - - - - - 40
No. of tanneries
constructed
1 30 - - 1 30 - - - - 60
Staff office
accommodation.
Staff working
comfortably in
suitable offices
No. of offices
constructed
2 20 1 10 1 10 - - - - 40

61
d. Sub Sector Programmes - Fisheries Sub
Programme
Key Output Baseline Key
performance
Indicators
Planned Targets Total
Budget
(M) Year 1 Year 2 Year 3 Year 4 Year 5
Target Cost
(M)
Target Cost
(M)
Target Cost
(M)
Target Cost
(M)
Target Cost
(M)
Programme 1: General Administration, Planning and Support Services
Objective: To facilitate general administrative, planning and support services
Outcome: Enhanced institutional capacity and efficient service delivery
Human
Resource
Trained staff - No. of staff
trained
- 0.5m - 0.7m - 0.8m - 0.9m - 1m 3.9m
Transport
improvement
Improved
service
delivery
- No. of vehicles
purchased
1
7.5m
-
-
- - 1
9 - - 16.75
No. of motor
cycles
purchased
3 1.5 3 1.5 4 2 - - - - 5
No. of boats
maintained and
repaired
1 0.75 2 1.2 3 1.5 4 1.8 4 1.8 7.05
Well repaired
and
maintained
motor
vehicles
6
m/cycles
No. of motor
vehicles
repaired
1 m/vehicle
6 m/cycle
0.75 1m/veh
icle
0.75 - - - - - - 1.5
Refined fuel
and lubricants
Improved
service
delivery
No. of litres of
fuel purchased
2500 0.275 3000 0.33 3500 0.385 4000 0.44 4500 0.49 1.925
Office support
services
Improved
service
delivery
No. office
equipment
bought
10 1.5 2 0.3 2 0.3 2 0.3 3 0.4 1.9
Utility bills
paid
36 0.4 36 0.4 36 0.4 36 0.4 36 0.4 2
Fisheries
legislation
enactment
Legislation
enacted in
use
None 1 legislation
enacted
- - 1 3.5 - - - - - - 3.5
Periodic
Monitoring and
Evaluation
Well
supervised
projects
Ongoing No. of site
visits carried
out
12 0.15 12 0.2 12 0.25 12 0.3 12 0.4 1.3

62
Sub
Programme
Key Output Baseline Key
performance
Indicators
Planned Targets Total
Budget
(M) Year 1 Year 2 Year 3 Year 4 Year 5
Target Cost
(M)
Target Cost
(M)
Target Cost
(M)
Target Cost
(M)
Target Cost
(M)
No. of
meetings
carried out
4 0.15 4 0.15 4 0.2 4 0.25 4 0.3 1
Field visits 4 0.25 4 0.25 4 0.25 4 0.25 4 0.25 1.25
Programme 2: Fish production
Objective: To increase fish production
Outcome: Improved production of high quality fish and fish products
Aquaculture
Development
Increased
fish
production
No. of
hatcheries
constructed
1
14
-
-
1
14
-
-
-
-
28
No. of quality
fingerlings
available per
sub-county
150,000 1.5 300,00
0
3 450,000 4.5 600,000 6 750,000 7.5 22.5
Improved
quality and
increased
quantity of
fish feeds
Construction of
fish production
unit; Quantity
of fish feeds
available in
tons per sub
county
1
30
3.5
3
-
35
-
4.5
-
45
-
6.75
-
50
-
9
-
60
-
11.25
3.5
34.5
Increased
productivity
through fish
farming and
improved
livelihood
No. of fish
farmers
assisted to
operationalize
fish ponds
150 4.4 150 4.8 200 5 125 5 125 5 24.2
Empowered
women and
youth
engaged in
Fish farming
5 No. of women
and youth
groups
involved in fish
farming
7 0.3 9 0.5 12 0.7 15 0.9 20 1.1 3.5
Improved
fish farming
production
2 No. of fish
ponds
constructed and
stocked with
fingerlings
30 2.5 30 2.5 30 2.5 30 2.5 30 2.5 12.5

63
Sub
Programme
Key Output Baseline Key
performance
Indicators
Planned Targets Total
Budget
(M) Year 1 Year 2 Year 3 Year 4 Year 5
Target Cost
(M)
Target Cost
(M)
Target Cost
(M)
Target Cost
(M)
Target Cost
(M)
Capture
Fisheries
Increased
fish landing
2
No. of natural
water bodies
restocked
2 3 2 3 2 3 1 1.5 - - 10.5
Enhanced
patrols and
surveillance
1 No. of patrols
and
surveillance
incursions
carried out
12
0.6 12 0.8 12 1 12 1.2 12 1.5 5.1
1 No. of landing
sites gazetted
2 0.5 - - - - - - - - 0.5
Fisheries
extension,
research and
training
Improved
management
and
sustainable
utilization of
fisheries
resources
380 No. of fishers
and farmers
getting
effective and
efficient
extension
services
500 1.5 650 1.65 800 1.9 1000 2.2 1200 2.5 9.75
Increased
consumption
of fish
through Fish
Eat
Campaigns
1 No. of
households
utilizing fish as
a cheap source
of animal
protein
segregated by
gender
1 0.4 2 0.8 3 1.2 4 1.6 5 2 6
Improved
farming and
fishing skills
2 Quantity of
fish and fish
products
5 0.4 7 0.5 9 0.6 11 0.7 13 0.9 3.1
Improved
compliance
of Fisheries
Management
and
Development
Act 2016
- No. of fishers
sensitized on
FMD 2016 Act
1200 0.6 1200 0.6 1200 0.6 - - - - 1.8
Programme 3: Fish market Development
Objective: Diversify and expand fish market

64
Sub
Programme
Key Output Baseline Key
performance
Indicators
Planned Targets Total
Budget
(M) Year 1 Year 2 Year 3 Year 4 Year 5
Target Cost
(M)
Target Cost
(M)
Target Cost
(M)
Target Cost
(M)
Target Cost
(M)
Outcome: Increased household income to fishers
Fish value
addition
Production of
high quality
fish and fish
products
- Increased
access to
market
information
20 0.5 20 0.5 20 0.5 30 0.7 30 0.7 2.9
7 Market
penetration and
product
development
2 0.25 2 0.25 3 0.5 - - - - 0.9
2 No. of groups 2 0.4 7 0.5 9 0.6 11 0.7 13 0.9 3.1
2 No. of groups 1 0.3 - 0.35 - 0.45 - 0.5 - 0.65 2.25
Fish
infrastructure,
fish handling
facilities
Improved
fish handling,
preservation
and reduced
post-harvest
losses
- Modern fish
depot at Kipini
- - 1 20 - - - - - - 20
1 Installation of
an ice plant and
cold store
1No. 7 - - - - - - - - 7
-
No. of modern
fishing gears
- - - - - - Set 2.8 Set 3 5.8
1 Modern
smoking kiln
1 0.65 1 0.65 1 0.65 - - - - 1.95
Fish Co-
operative
development
Improved
household
incomes
through
collective
marketing
100 No. of
organized
groups joining
to form Co-
operative
1 0.65 - - - - - - - - 0.65
5 Improved
organization
and internal
governance
1 0.45 - 0.38 - 0.3 - 0.3 - 0.3 1.68

65
Sub
Programme
Key Output Baseline Key
performance
Indicators
Planned Targets Total
Budget
(M) Year 1 Year 2 Year 3 Year 4 Year 5
Target Cost
(M)
Target Cost
(M)
Target Cost
(M)
Target Cost
(M)
Target Cost
(M)
- No. of Co-
operatives
registered and
operational
3 0.5 3 0.4 3 0.45 3 0.3 - 0.25 1.8
No. of fishers
accessing the
fund
- - 3 1.5 3 2 3 2.5 3 3.5 9.5
e. Housing and Urbanisation
Sub-programme Key output Baseline Key
performance
Indicators
Targets Total Budget
(M) Year 1 Year 2 Year 3 Year 4 Year 5
Target Cost
(M)
Target Cost
(M)
Target Cost
(M)
Target Cost (M) Target Cost
(M)
Programme 1: General administration and support services
Objective: To provide administrative support services
Outcome: Conducive working environment.
Training Expenses Improved
service
delivery
Number of
Training
workshop s
conducted
4 1 4 1.5 4 2 4 2.5 4 3 10
Purchase of
Office Furniture
and General
Equipment
Improved
service
delivery
Number of
Office Furniture
and Fitting
purchased
3 1 3 1.5 3 2 3 2 3 2.5 9
Number of
Computers,
Printers and
other IT
Equipment
purchased
5 0.4 5 0.5 3 0.4 3 0.5 3 0.6 2.4
Transport
Improvement
Improved
service
delivery
No. of motor
vehicles bought
1 7 1 8 1 9 - - - - 24
Programme 2: Urban Centre Lighting
Objective: To ensure well lit urban centres

66
Sub-programme Key output Baseline Key
performance
Indicators
Targets Total Budget
(M) Year 1 Year 2 Year 3 Year 4 Year 5
Target Cost
(M)
Target Cost
(M)
Target Cost
(M)
Target Cost (M) Target Cost
(M)
Outcome: Increased trading hours in urban centres.
Installation of
street lights
Street lights
installed
Number of street
lights powered
by either
national grid or
solar
55 10 75 15 100 20 120 25 150 30 100
Programme 3: Urban Centre Cleaning
Objective: To ensure clean urban centres
Outcome: Improved sanitation in urban centres.
Cleaning of urban
centres
Clean Urban
Centres
Tonnes of
garbage
removed
200 10 200 15 200 20 200 25 200 30 100
Litres of liquid
waste disposed
500 5 500 5 500 5 500 5 500 5 25
Kilometres of
drains cleaned
10 5 10 5 10 5 10 5 10 5 25
Kilometres of
bushes cleared
10 5 10 5 10 5 10 5 10 5 25
Programme 4: Integrated Urban development plan
Objective: To ensure well planned urban centres
Outcome: Improved management of urban centres.
Integrated Urban
development
planning
Well planned
urban centres
- Number of
urban centres
with integrated
plan.
1 50 2 60 3 70 4 80 5 90 350
Programme 5 : Disaster risk preparedness
Objective: To ensure well preparedness for disaster risk in urban centres
Outcome: Improved management of disaster risk in urban centres.
Response to
disaster risk
Improved
response to
disaster risk
Number of Fire
stations
constructed
1 10 2 20 3 30 4 40 5
50
150
Number of Fire
engines
purchased
1 20 2 30 3 40 4 50 5 60 200
Number of
personnel
recruited and
12 5 20 8 25 10 30 12 30 15 50
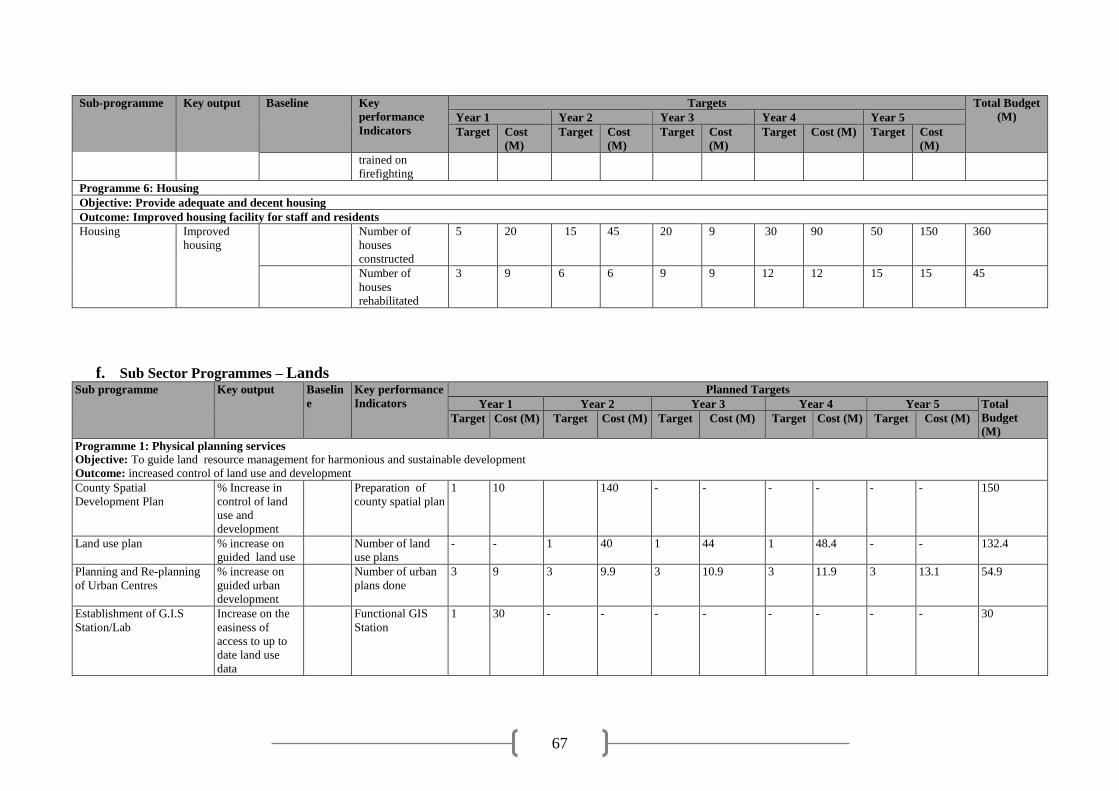
67
Sub-programme Key output Baseline Key
performance
Indicators
Targets Total Budget
(M) Year 1 Year 2 Year 3 Year 4 Year 5
Target Cost
(M)
Target Cost
(M)
Target Cost
(M)
Target Cost (M) Target Cost
(M)
trained on
firefighting
Programme 6: Housing
Objective: Provide adequate and decent housing
Outcome: Improved housing facility for staff and residents
Housing Improved
housing
Number of
houses
constructed
5 20 15 45 20 9 30 90 50 150 360
Number of
houses
rehabilitated
3 9 6 6 9 9 12 12 15 15 45
f. Sub Sector Programmes – Lands Sub programme Key output Baselin
e
Key performance
Indicators
Planned Targets
Year 1 Year 2 Year 3 Year 4 Year 5 Total
Budget
(M) Target Cost (M) Target Cost (M) Target Cost (M) Target Cost (M) Target Cost (M)
Programme 1: Physical planning services
Objective: To guide land resource management for harmonious and sustainable development
Outcome: increased control of land use and development
County Spatial
Development Plan
% Increase in
control of land
use and
development
Preparation of
county spatial plan
1 10 140 - - - - - - 150
Land use plan % increase on
guided land use
Number of land
use plans
- - 1 40 1 44 1 48.4 - - 132.4
Planning and Re-planning
of Urban Centres
% increase on
guided urban
development
Number of urban
plans done
3 9 3 9.9 3 10.9 3 11.9 3 13.1 54.9
Establishment of G.I.S
Station/Lab
Increase on the
easiness of
access to up to
date land use
data
Functional GIS
Station
1 30 - - - - - - - - 30

68
Sub programme Key output Baselin
e
Key performance
Indicators
Planned Targets
Year 1 Year 2 Year 3 Year 4 Year 5 Total
Budget
(M) Target Cost (M) Target Cost (M) Target Cost (M) Target Cost (M) Target Cost (M)
Purchase of plotter % Increase in
service delivery
Functional plotter 1 1.5 - - - - - - - - 1.5
Programme 2: Community land Registration and settlement services
Objective : To secure land tenure for the community, To sensitize/empower citizens on Land Laws
Outcome:
Settlement scheme
Increase number
of settlement
schemes
Established
Number of
schemes
registered.
3 24 3 26.4 3 29 3 31.9 3 35.1 146.50
Community Land Increase security
of tenure
Number of
community land
registered
2 12 2 13.2 2 14.5 2 15.9 2 17.5 73.2
Land laws sensitisation % Increase on
awareness of the
land laws.
Number of forums
covered in a ward
( desegregated by
gender, age,
PLWD)
3 2 3 2 3 2 3 2 3 2 10
Programme 3: Land Survey Services Objective : To demarcate and mark property boundaries in urban areas, settlement schemes and community land, To assist Community land management committee in boundary disputes resolutions, To
extend controls to ease mapping
Outcome: Increased Security of land tenure, Increased peace between neighbours
Cadastral/
Demarcation of plots
Increase number
of cadastral
surveys done
Number of Urban
centers surveyed
1 8 1 8.8 1 9.6 1 10.6 1 11.7 48.8
Disputes on property
boundaries
Increase on the
number of
disputes solved
Number of
disputes solved
100 5 120 5.5 130 6 140 6.6 100 7.3 30.5
Extension of survey
controls
% increase on
survey controls
extended
Number of Urban
centers covered
1 3 1 3.3 1 3.6 1 3.9 1 4.3 18.3
Completion and furnishing
of County Land Registry
Increase office
space and house
all county lands
departments
Office Block Built 1 24 - - - - - - - - 24

69
g. Co-operative Development Sub-Sector Sub programme Key output Baseline Key performance
Indicators
Planned Targets
Year 1 Year 2 Year 3 Year 4 Year 5 Total Budget
(M) Target Cost (M) Target Cost (M) Target Cost (M) Target Cost (M) Target Cost (M)
Programme 1: General Administration, Planning and Support Services
Objective: To facilitate general administrative, planning and support services
Outcome: Enhanced institutional capacity and efficient service delivery
Purchase of three 4WD
vehicle for the county
Improved staff
mobility for
service delivery
0 Tender
documents,
logbook
1 6 1 6 1 6 0 0 0 0 12
Purchase of furniture and
office equipment and
stationery
Offices
furnished
0 No. of offices
furnished
1 0.4 1 0.4 1 0.45 0 0 0 0 1.25
Renovation and fencing of
office block
Improved staff
comfort at
workplace and
better service
delivery
0 Tender
documents,
contracts
0 0 1 7.5M 0 0 0 0 0 0 7.5
Programme 2: Cooperative Development and Marketing
Objective: Enforce and enhance compliance with the provisions of co-operative Societies Act and subsidiary legislation
Outcome: Greater accountability and compliance with the law
General administration and
support services
Committee
members aware
of their roles
81
Minutes 50 1 50 1 50 1 50 1 50 1 5
Quality
decisions and
resolutions taken
15 Minutes 10 1 10 1 10 1 10 1 10 1 5
Good leadership
in place,
democracy
upheld
15 Minutes 10 1 10 1 10 1 10 1 10 1 5
Early detected
of fraud and
losses
15 Reports 20 1 20 1 20 1 20 1 20 1 5
Programme 2: Vibrant and self-sustaining cooperatives
Objective: Establishment of a cooperative development fund
Outcome: Improved income
Register new cooperatives Increased
income levels
81 Registration
certificates
50 1 50 1 50 1 50 1 50 1 5
Revive dormant
cooperatives
Raised income
levels
15 Amended bylaws 10 1 10 1 10 1 10 1 10 1 5

70
Sub programme Key output Baseline Key performance
Indicators
Planned Targets
Year 1 Year 2 Year 3 Year 4 Year 5 Total Budget
(M) Target Cost (M) Target Cost (M) Target Cost (M) Target Cost (M) Target Cost (M)
Establish a Cooperative
Development Fund
Emergence of
strong
cooperative
activities
0 Relevant
legislation to
guide the fund
1 100 1
100
1
100
1
100
1
100
500
Programme 3: Capacity Building
Objective: Improved decision making, loyalty and improved market access and marketing efficiency in co-operatives
Outcome: Capacity building on cooperative awareness and value addition
Conducting members
education programmes
Increased
members
awareness
81 Attendance lists,
reports
50 1 50 1 50 1 50 1 50 1 5
Management committee
seminars and staff trainings
Improved levels
of decision-
making
15 Attendance lists,
reports
10 1 10 1 10 1 10 1 10 1 5
Exposure tours and visits Improved levels
of decision-
making
0 Reports and
brochures from
other
cooperatives
1 1 1 1 1 1 1 1 1 1 5

71
h. Cross-Sectoral Impacts Programme name Sector Cross-sectoral Impact Mitigation Measures
Synergies Adverse Impacts
Agriculture
Food security Water Agro-forestry controls erosion
and conserves catchment
areas. This ensures sustained
availability of water for
domestic use and irrigation
Special programs, social protection &
gender
Empowerment of youth and
women groups
Livestock Increased fodder production
will increase the number and
quality of livestock. This in
turn will boost manure
production for organic
farming and biogas
production
Land degradation due to
overstocking.
Control livestock population numbers by
embracing zero grazing or reducing the number of
animals at household level.
Energy Fodder production will boost
manure production for
generation of renewable
energy.
Depletion of ozone layer due to
release of methane gas.
Use of methane as alternative fuel
Education Food security ensures
increased enrolment and
retention
Increased literacy levels
resulting in economic growth
Enforcement of laws that govern child labour
Health Reducing vulnerabilities
which might lead to new
HIV/AIDS infections
Malnutrition Health
Reduced cost of preventive
and curative healthcare due to
enhanced levels of nutrition
Sustainable agriculture Environment Embracing climate smart
agriculture in mitigating
against the adverse effects of
climate change & persistent
drought
Increased idle land opened up
for agricultural activities and
exposure to soil erosion
Soil conservation, Water harvesting and
conservation agriculture practiced
Livestock

72
Programme name Sector Cross-sectoral Impact Mitigation Measures
Synergies Adverse Impacts
Livestock extension services Health Combine the nutrition aspects
during farmer trainings
Transmission of zoonotic
diseases from livestock to
humans
Sensitization on hygiene when handling animal
products and consumption of inspected meat
Livestock marketing Trade Support in raising revenue
from sale of livestock
High cost of maintaining
livestock trade infrastructure
Strengthening of livestock marketing associations
Livestock improvement Agriculture
Improve crop production by
providing farmyard manure
and crop pollination
Invasion of crops by livestock Encourage the use of appropriate grazing systems
Drought mitigation Environment Environmental degradation due
to overgrazing
Sensitize the pastoral community on the
implementation of planned grazing
Drought mitigation Finance and planning Reallocation of budgets
towards drought mitigation
Enhance preparedness measures as opposed to
drought response
Veterinary
Clinical and laboratory services Health Effective control of zoonotic
diseases
- -
Disease and vector control
infrastructure
Environment - Spillage of waste chemicals Proper training of personnel manning facilities
Modernization of slaughter
houses
Environment Environmental Impact
Assessment
Problems in waste management
problems
Consult with the sector on mitigation measures
Value addition services Trade Market linkages - -
Breed improvement services Education Improved nutrition in children - -
Fisheries
Fish production Trade
Co-operative and market development
Health
Environment
Capacity building on
entrepreneurship
Promotion of collective
marketing;
Sensitization on fish
sanitation and safety
Awareness creation on
sustainable utilization of
fisheries resources
High literacy levels amongst
fishers; Disorganized groups
Loss of fish and fish products
due to product adulteration
Destruction of fisheries habitats
Capacity building of fishers on financial literacy,
fish value addition, collective marketing, fish
post-harvest losses, climate change and
sustainable utilization of fisheries resources
Fish market development Trade
Co-operative development and marketing
Fish market development
Establish contract farming
and fishing
Inadequate fish and fish
products; Low volumes of fish
and failure to meet contractual
terms
Establishment of market linkages and
development of new products
Cooperative Development
Reducing new HIV/AIDS
infections
Agriculture and rural development/Health
Work in collaboration with
health department to prevent
more new infections
Loss of productive part of
manpower leading to heavy
economic losses
Conduct voluntarily HIV testing and counselling
amongst fishing communities

73
Programme name Sector Cross-sectoral Impact Mitigation Measures
Synergies Adverse Impacts
Capacity building on life skills among fisher folk
and vulnerable women and children
Requisition, promotion and distribution of
condoms
Sensitization and provision of PEP
PMICT
Total ban on child labour
during crop harvesting season
Education Advocacy for compulsory
school going children
Early school drop outs
Chronic absenteeism in schools
Sensitize parents, working closely with local
administration to ensure fully compliance
Advocate for free education for all
Gender mainstreaming cooperatives Strengthening of cooperatives High poverty levels Sensitization and awareness amongst members of
cooperative members during member education
days and annual general meetings
Housing and Urbanisation
Urban Centre Lighting Roads Work in collaboration with
Roads to clear road reserve
Grabbed road reserve impede
installation of street lights
Sensitize residents to keep off road reserve
Urban Centre Cleaning Health
Work in collaboration with
Health to enforce public
health Act
Unclean environment causes
disease outbreak
Sensitize residents to maintain cleanness of their
place of work and residence
Environment Work in collaboration with
Environment to manage
garbage
Uncollected garbage pollutes
the environment
Remove and manage garbage in the Urban
Centres
Integrated Urban Development
Planning
Lands Work in collaboration with
Lands to prepare integrated
Urban Spatial Plans for the
Urban Centres
Lack of integrated Urban
spatial plans leads to
uncontrolled development
Sensitize residents to respect Town plans. Ensure
building plans are approved before developments
are done in the urban centres.
Disaster risk preparedness Public works Work in collaboration with
Public Works to ensure
buildings have safety
precautions
Lack of safety precautions is a
disaster risk
Sensitize residents on disaster risk preparedness
Roads Work in collaboration with
Roads to open roads in Urban
centres for ease of access
Blocking roads in the urban
centres impede ease of access
to respond to disaster
Sensitize residents to keep off roads reserve.
Housing Public works Work in collaboration with
public works to prepare bills
of quantities and supervision
of projects
Lack of supervision of projects
cause poor and shoddy work.
Sensitize contractors on following the bills of
quantities.

74
4.4.2 General Economic, Commercial and Labour Affairs
The sector is composed of the following sub-sectors: Trade and Enterprise Development;
Weights and Measures; Industrialization and Tourism.
Vision
A competitive economy with sustainable and equitable social-economic development
Mission
To promote, coordinate and implement integrated social-economic policies and programmes for
a rapidly industrializing economy.
Goal
Trade - Promote sustained, inclusive and sustainable economic growth, full and productive
employment and decent work for all. In the county, the sub-sector has continued to support the
productive activities in wholesale and retail trade which include, establishment of business
producer groups, provision of affordable loans, training on entrepreneurship and business
management skills, and encouraging the growth of micro, small- and medium-sized enterprises
and promotion of fair trade practices.
Tourism – To devise and implement policies to promote sustainable tourism that creates jobs
and promotes local culture and products. Towards this goal the subsector has identified several
niche products in the county which include nature based tourism and cultural tourism. The
subsector endeavours to develop, package and market the county as a tourist destination.
Sector Development Needs, Priorities and Strategies
The development priorities for the sector are;
1. Promotion of trade development and market services through construction of new trading
market facilities, rehabilitation of markets, development of business incubation centres,
provision of loans and capacity building of MSMEs.
2. Licensing, fair trade practises and regulation through promotion of business by
automation of licensing services.
3. Establishing of weighing centres, verification of weighing and measuring equipment,
calibration of county legal metrology standards and construction of weights and measures
laboratory.
4. Regulation and control of betting, gaming and lotteries.
5. Formulation of policies and establishment of legal framework for industrial development
in the county.
6. Development of plans and approach to protect MSMIs in the county against key imports
e.g. counterfeit and second hand goods.
7. Promotion and facilitating the development of SME industrial parks and SEZs.
8. Facilitation of the development of technical, entrepreneurial and managerial skills for
Micro, Small and Medium Industries (MSMIs).
9. Creation and promotion of linkages of MSMIs with source of finance, technology and
markets.

75
10. Facilitate orderly growth and development of local tourism
11. Develop tourism diversified products
12. Develop tourism information centres
13. Develop niche products
14. Develop high value cultural centres
15. Rehabilitate tourism infrastructure.
Developmental
Issue/Challenge
Causes Developmental
Objective
Immediate
Objective
Strategies
Trade and Enterprise Development
Limited access to credit
by SMEs
Limited credit
facilities.
Limited collaterals
To create a vibrant
SME sector
To provide
business finance to
SMEs
Financial Support to
business
Poor market
infrastructure
Inadequate finances To establish well-
functioning market
infrastructure
To provide market
infrastructure
Establish and
renovate markets
Poor business
management skills
Low exposure To increase market
information awareness
start business
courses
Capacity support to
SMEs
Weights & Measures
Inadequate weights and
measures services
Lack of accurate
determination of
quantities
Lack of verification
and calibration
To safeguard roads
To achieve fair trade
practices
To enhance consumer
protection
To ensure accurate
weighing of
produce
throughout the
county
To achieve
consumer
protection
To install weigh
bridges and animal
weigh machines
Low revenue collection
Inadequate CESS
points
To increase revenue
collection
To increase
revenue collection
Poor quantities/measures
determination systems
Inaccurate traders
equipment
To ensure accurate
determination of
quantities and measures
Provision of traders
equipment
Industrialization
Untapped potential of
animal products.
Inadequate market
for animal by-
products.
To fully exploit animal
products.
To increase
earnings by the
farmers.
Establish animal
products industry.
Tourism
Untapped tourism
potential
Poor tourism
marketing strategies
To exploit tourism
potential
To market tourism
potential
To create and
increase awareness
Develop a tourism
website
Organize miss
tourism beauty
pageant
Under-utilized parks Poor tourism
marketing strategies
To increase tourism
earnings
To increase
tourism activities
Restoration of
heritage sites
Poor access to heritage
sites
Poor road
infrastructure
Inadequate financing
to the tourism sector
To enhance access to
heritage sites
To increase tourist
arrivals
To increase
budgetary
allocation to the
sub sector
Enhance Public
Private Partnerships
Inadequate hotels and
bed capacity
Financial constraints
to private investors
Low tourist turnout
To enhance tourism
awareness on
investment
opportunities
To promote both
local tourism
Organize investor
forums
Enhance Public
Private Partnerships

76
a. Sub-sector Programmes - Trade and Enterprise Development Sub Programme Key Outcome Baseline Key performance
Indicators
Planned Targets Total
Budget
(M) Year 1 Year 2 Year 3 Year 4 Year 5
Target Cost
(M)
Target Cost
(M)
Target Cost
(M)
Target Cost
(M)
Target Cost
(M)
Sector Programme1. General administration, planning and support services
Objective 1: To provide efficiency in service delivery in implementation of county government policies
Outcome: Strong institutional capacity, enhanced efficiency and support services
Administration,
planning and
support services
Enhanced staff
capacity
No of staff trained 20 15 25 16 30 17 35 18 40 19 85
Staff mobility Efficient and
effective
service delivery
4 by 4 vehicle procured 1 7 - - - - - - - - 7
Office
accommodation
Efficient and
effective
service delivery
Office block built 1 (Hola)
7
1 (Garsen) 7 1 (Bura)
7
1
(Madogo)
7 -
-
35
Program 2: Market Infrastructure Development
Objective: To enhance and promote county and inter-county trade by 2022
Outcome: Enhanced trading activities
Market
Construction
Markets
constructed
No. of markets
constructed
1 100 1 100 1 100 - - - - 300
Market
establishment
Livestock
markets
established
No. of livestock markets
established
1 3 1 3 1 3 - - - - 9
Open air
markets
established
No. of open air markets
established
1 10 1 10 1 10 2 25 2 25 80
Market
Renovation
Markets
renovated
No. of markets
renovated
1 6 1 6 - - - - - - 12
Program3: Trade Promotion
Objective: To enhance financial accessibility to traders
To promote competitive trade and investments in the county
Outcome: A robust trade sector with growth in business fraternity and increased revenue generation.
Trade
development
Tana River
County Loans
Board
(revolving)
Scheme
established
No. of beneficiaries
(disaggregated by
gender, age, PLWD)
10,000 100 10,000 100 10,000 100 10,000 100 10,000 100 500
Financial
accessibility by
No. of MSMEs financed 5 5 5 5 5 5 5 5 5 5 25

77
Sub Programme Key Outcome Baseline Key performance
Indicators
Planned Targets Total
Budget
(M) Year 1 Year 2 Year 3 Year 4 Year 5
Target Cost
(M)
Target Cost
(M)
Target Cost
(M)
Target Cost
(M)
Target Cost
(M)
MSME
enhanced
A revolving
fund established
in all wards
Amount of loans (in
Kshs) recovered; No. of
loans with record growth
in business
1 15 1 15 1 15 1 15 15 75
Grants to
livestock
traders in all the
wards disbursed
No of beneficiaries 50 15 50 15 50 15 50 15 50 15 75
Grants to
Youth, women
& PLWD in all
the wards
provided
No of beneficiaries 50 15 50 15 50 15 50 15 50 15 75
Business
investment
forums
established
No. of foras
established/strengthened.
30 3 30 3 30 3 30
3 30
3 15
Business
linkages
increased
No. of stakeholders
meetings held
1 3 1 3 1 3 1 3 1 3 15
Business
Information
Centres in Hola,
Bura and
Garsen
established
No. of Business centers
established
1 - Bura
20 1 - Hola
20 1 - Garsen
20 - - 60
Trade
Investment
policy
developed and
trade Acts
revised
County Investment
policy developed; No. of
trade Acts revised
1 1 - - - - - - - - 5
Monitoring &
Evaluation
undertaken
Periodic reports 1
1 1
1 1 1 1 1 1 1 5

78
Sub Programme Key Outcome Baseline Key performance
Indicators
Planned Targets Total
Budget
(M) Year 1 Year 2 Year 3 Year 4 Year 5
Target Cost
(M)
Target Cost
(M)
Target Cost
(M)
Target Cost
(M)
Target Cost
(M)
One village one
product
program
established
Reports on OVOP
activities
1 3 1 3 1 3 - - 9
MSMEs Technical staff
trained
No. of technical staff
trained
20
1 20
1 20 1 20 1 20 1 5
TOT manual for
MSMEs
developed and
reviewed
MSMEs TOT manual 1 1 1 1 1 1 1 1 1 1 5
Interactive fora
for MSMEs
conducted
No. of MSMEs fora
conducted
1 1 1 1 1 1 1 1 1 1 5
Incubation
centers in
MSMEs in
Garsen, Hola
and Bura
established
No. of incubators
established
Bura
(1)
20 Hola
(1)
20 Garsen (1)
20 - - 60
MSEs Business
parks
established
No. of business parks
established
- - - Bura (1) 20 Hola (1) 20 Garsen (1) 20 60
Industrialization Inter-
governmental
consultation
forum on
Industrialization
held
No. of inter-
governmental
stakeholder consultative
forums held
1 1 1 1 1 1 1 1 1 1 5
Land for
industrial /
SME Parks
identified and
provided
Acreage of land for
industrial / SME parks
1
1 1 1 1
1 1 1 1
1 5
Industrial park
developed in Urara
1 100 100
Business
centres along
the major
highway
No. od business centres 6 20 6 20 40

79
Sub Programme Key Outcome Baseline Key performance
Indicators
Planned Targets Total
Budget
(M) Year 1 Year 2 Year 3 Year 4 Year 5
Target Cost
(M)
Target Cost
(M)
Target Cost
(M)
Target Cost
(M)
Target Cost
(M)
County Stake
holders forums
held
No. of county
stakeholders forums held
1 1 1 1 1 1 1 1 1 1 5
Hides and skin
industry
established
No. of industries
established.
1
50 1 50 - - - - - - 100
Milk processing
plants
established
No. of milk processing
plant established
-
- 1 60 1 60 1 60 - - 180
Agro
processing
(Honey, Mango
and pulp)
No. of Agro processing
Plants Established
3 10 3 10 3 10 3 10 3 10 50
Entrepreneurs
in BDS in areas
of hides & skins
and milk
processing
trained
No of entrepreneurs
trained
20 2 20 2 20 2 20 2 20 2 10
Capacity
building on
value addition
undertaken
No. of participants
trained
300 2 300 2 300 2 300 2 300 2 10
MSMEs
participants in
Trade Fairs,
shows and
exhibition
identified,
mobilized and
facilitated
No. of trade fairs held 1 2 1 2 1 2 1 2 1 2 10
Program 4: Business Licensing
Objective : To collect revenue and bring sanity to the market
Outcome: Enhanced revenue collection
Business
Licensing
Licensing of
pool tables and
amusement
machines
No of licensed pool
tables and amusement
machines and amount of
revenue collected
100 0.2 100 0.2 100 0.2 100 0.2 100 0.2 1
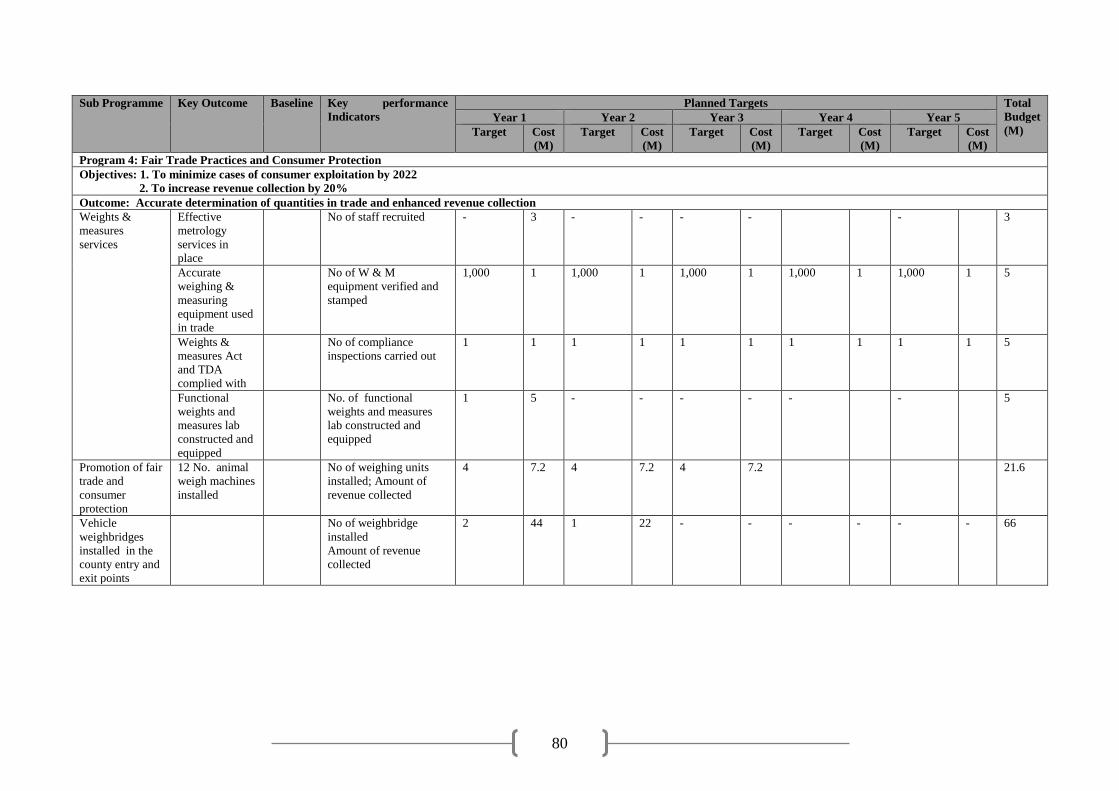
80
Sub Programme Key Outcome Baseline Key performance
Indicators
Planned Targets Total
Budget
(M) Year 1 Year 2 Year 3 Year 4 Year 5
Target Cost
(M)
Target Cost
(M)
Target Cost
(M)
Target Cost
(M)
Target Cost
(M)
Program 4: Fair Trade Practices and Consumer Protection
Objectives: 1. To minimize cases of consumer exploitation by 2022
2. To increase revenue collection by 20%
Outcome: Accurate determination of quantities in trade and enhanced revenue collection
Weights &
measures
services
Effective
metrology
services in
place
No of staff recruited - 3 - - - - - 3
Accurate
weighing &
measuring
equipment used
in trade
No of W & M
equipment verified and
stamped
1,000
1 1,000 1 1,000
1 1,000 1 1,000
1 5
Weights &
measures Act
and TDA
complied with
No of compliance
inspections carried out
1
1 1
1 1
1 1 1 1
1 5
Functional
weights and
measures lab
constructed and
equipped
No. of functional
weights and measures
lab constructed and
equipped
1 5 - - - - - - 5
Promotion of fair
trade and
consumer
protection
12 No. animal
weigh machines
installed
No of weighing units
installed; Amount of
revenue collected
4 7.2 4 7.2 4 7.2 21.6
Vehicle
weighbridges
installed in the
county entry and
exit points
No of weighbridge
installed
Amount of revenue
collected
2 44 1 22 - - - - - - 66

81
b. Sub-sector Programmes - Tourism Sub Programme Key Outcome Baseline Key
performance
Indicators
Planned Targets Total
Budget(m) Year 1 Year 2 Year 3 Year 4 Year 5
Target Cost(M) Target Cost(M) Target Cost(M) Target Cost(M) Target Cost(M)
Programme 1: Tourism Marketing and Promotion
Objective: To increase revenue collection from tourism by 50%
Outcome: A vibrant tourism industry
Restoration of
heritage sites
Heritage sites
restored
No. of heritage
sites restored
1
20 1
20 1
20 1 20 - -
80
Establishment of
tourism
information centers
Tourism
information
centres
established
No. of tourism
information
centres
1
30 1
30 1
30 1 30 - - 120
Miss tourism
beauty pageant
Miss tourism
beauty pageant
held
No. of miss
tourism beauty
pageant events
1
8 1
8 1
8 1 8 1 8 40
Organizing
investor forums
Investor forums
organized
No. of investor
forums held
1 20 1 20 1 20 1 20 - - 80
Development of
county tourism
website
Tourism website
developed
County tourism
website
1 1 - - - - - - - - 1
Destination
marketing
Destination
marketing held
N0. Of
destination
marketing
conducted
1 5 1 5 1 5 1 5 1 5 25
Establishment of
Eco camps
Eco camps across
the county
established
No. of eco camps
established
1
50 1
50 1
50 - - - - 150
Establishment of
tourist markets
Tourist markets
established
No. of tourists
markets
established
1
50 1
50 1
50 - - - - 150
Setting up of
community based
conservancies
Community based
conservancies
established
No. of community
based
conservancies
established
1 10 1 10 1 10 - - - - 30
Formulation of
tourism
development
policy
Tourism
development
policy formulated
Coordinated
tourism activities
1
20
-
- -
- - - - - 20

82
Sub Programme Key Outcome Baseline Key
performance
Indicators
Planned Targets Total
Budget(m) Year 1 Year 2 Year 3 Year 4 Year 5
Target Cost(M) Target Cost(M) Target Cost(M) Target Cost(M) Target Cost(M)
Operationalize
lower Tana
Tourism Circuit
Lower Tana
Tourism Circuit
established
Lower Tana
Tourism Circuit
1 1 - - - - - - - - 1
Establish
swimming sites
Swimming sites
established
No. of swimming
sites Established
1 5 1 5 1 5 - - - - 15
Programme Name: Tourism Potential Survey and Policy Development
Objective: To provide guidance in tourism investment
Outcome: Harmonized tourism industry
Tourism baseline
survey
Tourism baseline
survey conducted
Tourism baseline
survey report
1
5 -
-
-
- - - - -
5
Development of
tourism
development
policy
Tourism
development
policy developed
Tourism
Development
policy
1
20
-
- -
- - - - - 20
c. Cross-sectoral Impacts
Programme Name Sector Cross-sector Impact Measures to Harness or Mitigate the Impact
Synergies Adverse Impact
Market Infrastructure
Development
Agriculture Rural and Urban
Development; Livestock
Provide market for livestock trade Embracing modern technology
Sensitization and organizing auction market
day
Agriculture Provide market for fresh agricultural produce Increase in yield and diversification in
production
Environmental protection, water
and sanitation
Garbage and waste disposal,
Competition for clean water
supply
Proper waste management
Increase clean water supply
Trade Promotion Social Protection, culture and
Recreation
The programme shall empower all sections of
the county population
Capacity building of youth and women on
accessing and utilization of fund.
Business licensing Governance Justice Law and
Order; Finance and Economic
Planning
Business licensing will help in regulating
business activities within the county and
enhance revenue collection
Embracing of information technology
Fair trade practices and
consumer protection
Governance Justice Law and
Order; Finance and Economic
Planning
Accurate determination of quantities will
enhance revenue collection in the county
Embracing of information technology
Tourism Marketing and
Promotion
Governance Justice Law and
Order; Finance and Economic
Planning
Establishment of tourist sites will increase
tourism activities in the county hence enhance
revenue collection

83
4.4.3 Energy, Infrastructure & ICT
The sector is composed of the following sub-sectors: Roads, Transport, Public Works, Energy
and ICT.
Vision: To be the leading provider of cost effective, physical infrastructure facilities and services
in the nation and beyond
Mission: To provide efficient, affordable and reliable infrastructure for sustainable economic
growth and development through modernization, rehabilitation and effective management of
all infrastructure facilities in the County
Sector Development Needs, Priorities and Strategies Development Issues Causes Development
Objectives
Immediate
Objectives
Strategies
Poor Road network
(Murram, Tarmac)
Poor roads drainage;
Lack of continuous
maintenance of the
roads;
Lack of involvement of
the public in the
supervision of the road
construction and
maintenance;
Encroachment of road
reserves
Improved Road
Network
Promotion of
professionalism to
improve the
quality of roads;
Improve roads
drainage
Continuous
maintenance of
all-weather roads;
Formation of
project
supervision
committees which
should include the
community
members;
To increase space
for road
construction
Put in place a
supportive policy
framework;
Implement the agreed
code and standards of
roads and
infrastructure;
Allocation of more
funds towards the
road sector; Conduct
public participation
on roads projects;
Regular maintenance
of road
Establish legal
framework on the
ground to curb
encroachment of road
reserve; Form a
compliance team to
deal with unapproved
encroachments and
any misuse of road
reserves and NMT
facilities
Inadequate ICT
services
Inadequate ICT
infrastructure
Improve county ICT
services
To acquire and
install proper
infrastructure
Purchase of hardware
and software
infrastructure
Establishment of ICT
resource centres
Establish ICT office
Networking of offices
Establish county data
knowledge centre
(GIS unit)
ICT maintenance
Inadequate policies &
branding initiatives
Inadequate policies and
strategies
Develop ICT strategies
and branding
initiatives
Develop ICT
strategies and
branding
initiatives
Develop ICT &
Media policies
Establish county
branding initiative
Low uptake of ICT lack of training
Lack of institutions
Increase uptake of ICT
in the county
Gender sensitive
training and
capacity building
Establish computer
labs within
schools/colleges
Capacity build county
staff on ICT
Insufficient ICT
awareness and
Increase
knowledge on
ICT use
Awareness creation

84
Development Issues Causes Development
Objectives
Immediate
Objectives
Strategies
knowledge amongst the
citizens
Inadequate access to
renewable power
Untapped energy
resources.
Lack of purchasing
power
Increase access to
renewable power
Tap into available
renewable energy
sources
Set up solar powered
security lights in
villages
Inadequate Security
Lack of village based
security lighting
Improve security
through electrification
Offer incentives
through partners
Distribute energy
access to households
in partnership with
KPLC

85
a. Sub-Sector Programmes – Roads and Transport Sub-Programme Key Output Baseline Key Performance
Indicator
Planned Targets
Year 1 Year 2 Year 3 Year 4 Year 5 Total
Budget Target Cost
(M)
Target Cost
(M)
Target Cost
(M)
Targets Cost
(M)
Targets Cost
(M)
Programme 1: Road Construction and Rehabilitation
Objective: To increase the length of all weather, paved roads, capacity of roads and storm water drainage system
Outcome: Improving mobility and accessibility, Reducing the risk of loss of live, destruction of property and loss of livelihood
Roads
Construction,
rehabilitation and
maintenance
Roads
Constructed,
Access to all productive areas
improved
No. of km of roads
constructed, No.
of km of roads
opened, No.
vehicular bridges
constructed, No.
of foot bridges constructed
320 350 350 370 390 400 480 550 400 470 2110
Programme 2: Office Construction and Repair
Objective: To improve Working Environment for staff in the County
Outcome: Reduce destruction and Loss of property and low morale
Office
Construction
Offices
Constructed,
Offices
Rehabilitated
No. of offices
Constructed, No. of
offices
Rehabilitated
60 66 74 80 280
Programme 4: Housing Construction and Rehabilitation
Objective: To ensure accessibility to cheap and accessible houses
Outcome: Increase interpersonal
Office
Construction
Houses
Constructed,
Houses
Rehabilitated
No. of Houses
Constructed, No. of
Houses
Rehabilitated
10 units
4 office
blocks
60
5 units
4 office
blocks
66
5 units
4 office
blocks
74
5 units
4 office
blocks
80
5 units
4 office
blocks
100 380
Programme:
Objective:
Transport Bus park/stage - No. of bus park
designate
3 100 3 120 3 140 4 160 4 180 700
Programme:
Objective:
Outcome:
Urban Roads Urban Roads
developed
- Km of road 1200 600 1400 700 1600 800 1800 600 2000 400 3.1B

86
b. Sub-sector Programmes - ICT Sub-
Programme
Key Output Baseline Key
Performance
Indicator
Planned Targets
Year 1 Year 2 Year 3 Year 4 Year 5 Total
Budget Target Cost (M) Target Cost
(M)
Target Cost
(M)
Targets Cost
(M)
Targets Cost
(M)
Programme 1: County ICT and Broadband Infrastructure (ICT Infrastructure Development)
Objective: Improve county ICT services
Outcome: Improved connectivity within the county offices
County ICT
Infrastructure,
Connectivity
and shared
services
ICT
infrastructure in
place
15 No of officers
with
computers
30 5 30 5 30 5 30 5 30 7 27
- Acquired &
installed
software
50 (Office)
100
(antivirus)
50 (Win10)
8 50 (Office)
100
(antivirus)
50 (Win10)
8.8 50 (Office)
100
(antivirus)
50 (Win10)
9.7 50 (Office)
100
(antivirus)
50 (Win10)
10.7 50 (Office)
100
(antivirus)
50 (Win10)
11.8 48.9
- Offices with
ICT
accessories
i.e. projectors
etc
5 2 5 2 5 2 5 2 5 2 10
Internet & email
connectivity
- No of offices
connected
5 8.4 10 9.2
15 10.2 20 11.1
25 12.3
51.3
Establishment
and
operationalization
of ICT resource
centers
- Number of
functional
resource
centers
established
1 (Garsen) 8 1 (Galole) 8.9 1 (Bura) 9.6 26.5
Proper networked
county offices
- No of
functioning
county offices
networked
3 4.5
3 1
3 1.2
3 1.3 3 1.5
9.6
Functional county
data centre
- Operation
status of data
centre that is
gender
sensitive
1- Minjila 10 10

87
Sub-
Programme
Key Output Baseline Key
Performance
Indicator
Planned Targets
Year 1 Year 2 Year 3 Year 4 Year 5 Total
Budget Target Cost (M) Target Cost
(M)
Target Cost
(M)
Targets Cost
(M)
Targets Cost
(M)
Well maintained
ICT infrastructure
0 Frequency of
county ICT
maintenance
2 4 2 5 2 6 2 7 2 8 30
Programme 2: County ICT policies and branding
Objective: Develop ICT policies and branding initiatives
Outcome: Improved staff productivity
County ICT
and Media
Policy and
Regulation
Services
ICT policies - No of policies
developed
3 4.5 3 4.5 3 4.5 - - - - 13.4
County News
and
Information
Services
County news
services
- County news
and features
produced i.e.
documentaries
etc.
2
(documentary)
300
(magazines)
11 2
(documentary)
300
(magazines)
12 2
(documentary)
300
(magazines)
13 2
(documentary)
300
(magazines)
13 2
(documentary)
300
(magazines)
14 63
Functional
website
maintenance
1 3.1
1 3 1 2.3 1 2.3 1 2.3 13
Programme 3: County Information and Communication services
Objective: Increase uptake of ICT in the county
Outcome: Quality service delivery
Capacity
Development
County ICT
Skills
development
and enhancement
awareness
- No of
participants
trained (per
gender)
30 2 30 2.2 30 2.4
30 2.7
30 2.9 12.2
Computer for
schools
(CFS)
Computer labs
for schools
- No of schools
registered &
computers
issued per
ward
5 6 5 6.6 5 7.3 5 8 5 8.8 36.7

88
c. Sub-sector Programmes – Renewable Energy Sub-
Programme
Key
Output
Baseline Key Performance
Indicator
Planned Targets
Year 1 Year 2 Year 3 Year 4 Year 5
Total
Budget
Target Cost (M) Target Cost (M) Target Cost (M) Targets Cost (M) Targets Cost (M)
Programme 1: Renewable Energy
Objective: Increase county access to renewable power
Outcome: Electrification of towns and villages
Solar
powered
lightning
Solar
powered
lightning
- No of solar masts
erected per ward
5 15.5 5 17 5 18.7 5 20.5 5 22.5 94.1
Renewable
energy
Increase
village
connection
to the grid
- No of households
connected to the grid
per ward
200 5 200 6 200 7 200 8 200 9 35

89
d. Cross Sectoral Impacts Programme Name Sector Cross-sector Impact Measures to Harness the Impact
Synergies Adverse impact
County ICT and broadband
infrastructure (ICT Infrastructure
Development)
Health Automation of health records and systems will streamline the whole
process, helping doctors to serve the patients at a click of a button. This
will greatly reduce waiting time at the hospitals
Finance & Economic
planning
Automation of all revenue streams will greatly improve county revenue
collection by sealing all the loopholes. This will enable the county to meets
its immediate needs without reliance on the exchequer
Human resource Human resource automation will greatly improve staff management,
recruitment, records management etc. of HR
All other sectors Moving from manual to automated systems will greatly increase
productivity and service delivery of the employees
Resistance to
change might arise
from the users
Training and capacity build the users
on the importance of using computer
systems within an organization
County Information and
Communication services
Education ICT training of our students at schools will expose them to ICT skills at a
young age, and once they graduate they will have the necessary skills to
explore the world
More schools to be equipped with
ICT equipment
Develop ICT policies and
branding initiatives
Trade and tourism Continues county branding events will improve county exposure to the rest
of the country, thus improving trade and tourism
All other county
sectors
Improved standardization of communication and work as a result of
policies being in place
Resistance to
change to the new
policies might arise
from the users
Educate and capacity build the users
on the importance of policies within
an organization
Renewable Energy
Agriculture/Irrigation Increased food production –farmers will be provided with solar powered
water pumps to irrigate their farms during dry season.
Roll out more green energy
solutions in farming
Water / livestock &
fisheries / special
programs
More water sources can be explored and boreholes dug and produced with
solar water pumps, water will be pumped to villages and towns using green
energy
More cooperation between
departments

90
4.4.4 Health
Vision: A healthy, productive and globally competitive County
Mission: To build a progressive, responsive and sustainable health care system for accelerated
attainment of the highest standards of health to all residents of Tana River county
Goal: To attain equitable, affordable, accessible and quality health care for all residents in the
County
Sector Development needs, Priorities and Strategies Sub-Program Developmental
Issues/Problems
Causes Development
Objectives
Immediate
Objective
Strategies
General Administration, Planning and Support Services
Health
Services
Management
Weakness in
Coordination and
management in
the department of
Health, affecting
the quality of
services offered.
Inadequately
trained
CHMT/
SCHMT
High turnover
of Health
management
staff, lack of
prioritization
on the
trainings
Training of
CHMT/SCHMT
in management
Identify
management
staff in need for
management
training
Training to be
conducted both
in County and
at Kenya
School of
Government
Irregular and
unstructured
administrative
and
programmatic
support
supervision to
community
units and
Health
Facilities
Inadequate
vehicles, Fuel
and funds for
support
supervision
Improving
supportive
supervision
thereby ensuring
up to-date
management
practices in use
across the
country;
Increase number
of usable
vehicles in the
department.
Identify
serviceable
vehicles for
repairs,
Procure one
additional
vehicle, and
dispose of non-
serviceable
vehicles.
Absent Health
Management
Structure thus
less
accountability
among
managers
The Country
lacked a
standardised
Health
services
Management
structure to be
adopted by
Counties
To adopt WHO
proposed
Standardised
Health Services
Management
Structure for
accountability
Proposed
structure still in
draft form but
can be adopted
for efficiency.
Install health
management
structures
Administrative
and support
Services for
Health
Inadequate
support services
to technical
officers in the
department of
health, affecting
the
responsiveness to
health needs of
the community
Inadequate
logistics for
administrative
support
including
office
supplies,
airtime, office
space
Failure to avail
finances to the
Health
Administrative
and support
unit.
Improve finding
mechanism for
County Health
Administrative
Services
Develop
Financial Cash
Flow and
Procurement
plans for the
department of
Health
Creation of
County Health
Services
Account
Inadequate
utility
transport for
operations
Old
unserviceable
utility
vehicles,
failure to
purchase
utility vehicle
replacement
over long
time.
Increase number
of reliable utility
vehicles in the
department
Develop
inventory of
serviceable
vehicles in the
department.
Have a vehicle
maintenance
log in the
Health
Administrative
Department
Inadequate
and unreliable
Inadequate
servicing of
Improve patient
and specimen
Take stock of
the state of
Have a vehicle
maintenance

91
Sub-Program Developmental
Issues/Problems
Causes Development
Objectives
Immediate
Objective
Strategies
emergency
transport
ambulances
leading to
frequent
breakdowns
referral services
in the County
existing
ambulances in
the County
log in the
Health
Administrative
Department
Inadequate
allocation for
fuel
Failure to
decentralise
fuel to the
department,
and lack of
accountability
for the same
Improve service
provision and
mobility in the
department,
including referral,
supervision and
disaster response.
Liaise with
procurement
department to
have
procurement of
fuel expedited.
Decentralise
fuel
management to
departmental
level
Health
Financing
Inadequate
financing for
Health services
Proportion of
County budget
allocated to
Health
Low
percentage of
County budget
allocation to
Health
department
Increase
Equitable share
financing for
health to 30%
Progressively
increase the
percentage with
aim of getting to
30%
CECM health
to lead in
advocacy with
Governor,
Deputy
governor and
County
Assembly.
Alternative
sources of
Health
Financing
Low Health
Insurance
penetration in
the County
resulting in
high out of
spending on
Health
Increase
awareness on
NHIF registration
Working with
NHIF County
Office, increase
awareness on
the NHIF use.
Leverage on
Linda mama
project to
increase
enrolment, Use
health facilities
and
Community
units as
recruitment
units into
NHIF
Consolidating,
expanding (new
and existing) and
coordinating
social health
subsidy
mechanism for
the poor with a
view of achieving
universal
coverage
Poor families
that cannot
afford to register
for NHIF be
provided with
subsidy to be
able to register
Use of
Community
Units, chiefs,
ward and Sub
County
administrators
to identify
qualifying and
vulnerable
community
members for
consideration
Low
leveraging on
Donor
Financing for
Health for
enhancing
outcomes.
Enhance
leveraging on
donor support
Identify and
map out
potential
stakeholders
with interest in
the County
Health Services
Hold
stakeholder
forums to
identify the
available and
untapped
funding
streams for
health services
Limited
leveraging on
Public- Private
Partnerships to
enhance health
outcomes
Increase
leveraging on
opportunities
provided by
private health and
non-health sector
to improve health
outcomes
Identify and
map out
potential
stakeholders
with interest in
the County
Health Services;
All private
health operators
to be gazetted,
Appoint and
facilitate
Departmental
PPP focal
person to
coordinate the
activities

92
Sub-Program Developmental
Issues/Problems
Causes Development
Objectives
Immediate
Objective
Strategies
and to report in
the DHIS
assisted by the
County
department of
Health
Human
Resources for
health
Inadequate
Human Resources
for Health in the
County
Low Doctor:
patient ratio of
1:26,115.
Absence of a
staff retention
policy despite
efforts to
recruit
Adopt WHO
staffing norms
and standards
Take stock and
advise CPSB,
HR, Finance on
the available
slots vs.
availability of
funds
All hospitals to
offer routine
and emergency
services for 24
hours daily
Low Nurse:
Patient ratio of
1:1700
Small number
of nurses in
post
Adopt WHO
staffing norms
and standards
Take stock and
advise CPSB,
HR, Finance on
the available
slots vs.
availability of
funds
Recruitment,
Develop a
retention
policy
Low Clinical
officer: Patient
ratio of 1:
4300
Small number
of Clinicians
in post
Adopt WHO
staffing norms
and standards
Take stock and
advise CPSB,
HR, Finance on
the available
slots vs.
availability of
funds
Recruitment,
Develop a
retention
policy
Low
Nutritionist:
Patient ratio of
1:11,000.
Inadequate
number
recruited
Adopt WHO
staffing norms
and standards
Take stock and
advise CPSB,
HR, Finance on
the available
slots vs.
availability of
funds
Recruitment,
Develop a
retention
policy
Lack of
clinical
specialists in
the County
Absence of
county
Specific
Training
Needs
Assessment to
establish skills
mix need
Department to
have a five year
Training Needs
Assessment
report that is
implementable
Identify missing
skills and
provide support
for deserving
staff to pursue
training.
Support staff to
undertake
specialization
causes.
Adopt a
specialists
sharing
mechanism
with
neighbouring
Counties
Absence of
facilities for
leveraging on
distance
learning for
health workers
Establishment of
a Resource
Centre at Hola
CRH for staff
development/ E-
learning
Identify site and
equip as
resource centre
To have a
centre that can
be used to link
up staff
training in the
county with
other
organizations
e.g. AMREF,
University of
Nairobi
Leverage on
specialists
from
neighbouring
counties and
Central
Government

93
Sub-Program Developmental
Issues/Problems
Causes Development
Objectives
Immediate
Objective
Strategies
Poor retention
of competent
health workers
Due to limited
out of work
opportunities
occasioned by
the hardship
area
Improve staff
retention for
stability and
continuity of
services
Identify
sustainable and
implementable
staff retention
mechanisms
Identify
incentives for
staff retention
including
Training,
Promotion, and
Certification.
Access to Essential Health Services
Access to
essential and
specialized
health services
Limited access to
high quality
Health Services
within an
acceptable
distance for all
community
members
Population
lack access to
basic health
services within
5 km.
Low number
of facilities
despite the
expansiveness
of the County
Operationalizatio
n of completed
but unopened
and facilities
Take stock of
staffing and
equipping needs
for the facilities
Recruitment of
staff, induction
and
deployment;
Equipping and
stocking of the
facilities
Low number
of facilities
especially in
the hinterland
parts of the
County
Completion of
stalled facilities
Take stock of
unfinished
facilities
Review
Implementatio
n status of the
facilities for
completion
Scaling up of
Outreach
Services in
underserved parts
of the County
Identification
and planning for
underserved
sites
Health
facilities to
plan and
present reports
on underserved
areas in their
coverage
regions and
implement.
Limited
utilization of
rural health
facilities due
to limitation in
variety of
services
Increasing the
utilization of
services at lower
levels of the
health services
and reduce self-
referral to the
higher
levels of care;
Community
units to create
demand in the
community on
services
Community
action and
dialogue days
Accelerating
initiatives
targeting
nutrition services,
family planning,
immunization,
sanitation and
safe motherhood
Increase sites in
the County
offering these
services.
All health
facilities to
offer
Community
nutrition,
family
planning,
immunization
and community
sanitation
promotion
services
Low
availability of
EMOC
services
Lack of ability
to handle
critical
maternal cases
e.g. those
needing High
Dependency/
Intensive care.
Upgrade Hola
CRH to a fully
functional
referral Hospital
Increase
diversity of
services offered
at Hola County
Hospital
Renovation,
adequate
equipping and
staffing of
Hola County
Hospital to
offer
specialized
services
Limited
number of
facilities
Increase facilities
in the County
offering
Emergency
Elevate Ngao,
Garsen, Bura,
Kipini and
Bangal to offer
Complete
theatres at
Garsen, Bura

94
Sub-Program Developmental
Issues/Problems
Causes Development
Objectives
Immediate
Objective
Strategies
offering
EMOC
Obstetric Care
services
Comprehensive
EMOC services
Plan for theatre
and ward
spaces at
Kipini, and
Bangal.
Hola County
Referral
Hospital
Hola Services
lacks ability to
offer diverse
Health care
services,
including ability
to handle mass
casualties
Lack of
continued
focused
investment of
resources in
the Hospital
over many
years
Inadequate
and ill
equipped
clinical rooms
for clerking
patient.
Hospital is in an
old design and
equipping the
existing room has
had the least
priority
Restructure and
redesign the
hospital
architecture.
Refurbish and
renovate the
already
existing rooms.
Equip the
rooms with the
requisite basic
lifesaving
equipment
Absence of a
designated
Accident
&Emergency
area at the
hospital
leading
delayed
response
during the
emergencies
Poor and old
structural design
No room or
designated area
provided for such
response
Prepare the
master plan of
the general
outpatient unit
Establish a long-
term Training
Need
Assessment for
all the front and
first contact
officers on
emergency
response and
Basic Life
Support (BLS)
and Advanced
Trauma Life
Support (ATLS)
Allocate a
designated area
for emergency
response; to
train the
healthcare
providers on
the BLS and
ATLS
Purchase the
basic
equipment
needed for
emergency
response.
Poorly set
minor theatre
Old structural
designs
Develop a more
descent plan on
the minor
theatre
Refurbish and
renovate the
already
existing minor
theatre
Inadequate
space for
running
services like
laboratory and
paediatric
units
Increased
demand of
services and new
inventions
New technologies
on diagnosis and
equipment
Establish new
extensions for
the lab, and
paediatric
departments
Redesign the
already
existing
structures to fit
the new
demands.
Long waiting
time and turn-
around time
for most
services-
there’s need
for automation
of the services
Lack of
integrated
information
systems
Install an
integrated
information
system to all the
departments
Work with
other partners
to establish an
integrated
HMIS
-to recruit IT
experts to fast
track the
establishing of
the systems.
Human
Laboratory
Services
Very low access
to human
laboratory
services
Very few
facilities have
staffed,
equipped and
functional
laboratories
Limited
investment in
laboratory
services
Increase number
of labs, equip and
staff the labs
Open up/
equip/staff
existing labs
Stock up staff
unopened labs.
Progressively
construct labs
in facilities
without the
service.

95
Sub-Program Developmental
Issues/Problems
Causes Development
Objectives
Immediate
Objective
Strategies
Clinical
Services
Unavailability
of Specialised
Health
Services
Absence
Clinical
specialists in
the County
with limited
retention
capacity
Most specialists
are unwilling to
serve in the
hardship
Counties
Train specialists
among staff
serving in the
County /
Employ clinical
specialists and
retain
Conduct urgent
Training needs
assessment,
and implement.
Establish
Specialists visits
program in the
County
Hold a
stakeholders
meeting with
willing
partners,
including
AMREF, Kilifi
and Mombasa
Counties to
establish
specialist visit
program
Ineffective
rapid referral
system
Limited
knowledge on
effective
referral of
patients and
specimens
amongst
health workers
and health
managers
Training of health
managers and
health workers on
the National
Refferal strategy
Domestication
of the National
Referral strategy
at the County
Level
Documentation
of all referred
cases,
identification
of Refferal
focal persons,
with formal
review
meetings held
quarterly
Lack of
feedback on
the outcomes
of referrals
within and
without the
County.
Improving
reverse referral
and feedback
information
system;
Health
Products and
technologies
Poor quality of
health services
Shortage of
essential
medicines and
medical
supplies;
Unavailability
of
commodities
quantification
and
procurement
plan due to
limited
financial
support to the
Pharmacy
department for
supervision
Institutionalize
regulatory
framework for
the control of
health products,
health product
research and
technologies
Regular
procurement of
commodities
from reputable
suppliers
Renewal of
Memorandum
of
understanding
with KEMSA
Establish
Memorandum
of
Understanding
with Mission
for Essential
Drugs Supplies
(MEDS) for
supply of
Specialised
commodities
Inadequate
safe storage of
health
commodities
Limited
storage space
at buffer
stocks storage
facilities
Establish
strategic storage
facilities in the
County for buffer
stocks
Identify one
facility per Sub
county for
handling buffer
stocks
Construct drug
stores at Hola,
Garsen and
Bura for buffer
stocks
Inappropriate
drug storage
facilities in
some of the
Use proper drug
storage
mechanisms in
the health
facilities
Provision of
Drug shelves,
pallets and
fridges in rural
health facilities
Rural Health
facilities to be
encouraged to
fabricate
shelves and

96
Sub-Program Developmental
Issues/Problems
Causes Development
Objectives
Immediate
Objective
Strategies
rural health
facilities
pallets using
User Fees
foregone
reimbursement
Accumulated
stock of
expired drugs/
commodities
Unavailability
of mechanism
for disposal of
unusable
commodities
Stock taking of
all expired
commodities in
the County
Relocation of al,
expired
commodities to
Hola Hospital
for disposal.
To document
and implement
drug disposal
plan by June
2018
Reproductive, Maternal Neonatal Child and Adolescent Health, And Nutrition
Reproductive,
Maternal,
Neonatal and
adolescent
health program
High Maternal
Mortality rate of
395/100,000 live
births
National-
362/100,000 live
births; High
Neonatal
Mortality rate of
39/ 1000 live
births
National
29/100,000 live
births (KDHS
2014)
Limited access
to quality
Reproductive,
Maternal,
Neonatal and
adolescent
health services
with adverse
effects
Low 4th
Antenatal visit
(62.3% for
Coast region)
Increase
proportion of
mothers attending
4th antenatal Care
visit.
Increase sites in
the County
offering Ant
Natal care.
All facilities to
offer ANC, All
outreach sites
to offer ANC
services
Low skilled
birth
attendance
( 48% for
Tana River)
Increase
proportion of
mothers
accessing skilled
delivery services
All Health
facilities to have
capacity to
conduct
deliveries in the
County
Equip
facilities,
update health
workers, and
conduct
support
supervision.
Low iron/
folate uptake
during
pregnancy
Increase uptake
of Iron and Folate
among expectant
mothers
Increase
availability of
Iron and folate
to mothers at
community
level.
Use
community
Health workers
to deliver Iron
and folate at
Household
level to
pregnant
mothers
Delayed
management
of obstetric
emergencies
Increase access to
EMOC services
Develop more
facilities to offer
EMOC services
Target to have
Hola, Bura,
Garsen, Ngao,
Kipini and
Bangal as
EMOC Centres
Streamline
emergency
referral services
Domesticate the
Refferal
Strategy in the
County
Get health
workers
trained, avail
vehicles, avail
fuel.
Low
identification
of High risk
obstetric cases
Strengthen
outreach systems
for provision of
health services to
marginalized and
vulnerable
populations
Map out
underserved
populations and
the link facilities
All facilities to
map out
catchment
populations
that will
benefit from
outreaches
among their
catchment
population.
Low uptake of
postnatal care
services
Increase
proportion of
mothers attending
postnatal care.
Keep records of
mothers that
deserve post
natal care that
defaulted.
All facilities to
track mothers
post delivery
High Fertility
rate resulting
in large family
size with
constrained
resources
Low uptake of
Modern
Contraceptive
methods
Increase uptake
of modern
contraceptive
methods
Develop a
Costed County
Family Planning
Action Plan
Desegregate
Family
Planning
uptake and
gaps by Sub
County and

97
Sub-Program Developmental
Issues/Problems
Causes Development
Objectives
Immediate
Objective
Strategies
Facility for
effective
response.
Poor quality
neonatal care
services
Limited
availability of
Neonatal care
services sites
in the County
Increase
availability of
Neonatal care
services in the
County
Establish a
comprehensive
New born unit in
each Sub
County
All facilities
connected to
power to offer
basic neonatal
care and
referral
services
Improve
neonatal care in
facilities without
incubators
All facilities to
offer Kangaroo
care training to
mothers.
Inadequate
availability of
adolescent
Health
Services
Inadequate
programmatic
budgeting for
Adolescent
Health
services
Institutionalize
Adolescent
Health Services,
and progressively
roll out the
services in the
County
Establish
adolescent
Health services
in all hospitals
in the County by
202
Capacity
building of
health
providers and
identifying
sites for Youth
Friendly
Services
Adoption of
the adolescent
Health Policy
Child Health High Infant
Mortality Rate of
44/1000.(National
-39/1000)
(KDHS 2014)
Low quality
Integrated
Child Health
Services
Limited access
to child health
services
Increase number
of units offering
Integrated
Management of
Child Illnesses
Open up
facilities in far
to reach areas;
Use of
outreaches to
reach more
children with
high impact
interventions
Progressive
improvement
of access to
IMCI services
in the County
Extended
Program on
Immunization
Low coverage of
fully Immunized
Child
Limited access
to EPI services
due to
distances
between
facilities
Few facilities,
vast distances
between
facilities
Increase number
of facilities
Use outreaches
to reach far
lying villages
Progressive
improvement
of access to
EPI services
Nutrition Global Acute
Malnutrition rate-
13.7 %; Stunting
Rate of 27.8.
(SMART survey
2017)
Low
micronutrients
coverage-
VAS, IFAS
Stock outs,
inadequate
knowledge,
inadequate
,poor
documentation
, lack of
outreaches
capacity
among staffs
Train staffs,
CHVs on VAS,
IFAS forecasting.
Procure adequate
supplements,
conduct routine
outreaches,
conduct data
audits, sensitize
the community
on the importance
of VAS, IFAS
Train at least 60
staffs on VAS,
IFAS, conduct at
least 30 radio
spots, 30
community
dialogues,
conduct routine
outreaches,
conduct routine
data audits,
conduct regular
supportive
supervision
Use of media
e.g. radio
spots,
community
strategy,
schools and
religious
leaders to
create
awareness on
the importance
of
micronutrients
to the
community.
Stock outs,
spoilage, theft
and pilferage
of nutrition
commodities
Inadequate
storage and
safe storage
space for
nutrition
commodities
Construct storage
facilities for
nutrition
commodities
Construct
storage facilities
in Hola, Garsen,
Bura, Madogo,
Ngao and Kipini
Construct
storage spaces
in 6 health
facilities for
nutrition
commodities-
Hola, Bura,
Madogo,

98
Sub-Program Developmental
Issues/Problems
Causes Development
Objectives
Immediate
Objective
Strategies
Garsen, Ngao
and Kipini
Unavailability
of specialised
nutrition
services-renal
nutrition,
diabetes
management,
enteral and
parenteral
nutrition
Inadequate
staff trained on
specialised
nutrition
services
Low enteral
and parenteral
care in the
wards, lack of
specialised
feeds for
inpatients
Identify staffs to
be trained on
specialised
nutrition services.
Train staffs on
specialised
services-
parenteral and
enteral nutrition,
renal nutrition,
nutrition and
diabetes
Train at least 10
nutrition officers
on nutrition
specialised
services, procure
specialised feeds
for inpatient
care
Classroom
training, On
Job Training
Continuous
Medical
Education
Low IMAM
Coverage at
the county
Stock outs,
poor
documentation
, poor
defaulter
tracing
mechanism,
distance to
health
facilities,
nomadic
lifestyle,
inadequate
capacity
among staffs,
inadequate
knowledge on
nutrition
among the
community
Conduct routine
data audit, train
health workers on
IMAM, defaulter
training, conduct
outreaches,
sensitise the
community on
the causes of
malnutrition
Conduct
quarterly DQAs,
train at least 60
staffs on IMAM.
Conduct
quarterly
supervision,
conduct monthly
outreaches in
every facility
Conduct
support
supervision,
use of
community
strategy, use of
ICCM, use
media- spots to
create
awareness
Missed
opportunities
in screening
and wrong
diagnosis for
malnutrition
cases
Inadequate
anthropometri
c tools for
screening
Inadequate
skills for
measuring and
interpretation
of the
anthropometri
c tools
To ensure health
facilities and
staffs have
adequate capacity
for
anthropometric
assessments
Procure
weighing scales,
weight boards,
MUAC tapes,
BMI calculators,
Sensitize health
workers on
anthropometric
assessments
Conduct
routine
anthropometric
assessments at
the facility and
community
level.
Inadequate
capacity to
respond in
emergencies
Inadequate
knowledge on
contingency
and response
planning
among the
staffs, poor
community
resilience
among the
community
Develop and
review
contingency and
response plans,
implement
IMAM Surge
model, conduct
annual SMART
Surveys, use of
monthly NDMA
bulletin
Train the
CHMT/SCHMT
s on contingency
planning, train
staffs on IMAM
Surge, conduct
annual SMART
Surveys create
an emergency
committee for
the department
Develop and
review
integrated
response plans,
implement
IMAM surge
Model,
strengthen
nutrition
surveillance
systems-use
NMDA
monthly
bulletin, annual
SMART
surveys

99
Sub-Program Developmental
Issues/Problems
Causes Development
Objectives
Immediate
Objective
Strategies
Low exclusive
breastfeeding
rates in the
county
Inadequate
knowledge on
MIYCN
among staffs
and the
community,
Train health
worker on
MIYCN,
sensitize the
community on
importance of
MIYCN,
establish
breastfeeding
rooms/resources
centres for staffs
Train 30 staffs
on MIYCN,
implement BFCI
in at least 10
CUs, conduct 20
radio spots,
Implement
MICYN
strategy, BFCI,
MALEZI
BORA,
Low
complementar
y feeding
among
children 6-23
months
Inadequate
knowledge on
complementar
y feeding at
the community
level,
inadequate
capacity of
staffs, food
insecurity
Establish an
inventory of all
the locally
available foods,
sensitize mothers
on
complementary
feeds
Train staffs on
complementary
feeding,
sensitize
community on
complementary
feeding,
establish
demonstrations
centres, use of
locally available
foods to prepare
complementary
feeds
Implement
complementary
feeding plan,
use of
MTMSG, link
the
Weak
integration
with other
departments in
addressing
nutrition
issues-
Agriculture,
Education,
Livestock,
NDMA
Weak
integration
among other
departments,
poor
coordination
Integrate vitamin
A, deworming,
integration in
ECDEs, conduct
coordination
meetings
Train all the
ECDE centres
on Vitamin A
supplementation
, deworming,
conduct bi-
annual vitamin
A
supplementation
in ECDEs,
introduce
kitchen
gardening in at
least 3 hospitals,
conduct
quarterly
coordination
meetings
Use of ECDEs
HIV/ AIDS, TB & Lung Diseases, Malaria
HIV/ STI
Control
Program
Increased HIV
prevalence rate
from 1% (2013)
to 2% (2017)
High number
of
undiagnosed
persons living
with
HIV/AIDs in
the
community,
with need to
put all on care
and treatment
Limited access
to HTS
High HIV and
AIDS related
stigma
Erratic supply
of HIV test
kits
Increase
availability of
HCT services
Increase HCT
sites in the
County
All HFs to
offer HCT
services
Conduct
integrated
outreaches that
offer HCT.
Avail HCT
services at
Community
level
Introduce HIV
self-testing
services in the
County
High
HIV/AIDS
incidence
Low HIV
knowledge
among the
community
Increase
knowledge in the
Community on
transmission of
Increase Health
promotion on
HIV prevention
and treatment
Use of mass
media

100
Sub-Program Developmental
Issues/Problems
Causes Development
Objectives
Immediate
Objective
Strategies
Cultural
practices that
increase HIV
risk
Limited access
to HTS
High HIV
stigma rate
Lack of
programs
targeting key
populations
Increasing
commercial
opportunities
within the
Counties
HIV and the
services
available.
Use of
Community
Strategy
Identification
of an HIV
prevention
ambassadors
Limited access
to Elimination
of Mother To
child
Transmission
of HIV
services
Increase in
HIV incidence
in the county
Low ANC
attendance
Low skilled
birth
attendance
Increase access to
Ante Natal
Services
Increase 4th Ante
Natal Clinic
visits
All health
facilities to
offer e-MTCT
services;
e-MTCT
services to be
offered during
outreaches
Prevention of
HIV among
the youth and
adolescents
Few HIV
programmes
targeting AYP
Peer influence
Prevent new HIV
transmissions
among the youth.
Increase
availability of
HIV prevention
services
targeting the
Youth
Use of Sports
in
disseminating
messages to the
youth.
Use of school
Health
Program to
disseminate
HIV messages
TB and Lung
Diseases
control and
care
TB case detection
of 90%;
Emergence of
Drug resistant
strains of TB in
the County.
High number
of
undiagnosed
TB cases in
the
Community
Limited
screening
opportunities
provided to
high risk cases
Increase facility
based screening
for TB
All facilities to
be empowered
to conduct
screening.
Capacity
building of
Health workers
on TB
screening and
reporting.
Increase
community based
case finding for
high risk TB
cases
All Community
units to be
empowered to
conduct
community TB
screening
To have all
Community
Units routinely
report on
number of
Community
TB cases
screening
conducted
Existent risks
of treatment
defaulters in
the
Community
Long
Distances to
Health
facilities
To increase
treatment success
rates to 100%
All patients on
treatment be
clearly
documented and
followed up till
end of treatment
Use
community
Strategy to
ensure patients
finish
treatment and
defaulters are
traced
Inadequate
follow up of
TB patients on
Limited
diagnostic
equipment for
To increase
number of
patients on TB
treatment tested
To increase
availability of
gene expert
machine
Increase
number of
Gene expert
machines;

101
Sub-Program Developmental
Issues/Problems
Causes Development
Objectives
Immediate
Objective
Strategies
first line
treatment
drug resistant
TB
for drug
resistance
availability to all
patients on TB
treatment.
Streamline
sample referral
Malaria
Prevention and
Control
Program
Occurrence of
surges in malaria
cases in the
County due to
increased seasonal
transmission
Intermittent
Malaria case
surges with
potential for
outbreaks due
to low
immunity in
the community
Inadequate
investment in
malaria
prevention and
Control
Increase number
of malaria
prevention and
Control
Interventions
being undertaken
in the County
Avail prevention
and control
mechanisms up
to community
level
Strengthen
disease
surveillance
Increase
availability of
case
management/
all facilities
Initiate
Community
Case
Management
Adopt
appropriate
Vector control
mechanisms
including mass
net
distribution,
clinic nets.
Conduct
targeted
residual
spraying.
Preventive and Promotive Health Services
Neglected
Tropical
Diseases
High prevalence
of Neglected
tropical diseases
in the Community
including
Schistosomiasis,
Lymphatic
Filariasis,
Intestinal worms.
Very low
action on the
vector/vermin
Inadequate
environmental
health
activities
Intermittent
health
promotion
Limited
availability of
surgical
interventions
No funding for
vector control
,environmental
and continued
health
promotion
activities
Limited of
awareness of
the effects of
NTDs
To accelerate the
reduction of
disease burden
through control,
elimination and
eradication of
NTDs
To reduce the
prevalence of
NTDs
To create
unfavourable
environment for
vectors and
vermin’s
To accelerate
health literacy
Funding of line
departments
MDA-Periodic
mass drug
administration
Funding and
community
involvement
for
environmental
changes
Empowerment
of Officers at
community
level
Organize
camps/Hire
expertize
Health
Communicatio
n and
Advocacy
Low
knowledge on
health
communicatio
n and
advocacy
skills among
health workers
No trainings
on health
communicatio
n and skills
( SBCC)
To capacity build
health workers
knowledge on
health
communication
and skills
(SBCC)
To train
CHMTs,
SCHMTs,
PHOs,/CHAs
and health
facility in
charges
Planning and
organising for
the training
Inadequate
health
communicatio
n and
advocacy
strategies on
MNCRH
issues and TB
No specific
health
communicatio
n and
advocacy
strategies on
MNCRH and
TB
To establish
specific health
communication
and advocacy
strategies for
MNCRH and TB
To develop and
distribute health
communication
and advocacy
strategies for
MNCRH and
TB
Design,
develop and
distribute
strategies

102
Sub-Program Developmental
Issues/Problems
Causes Development
Objectives
Immediate
Objective
Strategies
Low health
seeking
behaviour
among
community
members
Low
community
awareness on
health seeking
practices
To create
universal
awareness on
health seeking
practices among
community
members
To conduct
community
engagement
meetings on
health seeking
behaviour
Community
engagement
and
communication
.
Mass
communication
like Radio talk
shows and
Radio spots.
Weak
leadership and
partnership
coordination
for Health
promotion
Lack of strong
leadership and
partnership
coordination
mechanism for
Health
promotion
To establish
strong leadership
and partnership
coordination
teams at county
and sub county
levels
To identify
partners, form
an operational
HPAC
Quarterly
Partnership and
coordination
meetings.
School Health
Program
Increased risk of
exposure to
health risks by
students in
learning
institutions
Inadequate
conduct of
institutional
health
activities in
the County,
including food
safety and
quality school
meal, and
health
education
Inadequate
funding for
school Health
activities
To roll out
Institutional
Health program
in all the Sub
Counties
Adopt the
National School
Health policy in
the County
Develop a
Costed work
plan for roll
out of school
Health
Water,
Sanitation and
Hygiene
(WASH)
Frequent
outbreaks of food
and water borne
diarrhoeal
diseases in the
County
Low toilet
coverage (< 39%)
Extensive
open
defecation
practices
Community
behaviour,
attitudes and
practises
Soil type that
doesn’t
support toilets
To strengthen
behaviour change
and
communication
To enhance
ACSM activities
Conduct health
promotion and
hygiene
sessions to
community
members
Community
dialogue days
Training on
SBCC.
Distribute IEC
materials
Community
barazas
Strengthen
Community Led
total Sanitation
Program
(CLTS)
Train CHAs
and CHVs on
CLTS; Use
Community
units to trigger
and support
villages to
achieve and
maintain Open
Defecation
Free status
Lack of safe
water
Limited access
to safe water
and use at
household
level
To ensure
households
access safe water
To promote safe
water utilization
at household
level
Education on
water treatment
methods.
Procure and
distribute water
treatment
chemicals.
Procure and
distribution

103
Sub-Program Developmental
Issues/Problems
Causes Development
Objectives
Immediate
Objective
Strategies
water storage
containers
supported by
partners
Community
health strategy
Limited access to
community
Health services
Inadequate
primary health
care delivery
in tier one
Low
geographical
coverage by
community
units
To form,
operationalize
and link
community units
in all the health
facilities
To increase the
number of
community units
by establishing
and
operationalizing
4 community
units per year
Map all health
facilities,
Map the
catchment
population and
households,
through chiefs.
Poor quality
services
offered by
community
unit workforce
Services
offered by
untrained
CHEWS,
CHCS and
CHVS
To capacity build
community units
workforce.
To train and
conduct
refresher
trainings to all
existing and
newly
established
community units
workforce.
Training of
CHEWs the
CHCS and
CHVS.
Inconsistent
services
offered by
CHVS
High drop outs
of community
workforce due
to lack of
incentives
(monthly
stipend of
Ksh.2000) as
stipulated in
KQMH
To adopt and
domesticate the
National policy
for community
health services
To advocate for
the introduction
of monthly
stipend for
CHVS to retain
them in the
service
Advocate and
lobbying for
funding
Absence of
medical cover
for CHVS
CHVS not
covered by
NHIF scheme
To cover all
CHVS in Tana
River county
working in the
community units
in the NHIF
scheme
To introduce
medical cover
for community
work force at
tier one
The county to
develop a
policy to cover
CHVS in the
NHIF scheme
Register all
CHVs into
NHIF scheme
Weak CHS
reporting
system
Community
units not
assigned
MCHUL
codes, not
updated in the
DHIS, reports
from the
CHEWS not
uploaded in
the DHIS; No
desk top for
the county
CHS
coordinator,
official
documents are
retained in a
personal lap
top
To assign all
established
community units
MCHUL codes,
update them in
the DHIS and
uploads all MOH
515 in the
system;
The department
to procure a
desktop for
community
health services
The HRIOs to
be empowered
with AIRTIME
and own the
responsibilities
of uploading all
the reports from
the community
health services
in tier one
To assign a
health records
officer to
specifically
deal with
reports from
the community
units; To
procure a desk
top (Computer
for Focal
person) for
community
health services
Communicable
Disease
control,
Disease
Increased
incidence of
infectious
Many risk
factors for
infectious
disease spread,
Inadequate
infectious
diseases
surveillance,
To strengthen
infectious
diseases
surveillance and
Develop a
disease
surveillance and
outbreak
Retrain
Disease
surveillance
officers

104
Sub-Program Developmental
Issues/Problems
Causes Development
Objectives
Immediate
Objective
Strategies
Surveillance
and outbreak
Control
diseases outbreaks
in the County
including low
sanitation
status, water
shortage, low
quality water
use at the
household
level
outbreak
preparedness
and response.
control in the
County
response Action
Plan
Provide
logistics for
outbreak
investigation
and response
Non
Communicable
Diseases,
Injuries and
Mental Health
Increased
morbidity and
mortality arising
from non-
communicable
and lifestyle
diseases
Rise of cancer;
hypertension,
heart diseases
and diabetes;
Inadequate
screening for
chronic
diseases hence
late diagnosis
Establishing fully
fledged low –
cost diagnostic
centres and
provide adequate
screening and
treatment
facilities for
persons with
chronic or
terminal
conditions,
including cancer,
diabetes and
kidney failure
Roll out non
communicable
diseases
activities in the
facilities
All facilities to
incorporate
screening of
Non
Communicable
Diseases in
their Annual
work plans
Al facilities to
routinely report
on activities
targeting non
communicable
diseases
Establishment of
Palliative care
services at Hola
CRH
Establishment of
a facilitated
Palliative care
Team to oversee
establishment of
Palliative Care
Services
Undertake
refresher
updates to the
Palliative care
team and link
with Palliative
care Centre at
CPGH,
Mombasa for
bench marking.
Rise in road
traffic
accidents due
to improved
road network
and violence
Improve on
emergency
care
management
for better
management
of injuries
Increase number
of facilities with
capacity to offer
Accident and
emergency
services in the
County
Establish fully
functional
Accident and
Emergency
services in
selected health
facilities
Establish Fully
functional
Casualty Units
at Hola, Ngao,
Garsen, Bura
and Madogo
Facilities
Inadequate
Mental Health
Services/ drug
and alcohol
abuse
treatment
Services in the
County
Inadequate
skills in
handling
mental health
cases in the
County
Absence of a
dedicated Unit
for
management
of patients
with mental
illness
To establish and
increase number
of health facilities
offering quality
mental Health
Services in the
County.
Create a mental
unit in each Sub
County
Train mental
health Nurses,
and Clinicians,
Procure mental
health
commodities
Lack of
Dedicated
Counselling
Services Unit
in the County
Provide
Counselling
Services in the
County
Establish a
Counselling
Unit at Hola
CRH
Hire a
counsellor
Establish a
Counselling
unit

105
Sub-Program Developmental
Issues/Problems
Causes Development
Objectives
Immediate
Objective
Strategies
Emergency
Preparedness
and Response
Ineffective
preparation and
response to
emergencies with
resultant adverse
effects
Uncoordinated
response to
emergencies in
the County
with untoward
outcomes
Failure of
departments to
mainstream
Emergency
Preparedness
and Response
in their plans
Establish a
departmental
Emergency
Preparedness and
Response team
that will link up
with other
departments of
interest.
Develop a plan
in the
mainstreaming
emergency
preparedness
and response in
the Department
Identify a
coordinator,
Capacity
building,
Allocate funds
for EDE.
Develop and
implement
EDE plan.
Health Management and Information Systems, Operational Research, Monitoring and Evaluation
Health
Information
Management
Systems
Weak Health
service delivery
performance
monitoring
mechanism
Frequent
unavailability
of Reporting
tools
Inadequate
funding
To develop and
implement a
HMIS data
capture
commodity
procurement plan
Head of HMIS
to quantify and
provide the cost
of printing the
tools;
procurement
plan for printing
of tools to be
developed.
To obtain soft
copy of tools to
be printed
Procurement of
printing and
distribution
services
Inadequate
airtime for
data entry
Inadequate
finding
To provide a
budget for airtime
for the HMIS
department
Funds allocated
for data entry
every year
To issue AIEs
to the technical
officers
Irregular data
review forums
and data
quality audits
Inadequate
funding
To conduct
quarterly data
review and
quality audit
forums in all Sub
Counties
The department
to provide funds
for the activity
Provide
facilitation
(funds , fuel,
airtime) to the
County Health
Records
department to
take lead.
Inefficient
Health
documentation
in Health
facilities
All health
facilities are
using manual
health data
capture
methods
To adopt use of
paperless
documentation
systems in the
Level 4 Hospitals
Roll out
paperless data
capture systems
in the hospitals
gradually
To roll out
paperless
systems at
Hola, Ngao,
Bura, Garsen,
Madogo.
Health
Research and
Innovation
Limited use of
Health
Information data
for context
specific decision
making in the
County
Limited
conduct of In-
County
research by
both County
staff and Out-
County
institutions
Limited
collaboration
between
County
departments
and learning
institutions/
partners
To develop two
research
questions yearly
to address local
health needs
Conduct Health
research in the
County using
local data
Mainstreaming
Research and
Development in
Health:
Biannual
stakeholder
forums to
identify
interested
partners.

106
a. Sector Programmes Sub-
Programme
Key Outcome Key
Performance
Indicators
Planned Targets Total
Budget
(M) Year 1 Year 2 Year 3 Year 4 Year 5
Target Cost
(M)
Target Cost
(M)
Targe
t
Cost
(M)
Target Cost
(M)
Target Cost
(M)
Program 1: General Administration, Human Resources, Planning and Support Services
Administrati
on and
Support
Services
Renovation of
the
Administration
blocks for
CHMT/SCHM
T
No. Renovation of
the
Administration
blocks for
CHMT/SCHMT
3 15 1 5 0 0 0 0 0 0 20
All Health
facilities be
benefit from
both
management
and
programmatic
support
supervision
Average Number
of Administrative
and Programmatic
Support
supervisions
conducted per
facility
96
5 96 5 96
5 96 5 96 5 15
Improve
finding
mechanism for
County Health
Administrative
Services by
2018/2019 FY
Allocation for
Administrative
department/
Support Services
(Kshs)
7
7 7 7 7 7 8 8 10 10 39
All
development
projects are
effectively
supervised by
Project
Development
Committees
Proportion of
Projects
effectively
supervised by
PMCs
100 6 100 9 100 10 100 11 100 11 47
Increase
reliable and
Serviceable
utility vehicles
to at least six
by 2022
Number of new
utility vehicles
procured per year
1 8 1 8 1
8 1 8 1 8 40

107
Sub-
Programme
Key Outcome Key
Performance
Indicators
Planned Targets Total
Budget
(M) Year 1 Year 2 Year 3 Year 4 Year 5
Target Cost
(M)
Target Cost
(M)
Targe
t
Cost
(M)
Target Cost
(M)
Target Cost
(M)
Improved
efficiency of
operations and
Refferal
services
Amount of money
allocated for fuel
(Kshs)
15 15 20 20 25 25 30 30 30 30 120
Raise revenue
by disposing
off unreliable/
n
Unserviceable
utility vehicles
Number of
vehicles disposed
of
12 7 - - - - - - - - 7
Improve
efficiency of
Transport in
the department
No. of vehicles in
the department
maintained and
serviced
25 15 26 20 27 20 28 25 29 30 110
Improve
efficiency in
patient referral
mechanism in
the County
Number of
ambulances
procured
3
30 3
30
-
- - - - - 60
Improved
efficiency of
field officers
to carry out
activities
Number of
motorcycles
procured
15 7.5 10 5 - - - - - - 12.5
Provide boat
ambulance at
Ozi
Number of water
ambulances
procured
- - 1 7 - - - - - - 7
Human
Resources
for Health
Training needs
assessment
conducted
Training Needs
assessment report,
reviewed
annually.
1
0.05 1 0.05 1 0.05 1 0.05 1 5 0.15
CHMT/
SCHMT
trained in
Senior
Management/
Strategic
Number of staff
trained in Senior
Leadership at
Kenya School of
Government/
Strategic
Management
10 2 10 2 10 2 10 2 10 2 10

108
Sub-
Programme
Key Outcome Key
Performance
Indicators
Planned Targets Total
Budget
(M) Year 1 Year 2 Year 3 Year 4 Year 5
Target Cost
(M)
Target Cost
(M)
Targe
t
Cost
(M)
Target Cost
(M)
Target Cost
(M)
Management
by 2020
To have a fully
functional
Departmental
Resource
Centre by end
of
FY2018/2019
Staff resource
centre established
- - 1 8 - - - - - - 8
Health
Financing
To
Progressively
increase
percentage of
equitable
allocation to
health from
20% to 30%
by 2022
Percentage of
equitable share
allocated to health
per year
24 - 26 - 28 - 30 - 30 - -
To increase
sourcing of
donor support
for Health
Number of donors
reached for
support/
Number of
concept notes
presented per year
2
0.05 2
0.05 2
0.05 2
0.05 2
0.05 0. 25
To ensure that
the County has
key specialists
in the
department of
Health by
2022 from
various cadres
Number of
officers bonded
and assisted to
specialize every
year.
5
0.1 5
0.1 5
0.1 5
0.1 5
0.1 0.5
Re-establish
scheduled
clinical
specialist visits
in the
department.
Number of
clinical specialist
visits made per
year.
24
2.5 24
2.5 24
2.5 24 2.5 24 2.5 7.5
Program 2: Essential Health Services

109
Sub-
Programme
Key Outcome Key
Performance
Indicators
Planned Targets Total
Budget
(M) Year 1 Year 2 Year 3 Year 4 Year 5
Target Cost
(M)
Target Cost
(M)
Targe
t
Cost
(M)
Target Cost
(M)
Target Cost
(M)
Improved
access to
basic
essential
Health
Services
Operationalize
completed
health
facilities
Number of new
completed
facilities
operationalized
7
0.7
6
0.6 - -
- - - - 1.3
Complete
stalled health
facilities
Number of stalled
facilities
completed and
operationalized
5 50 2 20 - - - - - - 70
Renovation of
health
facilities
Number of
facilities
renovated
3
9
3
9 4 12
- - - - 30
Construction
of Maternity
in-patient
facilities
Number of new
maternity units
constructed and
operationalized
2 40
2
40
3
60
2 40 - - 180
Establish new
health
facilities
Number of new
facilities
constructed
3 30 3
60 4
80 2 40 0 0 210
Construction
of theatres
Number of
functional theatres
constructed
1 8 2 40 - - 2 40 - - 88
Construction
of Mortuaries
Number of
Mortuaries
Constructed and
operationalized
1 30 2 20 2 20 - - - - 70
Construction
of Incinerators
Number of
incinerators
constructed
1 5 2 10 2 10 2 10 - - 25
Construction
of Staff
Houses in
Health
facilities
Number of Staff
Houses
constructed
4 28 4 28 4 28 4 28 4 28 140

110
Sub-
Programme
Key Outcome Key
Performance
Indicators
Planned Targets Total
Budget
(M) Year 1 Year 2 Year 3 Year 4 Year 5
Target Cost
(M)
Target Cost
(M)
Targe
t
Cost
(M)
Target Cost
(M)
Target Cost
(M)
Fencing of
health
facilities
No. of health
facilities
5 25 5 25 5 25 4 20 4 20 115
Electrification
of facilities
No. of health
facilities
3 1 3 1 3 1 3 1 3 1 5
Backup
generators
Number of
facilities fitted
with backup
generator
1 10 2 20 1 10 - - - - 40
Equipping of
facilities
Proportion of
health facilities
adequately
equipped
50
20
80
40
100
50
100 40 100 30 180
Renovation
works at Ngao
hospital
% level of
completion of
renovation works
- - 100 30 - - - - - - 30
Construct
Accident &
Emergency
Units
Number of
facilities with
functional
Accident &
Emergency
Units(out of Hola)
- - 2
20 2 20 2 20 - - 60
Renovation
and upgrading
of Hola CRH
% level of
completion
renovation of
Outpatient block
100 40 - - - - - - - - 40
% level of
completion
renovation of
paediatric Unit
- - 100 10 - - - - - - 10
% level of
completion of
construction of
Accident and
Emergency Unit
- - 100 15 - - - - - - 15
% level of
completion of
construction of
- - 100 70 - - - - - - 70

111
Sub-
Programme
Key Outcome Key
Performance
Indicators
Planned Targets Total
Budget
(M) Year 1 Year 2 Year 3 Year 4 Year 5
Target Cost
(M)
Target Cost
(M)
Targe
t
Cost
(M)
Target Cost
(M)
Target Cost
(M)
Intensive Care
Unit/ High
Dependency Unit
% level of
completion of
renovation of In
Patient Unit
- - - - 100 15
- - - - 15
% level of
completion of
completion of
wards (2)
100 20 - - - - - - - - 20
% level of
completion of
completion of
Maternity Unit
100 15 - - - -
- - - - 15
% level of
completion of
renovation of
sewerage system
100 10 - - - - - - - - 10
% level of
completion of
completion of the
Cabro parking
yard
100 5 - - - - - - - 5
% level of
completion of
general
landscaping
100 1.5 - - - - - - - - 1.5
Increased
access to
diagnostic
health
services
Open new labs Number of labs
opened per year
3 1.5 3 1.5
3 1.5
3 1.3 - - 6
Construct new
laboratories
Number of labs
constructed and
operationalized
per year
- -
2
8
2
8
2 8 2 8 36
Equipping of
Laboratories
Proportion of
laboratories
adequately
equipped
50 10 75 15 100 20 100 23 100 30 98

112
Sub-
Programme
Key Outcome Key
Performance
Indicators
Planned Targets Total
Budget
(M) Year 1 Year 2 Year 3 Year 4 Year 5
Target Cost
(M)
Target Cost
(M)
Targe
t
Cost
(M)
Target Cost
(M)
Target Cost
(M)
Expand
capacity of
Hola Hospital
Laboratory
% level of
completion of Lab
at Hola CRH
- - 100 10 - - - - - - 10
Stocking of
laboratories
Number of
laboratories
adequately
stocked
100 10 100 20 100 25 100 35 100 35 125
Health
Products and
Technologie
s
Improve
commodity
availability in
the health
facilities
Proportion of
facilities receiving
quarterly medical
supplies
100 150 100 250 100 290 100 310 100 320 1420
Program 3: Reproductive Maternal, Neonatal, Child, and Adolescent Health and Nutrition
Maternal
Health
Improve
access to and
quality of
maternal
health services
in the County
Increase skilled
birth attendance in
the County from
42% to 80%
50 6 60 10 65 12 75 14 80 12 54
Neonatal
Health
Improve the
neonatal
outcomes in all
Health
facilities in the
County
Increase
proportion of
health facilities
offering basic and
Comprehensive
Neonatal Care
10 4 30 6 50 6 75 6 100 6 28
Extended
Program on
Immunizatio
n
Improved
immunization
coverage in the
County
Increase fully
immunized child
from 58% to 90%
58 5 70 10 75 10 80 10 90 10 45
Child Health
Services
Improve child
survival in
Tana River
Increase
proportion of
children under
five accessing
IMCI services
from 40% to 80 %
40 10 50 15 60 15 70 15 80 10 65
Adolescent
Health
Improved
access and
Increase sites
offering Youth
1 1 3 3 6 3 9 3 12 3 13

113
Sub-
Programme
Key Outcome Key
Performance
Indicators
Planned Targets Total
Budget
(M) Year 1 Year 2 Year 3 Year 4 Year 5
Target Cost
(M)
Target Cost
(M)
Targe
t
Cost
(M)
Target Cost
(M)
Target Cost
(M)
utilization of
adolescent
health services
Friendly Services
from 0 to 12
Nutrition
Program
Improve the
nutrition of
residents of
Tana River,
with particular
attention to
Children and
pregnant
women
To reduce the
Global Acute
Malnutrition Rate
from 14% to less
than 5%
14 8 10 10 7 10 5 10 <5 10 48
Program 4: HIV/AIDS, TB & Lung Diseases, Malaria
HIV, AIDS
and STI
Control
Reduce HIV
transmission in
the County
Proportion of
Health facilities
providing
Comprehensive
HIV Services
from 40% to
100%
40 5 50 12 70 10 85 10 100 8 45
TB Control
and Lung
Diseases
Reduced
morbidity and
mortality due
to TB and
Lung diseases
Increase TB
detection rate
from 60% to 95%
60 2.5 70 5 75 5 80 5 95 5 22.5
Increase
In cure rate from
80% to 95%
80 85 90 92 95
Malaria
Prevention
and Control
Increase
access to
malaria
prevention and
control
services in the
Count
Increase Net use
from 65% to 90%
Increase access to
malaria diagnosis
and treatment
services to
The Community
Level
65 10 70 4.5 75 5 80 13 90 5 37.5
Program 5: Preventive and Promotive Health Services
Health
Communicat
Community
knowledge
about their
Proportion of
wards reached
40 3 100 5 100 5 100 5 100 5 23

114
Sub-
Programme
Key Outcome Key
Performance
Indicators
Planned Targets Total
Budget
(M) Year 1 Year 2 Year 3 Year 4 Year 5
Target Cost
(M)
Target Cost
(M)
Targe
t
Cost
(M)
Target Cost
(M)
Target Cost
(M)
ion and
Advocacy
health,
practices and
attitudes
towards better
health
improved.
with appropriate
Health Messages
School
Health
Program
Increase
coverage of
school Health
in the County
Increase
proportion of
schools reached
with school
Health Program
from 20% to
100%
20 1 40 2.5 50 2.5 65 2.5 90 1.5 10
Neglected
Tropical
Diseases
Reduced
prevalence of
non-
communicable
diseases
Increase number
of targeted
quarterly activities
focusing on
Filariasis,
Schistosomiasis
and snake bites
1 2 3 1 3 3 3 2 3 3 11
Community
Strategy
Increase
coverage of
the County
with
Community
Units
Number of new
functional
Community units
2 5 5 10 5 10 5 10 5 10 45
Communica
ble disease
Control,
Disease
Surveillance
Monitor
pattern of
communicable
diseases and
initiate
preventive
actions
Number of
focused quarterly
disease
surveillance
activities
conducted per
year
2 2 5 4 5 4 5 4 5 4 18
Water,
Sanitation
and Hygiene,
Community
Led total
Improved
water quality
Number of water
quality
surveillance and
treatment
activities carried
3 3 3 15 3 16 3 16 3 14 64

115
Sub-
Programme
Key Outcome Key
Performance
Indicators
Planned Targets Total
Budget
(M) Year 1 Year 2 Year 3 Year 4 Year 5
Target Cost
(M)
Target Cost
(M)
Targe
t
Cost
(M)
Target Cost
(M)
Target Cost
(M)
Sanitation
(WASH.
CLTS)
out yearly at
household level
Medical
waste
management
Safe handling
and disposal of
medical waste
in the County
Proportion of
health facilities in
the managing
medical waste
according to
guidelines
50 2.5 75 3 100 3 100 3 100 3 14.5
General
refuse
management
Improved
general
cleanliness of
urban and semi
urban centers
Quarterly inspect
refuse handling in
all urban and semi
urban Centres
4 2 4 4 4 4 4 4 4 4 18
Food quality Improve
quality of food
consumed in
the County
Quarterly
inspection of food
handling areas in
all wards
4 2 4 4 4 4 4 4 4 4 18
Human
waste
management
Construction
of public
toilets
Number of public
toilets constructed
3
9 5
15 5 15 - - - - 39
Emergency
Preparedness
and response
Have a disaster
preparedness
and response
team within
the Unit by
end of
2017/2018 FY,
reviewed
biannually
Number of
Disaster
Preparedness
meetings and
response activities
held per year
4 0.5 4 0.5 4 0.5 4 0.5 4 0.5 2.5
Program 6 : Health Management and Information Systems, Operational Research, Monitoring and Evaluation
Health
Management
and
Information
Systems
All Health
facilities to
report to the
KDHS II
system,
Conduct data
quality audit
Number of data
review meetings
held every year to
track quality and
performance
8 2 8 5 8 7 8 10 8 10 34

116
Sub-
Programme
Key Outcome Key
Performance
Indicators
Planned Targets Total
Budget
(M) Year 1 Year 2 Year 3 Year 4 Year 5
Target Cost
(M)
Target Cost
(M)
Targe
t
Cost
(M)
Target Cost
(M)
Target Cost
(M)
and review
quarterly
Print and
distribute data
tools to health
facilities
Proportion of
facilities supplied
with reporting
tools
100 10 100 13 100 17 100 20 100 22 82
Install
paperless data
systems in13
Health
Facilities
Number of
facilities fitted
with paperless e-
Health systems
1 10 2 20 3 30 2 20 2 20 100
Health
Research and
Innovation
Use of locally
available data
for making
context
specific
decision
making
Conduct
operational
research once
every year
1 2 1 2 2 3 2 3 3 4 14

117
4.4.5 Education
The Education Sector comprises of the following sub-sectors: Early Years Education; Vocational
Training; Adult and Continuing Education and Sports.
Vision
A competitive education, training, research and innovation sector for sustainable development
Mission To provide quality and basic education foundation for the young children; develop technical
skills and know-how for self-reliance; identify, develop and nurture sports talents to enhance
socio economic prosperity and cohesion.
Goal
The strategic objective of the sector is to deliver the highest possible quality Education and Social
Services to the resident. This is achieved through specific sub-sectoral goals which include the
following:
The goal of Early Years Education Goals is to offer quality education in early years education in
the County while that of Vocational Training is to equip the youth with relevant skills,
knowledge and attitude to enhance their capacity to engage in meaningful activities and to
mainstream and sustain Technical and Vocational training issues in relevant policies. The Adult
and Continuing Education sub-sector aims to eradicate illiteracy and promote lifelong learning
amongst adults and out of school youths to enable them make informed decisions, become self-
reliant and improve on their livelihood. The goal of sports is to promote Sports, Leisure and
recreational activities for social economic development.
Sector Development Needs, Priorities and Strategies Development issue Cause Development
objective
Immediate objective strategies
Low level of EYE
education
Inadequate
distribution of ECDE
centres; Inadequate &
inappropriate
teaching staff
Improved EYE
education
Increase accessibility
& retention in ECDE
centres; Increase
skills and no of
teaching staff for both
genders
Construction of
ECDE centres; In
servicing and
capacity building of
staff appropriate for
Tana river county;
Develop & adopt a
harmonized inter-
county approach to
address staff
recruitment training
and retention
Low access to
education
Inadequate learning
facilities
Improve accessibility
to education
Increase & improve
infrastructure
Construct and
renovation learning
facilities
Low sports activities Inadequate sports
facilities
Enhance sports
activities
Increase the no of
sports facilities &
participation by both
gender
Construction of
sporting facilities
Poor enrolment,
retention & transition
rates in secondary and
tertiary education
Poverty and
ignorance
Promote enrolment,
retention and
transition in secondary
and tertiary
institutions
Increase enrolment,
retention and
transition rates for
both gender in
secondary and tertiary
institutions
Establish county
bursary facilities by
gender; Sensitize the
community on
importance of
education for both
genders

118
Development issue Cause Development
objective
Immediate objective strategies
Low standards of post
early year education
Long distance to
schools
Nomadic lifestyle
To improve the
quality of post early
year education
Improve boarding
facilities for both
gender
Construction &
maintenance of
boarding facilities for
both gender
Poor access to
education among
PWDs
Ignorance amongst
parent; Unfriendly
education facilities
Improve the quality of
education among the
PWDs
To improve the
suitable infrastructure
for education among
the PWDs for both
gender
construction of
special schools &
modification of
existing institutions
to supports PWDs for
both gender
Poor quality of
vocational training
Poor facilities in
VTCs; Inadequate &
inappropriate
training staff
Improve the quality of
vocational training
Enhance quality and
equality of VTC
education
Increase skills and no
of training staff for
both genders
Construct and equip
VTC with modern
tools and equipments;
In servicing and
capacity building of
staff appropriate for
Tana River county;
Develop & adopt a
harmonized inter-
county approach to
address staff
recruitment training
and retention
High illiteracy level
within the
communities
Low distribution of
adult learning centres
Improve literacy level To improve quality
and equality of adult
learning facilities
Construct and equip
gender friendly adult
learning centres
Poor coordination and
engagement with
other players in the
sector
Unclear terms of
engagement;
Competing interest;
Poor information
flow channels
Improve coordination
and engagement with
stakeholders in the
sector
To enhance resource
mobilization and
efficiency resource
utilization
Establish stake holder
coordination
stakeholders forum

119
a Sector Programmes Sub
Programme
Key Output Baseline Key
performance
Indicators
Planned Targets
Year 1 Year 2 Year 3 Year 4 Year 5 Total
Budget
(M) Target Cost
(M)
Target Cost
(M)
Target Cost
(M)
Target Cost
(M)
Target Cost
(M)
Sector Programme 1.Quality and Standards assurance in ECDE, VTC, & Adult Education and Post EYE
Objective : To offer quality education foundation for growth and development
Outcome: High standards of education
Quality and
standards in
EYE
ECDE staff
trained
10 No of ECDE
staff trained
150 3 150 3 150 3 150 3 150 3 15
Quality
teaching/learning
standards
attained
30 Percentage
ECDE
centres
assessed
322 2 322 2 322 2 322 2 322 2 10
Learning
material supplied
to ECD Centres
52 No of centers
supplied with
learning
materials
322 10 322 10 322 10 322 10 322 - 50
Play & art
materials
supplied
- No of centres
provided
with play &
art materials
150 32.4 150 32.4 150 32.4 150 32.4 150 32.4 162
ECDE centres
connected with
ICT facilities
- No of
schools
connected
with ICT
facilities
30 5 30 5 30 5 30 5 30 5 25
Education
bursary provided
35 No pupils
benefited
from bursar
7,500 75 7,500 75 7,500 75 7,500 75 7,500 75 375
Quality and
standards in
vocational
training centres
Supplied
electricity to
improve training
50 No of VTC
electrified
1 1 1 1 1 1 1 1 1 1 5
Supplied tools &
equipments to
improve training
40 No of VTC
departments
equipped
2 8 2 8 2 8 2 8 2 8 40
Supplied
furniture to
improve learning
environment
30 Number of
VTCs
supplied with
furniture
2 3 2 3 2 3 2 3 2 3 15
Supplied ICT
equipments to
15 Number of
VTCs
2 2 2 2 2 2 2 2 2 2 10

120
Sub
Programme
Key Output Baseline Key
performance
Indicators
Planned Targets
Year 1 Year 2 Year 3 Year 4 Year 5 Total
Budget
(M) Target Cost
(M)
Target Cost
(M)
Target Cost
(M)
Target Cost
(M)
Target Cost
(M)
improve learning
and
communication
supplied with
ICT
equipments
Sports activities
conducted
- No. of sports
activities
conducted
1 1 1 1 1 1 1 1 1 1 5
HIV & AIDS
awareness
created
- No. of HIV
& AIDS
campaign
conducted
3 0.4 3 0.4 3 0.4 3 0.4 3 0.4 2
Planted trees for
conserved
environment
- No of trees
planted and
nurtured
120 0.4 120 0.4 120 0.4 120 0.4 120 0.4 2
Income
opportunities
created
- No. of
income
generating
activities
undertaken
6 3 6 3 6 3 6 3 6 3 15
Job created - No. of
functional
incubation
centers
constructed
and equipped
1 30 1 30 1 30 90
Practical skills
enhanced
50 No. of
trainees to
attach
100 0.4 100 0.4 100 0.4 100 0.4 100 0.4 2
Programme 2: Enrollment & accessibility in education
Objective : To improve access & enrollment in education institutions
Outcome : improved enrollment, access and retention
Enrollment &
accessibility in
ECDE education
Food stores
established
- No of food
stores
constructed
30 6 30 6 30 6 30 6 3 6 30
Renovated
ECDE centers
52 No of centres
renovated
9 13.5 9 13.5 9 13.5 9 13.5 9 13.5 67.5
Model ECDE
centres
- No. of Model
ECDE
centres
5 75 5 75 5 75 - - - - 225

121
Sub
Programme
Key Output Baseline Key
performance
Indicators
Planned Targets
Year 1 Year 2 Year 3 Year 4 Year 5 Total
Budget
(M) Target Cost
(M)
Target Cost
(M)
Target Cost
(M)
Target Cost
(M)
Target Cost
(M)
established in
major towns
Fenced ECDE
centres
20 No of ECDE
centres
fenced
15 22.4 15 22.4 15 22.4 15 22.4 15 22.4 112
Constructed
classes
30 No of ECDE
classrooms
constructed
15 60 15 60 15 60 15 60 15 60 300
Constructed
resource centres
- No of
resource
centres
constructed
1 15 1 15 1 15 - - - - 45
Electrified
ECDE centre
10 No of ECDE
electrified
15 3 15 3 15 3 15 3 15 3 15
Mainstreamed
PWD
- No of
secondary
schools
upgraded for
PWDs needs
- - - - - - 1 15 1 15 30
Supplied water
tanks
10 No of water
tanks
provided
60 1 60 1 60 1 60 1 60 1 5
Furniture
supplied
28 No of
furniture
supplied
1,500 6 1,500 6 1,500 6 1,500 6 1,500 6 30
ECDE teacher
college
established
- ECDE
college
- - 1 50 - - - - - - 50
Enrollment &
accessibility of
post-early Year
Education
Boarding
facilities for post
early child
development
established
10 No of new
boarding
schools
established
15 75 15 75 15 75 15 75 15 75 375
VTCs
constructed &
established
20 No of VTC
constructed
and
established
1 18.7 1 18.7 1 18.7 - - - - 56

122
Sub
Programme
Key Output Baseline Key
performance
Indicators
Planned Targets
Year 1 Year 2 Year 3 Year 4 Year 5 Total
Budget
(M) Target Cost
(M)
Target Cost
(M)
Target Cost
(M)
Target Cost
(M)
Target Cost
(M)
Better learning
environment
created
30 No of VTCs
renovated
2 2 2 2 2 2 2 2 2 2 10
Conducted
exhibitions
- No of
exhibitions
conducted
1 2 1 2 1 2 1 2 1 2 10
Subsidized
tuition offered
10 No of
trainees
benefited
from the
grant
400 6 400 6 400 6 400 6 400 6 30
Model VTCs
established
- A Model
VTC
established
- 1 1 30 - - - - - - 30
Mainstreamed
PWDs in
vocational
training
- No of
functional
centers
constructed
and equipped
with special
ICT and
educational
resources for
PWDs
1 40 40
Community
learning
resources
established
- No. of
Established
Community
learning
resource
centers
1 20 1 20 1 20 60
Model girls and
boys secondary
school
- No. of model
schools
- - - - 1 30 1 30 - - 60
Branding of Mau
Mau secondary
school
Memorial
park
- - 1 25 - - - - - - 25

123
Sub
Programme
Key Output Baseline Key
performance
Indicators
Planned Targets
Year 1 Year 2 Year 3 Year 4 Year 5 Total
Budget
(M) Target Cost
(M)
Target Cost
(M)
Target Cost
(M)
Target Cost
(M)
Target Cost
(M)
Enrollment &
accessibility in
adult &
Continuing
Education
Learning
materials
supplied
- No. of ACE
centers
provided
with learning
materials
15 0.4 15 0.4 15 0.4 15 0.4 15 0.4 2
Learning
materials
supplied
- No. of ACE
centers
provided
with learning
materials
15 0.4 15 0.4 15 0.4 15 0.4 15 0.4 2
Program 3: Sports Promotion, Participation and Inclusivity
Objective : to promote & improve sports standards
sports ,
participation,
promotion and
inclusivity
Sports stadium
&
grounds
constructed
Sports talent
constructed
- No of sports
ground
improved
1 3.5 3 10.5 3 10.5 4 14 4 14 52.5
- No of
playground
fenced
- - 2 9 3 13.5 3 13.5 2 9 45
- No of sports
talent
academy
established
- - - - - - 1 30 - - 30
Gymnasiums
constructed
- No of
gymnasiums
established
- - 1 9 - - 1 9 1 9 27
Sports kits
supplied
30 No of sports
teams
supplied with
kits supplied
100 20 5 20 5 20 20 5 20 5 25
Sports kits
supplied
Inter county
competition
conducted
- No buses
purchased
1 8 8
- No of inter-
county and
national
competitions
held
1 3 1 3 1 3 1 3 1 3 15

124
Sub
Programme
Key Output Baseline Key
performance
Indicators
Planned Targets
Year 1 Year 2 Year 3 Year 4 Year 5 Total
Budget
(M) Target Cost
(M)
Target Cost
(M)
Target Cost
(M)
Target Cost
(M)
Target Cost
(M)
Sports leagues
conducted
- No of county
sports
leagues
conducted
2 3 2 3 2 3 2 3 2 15
Sports leagues
conducted
Trained coaches
& referees
- No of
holiday
sports
tournaments
conducted
3 1.5 3 1.5 3 1.5 3 1.5 3 1.5 7.5
- No of
coaches &
referees
trained
50 1 50 1 50 1 50 1 50 1 5
Exchange
program
conducted
- No of
exchange
program
conducted
1 0.8 1 0.8 1 0.8 1 0.8 1 0.8 4

125
Cross-Sectoral Implementation Considerations
Education sector will value collaborations in programs that cut across various sectors for
implementation. The sector will focus on projects related to gender, PWDs, Drugs and substance
abuse, HIV/AIDs, Environment as well as publicity and sensitization. To harness cross sector
synergies in implementation of these programs the sector will ensure appropriate involvement of
key stakeholders.
Table 12: Cross-Sectoral impacts
Programme
Name
Sector Cross-sector Impact Measures to Harness or
Mitigate the Impact Synergies Adverse
impact
Early Years
Education &
VTC
Entrepreneur
ship
development
Provide market for
products and
services
Train more entrepreneurs
Finance &
human
resource
Staff promotion
and empowerment
-Prudent utilization of
available human resource
-Come up with alternative
income to supplement
allocations
Sports
services
Social
development
Promotes national
coexistence
-Conducting sports leagues.
-Conduct all-inclusive
sports participation
Vocational
training
services
Trade &
labour
mass production
of skilled labour
and enterprise
development
Produce demand driven
market oriented skilled
labour
County
bursary
Social
development
Identification of
needy students
High standard of education
and mentorship
Finance Disbursement of
funds
-Offer loans for tertiary
institutions
-Develop alternative
funding mechanism
4.4.6 Social Protection, Culture, Recreation and Special Programmes Sector
The Social Protection, Culture, Recreation and Special Programs Sector is made up of five
interrelated sub-sectors namely: Gender, Children and Social Development; Special Programs;
Heritage and Culture, and Youth Affairs.
Vision: Sustainable and equitable socio-cultural and economic empowerment for all county
residents.
Mission: To formulate, mainstream and implement responsive policies through coordinated
strategies for sustained and balanced socio-cultural and economic development of the county
and empowerment of vulnerable and marginalized groups and areas.

126
Goal
Culture, Gender and Social Services: To provide social welfare services and disability
Mainstreaming, youth development, gender and community services, promote, develop and
preserve culture, provide library and information services, rescue and rehabilitate, Orphans and
Vulnerable Children, Care for the Abandoned Aged.
Special Programmes: To enhance community’s capacities in preparedness to disasters, Reduce
disaster risks and enhance resilience building through appropriate interventions.
Sector Development Needs, Priorities and Strategies Development Issue Cause Development
Objective
Immediate Objective Strategies
Culture, Gender and Social Services Sub-Sector
Untapped cultural
potential
Inadequate cultural
development
services; Entrenched
negative traditions
To promote
develop, and
preserve cultural
heritage
To empower cultural
practitioners
Build talent academies,
libraries; capacity build
practitioners; conduct
learning visits
Socially and
economically un-
empowered
community
Inadequate social
and economic
development
structures;
Discrimination of
women in decision
making;
Retrogressive
cultural practices;
Low literacy levels
To empower
communities to
engage in socio-
economic
development
activities
To provide social
assistance and support to
community groups
Capacity building; cash
transfers; mainstream
gender issues
Neglected
Children/OVCs
Poverty;
Retrogressive
cultural practices;
Low literacy levels
To enhance child
protection services
To support communities
to respond to OVCs
issues
Conduct child rescue
missions; to raise
awareness on child
rights
Un employed youth Lack of employment
opportunities; Low
literacy levels; Lack
of appropriate skills
among the youth
To enhance the
capacity of youth to
engage in socio-
economic
development
To improve youth
participation in
community development
Capacity building;
conduct learning visits;
offer mentorship to the
youth
Special Programmes Sub -Sector
Drought risk Lack of adequate
rainfall; Inadequate
water supply; food
insecurity
Reduce
vulnerability to
drought
Promote resilience to
drought
Drilling of strategic
boreholes , construction
of shallow wells and
barkards; Construction
of strategic mega earth
pans; Implementation of
cohesion and food
security projects;
provide water trucking
services; Water
harvesting services for
food production;
Rehabilitation of
boreholes and shallow
wells; pasture
preservation techniques;
livestock breed
improvement; Capacity
building of
communities on disaster
risk reduction and
ending drought
emergencies

127
Development Issue Cause Development
Objective
Immediate Objective Strategies
Floods Heavy rainfall; weak
river banks
Save lives and
protect assets
Mitigate floods and
reduce vulnerability
Construction of dykes
and placement of
gabions along the weak
banks of the river Tana;
Construction of foot
bridges; purchase of
rescue boats and
lifesaving equipments;
Establishment of early
warning systems;
community capacity
building on community
managed disaster risk
reduction
Establishment of
evacuation centers
Conflict and security Competition over
scarce resources;
politics; Border
disputes
Peace and cohesion
among
communities in
Tana river
Promote peace for
sustainable development
Inter community dialog;
mapping of conflict hot
spots; community
policing; barazas and
peace forums; conduct
peace caravans and
peace tournaments
Conduct cultural
festivals; inter-county
peace meetings
Intercommunity
leaders and interfaith
meetings
Peace dividend projects
Provision of satellite
phones and transport
Diseases outbreaks Lack of adequate
preventive measures
Promote both
preventive and
curative measures
Reduce morbidity and
mortality
Promote hygiene and
sanitation services;
Routine immunization
and treatment; promote
safe water supply and
good nutrition services
Fire out breaks Poor town planning
and housing
conditions; Lack of
awareness and
capacity
Save lives and
build capacities of
communities
Enhance capacities for
communities for timely
response
Train fire champions;
support fire victims to
restore their livelihoods

128
a. Sub-sector Programmes – Social Protection Sub Program Key Output Baseline
(%)
Key performance
Indicators
Planned Targets
Year 1 Year 2 Year 3 Year 4 Year 5 Total
Budget
(M) Target Cost
(M)
Target Cost
(M)
Target Cost
(M)
Target Cost
(M)
Target Cost
(M)
Program: General Administrative and Support Services
Objective: To improve working conditions, enhance effectiveness, efficiency and accountability in service delivery.
Outcome: Efficient service delivery system
Administration Planning
and Support Services
Improved service
delivery
5 No of activities
completed on a timely
manner and to budget.
Strengthened
institutional capacity
20 51 20 51 20 51 20 51 20 51 320
Human Resource
Development(Recruitment
of staff)
Efficient and
targeted service
delivery
1 No. of officers recruited
and trained on service
delivery and
performance
management
60 21 10 3.5 10 3.5 10 3.5 10 3.5 35
Monitoring and Evaluation No of programmes
reviewed
1 No of M&E reports 20 10 20 10 20 10 20 10 20 10 50
Research, documentation
and dissemination
Focused sector
targets
1 Research reports
Dissemination reports
20 11 20 11 20 11 20 11 20 11 55
Sector Program: Culture, Heritage Creative Arts and Library Services
Objective: To promote, preserve and develop all functional aspects of culture for sustainable development.
Outcome: A culturally vibrant, tolerant and cohesive society
Culture Promotion and
Development
Structured and
refined county
cultural industry
5 County cultural
development
policy/strategy
1 10 10
Efficient cultural
practitioners
1 Database/Register of
cultural practitioners
1 0.5 1 0.5 1 0.5 1 0.5 1 0.5 2.5
Developed talent
among the cultural
practitioners
1 No. annual county
cultural
festivals/exhibitions/tale
nt shows held.
2 5 2 5 2 5 2 5 2 5 25
Reduced
prevalence of
retrogressive
cultural practices
1 No. community
education campaigns on
retrogressive cultural
practices conducted
3 1 3 1 3 1 3 1 3 1 5

129
Sub Program Key Output Baseline
(%)
Key performance
Indicators
Planned Targets
Year 1 Year 2 Year 3 Year 4 Year 5 Total
Budget
(M) Target Cost
(M)
Target Cost
(M)
Target Cost
(M)
Target Cost
(M)
Target Cost
(M)
Cohesive society 1 No. of community
cultural institutional
structures strengthened
1 1 1 1 1 1 1 1 1 1 5
Observe and
support National
and International
(public) days
1 Number of National and
International (public)
days observed and
supported
4 2 4 2 4 2 4 2 4 2 10
Empowerment/Capacity
building of cultural
practitioners
Skilled cultural
practitioners
250 No. cultural
practitioners trained and
empowered
1000 1 1000 1 1000 1 1000 1 1000 1 5
Distinct county
cultural brand
developed
1 No. community learning
visits/exchange tours
conducted
2 5 2 5 2 5 2 5 2 5 15
Cultural Infrastructure
Development
Provision of
modern and
functional venues
of culture and
heritage
promotion.
1 No. county cultural
centers Libraries and
Citizen documentation
services /museums/
constructed and
operationalized
3 60 3 60 3 60 180
Cultural research
centre
0 No. of cultural research
centres established
1 30 - - - - - - - - 30
Community resorts 0 No. of community
resorts established
- - 1 30 - - - - - - 30
Heritage sites
renovated and
preserved
- No. of cultural heritage
sites developed
3 16.7 3 16.7 3 16.6 50
Sector Program: Child Protection
Objective: To ensure efficient and effective Child Protection, Care and Support Systems in the County
Outcome: Children are protected from abuse, exploitation, neglect and violence
Establishment of Children
Rescue Centres
3 Children rescue
centers established
and equipped as
per gender needs.
- No. of Rescue Centers
established.
1 20M 1 20M 1 20M 60 M
Conduct children rescue
missions
120 children
rescued protected
and in safe
environment
5 No. of reports 1 1 1 1 1 1 1 1 1 1 3M

130
Sub Program Key Output Baseline
(%)
Key performance
Indicators
Planned Targets
Year 1 Year 2 Year 3 Year 4 Year 5 Total
Budget
(M) Target Cost
(M)
Target Cost
(M)
Target Cost
(M)
Target Cost
(M)
Target Cost
(M)
Enhanced coordination in
operations
Children supported
with integrated
protection services
Children rescued
from potential
abuse and violence
2 No. of successful child
protection missions
facilitated.
3 27.9 27.9
Children protected
including during
emergencies
Improved child
welfare during
emergencies
- No of reports 2 6 4 6 2 2 2 2 2 6 30
Baseline Survey for OVC Reliable planning
for OVC in the
County
3,500 OVCs
benefiting from
Cash Transfer
Up to date, reliable
gender disaggregated
OVC register.
1 3 3
Cash transfers for OVC Social Protection
(Cash Transfer for
the OVC
3,500, gender
disaggregated
OVCs benefiting
from Cash
Transfer in Tana
River County
No. of households
supported
1500 30 1500 30 1500 30 1500 30 1500 30 150
Accelerating /scaling up
of Birth Registration for
children.
Birth registration
of children under 5
years
disaggregated by
gender scaled up
35.7 Proportion of children
whose births has been
registered
100 3 100 3 100 3 100 3 100 3 15
Legal Aid Support for
victims of abuse, early
marriages, exploitation,
neglect and violence
Justice for children 5 No. of children
supported with legal aid.
20 2.4 20 2.4 20 2.4 20 2.4 20 2.4 12
Community Awareness
creation on Child Rights,
effects of early marriages
and Child Protection
through Barazas and
Increased number
of people
participating in
child protection
matters
- No of
barazas/community
education forums on
child protection and
radio programs
conducted
24 .4 24 4 24
4 24 4 24 4 20

131
Sub Program Key Output Baseline
(%)
Key performance
Indicators
Planned Targets
Year 1 Year 2 Year 3 Year 4 Year 5 Total
Budget
(M) Target Cost
(M)
Target Cost
(M)
Target Cost
(M)
Target Cost
(M)
Target Cost
(M)
Community Radio
Programmes.
Empowerment of Existing
Child Protection
Structures/Mechanisms
Effective Child
Protection
Structures
/Mechanisms
(AACs, Child
Protection
Networks,
Community Child
Protection
Committees.
3 Sub County
AACs
1 County Child
Protection
Network
10 Community
Based CP
Committees
No of capacity
development trainings
conducted for AACs, CP
Network &Community
CP Committees
disaggregated by gender;
No of children
disaggregated by gender
supported by child
protection mechanisms
14 2 14 2 14 2 14 2 14 2 10
Enhance Child
Participation
Increased number
of children
participating in
events
Existence of
Children
Assemblies
Day of the
African Child &
World Orphans
Day regularly
marked in the
County 0%
No of children calendar
events conducted/
marked
5 1 5 1 5 1 5 1 5 1 5
Development of a County
Child Protection and OVC
Policy
Adoption and
implementation of
the child protection
& OVC policy
- Implementation reports 1 5 5
Allocation of Emergency
Fund for children.
Support offered to
children during
emergency
situations
- No. of Needy children
disaggregated by gender
assisted during
emergency especially
on, payment of fees for
vulnerable children and
establishment of safe
places/child friendly
spaces
300 6 300 6 300 6 300 6 300 6 30
Capacity building of
Community Child
Protection actors on
Emergency Preparedness.
Effective response
and preparedness
during emergencies
Tana River Child
Protection
Network trained
on emergency
preparedness &
No of trainings
conducted on
preparedness
3 4.8 3 4.8 3 4.8 3 4.8 3 4.8 24
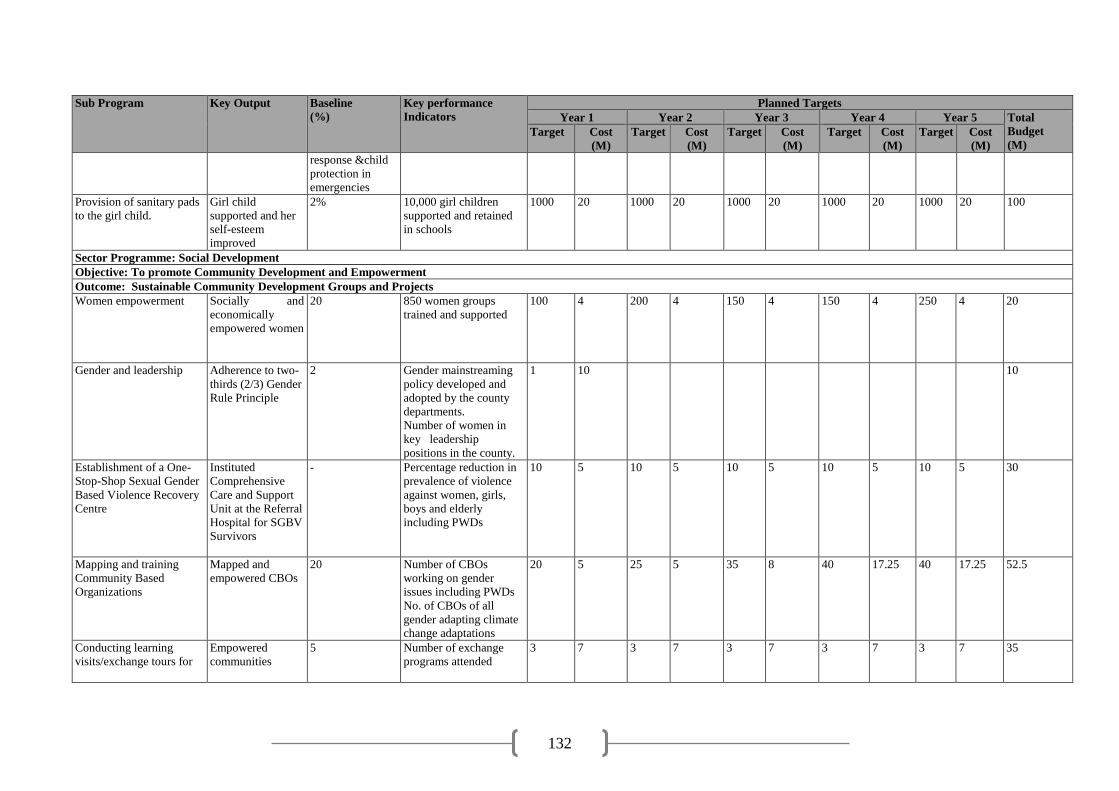
132
Sub Program Key Output Baseline
(%)
Key performance
Indicators
Planned Targets
Year 1 Year 2 Year 3 Year 4 Year 5 Total
Budget
(M) Target Cost
(M)
Target Cost
(M)
Target Cost
(M)
Target Cost
(M)
Target Cost
(M)
response &child
protection in
emergencies
Provision of sanitary pads
to the girl child.
Girl child
supported and her
self-esteem
improved
2% 10,000 girl children
supported and retained
in schools
1000 20 1000 20 1000 20 1000 20 1000 20 100
Sector Programme: Social Development
Objective: To promote Community Development and Empowerment
Outcome: Sustainable Community Development Groups and Projects
Women empowerment
Socially and
economically
empowered women
20 850 women groups
trained and supported
100 4 200 4 150 4 150 4 250 4 20
Gender and leadership Adherence to two-
thirds (2/3) Gender
Rule Principle
2
Gender mainstreaming
policy developed and
adopted by the county
departments.
Number of women in
key leadership
positions in the county.
1 10 10
Establishment of a One-
Stop-Shop Sexual Gender
Based Violence Recovery
Centre
Instituted
Comprehensive
Care and Support
Unit at the Referral
Hospital for SGBV
Survivors
- Percentage reduction in
prevalence of violence
against women, girls,
boys and elderly
including PWDs
10 5 10 5 10 5 10 5 10 5 30
Mapping and training
Community Based
Organizations
Mapped and
empowered CBOs
20 Number of CBOs
working on gender
issues including PWDs
No. of CBOs of all
gender adapting climate
change adaptations
20 5 25 5 35 8 40 17.25 40 17.25 52.5
Conducting learning
visits/exchange tours for
Empowered
communities
5 Number of exchange
programs attended
3
7 3
7 3 7 3 7 3 7 35

133
Sub Program Key Output Baseline
(%)
Key performance
Indicators
Planned Targets
Year 1 Year 2 Year 3 Year 4 Year 5 Total
Budget
(M) Target Cost
(M)
Target Cost
(M)
Target Cost
(M)
Target Cost
(M)
Target Cost
(M)
women, youths and People
living With Disabilities
Provision of Assistive
devices to PWDs
Improved PWDs
welfare
5
No. PWDS assisted 100 10 100 10 100 10 100 10 100 10 50
Combating drug abuse
and rehabilitation of drug
addicts
Healthy and low
levels of drug use
in the communities
2 No. people
disaggregated by gender
with improved health
–Socially well-adjusted
community
1000 1.5 1000 1.5 1000 1.5 1000 1.5 1000 1.5 7.5
Construction, equipping
and operationalization of
women empowerment
center.
Increased women
participation
- One Well-furnished and
functional County
Women Empowerment
Centre in Hola
1 30 30
Sector Programme: Youth Empowerment
Objective: To increase sector coordination in positive youth engagement and employment
Outcome: Socially and economically empowered youth
Development and
enactment of the county
youth empowerment
policy/strategy
Increased ,
/structured
participation of the
youth in
community
development
- County youth
empowerment
policy/strategy
1 10 10
County Youth
needs
assessment/bio-
data report
- Validated Needs
Assessment report with
gender disaggregated
data on youth in and out
of school, needs, skills,
livelihoods
1 5 5
Empowerment/Capacity
building of youth
Socially and
economically
empowered youth
- No. youth trained
/empowered
1000 5 1000 5 1000 5 1000 5 1000 5 25
Mentorship/Leadership
(Career guidance,)
Increased number
of informed and
motivated youth
taking part in
community
leadership
- No of forums for youth
held
1 2 1 2 1 2 1 2 1 2 10
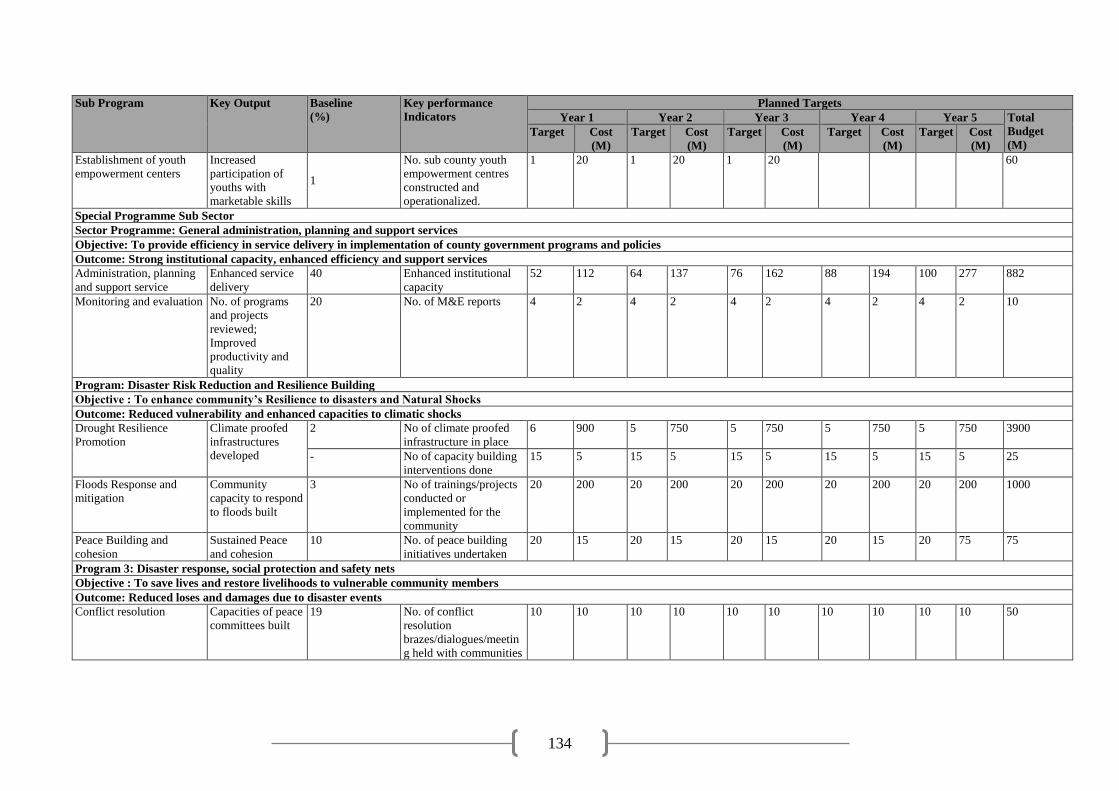
134
Sub Program Key Output Baseline
(%)
Key performance
Indicators
Planned Targets
Year 1 Year 2 Year 3 Year 4 Year 5 Total
Budget
(M) Target Cost
(M)
Target Cost
(M)
Target Cost
(M)
Target Cost
(M)
Target Cost
(M)
Establishment of youth
empowerment centers
Increased
participation of
youths with
marketable skills
1
No. sub county youth
empowerment centres
constructed and
operationalized.
1 20 1 20 1 20 60
Special Programme Sub Sector
Sector Programme: General administration, planning and support services
Objective: To provide efficiency in service delivery in implementation of county government programs and policies
Outcome: Strong institutional capacity, enhanced efficiency and support services
Administration, planning
and support service
Enhanced service
delivery
40 Enhanced institutional
capacity
52 112 64 137 76 162 88 194 100 277 882
Monitoring and evaluation No. of programs
and projects
reviewed;
Improved
productivity and
quality
20 No. of M&E reports 4 2 4 2 4 2 4 2 4 2 10
Program: Disaster Risk Reduction and Resilience Building
Objective : To enhance community’s Resilience to disasters and Natural Shocks
Outcome: Reduced vulnerability and enhanced capacities to climatic shocks
Drought Resilience
Promotion
Climate proofed
infrastructures
developed
2 No of climate proofed
infrastructure in place
6
900
5 750 5 750
5 750 5 750 3900
- No of capacity building
interventions done
15 5 15 5 15 5 15 5 15 5 25
Floods Response and
mitigation
Community
capacity to respond
to floods built
3 No of trainings/projects
conducted or
implemented for the
community
20 200 20 200 20 200 20 200 20 200 1000
Peace Building and
cohesion
Sustained Peace
and cohesion
10 No. of peace building
initiatives undertaken
20 15 20 15 20 15 20 15 20 75 75
Program 3: Disaster response, social protection and safety nets
Objective : To save lives and restore livelihoods to vulnerable community members
Outcome: Reduced loses and damages due to disaster events
Conflict resolution Capacities of peace
committees built
19
No. of conflict
resolution
brazes/dialogues/meetin
g held with communities
10 10 10 10 10 10 10 10 10 10 50

135
Sub Program Key Output Baseline
(%)
Key performance
Indicators
Planned Targets
Year 1 Year 2 Year 3 Year 4 Year 5 Total
Budget
(M) Target Cost
(M)
Target Cost
(M)
Target Cost
(M)
Target Cost
(M)
Target Cost
(M)
Support management of
human diseases out breaks
Provision of NFIs
and food items
60 % of emergency
response to disease
outbreak
100 5 100 5 100 5 100 5 100 5 25
Fire out breaks Train community
response champion
at all levels/support
fire victims
3 No. of fire champions
trained
10 40 6 20 6 20 6 20 6 20 120
Floods Response Timely flood
response/mitigatio
n measures in place
2 No cases evacuated and
cases received food and
none food items
15 40 15 40 15 40 15 40 15 40 200
- N0 of flood mitigation
projects implemented
15 10 15 10 15 10 15 10 15 10 50
Drought Response Households
supported
40 Percentage of vulnerable
households supported
5 200 5 200 5 200 5 200 5 200 1000
Cross-Sectoral Impacts Programme Name Sector Cross-sector Impact Measures to Harness or Mitigate the Impact
Synergies Adverse impact
Coordination of partnerships’ interventions All sectors Departments actively engaging
with partners in the
implementation of programmes
Inadequate provision
of funds affects
implementation of
projects and service
delivery ;
Delay in release of
funds affects
programmes and
projects
implementation
To collaborate with other departments and
partners in developing a common approach of
handling funding gaps and involvement of
partnerships
Disaster Risk Reduction and Resilience building Agriculture, livestock production/storage of hay,
livestock, pasture preservation
programs, purchase of high
value animal breeds,
Delays in availing of funds Collaborate with agriculture to advice on the best
hey to plant for pasture to get the best pasture.
The department of livestock will help in
choosing the best animal breed that will survive
extreme weather and have best results.
water and environment Construction of mega water
pans, and other water storage
facilities, sinking of strategic
boreholes, support construction
Dalays in availing funds Collaborate with the respective department to
identify best sites to construct water pans and
mega dams to collect most water

136
Programme Name Sector Cross-sector Impact Measures to Harness or Mitigate the Impact
Synergies Adverse impact
or rehabilitation of shallow
wells, water harvesting, support
sand harvesting groups
environmental conservation
programs/groups
public administration Peace and security,
coordination of disaster
management programs,
culture Gender and
social protection
Support to the most vulnerable
community members
Health Financial support to health
teams to capacity build
communities in diseases
prevention and control
Education Support to institutions and
schools in disaster risk
reduction programs
Urban planning Preparedness to emergencies,
purchase of equipment’s for
saving lives and assets
Disaster Response, social protection and safety nets Agriculture and
livestock
Relief food distribution to
vulnerable households and
support provision of livestock
feeds during drought
water and environment Provide water trucking services
to vulnerable households, drill
emergency boreholes,
provision of emergency water
storage facilities
Vehicle breakdown and over
populated water drawing
points
Establish water drawing point at river Tana in
Madogo, Bura Tana ,Hola and Garseni, establish
a monitoring unit during drought emergencies
public administration Coordination and support of
disaster emergencies, public
awareness
culture Gender and
social protection
Provision of support to
vulnerable households
Health Support disease control teams
and provide NFIs
Education Support institutions and
schools during occurrences of
emergencies

137
Programme Name Sector Cross-sector Impact Measures to Harness or Mitigate the Impact
Synergies Adverse impact
Urban planning Assembling of equipments and
teams during emergencies to
save lives and assets
Injuries/deaths can occur Capacity building on effective disaster response
approach

138
4.4.7 Environmental Protection, Water and Sanitation
The sector comprises of the following sub-sectors: Environment; Water and sanitation; Land
reclamation; Forestry and Wildlife and Meteorological Services.
Vision: Championing the provision of clean and safe water for a healthy and well protected
environment, supporting a sustainable society and economy.
Mission: To proactively provide efficient clean and safe water supply services, environmental
protection and natural resources management services sustainably for the people of Tana River.
Goal: Ensuring universal access to safe and affordable drinking water by investing in adequate
infrastructure, provide sanitation facilities and encourage hygiene at every level. Protecting and
restoring water-related ecosystems such as forests, mountains, wetlands and rivers is essential if
we are to mitigate water scarcity.
Sector Development Needs, Priorities and Strategies
The development priorities for the sector are: Solid waste management; Procurement of waste
trucks; Awareness creation on environment matters; Pollution control through procurement of
air quality surveillance machinery and enhancement of surveillance to reduce water and noise;
Improvement of environmental aesthetics through routine management of parks, planting of tree
seedlings and establishment of new gardens; Procurement of drilling rigs to facilitate drilling of
boreholes; Procurement of excavation for facilitating desilting of old water pan and excavating
new ones; Provision of clean safe water to Tana River residents; and Collection and analysis of
water samples.
Development
Issue
Cause Development
Objective
Immediate
Objective
strategies
Environmental
Protection
Inadequate systems to
implement the devolved
forestry functions
Lack of county specific
environmental policy
frameworks and guidelines to
address the challenges in the
sub sector
Inadequate staff to support the
development of the sector
Inadequate co-ordination
between the County
government and the local
communities on issues related
to environment
Lack of essential services to
communities such as public
parks
Poor garbage collection
system.
Complete lack of a sewerage
system.
Inadequate water supply.
Lack of solid waste dumping
sites.
Inadequate waste collection
equipment and trucks.
Lack of sub county
environmental officers
To proactively provide
efficient clean and safe
water supply services,
environmental
protection and natural
resources management
services sustainably
for the people of Tana
River
Pollution control
through procurement
of air quality
surveillance
machinery and
enhancement of
surveillance to reduce
water and noise
Improvement of
environmental
aesthetics through
routine management
of parks, planting of
tree seedlings and
establishment of new
gardens
Procurement of
drilling rigs to
facilitate drilling of
boreholes
Procurement of
excavation for
facilitating desilting
of old water pan and
excavating new ones
Implement the 10 million
trees programme;
Implement the provisions of
the transition implementation
plan on devolved forestry
functions
Formulate and implement
county specific policies
Develop and implement solid
waste management plan
Develop and enforce
environmental Standards
Integrate environmental
issues in county development
planning
Recruit additional staff to
take charge of environmental
issues at sub county levels
Strengthen community
institutions such as CFAs,
CWAs, CCAs to strengthen
coordination with County
department of environment
Develop a public park and
provide essential services
Improve garbage collection
system.
Develop a sewerage system.

139
Development
Issue
Cause Development
Objective
Immediate
Objective
strategies
Poor farming methods leading
to degradation of riverine
areas
Unsustainable charcoal
production
Failure to enact land use plans
Water pollution
Noise pollution
Human wildlife conflicts
Unsustainable use of forest
products and other unclean,
costly and unhealthy sources
of energy
Expand / increase water
supply though drilling of
borehole, dams and reduction
of water loss through
rehabilitation and
augmentation of water and
sewerage system (Purchase of
excavation machines to
increase water pan capacities
through disiltation,
Procurement of drilling rigs
to facilitate borehole drilling)
Develop a county integrated
water resources master plan
Mapping of all ground water
resources
Energy audit of all water
works
Procurement of waste
collection trucks and
equipment and employment
of additional staff to engage
in town clean-ups
Identify and develop
designated dump sites
Enforcement of riverbank
30m free boundary
Promote recycling of solid
waste.
Develop and implement
charcoal regulations
Audit of water and sewerage
system.
Promote development and
implementation of land use
plans
Conducting an environmental
sanitation campaign.
Investing in additional water
production and distribution of
infrastructure.
Reduction of water loss
Enforcement and policing of
environmental Regulations
Increase public education and
awareness on environment
Support KWS in
implementing Problem
Animal Control Strategies
Promotion of adoption of
clean and sustainable energy
sources

140
a. Sub-sector Programmes- Environmental Protection Sub-
programme
Key output Baseline Key performance
indicators
Planned Targets
Year 1 Year 2 Year 3 Year 4 Year 5 Total
Budget
(M) Target Cost
(M)
Target Cost
(M)
Target Cost
(M)
Target Cost
(M)
Target Cost
(M)
Programme Name: General Administration & Support Services
Objective: To enhance and improve service delivery
Outcome: Improved service delivery
General
Administration
& support
services
Renovation and
furnishing furniture
of offices
10% Number of offices
renovated and furnished
with furniture
1 1.4 1 1.54 1 1.7 1 1.9 1 2 8.6
Purchase of vehicle
for service delivery
and inspection
0% Number of vehicle
purchased
4 21.6 0 0 0 0 0 0 0 0 21.6
Use of goods and
services
30% Number of offices 4 7.4 4 8.14 4 8.954 4 9.85 4 10.8 45.1
Programme Name: Forest Management & Development Programme
Objective: To improve the management and development of forestry sector and ensure implementation of the devolved forestry functions
Outcome: improved forest cover for sustainable economic growth
Forest
Development
&
Enforcement
Suitable Ungazetted
forest areas
identified and
marked for
Gazettement as
community forests/
community
conserved areas
- Ha of forest patches
(and acreage) identified
for Gazettement
2000 Ha 3 2000 3.3 200 3.63 2000 4.0 2000 4.4 18.33
County Forest
Gazettement
Guidelines prepared
and approved by the
County Assembly
- Forest Gazettement
guidelines developed
1 2.5 0 0 0 0 0 0 0 0 2.5
Enforcement officers
seconded and
community scouts
recruited and jointly
trained at KWS/KFS
Training academy
- No of enforcement
officers seconded and
community scouts
recruited and trained
15 6 15 6 0 0 0 0 0 0 12
3 Forest Extension
officers recruited and
deployed in each of
the 3 sub counties
0 No of forest extension
officers recruited and
deployed
3 2.52 3 2.772 3 3.0492 3 3.34512 3 3.6895 19.065

141
Sub-
programme
Key output Baseline Key performance
indicators
Planned Targets
Year 1 Year 2 Year 3 Year 4 Year 5 Total
Budget
(M) Target Cost
(M)
Target Cost
(M)
Target Cost
(M)
Target Cost
(M)
Target Cost
(M)
Incentives for private
forest owners
developed and
approved
9 Private forest owners’
incentive and guidelines
developed and approved
1 0.5 0 0 0 0 0 0 0 0 0.5
patrol boat purchased
to secure the riverine
mangrove forest
areas
- Patrol boat 1 2 1 0.5 1 0.5 1 0.5 1 0.5 4
Woodlots of suitable
tree species across
the three sub-
counties for
rehabilitation of
degraded terrestrial
forest areas
established
- No of seedlings per
woodlot across the three
sub counties
3 2 3 2.2 3 2.42 3 2.66 3 2.928 12.21
10 million trees
planted
- No. of trees planted 2,000,000 40 2,000,000 40 2,000,000 40 2,000,000 40 2,000,000 40 200
Mangrove nurseries
established through
organized
community groups
(CFA members) in
Kipini and Ozi for
rehabilitation
- No of mangrove
nurseries established
2 1.584 2 1.742 2 1.92 2 2.11 2 2.32 9.676
Alternative
livelihood sources
consistent with
environmental
conservation
promoted including
agro-forestry
initiatives, extraction
of forest products
such as gums and
resins etc
- No of Nature based
enterprises initiated
20 SMEs
5.5 10 6.05 10 6.65 5 7.32 5 8.05 33.57
No of community
beneficiaries trained in
forest product value
addition
1500
Communities
facilitated to
register/strengthen
- No of Community
Forest Associations
(CFAs) and Community
2
1 2 1.1 2 1.21 2 1.33 2 1.50 6.14

142
Sub-
programme
Key output Baseline Key performance
indicators
Planned Targets
Year 1 Year 2 Year 3 Year 4 Year 5 Total
Budget
(M) Target Cost
(M)
Target Cost
(M)
Target Cost
(M)
Target Cost
(M)
Target Cost
(M)
existing community
Forest Associations
and Community
Conserved Areas
management
committees
Conserved Area
Committees
registered/strengthened
Capacity building
and trainings of
CFAs/CCAs
5 No of capacity building
trainings to CFAs/CCAs
6 1.8 6 1.98 6 2.178 6 2.40 6 2.64 10.998
Suitable tree species
grown in all public
and interested private
institutions within
the County
30 No of institutions under
the greening programme
100 2.02 100 2.22 100 2.44 100 2.68 100 2.95 12.32
A recognition model
for rewarding the
greenest institutions
(including schools,
tertiary institutions,
health facilities,
government offices
etc) established
- No of rewards given to
greenest institutions
3 1 3 1.1 3 1.21 3 1.33 3 1.50 6.14
Guidelines for
private forest
registration
developed and
incentives agreed
and approved
Private forest
registration guideline
and incentives
developed and approved
1 0.5 0 0 0 0 0 0 0 0 0.5
Forest extension
services for
registered private
foresters instituted
- No of private forest
owners under county
forest extension
programme
75 1 75 1.1 75 1.21 75 1.33 75 1.50 6.14
Carbon credits Capacity building
workshop/conference
on carbon trade
conducted
- No of
workshops/seminars on
carbon trade
1 2.6 0 0 0 0 0 0 0 0 2.6
Carbon stock
assessment done for
5 Carbon stock
Assessment reports
1 2 1 2.2 0 0 0 0 0 0 4.2

143
Sub-
programme
Key output Baseline Key performance
indicators
Planned Targets
Year 1 Year 2 Year 3 Year 4 Year 5 Total
Budget
(M) Target Cost
(M)
Target Cost
(M)
Target Cost
(M)
Target Cost
(M)
Target Cost
(M)
various forest
patches
Networks for carbon
credit markets
established with
implementing
counties
5 No of networking
meetings held
2 0.5 2 0.6 0 0 0 0 0 0 1.1
Beautification,
Recreation and
Greening
Services
Suitable sites for
public park and
arboreta identified,
preliminary studies
conducted and
designs done
10 Study reports and
designs developed
1 0.8 0 0 0 0 0 0 0 0 0.8
Develop the public
parks and arboreta as
designed
5 No and quality of
facilities at the public
park
1 15 1 16.5 1 16.5 0 0 0 0 48
Town beautification
programmes and
designs developed in
consultation with
planning
department
10 Designs for the
beautification
programmes
3 0.9 0 0 0 0 0 0 0 0 0.9
Suitable trees species
planted along the
major roads and
roundabouts and
allocated to
conservation
institutions e.g.
CBOs for care
- No of trees planted and
surviving in major
towns across the three
sub counties
3 1.5 1.5
Engage women in
tree program through
casual employment
on a contract basis
- No of women employed
through one-year
contract basis
80 0.96 40 0.48 20 0.24 20 0.24 20 0.24 2.16
Land
reclamation
30m riparian zone on
either side of Tana
River freed from any
human activities
- Length (in Km) of
riparian zones freed
from destructive human
activities
20 2 15 2.2 15 2.42 10 2.42 10 2.5 11.54

144
Sub-
programme
Key output Baseline Key performance
indicators
Planned Targets
Year 1 Year 2 Year 3 Year 4 Year 5 Total
Budget
(M) Target Cost
(M)
Target Cost
(M)
Target Cost
(M)
Target Cost
(M)
Target Cost
(M)
including farming
activities
Rehabilitation of all
degraded forest areas
- Acreage of degraded
forest areas rehabilitated
25000 6 30000
7.5 37500 8.5 25000 6 30000 7.5 35.5
Restoration
programmes
instituted specifically
targeting riparian
zones within the
County
Area (km2) of degraded
riverine areas restored
190 8 209 8.8 230 9.68 253 10.65 278 11.71 48.84
Regular patrols to
ensure compliance
instituted
- No of patrols done and
reports thereof
24 2 24 2.22 24 2.42 24 2.66 24 2.92 12.22
Human
resource
Suitable sites
identified and office
blocks constructed
across the three sub
counties
- No of office blocks
constructed
0 0 3 7.5 0 0 0 0 0 0 7.5
Programme Name: Wildlife management Programmes
Objective: Improve and strengthen wildlife management programmes and promote wildlife management as a form of land use
Outcome: Improved wildlife management systems that serve the interests of present and future generations
Wildlife
Resource
development
Key wildlife habitats
that require
protection identified
- Area identified June 2018 0.5 0 0 0 0 0 0 0 0 0.5
Enforcement of new
wildlife act
supported
- No of awareness
meetings held
36 3.6 36 3.9 36 4.3 36 4.7 36 5.2 21.7
Incentives for
communities and
land owners to
allocate land for
wildlife management
developed
- No of incentives 1 0.5 0 0 0 0 0 0 0 0 0.5
Tana Delta land Use
Plan and Strategic
Environmental
Assessment reports
- No of briefing meetings
held with environment
sub-committee and
approval report from the
Assembly
4 1 4 4 1.1 0 0 0 0 0 2.1

145
Sub-
programme
Key output Baseline Key performance
indicators
Planned Targets
Year 1 Year 2 Year 3 Year 4 Year 5 Total
Budget
(M) Target Cost
(M)
Target Cost
(M)
Target Cost
(M)
Target Cost
(M)
Target Cost
(M)
approved by the
County Assembly
Wildlife policy
enforcement
Key species
vulnerable to
poaching and
hotspots identified
- Reports on publicity of
the vulnerable species
and poaching hotspots
6 2.4 6 2.6 6 2.9 6 3.1 6 3.5 10.2
Anti-poaching
campaigns through
enforcement support
and awareness
programmes rolled
out
- No of anti-poaching
campaigns held
2 0.2 2 0.2 2 0.2 2 0.2 2 0.2 1.0
KWS officers
supported to help
identify and control
problem animals in
community areas
- No of PAC actions taken
and animals controlled
200 1 200 1.1 200 1.2 200 1.3 200 1.4 6
Purchase Land
cruiser vehicles for
rangers’ wildlife
patrols and
operations
- No. of land cruisers for
patrols and operation
2 10.8 0 0 0 0 0 0 0 0 10.8
Train conservancy
rangers in Manyani
on proper
conservation skills
(need supportive
policies)
- No. of rangers trained in
Manyani
0 0 25 2 0 0 0 0 0 0 2
Develop
management plans
for Ndera and Lower
Tana Delta
Conservancies (Need
supportive County
policies)
- No. of management
plans
0 0 2 4 0 0 0 0 0 0 4
Capacity
development
A wildlife
conservation unit
within the
- Functional wildlife
conservation support
unit
1 2.5 1 2.8 1 3.2 1 2.5 1 4 15

146
Sub-
programme
Key output Baseline Key performance
indicators
Planned Targets
Year 1 Year 2 Year 3 Year 4 Year 5 Total
Budget
(M) Target Cost
(M)
Target Cost
(M)
Target Cost
(M)
Target Cost
(M)
Target Cost
(M)
Department of
environment created
Officers seconded
and recruited
community scouts
trained in KWS/KFS
training academy
- No of officers seconded
and community scouts
recruited and trained
60 3.4 15
3.4 15
3.4 15 3.4 15 3.4 17
wildlife areas that
require development
of management plans
identified
- List of community,
private and county
wildlife areas requiring
a management plan
1 0.5 1 0.5 1 0.5 1 0.5 1 0.5 2.5
A professional team
instituted to work
with respective
communities to
develop the
management plans
- No of management
plans developed and
approved
1 5 0 1 5 0 0 1 5 15
General
wildlife
awareness
Popular versions of
the wildlife act and
other wildlife
awareness materials
produced
- No of awareness
materials produced
1000 1 0 0 1000 1 0 0 0 0 2
- Number of awareness
campaign meetings held
1 1 1 1 1 1 1 1 1 1 5
Local champions to
lead the campaign
drive at the
grassroots level
identified, trained
and facilitated
- No of champions
identified and trained
75 1 75 1.1 75 1.21 0 0 0 0 3.31
Programme Name: Solid Waste management
Objective: Ensure the protection of environment through effective delivery of solid waste services
Outcome: Proper safe and effective solid waste management in urban centres
Solid waste
management
County Strategic
solid waste
management plan
- Solid waste management
plan
1 2.5 0 0 0 0 0 0 0 0 2.5
suitable solid waste
disposal sites
identified and
developed
40 Fenced and developed
solid waste sites
3 3.6 2 2.4 2 2.4 0 0 0 0 8.4
- Number of solid waste
truck
0 0 3 21 2 14 0 0 0 0 35

147
Sub-
programme
Key output Baseline Key performance
indicators
Planned Targets
Year 1 Year 2 Year 3 Year 4 Year 5 Total
Budget
(M) Target Cost
(M)
Target Cost
(M)
Target Cost
(M)
Target Cost
(M)
Target Cost
(M)
Town clean-up
exercises instituted
10 No of clean-up exercises
held
5 2.5 3 1.5 3 1.5 3 1.5 1 0.5 7.5
Shoreline clean up
exercise instituted
No of clean-up exercises
held
5 2.5 3 1.5 3 1.5 3 1.5 1 0.5 7.5
Collect, safely store
and dispose of all
asbestos as provided
for by the National
Guidelines on Safe
Management and
Disposal of Asbestos
Materials of 2012
No. of reports 1 0 1 2.0 0 0 0 0 0 0 2
Waste water
drainage
management
Waste water
drainage and
treatment plant
piloted
Waste water drainage
and treatment plant
1 15 1 15 1 20 0 0 0 0 50
Hire &
Contracting
solid waste
transporters
Waste are
transported to the
designated sites
40 Ensured 8 towns are
clean and safe
8 64 8 70.4 8 77.4 8 85.1 8 93.7 391
Purchase and
install of tools
and
segregation
equipments for
solid waste
management
Purchase and
installation of tools
and solid waste
segregation
equipments
- Variety of tools and
equipments are
purchased and installed
200 4 200 4 4 0 0 0 0 0 12
Purchase of
incinerators and
construction of
houses
- No. of incinerators
purchased and
constructed B
3 30 0 0 0 0 0 0 0 0 30
Programme Name: Environmental laws and policies (Enforcement & surveillance)
Objective: To ensure effective and enabling policy environment to allow environmental programmes thrive
Outcome: Compliance to existing environmental laws and policies
Environmental
Planning,
Coordination
& management
Tana River County
Natural Resource
Management Forum
strengthened
10 No of NRMF meetings 4 0.2 4 0.2 4 0.2 4 0.2 4 0.2 1

148
Sub-
programme
Key output Baseline Key performance
indicators
Planned Targets
Year 1 Year 2 Year 3 Year 4 Year 5 Total
Budget
(M) Target Cost
(M)
Target Cost
(M)
Target Cost
(M)
Target Cost
(M)
Target Cost
(M)
Noise pollution
control measures
instituted
- No of enforcement and
surveillance reports
4 0.2 4 0.2 4 0.2 4 0.2 4 0.2 1
Disposal of Asbestos % reduction of asbestos
roofing
10 2
County
Environmental
Action Plan
produced
- CEAP produced for
Tana River County
1 2.5 2.5
Programme Name: Climate change mitigation and adaptation
Objective: Promote sustainable energy sources, climate change adaptations, information generation and sharing
Outcome: Resilient communities from the impacts of climate change
Sustainable
energy
development
Alternative and clean
energy sources
promoted
- No of solar panels and
energy efficient stoves
installed
100 10 50 5 50 5 50 5 20 2 27
Weather
Information
services
functional weather
station installed
- No of weather stations
installed
5 10 5 10 5 10 30
b. Sub-sector Programmes- Water and Sanitation Sub-
Programme
Key output Key
Performance
Indicators
Planned Targets Total
Budget
(M) Year 1 Year 2 Year 3 Year 4 Year 5
Target Cost (M) Target Cost (M) Target Cost
(M)
Target Cost
(M)
Target Cost
(M)
Programme Name: General Administration and Support Services
Objective: To enhance and improve service delivery
Outcome: Improved service delivery
General
Administration
& support
services
Enhanced
departmental
capacity and
conducive work
environment for
quality service
delivery
No of Planning
& design office
at HQs
established
1 1 - - - - - - - - 1

149
Sub-
Programme
Key output Key
Performance
Indicators
Planned Targets Total
Budget
(M) Year 1 Year 2 Year 3 Year 4 Year 5
Target Cost (M) Target Cost (M) Target Cost
(M)
Target Cost
(M)
Target Cost
(M)
Improved work
environment
No. of new
SCWO offices
furnished
1 0.3 - - 1 0.3 - - 1 0.3 0.9
Enhanced staff
capacity
No of staff
trained
3 0.6 3 0.6 3 0.6 3 0.6 3 0.6 3
Improved work
environment
No of computers
procured
10 0.16 0 0 0 0 10 0.16 0 0 0.32
Improved
efficiency
No of laptops
procured
10 0.2 0 0 0 0 10 0.2 0 0 0.4
Improved work
environment
No of
constructed new
sub-county
office
1 5 1 5 0 0 0 0 0 0 10
Enhanced
mobility
No of vehicles
purchased
4 28 0 0 0 0 0 0 0 0 28
Renovation and
furnishing
furniture of
offices
Number of
offices
renovated and
furnished with
furniture
1 1.4 1 1.54 1 1.7 1 1.9 1 2 8,6
Payment of
Salary and
compensation to
employees
Number of
employees paid
their salary and
their
compensation
36 18.6 36 20.46 36 22.5 36 24.8 36 27 113.6
Refurbished
offices;
Adequate
supply of
furniture
Redesigned
office outlook;
Adequate
furniture
1 3 3 9 0 0 0 0 3 9 21
Increased
mobility in
supervision and
inspection
No of vehicles
purchased
4 28 0 0 0 0 0 0 0 0 28
Programe Name: Water Supply Resources Management
Objective: To have Clean & Safe water and to improve Sanitation
Outcome: Clean, Quality and Safe water

150
Sub-
Programme
Key output Key
Performance
Indicators
Planned Targets Total
Budget
(M) Year 1 Year 2 Year 3 Year 4 Year 5
Target Cost (M) Target Cost (M) Target Cost
(M)
Target Cost
(M)
Target Cost
(M)
Water
resources
conservation
Enhanced
efficiency in
implementation
of water
projects through
mapping of all
water resources
in the County
An integrated
water resources
Master plan
done and
operational
1 10 0 0 0 0 0 0 0 0 10
Increased
capacity of
water pans
No. of water
pans
rehabilitated
24 72 24 72 24 72 24 72 24 72 360
Reduced
conflict between
pastoralists and
famers
No. of malkas
opened for
accessing the
rivers
5 2.5 5 2.5 5 2.5 0 0 0 0 7.5
Water
Resources
Protection
Improved
security for
water points
No. of water
points fenced
10 2.5 10 2.5 10 2.5 10 2.5 10 2.5 25
Improved
sanitation in
water points and
along the
riverine
No of new
gender sensitive
toilets
constructed in
the urban centres
20 24 20 24 20 24 20 24 20 24 120
Improved
sanitation in
water points
No of new
gender sensitive
toilets
constructed in
water points in
the hinterland
40 24 40 24 40 24 40 24 40 24 120
Increased forest
cover
Percentage
forest cover in
every water pan
constructed
40 1.6 40 1.6 40 1.6 40 1.6 40 1.6 8
Rehabilitation
of water
supplies
Improved water
supplies
No. of water
supplies
rehabilitated
5 5 5 5 5 5 5 5 5 5 25

151
Sub-
Programme
Key output Key
Performance
Indicators
Planned Targets Total
Budget
(M) Year 1 Year 2 Year 3 Year 4 Year 5
Target Cost (M) Target Cost (M) Target Cost
(M)
Target Cost
(M)
Target Cost
(M)
Increasing
capacity of
existing water
pans
No. of water
pans
rehabilitated
6 18 6 18 6 18 6 18 6 18 90
Increased access
to water supply
No of boreholes
rehabilitated and
functional
36 10.8 36 10.8 36 10.8 36 10.8 36 10.8 54
Restoration of
original river
causes
improved access
to water
supplies
No of brooks
rehabilitated
3 30 2 10 2 10 2 10 2 10 70
Water
resources
management
Water quality
monitoring
surveys
No of water
quality surveys
reports done
(quarterly)
0 0 4 1 4 1 4 1 4 1 4
Data
information
management
No of GIS and
CAD systems
deployed
0 0 2 10 2 10 2 10 2 10 40
No of water
resources
mapped
0 0 1 5 1 5 1 5 1 5 20
Programme Name: Water Harvesting and Storage
Objective: To have adequate water stored
Outcome: Increased population with access to safe water services
Water
Harvesting and
Storage
Improved water
supply
No. of 30,000c
water pan
capacity
constructed in all
sub-counties
12 120 12 120 12 120 12 120 12 120 480
Improved
access to quality
and safe water
No. of
50,000m3 small
dams
constructed in all
SCs.
9 180 9 180 9 180 9 180 9 180 720
Increased
storage capacity
at household
level
Disaggregated
data of PVC and
Bladder water
tanks distributed
40 10 40 10 40 10 40 10 40 10 50

152
Sub-
Programme
Key output Key
Performance
Indicators
Planned Targets Total
Budget
(M) Year 1 Year 2 Year 3 Year 4 Year 5
Target Cost (M) Target Cost (M) Target Cost
(M)
Target Cost
(M)
Target Cost
(M)
to need villages,
schools and
Health facilities
Increased
storage capacity
at water
supplies level
No. of 50m3
capacity
elevated tanks
constructed in
extended
pipelines
1 5 1 5 0 0 0 0 0 0 10
Increased
storage capacity
at water
supplies level
No. of 500m3
elevated GI tank
at Ngao;
1 15 0 0 0 0 0 0 0 0 15
improved water
quality in water
supplies
No of water
quality labs
constructed and
equipped
1 1.5 0 0 1 1.5 0 0 1 1.5 4.5
improved water
quality in water
supplies
No of household
supplied with
aqua tabs
100 0.1 100 0.1 100 0.1 100 0.1 100 0.1 0.5
Reduced
distance from
nearest water
points
No of roof
harvesting
technologies
promoted
50 15 50 15 50 15 50 15 50 15 75
Reduced risk to
drought
No of drought
resilient water
storage
structures
constructed
5 12.5 5 12.5 5 12.5 5 12.5 5 12.5 76
Programme Name: Urban Water Supply
Objective: To guarantee supply of quality and safe water to the urban areas
Outcome: Increased access of quality and safe water to household
Urban water
supply
Increased no of
hydrological
surveys in the
hinterland and
riverine
No of
hydrological
surveys
conducted
60 9 60 9 60 9 60 9 60 9 45

153
Sub-
Programme
Key output Key
Performance
Indicators
Planned Targets Total
Budget
(M) Year 1 Year 2 Year 3 Year 4 Year 5
Target Cost (M) Target Cost (M) Target Cost
(M)
Target Cost
(M)
Target Cost
(M)
Improved
access to piped
water in urban
centres
No. of kms of
water pipeline
extensions
connected
34km 204 34km 204 34km 204 34km 204 34km 204 1,020
Improved water
supply
Disaggregated
data on No, of
water supplies
upgraded and
operational
1 100 0 0 0 0 0 0 0 0 100
Increased
number of
citizens with
water
connections
Disaggregated
data of No of
new water
supply
connections
done
500 15 500 15 500 15 500 15 500 15 75
Improved
efficiency in
revenue
collection
No. of revenue
collection
offices
constructed
1 5 1 5 0 0 0 0 0 0 10
Improved water
quality in water
supplies
No. of
Composite
filtration
unit/coagulation
tanks
constructed
1 50 1 50 0 0 0 0 0 0 100
Improved
access to piped
water
No. of water
kiosks
constructed at
consumer level
10 6.3 10 6.3 10 6.3 10 6.3 10 6.3 31.5
Flushing and
test pumping of
existing
boreholes
No of test
pumping
activities done
0 0 5 1.5 5 1.5 5 1.5 5 1.5 6.0
Sewerage
services
provision
New sewerage
systems
constructed;
Hola, Garsen,
No of sewerage
systems
constructed
0 0 2 50 1 25 1 25 1 25 125

154
Sub-
Programme
Key output Key
Performance
Indicators
Planned Targets Total
Budget
(M) Year 1 Year 2 Year 3 Year 4 Year 5
Target Cost (M) Target Cost (M) Target Cost
(M)
Target Cost
(M)
Target Cost
(M)
Madogo, Bura,
Tarassa
Rehabilitation
of urban
sewerage
systems
No of sewerage
systems
rehabilitated
0 0 1 0.5 1 0.5 1 0.5 0 0 1.5
% coverage of
the county by
sewerage
services
0 0 5 0 10 0 15 0 0 0 0
Programme Name: Rural Water Supply
Objective: To guarantee supply of quality and safe water to the rural areas
Outcome: Increased access of quality and safe water at household level
Rural water
supply
Improved
management of
county water
projects
No. of WRUAs
for every county
project fared
20 3 20 3 20 3 20 3 20 3 15
Improved
management of
county water
projects
Draft bills tabled
at the county
assembly for
ratification
1 0.2 0 0 0 0 0 0 0 0 0.2
Improved
management of
county water
projects
No of CBOs
trained on
efficient water
management
10 2 10 2 10 2 10 2 10 2 10
Improved water
supply at the
household level
No. of 200C
capacity Clear
water booster
sups Constructed
1 5 1 5 1 5 1 5 1 5 25
Increased access
of portable
water to
household
No. of New
water supplies
constructed
12 240 12 240 12 240 12 240 0 0 960
Increase storage
capacity at
household level
No. of PVC and
Bladder water
tanks supplied to
household
40 10 40 10 40 10 40 10 40 10 50

155
Sub-
Programme
Key output Key
Performance
Indicators
Planned Targets Total
Budget
(M) Year 1 Year 2 Year 3 Year 4 Year 5
Target Cost (M) Target Cost (M) Target Cost
(M)
Target Cost
(M)
Target Cost
(M)
Increase storage
capacity in
institutions
No. of PVC and
bladder water
tanks distributed
to institutions
40 10 40 10 40 10 40 10 40 10 50
Increased access
to piped water
No. of kms of
pipelines
constructed
60km 159.6 60km 159.6 60km 159.6 60km 159.6 60km 159.6 798
Increased access
to quality and
safe water
No. of boreholes
drilled
20 100 20 100 20 100 20 100 20 100 500
Increased access
to quality and
safe water
No. of shallow
wells drilled and
equipped
10 20 10 20 10 20 10 20 10 20 100
Improved
Access to
quality and safe
water
No. of boreholes
repaired
10 3 10 3 10 3 10 3 10 3 9
Increased access
to quality and
safe water
No. of 20,000c
capacity water
pans constructed
9 72 9 72 9 72 9 72 9 72 360
Increased access
to quality and
safe water
No. of 30,000c
capacity water
pans constructed
9NO 90 9NO 90 9NO 90 9NO 90 9NO 90 450
Increased access
to quality and
safe water
No. of 50,000c
capacity water
pans constructed
6 132 6 132 6 132 6 132 6 132 660
Increased access
to quality and
safe water
No of sand das
constructed
3 9 3 9 3 9 3 9 3 9 45
Increased access
to quality and
safe wat0er to
domestic and
livestock
No of earthen
canals
constructed
0 0 0 0 0 0 0 0 1 300 300
Drought
mitigation
Reduced risk to
drought
No of climate
proofed
structures
5 12.5 5 12.5 5 12.5 5 12.5 5 12.5 76

156
Sub-
Programme
Key output Key
Performance
Indicators
Planned Targets Total
Budget
(M) Year 1 Year 2 Year 3 Year 4 Year 5
Target Cost (M) Target Cost (M) Target Cost
(M)
Target Cost
(M)
Target Cost
(M)
(barkads)
constructed
Increased access
to water for
human and
livestock within
strategic
rangeland
No. of
300,000m3
capacity water
pans constructed
1NO, 150 1 150 1 150 1 150 2 300 900
Increased
availability of
water to
vulnerable
household and
institutions
during drought
emergency
phase
No. of
institution/
household
supplied with
water through
trucking
30 9.45 30 9.45 30 9.45 30 9.45 30 9.45 47.25
maintenance of
emergency
boreholes
No of strategic
boreholes
serviced
10 20 10 20 10 20 10 20 10 20 50
Programme Name: Water Use Efficiency
Objective: To reduce non-revenue water in water supplies
Outcome: Efficiency in water supply at household level
Water use
efficiency
Lack of county
policy guiding
management of
water
distribution in
urban centres
Key policy
drafted and
passed at the
county assembly
1 20 0 0 0 0 0 0 0 0 20
Improved water
quality in water
works
No. of water
quality labs
equipped
1 5 1 5 1 5 1 5 1 5 25
Use of solar
powered
submersible
water pups
No. of solar
powered
submersible
pumps installed
20 20 20 20 20 20 20 20 20 20 100

157
Sub-
Programme
Key output Key
Performance
Indicators
Planned Targets Total
Budget
(M) Year 1 Year 2 Year 3 Year 4 Year 5
Target Cost (M) Target Cost (M) Target Cost
(M)
Target Cost
(M)
Target Cost
(M)
Reduced NRW
in water
supplies
Metering all
household water
connections
No. of
household
metered
600 2.4 600 2.4 600 2.4 600 2.4 600 2.4 12
Reduced NRW
in water
supplies
Replacement of
aged
infrastructure to
reduce no of
bursts
kms of pipeline
replaced
50km 125 50km 125 50km 125 50km 125 50km 125 625
Reduced NRW
in water
supplies
Digitization of
revenue
collection in
water works
No. of water
works digitized
and operational
1 2 1 2 1 2 1 2 0 0 8
Reduced NRW
in water
supplies
Automation of
water supply
systems
No. of pipeline
systems
connected with
leak detection
equipments
1 5 1 5 1 5 0 0 0 0 15
a. Cross Sector Impacts
Programme Name
Sector
Cross-sector Impact Measures to Harness or Mitigate the Impact
Synergies Adverse Impacts
Forest management and
Development
Livestock Provision of manure Overstock of livestock
Creation of awareness materials laws and regulation
Awareness creation of the important of protection and conservation
of natural resources
Education Education and awareness
Conservation and
protection
Creation of awareness materials laws and regulation
Awareness creation of the important of protection and conservation
of natural resources
Agriculture rural development Provision of food Encroachment of forest
and wildlife habitats
Land degradation
Development of laws and regulation
Awareness creation of the land protection
Sustainable agriculture
Regulation and Law enforcement
Water water services
Water supply
Water resource
conservation
Encroachments of forest
Creation of awareness materials laws and regulation
Awareness creation of the important of protection and conservation
of natural resources
Afforestation

158
Programme Name
Sector
Cross-sector Impact Measures to Harness or Mitigate the Impact
Synergies Adverse Impacts
Wildlife management,
Conservation and Protection
Agriculture rural development
human wildlife conflicts Encroachments of forest
Creation of awareness materials laws and regulation
Awareness creation of the important of protection and conservation
of natural resources
Increase human wildlife conflicts patrols
Anti-poaching patrols
Solid waste management Water and Sanitation Agriculture
-Recycling of solid waste
and production of compost
manure
pollution (water, Air)
increase cost in health
in human and animals
purchase of trucks for collection of solid waste
Identification of dumping sites
Introducing recycling methods
Education and awareness on health and hygiene
Develop regulation on waste management
Identify and construct sewage system
Climate change adaptation and
mitigation
Water Fisheries Agriculture
Special program
loss of vegetation cover
decreased fish
production
overheating
sudden death of species
Development of county strategies on climate change adaptation and
mitigation
awareness and education on climate change adaptation and
mitigation
Water Supply Resources
Management
Finance & Economic planning Prudent financial
management
Sub-county Administration Enhanced compliance of
county laws
GJLOS Enhanced compliance of
county laws
Environmental conservation Water resources
conservation
Water resources protection
Agriculture Improved access to
irrigation water
Pollution through farm
inputs; Increase costs in
health for both livestock
and human beings
Health and sanitation Improved usage of water
resources
High power bills in
water supplies
Energy audit for all water supplies
Promotion of alternative sources of Energy
Use of solar powered submersible water pumps
Education Improved access to water
supplies

159
Programme Name
Sector
Cross-sector Impact Measures to Harness or Mitigate the Impact
Synergies Adverse Impacts
Public Private partnerships (PPP)
and development partners
Technical expertise and
financing from the private
sector
Training of staff on
efficiency in projects
implementation
Partnerships with training institutions
Water Harvesting and Storage Finance & Economic planning Prudent financial
management
Financing of county water
projects
Agriculture Increased food security
through irrigation
Provision of water for
irrigation
Water pollution from
farm inputs
Livestock Improved access to water
supplies
Encroachment of water
supplies
Sub-county Administration Enforcement of county
laws
Enhanced compliance of
county laws
Urban planning and Housing, Identification of lands for
new water supplies
Health and sanitation Improved usage of water
Improved sanitation
Energy audit for all water supplies
Promotion of alternative sources of Energy
Use of solar powered submersible water pumps
Environmental Protection Destruction of forest
cover during
construction of water
pans
Health and sanitation Improved access to water
supply
Education Education and awareness
on efficient use of water
Public Private partnerships (PPP)
and development partners
Technical expertise and
financing from the private
sector
Training of staff on
efficiency in projects
implementation
Partnerships with training institutions

160
Programme Name
Sector
Cross-sector Impact Measures to Harness or Mitigate the Impact
Synergies Adverse Impacts
GJLOS
Improved usage of water
resources; Technical
expertise and financing
from the private sector
Urban Water Supply Finance & Economic planning
Prudent financial
management
Increased NRW
Closer collaboration with urban planning to ensure wayleave are
provided and there is encroachment
Energy audit for all water supplies
Promotion of alternative sources of Energy
Use of solar powered submersible water pumps
Sub-county Administration
Enhanced compliance of
county laws
Urban planning and Housing,
Environmental Protection
Land, housing & Physical
planning
Health and sanitation
Improved usage of water
resources
Education
Improved usage of water
resources
Public Private Partnerships (PPP)
and development partners
Technical expertise and
financing from the private
sector and donor partners
GJLOS Law and order in
incidences of conflicts
Rural Water Supply Finance & Economic planning
Prudent financial
management
High power bills in
water supplies
Increased NRW
Closer collaboration with urban planning to ensure wayleave are
provided and there is no encroachment
Promotion of alternative sources of Energy
Use of solar powered submersible water pumps
Sub-county Administration Enhanced compliance of
county laws
Urban planning and Housing,
Environmental Protection Improved usage of water
resources
Land, housing & Physical
planning
Health and sanitation Improved usage of water
resources

161
Programme Name
Sector
Cross-sector Impact Measures to Harness or Mitigate the Impact
Synergies Adverse Impacts
Education Improved usage of water
resources; Training on
efficient use of water
Public Private partnerships (PPP)
and development partners
Technical expertise and
financing from the private
sector
GJLOS Enhanced compliance of
county laws
Water Use Efficiency Finance & Economic planning
Prudent financial
management
Technical expertise and
financing from the private
sector
Sub-county Administration Enhanced compliance of
county laws
County Assembly Passing of county laws and
policies
The County Executive Drafting of policies
Public Health and sanitation Improved usage of water
resources
Urban planning and Housing, Improved usage of water
resources
Environmental Protection
Land, housing & Physical
planning
Improved usage of water
resources
Education
Public Private partnerships (PPP)
and development partners
Technical expertise and
financing from the private
sector
GJLOS Enhanced compliance of
county laws

162
4.4.8 Public Administration and Intergovernmental Relations Sector
The sector comprises the Finance and Economic Planning, Internal Auditing, Revenue,
Procurement, County Public Service, Human Resources Management and Devolution.
Vision: To be an institution of excellence in economic planning, financial management and
prudent resource management.
Mission: To pursue prudent economic, fiscal, and monetary policies and effectively
coordinate government financial operations for rapid and sustainable development of Tana
River County.
Sector Development Needs, Priorities and Strategies
The key sector priorities are:
1) Resource mobilization
2) Asset management
3) Debt Management
4) Strengthening policy formulation, planning, budgeting and implementation of CIDP
2018-2022.
5) Expenditure controls.
6) Tracking of implementation of development policies, strategies and programmes.
7) Human Resource planning, Management and Development
Challenges Causes Development
Objectives
Immediate
Objectives
Strategies
Underperformance in
Revenue Collection
Not all revenue is
collected through the
automated system.
Enhanced revenue
collection.
Automation of all
revenue collection Automation
in revenue collection
Enactment
and enforcement of
revenue laws and
policies
Capacity
building of the
revenue directorate
Weak supervision in
revenue
administration.
Strengthen revenue
administration.
Delays in banking the
collected revenue
resulting in pilferage.
Timely banking of
collected revenue.
Weak legal
framework
Strengthen the legal
framework
Insufficient Capacity
of the revenue
directorate.
Capacity building of
the revenue
directorate.
Budget process
calendar not strictly
followed.
Insufficient Capacity
in Budget office.
Budget process
follow clear budget
calendar.
Training of
economists and
statisticians for the
Budget office.
Capacity
building of the Budget
office and other
government
departments.
Hiring of
economists and
stasticians
Delayed and
submission of reports
with gaps by
government
department.
Sensitize departments
on the budget
circular.
Insufficient skills by
government
departments on
budgeting.
Capacity building of
government
departments on
reporting formats and
quality.
Insufficient
economists and
stasticians
Hiring of economists
and stasticians.
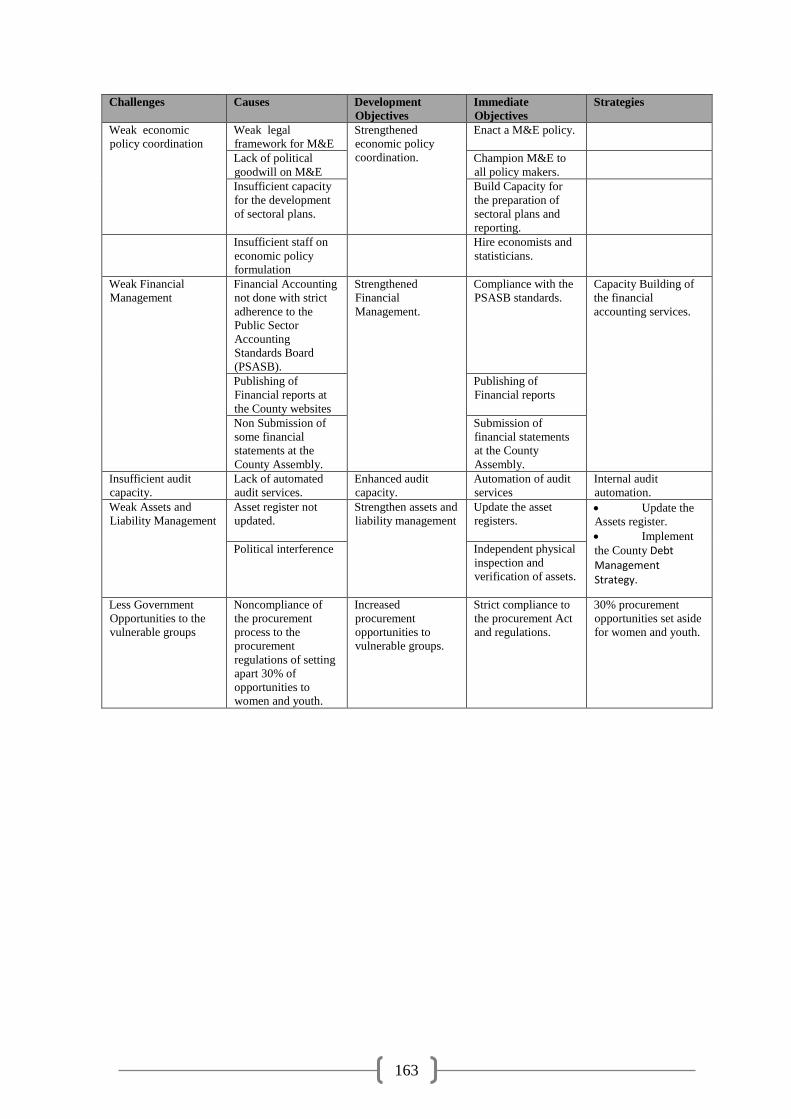
163
Challenges Causes Development
Objectives
Immediate
Objectives
Strategies
Weak economic
policy coordination
Weak legal
framework for M&E
Strengthened
economic policy
coordination.
Enact a M&E policy.
Lack of political
goodwill on M&E
Champion M&E to
all policy makers.
Insufficient capacity
for the development
of sectoral plans.
Build Capacity for
the preparation of
sectoral plans and
reporting.
Insufficient staff on
economic policy
formulation
Hire economists and
statisticians.
Weak Financial
Management
Financial Accounting
not done with strict
adherence to the
Public Sector
Accounting
Standards Board
(PSASB).
Strengthened
Financial
Management.
Compliance with the
PSASB standards.
Capacity Building of
the financial
accounting services.
Publishing of
Financial reports at
the County websites
Publishing of
Financial reports
Non Submission of
some financial
statements at the
County Assembly.
Submission of
financial statements
at the County
Assembly.
Insufficient audit
capacity.
Lack of automated
audit services.
Enhanced audit
capacity.
Automation of audit
services
Internal audit
automation.
Weak Assets and
Liability Management
Asset register not
updated.
Strengthen assets and
liability management
Update the asset
registers.
Update the
Assets register.
Implement
the County Debt Management Strategy.
Political interference Independent physical
inspection and
verification of assets.
Less Government
Opportunities to the
vulnerable groups
Noncompliance of
the procurement
process to the
procurement
regulations of setting
apart 30% of
opportunities to
women and youth.
Increased
procurement
opportunities to
vulnerable groups.
Strict compliance to
the procurement Act
and regulations.
30% procurement
opportunities set aside
for women and youth.

164
a. Sub-Sector Programmes – Economic Planning Sub Programme Key Outcome Key performance
Indicators
Planned Targets Total Budget
(M) Year 1 Year 2 Year 3 Year 4 Year 5
Programme Name: To be an institution of excellence in economic planning and financial management.
Objective: To pursue prudent economic, fiscal, and monetary policies and effectively coordinate government financial operations for rapid and sustainable development of Tana River County.
Expand and Equip
Tana River Sub-
County
Information and
Documentation
Centre
To improve planning
for development the
community and
operation of the
CIDC
% level of
completion Sub-
County Information
and Documentation
Centre
50 70 100 32.8
Community
Empowerment
To strengthen the
capacity of
communities to
participate in
development
activities.
No. capacity
buildings trainings
2 2 2 2 2 13.6
Social Intelligence
Reporting
To provide a
platform for the
engagement of all
stakeholders in social
development
No. of SIR 1 1 1 1 1 12.2
Monitoring and
Evaluation
Ensure proper
implementation of
projects and
programmes.
No. of quarterly;
participatory
monitoring and
evaluation;
4 4 4 4 4 19.6
Strategic
Leadership and
Efficiency
Monitoring
To improve service
delivery and
coordination of
services
Percentage increase
in the level of
satisfaction with
quality of service by
customers
40 50 65 80 90 10
Service charter
developed and
cascaded
1 3
Percentage increase
in timely service
delivery of services
(Schedule
Performance Index -
SPI)
50
(SPI 1)
65
(SPI 1)
75
(SPI 1)
85
(SPI 1)
100
(SPI 1)
50
Percentage increase
in cost effectiveness
35
(>1)
45
(>1)
60
(>1)
75
(>1)
100 (>1) 60

165
Sub Programme Key Outcome Key performance
Indicators
Planned Targets Total Budget
(M) Year 1 Year 2 Year 3 Year 4 Year 5
of service delivery
(Cost Performance
Index - CPI)
Economic
Planning,
budgeting and
Policy
Coordination
To link planning,
budgeting and policy
Number of
development plans
prepared/reviewed
5 4 4 4 4 100
Sector plans prepared 8 8 8 8 8 50
Number of reports
prepared on SDGs
1 1 1 1 1 10
No. of financial
reports/reviews done
4 4 4 4 4 10
Budget preparation
coordination
To strengthen budget
implementation
% absorption of
allocated funds
100 100 100 100 100 0.5
Levels of compliance
with the budgetary
preparation timelines
100 100 100 100 100 0.5
Percentage increase
in the participation of
the state and non-
state actors in the
budget cycle
95 100 100 100 100 15
County Statistics
and research
To enhance
development
planning in the
county
County Statistical
Abstract
1 1 1 1 1 10
Number of research
studies/ surveys
undertaken
1 1 1 1 1 25
Baseline survey on
access to essential
services in the county
1 10
An automated
monitoring and
evaluation system
1 1 1 1 1 50
Monitoring and
Evaluation
To track
implementation of
programmes and
projects
Monitoring and
evaluation
framework
1 10
Handbook of
reporting indicators
1 5
CMES established
and operationalized
1 10

166
Sub Programme Key Outcome Key performance
Indicators
Planned Targets Total Budget
(M) Year 1 Year 2 Year 3 Year 4 Year 5
County performance
review reports
4 4 4 4 4 50
b. Sub-Sector Programmes - Human Resource Sub-Programme Key Outcome Key Performance
Indicators
Planned Targets Total Budget
(M) Year 1 Year 2 Year 3 Year 4 Year 5
Programme Name :Human resource management and development
Objective :To improve service delivery in the county government
Outcome: Improved public service delivery
Training and staff
development of all
categories of
employees of the
county for effective
and efficient
performance
To improve
employee work
performance and
enhance
achievement of the
departmental and
individual goals
Proportion of
employees trained
100 100 100 100 100 109.9
Effectiveness and
efficiency in
service delivery
improved
Proportion of
departments on PC
100 100 100 100 100
Proportion of staff
on PAS
100 100 100 100 100
Create HRIMS
where information
can be accessed
with ease,
modernize and
automate record
management
system for quick
retrieval of records
HRIMS 1

167
c. Sub-Sector Programmes - Revenue Sub Programme Key Outcome Key
Performance
Indicators
Planned Targets Total Budget
(M) Year 1 Year 2 Year 3 Year 4 Year 5
Programme Name: General Administration and Support Services
Objective: To enhance and improve service delivery
Outcome: Improved service delivery
Administrative
Services
Staff trained to improve staff
capacity and to strengthen staff
capacity on Modern Revenue
collection Technic and in
development of collection
technology
No of staff
trained
17 12
12 12 12 183.2
Programme 2: Revenue Management
Objective: To improve revenue collection and avoid pilferage
Outcome: Enhanced revenue collection
Resource mobilization
program/Mapping Database
Management systems
To enhance and mobilize local
revenue resources for the county
Annual
resource
mapping
reports on
revenue
performance
1 1 1 1 1 50
Automation of Revenue
operation
Revenue collection enhanced
through the review and evaluation
of the automated revenue system.
Automated
Revenue
operation
1 1 1 1 1 120
Refurbishment of Revenue
Sub county offices
To improve working environment
for revenue collection
No. of sub-
county offices
refurbished
1 1 1 1 1 20
Installation of Revenue
collection points
(Refurbishment containers at
the following collection
points
To bring services closer to the tax
payers
Revenue
collection
points installed
3 3 3 3 3 40
Purchase of 5 Supervision
vehicle and 10 Motor bikes
To improve revenue supervision
and surveillance
No. of motor
vehicles
1 1 1 1 1 40
No. of motor
bikes
2 2 2 2 2

168
d. Sub-Sector Programmes - Finance Sub Programme Key output Key performance indicators Baseline Planned Targets Total
Budget (M) 2017 Year 1 Year 2 Year 3 Year 4 Year 5
Programme 1: General Administration, Planning and Support Services
Objective: To facilitate general administrative, planning and support services
Outcome: Enhanced institutional capacity and efficient service delivery
General Administrative
and support Services
(AIE)
To enhance departmental
capacity and conducive work
environment for quality
service delivery
Level of implementation of the county
payroll
100 100 100 100 100 763.9
Programme 2: County Treasury Services
Objective: To strengthen planning, budgeting, policy formulation and financial management
Outcome: Enhanced fiscal responsibility and coordination economic Development
Economic Planning &
Budgeting
Legal and regulatory
frameworks Governing
formulation, preparation
and implementation of
budget adhered to
No. of Budget circular released 1 1 1 1 1 1 -
No. of appropriation bill generated 1 1 1 1 1 1 1
No. of policies and strategies in place. 1 3 1 1 1 1 2.1
% of gender responsive budgeting 30% 30% 30% 30% 30% -
Stakeholders involved in
Planning and Budget
preparation
process(participatory
budgeting and planning)
No. of stakeholders mobilized and
involved
100 100 100 100 100 100 4
No. of forums held in Budget
preparation
1 1 1 1 1 1 10
No. of annual development Plans
developed
1 1 1 1 1 1 12.5
No. Budget review and outlook paper
prepared
1 1 1 1 1 1 2.5
No. County Fiscal Strategy Paper
Prepared
1 1 1 1 1 1 7.5
No. of programme based budgets
developed
1 1 1 1 1 1 10
No. of Itemized budgets prepared 1 1 1 1 1 1 5
CIDP II prepared No. of CIDP document in place 1 13
CIDP Reviewed No. of reviews 1 1 12
Monitoring, evaluation
and reporting
Accurate, Reliable &
updated Reports.
No. of reports published 1 4 4 4 4 4 1
Performance reviewed, No. of M & E Reports prepared 1 4 4 4 4 4 5
Handbook on key performance
indicators,
0 1 1 1 1 1 0.25
No. of trainings on M&E 6 2 1 1 1 1 3

169
No. of Copies of updated County
Factsheet(s)
1 1 1 1 1 1 5
Installation and
operationalization of
Electronic County
Information Monitoring
and Evaluation System (e-
CIMES)
Training conducted and population of
the system
0 1 - - - - 7
% of projects completed within the
stipulated timelines
61% 80% 87% 95% 100% 100% -
Statistical surveys
undertaken and data
analysis carried out
No of surveys done, 0 1 1 1 1 1 6
No. of electronic database systems
installed
0 - 1 - - - 5
No. of updated reports 1 1 1 1 1 1 -
Dissemination of
information and policies
No. of documents and policies
disseminated
8 10 5 5 5 5 4.5
Accounting Service Cash management No. of compliance statements 8 8 8 8 8 8 -
Debt management % of debt vis-a- vis the budget 16% 15% 13% 12% 11% 10% -
Compliance to accounting
standards
% of compliance 80% 100% 100% 100% 100% 100% -
Financial reporting No. of reports submitted 24 24 24 24 24 24 -
Financial advisories No. of advisory circulars 4 4 4 4 4 4 -
Integrated IFMIS support
functions
No of modules implemented 2 3 - - - - 3.45
Supply Chain
Management
Evaluated tenders within
stipulated time frame
% of evaluations done 75% 80% 85% 90% 100% 100% 0.455
Inventory management Updated inventory 1 1 1 1 1 1 -
Development of
procurement policy,
standard operating
procedures and manual
No of policy documents prepared 0 1 1 1 - - 0.3
Installed Inventory
management system
software
No of software procured 0 1 - - - - 2
Construction of inventory
storage block
No of storage blocks 0 3 - - - - 15
Legal and regulatory
requirements complied with
% of procurement to PWDs, Women
and Youth (AGPO)
24% 30% 30% 30% 30% 30% -

170
e. Sub-Sector Programmes - Devolution Sub Programme Key Output Key Performance
Indicators
Planned Targets Total Budget
(M) Year 1 Year 2 Year 3 Year 4 Year 5
Programme Name: To be an institution of excellence in economic planning and financial management.
Objective: To pursue prudent economic, fiscal, and monetary policies and effectively coordinate government financial operations for rapid and sustainable development of Tana River County.
Outcome:To improve service delivery to devolved units
Facilitation of
investment for
active participation
and involvement of
stakeholders in
trade fairs and
exhibits, investment
forums, summits
and conferences,
missions and
investment
consultation
workshops
Increased
investment
potential and
resource utilization
for socio economic
growth of frontier
counties
% level of
participation of
stakeholders in
county functions
100 100 100 100 100 54.9
Spatial
Development for
promotion and
achievement of
physical integration
among key
economic clusters
in the frontier
region.
Developed and
utilized key
physical
infrastructure to
promote and
enhance trade and
investment volumes
Spatial plan 1 67.2
Technology and
ICT development
for Enabled
Livelihoods
Intervention and
Natural Resources
Enhancement
Enabled
Sustainable
Livelihoods
adopting
watersheds for
ecological value
and human
survival; Change
management
Strategies adopted
in sustainable
livelihoods
initiatives
No. of mapped and
assessed watershed
resources included
in ecological
initiatives
1 1 1 1 1 22.6

171
Sub Programme Key Output Key Performance
Indicators
Planned Targets Total Budget
(M) Year 1 Year 2 Year 3 Year 4 Year 5
Energy
Development
Established energy
development
committee
spearheading and
coordinating efforts
of FCDC; Flagship
programmes in
renewable energy
development and
power generation
FCDC Energy
Development
committee; No. of
reports
1 1 1 1 1 13.4
Knowledge
resource and Policy
Development
An established
policy and
knowledge resource
database of experts;
Academic and
research institutions
providing
knowledge for
evidence based
interventions
Research and
knowledge
database centre
established
1 1 17.1
Peace, Cohesion
and Security
Establishment of
the Frontier peace
and development
Committee to serve
a coordinating and
advisory role;
Integrated relevant
policies for better
collaboration
among concerned
agencies. with a
direct impact on
peace and
development
security
A peace and
development
committee
established and
initiatives
established as a
result of
coordination and
integration
1 10.4
Topographic
Mapping
Established
partnerships with
FCDC, National
Geological
Mapping & Survey
No of partnerships
established with
state and non-state
actors
1 1 8.2

172
Sub Programme Key Output Key Performance
Indicators
Planned Targets Total Budget
(M) Year 1 Year 2 Year 3 Year 4 Year 5
as prospective
investors and
implementing
partners
a. Sub-Sector Programmes - County Public Service Board Sub Programme Key Output Baseline Key performance
Indicators
Planned Targets Total
Budget Year 1 Year 2 Year 3 Year 4 Year 5
Target Cost
(M)
Target Cost
(M)
Target Cost
(M)
Target Cost
(M)
Target Cost
(M)
Programme Name: General Administration and Support Services
Objective: To build and strengthen the Board’s capacity to execute its mandate
Outcome: Quality, effective and efficient service delivery
Administrative and
Support Services
Enhanced Board
Capacity
No. of policies formulated 4 69 4
69 4 69 4 69 4 69 345
Human resource
management and
development
Motivated and
competent workforce
Quality service delivery
and minimized Staff
turnover rate
1 4.76 1 4.76 1 4.76 1 4.76 1 4.76 23.8
ICT Infrastructure & E-
services
Enhanced
communication
No. of offices Automated 5 3.08 5 3.08 5 3.08 5 3.08 5 3.08 15.4
Sub-Sector Programmes - Public Administration and Governance
Sub Programme Key Output Baseline Key performance
Indicators
Planned Targets Total
Budget Year 1 Year 2 Year 3 Year 4 Year 5
Target Cost
(M)
Target Cost
(M)
Target Cost
(M)
Target Cost
(M)
Target Cost
(M)
Programme Name: General Administration and Support Services
Objective: To build and strengthen the Board’s capacity to execute its mandate
Outcome: Quality, effective and efficient service delivery
Administrative
services
Public barazas on peace and
mainstream on HIV/Aids.
Number of barazas
held
812 812 812 812 812 8.25m
Sensitization on disaster
preparedness, response and
mitigation
Number of disaster
sensitization meetings
held
150 150 150 150 150 6m

173
Sub Programme Key Output Baseline Key performance
Indicators
Planned Targets Total
Budget Year 1 Year 2 Year 3 Year 4 Year 5
Target Cost
(M)
Target Cost
(M)
Target Cost
(M)
Target Cost
(M)
Target Cost
(M)
Sensitization crime prevention
and youth radicalization
Number of security
meetings held.
72 72 72 72 72 9.4m
Sensitization and support
issuance of birth & death cert &
IDs.
Number of vetting and
baraza forums held.
150 150 150 150 150 9.4m
Administrative
Infrastructure
development
Construction of ward offices.
Ward offices in place 15 15 15 15 15 225m
Renovation of sub-county
administration offices.
No of offices
renovated.
3 9m
Full medical cover for the
administrators
15 Medical cover in
place
60 60 60 60 60 2.6m
Establishment of no. 3 units
enforcement officer’s camp
with base commander offices
Housing units in
place.
60 60 60 900
Procurement of Office furniture Furniture in place. 1 1 1 12
Furniture in place.
Construction of parking bay 3 parking bay
constructed
1 1 1 3
Uniform for
administrators
Procure of fittings for
uniformed officers
No of uniform sets
purchased
174 174 174 174 174 40
Staffing Recruitment of office support
staffs
No of officers
recruited.
6 8 8 6 6 4.8
Trainings
Capacity building of
administrators
No of administrator
trained.
12 13 50 50 50 110
Judiciary Support the Construction of
modern courts
No of Court building
in place
1 1 1 75
Support the Construction of new
modern prison
No of prisons
facilities in place
1 1 50
Probation Establishment of children
remand home and rehabilitation
center
No of remand home
and rehabilitation
center set.
1 1 1 85
Transport, vehicles
and maintenance
Procurement of vehicles and 5
motor boats.
No of vehicles boats
bought.
3 3 3 3 3 50
Security Fencing of an AP camp and
Kenya Police station
No of erected fences. 1 1 10
Establishment of new security
posts.
No of AP and Kenya
Police posts set.
1 1 1 45

174
Sub Programme Key Output Baseline Key performance
Indicators
Planned Targets Total
Budget Year 1 Year 2 Year 3 Year 4 Year 5
Target Cost
(M)
Target Cost
(M)
Target Cost
(M)
Target Cost
(M)
Target Cost
(M)
Renovation of security houses No of houses and
toilets renovated.
1 1 1 1 1 75
Establishment of patrol bases to
enhance revenue collection.
5 No of patrol base set. 75
Monitoring and
Evaluation
Monitoring and Evaluation of
exercise.
No of exercise done
and projects
evaluated.
5 5 5 5 5 37.5

175
Cross Sectoral Impacts Programme / sub
Programme
Sector Cross-sector impact Measures to harness or mitigate the impact
Synergies Adverse Impact
Revenue Management
Services
All sectors Adequate and sufficient funding for
projects and programs
Incomplete implementation of
projects/programs Underfunding of
projects
Enforce revenue collection and increase revenue
points.
Prudent management of resources
Revenue resource mapping
ER system
Supply Chain
Management
All sectors Automation of procurement procedures
Timely procurement of services and
projects
Non completion of projects within the
stipulated timelines
Litigations
Increase in project costs
Missing out on grants
Adherence to procurement laws and policies
Full implementation of IFMIS modules
Timely requisition of projects and services by
departments
Accounting Service All sectors Timely payments for goods and services
Satisfied clients
Inaccurate financial reports
Low funds absorption rates
Delays in project/ programs
implementation
Adverse audit opinions
Training and capacity building
Adherence to financial regulations and procedures
as provided for in PFM Act
Monitoring, Evaluation
and Reporting
All sectors Improved tracking and assessment of
project implementation
Efficient utilisation of resources
Poor implementation of projects
Inaccurate status reporting
Poor quality of works
Loss of funds
Project/program objective will not be
achieved
Establish M&E unit
Acquisition and installation of electronic M&E
system
Economic Planning &
Budgeting
All sectors Enough resource for development
(resource mobilization)
Streamlined allocation of resources
Integrated economic plans
Improved funds Absorption
Improved service delivery
Quality and accountable governance
Seamless implementation of plans
Unsustainable decision making
Inadequate resources
Capacity building of technical staff
4.4.9 Governance Justice Law and Order
Vision: A cohesive, secure, just, democratic, accountable and transparent county
Mission: Ensure effective and accountable leadership geared at promoting a just, democratic and secure environment for the establishment of strong
government institutions to empower residents for the achievement of socio-economic and political development.

176
Some of the strategies will include;
i. Reducing the number of illegal fire arms in the hands of the public.
ii. Establish an intra and inter boundary conflict management committees.
iii. To provide adequate resources to the county administrators.
iv. Provide modern communication gargets e.g. radio and satellite telephones to the county enforcement officers rehabilitate and construct offices and
staff quarters for the county enforcement officers.
v. Installation of CCTV surveillance cameras in strategic locations to curb insecurity.
vi. Establish and operationalization of county early warning and response hub to support drought and conflict mitigation.
vii. Establish rapid response contingency fund.
viii. Establish and operationalize county peace secretariats.
ix. Implement targeted peace dividend projects in county.
x. Identify, assess and monitor disaster risks and enhance early warning which will foster disaster risk assessment and monitory.
xi. To encourage alternative dispute resolution framework.
xii. Mainstreaming conflict sensitive programming in development planning.
Sector Programmes Programme Activities Key Outcomes Key
Performance
Indicators
Planed Target Totals (M)
Year 1 Year 2 Year 3 Year 4 Year 5
Target Cost (M) Target Cost (M) Target Cost (M) Target Cost
(M)
Target Cost
(M)
Programme Name: General Administration and Support Services
Objective : To improve service delivery and working environment
Outcome: Improved service delivery and working environment
Administrative
services
compensation to
employees
Improved
service
delivery.
Number of staff
paid salaries.
980
940
980
940.2
980
940.5
980
940.7
980
941
4702.4
To mainstream
HIV/Aids in
public barazas
Peace, cohesive
community,
inclusive
development
programmes
Reduced
conflicts.
Harmonious
coexistence
among
communities.
812
1.65
812
1.65
812
1.65
812
1.65
812
1.65
8.25
Sensitization on
disaster
Reduced
number of
Number of
disaster
150
1.2
150
1.2
150
1.2
150 1.2
150
1.2
6.0

177
Programme Activities Key Outcomes Key
Performance
Indicators
Planed Target Totals (M)
Year 1 Year 2 Year 3 Year 4 Year 5
Target Cost (M) Target Cost (M) Target Cost (M) Target Cost
(M)
Target Cost
(M)
preparedness,
response and
mitigation.
disaster
occurrence.
sensitization
meetings held.
Structured
sensitization
programs on
crime prevention
and
radicalization
Reduced
number of
youth
embracing
radicalization.
Number of
security
meetings held.
All
1.88 All 1.88 All 1.88 All
1.88
All 1.88 9.40
Governance
Establishment of
inter and intra -
county peace
committee
Reduced border
conflict.
Number of the
Intra and Inter
county peace
committees
formed (23
expected)
20 18
20
18
20
18
20
18
20
18
90
Institutionalize
local/traditional
(ADR) peace
building
mechanism
Reduced inter
clan and ethnic
conflicts.
Number of peace
forums held.
15
20
15
20
15
20 15
20
15
20
100
Administration
of ward bursary
fund
Minimal
complaints
received.
Number of
beneficiaries of
bursaries.
Increased
transition and
retention rates.
6000 210
6500 210
7000
210
7500 210
8000
210
1.05b
Administrative
Infrastructure
development
Construction of
ward offices.
Enhanced
service delivery
Ward offices in
place.
15
225
225
Renovation of
sub-county adm
offices.
No. of offices 3
9
Full medical
cover for the
administrators
Medical cover in
place
60
300
300
2.6

178
Programme Activities Key Outcomes Key
Performance
Indicators
Planed Target Totals (M)
Year 1 Year 2 Year 3 Year 4 Year 5
Target Cost (M) Target Cost (M) Target Cost (M) Target Cost
(M)
Target Cost
(M)
Establishment of
3 no
enforcement
officer’s camp
with base
commander
office
Housing units in
place.
60 two
bed unit
houses.
900
Uniform for
administrators
Provision of
administrators
uniforms
Fitted
enforcement
officers
Uniform sets for
174
administrators
purchased
174 sets 3.5 - - - - - - - 3.5
Staffing
Recruitment of
office support
staffs
Improved
service delivery
No. of staff
recruited
(Secretaries)
3
0.54
4
0.72
4
0.72
4
0.72
3
0.54
3.24
Clerk 3 0.43 4
0.576 4
0.576
3
0.432
3
0.43
2.448
Support staff
recruited
3 0.43 4 0.576 4 0.576 3 0.432 3 0.43 2.448
Trainings
Managerial
courses
values
Improved
service delivery
Number of
administrators
trained
1
P
3.75 1 3.75 1 I.4 1 1.6 1 1.4 11.9
Judiciary Support the
Construction of
modern courts
Improved
working
environment
Court building
in place
1 30 30
Support the
Construction of
new modern
prison
Improved
rehabilitation
of offenders
Modern prisons
facilities in place
1 30 30
Supplement
Construction of
judiciary courts
Improved
service delivery
Number of court
buildings in
place
1 25 1 25 1 25 75
Probation Establishment of
children remand
home
Improved
rehabilitation
of juvenile
Number of
remand homes in
place
-
-
Hola 30
-
- T/delta
30
- - 60
Establishment of
a drug
Improved
rehabilitation
services
Number of drug
addicts
rehabilitated
- - - - 1 25 - - -

179
Programme Activities Key Outcomes Key
Performance
Indicators
Planed Target Totals (M)
Year 1 Year 2 Year 3 Year 4 Year 5
Target Cost (M) Target Cost (M) Target Cost (M) Target Cost
(M)
Target Cost
(M)
rehabilitation
centers
Procumbent of
vehicles
Improved
service delivery
Vehicles in
place.
5 10 5 10 5
10 3
6.0
- - 36
Security
Construction of
a fence at the AP
camps and
Kenya Police
stations and
renovation of AP
and police
camps
Improved
security
Number of
fenced security
installations
1
15
1
15
1
15
1
15
1
15
75

180
4.5 Flagship / County Transformative Projects
Agriculture Rural and Urban Development
Project Name Location/Sub-
County
Objective Output
/Outcome
Performance
indicators
Timeframe
(Start-End)
Implementing
Agencies
Cost
(Ksh.)
Development of Kurawa holding
ground into a livestock export
zone
Garsen South Prepare livestock for export
and sale to export slaughter
houses
Improve
farmers
earnings
No. of animals
sold
CTRG/GOK 500m
Health Project
Name
Location Objective Output /Outcome Performance indicators Timeframe
(Start-End)
Implementing
Agencies
Cost
(Kshs.)
Access to
health
services
Hola To increase access to
quality referral services
in the County
An expanded, refurbished
and well equipped County
Refferal Hospital
Renovated units as per M& E framework 2018-2022 TRCG 191.5 M
THS-UHC
(Transforming
Health
Services for
Universal
Health Care)
Tana Delta;
Tana River;
Tana North
Pregnant women,
Neonates and Children
access services under the
Transforming Health
Services for Universal
Health Care Project
Increased uptake of
Reproductive Maternal
Neonatal Child and
Adolescent Health
Interventions
Number of women accessing skilled birth
attendance
Pregnant women attending Four Ante natal
visits
Fully Immunized Child
Women accessing modern family planning
methods
2018-2022 TRCG
WORLD
BANK
DANIDA
MOH
COG
75 M
Essential
Health
Services
Tana Delta;
Tana River;
Tana North
Increase number of
residents accessing
Health Insurance
Develop a framework for
increasing penetration of
Health Insurance in the
County
Percentage of outpatient service users with
Health insurance
2018-2022 TRCG
NHIF
MOH
TBD
Education Project Name Location/Sub-
County
Objective Output
/Outcome
Performance indicators Timeframe
(Start-End)
Implementing Agencies Cost
(Ksh.)
Establishment of ECDE
college at Hola
Hola To improve Quality and
standards of early years
education
EYE training
facility
Functional EYE facility 2019/2020 TRCG 50M
Establishment of boarding
schools
Sub-county level To improve on
Accessibility and
retention
Boarding
schools
No of boarding schools 2018/2022 TRCG/National
Government/NGOs
375M

181
Project Name Location/Sub-
County
Objective Output
/Outcome
Performance indicators Timeframe
(Start-End)
Implementing Agencies Cost
(Ksh.)
Establish new VTCs Madogo, Bangale &
Kipini
To improve
Accessibility
New VTCs No of functional VTCs 2018/2020 TRCG 56M
Establish one model VTC Hola Ito mprove access and
quality in vocational
training
Model VTC Established and equipped
model VTC
2018/2020 TRCG 30M
Business incubation centre Garsen, Hola and
Bura
To Increase job
creation
Business
incubation
centers
No of functional incubation
centers constructed and
equipped
2019/2022 TRCG/NGOs 90M
Community learning
resource centres
Hola To improve reading
culture and literacy
levels
Resource centre Functional learning
resource centre
2020/2022 TRCG/National
government
60M
build one modern stadium
per sub-county
Sub-counties To Improve sports
activities
Modern
stadium
No of operational stadium 2020/2022 TRCG 150M
Establish sports talent
academy.
Hola To identify & nurture
sports talents
Sports talent
academy
Functional sports talent
academy
2020/2021 TRCG 30M
Establishment of push up
program
County to improve access to
education
Educated
people
No of beneficiaries 2018/2022 TRCG 60M
Culture, Gender and Social Services Sub-Sector Project Name Location/Sub-
County
Objective Output /Outcome Performance indicators Timeframe
(Start-
End)
Implementing Agencies Cost
(Ksh.)
Construction and
equipping of Ward
Multi-purpose/ Social
Halls
15 Wards To provide a County
facility for recreation
and public events
Promotion of
community
cohesiveness
Functional social halls 2018-2020 County Government
Department of Culture, Gender
and Social services, Partners
and donors
300M
Social Support to
PLWDs and other
vulnerable groups-,
elderly, OVCs
Countywide To empower and
Improve the lives and
welfare of PWDs,
elderly and OVCs.
Improved welfare for
the targeted individuals
and households
Number of individuals
and households
sensitized and supported
2018-2022 County Government
Department of Culture, Gender
and Social services, Partners
and donors
600M
Special Programmes Sub-Sector Project Name Location/Sub-
County
Objective Output
/Outcome
Performance
indicators
Timeframe
(Start-End)
Implementing
Agencies
Cost
(Ksh.)
Strategic mega earth pan Hiriman at
MalbeUwalHuri
Strategic water
source during
drought
Water for
food security
and livestock
use available
N0,of
household
accessed to
food and water
May 2018-
aApril2019
CG, Partners 100M

182
Project Name Location/Sub-
County
Objective Output
/Outcome
Performance
indicators
Timeframe
(Start-End)
Implementing
Agencies
Cost
(Ksh.)
Hirimani at
Walesa/Hosing
Strategic water
source during
drought
Water for
food security
and livestock
use available
N0,of
household
accessed to
food and water
May 2018-
aApril2019
CG, Partners 100M
Chewele ward at
Dolologarse
Strategic water
source during
drought
Water for
food security
and livestock
use available
N0,of
household
accessed to
food and water
May 2018-
aApril2019
CG, Partners 100M
Bangal at lagha
Tula along
Bangali-Boka road
Strategic water
source during
drought
Water for
food security
and livestock
use available
N0,of
household
accessed to
food and water
May 2018-
aApril2019
CG, Partners 100M
Wayu Boro at lagha
Danabale
Strategic water
source for
livestock and
domestic use
during drought
Water for
food security
and livestock
use available
N0,of
household
accessed to
food and water
May 2018-
aApril2019
CG, Partners 100M
Garseni west ward
Charicha area
between assa and
Kone
Strategic water
source for
livestock and
domestic use
during drought
Water for
food security
and livestock
use available
N0,of
household
accessed to
food and water
May 2019-
aApril2020
CG, Partners 100M
4 N0. Strategic bore holes Bangal, Hirmani,
Wayu and Assa
To provide
water to water
stressed areas
of the county
Water for
domestic and
livestock
available
No. of
strategic bore
holes drilled
and equipped.
May 2019-
aApril202
CG, Partners 100M
3N0.Cohesion and food security projects Garseni
Galole
Bura
To enhance
peace and
cohesion and
food security
Adequate
food at
household
level
Reduced N0.
Of households
from relief
food
April 2018-
July 2019
CG, Partners 100M
3No.Strategic pasture/hay production and storage Bura
Hola
Garsen
To promote
livestock feeds
during drought
Enhanced
household
food and
economy
during
drought
Reduced
vulnerability
to drought
April 2018-
July 2019
CG, Partners 100M
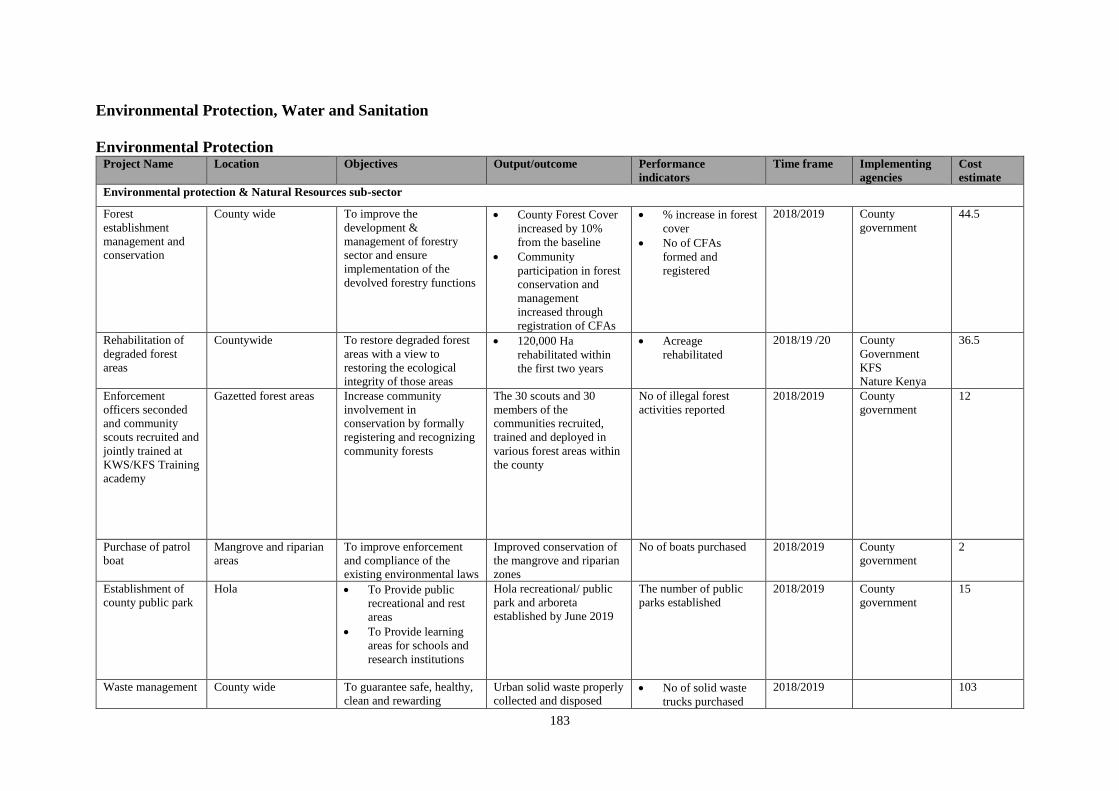
183
Environmental Protection, Water and Sanitation
Environmental Protection Project Name
Location Objectives Output/outcome Performance
indicators
Time frame Implementing
agencies
Cost
estimate
Environmental protection & Natural Resources sub-sector
Forest
establishment
management and
conservation
County wide To improve the
development &
management of forestry
sector and ensure
implementation of the
devolved forestry functions
County Forest Cover
increased by 10%
from the baseline
Community
participation in forest
conservation and
management
increased through
registration of CFAs
% increase in forest
cover
No of CFAs
formed and
registered
2018/2019 County
government
44.5
Rehabilitation of
degraded forest
areas
Countywide To restore degraded forest
areas with a view to
restoring the ecological
integrity of those areas
120,000 Ha
rehabilitated within
the first two years
Acreage
rehabilitated
2018/19 /20 County
Government
KFS
Nature Kenya
36.5
Enforcement
officers seconded
and community
scouts recruited and
jointly trained at
KWS/KFS Training
academy
Gazetted forest areas Increase community
involvement in
conservation by formally
registering and recognizing
community forests
The 30 scouts and 30
members of the
communities recruited,
trained and deployed in
various forest areas within
the county
No of illegal forest
activities reported
2018/2019 County
government
12
Purchase of patrol
boat
Mangrove and riparian
areas
To improve enforcement
and compliance of the
existing environmental laws
Improved conservation of
the mangrove and riparian
zones
No of boats purchased 2018/2019 County
government
2
Establishment of
county public park
Hola To Provide public
recreational and rest
areas
To Provide learning
areas for schools and
research institutions
Hola recreational/ public
park and arboreta
established by June 2019
The number of public
parks established
2018/2019 County
government
15
Waste management County wide To guarantee safe, healthy,
clean and rewarding
Urban solid waste properly
collected and disposed No of solid waste
trucks purchased
2018/2019 103

184
Project Name
Location Objectives Output/outcome Performance
indicators
Time frame Implementing
agencies
Cost
estimate
environment for the
residents
No of employees
engaged in solid
waste management
Cleanliness levels
within urban areas
County
government
Institute Anti-
poaching measures
and problem animal
control (PAC)
County wide 1. Reduce incidences of
poaching within the
county
2. Reduced incidence of
human wildlife
conflict
Poaching levels
reduced by 30% by
June 2018
Incidences of HWCs
reduced and
agricultural
productions increased
and sustained
No of poaching
incidences reported
and prosecuted
No of Human
Wildlife Conflict
situations reported
and dealt with
Continuous County
government
Kenya wildlife
service
10.2
Water and Sanitation Sub-Sector Project Name
Location Objectives Output/outcome Performance
indicators
Time frame Implementing
agencies
Cost estimate
Consultancy services for an
integrated masterplan for all
water resources
All sub-
counties
To provide
effective
management of
water services that
is efficient,
affordable, reliable
and sustainable
To ensure efficient
use of resources in
implementation of
the water sector
budgets
Effective
management of
water services that
is efficient,
affordable, reliable
and sustainable
All water resources
identified and
mapped
Proper planning in
the distribution of
resources
2018-2019 TRCG/FAO 6M
Relocation and upgrading of the
Hola water works
Hole and
its
environs
Increase capacity of
water supply to
5,000cm/day
Sink larger
diameter boreholes
Land purchased
New water works
constructed
2018-2019 TRCG/NG and donor
partners
500M

185
Project Name
Location Objectives Output/outcome Performance
indicators
Time frame Implementing
agencies
Cost estimate
Upgrading of the Ngao water
supplies
Nago
Location,
Tana
Delta
Sink larger
diameter boreholes
Increase capacity of
the water supply to
meet the water
demand
Increased access to
potable water
2018-2019 TRCG and donor
partners
100M
Construction of 90km Bura-
Chifiri-Wayu water pipeline
Tana
North and
Tana
Delta sub-
Counties
Water supply to the
hinterland
Increased access to
potable quality and
safe water
2018-2022 TRCG/NG and donor
partners
540M
Construction of 50Km Bura-
Hola water pipeline project
TN and
TR SCs
Water supply to the
hinterland
Increased access to
potable quality and
safe water
2018-2022 TRCG/NG/DONOR
PARTNER
300M
Construction of Handampia
water supply in Mikinduni Ward
Water supply to the
hinterland
Increased access to
potable quality and
safe water
2018-2019 TRCG 20M
Purchase of back-up power units
for 5No. water supplies
For all the
water
supplies
To supplement
power rationing to
water works
Continuous supply
of water
2018-2020 TRCG 25M
Purchase of 7No. Water bowsers All sub-
counties
Water trucking to
needy areas during
emergencies
Prompt service
delivery to the
community
Reduce cost of
construction and
desilting of water
pans
Reduced
vulnerability to
drought impact
2018-2019 TRCG 84M
Purchase of 3No. Bulldozers
(D10) machine
All Sub-
Counties
Prompt service
delivery
Increased revenue
base for the county
government
Revenue base for
the County
Government
Reduce cost of
construction and
desilting of water
pans
2018-2022 TRCG 75M
Purchase of 3No. Drilling Rigs All sub-
counties
Reduced cost of
drilling of
boreholes
Direct
implementation of
Revenue base for
the County
Government
Reduce cost of
construction and
2018-2022 TRCG 60M

186
Project Name
Location Objectives Output/outcome Performance
indicators
Time frame Implementing
agencies
Cost estimate
water projects by
the county
government
desilting of water
pans
Conduct hydrological surveys
on sinking of dedicated larger
diameter boreholes (3sites) in 4
water supplies,
Hola,
Ngao,
Madogo and
Garsen
All water
supplies
Mapping out
potential
groundwater
resources for
immediate tapping,
conservation and
strategic allocation
Increased water
supply to meet the
increase water
demand
Increased access to
quality and safe
water
Planning for sinking
of boreholes
2018-2019 TRCG 1M
Conduct hydrological surveys
whose report will give direction
of where to invest in ground
water within the county. Each
sub county 360 sites
All sub-
counties
Mapping out
potential
groundwater
resources for
immediate tapping,
conservation and
strategic allocation
Increased water
supply to meet the
increase water
demand
Increased access to
portable water
2018-2019 TRCG 1M
Construction of Kipini water
supplies
Kipini in
Tana
Delta
S/County
Increased access to
quality and safe
water
Piped water supply
and distribution in
Kipini Town
2018-2019 TRCG 50M
Consultancy services for
construction of 100-300m3
capacity small dams (3 per sub-
county)
All sub-
Counties
Feasibility done and
recommendations
done
Identification of
new sites
6No. mega dams
constructed, 2 in
every sub-county
2018-2022 TRCG 36M
Construction of a 9km water
supply pipeline from Minjila to
Dalu
Dalu
location in
Tana
Delta
Increased access to
portable and safe
water
Piped water
supplied to Dalu
2018-2019 TRCG 22.5M
Sinking of larger diameter
boreholes in Wema, Vungwe
and Hewani villages
Wema in
Salama
location
Increased access to
quality and safe
water
Water supplied to
Wema, Vungwe,
Hewani and Kulesa
Reduced distance to
water points
2018-2019 TRCG 20M
Construction of 35km pipeline
extension from Tarasaa to
Hurara settlement;
Hurara,
Tana
Delta
Increased access to
quality and safe
water
Water pipeline
constructed and
operational
2018-2022 TRCG 100M

187
Project Name
Location Objectives Output/outcome Performance
indicators
Time frame Implementing
agencies
Cost estimate
Reduced distance to
water points
Purchase of pipes & fittings for
repair of water supplies
(Madogo, Bura, Hola, Garsen
and Ngao)
All water
works
Prompt
maintenance and
rehabilitation of our
water works
Continuous supply
of water in all water
works
2018-2019 TRCG 8M
Diversion of the Kitere brook in
Kitere
Garsen
North
ward
Restoration of flow
of water along the
channel to Wema
Water flow restored
in the Kitere
channel
Irrigation schemes
operational
2018-2022 TRCG/NG 50M
Construction of a 3km Hola
primary -Malindi ya ngwena
water pipeline extension
Hola Increased access to
piped water
Reduced distance to
water points
Increased access to
quality and safe
water
2018-2019 TRCG 10M
Construction of Kalalani water
supply
Waldena Increased access to
potable and safe
water
Reduced distance to
water points
Continuous supply
of piped water
2018-2019 TRCG 20M
Construction of a 25km Tana
High-Haroresa water pipeline
extension
Kalkacha Increased access to
piped water
Reduced distance to
water points
Continuous supply
of piped water
2018-2020 TRCG/DONOR
PARTNER
65M
Construction of Lakole water
supply
Chifiri Increased access to
potable and safe
water
Reduced distance to
water points
Water supply
constructed and
operational
2018-2019 TRCG 20M
Construction of 14km Madogo
to KBC water pipeline
Sala Increased access to
piped water
Reduced distance to
water points
Water pipeline
constructed and
operational
2018-2019 TRCG 35M
Construction of 15km KBC to
Hamares water pipeline
extension
Sala Increased access to
piped water
Reduced distance to
water points
Water pipeline
constructed and
operational
2018-2020 TRCG 37.5

188
Project Name
Location Objectives Output/outcome Performance
indicators
Time frame Implementing
agencies
Cost estimate
Construction of Kaniki water
supply
Bangale Increased access to
potable and safe
water
Reduced distance to
water points
Water supply
constructed and
operational
2018-2019 TRCG 20M
Construction of Titila Muka
water supply with a pipeline to
Taqe
Hirimani Increased access to
potable and safe
water
Reduced distance to
water points
Water supply
constructed and
operational
2018-2019 TRCG 20M
Construction of Handaraku
water supply in Kipini west
ward
Wachu
Oda
Increased access to
potable and safe
water
Reduced distance to
water points
Water supply
constructed and
operational
2018-2019 TRCG 20M
Construction of Wema water
supply
Garsen Increased access to
potable and safe
water
Reduced distance to
water points
Water supply
constructed and
operational
2018-2019 TRCG 20M
Consultancy services on the
rehabilitation of Matomba
Brook (closure) diversion
channel
Garsen
Central
Restored river
channel to Ngao,
Tarasaa, Oda,
Kipao, Mandingo,
Chara
Reduced distance to
water points
Irrigation of
farmlands
Water for livestock
at the delta
2018-2019 TRCG, NG and FAO

189
CHAPTER FIVE
IMPLEMENTATION FRAMEWORK
5.0 Introduction
The chapter outlines the institutional framework and organizational flow that will be followed
in implementing the plan. It outlines the stakeholders in the county, and the roles that they play
and how their functions are accommodated to avoid duplication.
5.2 Institutional Framework The CIDP 2013-2017 envisaged a seamless intergovernmental relation between national
government entities and County Government entities. Lessons learnt from implementing the first
CIDP revealed a spontaneous viewpoint in ‘integration’ of the County and National development
planning effort in the region. Therefore, the County Government has endeavoured to make the
necessary adjustments in policy strategy and institutional arrangement to help streamline any
foreseeable bottleneck in plan execution. Figure below illustrate the revised county organogram
with interactions of various entities relevant in the implementation of the 2nd CIDP 2018-2022.
The County Government will continue to abide by the general policy directions of the National
Development agenda espoused of the Vision 2030 and its 3rd MTP 2018-2022. County
Government shall ensure that that there shall be effective linkage between planning and
budgeting further compliance with the provisions of the PFM Act 2012 and the CG Act 2012.
The County Department of Finance and Economic Planning shall be the lead agent in
spearheading coordination of the plan implementation. Chapter Six of this plan document
contains the procedure for programme/project monitoring and reporting in order to collect,
analyse and interpret data on progress being made. The County Government will continue to
pursue partnerships and collaboration with the equivalent National Government entities in order
to help mobilise more resources for project financing beyond normal projected revenue streams.
Additional the County Government will create the enabling environment in order to encourage
for stakeholders’ participation in private sector and other non-state partners in development. Of
importance will be to further ensure coordination’s between development agents across the levels
of Government and non-state actors in order to eliminate duplication in delivery of public good
and service.

190
5.3 Resource Requirements by Sector
Table 5-1 shows the resource requirements by sector. In the next five years, the county will
require Kshs. 48.8 billion. Majority of the monies (23.9%) will be required in the provision of
water and environmental conservation, followed by Social Protection, Culture, Gender, Social
Services and Special Programmes (18.5%); Health (13.5%); and Agriculture, Livestock, Fisheries And
Cooperatives (13.3%).
Table 5-1: Summary of Proposed Budget by Sector
Sector Name Amount (Ksh. Million) As a Percentage (%) of
the Total Budget
Agriculture, Livestock, Fisheries And
Cooperatives
7,105.2 13.3
Education 2,356.5 4.9
Energy, Physical Infrastructure And ICT 480.7 1.0
Integrated Development Plan; Provide linkage between planning budgeting implementation and Annual performance review & reporting
Sub-County Administration; Coordinate projects implementation, monitoring & reporting at the sub county
level
County Assembly; Provide representation of electorate, oversight in plan implementation; legislation of policy gap areas.
Public /Community Based Organizations and Non State Actors; Public participation in project identification and implementation; Community social audit; Community contribution; Project sustainability; project beneficiaries and ownership
Ward Administration; Coordinate projects implementation, monitoring & reporting at the ward level Provide interface for liaison with the community agents to conduct performance reviews
Business Community Participate in programme/project implementation in PPP
arrangements.
Development agencies/partners; Bridge financial resource gaps and technical aid in plan execution
Semi-autonomous; government agencies such as: KeRRA, KURA, REA, CDF, KWS, KFS to implement complementary projects/programme
Senate/ National
Assembly
Legislation of the County Allocation of Revenue bills and other laws relevant to County Governments
County Executive
Coordination& implementation of the proposed Programmes and projects; Policy formulation and implementation;
National Government (Executive)
General policy guidance, technical assistance; transfer of nationally raised
revenues; collaboration in implementation of flagship projects and
other related priority Programmes
Figure: CIDP 2018-2022 Implementation Organogram

191
Environmental Protection And
Water & Sanitation
11,489.9 23.9
General Economics, Commercial and
Labour Affairs
2,821.6
5.9
Governance Justice, Law and order 6,382.2 13.3
Health 6,503.5 13.5
Public Administration and
Intergovernmental relations
2,737.5
5.7
Social Protection, Culture, Gender,
Social Services And Special Programmes
8,881.4
18.5
Total 48,758.5 100

192
5.4 The Resource Mobilization Framework
The ability of the County Government to raise revenues and allocate resources to meet various
competing needs, has a direct bearing on the level of economic and social development that will
be achieved. Prioritization of scarce resources is therefore key in the budget making process. The
County Government is mandated to coordinate the County Strategic Plan Preparation process
aligned to the Medium Term Expenditure Frame Work (MTEF).
The county government will prepare fiscal framework and factor in macro issues-unemployment,
price of basic foodstuffs and general cost of living at the county level while formulating and
outlining sources of potential Revenues and estimated Expenditures. In most cases revenues are
not enough to meet the expenditure demands, In such cases we end up with a deficit (Revenue
minus expenditures) and to fund this deficit the County Government will have to mobilize
additional resources. Resource allocation focuses on County priorities that ensure that budget
proposal gives priority to programmes that will contribute to growth of the county economy and
raising the levels of income per capita, focus on poverty alleviation and increasing job
opportunities, completion of ongoing projects, communities/stakeholders have identified and
recognized as important through public participation and are sustainable within the projected
fiscal framework for the MTEF period.
Sources of revenue for the county government will include but not limited to, transfers from the
Central Government, Appropriation in Aid (A.I.A), fees and fines collected amongst others.
Public Financial Management Act 2012 repealed the External Loans Act Cap 422, Internal
Loans Act Cap 420 and the National Government Loans Guarantee Act, 2011.
5.4.1 Asset Management
A proper record of assets is absolutely essential as foundation for effective management.
Comprehensive & timely data needed for will be required for Monitoring liabilities and getting
early warning of possible problems. Active management of assets cannot happen without
availability of comprehensive assets information.
i. Automation to enhance public finance management-IFMIS and e-ProMIS
ii. Assets management and recording system
In the fiscal framework, financing is one of the key pillars that determine the implementation of
the identified line of expenses.
In Tana River County, various approaches will be explored to increase the pool of revenue
available; Resuscitation and establishment of new projects having higher revenue generation
potentials:
Industry: Tana County will develop legislation on fishing sector, and how to tap on the
foreigners that extract goods and services from the County. Working relationships will be
established, with Malindi Bay and Ungwana Bay to maximize returns from the sector.
Mango processing industry if well-structured and invested in, is expected to produce about 30
tonnes daily. Approximately, 20 million mangoes per year are to be exported, and revenue of
about 1.5 billion per billion per annum.

193
Livestock Industry will be developed through establishing an abattoir in Garsen to handle about
150 heads of animals per day. This is projected to be able to generate Kshs. 6 billion per annum.
Exportation of livestock is envisaged to play a key role in the economy of Tana, and capable of
generating more than Kshs. 3 billion annually. Feasibility study will be prepared in order to
establish the potential of Milk processing plant in Garsen.
Tourism: Revival of tourism industry in the Tana County through targeting a minimum of 1000
visitors and means of entrenching and enhancing absorption of tourists spending locally. This
will require diversification of tourist’s attractions and recreational facilities in the County.
Agriculture: Tree planting will be enhanced in the County, through allocation of land for forest.
This provides an opportunity to tap into Carbon Financing scheme. Dams will be constructed in
the geographic areas of Hiriami (Bura), Galole (Hola), Kokami (Garsen) and Saga Buma in
Garsen. The dams are expected to provide foundation for tree planting, fishing and water facility
sports.
Financial Management Strategies: PFMA 2012 and the Medium Term Expenditure
Framework stipulate best practices for the management of public resources. MTEF is a
transparent planning and budget formulation process, that aims at improving decision making
process to link policies, requirements & priorities within limited resource constraints. The
objective of MTEF is to enhance comprehensive & realistic framework for planning and
management of public resources, Increase predictability of resources through a structural budget
planning process that provides a more reliable estimates of revenues and expenditures over a 3
year period, smoothen contestability of resources where programmes compete for the limited
resources and demand accountability for performance-allocations linked to projected outputs and
policy outcomes.
Other mechanisms of attracting revenue in Tana County will include;
1. Cess collection
2. Land rent and plot rent
3. Bill boards and sign bill boards
4. Parking fee in the towns of Hola, Bura, Madogo and Garsen
5. Attracting investment in the county through effective business regulations
Table 1: Revenue Projections Type of Revenue 2018 (Ksh.) 2019 (Ksh.) 2020 (Ksh.) 2021 (Ksh.) 2022 (Ksh.) Total (Ksh.)
Local revenue by category 60,000,000 66,000,000 72,600,000 79,860,000 87,846,000 366,306,000
Equitable share 5,557,800,000 5,780,112,000 6,011,316,480 6,251,769,139 6,501,839,905 30,102,837,524
Conditional grants 939,429,663 939,429,663 939,429,663 939,429,663 939,429,663 4,697,148,315
Equalization fund 859,000,000 893,360,000 929,094,400 966,258,176 1,004,908,503 4,652,621,079
Other sources (Specify) 1,663,125,981 1,722,031,469 1,783,373,908 1,847,258,850 1,913,796,874 8,929,587,082
Total 9,079,355,644 9,400,933,132 9,735,814,451 10,084,575,828 10,447,820,945 48,748,500,000

194
CHAPTER SIX
MONITORING AND EVALUATION FRAMEWORK
6.1 Introduction
This chapter specifies programmes/projects to be implemented during the plan period. It also outlines
objectively verifiable outcome indicators that will be used to monitor project/program implementation,
and sets both medium term and end term milestones for impact assessment.
It will be necessary to have in place an effective monitoring and evaluation system to track the
implementation of the projects and programmes which will be a continuous process to assess the extent
to which development objectives and targets set in the plan have been achieved.
6.2 Institutional Framework for Monitoring and Evaluation in the County
At the National level, Monitoring and Evaluation is conducted through National Integrated Monitoring
and Evaluation System (NIMES), whose main aim is to improve the effectiveness and quality of tracking
of implementation of various development policies, strategies and programmes. The County and lower
level monitoring and evaluation of projects and programmes are part of this system. The County will
put in place a functional County Monitoring and Evaluation System to serve the needs of the county
government, while complimenting the National M & E system. The system will take cognizance of the
projects and programmes included in the CIDP as well as indicators facilitating the MTEF process, and
development aspects of the county. The county will also put in place a functional CIDP delivery
coordination mechanism to enhance its delivery.
6.3 Data collection, Analysis, and Reporting
Data collection and collation will be the responsibility of individual officers in their respective
departments. However, there will be need for established systematic fashion in gathering and measuring
of the information on the targeted variables to aid in evaluating the outcomes.
6.4 M&E Outcome Indicators
The matrix below provides a summary of the programmes by sector and verifiable outcome indicators.
It also gives the current situation with mid-term and end-term milestones.
Table 6-1: Summary of M&E Outcome indicators Sector Programme Outcome Indicators Source of
Data
Reporting
Responsibilit
y
Situation in
2018
Mid-term
Target
(2020)
End-term
Target
(2023)
Agriculture and
Rural
Development
Food security,
improved
nutrition and
sustainable
agriculture
% change in tonnage of
agricultural output of
major food crops (maize,
green grams & cowpeas)
Food crops
report 2017
County
Department of
Agriculture
120,660
(12.34%)
143,170
(33.3%)
178,937
(66.6%)
% change in acreage
under major food crops
Food crops
report 2017
County
Department of
Agriculture
7139 8738
(22.4%)
13,478
(88.8%)
% decrease in no. of
households relying on
relief food
WFP Agriculture
department
44900 25000
(44%)
15000
(66%)
Agricultural
infrastructure
Development
% change in volume of
value added produce
Coast
Developmen
t Authority
report
Agriculture
department,
Stakeholders
50,000 (0%) 100,000
(100%)
150,000
(300%)

195
Sector Programme Outcome Indicators Source of
Data
Reporting
Responsibilit
y
Situation in
2018
Mid-term
Target
(2020)
End-term
Target
(2023)
% increase in number of
groups /farmers accessing
agricultural information
Extension
report
County
Department of
Agriculture
10,000
(33.3%)
11,250
(50%)
13,125
(75%)
% increase in number of
farmer groups engaged in
irrigation
NIB,
Agriculture
reports
Agriculture
department
200 (33.3%) 300 (100%) 600 (400%)
Veterinary
disease
prevention
services
% Increase in no. of
animal cases attended
22,172 County
department of
veterinary
report
County
Director of
veterinary
services
25,000 30,000
% increase no. of
carcasses inspected
13,110 County
department of
veterinary
report
County
Director of
veterinary
services
15,000 20,000
% increase in no. of youth
employed in the cottage
industry
0 County
department of
veterinary
report
County
Director of
veterinary
services
50 100
Veterinary
Services
% increase in no. of
samples collected and
analysed per year
300 County
department of
veterinary
report
County
Director of
veterinary
services
500 1,000
% increase in grade I
hides and skins
70% County
department of
veterinary
report
County
Director of
veterinary
services
80% 85%
% increase in average live
weight of cattle
250 County
department of
veterinary
report
County
Director of
veterinary
services
260 275
Physical
Planning
Services
% Increase on guided
urban development
Lands sub
sector
CEC-Lands,
CCO-Lands
and Physical
planning
Officer
Most of the
towns are
unplanned
and the
planned
towns are
overtaken
by
developmen
t hence
needs re-
planning
50% urban
centres
Planned
100% urban
centres
planned
% Increase in control of
land use and development
Lands sub
sector
CEC-Lands,
CCO-Lands
and Physical
planning
Officer
The county
has no
spatial plan
100%
% increase on guided
land use
Lands sub
sector
CEC-Lands,
CCO-Lands
and Physical
planning
Officer
County has
a land use
plan for the
delta only
50% done 100%
complete
Increase on the easiness
of access to up to date
land use data
Lands sub
sector
CEC-Lands,
CCO-Lands
and Physical
planning
Officer
County has
no
established
GIS lab
100%
established
Survey services Increase in number of
cadastral surveys done
Lands sub
sector
CEC-Lands,
CCO-Lands
and Surveyor
Most of
urban
centers and
settlement
schemes are
newly
proposed
50% urban
centers and
settlement
schemes
surveyed
100% of
urban
centers and
settlement
schemes
surveyed

196
Sector Programme Outcome Indicators Source of
Data
Reporting
Responsibilit
y
Situation in
2018
Mid-term
Target
(2020)
End-term
Target
(2023)
Increase on the number of
disputes solved
NLC CEC-Lands,
CCO-Lands,
NLC County
coordinator
and Surveyor
Many cases
of disputes
were
identified
50% of
disputes
resolved
90% of
disputes
resolved
% increase on survey
controls extended
Lands sub
sector
CEC-Lands,
CCO-Lands
and Surveyor
Most urban
centers are
not
controlled
50% of
controls
fixed
100% of
controls
fixed
Community
land
Registration
and settlement
services
Increase in number of
settlement schemes
established
Lands sub
sector
CEC-Lands,
CCO-Lands
and County
settlement
Officer
3 schemes
exist (Witu
I, Witu II
and Kipini)
5 are
proposed
50%
established
100%
established
and title
issued
Increase in security of
tenure
Lands sub
sector
CEC-Lands,
CCO-Lands
and County
Settlement
Officer
Registration
of Wayu
community
land
ongoing,
10 others
proposed
50% of the
proposed
community
land
registered
100% of the
proposed
community
land
registered
% Increase on awareness
of the land laws
Lands sub
sector
CEC-Lands,
CCO-Lands
and County
Settlement
Only Wayu
ward
residents
were
sensitized
50% of
communitie
s sensitized
100% of
communitie
s sensitized
Urban Centre
Lighting
Number of street lights
installed
Housing and
Urbanization
sub sector
CEC, CCO-
Housing and
Urbanization
50 230 500
Urban Centre
Cleaning
Tonnes of garbage
removed
Housing and
Urbanization
sub sector
CEC, CCO-
Housing and
Urbanization
100 500 1000
Litres of liquid waste
disposed
Housing and
Urbanization
sub sector
CEC, CCO-
Housing and
Urbanization
- 1250 2500
Kilometres of drains
cleaned
Housing and
Urbanization
sub sector
CEC, CCO-
Housing and
Urbanization
- 25 50
Kilometres of bushes
cleared
Housing and
Urbanization
sub sector
CEC, CCO-
Housing and
Urbanization
- 25 50
Integrated
Urban
Development
Planning
Number of Urban
Centres with integrated
plan
Housing and
Urbanization
sub sector
CEC, CCO-
Housing and
Urbanization
- 3 5
Disaster risk
preparedness
Number of fire stations
constructed
Housing and
Urbanization
sub sector
CEC, CCO-
Housing and
Urbanization
- 3 5
Number of fire engines
purchased
Housing and
Urbanization
sub sector
CEC, CCO-
Housing and
Urbanization
- 3 5
Number of personnel
recruited and trained in
fire fighting
Housing and
Urbanization
sub sector
CEC, CCO-
Housing and
Urbanization
- 25 30
Housing Number of houses
constructed
Housing and
Urbanization
sub sector
CEC, CCO-
Housing and
Urbanization
- 20 50
Number of houses
rehabilitated
Housing and
Urbanization
sub sector
CEC, CCO-
Housing and
Urbanization
3 9 15
Physical
Planning
Services
% Increased on guided
urban development
Lands sub
sector
CEC-Lands,
CCO-Lands
and Physical
Most of the
towns are
unplanned
50% urban
centres
Planned
100% urban
centres
planned

197
Sector Programme Outcome Indicators Source of
Data
Reporting
Responsibilit
y
Situation in
2018
Mid-term
Target
(2020)
End-term
Target
(2023)
planning
Officer
and the
planned
towns are
overtaken
by
developmen
t hence
needs re-
planning
% Increase in control of
land use and development
Lands sub
sector
CEC-Lands,
CCO-Lands
and Physical
planning
Officer
The county
has no
spatial plan
100%
% increase on guided
land use
Lands sub
sector
CEC-Lands,
CCO-Lands
and Physical
planning
Officer
County has
a land use
plan for the
delta only
50% done 100%
complete
Increase on the easiness
of access to up to date
land use data
lands sub
sector
CEC-Lands,
CCO-Lands
and Physical
planning
Officer
County has
no
established
GIS lab
100%
established
Survey
Services
Increase number of
cadastral surveys done
lands sub
sector
CEC-Lands,
CCO-Lands
and Surveyor
most of
urban
centers and
settlement
schemes are
newly
proposed
50% urban
centers and
settlement
schemes
surveyed
100% of
urban
centers and
settlement
schemes
surveyed
Increase on the number of
disputes solved
NLC CEC-Lands,
CCO-Lands,
NLC County
coordinator
and Surveyor
Many cases
of disputes
were
identified
50% of
disputes
resolved
90% of
disputes
resolved
% increase on survey
controls extended
lands sub
sector
CEC-Lands,
CCO-Lands
and Surveyor
Most urban
centers are
not
controlled
50% of
controls
fixed
100% of
controls
fixed
Community
land
Registration
and settlement
services
Increase number of
settlement schemes
Established
Lands sub
sector
CEC-Lands,
CCO-Lands
and County
settlement
Officer
3 schemes
exists (Witu
I, Witu II
and Kipini)
5 are
proposed
50%
established
100%
established
and title
issued
Increase security of
tenure
Lands sub
sector
CEC-Lands,
CCO-Lands
and County
Settlement
Officer
Registration
of wayu
community
land
ongoing,
10 others
proposed
50% of the
proposed
community
land
registered
100% of the
proposed
community
land
registered
% Increase on awareness
of the land laws.
Lands sub
sector
CEC-Lands,
CCO-Lands
and County
Settlement
Only wayu
ward
residents
were
sensitised
50% of
communitie
s sensitised
100% of
communitie
s sensitised
General
Economic,
Commercial and
Labour Affairs
Sector
General
administration,
planning and
support
services
% increase in the number
of clients accessing
government services
County
Department
of Trade
Trade &
Enterprise
Development
50 70 90

198
Sector Programme Outcome Indicators Source of
Data
Reporting
Responsibilit
y
Situation in
2018
Mid-term
Target
(2020)
End-term
Target
(2023)
Market
Infrastructure
Development
% increase in the volume
of trade (sales)
County
Department
of Trade
Trade &
Enterprise
Development
50 70 90
Trade
Promotion
% increase of business
start-ups
County
Department
of Trade
Trade &
Enterprise
Development
10 30 60
Business
Licensing
% increase in revenue
collection
County
Department
of Trade
Trade &
Enterprise
Development
50 70 90
Fair Trade
Practices and
Consumer
Protection
% increase in the use of
appropriate trade
equipment
County
Department
of Trade
Weights &
Measures
50 70 90
Tourism
Marketing and
Promotion
% increase in tourism
earnings
County
Department
of Tourism
Tourism 50 70 90
Tourism
Potential
Survey and
Policy
Development
% increase in tourism
earnings
County
Department
of Tourism
Tourism 50 70 90
Environmental
Protection and
Water &
Sanitation
Water Supply
Resources
Management
% increase in access to
water supplies
County
Department
of Water
County
Department of
Water
- 65 80
Reduced distance to
water points
County
Department
of Water
County
Department of
Water
10 6 5
% reduction in conflicts
between pastoralists and
farmers
County
Department
of Water
County
Department of
Water
- 10 5
% increase in hh with
improved sanitation
County
Department
of Water
County
Department of
Environment
- 65 80
Increased forest cover KFS reports County
Department of
Environment
- 10 10
Water
Harvesting and
Storage
% increase in access to
quality and safe water at
hh level
County
Department
of Water
County
Department of
Water
- 65 80
Urban Water
Supply
% increase in the no of hh
with water connections
County
Department
of Water
County
Department of
Water
- 20 40
Rural Water
Supply
% increase in access to
portable water to hh
County
Department
of Water
County
Department of
Water
- 65 80
Water Use
Efficiency
% increase in number of
automated water supplies
systems
Reduced no of bursts in
pipelines
Increased no of hh with
cold meters
Increased number of solar
powered submersible
water pumps
Reduced incidences of
cholera outbreaks
County
Department
of Water
CEC in charge
of water &
sanitation in
formulation of
policies
CCO – Water
& Sanitation
County
Assembly on
issues of
policy
CCO –
Finance and
Economic
Planning

199
Sector Programme Outcome Indicators Source of
Data
Reporting
Responsibilit
y
Situation in
2018
Mid-term
Target
(2020)
End-term
Target
(2023)
Water
sanitation
Volume of waste
generated
Department
of
Environment
Chief officer
in charge of
Water and
Sanitation
Raise Ensure all
towns are
clean
Ensure all
towns are
clean
No of environment
officers
County
Public
service board
Chief officer 1 36 36
No of solid waste trucks Department
of
Environment
Chief officer 8 8
Sewer system coverage Department
of
Environment
Chief officer 1
Kms. of trunk sewers Department
of
Environment
Chief officer Same Expect to
establish one
Forest
Development
& Enforcement
% forest cover KFS Conservator Same
Number of county
specific policy
legislations
Department
of
Environment
Chief officer 0 4 4
No of enforcement
officers and Community
scouts
Department
of
Environment
Chief officer 0 36 36
Number of patrol boats Department
of
Environment
Chief officer 0 1 1
Wildlife
management
No. of report of HWC per
day reported
KWS KWS Raise Reduction
HWC
Reduction
HWC
No. of Awareness
meeting conducted
KWS
Environment
KWS Raise Raise
The no. of management
plan
KWS
Environment
KWS
Number of functional
meteorological stations
Department
of
Environment
Director of
environment
0 3 3
Number of public
spaces/public parks
Department
of
Environment
Director of
environment
0 4 4
Volume of waste
collected
Department
of
Environment
Director of
environment
Raise Ensure all
towns are
clean
Ensure all
towns are
clean
Education Quality &
standards in
education
Increased Transition rate
from ECD to Primary
Reports from
learning
institution
Teachers, head
teachers,
education
officers
60% 80% 100%
Increased Transition rate
from VTC to TTI
Enrolment
register
VTC manager,
TTI principal
and Trainers
5% 10% 30%
Performance rate in
VTCs
Graduation
reports
Institutional
managers,
education
officer
60% 70% 90%
Enrolment &
accessibility in
education
Increased Enrolment rates
in VTC centres
Admission
register
Teachers,
institutional
managers
Education
officers
55% 75% 90%
Increased Retention rate
in ECDE
Attendance
registers
Teachers,
institutional
managers
60%
80% 90%
Increased Retention rate
in VTC
Attendance
register
Education
officers
55%
60% 80%

200
Sector Programme Outcome Indicators Source of
Data
Reporting
Responsibilit
y
Situation in
2018
Mid-term
Target
(2020)
End-term
Target
(2023)
sports
promotion,
participation
and inclusivity
Number of talented sports
persons active in sports
Sports
register
Team leader
sports officer
Sports clubs
20 30 35
Number of professional
sports persons actively
participating in sports
Sports
reports
Team leader
sports officer
Sports clubs
0 10 20
Health Administration
and Support
Services
Number of staff trained in
Senior Leadership at
Kenya School of
Government/ Strategic
Management
Human
resource
Unit, Health
department
COH 2 30 50
Number of Renovated
administration blocks for
CHMT/SCHMT
Procurement
unit, Health
Department
COH 0 4 4
Number of utility
vehicles procured per
year
Asset
register
COH 1 3 5
Number of vehicles
disposed off
Asset
register
COH 0 12 12
Number of ambulances
procured
Asset
register
COH 0 6 6
Number of motorcycles
procured
Asset
register
COH 0 15 20
Human
resources for
Health
Staff resource centre
established
Asset
Register
COH 0 100% 100%
Health
Financing
Percentage of equitable
share allocated to health
per year
Approved
Annual
Budget
COH 20.9% 26% 30%
Number of donors
reached for support
Number of concept notes
presented per year
Biannual
stakeholders
Forum
reports
County
Director
Health
1 2 yearly 2 yearly
Access to
essential health
services
Number of completed
facilities operationalized
Workload
Reports
CDH 3 15 15
Number of stalled
facilities completed and
operationalized
Asset
register,
Workload
reports
COH 0 7 7
Number of facilities
renovated
Asset
Register
COH 0 10 10
Number of new maternity
units constructed and
operationalized
Asset
Register
COH 0 5 9
Number of new facilities
constructed
Asset
register
COH 0 5 9
Number of Staff Houses
constructed
Asset
register
COH 0 12 20
Number of facilities
fenced
Asset
register
COH 0 15 23
Increased number of
functional theatres to 6
Asset
register
Workload
Reports
COH 2 4 6
Number of Mortuaries
Constructed and
operationalized
Asset
register
Workload
Reports
COH 0 3 5
Number of Incinerators
constructed
Asset
register,
Workload
reports
COH 0 3 5
Renovation works at
Ngao hospital
Asset
register
COH 0 100% 100%

201
Sector Programme Outcome Indicators Source of
Data
Reporting
Responsibilit
y
Situation in
2018
Mid-term
Target
(2020)
End-term
Target
(2023)
Number of facilities
newly connected to
Mains electricity
Asset
register
COH 0 9 15
Facilities newly fitted
with backup generator
Asset
register
COH 0 4 4
Proportion of health
facilities adequately
equipped
Asset
register
COH 50% 100% 100%
Number of facilities with
functional Accident &
Emergency Units
Asset
register
COH 0 2 4
Renovation and
upgrading of
Hola
Outpatient block
renovated
Asset
register
COH 0 100% 100%
Paediatric unit renovated Asset
register
COH 0 100% 100%
Accident and Emergency
Unit constructed
Asset
register
COH 0 100% 100%
Intensive Care Unit/ high
dependency Unit
constructed
Asset
register
COH 0 100% 100%
In-patient unit renovated Asset
register
COH 0 100% 100%
Wards completed Asset
register
COH 60% 100% 100%
Maternity unit completed Asset
register
COH 50% 100% 100%
Cabro parking yard
completed
Asset
register
COH 30% 100% 100%
General landscaping done Asset
register
COH 0 100% 100%
Increased
access to
diagnostic
health services
Number of new labs
opened (Kau, Assa, Sera,
Kalalani, Wadesa, Chifiri,
Kipao, Majengo, Bangal,
Waldena)
Workload
reports
CDH 0 10 20
% level of laboratories
equipping
Asset
register
COH 50% 100% 100%
Hola CRH lab expanded Asset
register
COH 0 100% 100%
Health
Products and
Technologies
Proportion of facilities
receiving quarterly
medical supplies
Monthly
Commodity
reports
CDH 80% 100% 100%
Maternal
Health
Increased skilled birth
attendance in the County
DHIS 2 CDH 42% 65% 80%
Maternal
Health
Increased proportion of
health facilities offering
Basic and
Comprehensive Neonatal
care
DHIS 2 CDH 10% 50% 100%
Extended
Program on
Immunization
% increase in immunized
children
DHIS CDH 58% 75% 90%
Child Health
Services
Increased proportion of
under-fives accessing
Comprehensive IMCI
services
DHIS CDH 40% 60% 80%
Adolescent
Health
Increased number of
facilities offering Youth
Friendly Services
Workload
reports
CDH 0 6 12
Nutrition
program
Reduced Global Acute
Malnutrition rate
DHIS 2 CDH 14% 7 <5 %
HIV, AIDS and
STI Control
Increased number of
facilities providing
Comprehensive HIV
Services
Workload
reports
CDH 40% 70% 100%

202
Sector Programme Outcome Indicators Source of
Data
Reporting
Responsibilit
y
Situation in
2018
Mid-term
Target
(2020)
End-term
Target
(2023)
TB, Leprosy
and Lung
Diseases
Control
Increased TB detection
rate
Workload
reports
CDH 60%
75% 95%
Increased TB cure rate Workload
reports
CDH 80% 90% > 95%
Malaria
Prevention and
Control
% increase in access to
malaria diagnosis and
treatment to community
level.
Workload
reports
CDH 65% 75% 90%
Health
Communicatio
n and
Advocacy
Proportion of wards
reached with appropriate
Health Messages
HMIS CDH 40% 100% 100%
School Health
Program
Proportion of schools
reached with school
Health Program q45
HMIS CDH 20% 50% 90%
Neglected
Tropical
Diseases
Number of quarterly
targeted activities
focusing on Filariasis,
Schistosomiasis and
snake bites
HMIS CDH 1 3 3
Community
Strategy
Increased number of new
functional Community
units
HMIS CDH 2 12 22
Communicable
disease
Control,
Disease
Surveillance
Number of focused
quarterly disease
surveillance activities
conducted per year
HMIS CDH 2 5 5
Water,
Sanitation and
Hygiene
Number of water quality
surveillance and
treatment activities
carried out yearly at
household level
HMIS CDH 2 6 6
Medical waste
management
Proportion of health
facilities in the managing
medical waste according
to guidelines
HMIS CDH < 50% 100 % 100%
General refuse
management
Number of refuse
handling inspection done
in all urban and semi
urban Centres
HMIS CDH 0 4 4
Food quality Number of Quarterly
food handling areas
inspection done in all
ward
HMIS CDH Irregular 4 4
Human waste
management
Number of Public toilets
constructed (Hola,
Gofisa, Walderna, Titila,
Daba, Madogo, Bangal,
Kipini, Tarassa, Garsen,
Bura)
Asset
register
COH 0 12 12
Emergency
Preparedness
and response
Disaster Preparedness and
Response Plan within the
Unit prepared by end of
2017/2018 FY, reviewed
biannually
Review
report
CDH 1 1 1
Health
Management
and
Information
Systems
Number of data review
meetings held every year
to track quality and
performance
HMIS
Dashboard
report
CDH 2 8 8
Proportion of facilities
supplied with reporting
tools
Workload
reports
Asset
register
CDH 100% 100% 100%

203
Sector Programme Outcome Indicators Source of
Data
Reporting
Responsibilit
y
Situation in
2018
Mid-term
Target
(2020)
End-term
Target
(2023)
Number of facilities fitted
with paperless e-Health
systems
Asset
register
COH 0 6 10
Health
Research and
Innovation
Number of Operational
research questions
identified yearly
Yearly
review report
CDH 0 2 2
Energy,
Infrastructure and
ICT
Road
Construction
and
Rehabilitation
No. of km of roads
constructed
CIDP Mid-
term review
report
County
Department of
Roads
120 190 300
No. of km of roads graded CIDP Mid-
term review
report
County
Department of
Roads
No. of bus park designate CIDP Mid-
term review
report
County
Department of
Transport
3 6 10
Energy % increase in the number
of households connected
to the grid per ward
CIDP Mid-
term review
report
County
Department of
Energy
10 20 30
County ICT
and Broadband
Infrastructure
(ICT
Infrastructure
Development)
Proportion of officers
with computers
CIDP Mid-
term review
report
County
Department of
ICT
30 80 100
Proportion of offices with
internet connectivity
CIDP Mid-
term review
report
County
Department of
ICT
30 80 100
Number of functional
resource centers
established
CIDP Mid-
term review
report
County
Department of
ICT
1 3 3
Social Protection,
Culture,
Recreation and
Special
Programmes
Culture,
Heritage
Creative Arts
and Library
Services
No. annual county
cultural
festivals/exhibitions/talen
t shows held.
CIDP Mid-
term review
report
County
Department of
Culture
2 6 10
No. community
education campaigns on
retrogressive cultural
practices conducted
CIDP Mid-
term review
report
County
Department of
Culture
3 9 15
No. county cultural
centers Libraries and
Citizen documentation
services /museums/
constructed and
operationalized
CIDP Mid-
term review
report
County
Department of
Heritage
3 9 9
Child
Protection
No. of Rescue Centers
established
CIDP Mid-
term review
report
County
Department of
ICT
1 3 3
% increase in the number
of successful child
protection missions
facilitated
CIDP Mid-
term review
report
County
Department of
Children
Services
50 100 100
% increase in the no. of
households supported
through cash transfers
CIDP Mid-
term review
report
County
Department of
Children
Services
30 70 90
Proportion of children
whose births has been
registered
CIDP Mid-
term review
report
County
Department of
Children
Services
50 100 100
Proportion of needy
children disaggregated by
gender assisted during
emergency especially on,
payment of fees for
vulnerable children and
establishment of safe
places/child friendly
spaces
CIDP Mid-
term review
report
County
Department of
Children
Services
- 100 100

204
Sector Programme Outcome Indicators Source of
Data
Reporting
Responsibilit
y
Situation in
2018
Mid-term
Target
(2020)
End-term
Target
(2023)
Proportion of girl
children supported and
retained in schools
CIDP Mid-
term review
report
County
Department of
Children
Services
- 100 100
Social
Development
Proportion of women
groups trained and
supported
CIDP Mid-
term review
report
County
Department of
Social
Development
10 50 80
Percentage reduction in
prevalence of violence
against women, girls,
boys and elderly
including PWDs
CIDP Mid-
term review
report
County
Department of
Social
Development
10 5 5
No. of Well-furnished
and functional County
Women Empowerment
Centre
CIDP Mid-
term review
report
County
Department of
Social
Development
- 1 1
Youth
Empowerment
No. sub county youth
empowerment centres
constructed and
operationalized
CIDP Mid-
term review
report
County
Department of
Youth
- 3 3
Proportion of youth
groups trained and
supported
CIDP Mid-
term review
report
County
Department of
Youth
10 50 80
Disaster Risk
Reduction and
Resilience
Building
No of climate proofed
infrastructure in place
CIDP Mid-
term review
report
County
Department of
Disaster
management
- 17 26
Proportion of residents
with resilience adaptive
capabilities
CIDP Mid-
term review
report
County
Department of
Disaster
management
- 50 80
% of emergency response
to disease outbreak
CIDP Mid-
term review
report
County
Department of
Disaster
management
100 100 100
Percentage of drought
vulnerable households
supported
CIDP Mid-
term review
report
County
Department of
Disaster
management
100 100 100
Public
Administration
and
Intergovernmenta
l Relations
Strategic
Leadership and
Efficiency
Monitoring
Percentage increase in
the level of satisfaction
with quality of service by
customers
CIDP Mid-
term review
report
County
Department of
Economic
Planning
40 65 90
Percentage increase in
the level of satisfaction
with quality of service by
customers
CIDP Mid-
term review
report
County
Department of
Economic
Planning
40 65 90
Percentage increase in
timely service delivery of
services (Schedule
Performance Index - SPI)
CIDP Mid-
term review
report
County
Department of
Economic
Planning
50 75 100
Percentage increase in
cost effectiveness of
service delivery (Cost
Performance Index - CPI)
CIDP Mid-
term review
report
County
Department of
Economic
Planning
45 75 100
Number of development
plans prepared/reviewed
CIDP Mid-
term review
report
County
Department of
Economic
Planning
5 13 21
Sector plans prepared CIDP Mid-
term review
report
County
Department of
Economic
Planning
8 8 8

205
Sector Programme Outcome Indicators Source of
Data
Reporting
Responsibilit
y
Situation in
2018
Mid-term
Target
(2020)
End-term
Target
(2023)
% absorption of allocated
funds
CIDP Mid-
term review
report
County
Department of
Economic
Planning
- 100 100
Levels of compliance
with the budgetary
preparation timelines
CIDP Mid-
term review
report
County
Department of
Economic
Planning
100 100 100
Percentage increase in the
participation of the state
and non-state actors in the
budget cycle
CIDP Mid-
term review
report
County
Department of
Economic
Planning
100 100 100
Monitoring and
evaluation framework
CIDP Mid-
term review
report
County
Department of
Economic
Planning
1 1 1
Handbook of reporting
indicators
CIDP Mid-
term review
report
County
Department of
Economic
Planning
1 1 1
CMES established and
operationalized
CIDP Mid-
term review
report
County
Department of
Economic
Planning
1 1 1
County performance
review reports
CIDP Mid-
term review
report
County
Department of
Economic
Planning
4 12 20
Human
Resource
Management
Proportion of employees
trained
CIDP Mid-
term review
report
County
Department of
HRM
100 100 100
Proportion of departments
on PC
CIDP Mid-
term review
report
County
Department of
HRM
100 100 100
Proportion of staff on
PAS
CIDP Mid-
term review
report
County
Department of
HRM
100 100 100
Revenue
collection
% increase in local
revenue collection
CIDP Mid-
term review
report
County
Department of
Revenue
20 70 100
Financial
management
Level of implementation
of the county payroll
CIDP Mid-
term review
report
County
Department of
Finance
100 100 100
County
Treasury
Services
% of projects completed
within the stipulated
timelines
CIDP Mid-
term review
report
County
Department of
Finance
61 87 100
% of procurement to
PWDs, Women and
Youth (AGPO)
CIDP Mid-
term review
report
County
Department of
Finance
30 30 30
Compliance to
accounting standards
CIDP Mid-
term review
report
County
Department of
Finance
100 100 100
Devolution % level of participation of
stakeholders in county
functions
CIDP Mid-
term review
report
County
Department of
Decentralized
Services
100 100 100
Governance
Justice Law and
Order
Peace building Number of the Intra and
Inter county peace
committees formed (23
expected)
CIDP Mid-
term review
report
County
Department of
Decentralized
Services
20 60 100
No. of local/traditional
(ADR) peace building
mechanism forums held
CIDP Mid-
term review
report
County
Department of
Decentralized
Services
20 60 100

206
Sector Programme Outcome Indicators Source of
Data
Reporting
Responsibilit
y
Situation in
2018
Mid-term
Target
(2020)
End-term
Target
(2023)
Proportion of drug
addicts rehabilitated
CIDP Mid-
term review
report
County
Department of
Decentralized
Services
- 50 90

207
Annex 1: Sector Projects Derived from Programmes
Agriculture Rural and Urban Development Sector
Veterinary Sub-sector Project
Name/
Location*
Objectives Targets Description
of Activities
(Key
Outputs)
Green
Economy
considerations
Cost
(Kshs.)
Source
of
funding
Time
frame
Implementing
Agency
Disease and
vector
control
services
Immunity
against
CCPP, CBPP
and PPR
enhanced
Whole
county
Vaccination Promotion of
‘live’ crushes
71.255m CGTR Throughout
the year
Veterinary
services
Dumi,
Bandi,
Dibe,
galili,
Ongonyo
Construction
of cattle Dips
Disease
Surveillance
Early
detection of
diseases
before they
spread
Whole
county
Stock route
and market
inspection
Use of IT in
reporting
6.5m CGTR Throughout
the year
Veterinary
services
Leather
development
services
Production
of quality
hides and
skin
Whole
county
Inspection of
hides and
skins banda
Use of IT in
reporting
7.5m CGTR Throughout
the year
Veterinary
services
Veterinary
public
health
Production
of
wholesome
livestock
products fit
for human
consumption.
Whole
county
Meat
inspection
and
inspection of
slaughter
premises
Encouraging
use of biogas
7.5m CGTR Throughout
the year
Veterinary
services
General Economic Commercial and Labour Affairs Sector
Project
Name/
Location*
Objectives Targets Description
of Activities
(Key
Outputs)
Green Economy
considerations
Cost
(Kshs.)
Source
of
funding
Timeframe Implementing
Agency
Trade & Enterprise Development Sub-Sector
Construction
of modern
market at
Garsen
To enhance
and promote
county and
inter county
trade
1 Constructing
market
TRCG 2018 - 2020 Department of
Trade, Tourism
and Cooperative
Development
Construction
of Bura
market
To enhance
and promote
county and
inter county
trade
1 Constructing
market
TRCG 2018 - 2020 Department of
Trade, Tourism
and Cooperative
Development
Health Sector Program Sub-
Program
Project
Name/
Location*
Objectives Targets Description
of Activities
(Key
Outputs)
Green
Economy
considerations
Cost
(Kshs.)
Source
of
funding
Timeframe Implementing
Agency
Essential
Health
services
Improved
access to
basic
essential
Health
Services
Kau,
Onkolde,
Kone, Hara,
Kalalani,
Konoramada,
Wadesa,
Operationalize
facilities in
remote areas
to improve on
Service
delivery
13
facilities to
commence
operations
Confirmation
of
completion,
equipping,
staffing,
Natural
lighting, Use
of solar
lighting and
fridges, tree
750,000 TRCG 3 years TRCG

208
Program Sub-
Program
Project
Name/
Location*
Objectives Targets Description
of Activities
(Key
Outputs)
Green
Economy
considerations
Cost
(Kshs.)
Source
of
funding
Timeframe Implementing
Agency
Bura Village
Six,
Kamagur,
Korati,
Maramtu,
Sala,
Wolesorea,
danisa,
kipao, Galili
support
supervision
planting in the
compounds
Essential
Health
services
Improved
access to
basic
essential
Health
Services
Garsen Complete
construction
of Theatre
block
Block
completed and
operationalized
Confirmation
of
completion,
equipping,
staffing,
support
supervision
Natural
lighting, Use
of solar
lighting and
fridges, tree
planting in the
compounds
8 M TRCG 1 year TRCG
Dumi Construction
of dispensary
Operational
dispensary
6 TRCG 1 year TRCG
Environmental Protection, Water and Sanitation
Water and Sanitation Sub-Sector Project
Name/Location
Objectives Targets Description of
activities (Key
Outputs)
Green
Economy
considerations
Cost
(KShs.)
Source of
funding
Time
frame
Implementing
Agency
Construction of
Godia Water Pan
Water supply
improvement
Improved
access to safe
water for
domestic use
and livestock
Excavation
Auxiliary works
Fencing
Sanitation
5M TRCG 2017/18 TRCG
Rehabilitation of
Saware Borehole
Universal and
equitable
access to safe
and affordable
drinking water
for all
Domestic water
supply and
livestock
Equipping of the
borehole
Solar powered
submersible
pumps
5M TRCG 2017/18 TRCG
Rehabilitation Of
2no. Borehole at
Madogo
Increased
access to
portable water
Domestic
supply
Drilling and test
pumping
Solar powered
submersible
pumps
11M TRCG 2017/18 TRCG
Drilling of bore
holes at Onkolde,
wolkon village,
ferry, danisa,
Mitapani
Increased
access to
portable water
Domestic
supply
Drilling and test
pumping
Solar powered
submersible
pumps
5M TRCG 2018/20 TRCG
Construction of
Kone Kaliti
Water Pan
Water supply
improvement
Improved
access to safe
water for
domestic use
and livestock
Excavation
Auxiliary works
Fencing
Sanitation
5M TRCG 2017/18 TRCG
Construction of
Garsen Juu
Water Pan
Water supply
improvement
Improved
access to safe
water for
domestic use
and livestock
Excavation
Auxiliary works
Fencing
Sanitation
5M TRCG 2017/18 TRCG
Construction of
Balaneka Water
Pan
Water supply
improvement
Improved
access to safe
water for
domestic use
and livestock
Excavation
Auxiliary works
Fencing
Sanitation
5M TRCG 2017/18 TRCG
Drilling and Test
Pumping of
Kone Kaliti
Borehole
Universal and
equitable
access to safe
and affordable
drinking water
for all
Domestic and
livestock
Equipping of
the borehole
Solar powered
submersible
pumps
5M TRCG 2017/18 TRCG
Construction of
Hamares Water
Pan
Water supply
improvement
Improved
access to safe
water for
Excavation
Auxiliary
works
5M TRCG 2017/18 TRCG

209
Project
Name/Location
Objectives Targets Description of
activities (Key
Outputs)
Green
Economy
considerations
Cost
(KShs.)
Source of
funding
Time
frame
Implementing
Agency
domestic use
and livestock
Fencing
Sanitation
Construction of
Bilbil Water Pan
Water supply
improvement
Improved
access to safe
water for
domestic use
and livestock
Excavation
Auxiliary
works
Fencing
Sanitation
5M TRCG 2017/18 TRCG
Drilling of Assa
Borehole
Universal and
equitable
access to safe
and affordable
drinking water
for all
Domestic and
livestock
Equipping of the
borehole
Solar powered
submersible
pumps
5M TRCG 2017/18 TRCG
Supply & Laying
Of 6” Pipeline
Extension from
Hola water
works to Laza
Mtoni
Improve
access to safe
water
Domestic
supply
Pipeline
extension
5M TRCG 2017/18 TRCG
Rehabilitation of
Oda Water Pan
Increase
capacity and
securing of
water facility
Improved
access to
safe and
quality
water
Increase
storage
capacity and
Fencing
5M TRCG 2017/18 TRCG
Baraka School,
Kipini
Increased
access to
portable water
Increase access
to quality and
safe water
Well excavation
and equipping
Team &
Team
2017/18 Team & Team
Jiinue Self Help
Group
Increased
access to
portable water
Reduce distance
to water points
Improved
access to
quality and safe
water
Well excavation
and equipping
Team &
Team
2017/18 Team & Team
Umandeni
Heshima Self
Help Group
Increased
access to
portable water
Reduce distance
to water points
Improved
access to
quality and safe
water
Well excavation
and equipping
Team &
Team
2017/18 Team & Team
Soroko
Nyakinyua
Women Goup
Increased
access to
portable water
Reduce distance
to water points
Improved
access to
quality and safe
water
Well excavation
and equipping
Team &
Team
2017/18 Team & Team
Bora Imani
Medical Clinic
Increased
access to
portable water
Reduce distance
to water points
Improved
access to
quality and safe
water
Well excavation
and equipping
Team &
Team
2017/18 Team & Team
Upendo Hewani
Women Group
Increased
access to
portable water
Reduce distance
to water points
Improved
access to
quality and safe
water
Well excavation
and equipping
Team &
Team
2017/18 Team & Team
New Ngao
Maendeleo
Women Group
Increased
access to
portable water
Reduce distance
to water points
Improved
access to
quality and safe
water
Well excavation
and equipping
Team &
Team
2017/18 Team & Team
Motomoto
Women Group,
Kinyadu
Increased
access to
portable water
Reduce distance
to water points
Improved
access to
Well excavation
and equipping
Team &
Team
2017/18 Team & Team

210
Project
Name/Location
Objectives Targets Description of
activities (Key
Outputs)
Green
Economy
considerations
Cost
(KShs.)
Source of
funding
Time
frame
Implementing
Agency
quality and safe
water
Ngao Water
Supply Shallow
Well (Large Dia
Shallow Well)
Increase
supply at
Ngao water
works
Reduce
distance to
water
points
Improved
access to
quality
and safe
water
Drilling and
equipping
KRCS 2017/18 Kenya Red
cross society
(KRCS)
Hewani borehole Drought
mitigation
Hewani
village and
Garden
Sec.
School
Reduce
distance to
water
points
Improved
access to
quality
and safe
water
Drilling, test
pumping and
equipping
Solar powered
submersible
pumps
NG
Through
CWSB
2017/18 Coast Water
Services Board
(CWSB)
Construction of
Titila Borehole
Universal and
equitable
access to safe
and affordable
drinking water
for all
Domestic
supply and
Livestock
Reduce
distance to
water
points
Improved
access to
quality
and safe
water
Drilling, test
pumping and
equipping of
borehole
Construction
of watering
points for
households
and livestock
Fencing of
the facility
Solar powered
submersible
pumps
20M NG
Through
CWSB
2017/18 Coast Water
Services Board
(CWSB)
Extension of
water supply to
villages within
Garsen area
Universal and
equitable
access to safe
and affordable
drinking water
for all
Domestic
supply
Reduce
distance to
water
points
Improved
access to
quality
and safe
water
Borehole
drilling,
equipping
and test
pumping
Water supply
pipeline
Elevated steel
tower
40M NG
Through
CWSB
2017/18 Coast Water
Services Board
(CWSB)
Construction of
water supply to
Garsen TTI
(Abaganda) and
its sorrounding
villages
Universal and
equitable
access to safe
and affordable
drinking water
for all
Domestic
supply
Reduce
distance to
water
points
Improved
access to
quality
and safe
water
Water
supply to
TTI
Borehole
drilling,
equipping
and test
pumping
Water supply
pipeline
Elevated steel
tower
Solar powered
submersible
pumps
40M NG
Through
CWSB
2017/18 Coast Water
Services Board
(CWSB)
Maumau
Memorial Girls
Secondary water
pipping
Universal and
equitable
access to safe
and affordable
drinking water
for all
Domestic
supply
Reduce
distance to
water
points
Borehole
drilling,
equipping
and test
pumping
Water supply
pipeline
10M NG
Through
CWSB
2017/18 Coast Water
Services Board
(CWSB)

211
Project
Name/Location
Objectives Targets Description of
activities (Key
Outputs)
Green
Economy
considerations
Cost
(KShs.)
Source of
funding
Time
frame
Implementing
Agency
Improved
access to
quality
and safe
water
Elevated steel
tower
Kalkacha
Primary school
water pipping
Universal and
equitable
access to safe
and affordable
drinking water
for all
Domestic
supply
Reduce
distance to
water
points
Improved
access to
quality
and safe
water
Borehole
drilling,
equipping
and test
pumping
Water supply
pipeline
Elevated steel
tower
10M NG
Through
CWSB
2017/18 Coast Water
Services Board
(CWSB)
Hola secondary
school water
pipping
Universal and
equitable
access to safe
and affordable
drinking water
for all
Domestic
supply
Reduce
distance to
water
points
Improved
access to
quality
and safe
water
Borehole
drilling,
equipping
and test
pumping
Water supply
pipeline
Elevated steel
tower
10M NG
Through
CWSB
2017/18 Coast Water
Services Board
(CWSB)
Hola Primary
school water
pipping
Universal and
equitable
access to safe
and affordable
drinking water
for all
Domestic
supply
Reduce
distance to
water
points
Improved
access to
quality
and safe
water
Borehole
drilling,
equipping
and test
pumping
Water supply
pipeline
Elevated steel
tower
10M NG
Through
CWSB
2017/18 Coast Water
Services Board
(CWSB)
Pipping and
Installation of
water for Hola
Mango Factory
and its environs
Universal and
equitable
access to safe
and affordable
drinking water
for all
Domestic
supply
Reduce
distance to
water
points
Improved
access to
quality
and safe
water
Borehole
drilling,
equipping
and test
pumping
Water supply
pipeline
Elevated steel
tower
Solar powered
submersible
pumps
40M NG
Through
CWSB
2017/18 Coast Water
Services Board
(CWSB)
Bura Water
Supply
Universal and
equitable
access to safe
and affordable
drinking water
for all
Domestic
supply
Reduce
distance to
water
points
Improved
access to
quality
and safe
water
Borehole
drilling,
equipping
and test
pumping
Water supply
pipeline
Elevated steel
tower
60M NG
Through
CWSB
2017/18 Coast Water
Services Board
(CWSB)
Construction of
Bangale Sand
Dam
Ditto Domestic
supply
Reduce
distance to
water
points
Improved
access to
Construction
of a borehole
Construction
of a supply
pipeline
Elevated
water tank
100M NG
Through
state
department
of irrigation
2017/18 State
Department of
Irrigation
(MWI)

212
Project
Name/Location
Objectives Targets Description of
activities (Key
Outputs)
Green
Economy
considerations
Cost
(KShs.)
Source of
funding
Time
frame
Implementing
Agency
quality
and safe
water
Construction
of a water
pan
One Dam to Did-
Ade Village
Ditto Domestic
supply
Reduce
distance to
water
points
Improved
access to
quality
and safe
water
Water pan
excavation
Auxiliary
works
50M NG
Through
state
department
of irrigation
2017/18 State
Department of
Irrigation
(MWI)
One Dam of
Haroresa Village
Ditto Domestic
supply
Reduce
distance to
water
points
Improved
access to
quality
and safe
water
Water pan
excavation
Auxiliary
works
50M NG
Through
state
department
of irrigation
2017/18 State
Department of
Irrigation
(MWI)
Construction
Dam at Tank – E
Ditto Domestic
supply
Reduce
distance to
water
points
Improved
access to
quality
and safe
water
Water pan
excavation
Auxiliary
works
60M NG
Through
state
department
of irrigation
2017/18 State
Department of
Irrigation
(MWI)
Construction of
Taqe Sand Dam
Ditto Domestic
supply
Reduce distance
to water points
Improved
access to
quality and safe
water
Water pan
excavation
Auxiliary
works
20M NG
Through
state
department
of irrigation
2017/18 State
Department of
Irrigation
(MWI)
Construction of
Gurujo Sand
Dam
Ditto Domestic
supply
Reduce distance
to water points
Improved
access to
quality and safe
water
Water pan
excavation
Auxiliary
works
20M NG
Through
state
department
of irrigation
2017/18 State
Department of
Irrigation
(MWI)
Construction of
Hadhama Sand
Dam
Ditto Domestic
supply
Reduce distance
to water points
Improved
access to
quality and safe
water
Water pan
excavation
Auxiliary
works
20M NG
Through
state
department
of irrigation
2017/18 State
Department of
Irrigation
(MWI)
One Dam to
Kalkacha Village
Ditto Domestic
supply
Reduce distance
to water points
Improved
access to
quality and safe
water
Water pan
excavation
Auxiliary
works
44M NG
Through
state
department
of irrigation
2017/18 State
Department of
Irrigation
(MWI)
One Dam to
Maderte Village
Ditto Domestic
supply
Water pan
excavation
50M NG
Through
2017/18 State
Department of

213
Project
Name/Location
Objectives Targets Description of
activities (Key
Outputs)
Green
Economy
considerations
Cost
(KShs.)
Source of
funding
Time
frame
Implementing
Agency
Reduce distance
to water points
Improved
access to
quality and safe
water
Auxiliary
works
state
department
of irrigation
Irrigation
(MWI)
Tana High
school project
(Makutano-
Dayate Pipeline
extension project
Ditto Domestic
supply
Reduce distance
to water points
Improved
access to
quality and safe
water
Pipeline
extension
2No. water
kiosks
15M NG
Through
CWSB
2017/18 Coast Water
Services Board
(CWSB)
Development and
Equipping of
Hewani Borehole
in Tana River
County
Ditto Domestic
supply
Reduce distance
to water points
Improved
access to
quality and safe
water
Drilling and
test pumping
Equipping of
the borehole
Pipeline
extension
6.5M NG
Through
CWSB
2017/18 Coast Water
Services Board
(CWSB)
Construction of
Idd water pan in
Tana River
County
Ditto Domestic
supply
Reduce distance
to water points
Improved
access to
quality and safe
water
Water pan
excavation
Auxiliary
works
17M NG
Through
state
department
of livestock
2017/18 World Bank
through State
Department of
Livestock
(Regional
Pastoral
Livelihoods
Resilience
Project)
Construction of
Libile water pan
in Tana River
County
Ditto Domestic
supply
Reduce distance
to water points
Improved
access to
quality and safe
water
Water pan
excavation
Auxiliary
works
17M NG
Through
state
department
of livestock
2017/18 World Bank
through State
Department of
Livestock
(Regional
Pastoral
Livelihoods
Resilience
Project)
Construction of
Bulto-Abarufa
Water Pan in
Tana River
County
Ditto Domestic
supply
Reduce distance
to water points
Improved
access to
quality and safe
water
Water pan
excavation
Auxiliary
works
18.5M NG through
NDMA
2017/18 National
Drought
Management
Authority
(NDMA)

214
Annex II: New Project Proposals
Agriculture Rural and Urban Development Sector
Veterinary Sub-Sector Project
Name/Location
Objectives Targets Description
of Activities
Cost
(Kshs.)
Source
of
funding
Timeframe Implementing
Agency
Remarks
Animal welfare
and rabies
control
To promote
animal
welfare
Whole
county
Awareness
creation and
vaccination
of dogs
6.465m CGTR Throughout
the year
Veterinary
services
Housing and Urbanisation Sub-Sector Project
Name/
Location
Objectives Targets Description
of Activities
Cost (Kshs.) Source
of
Funding
Timeframe Implementing
Agency
Installation of
Street lights
(Hola,
Madogo, Bura
Garsen,,
Kipini
Safe and
Secure
Urban
Centres
500 street
lights.
Installation 100M TRCG 2018-2022 Housing and
Urbanization
Department
Cleaning of
Urban Centres
Clean
Urban
Centres
1000
Tonnes of
Garbage
removed
Garbage
collection
100M
TRCG
2018-2022
Housing and
Urbanization
Department
2500 litres
of liquid
waste
disposed.
Liquid waste
disposal
25M
TRCG 2018-2022 Housing and
Urbanization
Department
50 km of
drains
cleaned
50km of
bushes
cleared
Cleaning of
drains
Bush clearing
25M
25M
TRCG 2018-2022 Housing and
Urbanization
Department
50km of
bushes
cleared
Cleaning of
drains
Bush clearing
25M TRCG 2018-2022 Housing and
Urbanization
Department
Integrated
Urban
Development
Planning
Well
planned
Urban
Centres
5 Urban
Centres
Planned
Spatial
Planning
350M TRCG 2018-2022 Housing and
Urbanization
Department
Response to
Disaster risk
Prompt
response
to disaster
risk
5 Fire
stations
constructed
Construction
150M TRCG 2018-2022 Housing and
Urbanization
Department
5 Fire
engines
purchased.
Procurement 200M TRCG 2018-2022 Housing and
Urbanization
Department
30
Firefighting
personnel
recruited
and trained
Recruitment
and Training
50M TRCG 2018-2022 Housing and
Urbanization
Department
Housing Provide
adequate
and decent
housing
50 houses
constructed.
15 houses
rehabilitated
Construction
Rehabilitation
360M
45M
TRCG
TRCG
2018-2022
2018-2022
Housing and
Urbanization
Lands Sub-Sector Project Name/Location Objectives Targets Description
of Activities
Cost (Kshs.) Source of
Funding
Timeframe Implementing
Agency
Remarks
Planning and re-planning
of urban centers (Hola,
To achieve
Guided urban
development
15 urban
centres
planned
Planning 54,945,900 TRCG 2018-2022 Physical
planning office

215
Project Name/Location Objectives Targets Description
of Activities
Cost (Kshs.) Source of
Funding
Timeframe Implementing
Agency
Remarks
Bura, Garsen, Madogo,
Chardende,
Bangale,
Kipini, Boji,
Mnazini,Weje,
Tarasaa,
Mikinduni)
County spatial
Development plan
To guide
resource
management
for harmony
and
sustainable
development
1 plan Planning 150,000,000 TRCG 2018-2019 Physical
planning office
Land Use Plan Guided
Efficient and
effective land
use
3 plans planning 132,400,000 TRCG 2018-2022 Physical
Planning office
Establishment of G.I.S
Station/Lab
Ease spatial
planning and
efficient
services
delivery
1 station Installation 30,000,000 TRCG 2018-2019 Physical
Planning office
1.5: Purchase of plotter To Increase
service
delivery
1 plotter Procuring
and
installation
1,500,000 TRCG 2018-2019 Physical
Planning office
General Economic Commercial and Labour Affairs Sector Project
Name/Location
Objectives Targets Description
of Activities
Cost
(Kshs.)
Source of
funding
Timeframe Implementing
Agency
Remarks
Trade & Enterprise Development
Construction of
Madogo market
Constructing
market
1 Constructing
market
150m Tana River
County
Government
2018 -
2022
Department of
Trade, Tourism
and
Cooperative
Development
Construction of
modern market in
Hola
Constructing
market
1 Constructing
market
50m Tana River
County
Government
2018 -
2022
Department of
Trade, Tourism
and
Cooperative
Development
Construction of
Garsen Livestock
market shade
Constructing
market
1 Constructing
a livestock
market
3m Tana River
County
Government
2018 -
2022
Department of
Trade, Tourism
and
Cooperative
Development
Construction of
Bangale
livestock market
Constructing
market
1 Constructing
a livestock
market
3m Tana River
County
Government
2018 -2022 Department of
Trade, Tourism
and
Cooperative
Development
Construction of
Waldhena
livestock market
Constructing
market
1 Constructing
a livestock
market
3m Tana River
County
Government
2018- 2022 Department of
Trade, Tourism
and
Cooperative
Development
Construction of
Chardende open
air market
Constructing
market
1 Construction
of an open air
market
10m Tana River
County
Government
2018 -
2022
Department of
Trade, Tourism
and
Cooperative
Development
Construction of
Tarasaa/Odha
Open air market
Constructing
market
1 Construction
of an open air
market
10m Tana River
County
Government
2018 -2022 Department of
Trade, Tourism
and

216
Project
Name/Location
Objectives Targets Description
of Activities
Cost
(Kshs.)
Source of
funding
Timeframe Implementing
Agency
Remarks
Cooperative
Development
Construction of
Kipini Open air
market
Constructing
market
1 Construction
of an open air
market
10m Tana River
County
Government
2018 -2022 Department of
Trade, Tourism
and
Cooperative
Development
Construction of
Hurara Open air
market
Constructing
market
1 Construction
of an open air
market
10m Tana River
County
Government
2018 -2022 Department of
Trade, Tourism
and
Cooperative
Development
Construction of
Boka Open air
market
Constructing
market
1 Construction
of an open air
market
10m Tana River
County
Government
2018- 2022 Department of
Trade, Tourism
and
Cooperative
Development
Construction of
Bangale Open air
market
Constructing
market
1 Construction
of an open air
market
10m Tana River
County
Government
2018 -2022 Department of
Trade, Tourism
and
Cooperative
Development
Construction of
Wayu Open air
market
Constructing
market
1 Construction
of an open air
market
10m Tana River
County
Government
2018 -2022 Department of
Trade, Tourism
and
Cooperative
Development
Construction of
Jua kali shade in
Bura
Constructing
a jua kali
shed
Construction
of jua kali
shade
10m Tana River
County
Government
2018 -
2022
Department of
Trade, Tourism
and
Cooperative
Development
Renovation of
Jua kali shade in
Hola
Constructing
a jua kali
shed
1 Renovation
of jua kali
shade
6m Tana River
County
Government
2018 -2022 Department of
Trade, Tourism
and
Cooperative
Development
Renovation of
Jua kali shade in
Garsen
Renovating
jua kali sheds
1 Renovation
of jua kali
shade
6m Tana River
County
Government
2018 -2022 Department of
Trade, Tourism
and
Cooperative
Development
Weights and Measures
Construction and
equipping of a
calibration
laboratory
Constructing
a labaoratory
1 Construction
of a
calibration
laboratory
15m TRCG 2018 -2022 Weights &
Measures
Installation of 2
No. animal
weigh machines
in Garsen
Buying and
installing
animal
weighs
2 Installation of
animal weigh
machines
3.6 TRCG 2018 -2019 Weights &
Measures
Installation of 2
No. animal
weigh machines
in Bangale
Buying and
installing
animal
weighs
2 Installation of
animal weigh
machine
3.6 TRCG 2019 -2020 Weights &
Measures
Installation of 2
No. animal
weigh machines
in Bura
Buying and
installing
animal
weighs
2 Installation of
animal weigh
machines
3.6 TRCG 2018 -2022 Weights &
Measures
Installation of 2
No. animal
weigh machines
in Wayu
Buying and
installing
animal
weighs
2 Installation of
animal weigh
machines
3.6 TRCG 2018 -2022 Weights &
Measures
Installation of 2
No. animal
weigh machines
in Hola
Buying and
installing
animal
weighs
2 Installation of
animal weigh
machines
3.6 TRCG 2018 -2022 Weights &
Measures

217
Project
Name/Location
Objectives Targets Description
of Activities
Cost
(Kshs.)
Source of
funding
Timeframe Implementing
Agency
Remarks
Installation of 2
No. animal
weigh machines
in Titila
Buying and
installing
animal
weighs
2 Installation of
animal weigh
machines
3.6 TRCG 2018 -2022 Weights &
Measures
Istallation of
vehicle
weighbridge in
Bangale
Buying and
installing
weigh bridges
1 Installation of
vehicle
weighbridge
22 TRCG 2018 -
2019
Weights &
Measures
Istallation of
vehicle
weighbridge in
Kanagoni
Buying and
installing
weigh bridges
1 Installation of
vehicle
weighbridge
22 TRCG 2018 -2019 Weights &
Measures
Istallation of
vehicle
weighbridge in
Mororo
Buying and
installing
weigh bridges
1 Installation of
vehicle
weighbridge
22 TRCG 2018 -2019 Weights &
Measures
Establishing
Hides and skins
industry in Bura
Constructing
a hide and
skin industry
50 Setting up of
a hides and
skins industry
50 TRCG 2018 -
2022
Enterprise
Development
establish a Hides
and skins
industry in
Garsen
Constructing
a hides and
skin industry
50 Setting up of
a hides and
skins
indurstry
50 TRCG 2018 -2022 Enterprise
Development
Milk processing
plant in Garsen,
Constructing
a milk
processing
factory
1 Setting up of
a milk
processing
plant
60 TRCG 2018 -2022 Enterprise
Development
Milk processing
plant in Chewani
Constructing
a milk
processing
factory
1 Setting up of
a milk
processing
plant
60 TRCG 2018 -
2022
Enterprise
Development
Milk processing
plant in Bura
Constructing
a milk
processing
factory
1 Setting up of
a milk
processing
plant
60 TRCG 2018 -
2022
Enterprise
Development
Establishment of
Eco Camps
Constructing
eco camps
5 Establishment
of eco camps
150 TRCG 2018 -2022 Tourism
Department
Restoration of
heritage sites
Rehabilitation
of heritage
sites
4 Restoration
of heritage
sites
80 TRCG 2018 -2022 Tourism
Department
Establishment of
tourist market
Constructing
tourist
markets
3 Establishment
of tourists
150 TRCG 2018 -2022 Tourism
Department
Establishment of
Tourism
Information
Centres
Constructing
information
centres
4 Establishment
of tourism
information
centres
120 TRCG 2018 -2022 Tourism
Department
Setting up of
community-
based
conservancies
Identification
establishment
of community
based
conservancy
3 Setting up of
community
based
conservancies
30 TRCG 2018 -
2022
Tourism
Department
Miss Tourism
beauty pageant
Holding Mss
county
auditions
5 Holding a
miss tourism
beauty
pageant
40 TRCG 2018 –
2022
-done
annually.
Tourism
Department
Organizing
Investor Forums
Holding
interactive
forums
4 Organizing
investor
forums
80 TRCG 2018 -2022 Tourism
Department
Development of
county tourism
website
Creating
website
1 Develop a
county
tourism
website
1 TRCG 2018 -
2022
Tourism
Department
Destination
marketing
Holding
exhibitions
outside the
county and
the country
5 Organizing
destination
marketing
25 TRCG 2018 -
2022
Tourism
Department

218
Project
Name/Location
Objectives Targets Description
of Activities
Cost
(Kshs.)
Source of
funding
Timeframe Implementing
Agency
Remarks
Development of
Tourism
Development
Policy
Writing of
bill in
collaboration
with
stakeholders
1 Develop a
tourism
development
policy
20 TRCG 2018 -2022 Tourism
Department
Tourism Baseline
Survey
Conducting
county wide
survey
1 Conduct a
tourism
baseline
survey
5 TRCG Tourism
Department
Health Sector Program Sub
Program
Project
Name/Locat
ion
Objectives Targets Descriptio
n of
Activities
Green
Economy
considerati
ons
Estimat
ed cost
Source
of
fundin
g
Timefra
me
Implement
ing Agency
Administrati
on, Human
Resources
and Support
Services
Administrat
ion and
Support
Services
Hola Increase
number of
serviceable
utility
vehicles
6
vehicles
procured
Procureme
nt of utility
vehicles
New fuel
efficient
vehicles
40 M TRCG 5 years TRCG
Administrati
on, Human
Resources
and Support
Services
Administrat
ion and
Support
Services
Tana River
Tana Delta
Tana North
Increase
number of
ambulances
in the
County for
ease of
Refferal
6
ambulan
ces
procured
Procure six
new
ambulance
s
New fuel
efficient
vehicles
60 M TRCG 3 years TRCG
Administrati
on, Human
Resources
and Support
Services
Administrat
ion and
Support
Services
Ozi
Tana Delta
Improve
referral from
cut out
villages
1
Procure a
water
ambulance
for Tana
Delta
Fuel
efficient
water
ambulance
7 M TRCG 2years TRCG
Administrati
on, Human
Resources
and Support
Services
Human
Resources
for Health
Hola Staff
resource
Centre
constructed
at Hola
County
Hospital
I
Provide a
resource
Centre for
staff
Natural
lighting, use
paperless
systems
8 M TRCG 2 years TRCG
Essential
Health
services
Administrat
ion and
Support
Services
Hola, Bura,
Garsen,
Ngao
Increase
management
efficiency by
CHMT/SCH
MT
4 blocks
renovate
d
Renovation
of
administrat
ion blocks
Natural
lighting/
Provision of
solar panels
for
alternative
lighting
25 M TRCG 3 years TRCG
Essential
Health
services
Improved
access to
basic
essential
Health
Services
Kulesa,
Buwa,
Majengo,
Wenje,
Sabukie,
Bilbil
Improve
service
delivery in
remote areas
Facilities
renovate
d
Renovation
of Health
Facilities
Natural
lighting,
solar
lighting,
solar fridges
30 M TRCG 3 years TRCG
Essential
Health
services
Improved
access to
basic
essential
Health
Services
Ngao
Tana Delta
Improve
service
delivery in
remote areas
Works
complete
d
Renovation
works at
Ngao
Hospital
Natural
lighting,
solar
lighting,
solar fridges
30M TRCG 2 years TRCG
Essential
Health
services
Improved
access to
basic
essential
Garsen,
Kipini,
Bangal,
Makere,
Majengo,
Improve
access to
maternal
Neonatal
care services
9 Constructio
n of
Maternity
in-patient
facilities
Natural
lighting,
solar
lighting,
solar fridges
180 M TRCG 5 years TRCG

219
Program Sub
Program
Project
Name/Locat
ion
Objectives Targets Descriptio
n of
Activities
Green
Economy
considerati
ons
Estimat
ed cost
Source
of
fundin
g
Timefra
me
Implement
ing Agency
Health
Services
Assa, Wayu,
Ozi,
Shirikisho
Essential
Health
services
Improved
access to
basic
essential
Health
Services
Danisa,
Kuriti,
Tawfiq, Bula
Rahma,
Hakoka/
Dayate,
Ongola,
Bura Amani/
Bura Kofira
Improve
service
delivery in
remote areas
8 Constructio
n of new
health
facilities
Natural
lighting,
solar
lighting,
solar fridges
200 M TRCG 5 years TRCG
Essential
Health
services
Improved
access to
basic
essential
Health
Services
Mbalambala,
Buwa, Boka,
Kamagur,
Mulanjo,
Meti,
Nanighi,
Kalalani,
Wenje, Kau,
Kipini,
Semikaro,
Ngao, Titila,
Daba,
Lenda, Sera,
Majengo,
Kilindini
Improve
service
delivery in
remote areas
20 Constructio
n of Staff
Houses in
Health
facilities
Natural
lighting,
solar
lighting,
solar fridges
140M TRCG 5years TRCG
Essential
Health
services
Improved
access to
basic
essential
Tana River
Tana Delta
Tana North
Provide safe
working
environment
23 Fencing of
health
facilities
Environmen
t friendly
materials
115M TRCG 5 years TRCG
Essential
Health
services
Improved
access to
basic
essential
Tana River
Tana Delta
Tana North
Provision of
convenient
working
environment
15 Electrificat
ion of
health
facilities
Environmen
t friendly
materials
5M TRCG 5years TRCG
Essential
Health
services
Improved
access to
basic
essential
Garsen
Madogo
Kipini
Bangal
Provision of
convenient
working
environment
4
Procureme
nt of
backup
generators
for
facilities
Low
emission
generators
to be
selected
40M TRCG 5 years TRCG
Essential
Health
services
Improved
access to
basic
essential
Hola, Kipini,
Ngao,
Garsen,
Madogo
Provide
dignified and
safe handling
of corpses
5 Constructio
n of
Mortuaries
Natural
lighting,
solar
lighting,
solar fridges
45 M TRCG 5 years TRCG
Essential
Health
services
Improved
access to
basic
essential
Hola, Ngao,
Garsen,
Bura,
Madogo,
Kipini
Provide safe
disposal of
medical
waste
6 Constructio
n of
Incinerator
s
Preferably
five of the
incinerators
to be
ultraviolet
type
24 M TRCG 4 years TRCG
Essential
Health
services
Improved
access to
basic
essential
Tana River
Tana North
Tana delta
Improve
service
delivery in
remote areas
All
facilities
Equipping
of Health
facilities
Energy
efficient
machines,
solar
operated
equipment
180 M TRCG
WORL
D
BANK
4years TRCG
Essential
Health
services
Improved
access to
basic
essential
Garsen,
Ngao, Bura,
Madogo,
Bangal
Improve
efficiency of
handling
acute/
5 Construct
Accident &
Emergency
Units
Use of
natural
lighting, use
of solar
lighting
50 M TRCG 5 years TRCG

220
Program Sub
Program
Project
Name/Locat
ion
Objectives Targets Descriptio
n of
Activities
Green
Economy
considerati
ons
Estimat
ed cost
Source
of
fundin
g
Timefra
me
Implement
ing Agency
traumatic
cases
Essential
Health
services
Improved
access to
basic
essential
Hola CRH Improve
client
management
in the facility
1 Renovation
of
Outpatient
block
Use of
natural
lighting, use
of solar
lighting
40 M TRCG 5 years TRCG
Essential
Health
services
Improved
access to
basic
essential
Hola CRH Improve
quality of
child health
services
1 Renovation
of
paediatric
Unit
Use of
natural
lighting, use
of solar
lighting
10 M
TRCG 5 years TRCG
Essential
Health
services
Improved
access to
basic
essential
Hola CRH Improved
handling of
acute/ injury
cases
1 Constructio
n of
Accident
and
Emergency
Unit
Use of
natural
lighting, use
of solar
lighting
15M TRCG 5 years TRCG
Essential
Health
services
Improved
access to
basic
essential
Hola CRH Provide
quality
critical care
services
1 Constructio
n of
Intensive
Care Unit/
High
Dependenc
y Unit
Use of
natural
lighting, use
of solar
lighting
20M TRCG 5 years TRCG
Essential
Health
services
Improved
access to
basic
essential
Hola CRH Improve
working
conditions
for inpatient
unit
2 wards Renovation
of In
Patient
Unit
Use of
natural
lighting, use
of solar
lighting
15M
TRCG 5 years TRCG
Essential
Health
services
Improved
access to
basic
essential
Hola CRH Increase
available in
patient space
2 wards Completio
n of wards
(2)
Use of
natural
lighting, use
of solar
lighting
20 M
TRCG 5 years TRCG
Essential
Health
services
Improved
access to
basic
essential
Hola CRH Increase
available
maternity
space
1 Completio
n of
Maternity
Unit
Use of
natural
lighting, use
of solar
lighting
15 M
TRCG 5 years TRCG
Essential
Health
services
Improved
access to
basic
essential
Hola CRH To improve
on the
hospital front
yard
1 Completio
n of the
Cabro
parking
yard
Use of
natural
lighting, use
of solar
lighting
5 M TRCG 5 years TRCG
Essential
Health
services
Improved
access to
basic
essential
Hola CRH Improve
general
working
conditions
1 General
landscapin
g
Use of
natural
lighting, use
of solar
lighting
1.5 M TRCG 5 years TRCG
Essential
Health
services
Human
diagnostic
laboratory
services
Majengo,
Bangal,
Waldena,
Maziwa,
Boka,
Mbalambala,
Increase
access to lab
services
6 Construct
new
laboratorie
s
Use of
natural
lighting, use
of solar
lighting,
Use of solar
fridges
36 M TRCG 5 years TRCG
Essential
Health
services
Human
diagnostic
laboratory
services
Tana River
Tana Delta
Tana North
Increase
number of
services
offered
100% Equipping
of all
laboratorie
s
Use of
natural
lighting, use
of solar
lighting,
Use of solar
fridges,
50 M TRCG 5years TRCG

221
Program Sub
Program
Project
Name/Locat
ion
Objectives Targets Descriptio
n of
Activities
Green
Economy
considerati
ons
Estimat
ed cost
Source
of
fundin
g
Timefra
me
Implement
ing Agency
energy
efficient
machines
Essential
Health
services
Human
diagnostic
laboratory
services
Hola CRH Increase
variety of
laboratory
services
offered
1 Expand
capacity of
Hola
Hospital
Laboratory
Use of
natural
lighting, use
of solar
lighting,
Use of solar
fridges,
energy
efficient
machines
10 M TRCG 3 years TRCG
Preventive
and
Promotive
health
services
Solid waste
managemen
t
Hola,
Gofisa,
Walderna,
Titila, Daba,
Madogo,
Bangal,
Kipini,
Tarassa,
Garsen, Bura
Increase
latrine
coverage in
the county
11 Constructio
n of public
toilets
Adopt Eco
toilet
technology
36 M TRCG 3 years TRCG
Health
Managemen
t and
Information
Systems,
operational
research,
monitoring
and
evaluation
Health
Records
and
Information
Systems
Hola, Bura,
Ngao,
Garsen,
Kipini,
Madogo
Improve
health data
management
and use
6 Install
paperless
data
systems in
the
hospitals
Adopting
paperless
system
120 M TRCG 5 years TRCG
Environmental Protection, Water and Sanitation Sector
Environmental Protection Sub-Sector Sub
programs/Projects
Location Ranking Objectives Target s Activities
New Projects/Programmes 1 – General administrative and support services
General
administrative and
support services
County wide
1 To enhance
departmental
capacity and
conducive work
environment for
quality service
delivery
To establish a
planning & design
office at HQs
To furnish all
SWOs offices
All sub-county offices
equipped
2019
Purchase of specialized
equipments
Purchase of computers
Rehabilitation of staff
offices
Purchase of furniture
New Projects/Programmes – 2 Forest Management General
Sub
programs/Projects
Location
Ranking Objectives Target s Activities
Gazettement,
registration and
operationalization of
both County,
community and
private forests
All wards
1 To expand the
area under forests
in within the
county towards
achieving 10%
nationwide forest
cover
Purchase at least one
patrol boat to secure
riverine mangrove
forests within the Delta
Additional 10,000Ha of
forest gazetted and
Identification of suitable
ungazetted forest areas for
gazettement
Preparation of County
Forest Gazettement
Guidelines for approval

222
Sub
programs/Projects
Location Ranking Objectives Target s Activities
To strengthen
management and
secure already
gazetted forests
within the county
Increase
community
involvement in
conservation by
formally
registering and
recognizing
community forests
Build local
capacity in forest
management
Give incentives to
land owners to
plant trees and
improve forest
area acreage
effectively managed by
June 2018
5 Management plans for
gazette forests
developed by June 2019
At least 3 sub-county
Foresters recruited by
June 2018
30 enforcement officers
seconded to environment
department supported
for training in Manyani
KWS Training School to
assist in enforcement by
June 2019
by the County Assembly
to guide gazettement of
County and Community
Forests
Recruiting staff including
Extension Foresters to
strengthen management of
the gazetted forests and
provide forest extension
services
Seconding of county
enforcement officers to
environment department
to help with enforcement
of forest regulations
Establish incentives to
land owners maintaining
forests on private lands
Rehabilitation
of land
degraded areas
& mangrove
Degraded
terrestrial forest
areas in entire
county
Mangrove
forests in Kipini
East ward and
Kipini West
(Chara, Ozi,
Kilelengwani
and Kipini
Darga galge Mto
Tana) & Coastal
line of 76 km
bordering
222njuri
1 To Improve the
area (acreage)
quality of the
forests in the
County
To strengthen
local institutions
(CFAs) to take up
management of
local forests in
their jurisdiction
To ensure
sustainable
benefits by the
local communities
are maintained
Rehabilitate at least 450
Ha (cumulatively) of
degraded forests in the
county by June 2022
Establishing woodlots of
suitable tree species
across the three sub-
counties for rehabilitation
of degraded terrestrial
forest areas
Establishing through
organized community
groups (CFA members)
two mangrove nurseries in
Kipini and Ozi for
rehabilitation
Community
empowerment and
institutional
strengthening
All wards
1 To create
alternative
livelihood sources
to reduce over-
reliance on
Natural resources
(specifically
Natural forest
products)
To improve
government-
community
relationships by
promoting joint
forest
management
50 SMEs implemented
and connected to
effective markets by
2022
10 CFAs and CCA
Committees formed,
registered, strengthened
and actively engaged in
forest management
500 farmers trained on
production, harvesting,
processing & marketing
of gums and resins by
June 2018
Promotion of alternative
sources of livelihoods by
implementing NBEs
consistent with
environmental
conservation including
agro-forestry initiatives,
extraction of forest
products such as gums
and resins etc
Facilitating communities
to register/strengthen
existing community
Forest Associations and
CCA management
committees
All wards
1 To provide a
platform for
climate change
amelioration
Promote a culture
of tree growing in
the county
Recognize and
reward the best
performance165
schools and institutions
implement greening
programme by June
2018
Grow suitable tree species
in all public and interested
private institutions within
the County
Establish a recognition
model for rewarding the
greenest institutions
(including schools,
tertiary institutions, health
facilties, government
offices etc

223
Sub
programs/Projects
Location Ranking Objectives Target s Activities
Registration of
Private Forests
All wards 2 To Encourage
additional land
under forest cover
To Set standards
for private forest
registration and
associated benefits
Private forest
registration guidelines
developed by June 2018
Registration guidelines
and proposed incentives
approved by September
2018
Register under the new
guidelines the first 5
private forests by June
2019
Develop guidelines for
private forest registration
Recommend incentives
for private forest
development and
registration
Institute forest extension
services for registered
private foresters
Solicit and explore
carbon credit trade
All wards with
specific
emphasis on the
Delta (Ramsar
site)
2 To diversities the
income streams
for the local
communities
through their
conservation
efforts
Carbon credit
conference organized by
September 2018
Carbon stock assessment
done by September 2020
Potential carbon credit
markets established by
June 2019
Organize a capacity
building
workshop/conference for
environment/forest sector
practitioners and local
communities to
understand the concept of
carbon credits
Conduct carbon stock
assessment with a view to
understanding the
quantities and potential
annual income
Network with
implementing counties
with a view to
establishing reliable
carbon credit markets for
the county
Forest extension
services
All wards 1 Improve forestry
and agro-forestry
practices in the
county6
forest extension officers
recruited by June 2019
6 Yamaha DT 125cc
motorbikes procured for
the extension officers
and adequate funds
allocated for their
movement by September
2019
Recruit forest extension
officers in all the sub-
counties
Equip Forest extension
officers with a means of
movement and other
relevant tools of service
Establishment of
Parks and arboreta
Hola, Garsen &
Bura Madogo
urban centres
1 To Provide public
recreational and
rest areas as a
means to
appreciate nature
To Provide
learning areas for
schools and
researchers
Established 4 urban
green recreational public
parks and arboreta by
June 2019
Identify suitable sites and
conduct preliminary
studies and designs
Procure to hire expert for
designing
Develop the public parks
and arboreta as designed
Town/Urban
beautification
programme
Garsen
Hola
Madogo
Bura
1 To Improve the
face of the towns
in terms of their
aesthetic value
To Increase the
number of trees
within the county
Beautification plans
developed by March
2018
Beautification
programme rolled out in
all towns by September
2018
Work closely with town
planners to develop town
beautification
programmes and designs
Plant suitable trees species
along the major roads and
roundabouts and allocate
the trees to conservation
institutions including
CBOs nearby for care and
protection

224
Sub
programs/Projects
Location Ranking Objectives Target s Activities
Restoration and
Protection of riverine
and riparian zones
and sea beaches
All wards
Sea beaches in
Kipini Delta
dune
1 To Reduce
instances and
possibilities of
pollution of the
river from human
activities too close
to the river
To Ensure
stability of the
river banks/sea
beaches
To reduce cases of
land degradation
both along the
river banks and
sea beaches
1 sea wall constructed at
Kipini by 2019
30m riparian zone and
sea beaches exclusive
area implemented by
June 2019
Ensure the 30m riparian
zone on either side of
Tana River/sea beaches in
Kipini is free from any
human activities including
farming activities
Institute restoration
programmes specifically
targeting riparian zones
within the County
Ensure adequate and
regular patrols to ensure
compliance
Restore/rehabilitate the
land degraded along the
river bank and sea
beaches
Sea wall construction
beaches at Kipini
Infrastructural
improvement
Hola
Garsen
Bura
1 Improve the
administration of
the department
Office blocks
constructed by June
2020
Identification of suitable
sites for the office
constructions
Construction of 3
environmental blocks
Phased removal of
Prosopis
Garsen -Madogo
road side Hola
town and Bura
Town
1 .
To remove a total
of 50 hectares of
Prosopis juliflora
and replanting the
area with suitable
indigenous trees
by 30th June 2019
- 50 hectares under
Prosopis juliflora
reclaimed and
successfully replanted
with other suitable trees,
preferably indigenous
trees
One electric plant using
Prosopis within the
county
Marking out the area
where the removal of
Prosopis will be carried
out. -Carrying out the
revmoval. -Procuring
seedlings for replanting. -
Carrying out the
replanting with suitable
tree species
Education and awareness
of the important prosopis
to community
Establish a plant for
production of electricity
using Prosopis
Establishment of
institution for
collecting revenue
from Environmental
resources
County 1 To establish
institution for
collecting revenue
from
environmental
resources
1 institution established Establish institution for
collecting revenue from
environmental resources
Construction of sea
wall
New Projects/Programmes- 3 Waste Management
Sub
programs/Projects
Location Ranking Objectives Targets Description of Activities
Development of a
County Strategic
solid waste
management plan
County wide 1 To Ensure that
waste
management
efforts are well
targeted and
result oriented
Strategic solid waste
management plan
developed and approved
by June 2019
Procurement of
professional services to
conduct an assessment of
solid waste generation
levels and lead the process
of the development of a
strategic solid waste
management plan for
Tana River County
Safe disposal of
asbestos materials in
line with the National
Guidelines on Safe
Management and
County
Government
buildings
1 To protect
human health
from the
hazardous
health effects
All asbestos materials
removed y 2018
Collect, safely store and
dispose of all asbestos as
provided for by the
National Guidelines on
Safe Management and

225
Sub
programs/Projects
Location Ranking Objectives Target s Activities
Disposal of Asbestos
Materials of 2012
associated with
long exposure to
asbestos
particles and
dust
Disposal of Asbestos
Materials of 2012
Establishment of
suitable solid waste
disposal sites and
waste transfer
stations
Urban centres
Hola, Garsen,
Tarasaa, Oda,
Bura, Madogo,
Mororo, Kipini,
Wenje and
Bangale
1 To ensure
proper solid
waste
management
8 waste disposal sites
identified and developed
by September 2019
Identification of the waste
disposal sites
Conducting EIAs
followed by necessary
developments including
fencing
Procurement of solid
waste transfer trucks and
other town cleaning
equipment including
waste bins
Piloting the
construction of waste
water drainage and
treatment plant
Hola 2 To promote
proper waste
water treatment
and reduce
pollution of the
river Tana by
releasing only
treated water
back
waste water drainage
and treatment plant
developed by June 2020
Identify in collaboration
with relevant agencies,
competent firm to design
and develop the first
waste water drainage and
treatment plant
Construction of
centralized and waste
water system
Urban centres
Hola, Garsen
and Madogo
1 To construct
waste water
system
by 2018
100% completed
Identification of the sites
Contracting the
contractors through
procurement processes
Construction of a
polythene and plastic
recycling plant
Hola 1 To promote
clean and health
environment
To promote
waste
management in
through
recycling
1 recycling plant
Source for land. -Carry
out an Environmental
Impact Assessment (EIA).
-Tendering. -Construction
Hola
Enforce laws, by-
laws and standards on
safe management and
disposal of medical
wastes
health facilities 1 To protect
human health
from the
hazardous
health effects
associated with
long exposure to
medical wastes
All health facilities Identify health facilities
without medical waste
disposal facilities such as
incinerators, ash pits and
ensure they have complied
with regard to putting in
place these disposal
facilities
Integrate
Environmental
Impact Assessments
(EIAs) in the County
Government decision
making process
County wide 1 To ensure that
projects arising
from the
decisions made
are
environmentally
sustainable and
socially
acceptable
All projects conceived
from the decisions made
Subjecting all proposed
projects to the EIA
process with the view of
anticipating negative
environmental impacts
Adopt and
domesticate the
National Solid Waste
Management Strategy
(NSWMS) of 2015
County wide 1 To ensure
appropriate and
safe collection,
transportation
and disposal of
solid waste
(three vehicles
purchased
Ensure clean Entire County Waste segregation
at source; provision of
appropriate and adequate
collection facilities; waste
transportation using
recommended vehicles;
and safe disposal

226
Sub
programs/Projects
Location Ranking Objectives Target s Activities
Support cleanup
campaigns and
environmental club
activities in local
schools
All wards 1 To instill a
culture of
cleanliness and
environmental
sobriety among
learners and
members of the
public
A county Clean
Environment Award
initiated by June 2018
Initiate cleanup campaign
days around towns,
schools and other public
utility areas
Initiate and establish a
clean environment award
for schools, towns and
government institutions
New Projects/Programmes- 4 Wildlife Management
Sub programs?
Projects
Location Priority
Ranking
Objectives Targets Description of Activities
Increase and
improvement of
wildlife habitat
quality
All wards
4 To ensure that
wildlife
management is
regarded as
proper form of
land use with a
potential to
generate
revenue
To ensure that
wildlife habitats
are protected,
expanded and
quality
improved to
ensure
sustainability
and promote the
realization of
eco-tourism
potential of the
county.
To restore and
promote
sustainable
natural resource
use
Key wildlife habitats
identified by June 2018
Expand the existing
habitats by at least 20%
by June 2019
Guidelines for
Community wildlife
conservancy registration
developed and adopted
by County Assembly by
June 2018
Land Use Plan adopted
by June September 2018
Identification and
protection of key wildlife
habitats
Enforcement of the new
wildlife act
Identify and implement
incentives for
communities and land
owners to allocate land for
wildlife management as
conservancies
Pushing through
legislative agenda that
will ensure
implementation of Tana
Delta Land Use Plan
(LUP) and the Strategic
Environmental
Assessment Reports
Conservation of Bio-
Diversity of the Tana
county
County wide
Establishment
of community
conservancy
3 To conserve and
protect the bio-
Poaching of endangered
species of animals and
plants reduced by 60%
by June 2018
Strengthening of the
existing conservancies
Promote community
partnership in
management of reserve
both inside and outside
the reserve.
Institute Anti-
poaching measures
and problem animal
control (PAC)
All wards 2 To reduce
instances of
poaching within
the county
To minimize
any health risks
that may be
associated with
consumption of
bush meat
To promote
collaboration
with other
government
agencies with a
view to capacity
build the county
staff
Work closely with the
KWS to ensure that
proper measures are put
in place to control
problem animals
Poaching levels reduced
by 30% by June 2018 and
to below 10% of the
original value by June
2022
Anti-poaching campaign
materials developed and
implemented by
September 2018
Collaborative framework
between the County
Government and KWS
developed by September
2018Identify key species
vulnerable to poaching
Identify the key poaching
hotspots

227
Sub
programs/Projects
Location Ranking Objectives Target s Activities
Roll out anti-poaching
campaigns through
enforcements and
awareness programmes
Strengthening of
County Departmental
Human Resource
All wards
2 To
improvement
the capacity of
the department
to execute its
mandate
To ensure that
staff have
necessary skills
and capacity to
carry out their
assigned roles
and
responsibilities
Wildlife conservation
unit created and staffed
by June 2019
Creation of a wildlife
conservation unit within
the Department
Lobby for the secondment
of enforcement officers to
the wildlife conservation
unit
Training of the
enforcement officers
within the Unit at the
KWS Training College,
Manyani
Promote the
development of
management plans
for private,
community and
county wildlife
conservancies and
strengthen
community
institutions involved
in wildlife
management
All wards 3 To ensure the
development of
management
plans for
private,
community and
county wildlife
conservancies
and other
wildlife
conservation
areas
To ensure that
wildlife
associations are
registered and
strengthened to
patriciate in the
management of
wildlife
resources
At least 3 management
plans developed and
approved by June 2020
Identify wildlife
management areas that
require the development
of the management plans
Institute a professional
team to work with
respective communities to
develop the management
plans
Primate National
Game Reserve
In the Game
reserve
4 To conserve the
endangered
species of
equatorial
forests crested
migratory bird,
Red Colobus
monkey and
Tana Crested
Mangabeye
monkeys
Population increased by
30% by June 2019
Undertake research to
know the status of the
species
To involve the community
in the protection of the
specie
Rolling out general
awareness campaigns
on Wildlife act
All wards
3 To improve
awareness
levels on the
new wildlife act
and promote
compliance by
the local
communities100
Local wildlife
champions identified
and trained on the
wildlife act by June
2018
15 Awareness
campaigns rolled out in
all wards by March 2019
Produce popular version
of the wildlife act in local
languages/Swahili
Produce campaign
materials including
brochures, posters,
banners etc
Identify local champions
to lead the campaign drive
at the grassroots level
Establishment for
orphanage
In the county 1 To establish
orphanage
within the
county
1 orphanage established Site identification of the
orphanage
Construction of the
orphanage

228
Sub
programs/Projects
Location Ranking Objectives Target s Activities
1
New Projects/Programmes- 5 Environmental laws and policies (Enforcement & surveillance)
Sub programs
Projects
Description of
activities
Priority
Ranking
Objectives Targets
Establishment of
environmental
policies
To undertake a
research in order
to analyze the
gaps in polices,
laws and bills
which are
important for
environmental
management
To organize the
processes of
legal formation
To hire expert in
this task through
procurement
processes
1 County head
quarter
To introduce new
policies which will be
useful in environmental
management
To ensure compliance in
the protection, save
guarding and rewarding
environment
4 county policies/bills by
2022
Strategic
Environmental
Assessment
(SEA/EIA)
County wide To identify
general
environmental
impacts of all
the projects
/policy/plan in
the CIDP and
their general
mitigation
measures NB
general
environment A
Strategic
Environmental
Assessment
report for this
CIDP produced
by June 2018
NB general
environment for
every now and
then
Community are
protected from
harmful/228njuries/dam
age 100% from
project/programs/polices
Procurement of
consultancy services, field
visits, stakeholder’s
meetings, report writing
and submission to NEMA
for consideration for
approval
Strengthen the Tana
River County Natural
Resource
Management Forum
County head
quarters
1 To improve
working
relationships
with
government and
non-state actors
and tap in their
skills and
competencies
for the benefit
of the county
To ensure that
the department
gets the best
and informed
pieces of advice
to enable it take
decisions on
projects that
have potential
impacts on the
environment at
the least/no cost
1 environmental forum
established immediately
Hold a meeting with all
members of the TRC
NRM Forum with a view
to strengthening working
relations
Constitute a subcommittee
of the TRC NRMF to
work with the
Environment Committee
in reviewing all the EIAs,
Eas and SEAs relevant to
the county and advice the
department on the best
course of action

229
Sub
programs/Projects
Location Ranking Objectives Target s Activities
Rehabilitate
abandoned gypsum
quarries control
Selected Wards
in Tana North
Sub- County
2 To abate land
degradation and
safeguard
human and
animals’ health
and safety
8 quarries
Identify gypsum quarries
whose perpetrators cannot
be established and backfill
them
Noise pollution Urban centres 3 To reduce
public nuisance
caused by
beyond
permissible
levels of noise
At least 3 noise
surveillance gadgets
installed in 3 major
towns by June 2019
Create awareness on
permissible levels of noise
in public places
Work closely with NEMA
to purchase and install
strategically noise level
measurement gadgets
Surveillance in forest,
wildlife, mining areas
to control forest
destruction
County wide 1 To control
forest, wildlife
destructions and
land
degradation
Reduce the destructions
and land degradation to
60 %
Establish county legal
Framework Surveillance
and Enforcement
Organize staffs trips to the
forest gazetted, wildlife
zones
Collaborate with KFS and
KWS in organizing public
barazas on the important
of conservation of
wildlife, indigenous trees
and land protection
Purchase vehicle for
enforcement and
surveillance
County head
quarter
1 To purchase
vehicle with
immediately3
vehicles by 2018 Procurement of vehicle
New Projects/Programmes- 6 Climate change Mitigation
Sub programs
/Projects
Location Ranking Objectives Targets Description of Activities
Promotion of the use
of alternative sources
of energy
Selected villages 2 To promote
sustainable
sources of
energy with a
view to
reducing
desertification
caused by too
much extraction
of fuelwood
2000 energy saving jikos
installed in selected
villages across the
county by march 2019
1 Biogas plant piloted
and operational by
September 2019
Identify pilot villages
based on the estimated
energy consumption and
train selected few on
energy saving
technologies
Purchase and install pilot
energy saving jikos in
selected villages
Pilot biogas in selected
pastoralist village
Installation of a
functional weather
station
All sub-counties
1 To have real
time weather
data
A functional weather
station installed by
August, 2018
Identify suitable site for
the installation of a
weather station
Procurement and
installation of weather
equipment including
manual rain gauges
Installation of manual
standard rain gauges
All sub-counties 1 To have real
time rainfall
data
Have a network of
rainfall stations in the
County
Siting, installation,
observing and
transmission of data to
central point.
Air Pollution
measurement
All sub-counties 2 To understand
the status of
pollution in the
county
1 mobile pollution lab to
have data to show how
the County atmosphere
is polluted by 2018
To get the mobile from
meteorological
department for a duration
of 15 days
Water and Sanitation Sub-Sector

230
Project Name/Location Objectives Targets Description of
activities (Key
Outputs)
Cost
(KShs.
Million)
Source
of
funding
Implementing
Agency
Remarks
Recruitment/Deployment
of SCWOs for Tana River
and Tana Delta Sub-
Counties
Efficiency in
service delivery
9No. staff to be
employed/deployed
for Tana River and
Tana Delta sub-
counties.
Advertisement
Conducting
interviews
9.6M TRCG County
Department of
water - TRCG
Recruitment of support
staff for Tana North and
Tana Delta SCW offices
Increase
efficiency in
service delivery
42No. Support staff
employed
Advertisement
Conducting
interviews
6M TRCG County
Department of
water - TRCG
Purchase of 4 supervision
vehicles
To improve
mobility and
prompt response
for supervision
of ongoing
projects at the
sub-county
levels
Office of the chief
officer
Decentralized units
(sub-county water
offices)
Identify, purchase
and issue
appropriate model
of vehicles for
supervision
28M TRCG County
Department of
water - TRCG
Construction of sub-
county offices
To create
improve
working space
for county staff
at sub-counties
and ward offices
To encourage
decentralization
of services
To establish
access to county
services closer
to the public
Construction of
2No. (Hola and
Garsen) sub-county
offices completed
Site identification
Drawings and bills
of quantities and
designs
Tendering
Construct Office
building to
accommodate the
sub-county water
officer and his
team
5M TRCG County
Department of
water - TRCG
Purchase of 10,000Ltrs
PVC water tanks
Increase storage
capacity at
domestic level
100 units procured Tender
advertisement
Issuance of LPOs
20M TRCG County
Department of
water - TRCG
Purchase of 10,000Ltrs
bladder tanks
Increase storage
capacity for the
nomadic
livestock
keepers
100 units procured Tender
advertisement
Issuance of LPOs
30M TRCG County
Department of
water - TRCG
Construction of Bangale
pipeline from river Tana
in Bangale ward
Increase access
to quality and
safe water
Water supply
constructed and
operational
Construction of a
pipeline
Elevated water
tanks
Water kiosks
65.5M TRCG County
Department of
water - TRCG
Construction of Kora
water supply in Banagale
ward
Increase access
to quality and
safe water
Water supply
constructed and
operational
Drilling and test
pumping
Equipping of the
borehole
Construction of
50cm Elevated
water tank
Construction of
3km pipeline
20M TRCG County
Department of
water - TRCG
Construction of 300m3
Mega dam in Tula in
Bangale ward
Increase access
to quality and
safe water
Distance to
water points
reduced
300cm Water pan
constructed and
operational
Excavation of
water pan
Construction of the
auxiliary structures
Construction of a
draw-off system
Construction of a
perimeter Fence
Construction of a
VIP toilet
150M TRCG County
Department of
water - TRCG
Construction of Boka
water supply in Bangale
ward
Increase access
to quality and
safe water
Water supply
constructed and
operational
Drilling and test
pumping
Equipping of the
borehole
20M TRCG County
Department of
water - TRCG

231
Project Name/Location Objectives Targets Description of
activities (Key
Outputs)
Cost
(KShs.
Million)
Source
of
funding
Implementing
Agency
Remarks
Construction of
50cm Elevated
water tank
Construction of
3km pipeline
Drilling & test pumping
and equipping of Korati
borehole in Bangale ward
Increase access
to quality and
safe water
Water supply
constructed and
operational
Drilling and test
pumping
Equipping of the
borehole
Construction of
20cm Elevated
water tank
15M TRCG County
Department of
water - TRCG
Construction of bakards in
Tula in Bangale ward
No. of hh to be
served
300hh Excavation of
bakards
Construction of the
roof catchment
structure
Excavation of
water collection
channels
Construction of
elevated supply
tank
Construction of
water kiosk
2.5M TRCG County
Department of
water - TRCG
Construction of bakards in
Balaneka in Bangale ward
No. of hh to be
served
350hh Excavation of
bakards
Construction of the
roof catchment
structure
Excavation of
water collection
channels
Construction of
elevated supply
tank
Construction of
water kiosk
2.5M TRCG County
Department of
water - TRCG
Construction of 50,000m3
Bangale water pan in
Bangale ward
Increase access
to quality and
safe water
Distance to
water points
reduced
30,000cm Water
pan constructed and
operational
Excavation of
water pan
Construction of the
auxiliary structures
Construction of a
draw-off system
Construction of a
perimeter Fence
Construction of a
VIP toilet
22M TRCG County
Department of
water - TRCG
Drilling & test pumping
and equipping of Bangale
borehole in Bangale ward
Increase access
to quality and
safe water
Water supply
constructed and
operational
Drilling and test
pumping
Equipping of the
borehole
Construction of
20cm Elevated
water tank
15M TRCG County
Department of
water - TRCG
Supply of Water to
Bangale Market
5M TRCG County
Department of
water - TRCG
Drilling & test pumping
and equipping of
Hararsud MSD farm
borehole in Madogo ward
Increase access
to quality and
safe water
Water supply
constructed and
operational
Drilling and test
pumping
Equipping of the
borehole
Construction of
20cm Elevated
water tank
15M TRCG County
Department of
water - TRCG

232
Project Name/Location Objectives Targets Description of
activities (Key
Outputs)
Cost
(KShs.
Million)
Source
of
funding
Implementing
Agency
Remarks
Drilling & test pumping
and equipping of Adama
borehole in Madogo ward
Increase access
to quality and
safe water
Water supply
constructed and
operational
Drilling and test
pumping
Equipping of the
borehole
Construction of
20cm Elevated
water tank
15M TRCG County
Department of
water - TRCG
Construction of 2No.
larger diameter boreholes
at Mororo in Madogo
ward
Increase access
to quality and
safe water
Water supply
constructed and
operational
Drilling and test
pumping
Equipping of the
borehole
Construction of
20cm Elevated
water tank
30M TRCG County
Department of
water - TRCG
Drilling & test pumping
and equipping of Mulanjo
borehole in Madogo ward
Increase access
to quality and
safe water
Water supply
constructed and
operational
Drilling and test
pumping
Equipping of the
borehole
Construction of
20cm Elevated
water tank
15M County
Department of
water - TRCG
Construction of 50,000m3
Madogo water pan in
Madogo ward
Increase access
to quality and
safe water
Distance to
water points
reduced
30,000cm Water
pan constructed and
operational
Excavation of
water pan
Construction of the
auxiliary structures
Construction of a
draw-off system
Construction of a
perimeter Fence
Construction of a
VIP toilet
22M TRCG County
Department of
water - TRCG
Drilling & test pumping
and equipping of
Kororamadha borehole in
Madogo ward
Increase access
to quality and
safe water
Water supply
constructed and
operational
Drilling and test
pumping
Equipping of the
borehole
Construction of
20cm Elevated
water tank
15M TRCG County
Department of
water - TRCG
Rehabilitation of Asako
Borehole in Madogo ward
Increase access
to quality and
safe water
Water supply
constructed and
operational
5M TRCG County
Department of
water - TRCG
Construction of
300,000m3 Mega dam in
Hamares
Increase access
to quality and
safe water
Distance to
water points
reduced
300cm Water pan
constructed and
operational
Excavation of
water pan
Construction of the
auxiliary structures
Construction of a
draw-off system
Construction of a
perimeter Fence
Construction of a
VIP toilet
150M TRCG County
Department of
water - TRCG
TRCG
Water &
sanitation
Rehabilitation of Ziwani
dyke in Sala ward
Restoration of
the degraded
dyke
Water flow restored
and redirected to the
need area
Mass excavations
Construction of
gabion boxes
10M TRCG County
Department of
water - TRCG
Drilling & test pumping
and equipping of Tafbare
borehole in Sala ward
Increase access
to quality and
safe water
Water supply
constructed and
operational
Drilling and test
pumping
Equipping of the
borehole
Construction of
20cm Elevated
water tank
15M TRCG County
Department of
water - TRCG
Drilling & test pumping
and equipping of Gubatu
borehole in Sala ward
Increase access
to quality and
safe water
Water supply
constructed and
operational
Drilling and test
pumping
15M TRCG County
Department of
water - TRCG

233
Project Name/Location Objectives Targets Description of
activities (Key
Outputs)
Cost
(KShs.
Million)
Source
of
funding
Implementing
Agency
Remarks
Equipping of the
borehole
Construction of
20cm Elevated
water tank
Construction of Bula
Rahma water supply in
Sala ward
Increase access
to quality and
safe water
Water supply
constructed and
operational
Drilling and test
pumping
Equipping of the
borehole
Construction of
50cm Elevated
water tank
Construction of
3km pipeline
20M TRCG County
Department of
water - TRCG
Construction Sala water
supply in Sala ward
Increase access
to quality and
safe water
Water supply
constructed and
operational
Drilling and test
pumping
Equipping of the
borehole
Construction of
50cm Elevated
water tank
Construction of
3km pipeline
20M TRCG County
Department of
water - TRCG
Construction Gubatu
water supply in Sala ward
Increase access
to quality and
safe water
Water supply
constructed and
operational
Drilling and test
pumping
Equipping of the
borehole
Construction of
50cm Elevated
water tank
Construction of
3km pipeline
20M TRCG County
Department of
water - TRCG
30km Pipeline extension
from Hosingo to Hirimani
in Chewele ward
Increase access
to quality and
safe water
Water supply
constructed and
operational
Construction of a
pipeline
Elevated water
tanks
Water kiosks
80M TRCG County
Department of
water - TRCG
Drilling & test pumping
and equipping of
Mitiboma borehole in
Chewele ward
Increase access
to quality and
safe water
Water supply
constructed and
operational
Drilling and test
pumping
Equipping of the
borehole
Construction of
20cm Elevated
water tank
15M TRCG County
Department of
water - TRCG
Drilling & test pumping
and equipping of Hosingo
borehole in Chewele ward
Increase access
to quality and
safe water
Water supply
constructed and
operational
Drilling and test
pumping
Equipping of the
borehole
Construction of
20cm Elevated
water tank
15M TRCG County
Department of
water - TRCG
Drilling & test pumping
and equipping of Nanighi
borehole in Chewele ward
Increase access
to quality and
safe water
Water supply
constructed and
operational
Drilling and test
pumping
Equipping of the
borehole
Construction of
20cm Elevated
water tank
15M TRCG County
Department of
water - TRCG
Drilling & test pumping
and equipping of Diram
borehole in Chewele ward
Increase access
to quality and
safe water
Water supply
constructed and
operational
Drilling and test
pumping
Equipping of the
borehole
Construction of
20cm Elevated
water tank
15M TRCG County
Department of
water - TRCG

234
Project Name/Location Objectives Targets Description of
activities (Key
Outputs)
Cost
(KShs.
Million)
Source
of
funding
Implementing
Agency
Remarks
Drilling & test pumping
and equipping of
Kazamoyo borehole in
Chewele ward
Increase access
to quality and
safe water
Water supply
constructed and
operational
Drilling and test
pumping
Equipping of the
borehole
Construction of
20cm Elevated
water tank
15M TRCG County
Department of
water - TRCG
Drilling & test pumping
and equipping of
Kamuthe borehole in
Chewele ward
Increase access
to quality and
safe water
Water supply
constructed and
operational
Drilling and test
pumping
Equipping of the
borehole
Construction of
20cm Elevated
water tank
15M TRCG County
Department of
water - TRCG
Drilling & test pumping
and equipping of Darime
borehole in Chewele ward
Increase access
to quality and
safe water
Water supply
constructed and
operational
Drilling and test
pumping
Equipping of the
borehole
Construction of
20cm Elevated
water tank
15M TRCG County
Department of
water - TRCG
Purchase of 10,000Ltrs
PVC water tanks in
Chewele ward institutions
Increase storage
capacity at
domestic level
20 units procured Tender
advertisement
Issuance of LPOs
5M TRCG County
Department of
water - TRCG
Drilling & test pumping
and equipping of Shabaha
borehole in Chewele ward
Increase access
to quality and
safe water
Water supply
constructed and
operational
Drilling and test
pumping
Equipping of the
borehole
Construction of
20cm Elevated
water tank
15M TRCG County
Department of
water - TRCG
Chardende – Doka notu
distribution pipeline
TRCG County
Department of
water - TRCG
Construction of
300,000m3 Mega dam in
Hirimani
Increase access
to quality and
safe water
Distance to
water points
reduced
300,000cm Water
pan constructed and
operational
Excavation of
water pan
Construction of the
auxiliary structures
Construction of a
draw-off system
Construction of a
perimeter Fence
Construction of a
VIP toilet
150M TRCG County
Department of
water - TRCG
TRCG
Water &
sanitation
5km Pipeline extension
from Bura water works to
Bura TTI in Hirimani
ward
Increase access
to quality and
safe water
Water supply
constructed and
operational
Construction of a
pipeline
Elevated water
tanks
Water kiosks
14M TRCG County
Department of
water - TRCG
6km Pipeline extension
from Bura water works to
Manyatta in Hirimani
ward
Increase access
to quality and
safe water
Water supply
constructed and
operational
Construction of a
pipeline
Elevated water
tanks
Water kiosks
16M TRCG County
Department of
water - TRCG
Construction Titila water
supply in Hirimani ward
Increase access
to quality and
safe water
Water supply
constructed and
operational
Drilling and test
pumping
Equipping of the
borehole
Construction of
50cm Elevated
water tank
Construction of
3km pipeline
20M TRCG County
Department of
water - TRCG

235
Project Name/Location Objectives Targets Description of
activities (Key
Outputs)
Cost
(KShs.
Million)
Source
of
funding
Implementing
Agency
Remarks
Construction of Walesa
sand dam in Hirimani
Ward
Increase access
to quality and
safe water
Water supply
constructed and
operational
20M TRCG County
Department of
water - TRCG
Construction of Chirfa
sand dam in Hirimani
Ward
Increase access
to quality and
safe water
Water supply
constructed and
operational
20M TRCG County
Department of
water - TRCG
Construction of 50,000m3
Kurujo water pan in
Hirimani ward
Increase access
to quality and
safe water
Distance to
water points
reduced
30,000cm Water
pan constructed and
operational
Excavation of
water pan
Construction of the
auxiliary structures
Construction of a
draw-off system
Construction of a
perimeter Fence
Construction of a
VIP toilet
22M TRCG County
Department of
water - TRCG
Construction of 50,000m3
Bula Rigi water pan in
Hirimani ward
Increase access
to quality and
safe water
Distance to
water points
reduced
30,000cm Water
pan constructed and
operational
Excavation of
water pan
Construction of the
auxiliary structures
Construction of a
draw-off system
Construction of a
perimeter Fence
Construction of a
VIP toilet
22M TRCG County
Department of
water - TRCG
Drilling & test pumping
and equipping of Sabukia
borehole in Hirimani ward
Increase access
to quality and
safe water
Water supply
constructed and
operational
Drilling and test
pumping
Equipping of the
borehole
Construction of
20cm Elevated
water tank
15M TRCG County
Department of
water - TRCG
Drilling & test pumping
and equipping of Kaniki
borehole in Hirimani ward
Increase access
to quality and
safe water
Water supply
constructed and
operational
Drilling and test
pumping
Equipping of the
borehole
Construction of
20cm Elevated
water tank
15M TRCG County
Department of
water - TRCG
Drilling & test pumping
and equipping of Titila
borehole in Hirimani ward
Increase access
to quality and
safe water
Water supply
constructed and
operational
Drilling and test
pumping
Equipping of the
borehole
Construction of
20cm Elevated
water tank
15M TRCG County
Department of
water - TRCG
Construction
Walestokocha water
supply in Hirimani ward
Increase access
to quality and
safe water
Water supply
constructed and
operational
Drilling and test
pumping
Equipping of the
borehole
Construction of
50cm Elevated
water tank
Construction of
3km pipeline
20M TRCG County
Department of
water - TRCG
Water extension pipeline
from Meti to Makere in
Chewani ward
Increase access
to quality and
safe water
Distance to
water points
reduced
Water pipeline from
Meti to Makere
constructed
Water supply
Pipeline extension
done
1No. Water kiosk
done
20CM elevated
water tank done
25M TRCG County
Department of
water - TRCG

236
Project Name/Location Objectives Targets Description of
activities (Key
Outputs)
Cost
(KShs.
Million)
Source
of
funding
Implementing
Agency
Remarks
Construction Wachakone
water supply in Chewani
ward
Increase access
to quality and
safe water
Water supply
constructed and
operational
Drilling and test
pumping
Equipping of the
borehole
Construction of
50cm Elevated
water tank
Construction of
3km pipeline
20M TRCG County
Department of
water - TRCG
Drilling & test pumping
and equipping of Milalulu
borehole in Chewaani
ward
Increase access
to quality and
safe water
Water supply
constructed and
operational
Drilling and test
pumping
Equipping of the
borehole
Construction of
20cm Elevated
water tank
15M TRCG County
Department of
water - TRCG
Drilling & test pumping
and equipping of Makere
borehole in Chewaani
ward
Increase access
to quality and
safe water
Water supply
constructed and
operational
Drilling and test
pumping
Equipping of the
borehole
Construction of
20cm Elevated
water tank
15M TRCG County
Department of
water - TRCG
Drilling & test pumping
and equipping of
Masabubu borehole in
Chewaani ward
Increase access
to quality and
safe water
Water supply
constructed and
operational
Drilling and test
pumping
Equipping of the
borehole
Construction of
20cm Elevated
water tank
15M TRCG County
Department of
water - TRCG
Water extension pipeline
from Dayate Pry school to
Kiriakungu in Chewani
ward
Increase access
to quality and
safe water
Distance to
water points
reduced
Water pipeline from
Dayate to
Kiriakungu
constructed
Water supply
Pipeline extension
done
1No. Water kiosk
done
20CM elevated
water tank done
20M TRCG County
Department of
water - TRCG
Construction of Milalulu
water pan in Chewani
ward
Increase access
to quality and
safe water
Distance to
water points
reduced
20cm Water pan
constructed and
operational
Excavation of
water pan
Construction of the
auxiliary structures
Construction of a
perimeter Fence
Construction of a
VIP toilet
10M TRCG County
Department of
water - TRCG
Construction of
Kiriakungu water pan in
Chewani ward
Increase access
to quality and
safe water
Distance to
water points
reduced
20cm Water pan
constructed and
operational
Excavation of
water pan
Construction of the
auxiliary structures
Construction of a
perimeter Fence
Construction of a
VIP toilet
10M TRCG County
Department of
water - TRCG
Construction of Masabubu
water pan in Chewani
ward
Increase access
to quality and
safe water
Distance to
water points
reduced
20cm Water pan
constructed and
operational
Excavation of
water pan
Construction of the
auxiliary structures
Construction of a
perimeter Fence
Construction of a
VIP toilet
10M TRCG County
Department of
water - TRCG
Construction of Makere
water pan in Chewani
ward
Increase access
to quality and
safe water
20cm Water pan
constructed and
operational
Excavation of
water pan
Construction of the
auxiliary structures
10M TRCG County
Department of
water - TRCG

237
Project Name/Location Objectives Targets Description of
activities (Key
Outputs)
Cost
(KShs.
Million)
Source
of
funding
Implementing
Agency
Remarks
Distance to
water points
reduced
Construction of a
perimeter Fence
Construction of a
VIP toilet
Construction of Chewani
water supply in Chewani
ward
Increase access
to quality and
safe water
Water supply
constructed and
operational
Drilling and test
pumping
Equipping of the
borehole
Construction of
50cm Elevated
water tank
Construction of
3km pipeline
20M TRCG County
Department of
water - TRCG
Construction of
Galamanni water supply
in Chewani ward
Increase access
to quality and
safe water
Water supply
constructed and
operational
Drilling and test
pumping
Equipping of the
borehole
Construction of
50cm Elevated
water tank
Construction of
3km pipeline
20M TRCG County
Department of
water - TRCG
Construction of 4No.
larger diameter boreholes
at the Hola water supply
in Mikinduni ward
Increase access
to quality and
safe water
Water supply
constructed and
operational
Drilling and test
pumping
Equipping of the
borehole
Construction of
20cm Elevated
water tank
60M TRCG County
Department of
water - TRCG
Hola water work to
Malindi ya ngwena water
pipeline extension project
in Mikinduni ward
Increase access
to quality and
safe water
5km pipeline
constructed and
operational
Pipeline laying
50cm Elevated
water tank
Water kiosk
14M TRCG County
Department of
water - TRCG
Procurement of cold
meters for Hola water
supply project in
Mikinduni ward
5M TRCG County
Department of
water - TRCG
15km Pipeline extension
from Hola water works to
the New County
Headquaters
Increase access
to quality and
safe water
Distance to
water points
reduced
Water pipeline from
Hola water supply
to the new County
HQs constructed
Water supply
Pipeline extension
done
4No. Water kiosks
done
500CM elevated
water tank done
60M TRCG County
Department of
water - TRCG
Automation of water bills
in all the water supplies
5M TRCG County
Department of
water - TRCG
Construction of 6No.
water kiosks (Hola sec,
Mwangaza, Laza town,
Laza mtoni/ Ghala estate)
in mikinduni ward
3M TRCG County
Department of
water - TRCG
Construction of Chanani
water supply in Mikinduni
ward
Increase access
to quality and
safe water
Water supply
constructed and
operational
Drilling and test
pumping
Equipping of the
borehole
Construction of
50cm Elevated
water tank
Construction of
3km pipeline
20M TRCG County
Department of
water - TRCG
Construction of the Hola
sewerage system in
Mikinduni ward
200M TRCG County
Department of
water - TRCG

238
Project Name/Location Objectives Targets Description of
activities (Key
Outputs)
Cost
(KShs.
Million)
Source
of
funding
Implementing
Agency
Remarks
Construction of Majengo
water supply in
Kinakomba ward
Increase access
to quality and
safe water
Water supply
constructed and
operational
Drilling and test
pumping
Equipping of the
borehole
Construction of
50cm Elevated
water tank
Construction of
3km pipeline
Water kiosk
20M TRCG County
Department of
water - TRCG
7km Pipeline extension
from Makere to Hara
Increase access
to quality and
safe water
Distance to
water points
reduced
Water pipeline from
Makere water
supply to Hara
constructed
Water supply
Pipeline extension
done
4No. Water kiosks
done
50CM elevated
water tank done
17M TRCG County
Department of
water - TRCG
Expansion of Wenje water
supply project in
Kinakomba ward
Increase access
to quality and
safe water
Water supply
constructed and
operational
Drilling and test
pumping
Equipping of the
borehole
Construction of
50cm Elevated
water tank
Construction of
3km pipeline
Water kiosk
10M TRCG County
Department of
water - TRCG
Drilling & test pumping
and equipping of Haroresa
borehole in Kinakomba
ward
No of
households
connected with
quality and safe
water
300hh Drilling and test
pumping
Equipping of the
borehole
Construction of
20cm Elevated
water tank
15M TRCG County
Department of
water - TRCG
5km Pipeline extension
from Majengo to Kilindini
in Kinakomba ward
No of
households
connected with
quality and safe
water
800hh Water supply
Pipeline extension
done
4No. Water kiosks
done
50CM elevated
water tank done
14M TRCG County
Department of
water - TRCG
Construction of 300,
000cm Mega dam in
Kokani lagga
Increase access
to quality and
safe water
Distance to
water points
reduced
300cm Water pan
constructed and
operational
Excavation of
water pan
Construction of the
auxiliary structures
Construction of a
draw-off system
Construction of a
perimeter Fence
Construction of a
VIP toilet
150M TRCG County
Department of
water - TRCG
TRCG
Water &
sanitation
Galole lagga reclamation
project at Wayu duka and
wayu Boro in Wayu ward
No of hh using
irrigated
agriculture in
Wayu duka and
Wayu boro
350 hh Bush clearance
Rehabilitation of
the channels using
gabions boxes
Construction of
small weirs along
the lagga
20M TRCG County
Department of
water - TRCG
Drilling & test pumping
and equipping of Lakole
borehole in Wayu ward
No of
households
connected with
quality and safe
water
250hh Drilling and test
pumping
Equipping of the
borehole
Construction of
20cm Elevated
water tank
15M TRCG County
Department of
water - TRCG

239
Project Name/Location Objectives Targets Description of
activities (Key
Outputs)
Cost
(KShs.
Million)
Source
of
funding
Implementing
Agency
Remarks
Drilling & test pumping
and equipping of Lakole
borehole in Wayu ward
No of
households
connected with
quality and safe
water
200hh Drilling and test
pumping
Equipping of the
borehole
Construction of
20cm Elevated
water tank
15M TRCG County
Department of
water - TRCG
Drilling & test pumping
and equipping of Gofisa
borehole in Wayu ward
No of
households
connected with
quality and safe
water
150hh Drilling and test
pumping
Equipping of the
borehole
Construction of
20cm Elevated
water tank
15M TRCG County
Department of
water - TRCG
Rehabilitation of existing
water pans (Wayu boro,
Mesa, Lakole, Kesi and
Wayu duka) in Wayu
ward
Increasing
capacity of
water pans
5000cm Increasing capacity
by 5000cm
through excavation
Rehabilitation of
the auxiliary works
Fencing of the
pans
Construction of a
VIP toilet
20M TRCG County
Department of
water - TRCG
Construction of
300,0000m3 Wayu duka
Mega dam in Wayu ward
Increase access
to quality and
safe water
Distance to
water points
reduced
300,000cm Water
pan constructed and
operational
Excavation of
water pan
Construction of the
auxiliary structures
Construction of a
draw-off system
Construction of a
perimeter Fence
Construction of a
VIP toilet
150M TRCG County
Department of
water - TRCG
Construction of Kalalani
water supply in Wayu
ward
Increase access
to quality and
safe water
Water supply
constructed and
operational
Drilling and test
pumping
Equipping of the
borehole
Construction of
50cm Elevated
water tank
Construction of
3km pipeline
20M TRCG County
Department of
water - TRCG
Extension of the earthen
canal from Bura to wayu
More hh
accessing water
More hh
embracing
irrigated
agriculture
More water to
livestock
5000hh Mass excavation
Construction of
culverts, Weirs
9800M TRCG County
Department of
water - TRCG
Drilling & test pumping
and equipping of Koticha
odowan borehole in Wayu
ward
No of
households
connected with
quality and safe
water
200hh Drilling and test
pumping
Equipping of the
borehole
Construction of
20cm Elevated
water tank
15M TRCG County
Department of
water - TRCG
Rehabilitation of WIWA
project in Kipini East
ward
No of
households
connected with
quality and safe
water
3000hh Rehabilitation and
maintenance
10M TRCG County
Department of
water - TRCG
Diversion of the Mtomoni
brook in in Kipini East
ward
Restoration of
flow of water
along the
Water flow restored
in the channel
Feasibility study
Recommendations
given
20M TRCG County
Department of
water - TRCG

240
Project Name/Location Objectives Targets Description of
activities (Key
Outputs)
Cost
(KShs.
Million)
Source
of
funding
Implementing
Agency
Remarks
channel to
Wema
Irrigation schemes
operational
Construction of the
diversion works
Diversion of the Saba
kalota brook in in Kipini
East ward
Restoration of
flow of water
along the
channel to
Wema
Water flow restored
in the channel
Irrigation schemes
operational
Feasibility study
Recommendations
given
Construction of the
diversion works
20M TRCG County
Department of
water - TRCG
Construction of water
supply pipeline to
Mangani in Kipini east
ward
No of
households
connected with
quality and safe
water
150hh Drilling and test
pumping
Equipping of the
borehole
Construction of
50cm Elevated
water tank
Construction of
4km pipeline
21M TRCG County
Department of
water - TRCG
Construction of 2No.
bakards in Kilelengwani
and Ozi in Kipini east
ward
No. of hh to be
served
1000hh Excavation of
bakards
Construction of the
roof catchment
structure
Excavation of
water collection
channels
Construction of
elevated supply
tank
Construction of
water kiosk
5M TRCG County
Department of
water - TRCG
Construction of a water
supply at Kipini Police
station in Kipini east ward
Increase access
to quality and
safe water
Water supply
constructed and
operational
Drilling and test
pumping
Equipping of the
borehole
Construction of
50cm Elevated
water tank
Construction of
3km pipeline
15M TRCG County
Department of
water - TRCG
Extension of water supply
to villages within Kipini
Area in Kipini east ward
No. of hh to be
served
800hh Water pipeline laid
50cm Elevated
water tank
Construction of
water kiosks
15M TRCG County
Department of
water - TRCG
Extension of water supply
to Shauri moyo and its
surrounding villages in
Kipini east ward
No. of hh to be
served
700hh Water pipeline laid
50cm Elevated
water tank
Construction of
water kiosks
20M TRCG County
Department of
water - TRCG
Diversion of laghabuna
brook to Kitangale
towards lake shakababu in
Garsen south ward
Restoration of
flow of water
along the
channel to the
lake
Water flow restored
in the channel
Irrigation schemes
operational
Feasibility study
Recommendations
given
Construction of the
diversion works
20M TRCG County
Department of
water - TRCG
Rehabilitation of lake
Shakababu in Tarasaa
Restoration of
lake shakababu
Water flow restored
in the lake
Access to water for
Irrigation restored
Feasibility study
Recommendations
given
Construction of the
diversion works
20M TRCG County
Department of
water - TRCG
Construction of Golbanti
water supply in Garsen
south ward
No. of hh to be
served
1500hh Drilling and test
pumping
Equipping of the
borehole
Construction of
50cm Elevated
water tank
25M TRCG County
Department of
water - TRCG
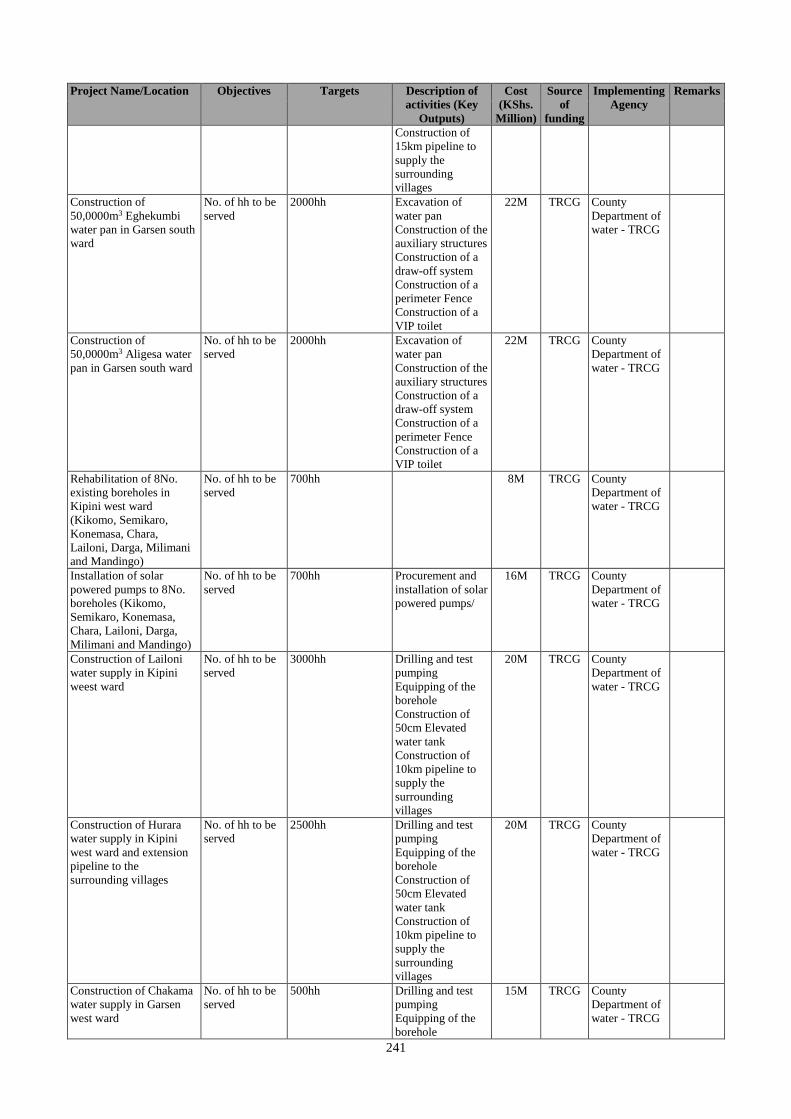
241
Project Name/Location Objectives Targets Description of
activities (Key
Outputs)
Cost
(KShs.
Million)
Source
of
funding
Implementing
Agency
Remarks
Construction of
15km pipeline to
supply the
surrounding
villages
Construction of
50,0000m3 Eghekumbi
water pan in Garsen south
ward
No. of hh to be
served
2000hh Excavation of
water pan
Construction of the
auxiliary structures
Construction of a
draw-off system
Construction of a
perimeter Fence
Construction of a
VIP toilet
22M TRCG County
Department of
water - TRCG
Construction of
50,0000m3 Aligesa water
pan in Garsen south ward
No. of hh to be
served
2000hh Excavation of
water pan
Construction of the
auxiliary structures
Construction of a
draw-off system
Construction of a
perimeter Fence
Construction of a
VIP toilet
22M TRCG County
Department of
water - TRCG
Rehabilitation of 8No.
existing boreholes in
Kipini west ward
(Kikomo, Semikaro,
Konemasa, Chara,
Lailoni, Darga, Milimani
and Mandingo)
No. of hh to be
served
700hh 8M TRCG County
Department of
water - TRCG
Installation of solar
powered pumps to 8No.
boreholes (Kikomo,
Semikaro, Konemasa,
Chara, Lailoni, Darga,
Milimani and Mandingo)
No. of hh to be
served
700hh Procurement and
installation of solar
powered pumps/
16M TRCG County
Department of
water - TRCG
Construction of Lailoni
water supply in Kipini
weest ward
No. of hh to be
served
3000hh Drilling and test
pumping
Equipping of the
borehole
Construction of
50cm Elevated
water tank
Construction of
10km pipeline to
supply the
surrounding
villages
20M TRCG County
Department of
water - TRCG
Construction of Hurara
water supply in Kipini
west ward and extension
pipeline to the
surrounding villages
No. of hh to be
served
2500hh Drilling and test
pumping
Equipping of the
borehole
Construction of
50cm Elevated
water tank
Construction of
10km pipeline to
supply the
surrounding
villages
20M TRCG County
Department of
water - TRCG
Construction of Chakama
water supply in Garsen
west ward
No. of hh to be
served
500hh Drilling and test
pumping
Equipping of the
borehole
15M TRCG County
Department of
water - TRCG

242
Project Name/Location Objectives Targets Description of
activities (Key
Outputs)
Cost
(KShs.
Million)
Source
of
funding
Implementing
Agency
Remarks
Construction of
50cm Elevated
water tank
Construction of
2km pipeline to
supply the
surrounding
villages
Construction of Garsen
water pump station, to
supply water to the
surrounding villages like
(Tullu, Minjilla)
No. of hh to be
served
4000hh Construction of a
pump house
Construction of a
sump
Construction of a
1000cm capacity
elevated water tank
Installation of a
pump
30M TRCG County
Department of
water - TRCG
Drilling & test pumping
and equipping of Tank E
borehole in Garsen west
ward
No of
households
connected with
quality and safe
water
300hh Drilling and test
pumping
Equipping of the
borehole
Construction of
20cm Elevated
water tank
Extension pipeline
to the surrounding
villages
15M TRCG County
Department of
water - TRCG
Construction of
300,000cm Mega dam in
Assa
Increase access
to quality and
safe water
Distance to
water points
reduced
300,000cm Water
pan constructed and
operational
Excavation of
water pan
Construction of the
auxiliary structures
Construction of a
draw-off system
Construction of a
perimeter Fence
Construction of a
VIP toilet
150M TRCG County
Department of
water - TRCG
TRCG
Water &
sanitation
Diversion of Kitere brook
in Garsen north ward
Restoration of
flow of water
along the
channel to the
lake
Water flow restored
in the channel
Irrigation schemes
operational
Feasibility study
Recommendations
given
Construction of the
diversion works
20M TRCG County
Department of
water - TRCG
Construction of Kitere
water supply in Garsen
North ward and extension
pipeline to the
surrounding villages
No. of hh to be
served
4000hh Drilling and test
pumping
Equipping of the
borehole
Construction of
50cm Elevated
water tank
Construction of
15km pipeline to
supply the
surrounding
villages
25M TRCG County
Department of
water - TRCG
Rehabilitation of Bahati
water supply in Garsen
North ward
No. of hh to be
served
600hh 15M TRCG County
Department of
water - TRCG
Drilling & test pumping
and equipping of Gadeni
pry school borehole in
Garsen north ward
No of
households
connected with
quality and safe
water
300hh Drilling and test
pumping
Equipping of the
borehole
Construction of
20cm Elevated
water tank
15M TRCG County
Department of
water - TRCG

243
Project Name/Location Objectives Targets Description of
activities (Key
Outputs)
Cost
(KShs.
Million)
Source
of
funding
Implementing
Agency
Remarks
Extension pipeline
to the surrounding
villages
Rehabilitation of 5No.
shallow wells (Mnazini,
Baomo, Choa, Mumbuji
and Kinyadu) in Garsen
North ward
No. of hh to be
served
600hh 2.5M TRCG County
Department of
water - TRCG
Construction of
50,0000m3 Junji water
pan in Garsen central
ward
No. of hh to be
served
1000hh Excavation of
water pan
Construction of the
auxiliary structures
Construction of a
draw-off system
Construction of a
perimeter Fence
Construction of a
VIP toilet
22M TRCG County
Department of
water - TRCG
Drilling & test pumping
and equipping of Onkode
borehole in Garsen central
ward
No of
households
connected with
quality and safe
water
400hh Drilling and test
pumping
Equipping of the
borehole
Construction of
20cm Elevated
water tank
Extension pipeline
to the surrounding
villages
15M TRCG County
Department of
water - TRCG

244
Annex III: Stalled Projects
Agriculture, Rural and Urban Development Sector
Veterinary Sub-Sector Project Name
Location Description of activities Reasons for stalling
Garsen modern slaughter
house
Garsen Construction works Was started by GOK ESP project as a
vision 2030 project
Health Project Name
Location Description of activities Reasons for stalling
Stalled construction of
health facilities
Kilindini, Mikinduni, Matagala,
Umoja, Daba, Waldena Maternity,
Charidende
Evaluation of progress,
review of tenders,
completion
Lack of consistency in funding/
Inadequate budgetary allocation
Construction of
Theatre
Garsen Evaluation of progress,
review of tenders,
completion
Limitation in funding
Renovation of
mortuary
Hola Renovation and equipping Works not completed by
contractor
Construction of
incinerator
Hola Construction Standards not observed by
contractor
Construction of
maternity ward
Hola Construction Funds flow challenges
Construction of wards
Hola Construction Funds flow challenge
Environmental Protection, Water and Sanitation Sector Project Name Location Description of activities Reasons for stalling
Establishment of public park Hola Identification of land
Designating of the parks
Fencing of the park
Change of use as the land
initially identified and fenced
was reallocated to KMTC
Drilling & Test Pumping of
Tula Borehole
Tula, Bangale Drilling and test pumping Non-payment of down
payment
Pipeline Extension to The
Governors Official Residence
in Kalkacha
Hola Construction of an elevated
supply tank
Pipe reticulation &
Fixing of air valves and
wash outs
Non-payment of pending
certificates
Improvement of Katumba
Borehole
Bangale Installation of a genset back
up
Construction of a store
house
Non-payment of pending
certificates
Construction of Kilelengwani
Water Pan
Wachu Oda
Chardende Pipeline Extension
3.6km Construction Project
Chardende Pipeline extension to the
community
Non-payment of down
payment
Sabukia Water Pan
Rehabilitation
Hirimani Rehabilitation of the water
pan
Rehabilitation of the water pan
through desilting
Rehabilitation of Gururi Water
Pan
Wayu Fencing of the water pan
Opening up of the inlet and
outlet channels
Rehabilitation of the sill
Non-payment of pending
certificates
Top Related