


Languages
Pages
Legal


TABELAS ÚTEIS
75
Séri
e
Des
ign
ação
Esp
açam
ento
lo
ng
itu
din
al
(cm
)
Esp
açam
ento
tr
ansv
ersa
l(c
m)
Diâ
met
ro
lon
git
ud
inal
(mm
)
Diâ
met
ro
tran
sver
sal
(mm
)
Seçã
o
lon
git
ud
inal
(cm
2 / m
)
Seçã
o
tran
sver
sal
(cm
2 / m
)
Ap
rese
nta
ção
Larg
ura
(m
)
Co
mp
rim
ento
(m
)
Kg
/ m
2
Kg
/ p
eça
61 Q 61 15 15 3,4 3,4 0,61 0,61 ROLO 2,45 120 0,97 285,2
75 Q 75 15 15 3,8 3,8 0,75 0,75 ROLO 2,45 120 1,21 355,7
92 Q 92 15 15 4,2 4,2 0,92 0,92 ROLO 2,45 60 1,48 217,6
92 Q 92 15 15 4,2 4,2 0,92 0,92 PAINEL 2,45 6 1,48 21,8
92 T 92 30 15 4,2 4,2 0,46 0,92 ROLO 2,45 120 1,12 329,3
113 Q 113 10 10 3,8 3,8 1,13 1,13 ROLO 2,45 60 1,8 264,6
113 L 113 10 30 3,8 3,8 1,13 0,38 ROLO 2,45 60 1,21 177,9
138 Q 138 10 10 4,2 4,2 1,38 1,38 ROLO 2,45 60 2,2 323,4
138 Q 138 10 10 4,2 4,2 1,38 1,38 PAINEL 2,45 6 2,2 32,3
138 R 138 10 15 4,2 4,2 1,38 0,92 PAINEL 2,45 6 1,83 26,9
138 M 138 10 20 4,2 4,2 1,38 0,69 PAINEL 2,45 6 1,65 24,3
138 L 138 10 30 4,2 4,2 1,38 0,46 ROLO 2,45 60 1,47 216,1
138 T 138 30 10 4,2 4,2 0,46 1,38 ROLO 2,45 60 1,49 219
159 Q 159 10 10 4,5 4,5 1,59 1,59 PAINEL 2,45 6 2,52 37
159 R 159 10 15 4,5 4,5 1,59 1,06 PAINEL 2,45 6 2,11 31
159 M 159 10 20 4,5 4,5 1,59 0,79 PAINEL 2,45 6 1,9 27,9
159 L 159 10 30 4,5 4,5 1,59 0,53 PAINEL 2,45 6 1,69 24,8
196 Q 196 10 10 5 5 1,96 1,96 PAINEL 2,45 6 3,11 45,7
196 R 196 10 15 5 5 1,96 1,3 PAINEL 2,45 6 2,6 38,2
196 M 196 10 20 5 5 1,96 0,98 PAINEL 2,45 6 2,34 34,4
196 L 196 10 30 5 5 1,96 0,65 PAINEL 2,45 6 2,09 30,7
196 T 196 30 10 5 5 0,65 1,96 PAINEL 2,45 6 2,11 31
246 Q 246 10 10 5,6 5,6 2,46 2,46 PAINEL 2,45 6 3,91 57,5
246 R 246 10 15 5,6 5,6 2,46 1,64 PAINEL 2,45 6 3,26 47,9
246 M 246 10 20 5,6 5,6 2,46 1,23 PAINEL 2,45 6 2,94 43,2
246 L 246 10 30 5,6 5,6 2,46 0,82 PAINEL 2,45 6 2,62 38,5
246 T 246 30 10 5,6 5,6 0,82 2,46 PAINEL 2,45 6 2,64 38,8
283 Q 283 10 10 6 6 2,83 2,83 PAINEL 2,45 6 4,48 65,9
283 R 283 10 15 6 6 2,83 1,88 PAINEL 2,45 6 3,74 55
283 M 283 10 20 6 6 2,83 1,41 PAINEL 2,45 6 3,37 49,5
283 L 283 10 30 6 6 2,83 0,94 PAINEL 2,45 6 3 44,1
335 Q 335 15 15 8 8 3,35 3,35 PAINEL 2,45 6 5,37 78,9
335 L 335 15 30 8 6 3,35 0,94 PAINEL 2,45 6 3,48 51,2
335 T 335 30 15 6 8 0,94 3,35 PAINEL 2,45 6 3,45 50,7
396 Q 396 10 10 7,1 7,1 3,96 3,96 PAINEL 2,45 6 6,28 92,3
396 L 396 10 30 7,1 6 3,96 0,94 PAINEL 2,45 6 3,91 57,5
503 Q 503 10 10 8 8 5,03 5,03 PAINEL 2,45 6 7,97 117,2
503 L 503 10 30 8 6 5,03 0,94 PAINEL 2,45 6 4,77 70,1
503 T 503 30 10 6 8 0,94 5,03 PAINEL 2,45 6 4,76 70
636 Q 636 10 10 9 9 6,36 6,36 PAINEL 2,45 6 10,09 148,3
636 L 636 10 30 9 6 6,36 0,94 PAINEL 2,45 6 5,84 85,8
785 Q 785 10 10 10 10 7,85 7,85 PAINEL 2,45 6 12,46 183,2
785 L 785 10 30 10 6 7,85 0,94 PAINEL 2,45 6 7,03 103,3
1227 LA 1227 10 30 12,5 7,1 12,27 1,32 PAINEL 2,45 6 10,87 159,8
98 EQ 98 5 5 2,5 2,5 0,98 0,98 ROLO 1,2 60 1,54 110,9
Telas soldadas nervuradas
TABELAS ÚTEIS
76
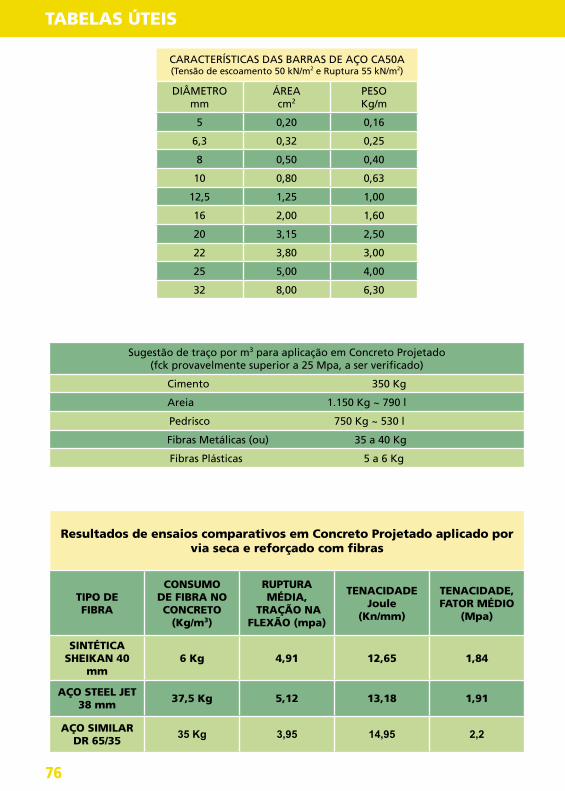
Sugestão de traço por m3 para aplicação em Concreto Projetado(fck provavelmente superior a 25 Mpa, a ser verificado)
Cimento 350 Kg
Areia 1.150 Kg ~ 790 l
Pedrisco 750 Kg ~ 530 l
Fibras Metálicas (ou) 35 a 40 Kg
Fibras Plásticas 5 a 6 Kg
DIÂMETROmm
ÁREAcm2
PESOKg/m
5 0,20 0,16
6,3 0,32 0,25
8 0,50 0,40
10 0,80 0,63
12,5 1,25 1,00
16 2,00 1,60
20 3,15 2,50
22 3,80 3,00
25 5,00 4,00
32 8,00 6,30
CARACTERÍSTICAS DAS BARRAS DE AÇO CA50A(Tensão de escoamento 50 kN/m2 e Ruptura 55 kN/m2)
TIPO DE FIBRA
CONSUMO DE FIBRA NO CONCRETO
(Kg/m3)
RUPTURA MÉDIA,
TRAÇÃO NA FLEXÃO (mpa)
TENACIDADEJoule
(Kn/mm)
TENACIDADE, FATOR MÉDIO
(Mpa)
SINTÉTICASHEIKAN 40
mm6 Kg 4,91 12,65 1,84
AÇO STEEL JET 38 mm 37,5 Kg 5,12 13,18 1,91
AÇO SIMILARDR 65/35
35 Kg 3,95 14,95 2,2
Resultados de ensaios comparativos em Concreto Projetado aplicado por via seca e reforçado com fibras
TABELAS ÚTEIS
77
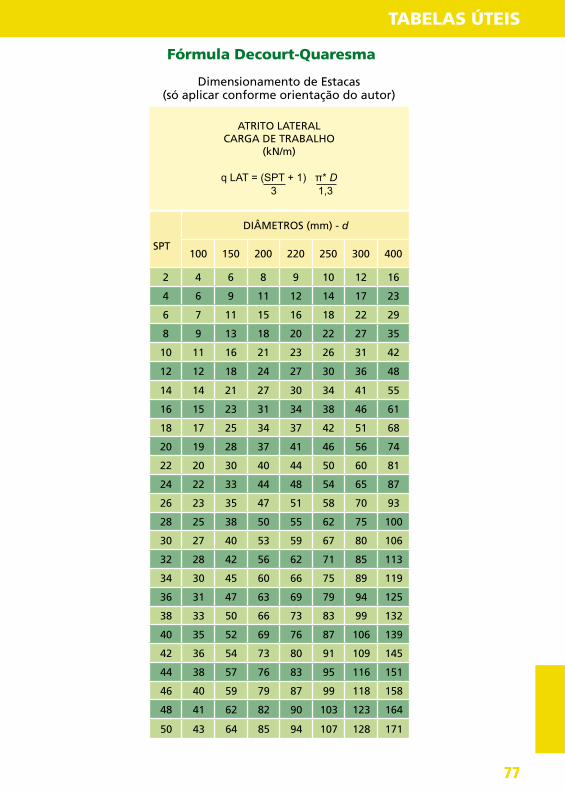
ATRITO LATERALCARGA DE TRABALHO
(kN/m)
q LAT = (SPT + 1) π* D 3 1,3
SPT
DIÂMETROS (mm) - d
100 150 200 220 250 300 400
2 4 6 8 9 10 12 16
4 6 9 11 12 14 17 23
6 7 11 15 16 18 22 29
8 9 13 18 20 22 27 35
10 11 16 21 23 26 31 42
12 12 18 24 27 30 36 48
14 14 21 27 30 34 41 55
16 15 23 31 34 38 46 61
18 17 25 34 37 42 51 68
20 19 28 37 41 46 56 74
22 20 30 40 44 50 60 81
24 22 33 44 48 54 65 87
26 23 35 47 51 58 70 93
28 25 38 50 55 62 75 100
30 27 40 53 59 67 80 106
32 28 42 56 62 71 85 113
34 30 45 60 66 75 89 119
36 31 47 63 69 79 94 125
38 33 50 66 73 83 99 132
40 35 52 69 76 87 106 139
42 36 54 73 80 91 109 145
44 38 57 76 83 95 116 151
46 40 59 79 87 99 118 158
48 41 62 82 90 103 123 164
50 43 64 85 94 107 128 171
Fórmula Decourt-Quaresma
Dimensionamento de Estacas(só aplicar conforme orientação do autor)

TABELAS ÚTEIS
78
d (mm) Ap (cm²)100 78,54150 176,71200 314,16220 380,13250 490,87300 706,86400 1.256,64
PONTACARGA DE TRABALHO
(kN)
Qponta = Ap x SPT x K 4
SPTDIÂMETRO (mm)
100 150 200 220 250 300 400
10 2 5 9 11 15 21 38
14 3 7 13 16 21 30 53
18 4 10 17 21 27 38 68
22 5 12 21 25 32 47 83
26 6 14 25 30 38 55 98
30 7 16 28 34 44 64 113
34 8 18 32 39 50 72 128
38 9 20 36 43 56 81 143
42 10 22 40 48 62 89 158
46 11 25 45 55 71 102 181
50 12 27 47 57 74 106 188
K = 12 ARGILA
SPTDIÂMETRO (mm)
100 150 200 220 250 300 400
10 5 11 20 24 31 44 79
14 7 15 27 33 43 62 110
18 9 20 35 43 55 80 141
22 11 24 43 52 67 97 173
26 13 29 51 62 80 115 204
30 15 33 59 71 92 133 236
34 17 38 67 81 104 150 267
38 19 42 75 90 117 168 298
42 21 46 82 100 129 186 330
46 24 53 94 114 147 212 377
50 25 55 98 119 153 221 393
K = 25 SILTE ARENOSO
SPTDIÂMETRO (mm)
100 150 200 220 250 300 400
10 4 9 16 19 25 35 63
14 5 12 22 27 34 49 88
18 7 16 28 34 44 64 113
22 9 19 35 42 54 78 138
26 10 23 41 49 64 92 163
30 12 27 47 57 74 106 188
34 13 30 53 65 83 120 214
38 15 34 60 72 93 134 239
42 16 37 66 80 103 148 264
46 18 41 72 87 113 163 289
50 20 44 79 95 123 177 314
K = 20 SILTE ARGILOSO (SOLOS RESIDUAIS)
SPTDIÂMETRO (mm)
100 150 200 220 250 300 400
10 8 18 31 38 49 71 126
14 11 25 44 53 69 9 176
18 14 32 57 68 88 127 226
22 17 39 69 84 108 153 276
26 20 46 82 99 128 184 327
30 24 53 94 114 147 212 377
34 27 60 107 129 167 240 427
38 30 67 119 144 187 269 478
42 33 74 132 160 206 297 528
46 36 81 145 175 226 325 578
50 39 88 157 190 245 353 628
K = 40 AREIA
TABELAS ÚTEIS
79
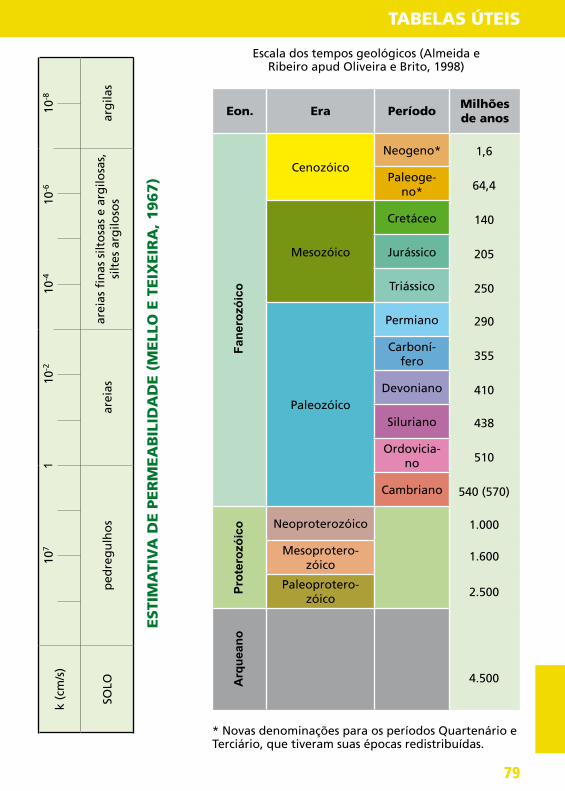
Eon. Era Período Milhões de anos
CenozóicoNeogeno*
Paleoge-no*
Mesozóico
Cretáceo
Jurássico
Triássico
Paleozóico
Permiano
Carboní-fero
Devoniano
Siluriano
Ordovicia-no
Cambriano
Neoproterozóico
Mesoprotero-zóico
Paleoprotero-zóico
Fane
rozó
ico
Prot
eroz
óico
Arq
uean
o
1,6
64,4
140
205
250
290
355
410
438
510
540 (570)
1.000
1.600
2.500
4.500
Escala dos tempos geológicos (Almeida e Ribeiro apud Oliveira e Brito, 1998)
* Novas denominações para os períodos Quartenário e Terciário, que tiveram suas épocas redistribuídas.
k (c
m/s
)10
7
1
0-2
10-4
10-6
10-8
SOLO
ped
reg
ulh
os
arei
asar
eias
fin
as s
ilto
sas
e ar
gilo
sas,
si
ltes
arg
iloso
sar
gila
s
1
ESTI
MA
TIV
A D
E P
ER
MEA
BIL
IDA
DE (
MELL
O E
TEIX
EIR
A, 1967)

TABELAS ÚTEIS
80
Topo RAM
Topo RAD
Topo RS
Fraturas
Veio de Quartzo Falha
Perfil de Intemperismo para Regiões Tropicais (Vaz, L., 1996)

TABELAS ÚTEIS
81
Car
ta d
e p
last
icid
ade
par
a cl
assi
fica
ção
de
solo
s fi
no
s p
elo
SU
CS
(Var
gas
, 197
8 ap
ud
Olive
ira
e B
rito
, 199
8)
60 50 40 30 20 10
0
1
0
2
0
3
0
4
0
5
0
6
0
7
0
8
0
9
0
10
0
Índice de Plasticidade (IP%)
Lim
ite d
e liq
uide
z (1
1%)
SC
SF
MLCL
OL
OH
MH
CH
Au
men
ta: t
enac
idad
e e
resi
stên
cia
do
so
lo s
eco
Dim
inu
i: p
erm
eab
ilid
ade
e va
riaç
ão d
e vo
lum
e
CO
MPA
RA
ÇÃ
O D
ESO
LOS
IGU
AL
LL
Dim
inu
i: te
nac
idad
e e
resi
stên
cia
do
so
lo s
eco
Au
men
ta: p
erm
eab
ilid
ade
e va
riaç
ão d
e vo
lum
e
Linha
“A”
Linha B (L.L.=50)
Arg
ilas
aren
osas
silt
es in
orgâ
nico
s de
bai
xa p
last
icid
ade
arei
as m
uito
fin
as s
iltos
as a
reia
s ar
gilo
sas
arei
as-a
rgila
s
Arg
ilas
inor
gâni
cas
de
med
iana
pla
stic
idad
e
Silt
es o
rgân
ico
s e
ino
rgân
ico
s e
silt
es-a
rgila
s
Arg
ilas
org
ânic
as
silt
es o
rgân
ico
s e
silt
es-a
rgila
sal
tam
ente
plá
stic
as
Lim
ite su
perio
r
apro
xim
ado
Linha
“A”
LP.=
0,73 (
L.L.%
-20)

TABELAS ÚTEIS
82
0
0,5
0,
7
1
,0
1,5
1,
7
2,0
2
,5
3
,0
2,0
1,75
1,5
1,15
1,0
0,5
0,27
0,4
5
0,7
1,
7
L -
LATE
RÍT
ICO
N
- N
ÃO
-LA
TER
ÍTIC
O
A -
AR
EIA
A
l - A
REN
OSO
G
l - A
RG
ILO
SO
Sl -
SIL
TOSO
NA LA
NA
l
NA
l
NS
l
NG
l
LGl
Car
ta p
ara
clas
sifi
caçã
o d
e so
los
pel
o s
iste
ma
MC
T (N
og
ami e
Ville
bo
r, 19
95 a
pu
d O
live
ira
e B
rito
, 199
8)

TABELAS ÚTEIS
83
SIG
LAR
OC
HA
CA
RA
CTE
RÍS
TIC
AR
ESIS
TÊN
CIA
A C
OM
PRES
SÃO
U
NIA
XIA
L (M
Pa)
C5
Extr
emam
ente
bra
nd
aM
arca
da
pel
a u
nh
aR
00,
25 -
1,0
Mu
ito
bra
nd
aEs
mig
alh
a-se
so
b im
pac
to d
a p
on
ta d
o m
arte
lo
de
geó
log
o. P
od
e se
r ra
spad
a p
or
can
ivet
e.R
11,
0 -
5,0
C4
Ro
cha
Bra
nd
aPo
de
ser
rasp
ada
po
r ca
niv
ete,
co
m d
ific
uld
ade.
M
arca
da
po
r fi
rme
pan
cad
a co
m p
on
ta d
o m
arte
-lo
de
geó
log
o.
R2
5 -
25
C3
Med
ian
amen
te r
esis
-te
nte
Não
po
de
ser
rasp
ada
po
r ca
niv
ete.
Am
ost
ras
po
dem
ser
fra
tura
das
co
m u
m ú
nic
o g
olp
e d
o
mar
telo
de
geó
log
o.
R3
25 -
50
C2
Res
iste
nte
Am
ost
ras
req
uer
em m
ais
de
um
go
lpe
de
mar
telo
p
ara
frat
ura
rem
-se.
R4
50 -
100
C1
Mui
to re
sist
ente
Am
ostra
s re
quer
em m
uito
s go
lpes
de
mar
telo
par
a fra
tura
rem
-se.
R5
100
- 250
Ext
rem
amen
te re
sist
ente
Am
ostra
s po
dem
ser
ape
nas
lasc
adas
com
o
mar
telo
do
geól
ogo.
R6
> 25
0
Gra
us
de C
oerê
nci
a (
ISR
M, ap
ud
AB
GE, 1983)

TABELAS ÚTEIS
84
Resi
stên
cia a
co
mp
ress
ão
un
iaxia
l (M
Pa)
Resi
stên
cia a
co
mp
ress
ão
un
iaxia
l e c
lass
es
de a
ltera
ção
(V
az,
L.F
., 1
996)
1
2
4
6
8
10
2
0
30
40
50
6
0
8
0 1
00
1
50
20
0 2
50
300
1
2
1
0
3
0
1
00
3
00
DE
SD
E 0
,5
BA
SA
LTO
S M
AC
IÇO
SG
RA
NIT
OS
MIG
MAT
ITO
S
AR
EN
ITO
“CO
ZID
O”
DIA
BÁ
SIC
OS
QU
AR
TZIT
OS
PIR
OX
EN
ITO
S
CA
LCO
SS
ILIC
ATO
SH
EM
ATIT
AS
TIN
GU
AÍT
OS
ITA
BIR
ITO
S
DIO
RIT
OS
PE
GM
ATIT
OS
MÁ
RM
OR
ES
DO
LOM
ITO
S
ME
TAS
SE
DIM
EN
TOS
MIL
ON
ITO
S
CA
LCÁ
RE
OS
ME
TAM
ÓR
FIC
OS
BA
SA
LTO
S V
ES
IC-A
MIG
SIL
TITO
S
XIS
TOS
FOLH
ELH
OS
AR
GIL
ITO
S
CA
LCÁ
RE
OS
SE
DIM
EN
TAR
ES
FILI
TOS
BA
SA
LTO
S L
EV
ES
EVA
PO
RIT
OS
AR
EN
ITO
S
PER
FUR
AÇ
ÃO
A
PER
CU
SSÃ
O
A
PER
CU
SSÃ
O
A
RO
TAÇ
ÃO
C
OM
TR
AD
O
C
OM
LA
VA
GEM
ESC
AV
AÇ
ÃO
LÂ
MIN
A
ESC
AR
IFIC
AÇ
ÃO
EX
PLO
SIV
O
100 60 30
> 10
% REDUÇÃO
R1
R2
R3
S2
CLASSES DE ALTERAÇÃO
SO
LO
RO
CH
AS
MU
ITO
BR
AN
DA
S
R
OC
HA
S B
RA
ND
AS
RO
CH
AS
MÉD
IAS
RO
CH
AS
DU
RA
S G
RU
POS

TABELAS ÚTEIS
85
Relação entre o índice Q e os valores de Vp para maciços rochosos fraturados escavados em níveis rasos (Barton, 1997)
excepcional-mente pobre
extremamen-te pobre
muito pobrepobre / regular
bom /muito bom
excelente
6,0
5,0
4,0
3,0
2,0
1,0
Vp (k
m/s
)
0,001 0,01 0,1 1 10 100 10 Q
Fraturas/m
RQD (%)
3,5
946,5
7813,5
4530
0>50
0
19
25
TERM SPT N - values Blows/300 mm penetration
Very loose 0 - 4
Loose 4 - 10
Medium dense 10 - 30
Dense 30 - 50
Very dense over 50
Standard penetration test N - values and descriptive terms of coarse soils (IAEG, 1981)

TABELAS ÚTEIS
86
10
3
1
0,3
0,1
0,5
0
,1 m
Esp
açam
ento
de
frat
ura
s
Cla
ssif
icaçã
o d
o m
aci
ço r
och
oso
(B
ien
iaw
ski,
1973)

TABELAS ÚTEIS
87
Dimensionamento empírico de tirantes, concreto projetado e cambotas com auxílio das classificações Q e RMR
(Waltham, 1995 apud Oliveira e Brito, 1998)
Dimensão equivalente, metros
Inapropriado
Concretomoldado
Tirantes e con-creto c/ fibras
Tirantes e concretoprojetado
Tirantes
Sistemáticos
Tirantes
Autoportante
Localizados

TABELAS ÚTEIS
88
Dia
gra
ma e
mp
íric
o p
ara
uso
no
dim
en
sio
nam
en
to d
o s
up
ort
e p
erm
an
en
te d
e t
ún
eis
e c
avern
as,
to
-m
an
do
po
r b
ase
o S
iste
ma-Q
. São
Tam
bém
ap
rese
nta
das
du
as
corr
ela
ções
en
tre Q
e R
MR
(B
art
on
, N
.;
Gri
mst
ad
, E.; 1
994)
RM
R 9
≈ In
Q +
44
(Bie
niaw
ski,
1989
) Q »
e
RM
R 1
5 ≈
logQ
+ 5
0 (B
arto
n, 1
995)
Q »
10
(RM
R -
44)
9
(RM
R -
50)
15
1 2
100 50 7 20 10 5 2 1
2,5
m2,
3 m
2,1
m1,
7 m
1,5
m1,
3 m
1,2
m
1,0
m
1,0
m
Bolt
spac
ing
in s
hotc
rete
d ar
ea
Bolt
spac
ing
in u
nsho
tcre
ted
area
Uns
uppo
rted1
23
45
67
89
CC
AR
RS
+B
Sfr
+ B
Sfr
+ B
Sfr
+ B
B (+
S)
Bsb
25 c
m15
cm12
cm
9 cm
5 cm
4 cm
20 11 7 5 3 2,4
1,5
0,00
1 0
,004
0,
01
0,
04 0
,1
0
,4
1
4
10
4
0
100
400
1
000
Bolt lenght in m for ESR = 1,0Span or height in m
ESR
V
IV
III
II
I
- 18,
2
2,
6
2
3,3
44
56,
5 6
4,7
7
7,2
85
,4
97,
9
10
6,2
5
20
3
5
50
59
6
5
74
8
0
8
9
95
RM
R ≈
RM
R ≈
1 2
Roc
k m
ass
qual
ity Q
=R
QD
Ja
Jw
J n
Ja
S
RF
XX

TABELAS ÚTEIS
89
GEOLOGICAL STRENGTH INDEX FOR JOIN-TED ROCKS (Hoek and Marinos, 2000)
From the lithology, structure and surface conditions of the discontinuities, estimates be too precise. Quoting a ran-ge from 33 to 37 is more realistic than stating that GSI=35. Note that the table does not apply to structurally controllad failures. Where weak planar structural planes are present in an unfavorable orientation with respect to the excava-tion face, these will dominate the rocks mass behaviour. The shear strength of surfaces in rocks that are prone to dete-rioration as a result of changes in mois-ture content will be reduced is water is present. When working with rocks in the fair to the right may be made for wet conditions. Water pressure is dealt with by effective stress analysis.
SU
RFA
CE C
ON
DIT
ION
S
VER
Y G
OO
DV
ery
rou
gh
, fre
sh u
nw
eath
ered
su
rfac
es
VER
Y G
OO
DV
ery
rou
gh
, fre
sh u
nw
eath
ered
su
rfac
es
FAIR
Smo
oth
, mo
der
atel
y w
eath
ered
an
d a
lter
ed
surf
aces
PO
OR
Slic
ken
sid
ed, h
igh
ly w
eath
ered
su
rfac
es w
ith
co
m-
pac
t co
atin
gs
or
filli
ng
s o
r an
gu
lar
frag
men
s
VER
Y P
OO
RSl
icke
nsi
ded
, hig
hly
wea
ther
ed s
urf
aces
wit
h s
oft
clay
co
atin
gs
or
filli
ng
s
STRUCTURE DECREASING SURFACE QUALITY
INTACT OR MASSIVE - intact rock specimens or massive in situ rock with few widely spaced discontinuities
DEC
REA
SIN
G I
NTE
RLO
CK
ING
OF
RO
CK
PIE
CES
N/A N/A
BLOCKY - well interlocked undis-turbed rock mass consisting of cubical blocs formed by three intersecting discontinuity sets
VERY BLOCK - interlocked, partially disturbed mass with multi-faceted angular blocks formed by 4 or more joint sets
BLOCKY/DISTURBED/SEAMY - folded with amgular blocks formed by many intersecting discontinuity sets. Persis-tence of bedding planes or schistosity
DISINTEGRATED - poorly interlo-cked, heavily broken rock mass with mixture of angular and rounded rock pieces
LAMINATED/SHEARED - Lack of blo-ckiness due to close spacing of weak schistosity or shear planes
N/A N/A
90
70
60
50
40
30
20
10
80
Tabela1 - Estimativa de GSI para maciços rochosos fraturados (Hoek,1995, in Hoek, 2001)

TABELAS ÚTEIS
90
Tabela 2 - Estimativa de GSI para maciços heterogêneos (Marinos e Hoek, 2001, in Hoek, 2011)
GSI FO
R H
ETE
RO
GEN
EO
US R
OC
K M
ASSES S
UC
H A
S FLY
SC
H(M
arin
os. P
an
d H
oek. E
, 2000)
From
a descrip
tion
of th
e litho
log
y, structu
re and
surface co
nd
ition
s (particu
larly of
the b
edd
ing
plan
es), cho
ose a b
ox in
the ch
art. Locate th
e po
sition
in th
e bo
x that
corresp
on
ds to
the co
nd
ition
of th
e disco
ntin
uities an
d estim
ate the averag
e value
of G
SI from
the co
nto
urs. D
o n
ot attem
pt to
be to
o p
recise. Qu
otin
g a ran
ge fro
m
33 to 37 is m
ore realistic th
an g
iving
GSI =
35. No
te that th
e Ho
ek-Bro
wn
criterion
d
oes n
ot ap
ply to
structu
rally con
trolled
failures. W
here u
nfavo
urab
ly orien
ted co
n-
tinu
ou
s weak p
lanar d
iscon
tinu
ities are presen
t, these w
ill do
min
ate the p
resence o
f g
rou
nd
water an
d th
is can b
e allow
ed fo
r by a slig
ht sh
ift to th
e righ
t in th
e colu
mn
s fo
r fair, po
or an
d very p
oo
r con
ditio
ns. W
ater pressu
re do
es no
t chan
ge th
e value o
s G
SI and
it is dealt w
ith b
y usin
g effective stress an
alysis.
SURFACE CONDITIONS OF DISCONTINUITIES(Predominantly bendding planes)
VERY GOOD - Very rough, fresh unwea-thered surfaces
GOOD - Rough, slightly weathered surfaces
FAIR - Smooth, moderately weathered and altered surfaces
POOR - Very smooth, occasionally slickensided surfaces with compact coa-tings or fillings with angular fragments
VERY POOR - Very smooth slickensided or highly weathered surfaces with soft clay coating or fillings
CO
MPO
SITIO
N A
ND
STR
UC
TUR
E
B. San
dsto
-n
e with
thin
in
terlayers o
f siltston
e
A. Th
ick bed
ded
, very blo
ck sand
ston
eTh
e effect of p
elitic coatin
gs o
n th
e bed
din
g p
lanes is m
ini-
mized
by th
e con
finem
ent o
f the ro
ck mass. In
shallo
w tu
n-
nels o
r slop
es these b
edd
ing
plan
es may cau
se structu
rally co
ntro
led in
stability.
C. San
ds-
ton
e and
siltsto
ne
in sim
ilar am
ou
nts
D. Siltsto
ne
or siltysh
ale w
ith san
ds-
ton
e layers
E. W
eak-siltsto
ne
or klayey
shale w
ith
sand
ston
e layers
C,D
,E an
d G
- may b
e mo
re or less
fold
ed th
an ilu
strated b
ut th
is do
es n
ot ch
ang
e the stren
gth
. Tecton
ic d
eform
ation
, faultin
g an
d lo
ss of
con
tinu
ity mo
ves these categ
ories to
F an
d H
.
F. Tecton
ically defo
rmed
, in-
tensively fo
lded
/faulted
, she-
ared clayey sh
ale or siltsto
ne
with
bro
ken an
d d
eform
ed
sand
ston
e layers form
ing
an
almo
st chao
tic structu
re
G. U
nd
isturb
ed silty
or clayey sh
ale with
o
r with
ou
t a few very
thin
sand
ston
e layers
H. Tecto
nically d
eform
ed silty o
r clayey sh
ale form
ing
a chao
tic stru
cture w
ith p
ockets o
f clay. Th
in layers o
f sand
ston
e are tran
sform
ed in
to sm
all rock
pieces.
10
20
30
40
50
60
70
A
BC
DEF
GH

TABELAS ÚTEIS
91
COROAS DIAMANTADAS
DIÂMETRO DO FURO
mm
DIÂMETRO DO
TESTEMUNHO mm
ÁREA DO FUROcm2
ÁREA DO TESTEMUNHO
cm2
EWG 37,7 21,5
11,2
3,6
EWM 37,7 21,5 3,6
EWT 37,7 23,0 4,2
AWG 48,0 30,1
18,1
7,1
AWM 48,0 30,1 7,1
AWT 48,0 32,5 8,3
BGW 60,0 42,0
28,3
13,9
BWM 60,0 42,0 13,9
BWT 60,0 44,4 15,5
NWG 75,8 54,7
45,1
23,5
NWM 75,8 54,7 23,5
NWT 75,8 58,7 27,1
HWG 99,2 76,277,3
45,6
HWT 99,2 80,9 51,4
Sondagem Rotativa: relação de diâmetros
1N 0,1kg
1kg 10N
1kN 0,1t
1t 10kN
1kg/cm2
0,1MPa
100kPa
14,2psi
0,1MN/m2
0,1N/mm2
0,01kg/mm2
0,0001kN/mm2
100kN/m2
1MPa 10kg/cm2
1kPa 0.01kg/cm2
1psi 0.07kg/cm2
1MN/m2 10kg/cm2
1N/mm2 10kg/cm2
1kg/mm2 100kg/cm2
1kN/mm2 10.000kg/cm2
1kN/m2 0,01kg/cm2
Relação de unidades
(oF(Fahrenheit) - 32) 0,556 oC (Celsius)

TABELAS ÚTEIS
92
Referências Bibliográficas
AGI - American Geological Institute. Publicação do Data Sheet Committee.Barton, N. Choosing between TBM or drill and blasting excavation for long tunnels. Publicação do Boletim Informativo no 74 da ABGE, 1997.Barton. N. and Choubey, V. The shear strenght of rock joints in theory and practice. Rock Mechanics, Springer, Vienna, no 1/2, p. 1-54. Also NGI-Publ. 119, 1997.Bieniawski, Z.T. Engineering classification of jointed rock masses. The Civil Engineering in South Africa, p.335-343, 1973.Fundações: Teoria e Prática, ABMS/ABEF, 1996, Editora Pini Ltda. São Paulo, SP. Intro-dução à Mecânica dos Solos, Milton Vargas, 1978., Mac Graw-Hill do Brasil, Editora da Universidade de São Paulo.IAEG International Association of Engineering Geology. Bulletin no 24, 1981.ISRM International Society for Rock Mechanics (1978). Tradução no 12 da ABGE, 1983.Jour. Sed. Pet., v. 23, p. 117, 1953.Mello, V. e Teixeira, A.M. Mecânica dos Solos. São Carlos. Escola de Engenharia de São Carlos - USP, 1967. (Publicação no 37).Oliveira, A.M.S. e Brito, S.N.A. Geologia de Engenharia, São Paulo. ABGE, p. 587, 1998.Terzaghi, K and Peck, R. Soil Mechanics in engineering practice. John Wiley and Sons Inc., New York, 1948.Vaz, L.F. Classificação genética dos solos e dos horizontes de alteração de rocha em re-giões tropicais. Revista Solos e Rochas, v. 19, n2, p. 117-136, 1996.Marinos e Hoek, 2001, in Hoek, 2011.
Tipos CategoriaPeso domartelo
Kg
Diâmetrodo furo(mm)
Produçãode furação
(m/h)
Produção de desmonte
m3/h
Marteletes manuais
leves < 18 40 - 36 4 3
médios 18 - 24 40 - 36 5 4
pesados 24 - 34 40 - 36 6 5
Carretasde furação
leves (sobre pneus)
35 - 45 73 (3”) 8 40
médias 45 - 60 88 (31/2”) 10 70
pesadas 60 - 70 102 (4”) 15 100
super > 70 > 102 (> 4”) 20 - 150
Tipos de equipamentos de furação para desmonte (Redaelli e Cerello apud Oliveira e Brito, 1998)
Top Related