


Languages
Pages
Legal

Incidence and surveillance of Lyme disease
Systematic review and policy mapping
Department of Health Reviews Facility To support national policy development and implementation
The Department of Health Reviews Facility is a collaboration between the following centres of excellence
Theo Lorenc, Julie Jones-Diette, Laurence Blanchard, Katy Sutcliffe, Claire Stansfield, Melissa Harden, Amanda Sowden and James Thomas
December 2017

i
The authors of this report are:
Theo Lorenc1, Julie Jones-Diette1, Laurence Blanchard2, Katy Sutcliffe3, Claire Stansfield3,
Melissa Harden1, Amanda Sowden1, and James Thomas3
1- Centre for Reviews and Dissemination (CRD), University of York
2- Faculty of Public Health and Policy, London School of Hygiene and Tropical Medicine,
London
3- EPPI-Centre, Social Science Research Unit, UCL Institute of Education, University
College London
Acknowledgements
We would like to acknowledge and give thanks for the valuable contribution of patient
advocacy group members who attended our consultation sessions and who provided
feedback to our survey on the key findings. Participating groups included:- About Time for
Lyme, Caudwell LymeCo Charity, Fight Lyme Now, Lyme Disease Action, Lyme Disease UK,
VIRAS and Vis-a-Vis Symposiums.
Thanks also go to the members of our scientific advisory group, Public Health England
(PHE) and the Department of Health team who provided guidance on the direction of the
reviews. We would also like to thank the team undertaking the NICE reviews with whom
we worked to ensure synergy between our concurrent programmes of work.
Funding
This is an independent report commissioned and funded by the Policy Research Programme
in the Department of Health. The views expressed are not necessarily those of the
Department.
Funder involvement
This work is part of an ongoing programme of work funded by the Department of Health
(DH) England. Throughout the review, the DH policy team members were consulted to
understand the context of the issue under study, collaborated on the development of the
research question(s) and informed the focus of the review findings.
Conflicts of interest
There were no conflicts of interest in the writing of this report.
Contributions
The opinions expressed in this publication are not necessarily those of the Department of
Health Reviews Facility or the funders. Responsibility for the views expressed remains
solely with the authors.
Guarantor of the review
James Thomas, Professor of Social Research and Policy, EPPI-Centre, Social Science
Research Unit, UCL Institute of Education University College London.

ii
This report should be cited as: Lorenc T, Jones-Diette J, Blanchard L, Sutcliffe K,
Stansfield C, Harden M, Sowden A and Thomas J (2017) Incidence and surveillance of Lyme
disease: Systematic review and policy mapping. London: EPPI-Centre, Social Science
Research Unit, UCL Institute of Education, University College London.
ISBN: 978-1-907345-99-9
© Copyright
Authors of the systematic reviews on the EPPI-Centre website (http://eppi.ioe.ac.uk/) hold the copyright for the text of their reviews. The authors give permission for users of the review to display and print the contents of the review for their own non-commercial use, provided that the materials are not modified, copyright and other proprietary notices contained in the materials are retained, and the source of the material is cited clearly, following the citation details provided. Otherwise, users are not permitted to duplicate, reproduce, republish, distribute, or store the review without written permission.
iii
Contents
Abbreviations ........................................................................................... v
Summary ................................................................................................. 1
1. Background ........................................................................................... 4
1.1 Lyme disease ........................................................................... 4
1.2 Surveillance of Lyme disease in the UK ............................................. 4
1.3 Previous research on incidence of Lyme disease and surveillance systems ... 5
2. Aims and methods ................................................................................... 6
2.1 Aims ...................................................................................... 6
2.2 Review methods ........................................................................ 6
2.3 Consultation with patient advocacy groups ........................................ 7
3. Systematic review of UK Lyme disease incidence data ........................................ 8
3.1 Overview ................................................................................ 8
3.2 Routine data ............................................................................ 8
3.3 Systematic review .................................................................... 10
3.4 Discussion .............................................................................. 11
4. Map of international Lyme disease surveillance systems and policies ...................... 14
4.1 Overview ............................................................................... 14
4.2 Findings: Surveillance systems and policies ....................................... 14
4.3 Discussion .............................................................................. 20
5. Systematic review of comparative studies of Lyme disease incidence ..................... 21
5.1 Overview ............................................................................... 21
5.2 Included studies ....................................................................... 21
5.3 Findings: studies comparing surveillance with non-surveillance sources ..... 27
5.4 Findings: studies comparing data sources within a surveillance system ...... 28
5.5 Discussion .............................................................................. 29
6. Patient advocacy groups views on these findings ............................................. 32
7. Conclusions .......................................................................................... 33
iv
7.1 Incidence of Lyme disease in the UK ............................................... 33
7.2 Context and goals of Lyme disease surveillance ................................. 33
7.3 Policy options.......................................................................... 33
8. Detailed methods .................................................................................. 35
8.1 Research questions ................................................................... 35
8.2 User involvement ..................................................................... 35
8.3 Study identification .................................................................. 35
8.4 Inclusion criteria ...................................................................... 36
8.5 Data extraction and quality appraisal ............................................. 37
8.6 Synthesis methods .................................................................... 40
8.7 Quality assurance ..................................................................... 40
8.8 Consultation on key findings with patient advocacy groups .................... 40
9. References .......................................................................................... 42
Appendices ............................................................................................. 47
Appendix 1: Example search strategy .................................................. 47
Appendix 2: Flow of literature through the review................................... 48
Appendix 3: Further details of UK studies ............................................. 49
Appendix 4: Further details for the map of surveillance policies .................. 54
Appendix 5: Quality assessment tool for review of comparative studies .......... 63
Appendix 6: Quality assessment tables for review of comparative studies ....... 64
Appendix 7: Evidence tables for review of comparative studies ................... 69

v
Abbreviations
AG Scientific Advisory Group
CPRD Clinical Practice Research Datalink
DEFRA UK Department for Environment, Food and Rural Affairs
EM erythema migrans
GP General Practitioner
HSE Health and Safety Executive
LD Lyme Disease
NB neuroborreliosis
NICE National Institute for Health and Care Excellence
NLBTL National Lyme borreliosis testing laboratory
PHE Public Health England
PTLD post-treatment Lyme disease
QA quality assessment
QATSO quality assessment tool for systematic reviews of observational studies
RIDDOR Reporting of Injuries, Diseases and Dangerous Occurrences Regulations
RIPL rare and imported pathogens laboratory
THIN The Health Improvement Network

INCIDENCE AND SURVEILLANCE OF LYME DISEASE: SYSTEMATIC REVIEW AND POLICY MAPPING
1
Summary
Background
Lyme disease is the result of an infection, caused by the Borrelia burgdorferi bacterium,
which is common in ticks; people can develop Lyme disease after being bitten by an
infected tick. This report describes one of a series of evidence reviews on Lyme disease
commissioned by the Department of Health (England) Policy Research Programme and
undertaken by the Department of Health Reviews Facility. This report focuses on the
incidence and surveillance of Lyme disease. The project draws on a broader evidence map
of research on Lyme disease (Stokes et al., 2017).
Review questions
The review questions were:
What is the incidence of Lyme disease in the UK, and how does this vary between
areas and population groups?
What surveillance systems and policies are in place internationally to monitor the
incidence of Lyme disease?
What is known about the completeness of incidence data drawn from surveillance
systems?
Following synthesis of the evidence to answer these questions we sought feedback from
eight UK patient advocacy groups to assess whether the findings resonate with their
experiences and concerns.
This report has three sections, corresponding to the three phases of the project.
1. A systematic review of Lyme disease incidence data for the UK
2. A map of national surveillance systems and policies for Lyme disease in Europe and
North America
3. A systematic review of studies which compare Lyme disease incidence from more
than one source, and so can be used to evaluate the completeness of surveillance
data.
The aim of the first section is to collate all available data about the incidence of Lyme
disease in the UK. The second section provides a broader international context by
comparing surveillance systems in the UK to those in similar countries. The third section
provides an indication of the extent of under-reporting of cases of Lyme disease to
surveillance systems.
Systematic review of UK Lyme disease incidence data
Studies identified from the comprehensive evidence map of Lyme disease research (Stokes
et al., 2017), along with published routine surveillance data, were synthesised to provide
an overview of the incidence of Lyme disease in the UK. We located eleven studies, in
addition to published routine data up to June 2017.
Routine data from recent years shows an annual incidence rate for Lyme disease in
England and Wales of just under 2 per 100,000. The rate has increased slowly but

INCIDENCE AND SURVEILLANCE OF LYME DISEASE: SYSTEMATIC REVIEW AND POLICY MAPPING
2
consistently over the last decade. The rate in Scotland is somewhat higher but has
declined since a peak in 2008-10. The rate in Northern Ireland is very low.
Published research studies indicate that there may be geographical ‘hotspots’ where local
incidence is much higher than found in routine data, particularly in the Highlands of
Scotland. Data are lacking for England and Wales, but the situation is likely to be similar.
The highest rates are in the 40-64 age group, and rates are similar in men and women.
Map of international Lyme disease surveillance systems and policies
We used a pragmatic, non-systematic approach to describe the surveillance systems in
place for Lyme disease across Europe (EU member states, plus Norway and Switzerland)
and North America (USA and Canada), for a total of 34 countries (counting England and
Wales, Northern Ireland and Scotland as three). We extracted data on reporting entities,
case definitions, whether notification is mandatory or voluntary, and the coverage and
administrative level of the system.
Most countries (N=28) have some form of surveillance for Lyme disease in place, managed
in most cases at the national level. Lyme disease is notifiable by clinicians in 23 countries
and by laboratories in 20; few systems rely as the UK does on laboratory notification alone
(N=2 in addition to the UK). In most cases notification is mandatory, at least in principle;
some countries use voluntary sentinel networks of clinicians and/or laboratories to provide
data about general trends without comprehensive coverage.
Case definitions vary widely between countries. Most countries which specify a clinical
case definition include both early disease (erythema migrans (EM)) and late or
disseminated disease (e.g. neuroborreliosis), but in a few systems (N=3) only late disease
is notifiable. There is also variation as to whether Lyme disease diagnosed on the basis of
EM alone, without laboratory confirmation, is notifiable or not. A few systems collect
information either on all clinician-diagnosed Lyme disease, or on patient consultations for
tick bites and/or EM.
Systematic review of comparative studies of Lyme disease incidence
We undertook a systematic review using studies from the evidence map (Stokes et al.,
2017) in which we compared incidence data from different sources, and estimated the
extent of under-reporting of Lyme disease to surveillance systems. We located 16 studies
meeting inclusion criteria. All studies were observational in nature and used either
secondary data analyses or surveys to collect data. The quality of the studies overall was
low. All studies were conducted in North America or continental Europe, with none from
the UK.
Results from higher-quality studies, which compared data from a surveillance system with
data from another source (such as hospital records or insurance data) and used consistent
case definitions, suggest that the number of unreported cases is between 10% and 120% of
the number of cases reported to surveillance systems, with a median estimate of 30%. All
of these studies were conducted in countries with mandatory clinician reporting of Lyme
disease. Findings on laboratory reporting as against clinician reporting are more limited,
but do not suggest that one is markedly superior to the other in terms of under-reporting.

INCIDENCE AND SURVEILLANCE OF LYME DISEASE: SYSTEMATIC REVIEW AND POLICY MAPPING
3
Most studies did not find marked disparities between systems or data sources with respect
to the demographics of cases or the trends in incidence over time, although there are
some divergences.
Feedback from patient advocacy groups
Feedback from patient advocacy groups suggests a concern that the evidence does not
reflect the true extent of Lyme incidence and indicated that data problems undermine the
accuracy of the figures. Concerns include that clinically diagnosed cases are not accounted
for, that the laboratory tests are unreliable and that there is variation in clinician
awareness of Lyme disease and diagnosis methods. There was also a desire for more
evidence about regional differences.
Conclusions
The incidence of Lyme disease in the UK is increasing but is still low by comparison with
the endemic areas of northern and central Europe and north-eastern USA.
There is almost certainly some under-reporting of cases in the UK surveillance system, but
this is also likely to be true for the other systems. We would anticipate that introducing
mandatory clinician notification for Lyme disease in the UK would identify some cases
which are currently not reported, but would not produce substantively more reliable data,
and the practical value of such a move remains unclear. Policy-makers could consider the
potential value of collecting further data on the presentation and demographics of cases
using questionnaires and/or using GP sentinel networks to supplement the existing
surveillance system.

INCIDENCE AND SURVEILLANCE OF LYME DISEASE: SYSTEMATIC REVIEW AND POLICY MAPPING
4
1. Background
This report is one of a series of reports on Lyme disease (LD) commissioned by the
Department of Health (England) Policy Research Programme and undertaken by the
Department of Health Reviews Facility.
The overarching project consists of a comprehensive evidence map on Lyme disease in
humans and four systematic reviews on:-
1) the incidence and surveillance of Lyme disease
2) stakeholder experiences of diagnosis of Lyme disease
3) stakeholder experiences of treatment of Lyme disease; and
4) prevention of Lyme disease.
This report contains the findings from review 1) on the incidence and surveillance of Lyme
disease. The primary objectives of this review are to a) systematically review UK evidence
on the incidence of Lyme disease, b) to map international policies and systems for the
surveillance and monitoring of Lyme disease and c) to systematically review international
evidence comparing different data sources on the incidence of Lyme disease.
1.1 Lyme disease
Lyme disease is the result of an infection, caused by the Borrelia burgdorferi1 bacterium,
which is common in ticks; people can develop Lyme disease after being bitten by an
infected tick (Public Health England, 2016).
In many cases, an early sign of the infection is an erythema-migrans or ‘bulls-eye’ rash
(Stanek and Strle, 2003, Wormser et al., 2006). Clinical complications resulting from Lyme
disease include joint, nervous system, and heart problems (Stanek et al., 2011, Stanek et
al., 2012, Wormser et al., 2006). Some evidence suggests that presentation is not always
typical (Bingham et al., 1995, Christen et al., 1993) and that complications may be more
wide-ranging and persistent. However, uncertainties around persistent infection mean
that the notion of chronic Lyme or post-treatment Lyme disease (PTLD) is contested and
has been the subject of ‘substantial and polarizing debate’ in the field of medicine for
many years (Rebman et al., 2017).
1.2 Surveillance of Lyme disease in the UK
Lyme disease is not a notifiable human or animal disease in the UK, so data are not
collected routinely from clinical practice. However, Borrelia burgdorferi is a notifiable
organism; that is, laboratories which test for Lyme disease are required to report positive
cases to surveillance agencies. In addition, occupationally-acquired Lyme disease is
1 We refer here to ‘Borrelia Burgdoferi Sensu Lato’ which includes all sub-species (including afzelii,
garinii, mayonii, bissettii, lusitaniae and spielmanii). We have used the abbreviated phrase in the
text for improved accessibility.

INCIDENCE AND SURVEILLANCE OF LYME DISEASE: SYSTEMATIC REVIEW AND POLICY MAPPING
5
reportable under the requirements of the Health and Safety Executive (HSE) for the
Reporting of Injuries, Diseases and Dangerous Occurrences Regulations (RIDDOR).
This means that the available figures for incidence of Lyme disease in the UK refer to
laboratory-confirmed cases of Lyme disease, and do not include cases where Lyme disease
may be diagnosed and treated on the basis of clinical symptoms without a test being
ordered. In 2013, Public Health England (PHE) estimated that an additional 1,000 to 2,000
cases of Lyme disease occur annually in England and Wales, over and above the
approximately 1,000 cases notified to surveillance agencies (Public Health England, 2013).
The analysis for most samples via GP referral in England and Wales has been performed
since 2012 by the PHE rare and imported pathogens laboratory (RIPL) at Porton Down.
Most analyses requested in Scotland are carried out at the National Lyme borreliosis
testing laboratory (NLBTL) at Raigmore Hospital, Inverness.
Data on Lyme disease are also collected within routine Hospital Episode Statistics,
although this represents only cases serious enough to be admitted to hospital, which is a
subset of the total cases.
1.3 Previous research on incidence of Lyme disease and surveillance systems
NICE’s review of UK incidence data (National Institute for Health and Care Excellence,
2017) partly overlaps with this review, but does not explore surveillance policies in depth
or evaluate completeness of data.
The most in-depth recent work on surveillance policy is reported in a paper published by
van den Wijngaard et al. (2017), which we have used to inform our analysis framework.
That paper is largely theoretical in orientation, with a focus on characterising indicators
and reporting entities, and does not attempt to descriptively classify national systems, as
does our analysis.

INCIDENCE AND SURVEILLANCE OF LYME DISEASE: SYSTEMATIC REVIEW AND POLICY MAPPING
6
2. Aims and methods
This section details the review aims and provides a brief overview of the methods used for
the different phases of the work. Further detail of the methods used for the different
phases is found in the relevant sections below and a comprehensive account of the
methods for the overarching review is in chapter 8.
2.1 Aims
The overarching aim of the review is to examine evidence on the incidence of Lyme
disease in the UK and to understand the different approaches used internationally for
surveying and monitoring the incidence of Lyme disease in order to illuminate the context
for UK policy decision-making.
The primary objectives are to a) systematically review UK evidence on the incidence of
Lyme disease, b) to map international policies and systems for the surveillance and
monitoring of Lyme disease and c) to systematically review international evidence
comparing different data sources on the incidence of Lyme disease.
2.1.1 Review questions
What is the incidence of Lyme disease in the UK, and how does this vary between
areas and population groups?
What surveillance systems and policies are in place internationally to monitor the
incidence of Lyme disease?
What is known about the completeness of incidence data drawn from surveillance
systems?
2.2 Review methods
Since a different approach was used for each project phase, detailed accounts are
provided in chapter 0. Here we provide an overview of the ways in which the approach for
each phase differed.
For phase 1, the review on UK Lyme disease incidence, and phase 3, the review on
completeness of data from surveillance systems, systematic reviews were undertaken. As
such these phases sought ‘research evidence’ using a ‘systematic approach’; that is,
research studies were identified from within the systematic evidence map produced as
part of the overarching research project (Stokes et al. 2017).
However, a non-systematic or ‘pragmatic’ approach was used to identify ‘non-research
evidence’ for both phase 2, the map of surveillance systems used internationally, and
supplementary evidence for the review of UK incidence. For the UK incidence review, we
examined published routine surveillance data from sources already known to the research
team and recommendations from our Scientific Advisory Group (see chapter 8 for details).
For the international map of surveillance systems and policies we sought information from
the websites of relevant agencies, from legal or regulatory documents on the notification
of communicable diseases and from surveillance reports published by national health
authorities. Table 1 provides details of evidence sources and search approaches for each
phase and full details are provided in chapter 8.

INCIDENCE AND SURVEILLANCE OF LYME DISEASE: SYSTEMATIC REVIEW AND POLICY MAPPING
7
Table 1: Included evidence and identification procedure for each project phase
Project phase Nature of included evidence and identification procedure
Research evidence
(systematically identified for
evidence map)
Non-research evidence
(pragmatically identified)
1) Incidence of Lyme in
the UK Research on UK incidence
Published routine UK
surveillance data
2) International map of
surveillance systems
and policies
-
Information from agency
websites, legal documents and
surveillance reports
3) Systematic review on
completeness of data
from surveillance
systems
Research studies comparing
incidence rates from more
than one data source
-
2.3 Consultation with patient advocacy groups
In October 2017, we shared the key findings with eight UK-based patient stakeholder
groups via an online survey and each group was invited to comment.
Prior to sharing findings, we conducted a series of face-to-face consultations with the
advocacy groups in July 2017 for our review on experiences of diagnosis (Brunton et al.
2017). Whilst these face-to-face consultations did not ask participants to comment on
incidence and surveillance issues directly, several participants raised issues relating to UK
incidence.
Comments relating to Lyme disease incidence and surveillance from both consultation
exercises are reported in chapter 6.

INCIDENCE AND SURVEILLANCE OF LYME DISEASE: SYSTEMATIC REVIEW AND POLICY MAPPING
8
3. Systematic review of UK Lyme disease incidence data
3.1 Overview
We examined information on the UK from routine data and research studies
Incidence rates for 2005-2016 are between 3 and 6 per 100,000 in Scotland,
between 1 and 2 in England and Wales, and close to 0 in Northern Ireland
Interim 2017 data for England and Wales indicate a marked increase over 2016
Rates are highest in the 40-64 age group, and slightly higher in men than women
Incidence in some areas may be much higher than the national average,
particularly the Scottish Highlands
3.2 Routine data
3.2.1 Data sources
The UK Department for Environment, Food and Rural Affairs (DEFRA) and PHE publish a
regular Zoonoses Report which provides the number of cases of Lyme disease in England
and Wales, Scotland, and Northern Ireland. The most recent provides data from 2015 and
revises previously published figures for 2013-2014 (Public Health England, 2017c). Annual
figures for 2016 are available separately for England and Wales (Public Health England,
2017a) and for Northern Ireland (Public Health Agency (Northern Ireland), 2017); for
England and Wales there are also quarterly data up to June 2017 (Public Health England,
2017b). Data for Scotland for 2016 were not published at the time of writing, but
provisional figures were communicated to us (pers. comm., Health Protection Scotland).
Health and Safety Executive (HSE) data on occupationally-acquired cases are not
published.
The routine data include only positive laboratory test results. Clinical practice may often
focus on treatment rather than serologic testing, and such cases would not be counted in
the routine data. Also, some further tests are carried out by other NHS laboratories; some
of these refer to RIPL or NLBTL for confirmation, but some do not. No data are available
for these other laboratories and tests conducted by them are not included in the routinely
reported figures. It should also be borne in mind that the figures for Northern Ireland
represent cases reported voluntarily by laboratories and may not be directly comparable
with figures for the rest of the UK, where laboratory notification is mandatory.
These routinely published reports give only the number of cases. Some data are available
from the Scottish system in studies in the systematic review on case demographics (e.g.
gender and age) and geographical distribution; these are discussed belowError! Reference
source not found.. However, these data are not reported routinely.
Data are also available from Hospital Episode Statistics on the number of patients with a
diagnosis of Lyme disease, although obviously these only include hospital patients and not
all Lyme disease cases.
INCIDENCE AND SURVEILLANCE OF LYME DISEASE: SYSTEMATIC REVIEW AND POLICY MAPPING
9
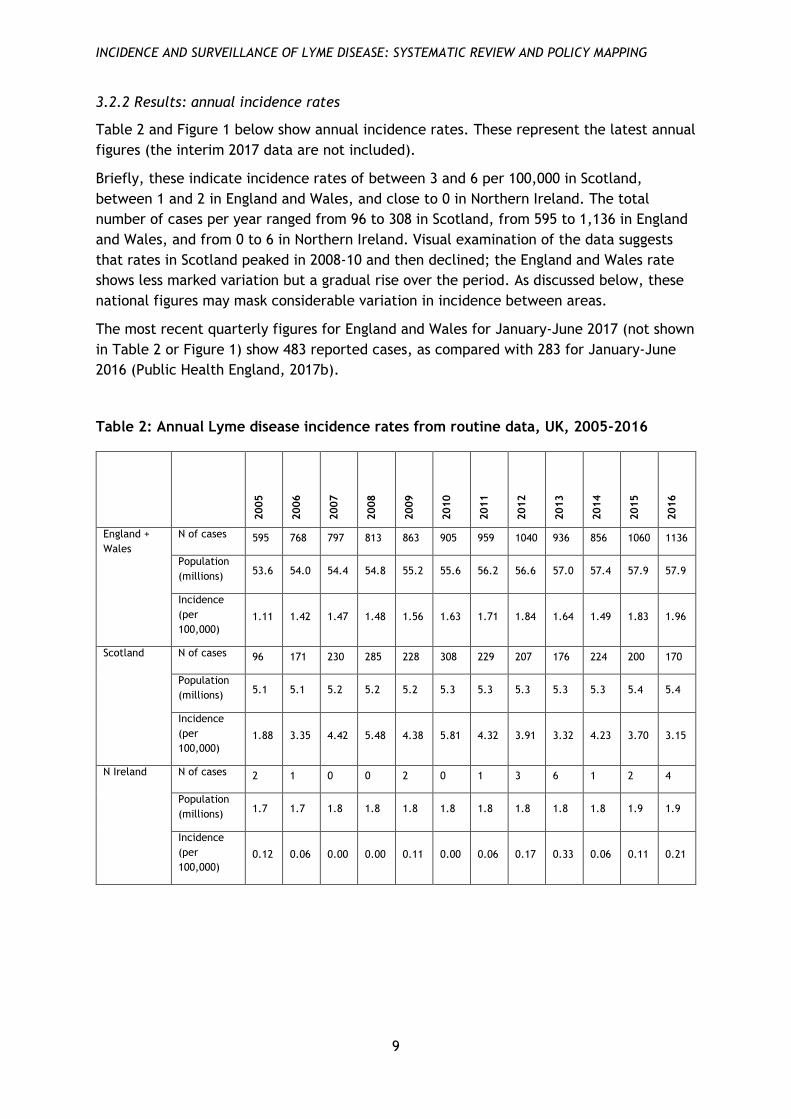
3.2.2 Results: annual incidence rates
Table 2 and Figure 1 below show annual incidence rates. These represent the latest annual
figures (the interim 2017 data are not included).
Briefly, these indicate incidence rates of between 3 and 6 per 100,000 in Scotland,
between 1 and 2 in England and Wales, and close to 0 in Northern Ireland. The total
number of cases per year ranged from 96 to 308 in Scotland, from 595 to 1,136 in England
and Wales, and from 0 to 6 in Northern Ireland. Visual examination of the data suggests
that rates in Scotland peaked in 2008-10 and then declined; the England and Wales rate
shows less marked variation but a gradual rise over the period. As discussed below, these
national figures may mask considerable variation in incidence between areas.
The most recent quarterly figures for England and Wales for January-June 2017 (not shown
in Table 2 or Figure 1) show 483 reported cases, as compared with 283 for January-June
2016 (Public Health England, 2017b).
Table 2: Annual Lyme disease incidence rates from routine data, UK, 2005-2016
2005
2006
2007
2008
2009
2010
2011
2012
2013
2014
2015
2016
England +
Wales
N of cases 595 768 797 813 863 905 959 1040 936 856 1060 1136
Population
(millions) 53.6 54.0 54.4 54.8 55.2 55.6 56.2 56.6 57.0 57.4 57.9 57.9
Incidence
(per
100,000)
1.11 1.42 1.47 1.48 1.56 1.63 1.71 1.84 1.64 1.49 1.83 1.96
Scotland N of cases 96 171 230 285 228 308 229 207 176 224 200 170
Population
(millions) 5.1 5.1 5.2 5.2 5.2 5.3 5.3 5.3 5.3 5.3 5.4 5.4
Incidence
(per
100,000)
1.88 3.35 4.42 5.48 4.38 5.81 4.32 3.91 3.32 4.23 3.70 3.15
N Ireland N of cases 2 1 0 0 2 0 1 3 6 1 2 4
Population
(millions) 1.7 1.7 1.8 1.8 1.8 1.8 1.8 1.8 1.8 1.8 1.9 1.9
Incidence
(per
100,000)
0.12 0.06 0.00 0.00 0.11 0.00 0.06 0.17 0.33 0.06 0.11 0.21

INCIDENCE AND SURVEILLANCE OF LYME DISEASE: SYSTEMATIC REVIEW AND POLICY MAPPING
10
Figure 1: Annual Lyme disease incidence rates from routine data, UK, 2005-2016
Hospital Episode Statistics for England for financial year 2015-16 show a total of 288
finished consultant episodes with a primary diagnosis of Lyme disease, and 572 with any
diagnosis of Lyme disease; the cases with a primary Lyme disease diagnosis were equally
distributed by gender and had a mean age of 39 (NHS Digital, 2016). Analyses by other
researchers indicate an increase in hospital-recorded Lyme disease over recent years
which is similar to that seen in the surveillance data (Cooper et al., 2017). However, these
figures may be affected by variation both in healthcare-seeking behaviour by patients and
in the willingness of clinicians to undertake consultations (as well as uncertainties in
reporting), and hence should be interpreted with caution.
3.3 Systematic review
We located N=11 studies (12 reports) which met our inclusion criteria (see Appendix 3).
Five of these were based on surveillance data, all but one from Scotland. Demographic
data suggest that most cases occur in later middle age (40-64 years), with slightly more
cases in males than females (Ho-Yen et al., 2008, Mavin et al., 2015, Milner et al., 2009).
There is very wide geographical variation in incidence rates, with average incidence rates
by NHS Board area in Scotland ranging from under 2 per 100,000 (with some areas
reporting no cases in some years) to over 40 per 100,000 for the Highlands (Mavin et al.,
2015). Three of these studies also report positive tests as a percentage of tests ordered,
finding figures between 3% and 7% (Ho-Yen et al., 2008, Mavin et al., 2009, Mavin et al.,
2015).
Six studies report on data other than routine surveillance data. For four of these, it is
difficult to make any direct comparison with the surveillance data. One reports very
limited data on travel-acquired cases from a single site (Roberts and Lever, 2003), and one
reports demographic and clinical data from cases identified by a hospital laboratory
(Lovett et al., 2008). One finds a seropositivity rate among Scottish blood donors of
0.00
1.00
2.00
3.00
4.00
5.00
6.00
7.00
2005 2006 2007 2008 2009 2010 2011 2012 2013 2014 2015 2016
Inci
den
ce p
er 1
00
,00
0
Year
England + Wales NI Scotland

INCIDENCE AND SURVEILLANCE OF LYME DISEASE: SYSTEMATIC REVIEW AND POLICY MAPPING
11
4.2%, with regional (postcode area) rates varying up to 8.6% in the Inverness area (Munro
et al., 2015). However, seropositivity rates among the general population cannot be
directly compared to UK routine data, as they may include people who have no clinical
symptoms. Finally, one study compares positive serological tests with hospitalisations,
finding that about 10% of laboratory-confirmed cases attended hospital (Lashley et al.,
2014).
The other two studies report fuller data, which is to some extent comparable with
national routine data. These both report data from hospital laboratories (Dryden et al.,
2015, Slack et al., 2011); in one case GPs in the local area had been targeted by an
awareness-raising campaign which specifically aimed to increase reporting rates (Dryden
et al., 2015).
The findings of these two studies suggest that incidence in certain areas may be
considerably higher than the overall national rate. One study finds a rate of 9.8 per
100,000 in Hampshire over the period 1992-2012, with a peak annual rate of 18.5,
compared with an England and Wales rate of 1.7 (Dryden et al., 2015). The other finds a
rate of 16.8 per 100,000 in Tayside in 2009-2010, compared with 5.5 for Scotland as a
whole (Slack et al., 2011). (However, the rates found by Slack et al. (2011) appear only
slightly higher than those in published surveillance data for the same region.) Both studies
also show incidence rising markedly up to 2009-2010 (Dryden et al., 2015, Slack et al.,
2011); Slack et al. (2011) is consistent with surveillance data in this respect, and in Dryden
et al. (2015) the rate appears to level off in subsequent years. Both these studies used
similar case definitions to those used for national routine data.
Findings on demographics from these studies appear consistent with surveillance data,
with the highest incidence rates in late middle age (Dryden et al., 2015, Munro et al.,
2015) and similar rates in men and women (Dryden et al., 2015, Lovett et al., 2008, Munro
et al., 2011, Munro et al., 2015, Slack et al., 2011).
3.4 Discussion
3.4.1 Summary of findings
Routine data shows an annual incidence rate for Lyme disease in England and Wales of just
under 2 per 100,000 in recent years. The rate has increased slowly but fairly consistently
over the last decade. The rate in Scotland is somewhat higher but has declined since a
peak in 2008-10. The rate in Northern Ireland is very low (although data are not directly
comparable). As discussed in the following subsection, these national rates conceal
considerable variation between local areas, and local incidence in some areas may be
several times higher.
The highest rates appear to be in people in later middle age (40-64 years). Most data show
similar rates in men and women, or a slightly higher rate in men.
It should also be borne in mind that data from the UK surveillance system will under-
estimate the true incidence to some extent, since cases without laboratory tests are not
captured. We do not know how many cases are diagnosed and treated in the UK on the
basis of clinical symptoms alone, without a diagnostic test being ordered. Hence, it is
challenging to establish the true extent of under-reporting. Importantly, it is not yet clear

INCIDENCE AND SURVEILLANCE OF LYME DISEASE: SYSTEMATIC REVIEW AND POLICY MAPPING
12
how much of the recent rise in notified cases reflects a rise in the true incidence, and how
much may be due to changes in reporting practice, clinician awareness, clinician practice
(e.g. in terms of ordering tests), and/or healthcare-seeking behaviours in patients.
3.4.2 Geographical variation and hotspots
Data for Scotland show that there are local ‘hotspots’ where rates are much higher than
the national average, with rates in the Highland area several times those for the country
as a whole (Mavin et al., 2015, Milner et al., 2009), and considerable variation at a more
local level within the Highlands (Mavin et al., 2009); there are also lower-incidence
hotspots in Tayside and the Western Isles.
Surveillance data are not broken down for region in England and Wales. Anecdotally,
relatively high-incidence areas are found in several parts of southern England. Public
Health England (2017c) list “the New Forest, Salisbury Plain, Exmoor, the South Downs,
Thetford Forest and parts of Wiltshire and Berkshire” (p. 50)). Cooper et al.’s (2017)
analysis of hospital episode data (published too late to be included in the map) identifies
high-incidence areas in Devon and in the Chiltern Hills in south-east England.
Of the studies in the review, Dryden et al.’s (2015) findings are the closest we have to a
confirmation of hotspots in England, with a local rate in Hampshire of 9.8 as compared
with a national rate of 1.7 per 100,000. However, these figures also reflect a campaign to
increase awareness of Lyme disease and use of Lyme disease testing services among GPs
and other health professionals. Given the absence of geographically comparable routine
data, we cannot determine how much of the discrepancy is due to geographical variation
and how much to under-reporting or under-diagnosis of Lyme disease. It seems likely that
there is some combination of both these factors, and that Dryden et al.’s results are
partial confirmation of local hotspots in England.
3.4.3 Strengths and limitations of the review
We identified UK studies from the comprehensive map of literature on Lyme disease and
used a systematic and transparent approach, although we did not quality assess the
studies. The collation of routine data was pragmatic and non-systematic in nature,
although we believe the main sources have been identified.
The evidence base relating to the UK and particularly England is sparse, and we identified
gaps in knowledge about the extent of under-reporting in routine data, and of variation in
geographical areas.
3.4.4 Comparison with previous research
The main existing review of UK incidence data was conducted by NICE (National Institute
for Health and Care Excellence, 2017). The studies and data covered in both reviews are
similar, although there is variation in search strategies and inclusion criteria. NICE
included one study which was published too late to be identified by our searches (Cooper
et al., 2017); this used hospital episode data for England, finding a total of N=260
completed episodes diagnosed as Lyme disease in 2011-2012, increasing to N=370 in 2014-
2015.

INCIDENCE AND SURVEILLANCE OF LYME DISEASE: SYSTEMATIC REVIEW AND POLICY MAPPING
13
We were able to include up-to-date routine surveillance data. As a result, our findings on
the overall national incidence rate show considerably higher numbers than the NICE
review (0.06 to 0.59 per 100,000, based on data from 1997 to 2005). The findings on
geographical variation are similar.

INCIDENCE AND SURVEILLANCE OF LYME DISEASE: SYSTEMATIC REVIEW AND POLICY MAPPING
14
4. Map of international Lyme disease surveillance systems and
policies
The aim of this phase was to provide a descriptive overview of the systems and policies in
place internationally for monitoring Lyme disease in humans. This provides context for UK
policy decision-making as well as information for the interpretation of international
incidence data.
4.1 Overview
We examined surveillance systems and incidence rates in 34 countries in Europe
and North America
Six countries have no national or governmental systems for monitoring Lyme
disease
Systems vary across the remaining 28 countries according to whether:-
o Reporting systems are organised at the national level (n=24) or regional
level (n=4)
o Cases of Lyme disease are reported to monitoring systems by both clinicians
and laboratories (n=15), by clinicians only (n=8) or by laboratories only
(n=5)
o The notification of Lyme disease is mandatory (n=23) or voluntary (n=6).
o Incidence is calculated from clinical presentations (e.g. EM,
neuroborreliosis) (n=19), patient consultations for tick bite or EM (n=3) or
positive laboratory tests (n=8)
4.2 Findings: Surveillance systems and policies
Table 3 presents the main characteristics of the surveillance systems (n=34 countries). Six
of these (Austria, Cyprus, Greece, Italy, Malta and Sweden) have no national or
governmental oversight in place for monitoring Lyme disease, do not place any legal
obligation on clinicians or laboratories, and do not report any official statistics. Our
analysis is based on the remaining twenty-eight systems (including the three UK systems).
We examine below for each country whether data are collected at a national or regional
level (4.2.1), whether clinicians or laboratories are responsible for reporting data to
surveillance systems (4.2.2), whether reporting of data is a legal requirement or not
(4.2.3) and how a case of Lyme disease is defined (4.2.4).
4.2.1 Administrative level
Of those countries with some surveillance system in place (n=28), four are administered at
sub-national level (Canada, Germany, Spain, and USA) and the remainder at national level
(including the UK nations for the purposes of analysis).
In Canada, Germany, Spain and the USA, the surveillance of Lyme disease is a sub-national
responsibility: each region has its own system and related laws. In Canada and the USA, all
provinces collect information on Lyme disease (with the exception of the northern
Canadian territories). Both countries have set national case definitions for Lyme disease,
compile data submitted by states/provinces, and report them at the national level.

INCIDENCE AND SURVEILLANCE OF LYME DISEASE: SYSTEMATIC REVIEW AND POLICY MAPPING
15
However, provinces in Canada do not all use the same case definitions and reporting
entities: some systems were implemented before the national system and continue to use
their own procedure. In addition, only some provinces participate in the Lyme Disease
Enhanced Surveillance system, which collects additional information on cases and reports
it to the national level. In the USA, Lyme disease is a notifiable disease but the states
decide by law whether to report at the state level, and are not obliged to submit their
information to the national US authorities, the Centers for Disease Control and Prevention
(CDC). Nevertheless, all seem to report data on Lyme disease at the national level. In
contrast, in Spain and Germany, surveillance of Lyme disease is carried out in some
regions (autonomous communities in Spain, Bundesländer in Germany) and not in others.

INCIDENCE AND SURVEILLANCE OF LYME DISEASE: SYSTEMATIC REVIEW AND POLICY MAPPING
16
Table 3: Characteristics of surveillance systems in Europe and North America
Countries (N = 34)
No govt-led activity
Administrative level
Reporting entity Obligation and coverage Manifestations reported (confirmed cases only)
National Sub-national
Clini-cians only
Labs only
Both Manda-tory
(country-wide)
Manda-tory
(some regions)
Volunta-ry
Clinician sentinel
Others EM clinical signs only
EM with lab
NB Other late or
dissem-inated
N consul-tations
Positive lab tests
Not clearly
defined
UK
England/Wales X X X X
North. Ireland X X Volunta-ry labs
X
Scotland X X X X
EUROPE
Austria X
Belgium X X Country
-wide
Volunta-ry labs sentinel
X X
Bulgaria X X X X X X
Cyprus X
Czech Rep. X X X X X X
Croatia X X X X X X
Denmark X X X X X
Estonia X X X X
Finland X X X X
France X X Country
-wide X X X
Germany X X X Some
regions X X X
Greece X
Hungary X X X X X

INCIDENCE AND SURVEILLANCE OF LYME DISEASE: SYSTEMATIC REVIEW AND POLICY MAPPING
17
Countries (N = 34)
No govt-
Administrative level
Reporting entity Obligation and coverage Manifestations reported (confirmed cases only)
led activity
National Sub-national
Clini-cians only
Labs only
Both Manda-tory
(country-wide)
Manda-tory
(some regions)
Volunta-ry
Clinician sentinel
Others EM clinical signs only
EM with lab
NB Other late or
dissem-inated
N consul-tations
Positive lab tests
Not clearly
defined
Ireland X X X X
Italy X
Latvia X X X X
Lithuania X X X X
Luxembourg X X X X X X
Malta X
Netherlands X X Clinician surveys
X X
Norway X X X X X
Poland X X X X X X
Portugal X X X X X X
Romania X X X X X X
Slovakia X X X X
Slovenia X X X X X X
Spain X X X X X
Sweden X
Switzerland X X
Country -wide
X
NORTH AMERICA
USA X X X X X X X
Canada X X X X X X
TOTAL (N) 6 24 4 8 5 15 21 2 4 3 7 10 16 12 3 8 2

INCIDENCE AND SURVEILLANCE OF LYME DISEASE: SYSTEMATIC REVIEW AND POLICY MAPPING
18
4.2.2 Reporting entities of surveillance
As shown in Table 3, Lyme disease is reported by clinicians only in eight systems, by
laboratories only in five systems, and by both clinicians and laboratories in the remaining
15. The Danish system is an example where both clinicians and laboratories submit data.
In systems where both clinicians and laboratories submit data, data can be reported at the
national level independently for both systems, or compiled by the authority in charge
(often the national public health department) in order to remove duplicates, confirm and
report single cases. Belgium is an example of a country where data are reported
separately. Its method includes three systems that involve clinicians and laboratories: a) a
GP sentinel that participates in cross-sectional surveys approximately every five years; b)
a laboratory sentinel that reports data on a weekly basis; and c) the National Reference
Centre for Borrelia Burgdorferi, which provides support for diagnosis and also reports
surveillance data. (Sentinels are explained in the next section.) The Public Health
Scientific Institute presents data from these separately, including in different reports.
In Norway, by contrast, data from clinicians and laboratories are aggregated in a single
database. Clinicians are required to send specimens of suspected cases to a laboratory,
which notifies both the clinician and the surveillance system when the result is positive.
Then, the clinician must send a standardised notification form to the surveillance system
and the local health authority. When both clinical and laboratory notifications are
received at the Institute for Public Health and match (the presence of both clinical
symptoms and a positive laboratory test are required to confirm a case), they are
registered as a single case in the surveillance system.
In the countries that have sub-national surveillance systems, reporting entities vary across
regions. For instance, in Germany, some states require clinicians to notify cases of Lyme
disease, some require laboratories to notify, some do both, and Lyme disease is not
notifiable in others.
As for other reporting entities (not shown in Table 3), Belgium, the Netherlands and
Switzerland invite the general population to report tick bites, EM or other symptoms via an
application or website that is managed by the national public health authority or in which
the government is a partner. In England and Wales, employers are required to report
occupationally-acquired cases to the Health and Safety Executive, under the Reporting of
Injuries, Diseases and Dangerous Occurrences Regulations.
4.2.3 Obligations and coverage
The notification of Lyme disease is mandatory by law in the majority of countries (n=21,
plus some regions of Germany and Spain). Three countries (Belgium, France and
Switzerland) and one German region (Bavaria) use a voluntary system called sentinels (in
addition to mandatory notification in the case of Bavaria). Sentinels are groups of
clinicians or organisations that are representative of the territory, trained and voluntarily
registered in a network. The sentinel network in Belgium includes about 150 GPs, the
French represents about 2.2% of GPs in mainland France, and the Swiss includes
approximately 200 clinicians. As explained earlier, Belgium also uses a laboratory sentinel
network of about 40 laboratories, representing nearly 50% of serologic tests performed in
the country (not only for Lyme). The Belgian laboratory sentinels and clinician sentinels in

INCIDENCE AND SURVEILLANCE OF LYME DISEASE: SYSTEMATIC REVIEW AND POLICY MAPPING
19
France, Switzerland and Bavaria are active systems that regularly report information to
the authority in charge. The GP Belgian sentinel network is used as a sample to whom
surveys are sent approximately every five years.
The Netherlands is a unique case where information is requested from clinicians across the
whole country on a voluntary basis. Similarly to the Belgian GP sentinels, the National
Institute for Public Health and Environment monitors Lyme disease through a survey sent
to GPs at approximately five-yearly intervals (in some surveys other clinicians have also
been surveyed). In the most recent survey questionnaires were sent to all GPs, while in
previous years a random sample was contacted. The most recent survey attained a
response rate of 41% of GPs, with practice populations representing 62% of the total
population.
4.2.4 Case definitions for reporting Lyme disease
Surveillance systems define cases differently. The definitions used fall into the following
categories:
Clinical case definitions (N=19), of which N=3 include only early Lyme disease (EM),
N=3 include only late or disseminated Lyme disease (neuroborreliosis and/or other
late manifestations), and N=13 include both;
Positive laboratory tests only (N=5);
Number of patient consultations only (N=1).
For two countries we were unable to find a clearly stated case definition (Latvia and
Lithuania). The level of detail and precision in the definitions varies between countries.
Canada and the USA are examples of countries that use extensive definitions. Cases are
classified into three categories (suspected, probable, confirmed), each of which is clearly
defined in terms of clinical presentation, exposure and/or laboratory confirmation.
Regarding early Lyme disease (EM), seven countries consider cases assessed with clinical
symptoms only. Ten require both clinical signs and a positive laboratory test. In addition
to these, in the USA, confirmed cases of EM need to have clinical symptoms supported by
either a laboratory confirmation or a history of tick bite. Most countries where late or
disseminated Lyme disease (including neuroborreliosis, Lyme arthritis or other late
manifestations) is notifiable require a laboratory confirmation.
Of the systems which use GP sentinels, two only collect data on patient consultations
rather than on diagnosed disease. Consultations for tick bites and EM are notifiable in the
Belgian GP sentinels, and consultations for tick bites, EM and “chronic manifestations” (no
definition) are reported by the Swiss GP sentinels. The Dutch surveys measure a
combination of both consultations (for tick bites) and diagnosis (of EM).
Finally, in the countries that have a laboratory-only system, only positive laboratory tests
are notified (England and Wales, Northern Ireland, Scotland, Finland and Slovakia). Three
further countries also report data on positive laboratory tests, as well as clinical data
(Belgium, Denmark and Spain).

INCIDENCE AND SURVEILLANCE OF LYME DISEASE: SYSTEMATIC REVIEW AND POLICY MAPPING
20
4.3 Discussion
4.3.1 Comparison of UK with international policies and systems
Relatively few countries operate similar systems to the UK, perhaps because few countries
have centralised laboratories. Mandatory clinician reporting is fairly common across
Europe and North America, but by no means ubiquitous, even in those countries which
seem geographically likely to have substantial incidence rates. Some do not conduct any
surveillance of Lyme disease at all, including Sweden, Austria and some regions of
Germany.
There is wide variation between countries in terms of case definitions. This can be seen in
terms of a ‘surveillance pyramid’ (Braks et al., 2011). Some systems focus on a ‘higher’
level of the pyramid (late or disseminated Lyme disease) and some on a ‘lower’ level (EM
alone): those sentinel- or survey-based systems which measure all consultations for tick
bites could be seen as focusing at a yet lower level.
4.3.2 Strengths and limitations of the overview
In this phase we described the different systems and policies in place for the surveillance
of Lyme disease internationally using information and data from reports and websites,
which for some countries is limited. We did not contact agencies directly for further
information. The information and data were verified fully by a second researcher. We used
Google Translate to extract information in languages not spoken by the researchers. We
also scanned studies in the map to provide additional information, but did not
systematically extract data from relevant studies.
To our knowledge, no previous research has produced a similar overview of surveillance
systems and policies (although a project led by the European Centre for Disease
Prevention and Control, which may overlap with this research, is currently underway and
is due to report in December 2017). The findings complement theoretical policy
discussions (e.g., van den Wijngaard et al. (2017)) by showing which policy options have
actually been implemented and which have not.
This phase of the research was mainly descriptive. We did not seek to assess the
implementation of surveillance systems or evaluate the completeness of data, since this
would require extensive primary research. Hence, we cannot judge, for example, what
proportion of cases are actually reported in countries with mandatory notification laws in
force.
INCIDENCE AND SURVEILLANCE OF LYME DISEASE: SYSTEMATIC REVIEW AND POLICY MAPPING
21
5. Systematic review of comparative studies of Lyme disease
incidence
5.1 Overview
We identified 16 studies which compared incidence rates for the same populations
using different data sources
Higher-quality studies comparing surveillance data to other data indicate that at
least some cases identifiable from other sources are not reported to surveillance
authorities; estimates range from 10% to 120% of cases, with an unweighted
median of 30%
Some evidence suggests that laboratory reporting may identify more cases than
mandatory clinician reporting alone
There are some limitations to the evidence, such as a dearth of high quality
evidence, and some significant gaps such as on active surveillance systems or
sentinel networks
5.2 Included studies
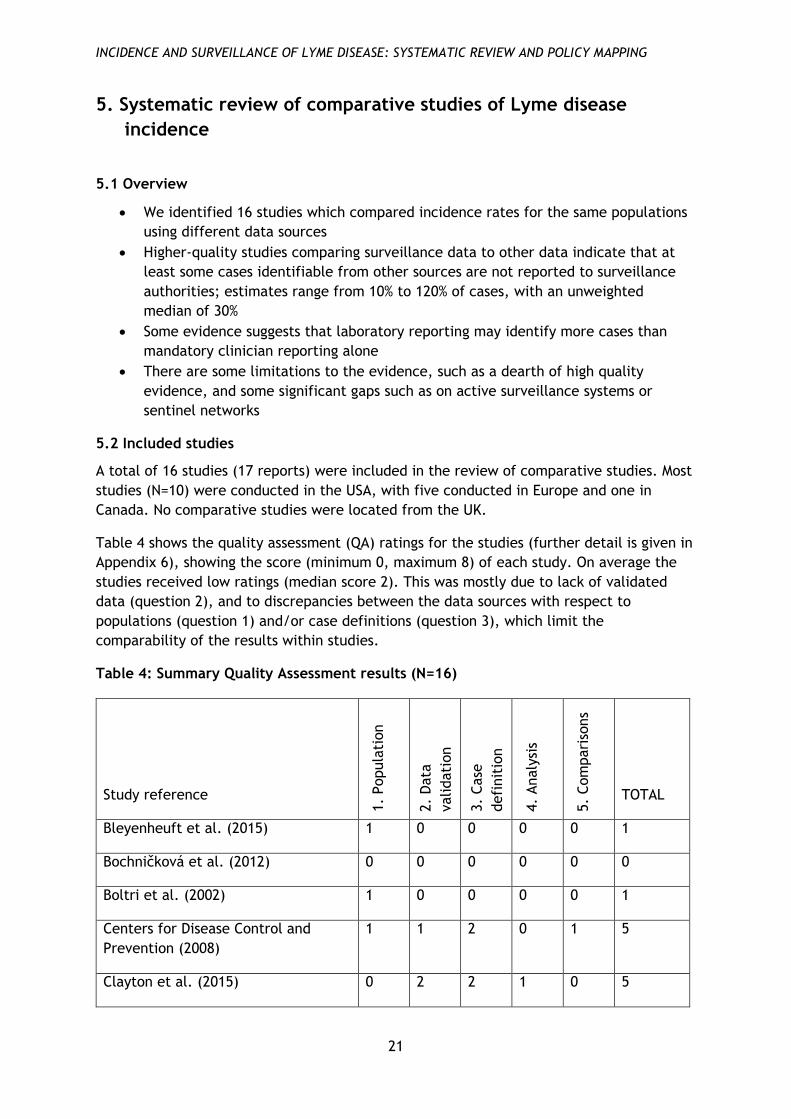
A total of 16 studies (17 reports) were included in the review of comparative studies. Most
studies (N=10) were conducted in the USA, with five conducted in Europe and one in
Canada. No comparative studies were located from the UK.
Table 4 shows the quality assessment (QA) ratings for the studies (further detail is given in
Appendix 6), showing the score (minimum 0, maximum 8) of each study. On average the
studies received low ratings (median score 2). This was mostly due to lack of validated
data (question 2), and to discrepancies between the data sources with respect to
populations (question 1) and/or case definitions (question 3), which limit the
comparability of the results within studies.
Table 4: Summary Quality Assessment results (N=16)
Study reference
1.
Popula
tion
2.
Data
validati
on
3.
Case
defi
nit
ion
4.
Analy
sis
5.
Com
pari
sons
TOTAL
Bleyenheuft et al. (2015) 1 0 0 0 0 1
Bochničková et al. (2012) 0 0 0 0 0 0
Boltri et al. (2002) 1 0 0 0 0 1
Centers for Disease Control and
Prevention (2008)
1 1 2 0 1 5
Clayton et al. (2015) 0 2 2 1 0 5

INCIDENCE AND SURVEILLANCE OF LYME DISEASE: SYSTEMATIC REVIEW AND POLICY MAPPING
22
Dessau et al. (2015) 1 0 0 0 1 2
Ertel et al. (2012) 1 1 2 0 1 5
Henry et al. (2011) 1 2 2 1 0 6
Jones et al. (2012); Jones et al.
(2013)
0 0 1 1 0 2
MacDonald et al. (2016) 1 0 0 0 0 1
Müller et al. (2012) 0 0 1 0 0 1
Naleway et al. (2002) 1 2 2 1 1 7
Nelson et al. (2015) 0 0 1 1 1 3
Robinson (2014) 1 0 0 0 0 1
Schiffman et al. (2016) 1 2 2 1 0 6
Tseng et al. (2015) 0 0 1 0 0 1
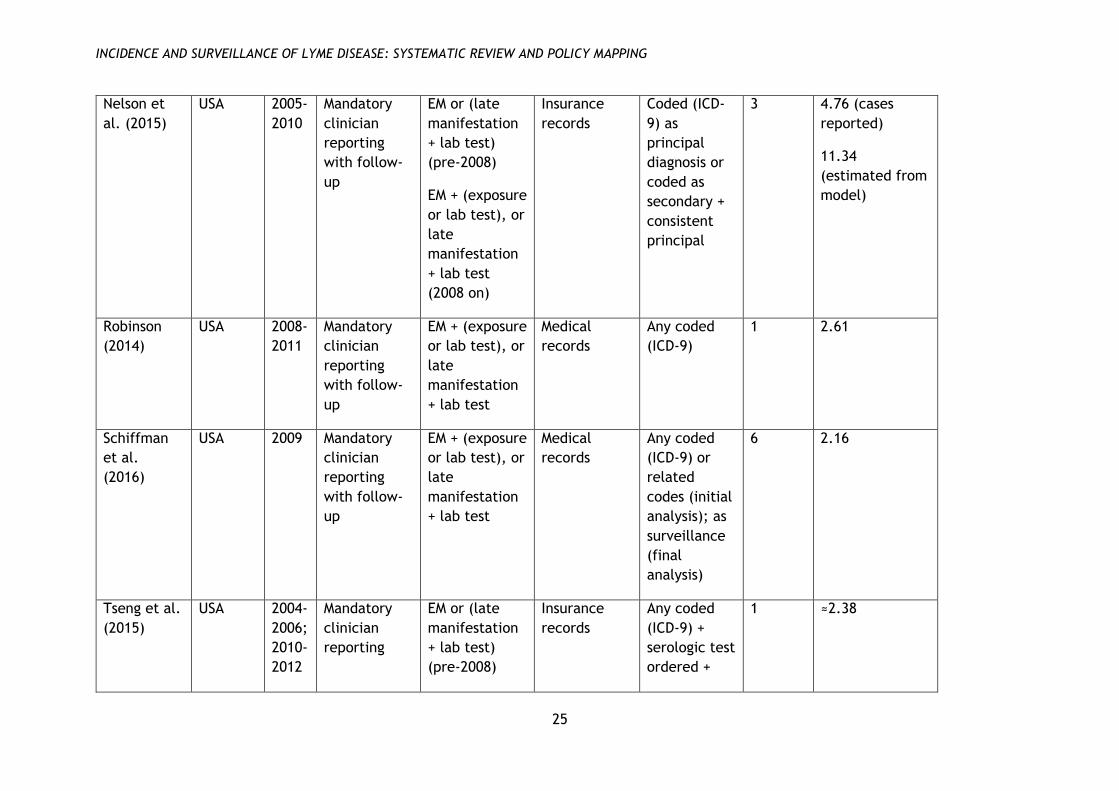
A brief overview of the types of data included in the studies is given in Tables 5 and 6.
Table 5 covers the studies which compared data from a surveillance system with data from
another source (N=13), in order to assess the extent of under-reporting within the former.
The comparison source was either administrative records from healthcare providers (N=6),
databases containing information on health insurance claims (N=5), results from
laboratories conducting serologic tests (N=1) or questionnaires distributed to clinicians
(N=1). The table summarises the nature of the surveillance system and case definitions (it
should be noted that this information was not always explicitly reported in the study
report, and had to be supplied from references given in the paper), and the comparison
data source and case definition. The table also repeats the summary QA score. Finally, the
table gives a summary statistic representing the reporting multiplication factor, that is,
the ratio of cases found from the comparison source to those reported within the
surveillance system, or calculated through modelling (Gibbons et al., 2014); this was
recalculated where not directly reported in the study. As discussed below these figures
should be interpreted with caution, particularly for those studies with lower quality
ratings.
Table 6 covers the studies which described different data sources within a single
surveillance system. (We have not calculated a multiplication factor for these studies as
the data sources are generally not independent.) These studies are somewhat more
heterogeneous in their aims and methods, but generally compare clinician reporting with
laboratory reporting, and in one case passive surveillance (relying on clinicians to report
cases) with active surveillance (a voluntary network of clinicians who reported every
month) (Ertel et al., 2012).

INCIDENCE AND SURVEILLANCE OF LYME DISEASE: SYSTEMATIC REVIEW AND POLICY MAPPING
23
Table 5: Studies comparing data from surveillance systems with data from other sources (N=13)
Study
reference
Country Years Surveillance
system
Case
definition for
surveillance
source
Comparison
source
Case
definition
for
comparison
source
QA
score
Ratio of rate in
comparison
source to rate
in surveillance
source
Bleyenheuft
et al.
(2015)
Belgium 2003-
2010
Sentinel
laboratory
network
Lab test Medical
records
Any coded
(ICD-9)
1 1.06
Bochničková
et al.
(2012)
Slovakia 1989-
2010
Unspecified NR Medical
records
NR 0 2.17
Boltri et al.
(2002)
USA 1999-
2000
Mandatory
clinician
reporting
with follow-
up
(EM or
disseminated)
+ lab test
Clinician
questionnaire
Any clinician
report of
diagnosing or
treating
1 96.33
Clayton et
al. (2015)
USA 2011-
2013
Mandatory
clinician
reporting
with follow-
up
(EM or
disseminated)
+ lab test +
exposure
Insurance
records
With ≥3
codes (ICD-9)
(initial
analysis); as
surveillance
(final
analysis)
5 1.19

INCIDENCE AND SURVEILLANCE OF LYME DISEASE: SYSTEMATIC REVIEW AND POLICY MAPPING
24
Henry et al.
(2011)
Canada 1997-
2008
Mandatory
clinician
reporting
(passive /
active)
Any diagnosed
(initial
analysis);
(appropriate
diagnosis +
exposure) or
lab test (final
analysis)
Laboratory
records
Lab test
(initial
analysis); as
surveillance
(final
analysis)
6 1.41 (cases
reported)
1.53 (estimated
from model)*
Jones et al.
(2012);
Jones et al.
(2013)
USA 2000-
2009
Mandatory
clinician
reporting
with follow-
up
Any diagnosed
+ lab test
Insurance
records
Any coded
(ICD-9) + ≥3
corroborating
events
2 3.09 (cases
reported)
7.76 (estimated
from model)
MacDonald
et al.
(2016)
Norway 2008-
2012
Mandatory
clinician and
lab reporting
Diagnosed
disseminated
or chronic
Medical
records
Any coded
(ICD-10)
1 3.97
Müller et al.
(2012)
Germany 2006-
2008
Mandatory
clinician
reporting
NR Insurance
records
Any coded
(ICD-10) +
serologic test
ordered
1 7.68
Naleway et
al. (2002)
USA 1992-
1998
Mandatory
clinician
reporting
with follow-
up
EM or
(disseminated
+ lab test)
Medical
records
Any coded
(ICD-9) or lab
test (initial
analysis); as
surveillance
(final
analysis)
7 1.12
INCIDENCE AND SURVEILLANCE OF LYME DISEASE: SYSTEMATIC REVIEW AND POLICY MAPPING
25
Nelson et
al. (2015)
USA 2005-
2010
Mandatory
clinician
reporting
with follow-
up
EM or (late
manifestation
+ lab test)
(pre-2008)
EM + (exposure
or lab test), or
late
manifestation
+ lab test
(2008 on)
Insurance
records
Coded (ICD-
9) as
principal
diagnosis or
coded as
secondary +
consistent
principal
3 4.76 (cases
reported)
11.34
(estimated from
model)
Robinson
(2014)
USA 2008-
2011
Mandatory
clinician
reporting
with follow-
up
EM + (exposure
or lab test), or
late
manifestation
+ lab test
Medical
records
Any coded
(ICD-9)
1 2.61
Schiffman
et al.
(2016)
USA 2009 Mandatory
clinician
reporting
with follow-
up
EM + (exposure
or lab test), or
late
manifestation
+ lab test
Medical
records
Any coded
(ICD-9) or
related
codes (initial
analysis); as
surveillance
(final
analysis)
6 2.16
Tseng et al.
(2015)
USA 2004-
2006;
2010-
2012
Mandatory
clinician
reporting
EM or (late
manifestation
+ lab test)
(pre-2008)
Insurance
records
Any coded
(ICD-9) +
serologic test
ordered +
1 ≈2.38

INCIDENCE AND SURVEILLANCE OF LYME DISEASE: SYSTEMATIC REVIEW AND POLICY MAPPING
26
with follow-
up
EM + (exposure
or lab test), or
late
manifestation
+ lab test
(2008 on)
treatment
≥14 days
* First ratio for Henry et al. (2011) is ratio of total deduplicated cases to cases from clinician reporting; second ratio for Henry 2011 is ratio
of estimated total rate (using capture-recapture methodology) to total number of cases identified through all sources (in best-fitting model;
other models give different rates)
‘Initial analysis’ refers to the initial coding of cases, ‘final analysis’ to the final coding on which the calculation of a reporting multiplier is
based

INCIDENCE AND SURVEILLANCE OF LYME DISEASE: SYSTEMATIC REVIEW AND POLICY MAPPING
27
Table 6: Studies comparing data within surveillance systems (N=3)
Country Years 1st data
source
2nd data source 3rd data source QA
score
Centers for
Disease
Control and
Prevention
(2008)
USA 2001-
2006
Electronic
laboratory
reports
Clinician reports +
paper-based
laboratory reports
N/A 5
Dessau et
al. (2015)
Denmark 2010-
2012
Clinician
reports
Electronic
laboratory reports
N/A 2
Ertel et al.
(2012)
USA 1996-
2007
Clinician
reports
Clinician active
surveillance network
Laboratory
reports (2
systems)
5
In the following synthesis we first discuss the studies comparing surveillance with non-
surveillance sources, and then the studies comparing sources within a surveillance system.
Within the groups studies are divided into higher-quality (QA score >4) and lower-quality
(QA score ≤4). The results of lower-quality studies are only briefly summarised; synthesis
focuses on the higher-quality studies.
5.3 Findings: studies comparing surveillance with non-surveillance sources
5.3.1 Higher-quality studies
Four studies received a QA score higher than 4 (Clayton et al., 2015, Henry et al., 2011,
Naleway et al., 2002, Schiffman et al., 2016). Three were conducted in the USA and one in
Canada. In all four studies, mandatory clinician reporting was in force during the study
period.
All four higher-quality studies used secondary data analysis comparing the number of cases
reported to the surveillance system with another source of data (clinical records,
insurance records, laboratory records or enhanced surveillance databases). In all these
studies the comparison data source was reviewed and validated by the study authors,
either for all the cases included (Henry et al., 2011, Naleway et al., 2002, Schiffman et
al., 2016) or for a random sample (Clayton et al., 2015), and a consistent case definition
was applied (based on the surveillance case definition in force in the jurisdiction where
the study was conducted). In three studies data analysis consisted of directly comparing
the different sources, with a view to identifying cases from the comparison source which
had not been reported to the surveillance system, and hence calculating a reporting
multiplier (Clayton et al., 2015, Naleway et al., 2002, Schiffman et al., 2016). The other
study combined three sources of data and analysed them using capture-recapture analysis,
which estimates the true number of cases in a population based on the overlap between
distinct data sources, to arrive at an estimate of the total number of cases unreported to
any source (Henry et al., 2011).

INCIDENCE AND SURVEILLANCE OF LYME DISEASE: SYSTEMATIC REVIEW AND POLICY MAPPING
28
Reporting multipliers calculated from these studies ranged between 1.1 to 2.2, with an
unweighted median of 1.3, when comparing incidence rates from surveillance systems
with mandatory clinician reporting to other data sources. The capture-recapture study
indicated a reporting multiplier of between 1 and 1.5, depending on model specification,
for a system including both mandatory clinician notification and mandatory laboratory
notification.
Two of these studies also investigated whether there was any difference in the
demographics of cases between the different data sources, both of which found no
significant difference with respect to age or gender (Clayton et al., 2015, Naleway et al.,
2002).
5.3.2 Lower-quality studies
Nine studies (ten study reports) received a QA score of 4 or lower (Bleyenheuft et al.,
2015, Bochničková et al., 2012, Boltri et al., 2002, Jones et al., 2013, MacDonald et al.,
2016, Müller et al., 2012, Nelson et al., 2015, Robinson, 2014, Tseng et al., 2015). Five
were conducted in the USA and four in continental Europe. In most cases (N=7) mandatory
clinician reporting was in force.
Most of these studies use secondary data analysis to compare surveillance data with other
data sources (medical records, insurance records, hospital episode data); one study
reports the findings of a questionnaire survey of clinicians and compares this to
surveillance data (Boltri et al., 2002). In none of these studies were the case definitions
consistent between sources, which limits the validity of the resulting data. The methods
used to analyse data from the comparison data sets varied considerably: some included
any cases coded with a Lyme disease diagnosis in the data set, while others used more
inclusive and others more exclusive definitions. In most cases (N=7) the analysis consisted
in directly comparing rates between the two sources; one study used generalised linear
mixed modelling (Jones et al., 2013), and one applied a correction factor to account for
under-diagnosis (Nelson et al., 2015).
The results of these studies vary widely, with calculable reporting multipliers ranging
between just over 1 and more than 10, or almost 100 in one outlying case (Boltri et al.,
2002). The unweighted median multiplier was 3.1 on the basis of direct comparisons, or
4.0 if the ‘corrected’ findings in the two studies using more complex analyses are
included.
5.4 Findings: studies comparing data sources within a surveillance system
5.4.1 Higher-quality studies
Two studies in this group, both conducted in the USA, received a QA score higher than 4
(Centers for Disease Control and Prevention, 2016, Ertel et al., 2012). One found that the
combination of clinician and paper-based laboratory reporting identified approximately
2.8 times as many cases as electronic laboratory reporting (Centers for Disease Control
and Prevention, 2016). The other found that mandatory laboratory reporting found a
substantial number of cases over and above those found by the combination of passive and
active clinician reporting (Ertel et al., 2012). Results on case demographics were mixed:
one study finds differences in the age and presentation of cases, with clinician-reported

INCIDENCE AND SURVEILLANCE OF LYME DISEASE: SYSTEMATIC REVIEW AND POLICY MAPPING
29
cases more likely to be younger and to present with early Lyme disease than those
reported by laboratories (Ertel et al., 2012); the other study shows no difference in age
but did find some differences in geographical location and seasonality (Centers for Disease
Control and Prevention, 2016).
5.4.2 Lower-quality studies
One study in this group received a QA score of 4 or lower. This study was conducted in
Denmark and compared clinician reporting to electronic laboratory reporting (Dessau et
al., 2015). Laboratory reporting found approximately 2.5 times as many cases as clinician
reporting. More clinician-reported cases than laboratory-reported cases were children;
there was no significant difference by gender, but there was some variation in
geographical region.
5.5 Discussion
5.5.1 Summary of findings
The findings from higher-quality studies that compare surveillance data with other sources
(N=4), all of which relate to systems which require mandatory clinician notification, show
that at least some cases identifiable from other sources are not reported to surveillance
authorities, and hence that there is some under-reporting of cases. Estimates of the
under-reporting multiplier (i.e. the ratio of cases in the comparison source to cases in the
surveillance source) in these studies range from 1.1 to 2.2 (or, in other words, between
10% and 120% additional cases); the unweighted median is 1.3. One study, using capture-
recapture methods, indicates that a system which includes both mandatory clinician
notification and mandatory laboratory notification under-reports cases by a factor of
between 1 and 1.5 (Henry et al., 2011). Estimated multipliers from lower-quality studies
are considerably higher, but the validity of these findings is limited.
Fewer reliable data are available on the performance of laboratory reporting relative to
clinician reporting. However, some evidence suggests that electronic laboratory reporting
may identify more cases than mandatory clinician reporting alone (Dessau et al., 2015,
Henry et al., 2011).
There is little data on active surveillance systems or sentinel networks, and what there is
is hampered by limited information on the nature of the system.
5.5.2 Transferability of the findings to the UK context
We located no comparative studies from the UK. The context of most of the studies
diverges from the UK in several respects, which may present barriers to the transferability
of the findings. Firstly, almost all the studies were conducted in countries where Lyme
disease is notifiable by clinicians, which is not the case in the UK. Findings regarding the
rate of under-reporting in these systems are thus not immediately applicable in the UK
context.
Most of the studies were conducted in countries and regions which have a higher incidence
of Lyme disease than the UK. This may translate into higher awareness of Lyme disease
among both clinicians and the general population. This may in turn affect clinician
practices in ways which impact on reporting behaviour and on the data recorded in

INCIDENCE AND SURVEILLANCE OF LYME DISEASE: SYSTEMATIC REVIEW AND POLICY MAPPING
30
administrative datasets (for example, it may make clinicians more likely to recognise
Lyme disease, but also to treat it without ordering serologic tests).
Most of the studies were conducted in countries with insurance-based health systems
(private or public). Several studies use health insurance providers as a comparison data
source, and these data have no direct analogue in the UK context. Differences in the
health system (for example, with respect to whether testing and treatment for Lyme
disease are reimbursed) may also affect the behaviour of clinicians and people seeking
healthcare.
Current UK surveillance operates on the basis of tracking positive laboratory tests alone;
there is no case definition distinct from this, since Lyme disease as distinct from B.
burgdorferi is not notifiable. The studies in this review are based upon official case
definitions for Lyme disease which include clinical symptoms and/or exposure to ticks in
addition to laboratory tests (or even without laboratory tests in some cases; see section 0
and Appendix 4). This may limit the applicability of the findings to the UK context.
5.5.3 Strengths and limitations of the review
In this phase we used full systematic review methods, with systematic screening, quality
assessment and data extraction. However, while all records were double-screened, quality
assessment and data extraction were checked rather than redone independently by the
second reviewer. Studies were identified from a comprehensive map of Lyme disease
research (Stokes et al. 2017).
Interpretation of the findings depends to some extent on contextual information,
particularly relating to the surveillance system in force. This was frequently not reported
in the studies and has been added from other policy documents where appropriate for the
analysis.
As the results show, much of the literature has severe limitations, mainly relating to the
comparability of data sources and case definitions, and the results of lower-quality studies
cannot be regarded as reliable. The body of studies using comparable data from both a
surveillance system and an independent data source is small, although the findings across
studies are reasonably consistent.
5.5.4 Implications for policy and practice
The findings imply that even in countries where Lyme disease is mandatorily notifiable by
clinicians, there is some under-reporting of cases. While estimates of the reporting
multiplier vary considerably – with higher-quality studies suggesting multipliers between
1.1 and 2.2 - the data do suggest that at least some cases go unreported in all systems.
There is more limited data on laboratory surveillance systems, but the data available do
not suggest that they perform worse than mandatory clinician reporting, and they may
perform better. This is probably due to the automated nature of electronic laboratory
reporting systems, although it may to some extent reflect differences in case definitions
(Dessau et al., 2015).
Most studies do not indicate major differences between reported and unreported cases in
terms of demographics or location, in either clinician or laboratory systems, although the
data are not fully consistent. There are fewer data comparing demographics between

INCIDENCE AND SURVEILLANCE OF LYME DISEASE: SYSTEMATIC REVIEW AND POLICY MAPPING
31
clinician-reported and laboratory-reported cases, but there are some divergences, with
clinician-reported cases more likely to be younger and to have an early form of Lyme
disease than laboratory-reported cases. This aside, the findings do not suggest that the
performance of either clinician or laboratory systems are inadequate in terms of tracking
the overall trends in incidence of Lyme disease. However, we identified some variability in
the geographical distribution of cases between different data sources (but, again, no clear
implication in terms of the superiority of one type of system over another). This may raise
concerns as to how accurately surveillance data captures local variation in incidence
rates, particularly at smaller spatial scales.
The findings suggest that a combination of methods gives more complete coverage in
terms of the identification of cases than any single method alone, but also that no
combination can guarantee full coverage of all cases. Whether such a combination of
systems gives a better representation of overall trends cannot be determined from the
available data.
Our findings do not suggest that administrative datasets would be a valuable addition to
the surveillance system, due to limited reliability of these data; plus such datasets are
largely unavailable for the UK.

INCIDENCE AND SURVEILLANCE OF LYME DISEASE: SYSTEMATIC REVIEW AND POLICY MAPPING
32
6. Patient advocacy groups views on these findings
Six patient advocacy groups provided feedback on these findings in our October 2017
survey. Responses largely focused on the incidence of Lyme disease in the UK.
All groups were concerned that the evidence does not reflect the true extent of Lyme
incidence in the UK. Stakeholders indicated that several problems undermine an accurate
picture of both absolute figures and regional comparisons of Lyme disease incidence.
These included a) the fact that clinically diagnosed cases are not accounted for in the
figures (noted by six groups), b) the unreliability of laboratory tests (noted by four groups)
and c) the variability of Lyme disease knowledge among clinicians, for example about the
need for and appropriate timing of serology testing (noted by two groups).
Three groups suggested that the true scale of UK Lyme disease incidence should be
monitored and two groups expressed a need for more comprehensive evidence about
regional differences.
Similar issues were raised in the consultation meetings in July 2017. Stakeholders raised
concerns about the lack of evidence on endemic areas or Lyme ‘hot-spots’ in the UK and
about the likelihood of underestimation of Lyme disease incidence given the limitations of
diagnosis procedures and testing.

INCIDENCE AND SURVEILLANCE OF LYME DISEASE: SYSTEMATIC REVIEW AND POLICY MAPPING
33
7. Conclusions
7.1 Incidence of Lyme disease in the UK
Our findings do not permit us to estimate a ‘true’ incidence rate for the UK, given the
limitations in transferability of the evidence on under-reporting. They also do not give any
reason to challenge PHE’s pragmatic estimate of 2,000 to 3,000 cases a year for England
and Wales, implying a value of 2 to 3 for the reporting multiplier and an incidence of
approximately 3.5 to 5 per 100,000 (Public Health England, 2013).
7.2 Context and goals of Lyme disease surveillance
The aspects of a surveillance system which are most important depend on the overarching
goal of the system and on the ways in which data will be used by practitioners and policy-
makers (German et al., 2001). In the case of Lyme disease, one potential concern is how
well surveillance data identifies ‘hotspots’ of higher incidence within an overall context of
relatively low incidence. The UK data suggest that most cases may be accounted for by a
small number of geographically limited areas; however, information on the geographical
distribution of cases in England and Wales is sparse and somewhat inconsistent, so we
cannot identify these areas with any confidence. Information on national incidence rates
does not provide an accurate measure of local risk, and so may be of limited value to
clinicians or local policy-makers. In addition, rates may vary between very small areas and
over time, so even a relatively fine-grained breakdown by areas might not give a full
picture of the local situation.
Laboratory tests can only provide evidence of B. burgdorferi infection. This in itself is not
evidence of Lyme disease as patients can be infected but not develop the disease. Lyme
disease can only be confirmed clinically. In addition, laboratory tests cannot distinguish
between active and past infection. Therefore, some patients that are seropositive may be
incorrectly labelled as having Lyme disease. By contrast, clinical surveillance schemes
provide a direct indication of the burden of Lyme disease. However, if strict case
definitions have to be adhered to it is likely that some real cases of Lyme disease will not
be labelled as such.
7.3 Policy options
Our findings, along with the broader literature, suggest several potential policy directions
for England and Wales.
a) Maintain the existing system with no change. The current laboratory-based system has
some advantages. It minimises the burden on both clinicians and public health authorities.
The evidence does not suggest that other systems, such as mandatory clinician reporting,
are superior in terms of the ability to track trends and estimate approximate overall
incidence (although the data are not fully conclusive). However, the current system does
not provide contextual information - for example, on the location, demographics and
clinical presentation of cases - which could give a more complete picture of disease
trends.
b) Introduce mandatory clinician reporting for all Lyme disease cases. Our findings suggest
that the introduction of mandatory clinician reporting for Lyme disease in England and
INCIDENCE AND SURVEILLANCE OF LYME DISEASE: SYSTEMATIC REVIEW AND POLICY MAPPING
34
Wales would probably locate more cases than the current system. However, they also
suggest that it would not eliminate under-reporting (and might introduce some over-
reporting). The issues with mandatory clinician reporting are well known and suggest that
such a move in England and Wales would probably not lead to substantively more reliable
information, or mitigate the challenges which currently beset the interpretation of
surveillance data. Mandatory reporting requirements could include a requirement to
report contextual data about cases, although again, there would be limitations to the
reliability of these data overall.
c) Introduce mandatory clinician reporting for late or disseminated Lyme disease cases
alone. If late manifestations of Lyme disease are a particular policy concern, these could
be made notifiable without adding notification of all manifestations of Lyme disease. The
data suggest that the overall numbers are likely to be fairly low, which could make the
system harder to implement. Other options (see (d) and (e) below) could also provide
information on late Lyme disease without the need to introduce mandatory notification.
d) Include Lyme disease in clinician sentinel networks. Some primary care sentinel
networks already exist in the UK, such as the Royal College of General Practitioners’
Research and Surveillance Centre (Correa et al., 2016), which could in theory be utilised
to collect data on Lyme disease. Sentinel networks could collect data on EM, which, as van
den Wijngaard et al. (2017) suggest, might complement data on other forms of Lyme
disease. Other primary care datasets, such as the Clinical Practice Research Datalink
(CPRD) or The Health Improvement Network (THIN) database, might also be usable to
supplement existing data. However, given the low overall incidence in England and
geographical variation in rates, it is likely that many GPs encounter very few or no cases
of Lyme disease. This may limit the usefulness of data from sentinel GP networks or
datasets.
e) Introduce enhanced surveillance using clinician questionnaires. Questionnaires were
used to collect further data on cases in conjunction with laboratory reporting in England
and Wales between 1997 and 2003 (Public Health England, 2013), and are still used in
Scotland. Such systems appear to attain reasonable response rates, and can give
substantially more information on cases than is currently available, which could help to
illuminate disease dynamics and identify hotspots. This research, for example, has relied
extensively on the data from Scotland to address questions about the situation in England
and Wales which would otherwise remain obscure. (This move would of course not address
under-reporting in the current system, but all systems suffer from under-reporting to some
degree.) However, this move would obviously require some additional resources to collect
and manage data.

INCIDENCE AND SURVEILLANCE OF LYME DISEASE: SYSTEMATIC REVIEW AND POLICY MAPPING
35
8. Detailed methods
8.1 Research questions
The research questions for this project were as follows:
What is the incidence of Lyme disease in the UK, and how does this vary between
areas and population groups?
What surveillance systems and policies are in place internationally to monitor the
incidence of Lyme disease?
What is known about the completeness of prevalence data drawn from surveillance
systems?
Correspondingly, this report has three sections, relating to the three phases of the
project. The data for phases 1 and 3 were extracted from the overall map of Lyme disease
research; detailed methods for the map as a whole are reported elsewhere. The data for
phase 2 were mostly collected specifically for this project.
1. Systematic review of Lyme incidence data for the UK
2. Map of national surveillance systems and policies for Lyme in Europe and North
America
3. Systematic review of comparative studies using more than one method to estimate
incidence
The methods and findings for each phase are set out below.
8.2 User involvement
We worked closely with the review commissioners throughout in order to ensure that the
review is closely aligned with their needs and emerging programme. In particular we
sought to identify research avenues that would support and complement the evidence
being assembled by NICE in 2017 to produce a guideline for Lyme disease.
We also convened a Scientific Advisory Group (AG) of UK and international academics and
UK policy-makers to obtain specialist expertise and input. The AG provided advice on an
as-needed basis with regard to technical issues relating to the research questions,
concepts and definitions as well as strategies for dissemination and impact. Lastly, we ran
a series of consultations with patient and practitioner groups to help interpret our
emerging findings in relation to current UK experiences.
8.3 Study identification
As noted above, the first phase of the overarching project involved producing a systematic
evidence map covering the whole range of research evidence on Lyme disease in humans.
The findings of the map coding were then used to populate the subsequent, more focused
systematic evidence reviews.
Full details of the methods and findings of the systematic map are available (Stokes et al.,
2017). Given the broad scope of focus of the systematic map, the search strategy was
sensitive, consisting in effect of a single cluster of terms for Lyme disease.

INCIDENCE AND SURVEILLANCE OF LYME DISEASE: SYSTEMATIC REVIEW AND POLICY MAPPING
36
To be included in the evidence map studies had to meet the criteria set out in Table 7
below.
Table 7: Inclusion criteria for the systematic evidence map
Criterion To be included in the map a
study must:-
Rationale
Date Be published in or after 2002. Guidance from members of the scientific
advisory group was to focus on recent
research from the last 15 years in order to
reflect current experiences and practices
relating to Lyme disease.
Language Be published in English
Language.
Since the team does not have capacity to
search for and examine evidence in all
languages, we will include only those
available in English Language.
Health
condition
Be about Lyme disease. Studies may focus on more than one
condition but must include at least some
focus on Lyme.
Evidence Be an empirical research
study OR systematic review.
In addition to empirical studies, systematic
reviews (i.e. reviews for which ≥ 2 databases
were searched and inclusion criteria applied)
will be included. Non-empirical evidence,
commentary pieces, editorials and non-
systematic reviews will be excluded.
Population Be about Lyme in humans. Whilst studies of Lyme in animals may
provide some information with implications
for human populations, the priority is to
focus in on those studies directly addressing
Lyme in humans.
Focus Not be a biomedical study
focusing purely on markers or
mechanisms of Lyme disease
within blood samples, tissue
samples, or cells.
The aim of the evidence reviews is to
understand patient and clinician experiences
of Lyme, rather than the underpinning
biomedical processes and causative
mechanisms, in order to support DH in future
policy development.
8.4 Inclusion criteria
8.4.1 Systematic review of UK Lyme disease incidence data
For the review, we screened the records from the overall evidence map which were coded
both as ‘incidence or prevalence’ and as ‘UK’ (N=17). The following criterion was used:

INCIDENCE AND SURVEILLANCE OF LYME DISEASE: SYSTEMATIC REVIEW AND POLICY MAPPING
37
Does the study report either newly collected data, or new analyses of routine data
(i.e. not just the number of cases available from routine data)?
8.4.2 Map of international Lyme disease surveillance systems and policies
The map of policies included information from 34 countries in Europe (EU member states
plus Norway and Switzerland) and North America (USA and Canada). We focused on these
countries as they are broadly comparable to the UK in socioeconomic and policy terms,
and most are known or suspected to have Lyme disease in their territory. The UK was
considered as three separate systems (England and Wales, Scotland and Northern Ireland).
The methods for this phase were pragmatic and non-systematic in nature, with a focus on
collating publicly available data. Thus, formal inclusion criteria were not used for this
phase. Searching was conducted by focused web searches, using Google Translate where
necessary. Sources of information mainly consisted of websites of relevant agencies, legal
or regulatory documents on the notification of communicable diseases and surveillance
reports published by national health authorities. We also scanned studies in the section on
incidence and prevalence of the overall Lyme disease map to locate further information.
We aimed to include information on any governmental system or policy designed to collect
information about the incidence of Lyme disease in humans. For pragmatic reasons, where
the surveillance system was organised at a sub-national (e.g. state or province) level,
and/or systems or policies varied between sub-national regions, we aimed to characterise
the system overall at national level and note the variations, rather than characterising
every sub-national system separately in detail (with the exception of the UK).
8.4.3 Systematic review of comparative studies of Lyme disease incidence
For this phase, we re-screened all the studies coded as ‘incidence or prevalence’ in the
overall evidence map (N=187) against the following criteria:
Does the study compare data on incidence from more than one source?
Do the sources cover the same geographical area at the same time point?
Do the sources use comparable disease definitions?
o Include comparisons of clinically diagnosed disease with laboratory findings
ordered by clinicians as part of the diagnosis process (i.e. which represent
confirmation of possible or suspected clinical Lyme disease). Exclude
comparisons of clinically diagnosed Lyme disease with population-level
seropositivity (i.e. rates of positive laboratory findings across the
population as a whole). Exclude comparisons of different stages of Lyme
disease (e.g. erythema migrans and disseminated disease or hospitalisation)
within a single dataset, or different methods for analysing a single dataset
to estimate incidence. Exclude comparisons of different laboratory
methodologies.
8.5 Data extraction and quality appraisal
8.5.1 Systematic review of UK Lyme disease incidence data
For the systematic review, data were extracted on the data collection methods, the
context of the study, the findings on incidence, and any other analyses. We did not carry

INCIDENCE AND SURVEILLANCE OF LYME DISEASE: SYSTEMATIC REVIEW AND POLICY MAPPING
38
out quality assessment as the main purpose of the literature review was to supplement
what is available from routine data, that is, we did not seek to base conclusions on the
literature alone.
8.5.2 Map of international Lyme disease surveillance systems and policies
The themes used for data extraction are shown in Table 8 and were based on the
characteristics suggested by van den Wijngaard et al. (2017). The authors of that study
described five characteristics of surveillance systems on Lyme disease:
1. Key indicators: a) the surveillance of EM and disseminated infections (selected to
document different stages and manifestations of Lyme disease); b) the
determination of groups of humans that are in areas susceptible to tick bites; and
c) the determination of the dynamics between the infected wildlife and tick
populations.
2. Reporting entity: a) GP, other physicians and laboratories; b) research groups; and
c) general public.
3. Coverage, defined as comprehensive or sentinels.
4. Type of reporting, defined as mandatory or voluntary notification.
5. Surveillance administrative level, defined as national or regional.
We have changed the first characteristic to “Case definitions” and have focused on
category (a) since we were interested in the general population and in Lyme disease in
humans only. Furthermore, in order to document the variety of definitions used to notify
Lyme disease, we have differentiated systems that assess the number of diagnosis, the
number of consultations and the number of positive laboratory tests. Regarding the
reporting entity, since British systems are based on laboratory reporting, we were
interested in the difference between laboratory- and clinician-based systems, and
therefore separated the two for data extraction. Research projects were not considered
unless they were conducted by a governmental entity as part of a surveillance system. The
general public was kept as a secondary reporting entity of interest. “Type of reporting”
was renamed “Obligation”. In addition to these five characteristics, information was
collected on the bodies responsible for the systems, reports, laws and case definitions.
Further information about data sources is presented in Appendix 4.
Table 8: Data extracted for the map of surveillance systems and policies
Characteristics Definitions
Administrative level National (same system across the country) or sub-national (the
responsibility to define and implement the system lies with
regional authorities)
Reporting entity Refers to the unit responsible for reporting a positive case:
Clinician-based: the GP or clinician treating a patient with the
disease is responsible for notifying the health authority.
Laboratory-based: the laboratory notifies the health
authority.
Both clinician and laboratory have responsibility for notifying
the health authority.

INCIDENCE AND SURVEILLANCE OF LYME DISEASE: SYSTEMATIC REVIEW AND POLICY MAPPING
39
Other reporting entities; these were not systematically
searched but noted.
Obligations Mandatory (e.g. by law) or voluntary
Coverage Comprehensive (covers the whole country; or region for sub-
national systems) or samples in a country or region (e.g.
sentinels)
Case definitions Information that, for the system in place, describes a positive
case or diagnosis of Lyme disease such that it is notifiable
according to the definition of Lyme disease in the country:
Erythema migrans (EM; clinical signs only, or confirmed with a
laboratory test), neuroborreliosis (NB) and other late or
disseminated conditions (e.g. Lyme carditis and arthritis). In
systems where case definitions include options according to
the level of confidence in the diagnosis (e.g. probable,
confirmed), the definition for confirmed cases was extracted.
Number of consultations (e.g. for EM or tick bites)
Positive lab tests alone
Body responsible for
maintaining and
reporting the data
Name in original language
Main surveillance
report
Title, reference and the most recent year for which annual data
is available. We focused on yearly reports on Lyme disease. If not
available, yearly general surveillance reports that include data on
Lyme disease, monthly reports or data portals allowing user-
defined queries were used.
Surveillance
laws/regulations
Name and reference to laws or regulations governing surveillance
of Lyme disease
8.5.3 Systematic review of comparative studies of Lyme disease incidence
We assessed quality using a tool based on the QATSO tool developed by Wong et al.
(2008), with some modifications to suit the specific purpose of this review. The full tool is
set out in Appendix 5. As our overall aim was to estimate the extent of under-reporting in
surveillance data, the main purpose of the tool was to establish how far the comparison
reported in the study could be reliably used to do this. Where there are discrepancies
between the different data sources in a study, this is likely to bias the findings and make
the study less useful for answering our review question.
We extracted data on: the data sources used; the findings from the different data sources;
any comparative data on demographics, seasonality and trends over time; and the study
authors’ conclusions or explanations of the findings. All quality assessment and data
extraction were conducted by a single reviewer and checked in detail by a second
reviewer. The full results are included in Appendices 6 and 7.
INCIDENCE AND SURVEILLANCE OF LYME DISEASE: SYSTEMATIC REVIEW AND POLICY MAPPING
40
8.6 Synthesis methods
8.6.1 Systematic review of UK Lyme disease incidence data
For the routine data, synthesis focused on calculating incidence rates from available data,
by dividing the number of cases reported by the surveillance agencies by ONS population
estimates (Office for National Statistics, 2017), and presenting trends over time. For the
research studies, a descriptive narrative synthesis was undertaken.
8.6.2 Map of international Lyme disease surveillance systems and policies
Data synthesis involved the collation of descriptive statistics about the most salient
differences between national systems and policies and the description of a limited number
of systems in greater detail to provide examples of different policies utilised
internationally.
8.6.3 Systematic review of comparative studies of Lyme disease incidence
A descriptive narrative synthesis was undertaken, with studies separated into high-quality
and low-quality. We calculated reporting multipliers by dividing the total number of cases
in the comparison source by the number of cases reported in the surveillance source;
where both ‘raw’ numbers and model results were presented, multipliers were calculated
for both.
8.7 Quality assurance
8.7.1 Systematic review of UK Lyme disease incidence data
For the systematic review, screening was carried out by a single reviewer. All data were
extracted by a single reviewer and checked in detail by a second reviewer.
8.7.2 Map of international Lyme disease surveillance systems and policies
Data for each country were extracted by one reviewer and checked in detail by a second
reviewer. Disagreements were discussed and, if required, a third reviewer was consulted.
8.7.3 Systematic review of comparative studies of Lyme disease incidence
All studies were screened by two reviewers independently and differences resolved by
discussion. All data were extracted by a single reviewer and checked in detail by a second.
8.8 Consultation on key findings with patient advocacy groups
In October 2017, following the completion of our analyses, we shared the key findings with
eight patient stakeholder groups. The findings were presented as a series of bullet points
via an online survey and stakeholder groups were invited to comment. We requested that
each group provide a single collated response for their group. As one group was unable to
meet this request we had a member of the research team who was not involved in writing
up the consultation findings collate the response for this group. The collated responses for
each group were then assessed to check whether the key findings resonated or not with
patient groups’ own experiences.
Prior to sharing findings, we conducted a series of face-to-face consultations with the
advocacy groups in July 2017 for our review on experiences of diagnosis; for further details

INCIDENCE AND SURVEILLANCE OF LYME DISEASE: SYSTEMATIC REVIEW AND POLICY MAPPING
41
on the methods for these consultations see Brunton et al. (2017). Whilst we did not
directly ask participants to comment on incidence and surveillance issues during the face-
to-face consultations, several participants did raise issues relating to UK incidence.
Comments relating to Lyme disease incidence and surveillance from both of these consultation exercises are reported in chapter 6.
INCIDENCE AND SURVEILLANCE OF LYME DISEASE: SYSTEMATIC REVIEW AND POLICY MAPPING
42
9. References
Bingham, P. M., Galetta, S. L., Athreya, B. & Sladky, J. (1995). Neurologic Manifestations
in Children With Lyme Disease. Pediatrics, 96, 1053-1056.
Bleyenheuft, C., Lernout, T., Berger, N., Rebolledo, J., Leroy, M., Robert, A. & Quoilin, S.
(2015). Epidemiological situation of Lyme borreliosis in Belgium, 2003 to 2012. Archives of
Public Health, 73, 33.
Bochničková, M., Szilágyiová, M. & Gardlík, R. (2012). Lyme borreliosis - Epidemiological
analysis of incidence in the northern region of Slovakia. Epidemiologie, mikrobiologie,
imunologie, 61, 3-8.
Boltri, J. M., Hash, R. B. & Vogel, R. L. (2002). Patterns of Lyme disease diagnosis and
treatment by family physicians in a southeastern state. Journal of Community Health, 27,
395-402.
Braks, M., Van Der Giessen, J., Kretzschmar, M., Van Pelt, W., Scholte, E.-J., Reusken, C.,
Zeller, H., Van Bortel, W. & Sprong, H. (2011). Towards an integrated approach in
surveillance of vector-borne diseases in Europe. Parasites & Vectors, 4, 192.
Centers for Disease Control and Prevention. (2008). Effect of electronic laboratory
reporting on the burden of Lyme disease surveillance - New Jersey, 2001-2006. MMWR -
Morbidity & Mortality Weekly Report, 57, 42-45.
Centers for Disease Control and Prevention. (2016). Reported cases of Lyme disease by
state or locality, 2005-2015 [Online]. Available:
https://www.cdc.gov/lyme/stats/tables.html [Accessed].
Christen, H.-J., Hanefeld, F., Eiffert, H. & Thomssen, R. (1993). Epidemiology and Clinical
Manifestations of Lyme Borreliosis in Childhood. A prospective multicentre study with
special regard to neuroborreliosis. Acta Pædiatrica, 82, 1-76.
Clayton, J. L., Jones, S. G., Dunn, J. R., Schaffner, W. & Jones, T. F. (2015). Enhancing
Lyme Disease surveillance by using administrative claims data, Tennessee, USA. Emerging
Infectious Diseases, 21, 1632-1634.
Cooper, L., Branagan-Harris, M., Tuson, R. & Nduka, C. (2017). Lyme disease and Bell's
palsy: An epidemiological study of diagnosis and risk in England. British Journal of General
Practice, 67, e329-e335.
Correa, A., Hinton, W., McGovern, A., Van Vlymen, J., Yonova, I., Jones, S. & De
Lusignan, S. (2016). Royal College of General Practitioners Research and Surveillance
Centre (RCGP RSC) sentinel network: a cohort profile. BMJ Open, 6.
Dessau, R. B., Espenhain, L., Molbak, K., Krause, T. G. & Voldstedlund, M. (2015).
Improving national surveillance of Lyme neuroborreliosis in Denmark through electronic
reporting of specific antibody index testing from 2010 to 2012. EuroSurveillance, 20,
21184.

INCIDENCE AND SURVEILLANCE OF LYME DISEASE: SYSTEMATIC REVIEW AND POLICY MAPPING
43
Dryden, M. S., Saeed, K., Ogborn, S. & Swales, P. (2015). Lyme borreliosis in southern
United Kingdom and a case for a new syndrome, chronic arthropod-borne neuropathy.
Epidemiology & Infection, 143, 561-572.
Ertel, S. H., Nelson, R. S. & Cartter, M. L. (2012). Effect of surveillance method on
reported characteristics of Lyme disease, Connecticut, 1996-2007. Emerging Infectious
Diseases, 18, 242-247.
German, R. R., Lee, L., Horan, J., Milstein, R., Pertowski, C. & Waller, M. (2001). Updated
guidelines for evaluating public health surveillance systems. MMWR Recommendations and
Reports, 50, 1-35.
Gibbons, C. L., Mangen, M.-J. J., Plass, D., Havelaar, A. H., Brooke, R. J., Kramarz, P.,
Peterson, K. L., Stuurman, A. L., Cassini, A., Fèvre, E. M. & Kretzschmar, M. E. E. (2014).
Measuring underreporting and under-ascertainment in infectious disease datasets: a
comparison of methods. BMC Public Health, 14, 147-147.
Henry, B., Roth, D., Reilly, R., Macdougall, L., Mak, S., Li, M. & Muhamad, M. (2011). How
big is the Lyme problem? Using novel methods to estimate the true number of Lyme
disease cases in British Columbia residents from 1997 to 2008. Vector Borne & Zoonotic
Diseases, 11, 863-868.
Ho-Yen, D., Mavin, S. & Hopkins, P. (2008). Lyme borreliosis: differences between the
patients who are tested and those with the infection. HPS Weekly Report, 42, 441-3.
Jones, S. G., Conner, W., Song, B., Gordon, D. & Jayakaran, A. (2012). Comparing spatio-
temporal clusters of arthropod-borne infections using administrative medical claims and
state reported surveillance data. Spatial and Spatio-Temporal Epidemiology, 3, 205-213.
Jones, S. G., Coulter, S. & Conner, W. (2013). Using administrative medical claims data to
supplement state disease registry systems for reporting zoonotic infections. Journal of the
American Medical Informatics Association, 20, 193-198.
Lashley, D., Darsh, G., Auckland, C. & Gutowski, N. (2014). Neuroborelliosis in South West
England. Journal of Neurology, Neurosurgery and Psychiatry, 85 (10), A7.
Lawrence, J. & Jones, J. 2007. Foreign travel associated illness, England, Wales and
Northern Ireland: 2007 report, London, Health Protection Agency.
Lovett, J. K., Evans, P. H., O'connell, S. & Gutowski, N. J. (2008). Neuroborreliosis in the
South West of England. Epidemiology and Infection, 136, 1707-1711.
Macdonald, E., Vestrheim, D. F., White, R. A., Konsmo, K., Lange, H., Aase, A., Nygård,
K., Stefanoff, P., Aaberge, I. & Vold, L. (2016). Are the current notification criteria for
Lyme borreliosis in Norway suitable? Results of an evaluation of Lyme borreliosis
surveillance in Norway, 1995-2013. BMC Public Health, 16, 729.
Mavin, S., Hopkins, P. C., Maclennan, A., Joss, A. W. & Ho-Yen, D. O. (2009). Urban and
rural risks of Lyme disease in the Scottish Highlands. Scottish Medical Journal, 54, 24-26.
INCIDENCE AND SURVEILLANCE OF LYME DISEASE: SYSTEMATIC REVIEW AND POLICY MAPPING
44
Mavin, S., Watson, E. J. & Evans, R. (2015). Distribution and presentation of Lyme
borreliosis in Scotland - analysis of data from a national testing laboratory. Journal of the
Royal College of Physicians of Edinburgh, 45, 196-200.
Milner, R. M., Mavin, S. & Ho-Yen, D. O. (2009). Lyme borreliosis in Scotland during two
peak periods. Journal of the Royal College of Physicians of Edinburgh, 39, 196-199.
Müller, I., Freitag, M. H., Poggensee, G., Scharnetzky, E., Straube, E., Schoerner, C.,
Hlobil, H., Hagedorn, H. J., Stanek, G., Schubert-Unkmeir, A., Norris, D. E., Gensichen, J.
& Hunfeld, K. P. (2012). Evaluating frequency, diagnostic quality, and cost of Lyme
borreliosis testing in Germany: A retrospective model analysis. Clinical and Developmental
Immunology, 2012, 595427.
Munro, H., Dow, B., Mavin, S. & Ho-Yen, D. (2011). Prevalence of Lyme borreliosis in
Scottish blood donors. Transfusion Medicine, 21, 28.
Munro, H., Mavin, S., Duffy, K., Evans, R. & Jarvis, L. M. (2015). Seroprevalence of lyme
borreliosis in Scottish blood donors. Transfusion Medicine, 25, 284-286.
Naleway, A. L., Belongia, E. A., Kazmierczak, J. J., Greenlee, R. T. & Davis, J. P. (2002).
Lyme disease incidence in Wisconsin: A comparison of state-reported rates and rates from
a population-based cohort. American Journal of Epidemiology, 155, 1120-1127.
National Institute for Health and Care Excellence 2017. Lyme disease: Diagnosis and
management. [A] Evidence review for the awareness of Lyme disease. London: National
Institute for Health and Care Excellence.
Nelson, C. A., Saha, S., Kugeler, K. J., Delorey, M. J., Shankar, M. B., Hinckley, A. F. &
Mead, P. S. (2015). Incidence of clinician-diagnosed Lyme Disease, United States, 2005-
2010. Emerging Infectious Diseases, 21, 1625-1631.
NHS Digital 2016. Hospital Admitted Patient Care Activity, 2015-16: Diagnosis.
Office for National Statistics. (2017). Population Estimates [Online]. Available:
https://www.ons.gov.uk/peoplepopulationandcommunity/populationandmigration/popula
tionestimates [Accessed].
Public Health Agency (NORTHERN IRELAND) 2017. Zoonoses. Belfast: Public Health Agency.
Public Health England. 2013. Guidance: Lyme borreliosis epidemiology and surveillance
[Online]. Available: https://www.gov.uk/government/publications/lyme-borreliosis-
epidemiology/lyme-borreliosis-epidemiology-and-surveillance [Accessed].
Public Health England 2016. Ticks and your health: Information about tick bite risks and
prevention. London: Public Health England.
Public Health England 2017a. Common animal associated infections quarterly report
(England and Wales): Fourth quarter 2016. Health Protection Report: Weekly Report, 11.
Public Health England 2017b. Common animal associated infections quarterly report
(England and Wales): Second quarter 2017. Health Protection Report, 11.

INCIDENCE AND SURVEILLANCE OF LYME DISEASE: SYSTEMATIC REVIEW AND POLICY MAPPING
45
Public Health England 2017c. Zoonoses Report: UK 2015. London: Public Health England.
Rebman, A. W., Aucott, J. N., Weinstein, E.R., Bechtold, K. T., Smith, K. C. & Leonard, L.
(2017). Living in Limbo. Qualitative Health Research, 27, 534-546.
Roberts, M. T. M. & Lever, A. M. L. (2003). An analysis of imported infections over a 5-year
period at a teaching hospital in the United Kingdom. Travel Medicine and Infectious
Disease, 1, 227-230.
Robinson, S. (2014). Lyme Disease in Maine: A comparison of NEDSS surveillance data and
Maine Health Data Organization hospital discharge data. Online Journal of Public Health
Informatics, 5, 231.
Schiffman, E. K., McLaughlin, C., Ray, J. A., Kemperman, M. M., Hinckley, A. F.,
Friedlander, H. G. & Neitzel, D. F. (2016). Underreporting of Lyme and other tick-borne
diseases in residents of a high-incidence County, Minnesota, 2009. Zoonoses & Public
Health.
Slack, G. S., Mavin, S., Yirrell, D. & Ho-Yen, D. O. (2011). Is Tayside becoming a Scottish
hotspot for Lyme borreliosis? Journal of the Royal College of Physicians of Edinburgh, 41,
5-8.
Stanek, G., Fingerle, V., Hunfeld, K. P., Jaulhac, B., Kaiser, R., Krause, A., Kristoferitsch,
W., O’Connell, S., Ornstein, K., Strle, F. & Gray, J. (2011). Lyme borreliosis: Clinical case
definitions for diagnosis and management in Europe. Clinical Microbiology and Infection,
17, 69-79.
Stanek, G. & Strle, F. (2003). Lyme borreliosis. The Lancet, 362, 1639-1647.
Stanek, G., Wormser, G. P., Gray, J. & Strle, F. (2012). Lyme borreliosis. The Lancet, 379,
461-473.
Stokes, G., Blanchard, L., Dickson, K., Burchett, H., Brunton, G., Richardson, M., Jones-
Diette, J., Lorenc, T., Khatwa, M., Hinds, K., Walker, R. & Sutcliffe, K. (2017). Research
on Lyme disease in humans: A systematic evidence map. London: Department of Health
Reviews Facility.
Tseng, Y. J., Cami, A., Goldmann, D. A., Demaria, A. & Mandl, K. D. (2015). Using nation-
wide health insurance claims data to augment Lyme Disease surveillance. Vector Borne &
Zoonotic Diseases, 15, 591-596.
Van Den Wijngaard, C. C., Hofhuis, A., Simões, M., Rood, E., Van Pelt, W., Zeller, H. &
Van Bortel, W. (2017). Surveillance perspective on Lyme borreliosis across the European
Union and European Economic Area. Euro Surveillance, 22, 30569.
Wong, W. C., Cheung, C. S. & Hart, G. J. (2008). Development of a quality assessment tool
for systematic reviews of observational studies (QATSO) of HIV prevalence in men having
sex with men and associated risk behaviours. Emerging Themes in Epidemiology, 5, 23.

INCIDENCE AND SURVEILLANCE OF LYME DISEASE: SYSTEMATIC REVIEW AND POLICY MAPPING
46
Wormser, G. P., Dattwyler, R. J., Shapiro, E. D., Halperin, J. J., Steere, A. C., Klempner,
M. S., Krause, P. J., Bakken, J. S., Strle, F., Stanek, G., Bockenstedt, L., Fish, D., Dumler,
J. S. & Nadelman, R. B. (2006). The Clinical Assessment, Treatment, and Prevention of
Lyme Disease, Human Granulocytic Anaplasmosis, and Babesiosis: Clinical Practice
Guidelines by the Infectious Diseases Society of America. Clinical Infectious Diseases, 43,
1089-1134.

INCIDENCE AND SURVEILLANCE OF LYME DISEASE: SYSTEMATIC REVIEW AND POLICY MAPPING
47
Appendices
Appendix 1: Example search strategy
MEDLINE (via Ovid) search strategy
1 exp Lyme Disease/ (9589)
2 (lyme or lymes or lyme's).ti,ab. (9797)
3 borreliosis.ti,ab. (3230)
4 neuroborreliosis.ti,ab. (1024)
5 (borrelia$ adj2 arthritis).ti,ab. (38)
6 (erythema adj2 migrans).ti,ab. (1471)
7 1 or 2 or 3 or 4 or 5 or 6 (12593)
8 exp Borrelia burgdorferi Group/ (6501)
9 (borrelia adj (burgdorferi or afzelii or garinii)).ti,ab. (7347)
10 (b adj (burgdorferi or afzelii or garinii)).ti,ab. (4289)
11 8 or 9 or 10 (8983)
12 7 or 11 (14245)
13 exp animals/ not humans/ (4279323)
14 12 not 13 (11450)

INCIDENCE AND SURVEILLANCE OF LYME DISEASE: SYSTEMATIC REVIEW AND POLICY MAPPING
48
Appendix 2: Flow of literature through the review
Full reports not available:
N = 29
Excluded on full report
N = 6,426
Exclusion 1: 3,960
Exclusion 2: 190
Exclusion 3: 1,249
Exclusion 4: 94
Exclusion 5: 166
Exclusion 6: 731
Exclusion 7: 36
Criteria on which reports
were excluded (abstract)
Exclusion 1 - Date:
Published before 1980
Exclusion 2 – Focus: Not
Lyme, borrelia, borreliosis
Exclusion 3 – Evidence: Not
empirical evidence
Exclusion 4 – Population:
Not humans
Exclusion 5 – Biological
mechanism/markers
Records removed:
N = 31,094
Duplicates: N = 29,561
Year and publication types: N = 1,533
Criteria on which reports
were excluded (full text)
Exclusion 1 - Date:
Published before 2002
Exclusion 2 – Focus: Not
Lyme, borrelia, borreliosis
Exclusion 3 – Evidence: Not
empirical evidence
Exclusion 4 – Population:
Not humans
Exclusion 5 – Biological
mechanisms/markers
Exclusion 6 – Language:
Not in English
Exclusion 7 – Registrations
of trials
Exclusion 8 – Case Reports
Total records
N = 52,268
Full reports included in descriptive map
N = 1,098
Excluded on abstract
N = 13,621
Exc 1: 84
Exc 2: 2,462
Exc 3: 4,289
Exc 4: 4,216
Exc 5: 2,504
Duplicates: 66
Total records screened
N = 21,174
Full reports retrieved and screened
N = 7,553
Incidence / prevalence studies
N=189
UK studies
N = 11
Comparative studies
N = 16

INCIDENCE AND SURVEILLANCE OF LYME DISEASE: SYSTEMATIC REVIEW AND POLICY MAPPING
49
Appendix 3: Further details of UK studies
Table 9: UK incidence studies based on surveillance data (N=5)
Reference Country (area) Data years Dimension
analysed
Findings
Ho-Yen et
al. (2008)
Scotland 2004-2006 Gender Male 55% cases (p<0.01)
Age Highest rate 60-64 years
Disease stage 75% possible early Lyme disease
20% possible late Lyme disease
4% no data
Area Scotland 2.08 per 100,000
Highlands 28.0 per 100,000
Lawrence
and Jones
(2007)
England, Wales, NI 2002-2005 Seasonality Third quarter 45%-70% cases
2005 Clinical
presentation
Tick bites / exposure 55% cases
Erythema migrans (EM) 42% cases
Neuroborreliosis 10% cases
Arthritis 1% cases
2002-2005 Travel- vs UK-
acquired
Foreign travel-associated 12%-21% cases
Scotland (Highlands) 2004-2006 Urban v rural Urban (incl. small towns) 5.1% positive test; rural 7.1%
(p<0.0001)

INCIDENCE AND SURVEILLANCE OF LYME DISEASE: SYSTEMATIC REVIEW AND POLICY MAPPING
50
Mavin et al.
(2009)
Highest rates in category 7 (remote rural areas) and
category 3 (settlements of 10,000 to 125,000 people)
Distance from
woodland
Higher risk with residence near woodland (141% of general
population if ≤700m, 174% if ≤200m)
Mavin et al.
(2015)
Scotland 2008-2013 Gender Male 55% cases
Age Highest rate 50-54 years
Area Ayrshire & Arran 1.9 per 100,000 annual incidence
Tayside 9.2
Dumfries & Galloway 6.3
Lothian 3.3
Fife 2.1
Greater Glasgow & Clyde 4.5
Highland 44.1
Lanarkshire 1.7
Borders 3.1
Western Isles 13.8
Clinical
presentation
EM 48% cases
Tick bite recalled 61% cases
Joint symptoms 25% cases
Neurological symptoms 15% cases
Cardiac symptoms 1% cases
Milner et
al. (2009)
Scotland 2007-2008 Gender Male 53.7% cases
Age Highest rates 40-44 and 50-54 years

INCIDENCE AND SURVEILLANCE OF LYME DISEASE: SYSTEMATIC REVIEW AND POLICY MAPPING
51
Area All Scotland 5.9 per 100,000
Highlands 43.4 per 100,000
Disease stage early Lyme disease 83.9% cases
Clinical
presentation
EM 57.1% cases
Arthritis 21.7% cases
Neurological symptoms 7.5% cases
Cardiac symptoms 25% cases
Table 10: UK incidence studies reporting new data (N=6)
Reference Data collected from Case
definition
Geographical
area
Years Overall
incidence
in study
(annual,
per
100,000)
Comparison
incidence
from
routine
data
(annual,
per
100,000)
Other findings
Dryden et
al. (2015)
Hospital laboratory;
programme of
awareness-raising
among GPs
Laboratory
confirmed
Hampshire 1992-
2012
9.68 1.7
(England,
2011)
508 cases over 10 years; rise
to peak of 18.4 in 2009,
then stabilised at ~14-16 in
2010-12
47% cases male
Highest rate 50-59 years
Tick bite recalled 38% cases
Acquired abroad 5.1% cases

INCIDENCE AND SURVEILLANCE OF LYME DISEASE: SYSTEMATIC REVIEW AND POLICY MAPPING
52
Lashley et
al. (2014)
Hospital laboratory /
hospital records
Laboratory
confirmed /
hospitalisations
Devon 2006-
2011
NR 1.5
(England)
206 positive laboratory tests
over study period
21 attended hospital (of
whom 72% had neurological
symptoms)
Hospitalisations similar rate
to 2000-2005
Lovett et
al. (2008)
Hospital laboratory Laboratory
confirmed
Devon 2000-
2004
NR 0.38-1.46
(England +
Wales)
98 of 2,825 confirmed cases
over study period
Male 58% cases
Tick bite recalled 64% cases
EM 65% cases
Arthralgia / myalgia 27%
cases
Arthritis 0% cases
Carditis 0% cases
Munro et
al. (2011);
Munro et
al. (2015)
Blood donations
(random stratified
sample)
Seropositivity
only
Scotland 2010-
2011
NR NR 4.2% seropositive (IgG
Western blot)
4.0% male, 4.4% female (ns)
3.7% urban, 5.5% rural (ns)
Highest rates 36-45 years
(ns)
8.6% in Inverness postcode
area, 6.1% Perth, 4.8%
Glasgow, 4.3% Outer
Hebrides, 4.2% Paisley, 3.6%
Aberdeen, 3.6% Dundee, 0
Dumfries, Falkirk,
Kilmarnock, Kirkwall,

INCIDENCE AND SURVEILLANCE OF LYME DISEASE: SYSTEMATIC REVIEW AND POLICY MAPPING
53
Motherwell, Galashiels and
Lerwick
Roberts
and Lever
(2003)
Hospital records; only
travel-related cases
Clinical Cambridge 1998-
2002
NR NR 2 cases over 5 years
Slack et
al. (2011)
Hospital laboratory Laboratory
confirmed
Tayside 2001-
2010
(2006-
2010 for
demo-
graphics)
2.57 (2001-
2002)
16.76
(2009-2010)
25.43
(2006-2007,
Highland)
56.35
(2009-2010,
Highland)
0.78 (2005-
2006,
Scotland)
5.53 (2009-
2010,
Scotland)
Male 50%-57% cases
Most cases ‘working age’
Early Lyme disease 57%-83%
cases

INCIDENCE AND SURVEILLANCE OF LYME DISEASE: SYSTEMATIC REVIEW AND POLICY MAPPING
54
Appendix 4: Further details for the map of surveillance policies
Table 11: Surveillance bodies and reports
Country Body/ies responsible for maintaining /
collating surveillance data (original
language)
Title of main surveillance
report or data source
(original language)
URL / reference for most recent report
UK - England/Wales Public Health England
Zoonoses Report UK https://www.gov.uk/government/uploads/system
/uploads/attachment_data/file/621094/UK_Zoono
ses_report_2015.pdf
UK - Scotland Health Protection Scotland “ “
UK - Northern
Ireland
Public Health Agency Northern Ireland “
“
Austria None N/A
Belgium Wetenschappelijk Instituut
Volskgezondheid / Institut Scientifique
de Santé Publique
Zoonoses et maladies à
transmission vectorielle
https://epidemio.wiv-
isp.be/ID/reports/Zoonoses%20et%20maladies%20%
c3%a0%20transmission%20vectorielle.%20Synth%c3
%a8se%20annuelle%202015.pdf
Bulgaria Националният център по заразни и
паразитни болести
N/A http://www.ncipd.org/index.php?option=com_biul
etin&view=view&month=31&year=2017&lang=en
Croatia Službe za epidemiologiju Hrvatskog
zavoda za javno zdravstvo
Zarazne bolesti u Hrvatskoj https://www.hzjz.hr/novosti/hrvatski-
zdravstveno-statisticki-ljetopis-za-2016-tablicni-
podaci/
Cyprus None N/A
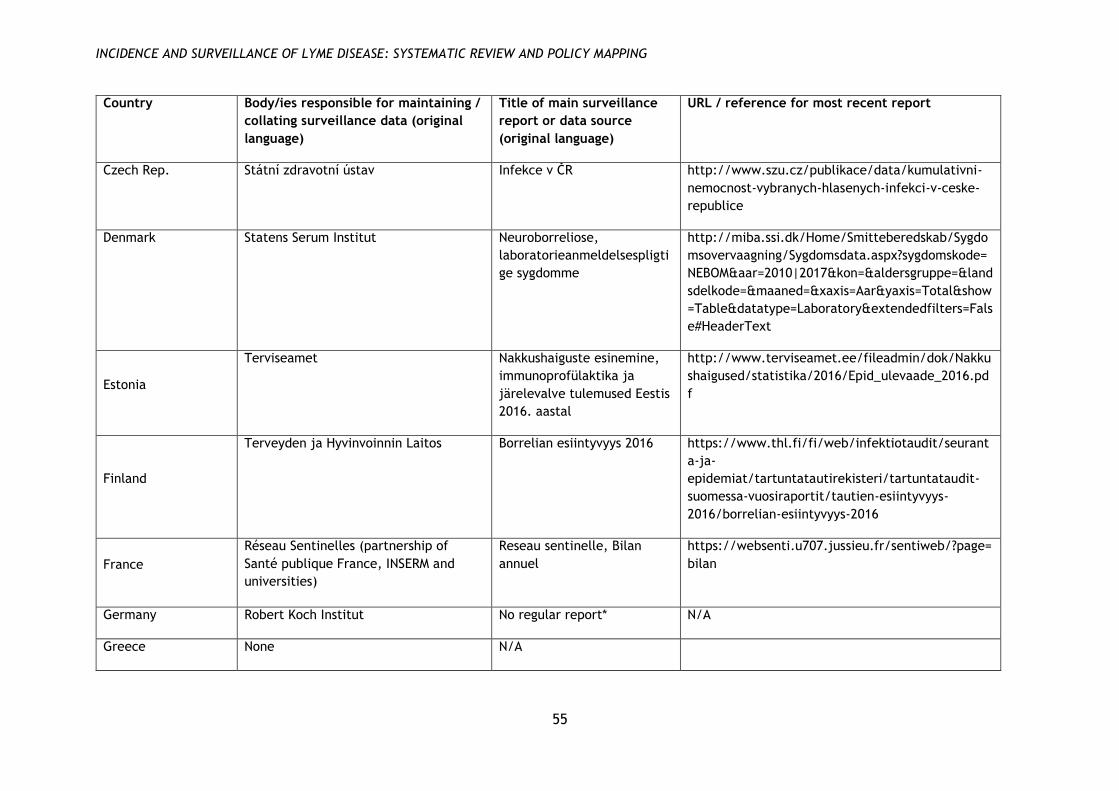
INCIDENCE AND SURVEILLANCE OF LYME DISEASE: SYSTEMATIC REVIEW AND POLICY MAPPING
55
Country Body/ies responsible for maintaining /
collating surveillance data (original
language)
Title of main surveillance
report or data source
(original language)
URL / reference for most recent report
Czech Rep. Státní zdravotní ústav Infekce v ČR http://www.szu.cz/publikace/data/kumulativni-
nemocnost-vybranych-hlasenych-infekci-v-ceske-
republice
Denmark Statens Serum Institut Neuroborreliose,
laboratorieanmeldelsespligti
ge sygdomme
http://miba.ssi.dk/Home/Smitteberedskab/Sygdo
msovervaagning/Sygdomsdata.aspx?sygdomskode=
NEBOM&aar=2010|2017&kon=&aldersgruppe=&land
sdelkode=&maaned=&xaxis=Aar&yaxis=Total&show
=Table&datatype=Laboratory&extendedfilters=Fals
e#HeaderText
Estonia
Terviseamet Nakkushaiguste esinemine,
immunoprofülaktika ja
järelevalve tulemused Eestis
2016. aastal
http://www.terviseamet.ee/fileadmin/dok/Nakku
shaigused/statistika/2016/Epid_ulevaade_2016.pd
f
Finland
Terveyden ja Hyvinvoinnin Laitos Borrelian esiintyvyys 2016
https://www.thl.fi/fi/web/infektiotaudit/seurant
a-ja-
epidemiat/tartuntatautirekisteri/tartuntataudit-
suomessa-vuosiraportit/tautien-esiintyvyys-
2016/borrelian-esiintyvyys-2016
France
Réseau Sentinelles (partnership of
Santé publique France, INSERM and
universities)
Reseau sentinelle, Bilan
annuel
https://websenti.u707.jussieu.fr/sentiweb/?page=
bilan
Germany Robert Koch Institut No regular report* N/A
Greece None N/A

INCIDENCE AND SURVEILLANCE OF LYME DISEASE: SYSTEMATIC REVIEW AND POLICY MAPPING
56
Country Body/ies responsible for maintaining /
collating surveillance data (original
language)
Title of main surveillance
report or data source
(original language)
URL / reference for most recent report
Hungary
Állami Népegészségügyi és Tisztiorvosi
Szolgálat
OEK, Bejelentett fertőző
megbetegedések
Magyarországon
http://www.oek.hu/oek.web?to=,2475,2465&nid=
509&pid=1&lang=hun
Ireland (Rep) Health Protection Surveillance Centre HPSC Annual Epidemiological
Report
http://www.hpsc.ie/abouthpsc/annualreports/
Italy None N/A
Latvia
Slimību profilakses un kontroles centrs Pārskats Par Atsevišķām
Infekcijas Un Parazitārajām
Slimībām 2016. Gadā
https://spkc.gov.lv/upload/Infekcijas_lim_statisti
ka/Statistikas%20parskati/statistikas_parskats_par
_2016_gadu.pdf
Lithuania Užkrečiamųjų ligų ir AIDS centro Užregistruotų susirgimų
skaičius iš viso
http://www.ulac.lt/uploads/downloads/Ataskaito
s/2016/forma4_pagal_16ligu_2016.pdf
Luxembourg
Direction de la Santé Système des maladies à
déclaration obligatoire:
Bulletin mensuel
http://www.sante.public.lu/fr/publications/b/bul
letin-maladies-transmissibles-2011-07-05/bulletin-
maladies-transmissibles-2011-07-05.pdf
Malta None N/A N/A
Netherlands Rijksinstituut voor Volksgezondheid en
Milieu
No regular report* N/A
Norway
Folkehelseinstituttet Meldingssystem for
smittsomme sykdommer
(web portal)
www.msis.no
Poland Narodowy Instytut Zdrowia Publicznego
– Państwowy Zakład Higieny
Choroby zakaźne i zatrucia
w Polsce
http://wwwold.pzh.gov.pl/oldpage/epimeld/2016
/Ch_2016.pdf

INCIDENCE AND SURVEILLANCE OF LYME DISEASE: SYSTEMATIC REVIEW AND POLICY MAPPING
57
Country Body/ies responsible for maintaining /
collating surveillance data (original
language)
Title of main surveillance
report or data source
(original language)
URL / reference for most recent report
Portugal
Instituto Nacional de Saúde Doenças de Declaração
Obrigatória, 2011-2014
https://www.dgs.pt/estatisticas-de-
saude/estatisticas-de-saude/publicacoes/doencas-
de-declaracao-obrigatoria-2011-2014-volume-i-
pdf.aspx
Romania
Centrul National de Supraveghere si
Control al Bolilor Transmisibile,
Institutul National de Sanatate Publica
Analiza epidemiologica
descriptiva a cazurilor de
Boala Lyme intrate in
sistemul national de
supraveghere
http://cnscbt.ro/index.php/analiza-date-
supraveghere/boala-lyme-1/659-boala-lyme-2016-
analiza/file
Slovakia Úrad verejného zdravotníctva
Slovenskej republiky
Analýza epidemiologickej
situácie a činnosti odborov
epidemiológie v Slovenskej
Republike
http://www.epis.sk/InformacnaCast/Publikacie/V
yrocneSpravy.aspx
Slovenia Nacionalni inštitut za javno zdravje Epidemiološko spremljanje
nalezljivih bolezni v
Sloveniji
http://www.nijz.si/sites/www.nijz.si/files/datote
ke/epidemiolosko_spremljanje_nb_v_letu_2015.pd
f
Spain Ministerio de Sanidad, Servicios Sociales
e Igualdad
Informe anual del Sistema
de Información
Microbiológica 2015
http://gesdoc.isciii.es/gesdoccontroller?action=do
wnload&id=31/03/2017-766cfe4967
Sweden None N/A

INCIDENCE AND SURVEILLANCE OF LYME DISEASE: SYSTEMATIC REVIEW AND POLICY MAPPING
58
Country Body/ies responsible for maintaining /
collating surveillance data (original
language)
Title of main surveillance
report or data source
(original language)
URL / reference for most recent report
Switzerland
Office fédéral de santé publique /
Bundesamt für Gesundheit / Ufficio
federale della sanità pubblica
Maladies transmises par les
tiques – Situation en Suisse
https://www.bag.admin.ch/bag/fr/home/themen
/mensch-gesundheit/uebertragbare-
krankheiten/ausbrueche-epidemien-
pandemien/aktuelle-ausbrueche-
epidemien/zeckenuebertragene-krankheiten.html
USA Centers for Disease Control and
Prevention
Summary of Notifiable
Infectious Diseases and
Conditions — United States
https://www.cdc.gov/mmwr/mmwr_nd/index.ht
ml
Canada Public Health
Agency of Canada
Surveillance of Lyme disease
https://www.canada.ca/en/public-
health/services/diseases/lyme-
disease/surveillance-lyme-disease.html
* For countries without a regular report, the following data sources are available:
Germany (Bayern): Meldepflicht für Lyme-Borreliose in Bayern – eine erste Bilanz, in Epidemiologisches Bulletin 8/2015, available at:
http://www.rki.de/DE/Content/Infekt/EpidBull/Archiv/2015/Ausgaben/08_15.pdf
Germany (eastern Länder): Wilking H, Stark K. Trends in surveillance data of human Lyme borreliosis from six federal states in eastern
Germany, 2009–2012. Ticks and Tick-Borne Diseases 5(3):219-224
Netherlands: Hofhuis A et al. Decrease in tick bite consultations and stabilization of early Lyme borreliosis in the Netherlands in 2014 after
15 years of continuous increase. BMC Public Health 16(425).

INCIDENCE AND SURVEILLANCE OF LYME DISEASE: SYSTEMATIC REVIEW AND POLICY MAPPING
59
Table 12: Laws and regulations on surveillance and case definitions
Country Laws / regulations relating to
surveillance
URL / reference Case definition (summary)
UK - England/Wales Health Protection (Notification)
Regulations 2010
http://www.legislation.gov.uk/uksi/2010/6
59/contents/made
Lab test
UK - Scotland Public Health etc. (Scotland) Act
2008
http://www.legislation.gov.uk/asp/2008/5/
pdfs/asp_20080005_en.pdf
Lab test
UK - Northern Ireland N/A N/A Lab test
Austria N/A N/A N/A
Belgium N/A N/A [For clinical system] Unclear
Bulgaria Ordinance 21 / 18th July 2005 http://www.mh.government.bg/media/filer
_public/2015/04/17/naredba-21-ot-2005g-
spisak-zarazni-bolesti-red-registratsia.pdf
[Confirmed case] (EM or late
manifestation) + lab test
Cyprus N/A N/A N/A
Czech Rep. Law on Epidemiological
surveillance 473/2008
https://www.zakonyprolidi.cz/cs/2008-473 (EM or disseminated LD) + lab test +
exposure
Croatia Law 79/2007 on protection from
infectious diseases
http://narodne-
novine.nn.hr/clanci/sluzbeni/2007_07_79_2
486.html
[Confirmed case] (EM or late) + lab test
Denmark Executive Order on Medical Review
of Infectious Diseases (no. 2777 of
14 April 2000)
https://www.retsinformation.dk/Forms/R07
10.aspx?id=21406
[For clinical system] Neuroborreliosis +
lab test

INCIDENCE AND SURVEILLANCE OF LYME DISEASE: SYSTEMATIC REVIEW AND POLICY MAPPING
60
Country Laws / regulations relating to
surveillance
URL / reference Case definition (summary)
Estonia
Communicable Diseases Prevention
and Control Act (RT I 2003, 26,
160)
https://www.riigiteataja.ee/akt/104122015
003
EM + lab test
Finland N/A N/A Lab test
France N/A N/A EM or (other symptoms + lab test)
Germany
Various at region (Bundesland)
level; governed by 2001 Infection
Protection Act
Various EM or (neuroborreliosis + lab test) or
(Lyme arthritis + lab test)
Greece N/A N/A N/A
Hungary Decree 18/1998 (VI.3) on
epidemiological measures
https://net.jogtar.hu/jr/gen/hjegy_doc.cgi
?docid=99800018.nm
[Confirmed case] (EM or
(neuroborreliosis + tick bite)) + lab test
Ireland
Infectious Diseases (Amendment)
Regulations 2016 (S.I. No. 276 of
2016)
http://www.irishstatutebook.ie/eli/2016/si
/276/made/en/print
Neuroborreliosis + lab test
Italy N/A N/A N/A
Latvia
Infectious diseases registration
procedure 1999
https://likumi.lv/doc.php?id=20667
Unclear
Lithuania Communicable Diseases Prevention
and Control Act 1996
https://www.e-
tar.lt/portal/lt/legalAct/TAR.EE245B47423C
Unclear

INCIDENCE AND SURVEILLANCE OF LYME DISEASE: SYSTEMATIC REVIEW AND POLICY MAPPING
61
Country Laws / regulations relating to
surveillance
URL / reference Case definition (summary)
Luxembourg
Grand-ducal ruling of 10 sept 2004
on notification of infectious
diseases
http://www.securite-
alimentaire.public.lu/organisme/administra
tions-
competentes/insa/maladies_trans/reglemen
t_grand_ducal.pdf
EM or neuroborreliosis or (late
symptoms + lab test)
Malta N/A N/A N/A
Netherlands N/A N/A EM
Norway
2003 Regulation on Communicable
Disease
https://lovdata.no/dokument/SF/forskrift/
2003-06-20-740
(Disseminated or late symptoms) + lab
test
Poland
Law on prevention and control of
infectious diseases 2008 nr 234
poz. 1570 (5 December 2008)
http://isap.sejm.gov.pl/DetailsServlet?id=W
DU20082341570
EM or (late + lab test)
Portugal
Decree no. 15385-A / 2016 on
mandatory notification of diseases
https://dre.pt/home/-
/dre/105574339/details/maximized?serie=II
&dreId=105574337
[Confirmed case] (EM or disseminated
or late) + lab test
Romania
Law 589/2007 on the reporting of
communicable diseases
http://legislatie.just.ro/Public/DetaliiDocu
ment/82975
[Confirmed case] (EM or disseminated
or late) + lab test
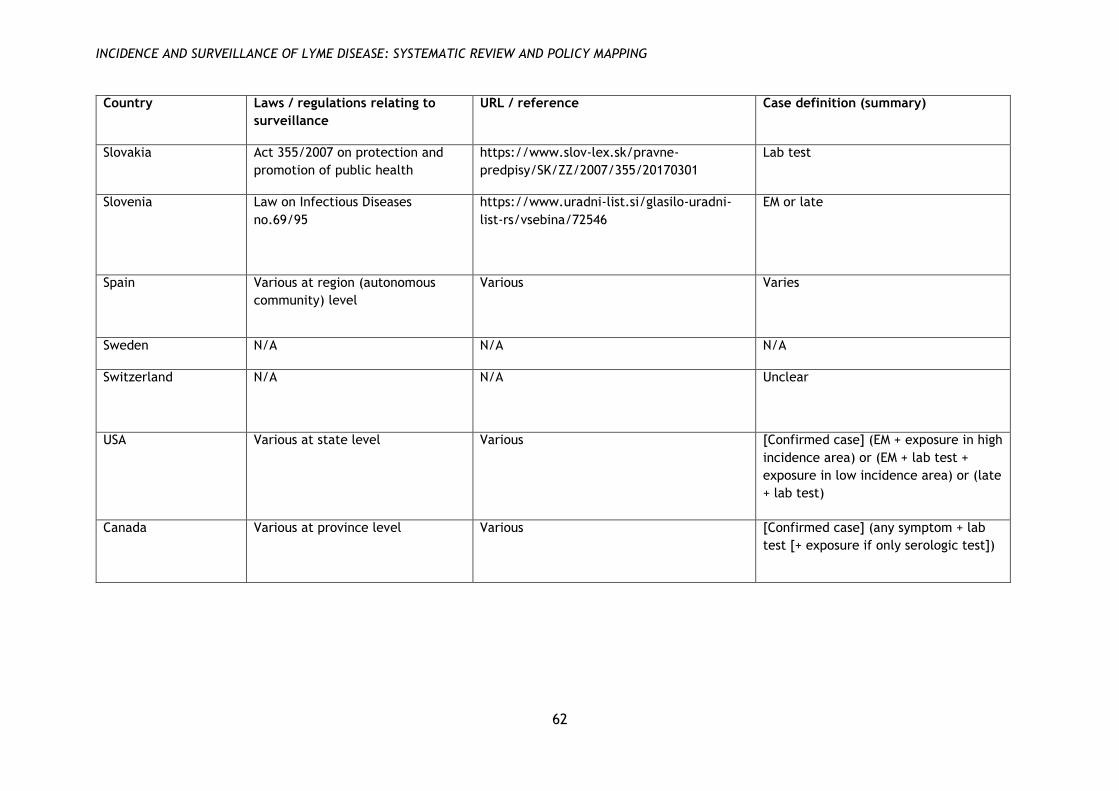
INCIDENCE AND SURVEILLANCE OF LYME DISEASE: SYSTEMATIC REVIEW AND POLICY MAPPING
62
Country Laws / regulations relating to
surveillance
URL / reference Case definition (summary)
Slovakia Act 355/2007 on protection and
promotion of public health
https://www.slov-lex.sk/pravne-
predpisy/SK/ZZ/2007/355/20170301
Lab test
Slovenia Law on Infectious Diseases
no.69/95
https://www.uradni-list.si/glasilo-uradni-
list-rs/vsebina/72546
EM or late
Spain Various at region (autonomous
community) level
Various Varies
Sweden N/A N/A N/A
Switzerland N/A N/A Unclear
USA Various at state level Various [Confirmed case] (EM + exposure in high
incidence area) or (EM + lab test +
exposure in low incidence area) or (late
+ lab test)
Canada Various at province level
Various [Confirmed case] (any symptom + lab
test [+ exposure if only serologic test])

INCIDENCE AND SURVEILLANCE OF LYME DISEASE: SYSTEMATIC REVIEW AND POLICY MAPPING
63
Appendix 5: Quality assessment tool for review of comparative studies
1. Did the two data sources cover the same population?
Yes = 2
No / unclear, but the datasets are similar due to mode of collection (e.g.
both derive from national statutory systems which cover the population as a
whole; or overlap in populations is <100% but is measured and found to be
sufficiently high) = 1
No / unclear = 0
2. Were the data validated or reviewed?
At least one source validated by study authors = 2
No validation by study authors, but all sources had previously been
validated by data collectors (e.g. clinician follow-up) = 1
No / unclear = 0
3. Was the same case definition used for the different sources?
Yes = 2
No, but corroborating information was used to address the discrepancy = 1
No / unclear = 0
4. (If answer to 2 is (b) or (c)) Did the analysis use modelling or capture-recapture
analysis to estimate the rate of under-reporting?
Yes / not applicable (answer to 3 is (a)) = 1
No / unclear = 0
5. Did the analysis report comparisons of general trends in the two sources, e.g.
w.r.t. demographics, seasonality or time trends, with significance tests?
Yes = 1
No = 0

INCIDENCE AND SURVEILLANCE OF LYME DISEASE: SYSTEMATIC REVIEW AND POLICY MAPPING
64
Appendix 6: Quality assessment tables for review of comparative studies
Bleyenheuft
2015
Score Notes
1. Population 1 i) Sentinel laboratory network covering 50% of population
ii) Data from every general hospital in Belgium
Populations are not explicitly compared but both national
statutory datasets. (Authors mention (i) is not geographically
fully representative (p7).)
2. Data
validation
0
3. Case
definition
0 i) Positive laboratory tests
ii) Hospitalisations
4. Analysis 0
5. Comparisons 0 Reported but sig NR
TOTAL 1
Bochničková
2012
Score Notes
1. Population 0 Unclear whether patients using hospital are similar to
population included in surveillance data (e.g. whether they
cover same geographical area, whether patients seek care at
other facilities)
2. Data
validation
0
3. Case
definition
0 Notifiable cases (exact case definition NR) vs hospitalisations
4. Analysis 0
5. Comparisons 0 Reported for one source only (hospital data but not
surveillance data)
TOTAL 0
Boltri 2002 Score Notes
1. Population 1 Questionnaire attempts to sample all family physicians in
study area (Georgia state). Response rate 54.3%
2. Data
validation
0
3. Case
definition
0 Case definition for questionnaire data appears to be broader
as includes clinician-diagnosed cases without serologic
testing
4. Analysis 0
5. Comparisons 0
TOTAL 1
CDC 2008 Score Notes
1. Population 1 Both from surveillance sources but unclear if there was
divergence between populations

INCIDENCE AND SURVEILLANCE OF LYME DISEASE: SYSTEMATIC REVIEW AND POLICY MAPPING
65
2. Data
validation
1 Not by study authors, but cases for both sources were
followed up within surveillance system
3. Case
definition
2 Both used national (US pre-2008) case definition
4. Analysis 0
5. Comparisons 1 Geography, age, season; sig tests reported
TOTAL 5
Clayton 2015 Score Notes
1. Population 0 Insurance dataset covers ≈50% of state population.
Population divergences not discussed by study authors (e.g.
uninsured people).
2. Data
validation
2 Random sample of cases from insurance data source
reviewed by study authors
3. Case
definition
2 Not in original source, but data review carried out using
surveillance case definition
4. Analysis 1
5. Comparisons 0 Reported no sig diff by age and gender, but full data NR
TOTAL 5
Dessau 2015 Score Notes
1. Population 1 i) Cases reported through clinician notification
ii) Cases reported through electronic laboratory reporting
Not explicitly discussed, but both data sources are national
statutory surveillance systems
2. Data
validation
0 All reported cases considered as cases
3. Case
definition
0 i) Neuroborreliosis only
ii) All positive laboratory tests (AI)
Appears to be divergent – authors assume all tests are for
neuroborreliosis but unclear that this assumption is justified
4. Analysis 0
5. Comparisons 1 Gender, age, geography; sig tests and 95% CIs reported
TOTAL 2
Ertel 2012 Score Notes
1. Population 1 i) Cases reported to surveillance system (passive)
ii) Active surveillance network
iii) Enhanced laboratory surveillance
iv) Mandatory laboratory surveillance
Not explicitly discussed, but at least (i), (iii) and (iv) are
statewide statutory surveillance systems (unclear for (ii))
2. Data
validation
1 Not by study authors, but cases for both sources were
followed up within surveillance system
3. Case
definition
2 All sources used standard (US 1996) case definition

INCIDENCE AND SURVEILLANCE OF LYME DISEASE: SYSTEMATIC REVIEW AND POLICY MAPPING
66
4. Analysis 0
5. Comparisons 1 Age, gender, ethnicity; sig tests reported
TOTAL 5
Henry 2011 Score Notes
1. Population 1 i) Cases reported to surveillance system
ii) Laboratory tests (from sole laboratory conducting tests in
state)
iii) Enhanced surveillance database
Not explicitly discussed, but at least (i) and (ii) are from
statewide statutory systems.
2. Data
validation
2 Cases from (ii) reviewed by study authors
3. Case
definition
2 Consistent case definition applied to all cases as part of data
validation
4. Analysis 1 Capture-recapture analysis to estimate unreported cases
over and above combination of all methods
5. Comparisons 0
TOTAL 6
Jones 2012,
2013
Score Notes
1. Population 0 Data from MCO covers ≈50% of state population. Divergences
in population not discussed
2. Data
validation
0
3. Case
definition
1 i) Surveillance data uses standard US case definition
ii) MCO data uses any case with ICD-9 code and ≥3
corroborating events
4. Analysis 1 Generalized linear mixed model
5. Comparisons 0 Sig only reported for cluster analysis (in 2012 paper)
TOTAL 2
MacDonald 2016 Score Notes
1. Population 1 i) Cases reported to surveillance system (clinician and
laboratory)
ii) Medical record data (nationwide; hospitals and specialists
only)
Both sources are from national statutory systems, but
populations not compared explicitly
2. Data
validation
0
3. Case
definition
0 i) Disseminated / chronic LD (excl EM)
ii) Any case with ICD-10 code
Authors recognise that definitions diverge (e.g. (ii) includes
EM only)

INCIDENCE AND SURVEILLANCE OF LYME DISEASE: SYSTEMATIC REVIEW AND POLICY MAPPING
67
4. Analysis 0
5. Comparisons 0 Findings on age mentioned but sig NR
TOTAL 1
Müller 2012 Score Notes
1. Population 0 i) Cases reported to surveillance system
ii) People covered by statutory health insurance company
Authors report some divergences (e.g. (ii) covers more
women than men, p2) but full information NR
2. Data
validation
0
3. Case
definition
1 i) Cases reported to surveillance system
ii) Diagnosis code + serologic test ordered
4. Analysis 0
5. Comparisons 0
TOTAL 1
Naleway 2002 Score Notes
1. Population 1 i) Residents in 8-county area surrounding area (ii)
ii) Residents in 24 zip codes around study clinic (≈95% of
whom utilise the clinic)
2. Data
validation
2 Data from (ii) reviewed and validated by study authors
3. Case
definition
2 National case definition applied as part of data validation
4. Analysis 1
5. Comparisons 1 Gender, age, disease stage; sig reported
TOTAL 7
Nelson 2015 Score Notes
1. Population 0 i) Cases reported to surveillance system
ii) Insurance claims database
Authors mention that (ii) only contains <65-year-olds and
correct for this in analysis, but do not consider other
limitations e.g. uninsured people
2. Data
validation
0
3. Case
definition
1 i) All notifiable cases
ii) Any diagnosis code plus (for outpatients) prescription for
antimicrobial drug recommended for LD treatment (note:
correction factor applied for undercoding, but this is a
generic multiplier and is not based on further analysis of the
data)
4. Analysis 1 Correction factor applied to estimate rates
5. Comparisons 1 Age, gender, geography; sig reported
TOTAL 3

INCIDENCE AND SURVEILLANCE OF LYME DISEASE: SYSTEMATIC REVIEW AND POLICY MAPPING
68
Robinson 2014 Score Notes
1. Population 1 i) Cases reported to surveillance system
ii) Statewide medical records database
Not explicitly discussed but both systems are statewide
statutory systems
2. Data
validation
0
3. Case
definition
0 Clinical data includes any patient with ICD code
4. Analysis 0
5. Comparisons 0 Authors mention sig (for time trend and gender) but full data
NR
TOTAL 1
Schiffman 2016 Score Notes
1. Population 1 i) Cases reported in study county
ii) Medical records for all acute care facilities in study county
(n=51); response rate 92%
Populations not explicitly compared, and unclear if county
residents could seek care elsewhere, but seems sufficiently
similar
2. Data
validation
2 Cases reviewed by study authors
3. Case
definition
2 National case definition applied as part of data validation
4. Analysis 1
5. Comparisons 0
TOTAL 6
Tseng 2015 Score Notes
1. Population 0 i) Cases reported to CDC
ii) Medical insurance claims data
Population divergences not discussed
2. Data
validation
0
3. Case
definition
1 Cases defined for insurance data as recorded diagnosis (ICD-
9) + serologic test ordered + antibiotic treatment ≥14 days
4. Analysis 0
5. Comparisons 0 Only time trends; sig NR
TOTAL 1
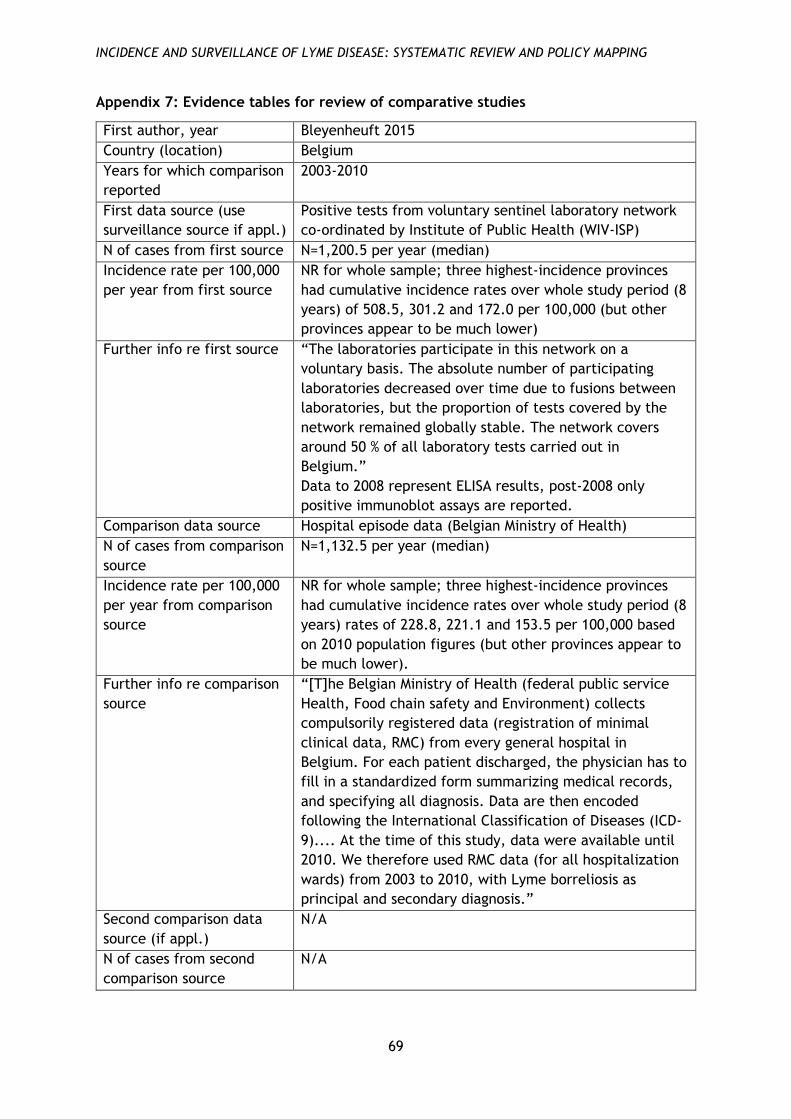
INCIDENCE AND SURVEILLANCE OF LYME DISEASE: SYSTEMATIC REVIEW AND POLICY MAPPING
69
Appendix 7: Evidence tables for review of comparative studies
First author, year Bleyenheuft 2015
Country (location) Belgium
Years for which comparison
reported
2003-2010
First data source (use
surveillance source if appl.)
Positive tests from voluntary sentinel laboratory network
co-ordinated by Institute of Public Health (WIV-ISP)
N of cases from first source N=1,200.5 per year (median)
Incidence rate per 100,000
per year from first source
NR for whole sample; three highest-incidence provinces
had cumulative incidence rates over whole study period (8
years) of 508.5, 301.2 and 172.0 per 100,000 (but other
provinces appear to be much lower)
Further info re first source “The laboratories participate in this network on a
voluntary basis. The absolute number of participating
laboratories decreased over time due to fusions between
laboratories, but the proportion of tests covered by the
network remained globally stable. The network covers
around 50 % of all laboratory tests carried out in
Belgium.”
Data to 2008 represent ELISA results, post-2008 only
positive immunoblot assays are reported.
Comparison data source Hospital episode data (Belgian Ministry of Health)
N of cases from comparison
source
N=1,132.5 per year (median)
Incidence rate per 100,000
per year from comparison
source
NR for whole sample; three highest-incidence provinces
had cumulative incidence rates over whole study period (8
years) rates of 228.8, 221.1 and 153.5 per 100,000 based
on 2010 population figures (but other provinces appear to
be much lower).
Further info re comparison
source
“[T]he Belgian Ministry of Health (federal public service
Health, Food chain safety and Environment) collects
compulsorily registered data (registration of minimal
clinical data, RMC) from every general hospital in
Belgium. For each patient discharged, the physician has to
fill in a standardized form summarizing medical records,
and specifying all diagnosis. Data are then encoded
following the International Classification of Diseases (ICD-
9).... At the time of this study, data were available until
2010. We therefore used RMC data (for all hospitalization
wards) from 2003 to 2010, with Lyme borreliosis as
principal and secondary diagnosis.”
Second comparison data
source (if appl.)
N/A
N of cases from second
comparison source
N/A

INCIDENCE AND SURVEILLANCE OF LYME DISEASE: SYSTEMATIC REVIEW AND POLICY MAPPING
70
Incidence rate per 100,000
per year from second
comparison source
N/A
Further info re second
comparison source
N/A
Findings on demographics Mostly similar with respect to (wrt) region with some
discrepancies. Males 58% of hospital data, 52% of
laboratory data; age similar in both sources (peaks at 5-
9/14 and 45/50-69) (sig NR).
Findings on time trends /
seasonality
Similar wrt seasonality (sig NR; interquartile ranges
reported). Time trends broadly stable over study period;
hospital data peak in 2006-7 and laboratory data in 2004-5
(sig reported for trends within sources, but not for
comparison).
Any other findings /
analyses
NR
Authors’ conclusions /
explanations
“Both data sources converge to the same result”.
Recorded rates may depend on systems / policies (e.g.
regarding reimbursement). Hospital data is in principle
comprehensive; includes secondary diagnoses. Laboratory
data is incomplete and coverage varies by region. Neither
source includes early manifestations e.g. EM.
Reviewer notes Neither data source validated. Data sources not
comparable wrt absolute numbers.
First author, year Bochničková 2012
Country (location) Slovakia (Liptovský Mikuláš and Ružomberok districts)
Years for which comparison
reported
1989-2010
First data source (use
surveillance source if appl.)
Cases reported to regional Public Health Office in
Liptovský Mikuláš and Ružomberok districts
N of cases from first source 221
Incidence rate per 100,000
per year from first source
7.5
Further info re first source NR
Comparison data source Medical records from Infectious Department of The
Central
Military Hospital in Ružomberok, Department of
Infectology at the hospital in Liptovský Mikuláš, and
Infectology Clinic in Liptovský Mikuláš
N of cases from comparison
source
476
Incidence rate per 100,000
per year from comparison
source
16.24

INCIDENCE AND SURVEILLANCE OF LYME DISEASE: SYSTEMATIC REVIEW AND POLICY MAPPING
71
Further info re comparison
source
“The diagnosis of Lyme borreliosis was established on the
basis of the comprehensive assessment of epidemiological
history, clinical symptoms of disease, and serological tests
for antibodies against antigen Borrelia burgdorferi by
using the immunofluorescent method (1989-2005) and
later by using the method ELISA.” But unclear if this is a
general description of practice, or a consistent case
definition.
Second comparison data
source (if appl.)
N/A
N of cases from second
comparison source
N/A
Incidence rate per 100,000
per year from second
comparison source
N/A
Further info re second
comparison source
N/A
Findings on demographics NR (reported for hospital data but not surveillance data)
Findings on time trends /
seasonality
NR (reported for hospital data but not surveillance data)
Any other findings /
analyses
NR
Authors’ conclusions /
explanations
“The real incidence of disease (all diagnosed cases) is two
times higher than the number of reported cases.” No
further information relevant to data comparison.
Reviewer notes Neither data source validated. No information re
surveillance system. Data sources not directly comparable
wrt absolute numbers (and unclear if population coverage
was exactly the same, i.e. who used hospitals which
provided data).
First author, year Boltri 2002
Country (location) USA (Georgia)
Years for which comparison
reported
Dec 1999 – Dec 2000
First data source (use
surveillance source if appl.)
Cases reported to Georgia Division of Public Health
N of cases from first source 6
Incidence rate per 100,000
per year from first source
NR
Further info re first source “Lyme disease was designated a reportable disease in
1991 … Current CDC reporting guidelines define confirmed
Lyme disease as ‘either: (a) physician-diagnosed erythema
migrans ≥5 cm in diameter or (b) at least one
disseminated manifestation (e.g., musculoskeletal,
neurologic, or cardiac) plus laboratory confirmation of

INCIDENCE AND SURVEILLANCE OF LYME DISEASE: SYSTEMATIC REVIEW AND POLICY MAPPING
72
infection.’ … In Georgia, confirmed surveillance case
definition of Lyme disease requires laboratory
confirmation for all cases.”
Comparison data source Survey of family physicians
N of cases from comparison
source
927 suspected, of which 316 treated without firm
diagnosis; 262 diagnosed, of which 132 confirmed by
serologic test. Authors regard all cases treated and/or
diagnosed as cases, for a total of 578.
Incidence rate per 100,000
per year from comparison
source
NR
Further info re comparison
source
“A confidential survey was developed to determine the
frequency and distribution of Lyme disease cases
suspected, diagnosed, and treated by Family Physicians in
Georgia during the twelve month period beginning
December 1999. The survey also included questions about
the criteria used to establish a diagnosis of Lyme disease.
The survey did not inquire about the specific type of
serologic testing utilized for diagnosis. Prior to the
administration of the final survey instrument to the target
physicians, a preliminary survey instrument was
administered to physicians within our department. The
survey instrument was refined and administered to a
second group of 20 physicians from across Georgia. After a
final revision, the survey was re-administered to another
20 physicians for validation. The survey was mailed to
1,331 family physicians in Georgia in late November 2000.
The mailing list was comprised of the active membership
of the Georgia Academy of Family Physicians, as provided
by the Academy.” Response rate 54.3%
Second comparison data
source (if appl.)
N/A
N of cases from second
comparison source
N/A
Incidence rate per 100,000
per year from second
comparison source
N/A
Further info re second
comparison source
N/A
Findings on demographics NR
Findings on time trends /
seasonality
NR
Any other findings /
analyses
NR
Authors’ conclusions /
explanations
Probable response bias in survey and other clinician
specialities not included, so rate could be
underestimated. Many cases from clinician questionnaire
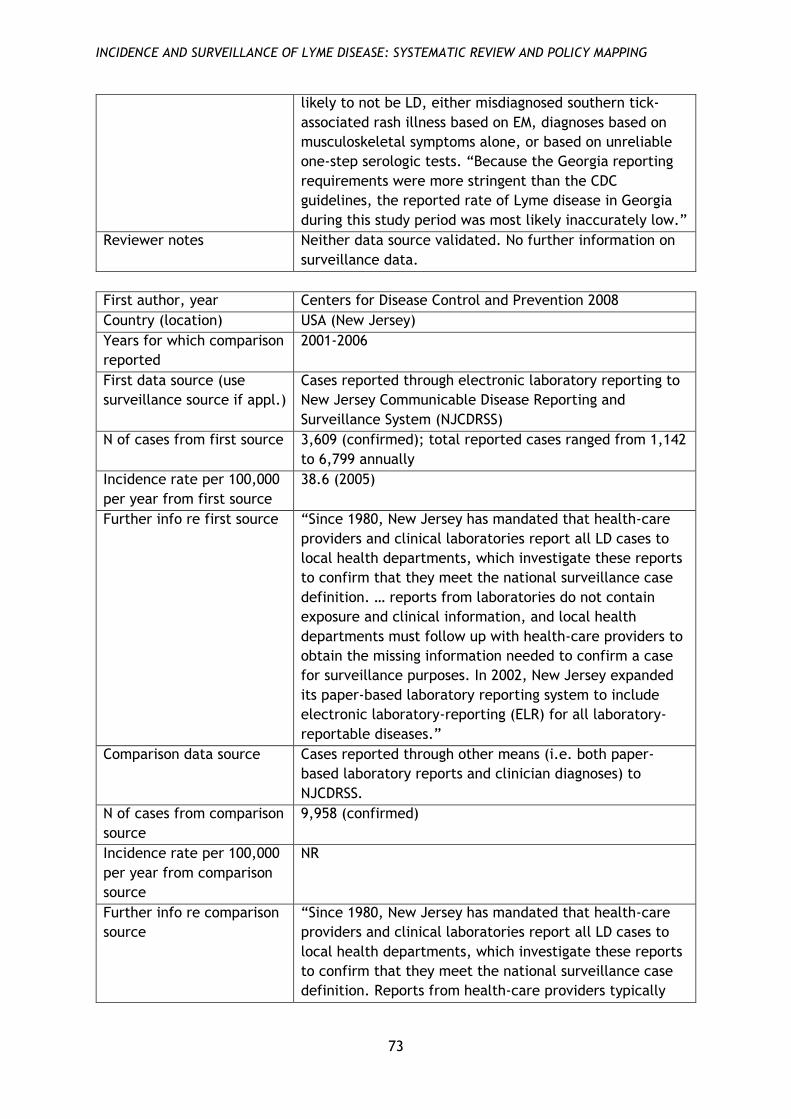
INCIDENCE AND SURVEILLANCE OF LYME DISEASE: SYSTEMATIC REVIEW AND POLICY MAPPING
73
likely to not be LD, either misdiagnosed southern tick-
associated rash illness based on EM, diagnoses based on
musculoskeletal symptoms alone, or based on unreliable
one-step serologic tests. “Because the Georgia reporting
requirements were more stringent than the CDC
guidelines, the reported rate of Lyme disease in Georgia
during this study period was most likely inaccurately low.”
Reviewer notes Neither data source validated. No further information on
surveillance data.
First author, year Centers for Disease Control and Prevention 2008
Country (location) USA (New Jersey)
Years for which comparison
reported
2001-2006
First data source (use
surveillance source if appl.)
Cases reported through electronic laboratory reporting to
New Jersey Communicable Disease Reporting and
Surveillance System (NJCDRSS)
N of cases from first source 3,609 (confirmed); total reported cases ranged from 1,142
to 6,799 annually
Incidence rate per 100,000
per year from first source
38.6 (2005)
Further info re first source “Since 1980, New Jersey has mandated that health-care
providers and clinical laboratories report all LD cases to
local health departments, which investigate these reports
to confirm that they meet the national surveillance case
definition. … reports from laboratories do not contain
exposure and clinical information, and local health
departments must follow up with health-care providers to
obtain the missing information needed to confirm a case
for surveillance purposes. In 2002, New Jersey expanded
its paper-based laboratory reporting system to include
electronic laboratory-reporting (ELR) for all laboratory-
reportable diseases.”
Comparison data source Cases reported through other means (i.e. both paper-
based laboratory reports and clinician diagnoses) to
NJCDRSS.
N of cases from comparison
source
9,958 (confirmed)
Incidence rate per 100,000
per year from comparison
source
NR
Further info re comparison
source
“Since 1980, New Jersey has mandated that health-care
providers and clinical laboratories report all LD cases to
local health departments, which investigate these reports
to confirm that they meet the national surveillance case
definition. Reports from health-care providers typically

INCIDENCE AND SURVEILLANCE OF LYME DISEASE: SYSTEMATIC REVIEW AND POLICY MAPPING
74
include exposure and clinical information needed for case
confirmation.”
Second comparison data
source (if appl.)
N/A
N of cases from second
comparison source
N/A
Incidence rate per 100,000
per year from second
comparison source
N/A
Further info re second
comparison source
N/A
Findings on demographics Non-ELR cases more likely to be in northern NJ (higher-
prevalence region) (p<0.05). No difference by age
Findings on time trends /
seasonality
Non-ELR cases more likely to be in April-September
(p<0.05)
Any other findings /
analyses
A lower proportion of ELR reports were confirmed (“ELR
reports accounted for 31%-71% of total annual reports but
only 5%-33% of confirmed cases per year”), representing a
substantial volume of staff time in following up cases.
Authors’ conclusions /
explanations
Data reflect pre-2008 US case definitions which did not
distinguish confirmed, probable and suspect cases; system
has now changed so that not all laboratory reports are
followed up. Increased reporting in ELR system “likely
reflected technological improvements in data acquisition
and not an actual increase in the number of laboratory
reports received.” Seasonal difference probably reflects
clinician diagnosis of early LD without serologic testing.
“Laboratory reports are useful to identify LD cases that
otherwise might not have been reported by health-care
providers and are an important component of LD
surveillance in New Jersey.” Study did not examine test
accuracy or clinicians’ willingness to report cases. Non-
ELR category conflates both laboratory and clinician
reports, so comparison of electronic and paper-based
laboratory reports was not possible.
Reviewer notes Study compares two sources within a single system and
main purpose is to audit the system as a whole. Some
unclarities about the relation of the two procedures (e.g.
there is presumably considerable overlap, but this is not
analysed). Because study does not investigate test
accuracy, unclear what accounts for the high rate of
laboratory reports which are subsequently not confirmed.
First author, year Clayton 2015
Country (location) USA (Tennessee)
Years for which comparison
reported
Jan 2011 – Jun 2013

INCIDENCE AND SURVEILLANCE OF LYME DISEASE: SYSTEMATIC REVIEW AND POLICY MAPPING
75
First data source (use
surveillance source if appl.)
Cases reported to Tennessee Department of Health
N of cases from first source 74 (9 confirmed, 65 probable)
Incidence rate per 100,000
per year from first source
NR
Further info re first source “TDH cases met the national surveillance case definition
for Lyme disease (2), consisting of the following criteria:
clinical (erythema migrans [EM] rash or late manifestation
of disease), laboratory (positive results by immunoassay
followed by positive western blot results), and exposure
and endemicity (possible exposure to infected ticks <30
days before rash onset). A person with physician-
diagnosed disease who met laboratory criteria was
considered to have a probable case. A person with a
confirmed case had an EM rash and either met laboratory
criteria, had possible exposure to ticks, or had a late
manifestation of disease and positive laboratory results.”
Comparison data source Insurance claims data from Blue Cross Blue Shield of
Tennessee (BCBST)
N of cases from comparison
source
1,367 with any code; 391 with ≥3 codes, of which 5 were
reported to TDH and 386 were not; of the latter 106
records were reviewed, of which 4 met the surveillance
case definition (2 confirmed, 2 probable) and 102 did not.
Authors estimate that insurance data represents
approximately a further 14 cases which are not recorded
in the surveillance data.
Incidence rate per 100,000
per year from comparison
source
NR
Further info re comparison
source
“BCBST is a health insurance provider covering ≈50% of
Tennessee’s population. … We defined Lyme disease
diagnosis for a BCBST-insured person as assignment of >3
primary or secondary codes for Lyme disease (088.81,
International Classification of Diseases, Ninth Revision
[ICD-9]), recorded in the claims data.”
Second comparison data
source (if appl.)
N/A
N of cases from second
comparison source
N/A
Incidence rate per 100,000
per year from second
comparison source
N/A
Further info re second
comparison source
N/A
Findings on demographics No differences by age and sex, similar by location (full
data and sig NR)

INCIDENCE AND SURVEILLANCE OF LYME DISEASE: SYSTEMATIC REVIEW AND POLICY MAPPING
76
Findings on time trends /
seasonality
NR
Any other findings /
analyses
Diagnoses not meeting case definitions “were made by a
limited number of clinicians”. Many of the excluded
reports had history of LD (i.e. were not incident cases).
Authors’ conclusions /
explanations
“By supplementing passive surveillance with BCBST claims
data, we identified 20% more Lyme disease cases than
were reported to TDH.” Most people with diagnosis in
insurance dataset did not meet case definitions; using
these data for surveillance purposes “would be
unsustainable”.
Reviewer notes None
First author, year Dessau 2015
Country (location) Denmark
Years for which comparison
reported
Jan 2010 – Dec 2012
First data source (use
surveillance source if appl.)
Cases reported to statutory Danish notification system for
infectious diseases (DNSID)
N of cases from first source 217
Incidence rate per 100,000
per year from first source
1.3
Further info re first source “The current statutory Danish notification system for
infectious diseases (DNSID) is based on collection of paper
forms completed by the physician treating the patient;
the forms are sent by mail to the Department of Infectious
Disease Epidemiology at SSI and the Regional Medical
Officer of Health. SSI sends reminders to the clinicians if
intrathecal antibody production has been detected by the
SSI laboratory and no notification has been received
within a certain timeframe. From 2011 to 2012, 44% of the
notifications was received only after a reminder had been
sent. Due to increased testing at the regional
microbiological laboratories, SSI is responsible for a
decreasing fraction of the AI tests in Denmark … Both
confirmed and probable cases … were included in the
DNSID dataset extracted for the present study, as both, so
far, have been included in the national surveillance.”
Statutory system only covers Lyme neuroborreliosis and
not other late manifestations (or early LD, although this is
not explicitly stated).
Comparison data source Electronic laboratory reports from Danish microbiology
database (MiBa)
N of cases from comparison
source
533

INCIDENCE AND SURVEILLANCE OF LYME DISEASE: SYSTEMATIC REVIEW AND POLICY MAPPING
77
Incidence rate per 100,000
per year from comparison
source
3.2
Further info re comparison
source
“MiBa receives real-time electronic copies of all reports
from all Danish departments of clinical microbiology. …
Within MiBa local codes are automatically mapped to
national shared codes before data extraction. … In
Denmark a total 11 laboratories performed AI tests. At the
time of the study, nine of these reported to MiBa through
their microbiology laboratory information systems [and
two did not] … To obtain complete nationwide data, data
on AI test results were acquired directly from the two
latter laboratories and merged with the MiBa data.” Data
were deduplicated where patients had >1 test in the study
period. “For this study, with the purpose of surveillance,
the conclusion by the laboratory in the report was
considered valid regardless of the type of assay and
method of index calculation. All laboratories except one
used an assay based on native purified flagella antigen.”
Second comparison data
source (if appl.)
N/A
N of cases from second
comparison source
N/A
Incidence rate per 100,000
per year from second
comparison source
N/A
Further info re second
comparison source
N/A
Findings on demographics DSNID cases significantly more likely to be children (0-15
years; 29% vs 19%). Gender no sig diff. Significantly more
DSNID cases in Capital and Northern Jutland regions,
fewer in other regions.
Findings on time trends /
seasonality
Time trends appear broadly similar
Any other findings /
analyses
N=182 cases were in both datasets; of those in DSNID but
not MiBa, 29 tested negative and 6 were not tested.
Median time lag from sampling date to data availability
was 58 days for DSNID and 5 days for MiBa.
Authors’ conclusions /
explanations
“The present study demonstrated underreporting as only
34% of the 533 AI positive LNB were notified. This
probably reflects both the workload associated with filling
in and sending paper forms and uncertainty on whether
LNB is notifiable or not.” Danish clinical guideline
recommends lumbar puncture with leucocytosis for
diagnosis of Lyme neuroborreliosis, but these data were
unavailable. Some positive tests may thus represent
earlier infections rather than active LD (authors estimate
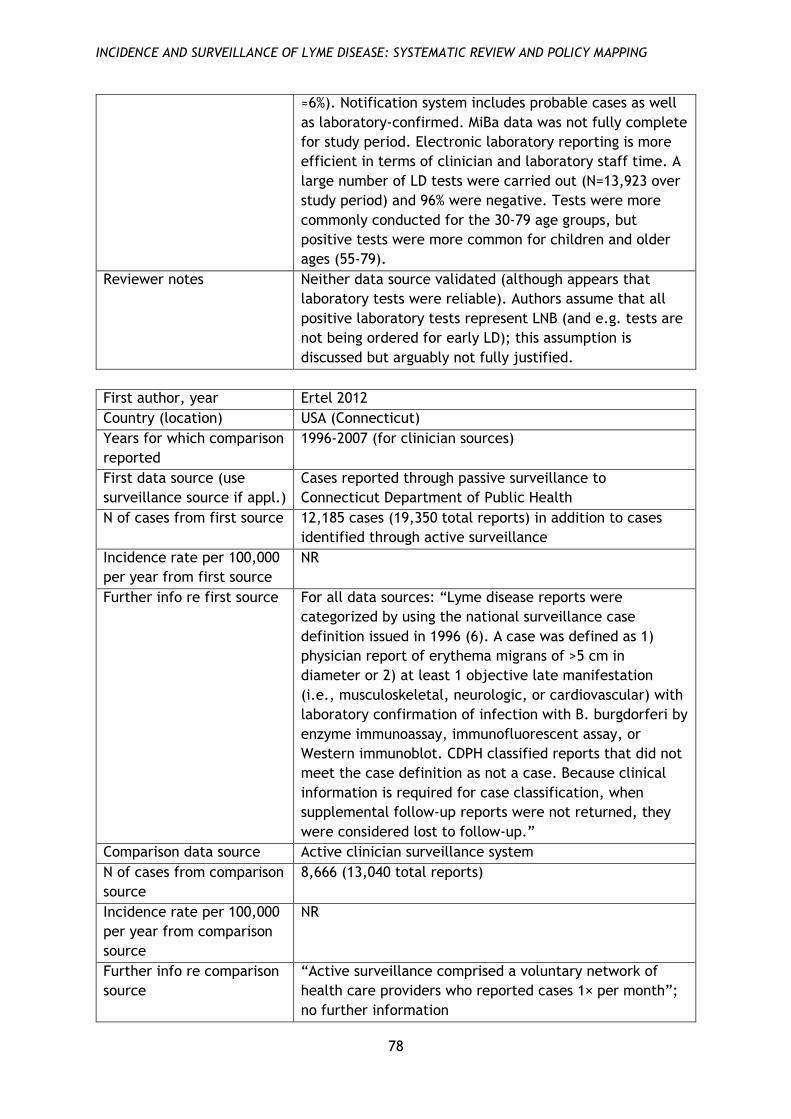
INCIDENCE AND SURVEILLANCE OF LYME DISEASE: SYSTEMATIC REVIEW AND POLICY MAPPING
78
≈6%). Notification system includes probable cases as well
as laboratory-confirmed. MiBa data was not fully complete
for study period. Electronic laboratory reporting is more
efficient in terms of clinician and laboratory staff time. A
large number of LD tests were carried out (N=13,923 over
study period) and 96% were negative. Tests were more
commonly conducted for the 30-79 age groups, but
positive tests were more common for children and older
ages (55-79).
Reviewer notes Neither data source validated (although appears that
laboratory tests were reliable). Authors assume that all
positive laboratory tests represent LNB (and e.g. tests are
not being ordered for early LD); this assumption is
discussed but arguably not fully justified.
First author, year Ertel 2012
Country (location) USA (Connecticut)
Years for which comparison
reported
1996-2007 (for clinician sources)
First data source (use
surveillance source if appl.)
Cases reported through passive surveillance to
Connecticut Department of Public Health
N of cases from first source 12,185 cases (19,350 total reports) in addition to cases
identified through active surveillance
Incidence rate per 100,000
per year from first source
NR
Further info re first source For all data sources: “Lyme disease reports were
categorized by using the national surveillance case
definition issued in 1996 (6). A case was defined as 1)
physician report of erythema migrans of >5 cm in
diameter or 2) at least 1 objective late manifestation
(i.e., musculoskeletal, neurologic, or cardiovascular) with
laboratory confirmation of infection with B. burgdorferi by
enzyme immunoassay, immunofluorescent assay, or
Western immunoblot. CDPH classified reports that did not
meet the case definition as not a case. Because clinical
information is required for case classification, when
supplemental follow-up reports were not returned, they
were considered lost to follow-up.”
Comparison data source Active clinician surveillance system
N of cases from comparison
source
8,666 (13,040 total reports)
Incidence rate per 100,000
per year from comparison
source
NR
Further info re comparison
source
“Active surveillance comprised a voluntary network of
health care providers who reported cases 1× per month”;
no further information

INCIDENCE AND SURVEILLANCE OF LYME DISEASE: SYSTEMATIC REVIEW AND POLICY MAPPING
79
Second comparison data
source (if appl.)
Enhanced laboratory surveillance (1996-1997) and
mandatory laboratory surveillance (1998-2002 and 2007)
N of cases from second
comparison source
Enhanced 1,949 cases (3,739 total reports) in addition to
clinician reported cases; mandatory 10,657 cases (43,767
total reports) in addition to clinician reported cases
Incidence rate per 100,000
per year from second
comparison source
NR
Further info re second
comparison source
“Enhanced laboratory surveillance, conducted during
1996-1997, required participating Connecticut laboratories
to send supplemental case report forms with each positive
B. burgdorferi result to the ordering physician. In January
1998, to study the effectiveness of a newly released Lyme
disease vaccine, mandatory laboratory surveillance was
implemented that required all laboratories to report
positive and equivocal results to CDPH. Follow-up,
conducted by CDPH staff, involved sending a letter and
supplemental report form to the ordering physician. To
assist the physician, demographic and patient-identifying
information from the laboratory report was incorporated
into the form. Mandatory laboratory surveillance ended
after 2002 when the Lyme disease vaccine was removed
from the market. In 2007, mandatory reporting of positive
Lyme disease results was reinstated for laboratories with
electronic reporting capability. Two large commercial
laboratories provided electronic reports. Follow-up was
reestablished by using the previous method, i.e., CDPH
staff sent a letter and supplemental report form to the
ordering physician.”
Findings on demographics Clinician-reported cases more likely to be younger
(p<0.001); no sig diff by gender or ethnicity
Findings on time trends /
seasonality
Time trends and seasonality broadly similar
Any other findings /
analyses
Cases with EM only more likely to be reported by clinicians
(p<0.001), late manifestations by laboratories (p<0.001).
More cases (mean 16.0% more) were reported by clinicians
in years with mandatory laboratory reporting. Percentage
of confirmed cases was much higher for clinician reporting
than for mandatory laboratory reporting where it was
<25%.
Authors’ conclusions /
explanations
Changes over time more likely to due to changes in
surveillance methods than underlying disease rate.
Increase in clinician-reported cases in years with
mandatory laboratory reporting suggests that follow-up
for laboratory surveillance helps to reduce clinician under-
reporting. Combination of methods performed
substantially better wrt identifying cases than either on

INCIDENCE AND SURVEILLANCE OF LYME DISEASE: SYSTEMATIC REVIEW AND POLICY MAPPING
80
its own. “Of all reported cases, nearly one third (31.9%)
originated through laboratory-based surveillance.
However, use of laboratory-based surveillance is
inefficient: only 24.3% were classified as cases.” Clinicians
participating in active surveillance probably more likely to
report cases in the passive system. Intensive surveillance
in endemic regions may not be best use of resources.
Reviewer notes Limited information on either the active or passive
clinician surveillance systems
First author, year Henry 2011
Country (location) Canada (British Columbia)
Years for which comparison
reported
Jan 1997 – Dec 2008
First data source (use
surveillance source if appl.)
Cases reported to surveillance system (Integrated Public
Health Information System)
N of cases from first source 64 confirmed (66 total cases)
Incidence rate per 100,000
per year from first source
NR
Further info re first source “Both clinical (physician-diagnosed erythema migrans with
or without laboratory confirmation) and laboratory-
confirmed cases of LD have been reportable to public
health authorities in BC since 1994.” No further
information
Comparison data source Laboratory test results (from sole site where tests
conducted)
N of cases from comparison
source
74 confirmed (1,144 total tests)
Incidence rate per 100,000
per year from comparison
source
NR
Further info re comparison
source
“We reviewed the provincial Laboratory database to
identify all individuals with a positive enzyme
immunoassay (EIA) test for B. burgdorferi antibodies and
subsequent confirmatory Western blot (WB) testing. …
Standard diagnostic criteria set out by the Canadian Public
Health Agency (Canadian Public Health Laboratory
Network 2007) were then applied … resulting in the
exclusion of individuals without (1) an appropriate clinical
diagnosis (e.g., erythema migrans) or (2) positive two-step
serological testing including a positive EIA and
confirmatory positive WB test.”
Second comparison data
source (if appl.)
Enhanced surveillance database
N of cases from second
comparison source
48 confirmed (51 total cases)

INCIDENCE AND SURVEILLANCE OF LYME DISEASE: SYSTEMATIC REVIEW AND POLICY MAPPING
81
Incidence rate per 100,000
per year from second
comparison source
NR
Further info re second
comparison source
“[A] repository of detailed epidemiological information
(e.g., exposure location) captured during public health
interviews of probable or confirmed cases”; no further
information
Findings on demographics NR
Findings on time trends /
seasonality
NR
Any other findings /
analyses
Total of N=93 cases after deduplication between 3
sources. Authors use capture-recapture methodology to
estimate the true rate and arrive at an estimate of N=142
(95% CI 111-224) in the best-fitting model (although this
seems to be an outlier relative to other models which give
substantially lower numbers, between N=95 and N=111),
leading them to estimate that the system as a whole (i.e.
all 3 sources combined) under-reports cases by
approximately 40%.
Total of N=27 cases not in the surveillance database but in
one of the other sources (i.e. surveillance database found
N=66 of N=93)
Authors’ conclusions /
explanations
Low sample size means estimate of under-reporting should
be interpreted with caution. Unclear whether unreported
cases are treated without testing or never diagnosed. A
large number of people were tested for LD and received
negative confirmatory (Western blot) tests.
Reviewer notes Limited information on surveillance system or enhanced
system.
First author, year Jones 2012, Jones 2013
Country (location) USA (Tennessee)
Years for which comparison
reported
2000-2009
First data source (use
surveillance source if appl.)
Cases reported to Tennessee Department of Health Center
for Environmental and Communicable Diseases
N of cases from first source 292
Incidence rate per 100,000
per year from first source
0.49 (estimated from generalized linear mixed model)
Further info re first source Analysis includes ‘confirmed’ and ‘probable’ cases
according to CDC definitions
Comparison data source Administrative records from managed care organisation
(MCO), BlueCross BlueShield of Tennessee
N of cases from comparison
source
903

INCIDENCE AND SURVEILLANCE OF LYME DISEASE: SYSTEMATIC REVIEW AND POLICY MAPPING
82
Incidence rate per 100,000
per year from comparison
source
3.8 (estimated from generalized linear mixed model)
Further info re comparison
source
“The participating MCO insures approximately 50% of the
entire state’s population. For the purposes of this study,
cases are defined as all medical claims filed to the MCO
having a primary or secondary arthropod-borne disease
diagnosis code of interest [ICD-9] with at least three
separate corroborating events, using the member’s first
recorded occurrence.” Only first diagnosis for each
individual patient retained in analysis.
Second comparison data
source (if appl.)
N/A
N of cases from second
comparison source
N/A
Incidence rate per 100,000
per year from second
comparison source
N/A
Further info re second
comparison source
N/A
Findings on demographics “Significant spatial variation,” not defined further
Findings on time trends /
seasonality
Some discrepancies over time (MCO data peaks in 2000,
2002, 2008 and these are not visible in surveillance data).
Any other findings /
analyses
NR
Authors’ conclusions /
explanations
Incidence estimated from MCO data 7.7 times higher than
reported rate. Study did not analyse how many cases
appeared in both data sources. MCO data does not
distinguish confirmed and probable cases (although not all
reported cases are necessarily laboratory confirmed, as
per CDC guidelines). Reported data may be subject to
both under- and over-reporting. Claims data were not
validated and could be mis-coded in some cases. Analysis
of spatio-temporal clusters showed 2 clusters in the
surveillance data and 1 in the MCO data which did not
overlap.
Reviewer notes Neither data source validated (authors argue that MCO
data should reflect only confirmed cases since clinicians
would not code with specific ICD codes without laboratory
confirmation).
First author, year MacDonald 2016
Country (location) Norway
Years for which comparison
reported
Jan 2008 – Dec 2012

INCIDENCE AND SURVEILLANCE OF LYME DISEASE: SYSTEMATIC REVIEW AND POLICY MAPPING
83
First data source (use
surveillance source if appl.)
Cases reported to MSIS system (Norwegian Institute of
Public Health) by both clinicians and laboratories
N of cases from first source 1,410
Incidence rate per 100,000
per year from first source
NR
Further info re first source Mandatory clinician and laboratory notification. “Group A
diseases, which includes LB, are notifiable to the
Department of Infectious Disease Surveillance at the NIPH
by clinicians and medical microbiological laboratories with
complete patient information. … Since 1991, LB has been
nominally notifiable. … only disseminated and chronic
manifestations [are] notifiable (specifically excluding
cases with only erythema migrans).”
Comparison data source Medical record data from Norwegian Patient Registry
N of cases from comparison
source
5,596 coded as LD (and an additional 7,430 with related
codes which authors define as ‘possible’ LD)
Incidence rate per 100,000
per year from comparison
source
NR
Further info re comparison
source
“NPR is administered by the Norwegian Directorate of
Health and contains information on all referrals or
treatments of patients to tertiary care facilities and
specialists only. The diagnosis registered in NPR is based
on ICD-10 codes.” Study reports on both cases coded as LD
(A69.2 or M01.2) and also on ‘possible’ cases coded with a
wide range of other symptoms.
Second comparison data
source (if appl.)
N/A
N of cases from second
comparison source
N/A
Incidence rate per 100,000
per year from second
comparison source
N/A
Further info re second
comparison source
N/A
Findings on demographics Cases in both sources more likely to be <19 years than
those in only one source (sig NR).
Findings on time trends /
seasonality
NR
Any other findings /
analyses
N=1,047 cases were in both data sets. Cases in both sets
more likely to be registered as neuroborreliosis than those
in MSIS only.
Authors’ conclusions /
explanations
ICD codes in NPR data may not reflect final diagnosis.
Diagnosis by ICD code includes EM only, which is not
notifiable (but source included hospitals and specialists
only so unlikely that many had EM only). NPR data may be

INCIDENCE AND SURVEILLANCE OF LYME DISEASE: SYSTEMATIC REVIEW AND POLICY MAPPING
84
miscoded and cannot be directly compared to surveillance
data. Variability between laboratory case definitions
affects MSIS data. Results might support case for changing
notification criteria e.g. including only neuroborreliosis.
Reviewer notes Neither data source validated. Definition of ‘possible’
cases is very broad, although these are reported
separately and can be ignored.
First author, year Müller 2012
Country (location) Germany (six eastern Länder: Berlin, Brandenburg,
Mecklenburg-Vorpommern, Saxony, Saxony-Anhalt,
Thuringia)
Years for which comparison
reported
2007-2008
First data source (use
surveillance source if appl.)
Cases reported to surveillance system (Robert Koch
Institute)
N of cases from first source 5,624
Incidence rate per 100,000
per year from first source
34
Further info re first source Mandatory reporting; no further information
Comparison data source Health insurance records (Deutsche Angestellten-
Krankenkasse)
N of cases from comparison
source
31,483 incident diagnoses
Incidence rate per 100,000
per year from comparison
source
261
Further info re comparison
source
“The basic dataset consists of health insurance data from
a German statutory health insurance company (Deutsche
Angestellten-Krankenkasse, DAK) which covers approx.
6.04 million individuals all over Germany. In a first step,
relevant international classification of diseases (ICD 10-
GM, 2004) diagnoses for Lyme borreliosis were defined as
follows: ICD A69.2 for Lyme-specific erythema chronicum
migrans, GO1∗ for LB-related meningitis, G63.0 for LB-
related polyneuropathy, and M01.2 for LB-related
Arthritis. Claims’ data of the years 2007 and 2008 were
derived from the underlying datasets (patient data,
ambulatory treatment data, and medication data)…
Individuals insured at least since January 1, 2006, or
January 1, 2007, respectively, in whom at least one
laboratory diagnostic procedure performed for LB in either
year 2007 or 2008, were included in our analyses. The
diagnostic procedures according to the general laboratory
health insurance claim code … included laboratory claim
numbers 32586 (B. burgdorferi antibody/ enzyme-linked

INCIDENCE AND SURVEILLANCE OF LYME DISEASE: SYSTEMATIC REVIEW AND POLICY MAPPING
85
immune assay, ELISA), 32662 (B. burgdorferi antibody/
western blot), and/or 32743 (culture of B. burgdorferi).
Individuals already having a coded diagnosis of Lyme
borreliosis in 2006 were excluded from the analysis.”
Second comparison data
source (if appl.)
N/A
N of cases from second
comparison source
N/A
Incidence rate per 100,000
per year from second
comparison source
N/A
Further info re second
comparison source
N/A
Findings on demographics NR
Findings on time trends /
seasonality
NR
Any other findings /
analyses
NR
Authors’ conclusions /
explanations
Comparison “strongly suggests significant underreporting”.
Possible misdiagnosis and/or miscoding.
Reviewer notes Neither data source validated. Limited info on
surveillance data (comparison of prevalence data not main
purpose of study). Definition of LD in insurance data wrt
ICD codes is fairly generous.
First author, year Naleway 2002
Country (location) USA (Wisconsin)
Years for which comparison
reported
1992-1998
First data source (use
surveillance source if appl.)
Cases reported to Wisconsin Division of Public Health in 8
counties surrounding area covered by comparison source
N of cases from first source 375
Incidence rate per 100,000
per year from first source
17.0
Further info re first source “Lyme disease has been a reportable disease in Wisconsin
since 1980. Written case report forms, including
information about patient demographics (name, race,
gender, and date of birth), dates of onset and diagnosis,
and clinical and laboratory information pertinent to the
national Lyme disease case criteria, are completed by
health care providers and mailed to local county health
departments. These reports are then forwarded to the
Wisconsin Division of Public Health where each form is
reviewed, and those patients that have been determined
to meet the national case criteria based on the

INCIDENCE AND SURVEILLANCE OF LYME DISEASE: SYSTEMATIC REVIEW AND POLICY MAPPING
86
information provided by the reporting form are included
in the state database.”
Comparison data source Medical records from Marshfield Epidemiologic Study Area,
covering residents receiving care at Marshfield Clinic
N of cases from comparison
source
189 (102 probable, 87 possible)
Incidence rate per 100,000
per year from comparison
source
19.1
Further info re comparison
source
“The Marshfield Epidemiologic Study Area was established
in 1991 to facilitate population-based research using the
integrated health care network of the Marshfield Clinic. …
Data pertaining to MESA residents are extracted on a daily
basis from the administrative and clinical files of the
Marshfield Clinic computer systems to track when persons
enter and leave the selected population as a result of
birth, death, or migration. … Computerized International
Classification of Diseases, Ninth Revision, codes from the
Marshfield Clinic database were used to identify potential
cases of Lyme disease that occurred in 1992–1998 in the
MESA population. The specific codes identified were codes
088.81, 695.90, and 066.90. The Marshfield Clinic
laboratory database was also searched for positive Lyme
serologic tests (indirect fluorescent antibody or enzyme
immunoassay, with or without Western immunoblot) to
identify potential cases. Persons with a history of Lyme
disease diagnosis prior to 1992 were excluded from study.
To validate these diagnostic codes and laboratory results,
we abstracted data from patients’ medical records.
Potential cases were grouped into three categories
(probable cases, possible cases, and noncases) based on
the chart abstraction findings. Probable Lyme disease
cases were defined as those patients who met the national
case definition The criteria for a probable case included
physician-diagnosed erythema migrans of ≥5 cm in
diameter or at least one late, noncutaneous manifestation
with laboratory confirmation of infection. … Possible cases
included patients with erythema migrans but no
documented size information and patients with positive
serology and recurrent joint pain or neurologic symptoms
that did not meet the criteria for a probable case.”
Second comparison data
source (if appl.)
N/A
N of cases from second
comparison source
N/A
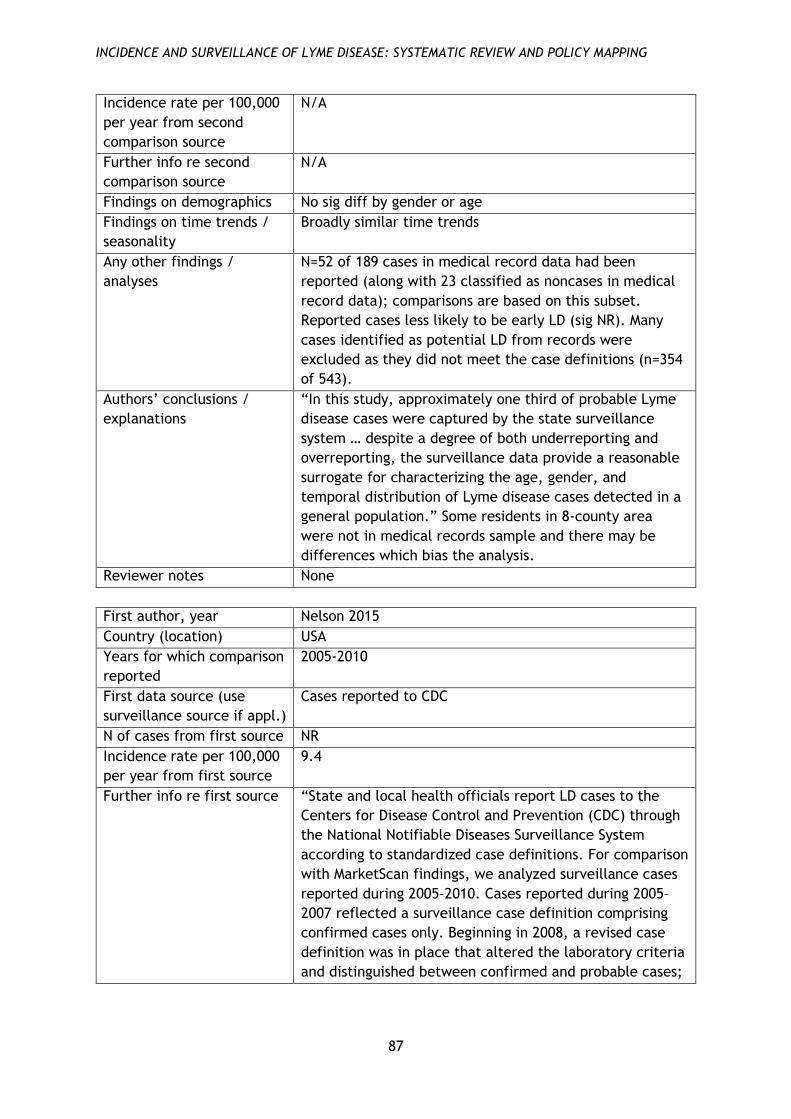
INCIDENCE AND SURVEILLANCE OF LYME DISEASE: SYSTEMATIC REVIEW AND POLICY MAPPING
87
Incidence rate per 100,000
per year from second
comparison source
N/A
Further info re second
comparison source
N/A
Findings on demographics No sig diff by gender or age
Findings on time trends /
seasonality
Broadly similar time trends
Any other findings /
analyses
N=52 of 189 cases in medical record data had been
reported (along with 23 classified as noncases in medical
record data); comparisons are based on this subset.
Reported cases less likely to be early LD (sig NR). Many
cases identified as potential LD from records were
excluded as they did not meet the case definitions (n=354
of 543).
Authors’ conclusions /
explanations
“In this study, approximately one third of probable Lyme
disease cases were captured by the state surveillance
system … despite a degree of both underreporting and
overreporting, the surveillance data provide a reasonable
surrogate for characterizing the age, gender, and
temporal distribution of Lyme disease cases detected in a
general population.” Some residents in 8-county area
were not in medical records sample and there may be
differences which bias the analysis.
Reviewer notes None
First author, year Nelson 2015
Country (location) USA
Years for which comparison
reported
2005-2010
First data source (use
surveillance source if appl.)
Cases reported to CDC
N of cases from first source NR
Incidence rate per 100,000
per year from first source
9.4
Further info re first source “State and local health officials report LD cases to the
Centers for Disease Control and Prevention (CDC) through
the National Notifiable Diseases Surveillance System
according to standardized case definitions. For comparison
with MarketScan findings, we analyzed surveillance cases
reported during 2005–2010. Cases reported during 2005–
2007 reflected a surveillance case definition comprising
confirmed cases only. Beginning in 2008, a revised case
definition was in place that altered the laboratory criteria
and distinguished between confirmed and probable cases;

INCIDENCE AND SURVEILLANCE OF LYME DISEASE: SYSTEMATIC REVIEW AND POLICY MAPPING
88
cases reported during 2008–2010 included both
categories.”
Comparison data source Nationwide insurance claims database (Truven Health
MarketScan Commercial Claims and Encounters Database)
N of cases from comparison
source
45,430 (clinician-diagnosed events); 329,000 (95% credible
interval 296,000–376,000) (estimated with correction for
under-coding)
Incidence rate per 100,000
per year from comparison
source
44.8 (actual coded events); 106.6 (estimated with
correction for under-coding)
Further info re comparison
source
“During 2013–2014, we retrospectively analyzed the 2005–
2010 Truven Health MarketScan Commercial Claims and
Encounters Database, which contains health insurance
claims information for a median of 27 million persons each
year. The database contains records for persons 0–64 years
of age with employer-provided health insurance and
includes information about employees and their spouses
and dependents from all 50 states. … Each patient
encounter record is assigned >1 diagnostic code from the
International Classification of Diseases, Ninth Revision,
Clinical Modification (ICD-9-CM), by a clinician or billing
specialist. Inpatient admissions in the database include 1
principal diagnosis and up to 14 secondary diagnoses.
Outpatient encounters include up to 4 associated ICD-9-
CM codes but do not distinguish between principal and
secondary diagnoses. … The study population comprised
persons enrolled in a participating health plan for the
entirety of any year during 2005–2010 and for whom
prescription drug information was available. For this
analysis, we defined an inpatient event as a hospital
admission with the ICD-9-CM code for LD (088.81) as the
principal diagnosis or the 088.81 code as a secondary
diagnosis plus a principal diagnosis consistent with an
established manifestation of LD or plausible co-infection …
We defined an outpatient event as any outpatient or
emergency department visit with the 088.81 code plus a
prescription filled for an antimicrobial drug recommended
by the Infectious Diseases Society of America for LD
treatment. … To estimate the total number of patients
with clinician-diagnosed LD in the United States, we
calculated age- and county-specific rates derived from the
MarketScan database and applied them to the 2010
population of each corresponding county. Counts for all US
counties were then summed. Because the MarketScan
database is limited to persons <65 years of age, these
calculations do not include clinician-diagnosed cases
among persons >65 years. To adjust for this exclusion, we

INCIDENCE AND SURVEILLANCE OF LYME DISEASE: SYSTEMATIC REVIEW AND POLICY MAPPING
89
multiplied by a correction factor of 1.17. This correction
factor was inferred from the age distribution of LD
patients reported through national surveillance. During
2005–2010, persons <65 years of age accounted for 85.8%
of LD cases reported through national surveillance.
Therefore, we multiplied the estimated number of cases
among persons <65 years by 1.00/0.858, or 1.17, to arrive
at an estimate of cases in all age groups. The estimated
number of patients with clinician-diagnosed LD was based
on extraction of a single ICD-9-CM code. Research has
shown, however, that clinician diagnosis of a medical
condition does not necessarily correlate with existence of
the ICD-9-CM code in the chart (17,18). The primary
reasons are coding errors and inclusion of codes for
accompanying symptoms but not the specific disease
(e.g., coding for joint pain but not LD) (17,19). … to
account for patients in whom LD was diagnosed but whose
charts were not coded with 088.81, we multiplied the
estimated number of cases with 088.81 by a correction
factor calculated as follows: 313/655 = 1/x, where x =
2.09.”
Second comparison data
source (if appl.)
N/A
N of cases from second
comparison source
N/A
Incidence rate per 100,000
per year from second
comparison source
N/A
Further info re second
comparison source
N/A
Findings on demographics Not sig diff wrt age or gender except that insurance data
showed higher rates among women age 15-44. High-
incidence states were the same in both data sets, but
ordering was sig diff.
Findings on time trends /
seasonality
Higher seasonal peak for June-Aug in surveillance data
(65.0% of cases) than for insurance data (61.9% inpatient,
50.0% outpatient) “though this is likely an artifact of the
large sample sizes.” No difference wrt time trends:
“Interannual fluctuation in incidence in MarketScan data
was similar to that in surveillance data (χ2 test, p = 0.81;
Cramer’s V = 0.037).”
Any other findings /
analyses
NR
Authors’ conclusions /
explanations
Possible overdiagnosis in insurance data and codes may
not reflect ultimate diagnosis. Finding on higher incidence
among younger adult women may reflect differences in
health-seeking behaviour or clinical presentation. Findings
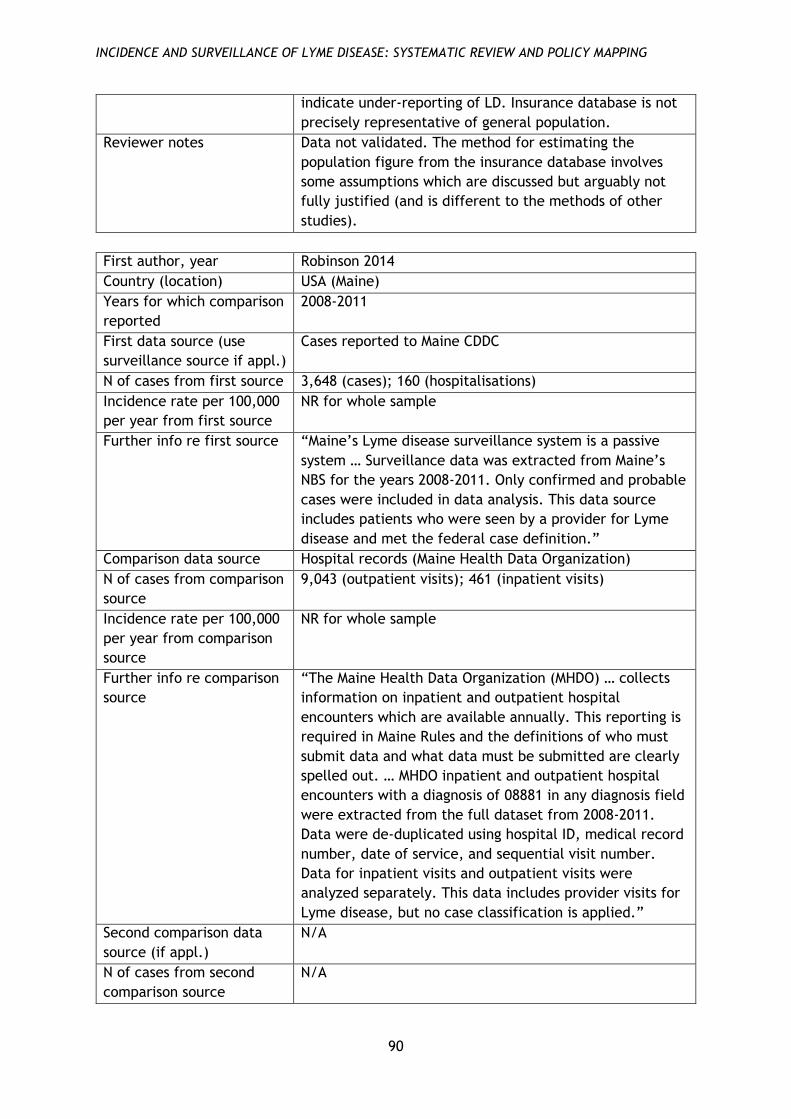
INCIDENCE AND SURVEILLANCE OF LYME DISEASE: SYSTEMATIC REVIEW AND POLICY MAPPING
90
indicate under-reporting of LD. Insurance database is not
precisely representative of general population.
Reviewer notes Data not validated. The method for estimating the
population figure from the insurance database involves
some assumptions which are discussed but arguably not
fully justified (and is different to the methods of other
studies).
First author, year Robinson 2014
Country (location) USA (Maine)
Years for which comparison
reported
2008-2011
First data source (use
surveillance source if appl.)
Cases reported to Maine CDDC
N of cases from first source 3,648 (cases); 160 (hospitalisations)
Incidence rate per 100,000
per year from first source
NR for whole sample
Further info re first source “Maine’s Lyme disease surveillance system is a passive
system … Surveillance data was extracted from Maine’s
NBS for the years 2008-2011. Only confirmed and probable
cases were included in data analysis. This data source
includes patients who were seen by a provider for Lyme
disease and met the federal case definition.”
Comparison data source Hospital records (Maine Health Data Organization)
N of cases from comparison
source
9,043 (outpatient visits); 461 (inpatient visits)
Incidence rate per 100,000
per year from comparison
source
NR for whole sample
Further info re comparison
source
“The Maine Health Data Organization (MHDO) … collects
information on inpatient and outpatient hospital
encounters which are available annually. This reporting is
required in Maine Rules and the definitions of who must
submit data and what data must be submitted are clearly
spelled out. … MHDO inpatient and outpatient hospital
encounters with a diagnosis of 08881 in any diagnosis field
were extracted from the full dataset from 2008-2011.
Data were de-duplicated using hospital ID, medical record
number, date of service, and sequential visit number.
Data for inpatient visits and outpatient visits were
analyzed separately. This data includes provider visits for
Lyme disease, but no case classification is applied.”
Second comparison data
source (if appl.)
N/A
N of cases from second
comparison source
N/A

INCIDENCE AND SURVEILLANCE OF LYME DISEASE: SYSTEMATIC REVIEW AND POLICY MAPPING
91
Incidence rate per 100,000
per year from second
comparison source
N/A
Further info re second
comparison source
N/A
Findings on demographics Surveillance data shows highest rates in 5-14 and 45-64
age groups, hospital data in 45-64 and >65. Surveillance
data shows no sig diff by gender; hospital inpatient data
shows no sig diff, but outpatient data shows higher rate
for females (sig NR). Geographical distribution:
surveillance data shows higher rates in southern and mid-
coast area, hospital data in mid-coast area and Franklin
county (western Maine).
Findings on time trends /
seasonality
Similar seasonal patterns. Surveillance data shows rise
2010-2011 which is less marked in the hospital data
Any other findings /
analyses
For inpatient data, LD was primary diagnosis for 27%-40%
of all cases, for outpatients 52%-71%
Authors’ conclusions /
explanations
Hospital data is events rather than individuals, so
individuals can be counted more than once. Surveillance
case definition stricter than clinical diagnosis. Children
may have lower outpatient rates because they would not
go to a hospital-associated clinic; older adults higher
because of comorbidities. Gender differences may reflect
differences in healthcare-seeking behaviour. Geographical
distribution reflects hospital location and possibly
patterns of healthcare utilisation. Hospital data is only a
partial picture of healthcare utilisation overall. ICD-9 does
not distinguish new diagnoses from old.
Reviewer notes Data not validated (and hospital data uses only raw
diagnosis figures).
First author, year Schiffman 2016
Country (location) USA (Crow Wing County, Minnesota)
Years for which comparison
reported
2009
First data source (use
surveillance source if appl.)
Cases reported to Minnesota Department of Health
N of cases from first source Only reported as proportion of cases identified from chart
review: of 163 of the latter, 66 were reported and 97 not
reported (an additional 29 cases were reported but were
regarded as misclassified on chart review)
Incidence rate per 100,000
per year from first source
81.3 (confirmed) plus 60.6 (probable)
Further info re first source “Minnesota’s communicable disease reporting rules
require physicians and healthcare facilities to report cases
of LD, anaplasmosis and babesiosis to MDH, which

INCIDENCE AND SURVEILLANCE OF LYME DISEASE: SYSTEMATIC REVIEW AND POLICY MAPPING
92
performs centralized TBD surveillance ... In addition,
reference laboratories must report positive laboratory
results. Minnesota Department of Health staff conduct
routine case surveillance by contacting health providers to
obtain information about each reported case’s clinical
presentation. To be considered confirmed according to
the national surveillance case definition, a case must have
laboratory evidence of infection with either a late
manifestation of disease or a physician-diagnosed
erythema migrans (EM) rash ≥5 cm in diameter. If there is
no laboratory evidence of infection, in addition to the EM
rash, a case must have exposure to tick habitat in an
endemic county within 30 days of the rash onset … To
increase the accuracy of case classification, MDH staff
interview LD EM case patients for missing rash size or
exposure information.”
Comparison data source Medical chart review (acute care facilities)
N of cases from comparison
source
163 (confirmed or probable); 299 (all reportable events)
(209 clinician diagnosis only, 23 laboratory result only, 67
both)
Incidence rate per 100,000
per year from comparison
source
227.6 (confirmed) plus 78.8 (probable) (estimated)
Further info re comparison
source
“[W]e contacted all 51 acute care medical facilities
located in either Crow Wing or one of four adjacent
counties … for lists of patient encounters assigned medical
billing codes suggestive of LD, anaplasmosis and
babesiosis. Only facilities that provided data on Crow
Wing County were included in the final study. For billing
codes, we used the International Classification of
Diseases, Ninth Revision, Clinical Modification (ICD-9- CM)
and Current Procedural Terminology (CPT). … Disease-
specific codes of closely related diseases were also
included to capture possible instances of miscoding or
misdiagnosis. To further increase capture of possible LD
diagnoses, we included symptomspecific ICD-9-CM codes
consistent with localized LD (rash), disseminated LD
(joint, cardiac or other manifestations) or tick bite in
conjunction with CPT codes for LD laboratory tests ...
After confirming that identified patients were residents of
Crow Wing County who met study criteria for ICD-9- CM
and CPT coding, we conducted chart reviews. … All
reviewed events were assigned a case status (confirmed,
probable, suspect or not a case) and assessed for
reportability. An event was considered to be ‘reportable’
if it met the criteria defined in Minnesota’s communicable
disease reporting rule … Disease-specific ICD- 9-CM codes

INCIDENCE AND SURVEILLANCE OF LYME DISEASE: SYSTEMATIC REVIEW AND POLICY MAPPING
93
were not used as a proxy for physician diagnosis. Chart
review data were compared to MDH’s 2009 TBD
surveillance data set using patient name and date of birth
to establish whether patients had been reported
independent of this study and classified correctly
according to the CSTE [Council of State and Territorial
Epidemiologists] case definition.”
Second comparison data
source (if appl.)
N/A
N of cases from second
comparison source
N/A
Incidence rate per 100,000
per year from second
comparison source
N/A
Further info re second
comparison source
N/A
Findings on demographics NR
Findings on time trends /
seasonality
NR
Any other findings /
analyses
NR
Authors’ conclusions /
explanations
Authors calculate ‘reporting multiplier’ of 2.8 for the
confirmed cases [142/50], i.e. total confirmed cases =
2.8× reported cases. A total of 1,301 LD events were
reviewed, but only 299 met definition for reportable
events; this was partly due to the use of ICD symptom
codes and Current Procedural Terminology codes. Study
area is endemic and clinicians are likely familiar with LD,
so may be more likely to treat empirically without using
diagnostic tests. Healthcare data may be incomplete.
Reviewer notes Surveillance data only partly reported.
First author, year Tseng 2015
Country (location) USA (Connecticut, Delaware, Maine, Maryland,
Massachusetts, Minnesota, New Hampshire, New Jersey,
New York, Pennsylvania, Vermont, Virginia, Wisconsin)
Years for which comparison
reported
2004-2006 and 2010-2012
First data source (use
surveillance source if appl.)
Cases reported to CDC
N of cases from first source NR
Incidence rate per 100,000
per year from first source
≈25 (2004-2006); ≈28 (2010-2012) (reviewer estimated
from graph)
Further info re first source NR
Comparison data source Nationwide insurance claims database

INCIDENCE AND SURVEILLANCE OF LYME DISEASE: SYSTEMATIC REVIEW AND POLICY MAPPING
94
N of cases from comparison
source
1,965 (2004-2006); 3,474 (2010-2012) using full inclusion
criteria, i.e. LD ICD code + serologic test + antibiotic
treatment ≥14 days
7,213 (2004-2006); 10,512 (2010-2012) with any primary
LD diagnosis code
Incidence rate per 100,000
per year from comparison
source
50.25 (2004-2006); 75.67 (2010-2012)
Further info re comparison
source
“We conducted a population-based retrospective cohort
study using medical insurance claims data from a
nationwide health insurance plan in the United States…
The database covers records of outpatient and inpatient
visits, drug prescriptions, and laboratory orders. Every
outpatient or inpatient visit was coded with one principal
and up to three secondary International Classification of
Diseases, Ninth Revision (ICD-9) codes and one zip code
associated with the provider’s address. Prescription-filling
data include the date, National Drug Code, and quantity
dispensed (in days). Laboratory orders were coded with
the Current Procedural Terminology (CPT) code.” Cases
were defined as patients having at least one occurrence of
the ICD-9 code for LD in the study period, antibiotic
treatment for LD for at least 14 days, and a serologic test
order.
Second comparison data
source (if appl.)
N/A
N of cases from second
comparison source
N/A
Incidence rate per 100,000
per year from second
comparison source
N/A
Further info re second
comparison source
N/A
Findings on demographics NR
Findings on time trends /
seasonality
Larger difference in insurance claims in later time period
(i.e. increasing incidence over time compared to
surveillance data)
Any other findings /
analyses
NR
Authors’ conclusions /
explanations
Codes may not reflect ultimate diagnosis. Database only
includes people using that health plan. Claims data do not
include serologic test results. Findings suggest under-
reporting is becoming more common, “perhaps due to
‘reporting fatigue.’”
Reviewer notes Data not validated. Surveillance data not discussed in any
detail or reported numerically.

The Department of Health Reviews Facility aims to put the evidence into development and implementation of health policy through:
• Undertaking policy-relevant systematic reviews of health and social care research
• Developing capacity for undertaking and using reviews
• Producing new and improved methods for undertaking reviews
• Promoting global awareness and use of systematic reviews in decision-making
The Reviews Facility is a collaboration between three centres of excellence: EPPI-Centre (Evidence for Policy and Practice Information and Co-ordinating Centre), UCL Institute of Education, University College London; CRD (Centre for Reviews and Dissemination), University of York; and PIRU (Policy Innovation Research Unit), London School of Hygiene and Tropical Medicine.
The Department of Health Reviews Facility collaboration has grown out of a previous ‘reviews facility’ in Health Promotion and Public Health based at the EPPI-Centre, and has been funded by the Department since 1995.
The views expressed in this work are those of the authors and do not necessarily reflect the views of the collaborating centres or the funder. All errors and omissions remain those of the authors.
This document is available in a range of accessible formats including large print.
Please contact the UCL Institute of Education for assistance: telephone: +44 (0)20 7947 9556 email: [email protected]
First produced in 2017 by:
Evidence for Policy and Practice Information and Co-ordinating Centre (EPPI-Centre) Social Science Research UnitUCL Institute of Education, University College London18 Woburn SquareLondon WC1H 0NR
Tel: +44 (0)20 7612 6397
http://eppi.ioe.ac.uk/ http://www.ucl.ac.uk/ioe
ISBN: 978-1-907345-99-9
Cover image © Flickr user Joel Kramer Attribution 2.0 Generic (CC BY 2.0)
Top Related