


Languages
Pages
Legal


Surface Chemistry Study on the Pentlandite-Serpentine System
Mayeli Alvarez-Silva
Department of Mining and Materials Engineering
McGill University
Montreal, Quebec
A thesis submitted to the Faculty of Graduate Studies and research in partial fulfillment of the requirements for the degree of Doctor of Philosophy
© Mayeli Alvarez-Silva
February, 2011

To my parents.
Con todo mi amor, va por ustedes

Quamvis enim melius sit benefacere quam nosse, prius tamen est nosse
quam facere.
Charlemagne
i
Abstract
Interaction with MgO-minerals is one mechanism suspected to reduce selectivity in
flotation of pentlandite from ultramafic ore. Understanding the surface chemistry of the
minerals involved will lead to improved flotation conditions that maximize flotation
selectivity.
The first part of the thesis compares isoelectric point (i.e.p.) and point of zero charge
(p.z.c.) determined using Mular-Roberts [M-R] titration technique of MgO-minerals
chlorite, serpentine and talc. The M-R technique was unsuccessful with talc, attributed to
Mg2+ acting as potential determining ion. For serpentine and chlorite, respectively, p.z.c.
was pH 4.3 and 4.6 and i.e.p. pH 3.2 and <3. Dispersion index (DI) for chlorite suggested
that aggregation/dispersion is controlled by both; serpentine remained dispersed, possibly
due to hydration effects.
The second part determines surface properties of pentlandite and serpentine isolated from
an ultramafic ore. Zeta potential measurements were made on minerals alone and as
mixtures with either indifferent electrolyte or supernatant derived from an ore suspension
as background. Individual mineral results anticipated interaction due to electrostatic
attraction. This was confirmed in the mixed mineral case, with Mg(OH)2 precipitate
interaction as an additional factor. Scanning electron microscopy validated the findings.
Aggregation/dispersion was determined by turbidimetry using a light scattering
technique and optical microscopy. The effect of selected factors on
aggregation/dispersion of pentlandite and serpentine was investigated by a design of
experiment (DOE). Concentration of carboxymethyl cellulose, CMC, and the interaction
between CMC and pH were the important factors.

Abstract ii
Contact angle measurements explored effects of several factors on pentlandite
hydrophobicity and, using a DOE, small-scale flotation was used to investigate effects on
pentlandite floatability. The pH was the most important factor, acidic pH increasing both
hydrophobicity and floatability. Copper activation enhanced both properties, as well;
magnesium affected hydrophobicity at alkaline pH, but it did not show significant effect
on floatability; serpentine was detrimental to the process; and CMC was capable of
partially restoring the hydrophobicity and floatability of pentlandite depressed with
serpentine.

iii
Résumé
L’interaction de la pentlandite avec des minéraux d’oxide de magnésium (MgO-) est
soupçonnée d’être à l’origine de la sélectivité réduite de la pentlandite dans les procédés
de flottation de minerais ultrabasiques. Une meilleure compréhension de la chimie de
surface des minéraux impliqués devrait mener à l'amélioration des conditions de
flottation qui en maximisent la sélectivité.
La première partie de la thèse compare le point isoélectrique (p.i.e) et le point de charge
nulle (p.c.n), déterminés à l'aide de la technique de titrage Mular-Roberts [M-R], de
minéraux d’oxide de magnésium tels que la chlorite, la serpentine et le talc. Dans le cas
du talc, la technique M-R a échoué, probablement dû aux ions Mg2+ qui jouent le rôle
d’ions déterminateurs de potentiel. Dans le cas de la serpentine et de la chlorite, les p.c.n.
ont été déterminés à pH 4,3 et 4,6 respectivement et les p.i.e à pH 3,2 et <3
respectivement. Des tests de décantations ont suggéré que l’agrégation/dispersion
observée pour la chlorite était contrôlée à la fois par le p.c.n et le p.i.e ; la serpentine au
contraire est restée dispersée, possiblement dû à des effets d’hydratation.
La deuxième partie détermine les propriétés de surface de la pentlandite et de la
serpentine isolées à partir d'un minerai ultrabasique. Des mesures du potentiel zêta ont
été effectuées sur les minéraux seuls et mélangés en présence d’un électrolyte, indifférent
dans un cas et surnageant dans l’autre cas, préparé à partir d'une suspension de minerai
utilisée comme milieu d’étude. Les résultats relatifs aux minéraux individuels et en
particulier les forces d’attraction électrostatique observables ont permis d’anticiper leur
interaction. Cette hypothèse a été confirmée dans le cas des minéraux mélangés, étant
après avoir pris en compte l’interaction de précipités de Mg(OH)2 comme facteur
additionnel. Des observations au microscope électronique à balayage ont permis de
valider les résultats.

Résumé iv
L’agrégation/dispersion a été déterminée par décantation en utilisant des techniques de
lumière diffuse et de microscopie optique. L'effet de certains facteurs sur
l'agrégation/dispersion de la pentlandite et de la serpentine a été étudié sur la base d’un
plan d’expériences (PE). Entre autres, la concentration en carboxymethyl cellulose
(CMC) et l'interaction entre le CMC et le pH ont été considérés comme des facteurs
importants.
Des mesures d'angle de contact ont permis d’explorer l'hydrophobicité de la pentlandite
et, à l’aide d’un PE, une étude de flottation à petite échelle a été réalisée pour investiguer
la flottabilité de la pentlandite. Les résultats ont montrés que le pH était le facteur le plus
important, un pH acide ayant pour effet d’augmenter à la fois l’hydrophobicité et la
flottabilité. L’ajout de cuivre a également permis de renforcer ces deux propriétés par un
effet d’activation; la présence de magnésium au contraire a affecté l'hydrophobicité de la
pentlandite à pH alcalin mais n'a pas eu d'effet significatif sur ses propriétés de
flottabilité; la présence de serpentine s’est trouvée être préjudiciable au procédé mais
l’utilisation de CMC a pu être utilisée afin de restaurer partiellement l'hydrophobicité et
la flottabilité de la pentlandite diminuées par la présence de la serpentine.

v
Resumen
Durante el procesamiento de minerales ultramáficos, los silicatos de magnesio tienen un
efecto nocivo en la flotación del mineral valioso, la pentlandita. Un posible mecanismo
de la reducción de selectividad es la interacción de la pentlandita con los silicatos de
magnesio. A fin de maximizar la flotación selectiva de estos minerales es preciso
entender la química de superficie de los minerales involucrados.
La primera parte de la presente tesis está comprendida por la comparación de punto
isoeléctrico y punto de carga cero de los silicatos de magnesio: clorita, serpentina y talco,
mediante la técnica de titulación Mular-Roberts. Dicha técnica no pudo aplicarse en el
caso del talco, debido probable papel del magnesio como ión determinante del potencial.
Para serpentina y clorita, el punto de carga cero se estableció a pH de 4.3 y 4.6,
respectivamente, y el punto isoeléctrico a pH 3.2 y <3. Mediante experimentos de
sedimentación, se determinó que la agregación/dispersión de clorita fue controlada tanto
por el punto de carga cero como por el punto isoeléctrico. La serpentina, en cambio,
permaneció dispersa en el rango de pH probado, posiblemente debido su tendencia a la
hidratación.
La segunda parte del trabajo está constituida por la determinación de diversas
propiedades de superficie de la pentlandita y serpentina aisladas de minerales
ultramáficos. Se realizaron mediciones de potencial zeta a esos dos minerales por
separado y a sus mezclas usando como solución base un electrólito indiferente o el
sobrenadante de una suspensión de mineral ultramáfico. En el estudio de minerales
individuales se concluyó que es posible la interacción entre las dos fases como
consecuencia de la atracción electrostática. Esto se confirmó en el caso de mezclas de
minerales, donde la precipitación de Mg(OH)2 en la superficie de la pentlandita es un
factor adicional. La inspección de los minerales mediante microscopía electrónica de
barrido ayudó a validar los resultados.

Resumen vi
La agregación/dispersión del sistema se estudió mediante experimentos de
sedimentación, usando la técnica de dispersión de luz y observación directa en un
microscopio óptico. Se investigó el efecto de diferentes factores en la
agregación/dispersión de pentlandita y serpentina mediante un diseño experimental. Los
factores más importantes fueron la concentración de carboximetilcelulosa (CMC) y la
interacción entre ésta y el pH.
A fin de conocer el efecto de diferentes factores en la hidrofobicidad de la pentlandita, se
realizó un estudio de ángulo de contacto. Para estudiar su flotabilidad, se realizó un
diseño experimental de flotación en pequeña escala. El pH resultó el factor más
importante: ambas propiedades se vieron favorecidas a pH ácidos. La activación con
cobre también resultó beneficiosa para ambas propiedades. La presencia de magnesio a
pH alcalino afectó negativamente la hidrofobicidad; sin embargo, la flotabilidad no
pareció mostrar el mismo efecto. La serpentina afectó ambas propiedades. Finalmente, la
carboximetilcelulosa remedió parcialmente los efectos negativos de la serpentina tanto en
la hidrofobicidad como en la flotabilidad.

vii
Contribution of authors
The following are manuscripts written by the author that were used in the preparation of
this thesis. All the experiments were conducted by the authors or under the authors’
directions. Manuscripts 1 and 2 comprise Chapter 4, and manuscripts 3, 4 and 5 make up
Chapters 5, 6 and 7, respectively.
1. Alvarez-Silva M., Uribe-Salas A., Mirnezami M., Finch J.A. (2010) The point of
zero charge of phyllosilicate mineral using the Mular-Roberts titration technique.
Minerals Engineering 23: 383-389
2. Alvarez-Silva M., Uribe-Salas A., Mirnezami M., Finch J.A. (2010) Point of zero
charge, isoelectric point and aggregation of phyllosilicate minerals. Canadian
Metallurgical Quarterly 49: 405-410
3. Alvarez-Silva M., Uribe-Salas A., Mirnezami M., Finch J.A. Effect of presence
of serpentine and dissolved mineral species on electrokinetic behaviour of
pentlandite, to be submitted to the International Journal of Mineral Processing
4. Alvarez-Silva M., Uribe-Salas A., Mirnezami M., Finch J.A. Effect of flotation
reagents on hetero-aggregation of pentlandite and serpentine, submitted for
presentation at 49th Annual Conference of Metallurgists (COM 2010),
Vancouver, BC, Canada
5. Alvarez-Silva M., Davila-Pulido G.I., Uribe-Salas A., Mirnezami M., Finch J.A.
Contact angle measurements and flotation study in the pentlandite-serpentine
system, to be submitted to Minerals Engineering.
Contribution of the authors viii
All the manuscripts presented above are co-authored by Prof. James A. Finch in his
capacity as research supervisor. Dr. M. Mirnezami and Dr. A. Uribe-Salas are also co-
authors in recognition to their suggestions towards the experimental design and
contribution to the discussions of results. Manuscript 5 also includes M.Sc. G.I. Dávila-
Pulido for her contribution in performing part of the experiments. Beyond the
contribution of the authors mentioned here, all the work presented in this dissertation was
performed by the author.

ix
Acknowledgements
First, I would like to thank my supervisor, Professor James A. Finch, for the guidance,
suggestions and financial support that he has provided me during the course of my
studies.
I would like to acknowledge Vale for the financial support of this project.
I would like to express my sincere gratitude to my master’s supervisor, Dr. Alejandro
Uribe-Salas, for believing in me, for his guidance and, foremost, for his friendship.
Without his encouragement, it would not have happened.
I want to express my appreciation to all the people that helped me in one way or another
during my studies, especially to my dear buddy Mr. Ray Langlois. Also, I would like to
thank Dr. Ram Rao, Dr. Jan Nesset, Dr. César Gómez, Dr. Mitra Mirnezami, Ms. Helen
Campbell, Mr. Ranjan Roy, Mr. Lang Shi, Prof. Kristian Waters, Ms. Monique
Riendeau, Ms. Barbara Hanley and Dr. Manqiu Xu (Vale).
Special thanks go to my friends in the mineral processing group, in particular to Rebecca
Payant, Rodrigo Araya, Yue (Hope) Tan and Patrick Blonde (my English editor among
other things). Also, I would like to express my gratitude to Cécile Charbonneau for the
translation of the abstract to French. Finally, I would like to thank the Mexican gang
Paula M. Proa-Flores and Yaneth Aguilar-Díaz and my lab mates from Extractive
Metallurgy in Cinvestav, Saltillo, especially Gloria Dávila-Pulido for her valuable help
with the performance of contact angle and small-scale flotation experiments.

x
Table of contents
Chapter 1 Introduction............................................................................................................................... 1
1.1. Objectives of the thesis .................................................................................................................. 2
1.2. Structure of the Thesis ................................................................................................................... 3
References ............................................................................................................................................ 3
Chapter 2 Background ............................................................................................................................... 5
2.1. Uses of Nickel ................................................................................................................................ 5
2.2. Occurrence ..................................................................................................................................... 6
2.3. Nickel deposits .............................................................................................................................. 7
2.4. Issues in ultramafic ore processing ................................................................................................ 8
2.5. The minerals .................................................................................................................................. 9
2.5.1. Sulphides ................................................................................................................................ 9
Pentlandite ................................................................................................................................... 9
Pyrrhotite ................................................................................................................................... 10
2.5.2. MgO-minerals ...................................................................................................................... 10
Serpentine ................................................................................................................................. 10
Amphibole ................................................................................................................................. 11
Chlorite ..................................................................................................................................... 12
Olivine ....................................................................................................................................... 12
Talc ........................................................................................................................................... 12
2.6. Flotation reagents ........................................................................................................................ 13
2.6.1. Collectors ............................................................................................................................. 13
2.6.2. Dispersants ........................................................................................................................... 14
2.6.3. pH modifiers ........................................................................................................................ 16
Effect on the minerals ............................................................................................................... 17
Effect on chemical species ........................................................................................................ 18
2.7. Some other factors affecting flotation .......................................................................................... 18
2.7.1. Dissolved species ................................................................................................................. 18
2.7.2. Process water ....................................................................................................................... 19
References .......................................................................................................................................... 20
Chapter 3 Experimental techniques ......................................................................................................... 25
Table of contents xi
3.1. Surface charge ............................................................................................................................. 26
3.1.1. Mechanisms of surface charge development ....................................................................... 26
3.1.2. The electrical double layer ................................................................................................... 27
Helmholtz model ....................................................................................................................... 27
Gouy-Chapman model .............................................................................................................. 28
Stern-Graham model ................................................................................................................. 28
3.1.3. Ions in the double layer ........................................................................................................ 28
3.1.4. Point of zero charge ............................................................................................................. 29
3.1.5. Isoelectric point .................................................................................................................... 32
3.1.6. Electrokinetic phenomena .................................................................................................... 32
Electro-osmosis ......................................................................................................................... 32
Streaming potential ................................................................................................................... 32
Sedimentation potential ............................................................................................................. 33
Electrophoresis .......................................................................................................................... 33
3.1.7. Calculation of zeta potential ................................................................................................ 33
3.1.8. Zeta potential apparatus ....................................................................................................... 35
3.2. Aggregation/dispersion ................................................................................................................ 36
3.2.1. Disppersion index ................................................................................................................ 36
3.2.2. Light microscopy ................................................................................................................. 37
3.3. Hydrophobicity and floatability ................................................................................................... 38
3.3.1. Contact angle ....................................................................................................................... 38
3.3.2. Small-scale flotation ............................................................................................................ 39
3.4. Characterization instruments ....................................................................................................... 40
3.4.1. Particle size distribution ....................................................................................................... 40
3.4.2. Elemental analysis ............................................................................................................... 41
3.4.3. Electron microprobe ............................................................................................................. 41
3.4.4. X-ray diffraction .................................................................................................................. 42
3.4.5. Scanning electron microscopy ............................................................................................. 42
References .......................................................................................................................................... 42
Chapter 4 Point of zero charge and isoelectric point of phyllosilicate minerals ...................................... 47
Abstract ............................................................................................................................................... 47
4.1. Introduction ................................................................................................................................. 48
4.2. Experimental ................................................................................................................................ 50
4.2.1. Minerals ............................................................................................................................... 50
4.2.2. Determination of isoelectric point ........................................................................................ 50

Table of contents xii
4.2.3. Dissolution ........................................................................................................................... 51
4.2.4. Effect of Mg2+ concentration on zeta potential .................................................................... 51
4.2.5. Determination of point of zero charge ................................................................................. 51
4.2.6. Aggregation/dispersion tests ................................................................................................ 52
4.3. Results ......................................................................................................................................... 52
4.3.1. Mineralogical characterization ............................................................................................. 52
4.3.2. Validating M-R technique .................................................................................................... 53
4.4.3. Isoelectric point and effect of some experimental conditions .............................................. 55
Effect of aging and solid/liquid ratio ......................................................................................... 55
Species dissolution .................................................................................................................... 55
Effect of Mg2+ ........................................................................................................................... 58
4.4.4. Point of zero charge ............................................................................................................. 60
4.4.5. Aggregation/dispersion tests ................................................................................................ 61
4.5. Discussion .................................................................................................................................... 62
4.6. Conclusions ................................................................................................................................. 66
References .......................................................................................................................................... 66
Chapter 5 Effect of serpentine and dissolved mineral species on electrokinetic behaviour of
pentlandite ............................................................................................................................................... 70
Abstract ............................................................................................................................................... 70
5.1. Introduction ................................................................................................................................. 71
5.2. Experimental ................................................................................................................................ 72
5.2.1. Minerals ............................................................................................................................... 72
5.2.2. Zeta potential ....................................................................................................................... 74
Serpentine ................................................................................................................................. 74
Pentlandite ................................................................................................................................. 74
Mixed mineral systems ............................................................................................................. 75
5.2.3. Scanning electron microscopy ............................................................................................. 75
5.3. Results ......................................................................................................................................... 76
5.3.1. Zeta potential ....................................................................................................................... 76
Individual minerals ................................................................................................................... 76
In presence of indifferent electrolyte .................................................................................... 76
In presence of supernatant .................................................................................................... 78
Mixed mineral systems ......................................................................................................... 81
In presence of indiferent electrolyte ........................................................................................... 81
Pentlandite in presence of serpentine and supernatant ............................................................... 82

Table of contents xiii
5.3.2. Scanning electron microscopy .......................................................................................... 84
5.4. Discussion .................................................................................................................................... 86
5.5. Conclusions ................................................................................................................................. 88
References .......................................................................................................................................... 88
Chapter 6 Effect of flotation reagents on hetero-aggregation of pentlandite and serpentine ................... 93
Abstract ............................................................................................................................................... 93
6.1. Introduction ................................................................................................................................. 94
6.2. Experimental ................................................................................................................................ 95
6.2.1. Minerals ............................................................................................................................... 95
6.2.2. Reagents ............................................................................................................................... 95
6.2.3. Aggregation/dispersion tests ................................................................................................ 96
6.2.5. Optical microscopy .............................................................................................................. 97
6.3. Results ......................................................................................................................................... 97
6.3.1. Dispersion index .................................................................................................................. 97
6.3.2. Optical microscopy ............................................................................................................ 104
6.4. Discussion .................................................................................................................................. 105
6.5. Conclusions ............................................................................................................................... 106
References ........................................................................................................................................ 107
Chapter 7 Contact angle measurements and flotation study in the pentlandite-serpentine system ........ 109
Abstract ............................................................................................................................................. 109
7.1. Introduction ............................................................................................................................... 110
7.2. Experimental techniques ............................................................................................................ 111
7.2.1. Minerals ............................................................................................................................. 111
Contact angle experiments ...................................................................................................... 111
Flotation experiments .............................................................................................................. 111
7.2.2. Reagents ............................................................................................................................. 112
7.2.3. Contact angle measurement ............................................................................................... 112
7.2.4. Flotation experiments ......................................................................................................... 113
7.3. Results ....................................................................................................................................... 114
7.3.1. Contact angle measurements .............................................................................................. 114
Effect of xanthate .................................................................................................................... 114
Cu-activation ........................................................................................................................... 115
Effect of magnesium ions ........................................................................................................ 116
Effect of serpentine ................................................................................................................. 116
Effect of CMC ......................................................................................................................... 117

Table of contents xiv
7.3.2. Flotation tests ..................................................................................................................... 119
7.4. Discussion .................................................................................................................................. 126
7.5. Conclusions ............................................................................................................................... 129
References ........................................................................................................................................ 130
Chapter 8 Conclusions, contributions and future work ......................................................................... 133
8.1. Conclusions ............................................................................................................................... 133
8.2. Contributions to the knowledge ................................................................................................. 136
8.3. Future work ................................................................................................................................ 136
Appendix 1:Characterization of phyllosilicates ......................................................................................... 138
Appendix 2: Isolation of mineral phases and characterization of samples ................................................. 141
A-2.1. Product identification ............................................................................................................ 143
A-2.1. Pentlandite for contact angle measurements .......................................................................... 146
Appendix 3: Supernatant analysis ......................................................................................................... 147
Appendix 4: Analysis of sulphate and chloride ..................................................................................... 149
A-4.1. Analysis of sulphate: turbidimetric method ........................................................................... 149
Apparatus ..................................................................................................................................... 149
Reagents ....................................................................................................................................... 149
Procedure ..................................................................................................................................... 149
A-4.2. Analysis of chloride: argentometric titration ......................................................................... 150
Apparatus ..................................................................................................................................... 150
Reagents ....................................................................................................................................... 151
Procedure ..................................................................................................................................... 151
Calculation .............................................................................................................................. 151
Reference .......................................................................................................................................... 151
Appendix 5: Contact angle measurement .............................................................................................. 153
xv
List of figures
Figure 2.1 Main industrial uses for nickel Source: Standard CIB Global Research http://www.standardbank.co.za................................................................................. 6
Figure 2.2 Major Nickel deposits. Modified from Elias (2002)………………………………. 7 Figure 2.3 Schematic representation of the (a) chrysotile and (b) lizardite structures.
Modified from Klein and Hurlbut (1993)…………………………………………. 11 Figure 2.4 Scanning Microscope images of a chunk of lizardite (left) and fibers of
chrysotile…………………………………………………………………………... 12 Figure 2.5 Schematic diagram of xanthate structure………………………………………….. 13 Figure 2.6 Carboxymethyl cellulose fragment………………………………………………... 15 Figure 3.1 Representation of charge development in talc [Mg3Si4O10(OH)2] by the
substitution of silicon by aluminum in the tetrahedral sheet and magnesium by iron in the octahedral sheet………………………………………………………... 27
Figure 3.2 Schema of a possible ions distribution on a surface and effect on the different
potentials…………………………………………………………………………... 29 Figure 3.3 Effect of a non-conductive particle on the applied field (a) κa << 1; (b) κa >> 1.
The broken line is at the distance of 1/κ from the particle surface (adapted from Hunter, 2001)……………………………………………………………………… 34
Figure 3.4 Zeta potential apparatus…………………………………………………………… 35 Figure 3.5 Schematic arrangement for dispersion index measurements…………….………... 37 Figure 3.6 Top view of the platform for contact angle measurements (modified from Dávila-
Pulido, 2010)………………………………………………………………………. 39 Figure 3.7 Schematic of the Partridge/Smith cell…………………………………………….. 40 Figure 4.1 Sketch diagrams of serpentine [Mg3Si2O5(OH)4], talc [Mg3Si4O10(OH)2] and
chlorite [(Mg,Fe2+)5(Al,Fe3+)2Si3O10(OH)8].Structures viewed parallel to the sheets………………………………………………………………………………. 49
Figure 4.2 Zeta potential of alumina (open squares) and silica (filled diamonds) as a function
of pH. IS = 10-2 mol/L using KCl; i.e.p. occurs at ca. pH 7.9 and <3, respectively. The error bars represent the 95 % confidence interval from three observations………………………………………………………………………... 53

List of figures xvi
Figure 4.3 ΔpH as a function of pHIS2 for alumina. IS changed from 10-2 mol/L to 0.1 mol/L
(circles), and from 0.1 mol/L to 1 mol/L (squares) using KCl; p.z.c. observed at ca. pH 8.1……………………………………………………………………………….. 54
Figure 4.4 ΔpH as a function of pHIS2 for silica. IS changed from 0.1 mol/L to 1 mol/L; p.z.c.
observed at ca. pH 2…………………………………………………………………. 54 Figure 4.5 Zeta potential of chlorite as a function of pH for aged (24-hr) and fresh samples. IS
= 10-2 mol/L using KCl. Solid-liquid ratio was 200 mg/L (filled squares and open diamonds) and 100 mg/L (filled triangles)………………………………….............. 56
Figure 4.6 Zeta potential of serpentine as a function of pH for aged (filled squares) and fresh
(open diamonds) samples. IS = 10-2 mol/L using KCl……………………………… 56 Figure 4.7 Zeta potential of talc as a function of pH for 24-hr aged (filled diamonds) and fresh
(open diamonds) samples. IS = 10-2 mol/L using KCl……………………………… 57 Figure 4.8 Zeta potential of serpentine (circles) and chlorite (squares) as a function of pH for
24-hr aged samples. IS = 10-2 (filled symbols) and 10-3 mol/L (open symbols) using KCl…………………………………………………………………………………... 57
Figure 4.9 Zeta potential of chlorite as a function of pH in 10-2 mol/L KCl for 0 mol/L (filled
diamonds), 10-5 mol/L (open squares), 10-4 mol/L (filled triangles) and 10-3 mol/L (crosses) of magnesium……………………………………………………………... 58
Figure 4.10 Zeta potential of serpentine as a function of pH in 10-2 mol/L KCl for 0 mol/L
(filled diamonds), 10-5 mol/L (open squares), 10-4 mol/L (filled triangles) and 10-3 mol/L (crosses) of magnesium………………………………………………………. 59
Figure 4.11 Zeta potential of talc in 10-2 mol/L KCl for 0 mol/L (filled diamonds), 10-5 mol/L
(open squares), 10-4 mol/L (filled triangles) and 10-3 mol/L (crosses) of magnesium………………………………………………………………………...... 59
Figure 4.12 ΔpH as a function of pHIS2 for chlorite. IS changed from 10-2 mol/L to 0.1 mol/L
(filled diamonds), and from 10-2 mol/L to 1 mol/L (open squares) using KCl. p.z.c. was observed at ca. pH 4.6………………………………………………………….. 60
Figure 4.13 ΔpH as a function of pHIS2 for serpentine. IS change was from 10-2 mol/L to 0.1
mol/L using KCl. p.z.c. was observed at pH ca. 4.3………………………………… 61 Figure 4.14 Dispersion index in absorbance increment per second as a function of pH for
chlorite (open circles) and serpentine (filled squares)……………………………….. 62 Figure 4.15 Interlayer bonding for different types of phyllosilicates…………………………..... 65 Figure 5.1 Zeta potential of pentlandite as a function of pH at two values of ionic strength: 10-2
mol/L (filled diamonds) and 5×10⁻³ mol/L (open squares) KNO3 (Note, error bars are the 95 % confidence interval)…………………………………………………… 77
Figure 5.2 Zeta potential of serpentine as a function of pH at two values of ionic strength: 10-2
mol/L (filled diamonds) and 5×10⁻³ mol/L (open squares) KNO3………………….. 77

List of figures xvii
Figure 5.3 Zeta potential of pentlandite as a function of pH with supernatant as background
electrolyte compared to 10-2 mol/L KNO3 as background electrolyte………………. 79
Figure 5.4 Zeta potential of serpentine as a function of pH with supernatant as background electrolyte compared to 10-2 mol/L KNO3 as background electrolyte………………. 79
Figure 5.5 Zeta potential of pentlandite as a function Mg2+ concentration at pH 10…………… 80 Figure 5.6 Zeta potential of pentlandite as a function of pH in the presence of 50 mg/L Mg2+
compared to supernatant…………………………………………………………...... 81 Figure 5.7 Zeta potential of pentlandite conditioned with serpentine suspended in 10-2 mol/L
KNO3 (open squares) compared to result for pentlandite in 10-2 mol/L KNO3 (filled diamonds)…………………………………………………………………................ 82
Figure 5.8 Zeta potential of serpentine conditioned with pentlandite suspended in 10-2 mol/L
KNO3 (open squares) compared to the result for pentlandite in 10-2 mol/L KNO3 (filled diamonds)…………………………………………………………………..... 83
Figure 5.9 Zeta potential of pentlandite conditioned with serpentine suspended in supernatant
compared to result for pentlandite conditioned with serpentine suspended in 10-2 mol/L KNO3 (open squares).………………………………………………………... 83
Figure 5.10 Scanning electron micrographs of the pentlandite conditioned in 10-2 mol/L KNO3
solution alone at pH 10 [a]; conditioned in supernatant at pH 4 [b] and at pH 10 [c]; conditioned with serpentine at pH 10 [d] and a particle of fibrous serpentine [e]……………………………………………………………………………………. 85
Figure 6.1 Representation of the experimental design in coded units; original units are
displayed in the table on the right side……………………………………………… 97 Figure 6.2 Pareto chart of regression coefficients………………………………………………. 101 Figure 6.3 Comparison of modeled versus actual dispersion index…………………...………… 101 Figure 6.4 Contour plot of dispersion index (A/s) as a function of pH and CMC concentration
(mg/L). PAX content was fixed at its centre level (3 mg/L)………….……………... 102 Figure 6.5 Dispersion index as a function of CMC concentration for pH 6, 8 and 10. (Note,
symbols are to identify the trends)……………............................................................ 103 Figure 6.6 Optical micrographs of the pentlandite-serpentine systems (pH 10, 3 mg/L PAX,
10-2 mol/L KNO3) (a) serpentine alone; (b) pentlandite alone; (c) serpentine and pentlandite; (d) serpentine and pentlandite with 50 mg/L CMC…………………..... 104
Figure 7.1 Contact angle of pentlandite as a function of pH; PAX = 10-4 mol/L (filled
diamonds) and no PAX (open squares), NaNO3 = 10-3 mol/L. Error bars indicate 95 % confidence interval………………………………………………………….......... 115
Figure 7.2 Contact angle of Cu-activated pentlandite as a function of pH (open squares). PAX
= 10-4 mol/L, NaNO3 = 10-3 mol/L. For comparison the result for non-activated pentlandite is included (filled diamonds)…………………………………………… 116
List of figures xviii
Figure 7.3 Contact angle on Cu-activated pentlandite as a function of the pH in the presence of
magnesium (50 mg/L) (open squares). PAX = 10-4 mol/L, NaNO3 = 10-3 mol/L. For comparison the curve for the Cu-activated pentlandite in absence of magnesium is included (filled circles)………………………………………………. 117
Figure 7.4 Contact angle on Cu-activated pentlandite as a function of the pH in the presence of
magnesium (50 mg/L) (filled circles) when Na2CO3 pH is used as pH modifier. PAX = 10-4 mol/L, NaNO3 = 10-3 mol/L. For comparison the curves for the Cu-activated pentlandite in the presence of PAX (filled diamonds), and in the presence of PAX and magnesium (50 mg/L) (open squares) when NaOH is used as pH modifier are included………………………………………………………………... 118
Figure 7.5 Contact angle on Cu-activated pentlandite as a function of the pH in the presence of
CMC (50 mg/L) (open squares). PAX = 10-4 mol/L, NaNO3 = 10-3 mol/L. For comparison the curve for the Cu-activated pentlandite in absence of serpentine is included (filled diamonds)…………………………………………………………... 118
Figure 7.6 Contact angle on Cu-activated pentlandite as a function of the pH in the presence of
serpentine (0.1 g/L) and CMC (50 mg/L) (open triangles). PAX = 10-4 mol/L, NaNO3 = 10-3 mol/L. For comparison, curves for Cu-activated pentlandite with PAX and CMC (open squares), and with PAX and serpentine (filled squares) are included………………………………………………………………………………. 119
Figure 7.7 Comparison of modeled versus actual recoveries………………………………….... 123 Figure 7.8 Studentized residuals as a function of the predicted recovery………………………. 123 Figure 7.9 Pareto chart of regression coefficients………………………………………………. 125 Figure 7.10 Contour plot of pentlandite recovery as a function of serpentine content and CMC
concentration. pH, magnesium and copper concentrations were fixed at their centre level…………………………………………………………………………………... 125
Figure 7.11 Contour plot of pentlandite recovery as a function of pH and serpentine content.
CMC, magnesium and copper concentrations were fixed at their centre level……... 126 Figure 7.12 Species distribution diagram of magnesium in concentration percentage as a
function of pH. Mg species concentration equal to 50 mg/ (modified from Sui and Huang, 1998)………………………………………………………………………... 128
Figure A-1.1 X-ray diffraction of serpentine identified as lizardite. The diffraction peaks for
lizardite is shown…………………………………………………………………….. 138 Figure A-1.2 X-ray diffraction of chlorite identified as clinochlore with minor serpentine-
chlorite. The diffraction peaks for clinochlore (continuous line) and chlorite-serpentine (dashed line) are shown…………………………………………………... 139
Figure A-1.3 X-ray diffraction of talc identified as steatite. The diffraction peaks for steatite is
shown……………………………………………………………………………….... 139 Figure A-1.4 Particle size distribution for serpentine, chlorite and talc. P80 ca. 40 μm for
serpentine and 30 μm for chlorite and talc…………………………………………... 140

List of figures xix
Figure A-2.1 Schematic diagram of the ore processing……………………………………………. 142 Figure A-2.2 Schematic diagram of the rougher concentrate processing………………………...... 143 Figure A-2.3 X-ray diffraction of pentlandite used for small-scale flotation. The diffraction peaks
for pentlandite (continuous line) and pyrrhotite (dashed line) are shown…………… 144 Figure A-2.4 X-ray diffraction of serpentine used for small-scale flotation. The diffraction peaks
for clinochrysotile (continuous line) and pyrrhotite (dashed line) are shown……….. 144 Figure A-2.5 Particle size distribution for pentlandite used in the flotation tests. P80 ca. 120
μm……………………………………………………………………………………. 145 Figure A-2.6 Particle size distribution for serpentine used in the flotation and contact angle tests.
P80 ca. 25 μm………………………………………………………………............... 145
Figure A-2.7 Optical micrographs of serpentine (left) and pentlandite (right)…………………….. 146 Figure A-2.8 X-ray diffraction pattern of pentlandite used for contact angle measurements
compared to the standard diffraction pattern for pentlandite (thick lines)…………... 146 Figure A-3.1 Magnesium in solution as a function of time in supernatant………………………… 147 Figure A-4.1 Calibration curve for determining sulphate concentration….……………………….. 150 Figure A-5.1 Picture of a bubble on a hydrophobic surface……………………………………...... 153

xx
List of tables
Table 2.1 Main MgO-minerals in ultramafic ores at Thompson (Lee, 2006)…………………… 9 Table 2.2 Dispersants classification (Kissa, 1999)……………………………………………… 14 Table 3.1 Detection limits and analytical sensitivity for some elements in inductively coupled
plasma-optical emission spectrometry and atomic absorption spectroscopy ………... 41 Table 4.1 Mineralogical characterization (XRD) of samples…………………………………… 52 Table 4.2 Comparison between i.e.p. and p.z.c. for samples tested……………………………... 61 Table 5.1 Measured elemental composition of the sample determined by AAS compared to
ideal pentlandite composition and composition determined by microprobe analysis on identified pentlandite grains……………………………………………………….. 73
Table 5.2 Chemical species in the supernatant………………………………………………….. 78 Table 6.1 Dispersion index for the experimental design………………………………………... 98 Table 6.2 Coefficient and P values of the factors and interactions on the first regression model 99 Table 6.3 Coefficient and P values of the factors and interactions on the final regression model 100 Table 7.1 Elemental composition of pentlandite samples for contact angle and small-scale
flotation tests. Theoretical composition of is also shown…………………………….. 111 Table 7.2 Conditioning of pentlandite for contact angle measurements………………………… 113 Table 7.3 Levels of the factors considered in the experimental design…………………………. 114 Table 7.4 Recovery of pentlandite according to experimental design…………………………... 121 Table 7.5 Coefficient of the first regression model……………………………………………... 121 Table 7.6 Coefficients of the final regression model……………………………………………. 122 Table A-2.1 Main mineral phases in the Thompson ultramafic ore………………………………... 141 Table A-3.1 Metals in solution in supernatant……………………………………………………... 148 Table A-3.2 Sulphate concentration in supernatant calculated by turbidimetry…………………... 148 Table A-3.3 Chloride concentration in supernatant calculated by argentometric titration………… 148

1
1
Introduction
Pentlandite, typically given the formula (Ni,Fe)9S8, is the most common sulphide nickel
mineral and the source of much of the world’s nickel. These sulphide ores are universally
treated by flotation. In the case of ultramafic ores, the major gangue includes a host of
MgO-minerals (Edwards et al., 1980). These minerals can reduce selectivity in flotation,
causing loss of Ni-mineral to the tails and in some operations reporting in significant
amount to the concentrate, diluting grade and increasing transport and smelting costs.
The mechanisms by which MgO-minerals degrade flotation performance include
entrainment, physical entrapment, true flotation of naturally hydrophobic particles or
through activation which promotes recovery to concentrate, and hetero-aggregation (e.g.,
slime coating) that may also induce loss of Ni-mineral to tails. Among these
Chapter 1 2
mechanisms, slime coating is explored in this study.
Slime coating is believed to be primarily controlled by the magnitude and sign of the
surface charge of the interacting particles as reflected by zeta potential measurements.
Oppositely charged or near-neutral charged particles tend to aggregate. This electrostatic
mechanism is suspected in the case of MgO-gangue slime coating of pentlandite (Dai et
al., 2009; Xu and Wells, 2006).
Slime coating can be controlled using dispersants, which adsorb preferentially onto
slimes, reversing and/or increasing the surface charge and preventing electrostatic
attraction. In the case of pentlandite other remedial techniques such as salt addition and
flotation at acidic pH which again influence surface charge have been shown to improve
selectivity against MgO-minerals (Senior and Thomas, 2005; Mani et al., 1997; Wellham
et al., 1992).
1.1. Objectives of the thesis
The general objective is to determine the surface characteristics of the minerals in an
ultramafic ore in order to interpret and control particle-particle and particle-chemical
species (reagents) interactions and improve flotation selectivity. As steps towards this
goal, the following specific tasks were addressed:
To determine whether isoelectric point or point of zero charge of two MgO-
minerals, serpentine and chlorite, controlled the interactions.
To determine the effect of the presence of dissolved species and serpentine (the
most abundant MgO-gangue in ultramafic ore) on the electrokinetic behaviour of
pentlandite.

Introduction 3
To determine the effect of flotation reagents on aggregation/dispersion in the
pentlandite-serpentine system.
To determine the effect of flotation reagents on the hydrophobicity of pentlandite.
1.2. Structure of the Thesis
The thesis consists of nine chapters. Objectives and scope of the research are given in
Chapter 1. The background, which describes ultramafic ore mineralogy and problems
related to mineral processing, is discussed in Chapter 2. Experimental techniques and
theory are included in Chapter 3. Comparison of isoelectric point and point of zero
charge of the specimen samples of MgO-minerals are presented in Chapter 4. A
systematic study of electrokinetic behaviour of pentlandite and serpentine is found in
Chapter 5. The aggregation/dispersion state of the pentlandite-serpentine system is
presented in Chapter 6. The effect of flotation reagents and dissolved mineral species on
hydrobobicity of pentlandite is discussed in Chapter 7. Although Chapters 4-7 contain
conclusion sections, the overall conclusions are summarized in Chapter 8, which includes
the intended contributions to the original knowledge and recommendations for future
work. Following Chapter 8, five appendixes providing supporting material are included.
This thesis was prepared as a manuscript-based structure. Consequently, some repetition
is expected, especially in the introduction sections of Chapters 4-7.
References
Edwards C.R., Kipkie W.B., Agar G.E. (1980) The effect of slime coatings of the
serpentine minerals, chrysotile and lizardite, on pentlandite flotation. International
Journal of Mineral Processing 7: 33-42
Chapter 1 4
Dai Z., Bos J.A., Quinn P. Lee A., Xu M. Flowsheet development for Thompson
ultramafic low-grade nickel ores. C.O. Gomez; J.E. Nesset, S.R. Rao (Eds.)
Advances in Mineral Processing Science and Technology. International Symposium
of the Metallurgical Society of CIM, 217-228. 2009
Mani H., Xu M., Quinn P. The effect of ultramafic mineralogy on pentlandite flotation.
J.A. Finch, S.R. Rao, I. Holubec (Eds.) Processing of Complex Ores, Mineral
Processing, and the Environment. International Symposium of the Metallurgical
Society of CIM, 63-76. 1997
Senior G.D., Thomas S.A. (2005) Development and implementation of a new flowsheet
for the flotation of a low grade nickel ore. International Journal of Mineral
Processing 78: 49-61
Wellham E.J., Elber L., Yan D.S. (1992) The role of carboxy methyl cellulose in the
flotation of a nickel sulphide transition ore. Minerals Engineering 5: 381-395
Xu M, Wells P.F. Effect of Slime Coating on Flotation of Nickel Sulphide Ores.
Proceesings of 23rd IMPC, Instambul, Vol. 2, 2006, 965-971
5
2
Background
Nickel is a silvery-white transition metal. It was first isolated in 1751 by Baron Axel
Fredrick Cronstedt, a Swedish chemist and mineralogist. Nickel is widely recognized
because of its use in coinage and its many household and industrial applications that
make it one of the most important metals (Encyclopædia Britannica, 2009).
2.1. Uses of Nickel
Nickel is seldom used in pure form. It is mostly used as an alloying element in stainless
steel and other alloy steels. Nickel (in combination with other elements such as
chromium and copper) is used to produce alloys with high strength and corrosion
resistance including super-alloys used in aircraft turbines and other high temperature

Chapter 2 6
applications (Encyclopædia Britannica, 2009; Bacon et al., 2002). A common application
is electroplating. A layer of electrochemically deposited nickel provides a substrate with
nickel’s natural resistance to corrosion which is exploited, for example, in food and
chemical-processing components. Electroplating is also used for decorative purposes
(Encyclopædia Britannica, 2009). A small amount of nickel is used in nonmetallic form.
Some nickel compounds are used as catalysts in processes such as petroleum refining or
as pigments and mordants. A summary of uses is given in (Figure 2.1).
Stainless steel
Other alloys
ElectroplatingChemicals
Stainless steel
Other alloys
ElectroplatingChemicals
Figure 2.1 – Main industrial uses for nickel
Source: Standard CIB Global Research http://www.standardbank.co.za
2.2. Occurrence
Nickel accounts for about 0.007 % of the Earth’s crust; however, a higher percentage lies
at the planet’s core. This segregation occurred when the Earth was young and hot, and
denser elements like nickel sank (Encyclopædia Britannica, 2009).

Background 7
2.3. Nickel deposits
Although nickel is a fairly common constituent of igneous rocks, few deposits qualify in
concentration, size and accessibility for exploitation. Countries with “world-class”
deposits are Russia, Canada, Australia, Indonesia and New Caledonia (France) (Figure
2.2).
* *
*
*
*
PhilippinesIndonesia
Cuba
Noril’sk
JinchuanSudbury
Voisey’s Bay
Murrin Murrin
New Caledonia
Kambalda
Stillwater
Bushveld
Great Dyke
Nickel sulphide deposit
Nickel laterite deposit * Associated platinum-group element deposit
Thompson
Raglan
* *
*
*
*
PhilippinesIndonesia
Cuba
Noril’sk
JinchuanSudbury
Voisey’s Bay
Murrin Murrin
New Caledonia
Kambalda
Stillwater
Bushveld
Great Dyke
Nickel sulphide deposit
Nickel laterite deposit * Associated platinum-group element deposit
Thompson
Raglan
Figure 2.2 – Major Nickel deposits. Modified from Elias (2002)
Nickel deposits can be classified in two main groups: laterites and sulphides.
Nickeliferous limonite, (Fe,Ni)O(OH), and garnierite (a hydrous nickel silicate) are the
main nickel phases in laterites while pentlandite [(Ni,Fe)9S8] is the most important nickel
mineralization among sulphide ores. Even though nearly 70 % of nickel resources are
contained in laterites, the bulk of production comes from sulphides due to the complex
and high-cost processing required for laterites (Bacon et al., 2002).
Chapter 2 8
Canada’s major nickel deposits include Sudbury, Thompson, Voisey’s Bay and Raglan.
All are associated with pyrrhotite (Fe1-xS) and MgO-minerals as the dominant gangue.
These deposits usually depend on combinations of nickel, copper and cobalt to be
profitable. However, low grade disseminated sulphide deposits like some ultramafic ores
with complex mineralization from Thompson may be economic due of their significant
size.
2.4. Issues in ultramafic ore processing
Ultramafic ores are more than 90 % composed of mafic rocks. Mafic is the term used to
define igneous rocks rich in FeO and MgO characterized by the presence of dark-colored
minerals such as olivine and pyroxene (Hurlbut and Sharp, 1998).
For sulphide deposits hosted in mafic-ultramafic rocks, the major gangue includes a
variety of MgO-minerals, which must be rejected as their presence in the Ni-concentrate
increases the slag melting point. The other common gangue, pyrrhotite, must be rejected
to reduce SO2 emissions.
The primary method for concentrating pentlandite is by froth flotation. This is usually
performed using thiol collectors in an alkaline pulp, sometimes with polyamines (DETA,
TETA) as pyrrhotite depressants, and polysaccharides (e.g., carboxymethyl cellulose,
CMC) to depress MgO-gangue.
MgO-minerals (e.g., serpentines) break readily. Thus size reduction (liberation) produces
fines or slimes, roughly particles less than ca. 10 μm. These gangue slimes can interfere
with flotation by forming a coating on the pentlandite surface. This has two
consequences: dilution of the concentrate when pentlandite partially coated remains
floatable and loss of pentlandite recovery when extensively coated pentlandite becomes
hydrophilic.
Background 9
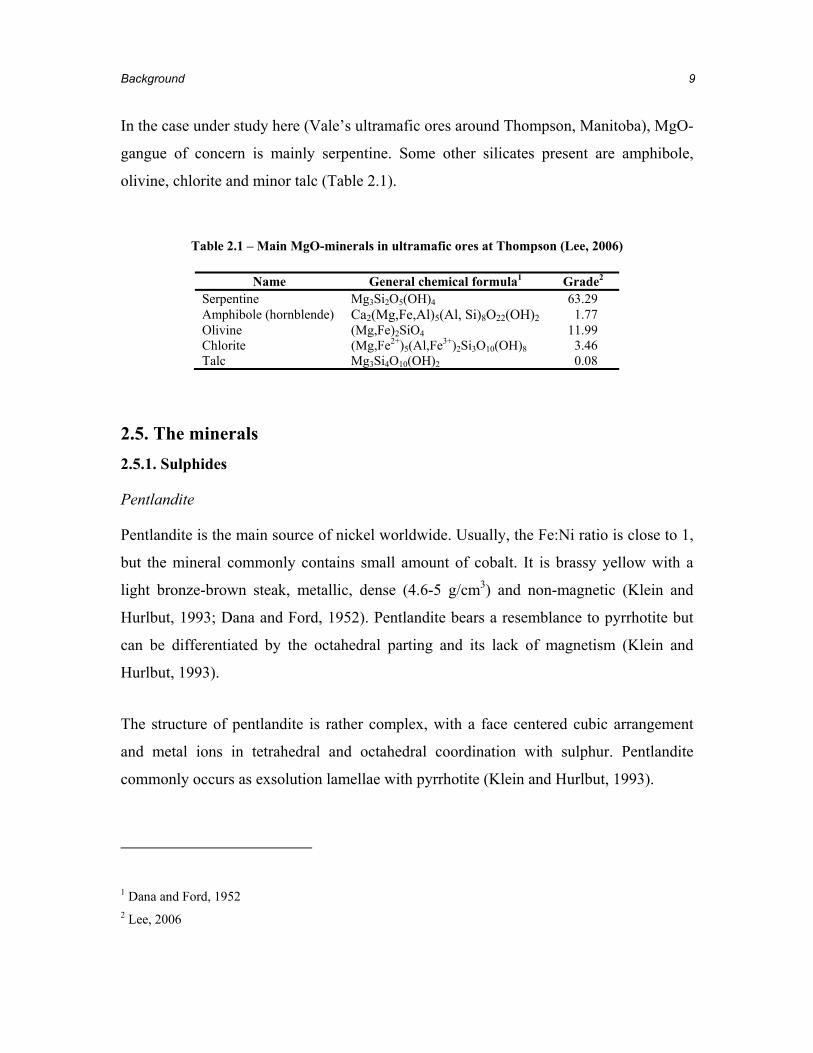
In the case under study here (Vale’s ultramafic ores around Thompson, Manitoba), MgO-
gangue of concern is mainly serpentine. Some other silicates present are amphibole,
olivine, chlorite and minor talc (Table 2.1).
Table 2.1 – Main MgO-minerals in ultramafic ores at Thompson (Lee, 2006)
Name General chemical formula1 Grade2
Serpentine Mg3Si2O5(OH)4 63.29 Amphibole (hornblende) Ca2(Mg,Fe,Al)5(Al, Si)8O22(OH)2 1.77 Olivine (Mg,Fe)2SiO4 11.99 Chlorite (Mg,Fe2+)5(Al,Fe3+)2Si3O10(OH)8 3.46 Talc Mg3Si4O10(OH)2 0.08
2.5. The minerals 2.5.1. Sulphides
Pentlandite
Pentlandite is the main source of nickel worldwide. Usually, the Fe:Ni ratio is close to 1,
but the mineral commonly contains small amount of cobalt. It is brassy yellow with a
light bronze-brown steak, metallic, dense (4.6-5 g/cm3) and non-magnetic (Klein and
Hurlbut, 1993; Dana and Ford, 1952). Pentlandite bears a resemblance to pyrrhotite but
can be differentiated by the octahedral parting and its lack of magnetism (Klein and
Hurlbut, 1993).
The structure of pentlandite is rather complex, with a face centered cubic arrangement
and metal ions in tetrahedral and octahedral coordination with sulphur. Pentlandite
commonly occurs as exsolution lamellae with pyrrhotite (Klein and Hurlbut, 1993).
1 Dana and Ford, 1952 2 Lee, 2006

Chapter 2 10
Pyrrhotite
Pyrrhotite, general formula Fe1-xS, is one of the most abundant iron sulphide minerals but
has little commercial value. It often occurs as a gangue mineral in pentlandite deposits.
To limit SO2 emissions during smelting, the separation of pentlandite from pyrrhotite has
been widely practiced and studied.
Pyrrhotite is a solid solution between two end members, pyrite and troilite. The non-
stoichiometry of pyrrhotite is caused by a deficiency of iron atoms in the Fe-layers (as
indicated by the formula: Fe1-xS) and ordering of these vacancies leads to superstructure
and non-stoichiometry of intermediate pyrrhotites (Morimoto et al., 1975). The non-
stoichiometric structure helps this mineral to oxidize 20-100 times faster than pyrite
(Shaw et al., 1988).
Pyrrhotite rarely exists as a single phase. Lamellae intergrowths of ferrimagnetic
monoclinic and antiferromagnetic hexagonal phases are responsible for the variation in
magnetic properties within single pyrrhotite grains (Miller et al., 2005; Pósfai et al.,
2000).
2.5.2. MgO-minerals
Serpentine
The main MgO-mineral in ultramafic ores is serpentine. Serpentine minerals are formed
through hydrothermal alteration of previously existing minerals, such as olivine and
pyroxene (Azer and Khalil, 2005). The idealized formula is Mg3Si2O5(OH)4, but
frequently iron, nickel, aluminum and other cations can substitute into the Mg position
(Tartaj et al., 2000). Chysotile, lizardite and antigorite are the most common serpentine
polymorphs found in nature.
Background 11
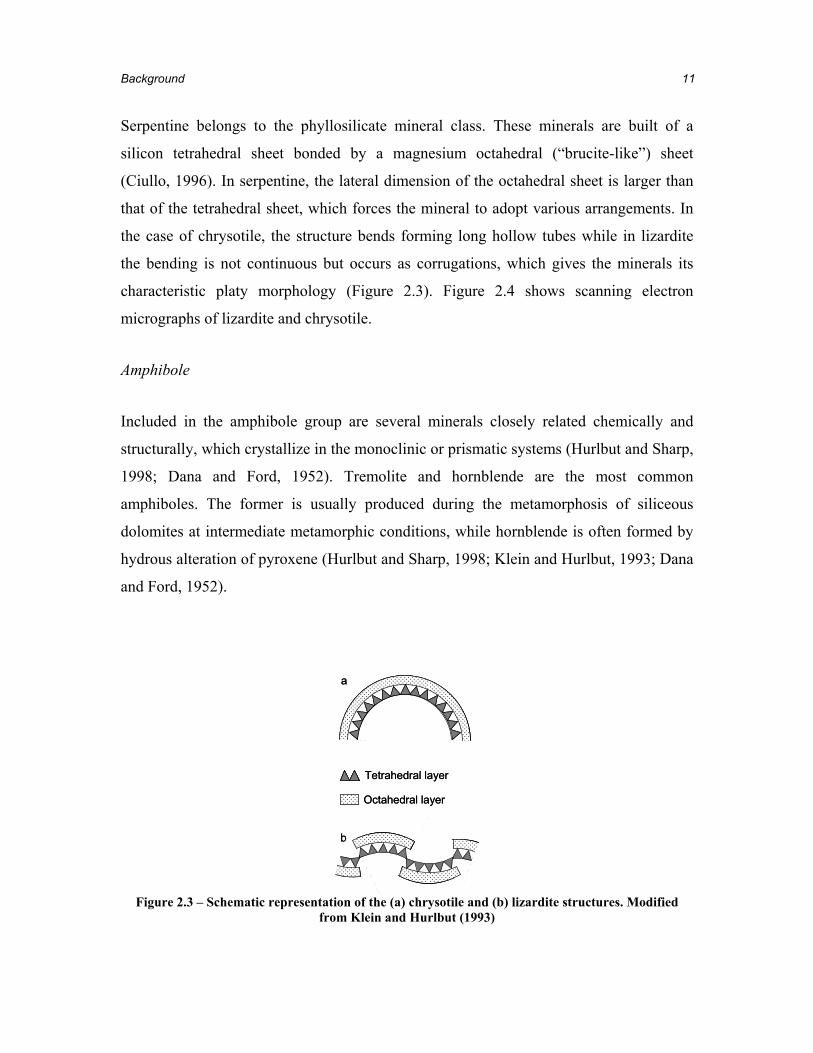
Serpentine belongs to the phyllosilicate mineral class. These minerals are built of a
silicon tetrahedral sheet bonded by a magnesium octahedral (“brucite-like”) sheet
(Ciullo, 1996). In serpentine, the lateral dimension of the octahedral sheet is larger than
that of the tetrahedral sheet, which forces the mineral to adopt various arrangements. In
the case of chrysotile, the structure bends forming long hollow tubes while in lizardite
the bending is not continuous but occurs as corrugations, which gives the minerals its
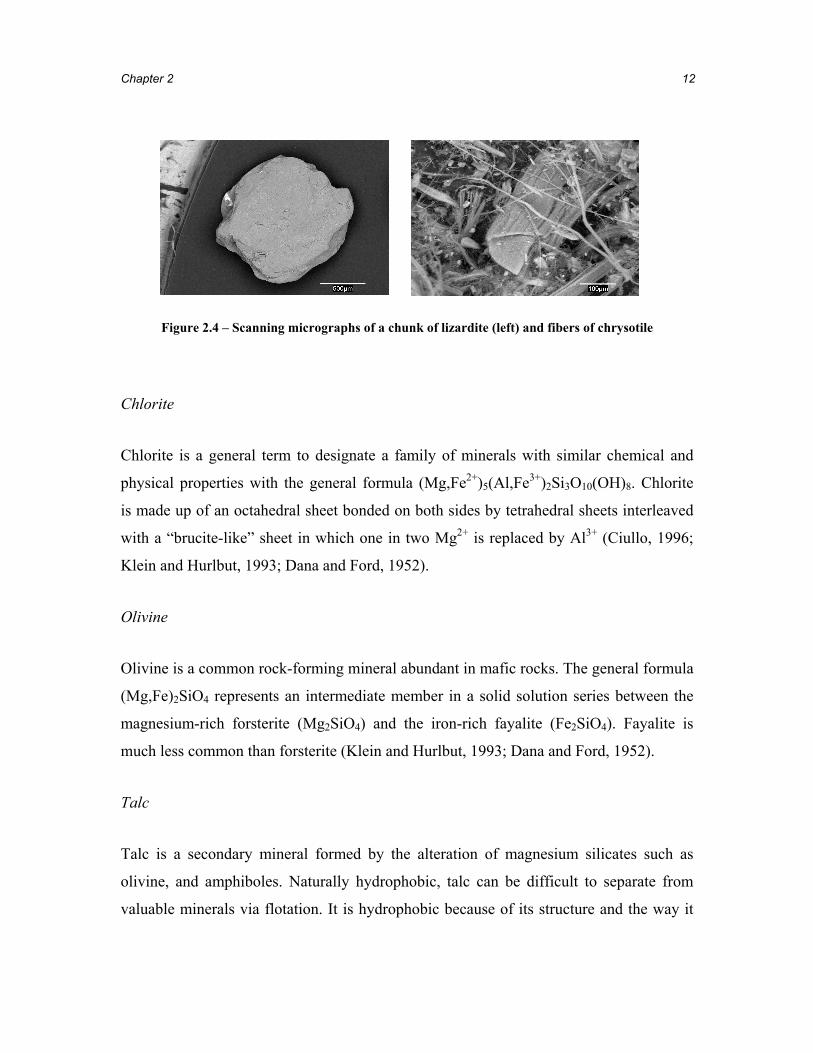
characteristic platy morphology (Figure 2.3). Figure 2.4 shows scanning electron
micrographs of lizardite and chrysotile.
Amphibole
Included in the amphibole group are several minerals closely related chemically and
structurally, which crystallize in the monoclinic or prismatic systems (Hurlbut and Sharp,
1998; Dana and Ford, 1952). Tremolite and hornblende are the most common
amphiboles. The former is usually produced during the metamorphosis of siliceous
dolomites at intermediate metamorphic conditions, while hornblende is often formed by
hydrous alteration of pyroxene (Hurlbut and Sharp, 1998; Klein and Hurlbut, 1993; Dana
and Ford, 1952).
Tetrahedral layer
Octahedral layer
a
b
Tetrahedral layer
Octahedral layer
a
b
Figure 2.3 – Schematic representation of the (a) chrysotile and (b) lizardite structures. Modified
from Klein and Hurlbut (1993)
Chapter 2 12
Figure 2.4 – Scanning micrographs of a chunk of lizardite (left) and fibers of chrysotile
Chlorite
Chlorite is a general term to designate a family of minerals with similar chemical and
physical properties with the general formula (Mg,Fe2+)5(Al,Fe3+)2Si3O10(OH)8. Chlorite
is made up of an octahedral sheet bonded on both sides by tetrahedral sheets interleaved
with a “brucite-like” sheet in which one in two Mg2+ is replaced by Al3+ (Ciullo, 1996;
Klein and Hurlbut, 1993; Dana and Ford, 1952).
Olivine
Olivine is a common rock-forming mineral abundant in mafic rocks. The general formula
(Mg,Fe)2SiO4 represents an intermediate member in a solid solution series between the
magnesium-rich forsterite (Mg2SiO4) and the iron-rich fayalite (Fe2SiO4). Fayalite is
much less common than forsterite (Klein and Hurlbut, 1993; Dana and Ford, 1952).
Talc
Talc is a secondary mineral formed by the alteration of magnesium silicates such as
olivine, and amphiboles. Naturally hydrophobic, talc can be difficult to separate from
valuable minerals via flotation. It is hydrophobic because of its structure and the way it

Background 13
breaks. The atoms within the layers are held together by ionic bonds, while the interlayer
atoms are linked by van der Waals forces. When ground, two kinds of surfaces are
formed: one resulting from the easy cleavage of the layers (basal plane) and the other
resulting from the rupture of chemical bonds (edge plane). The basal plane, which
represents about 90 % of the surface, has a very low charge (ideally zero if the talc has
no isomorphic substitution) and high hydrophobicity, unlike the edge plane, which has a
relatively high electric charge and is strongly polar (Fuerstenau et al., 1988).
2.6. Flotation reagents
2.6.1. Collectors
A collector is the chemical reagent that makes a particle hydrophobic enabling it to be
held at the water-air interface (Sutherland and Wark, 1955). Collectors generally
comprise polar and non-polar groups. The polar group should have affinity with the
desired mineral, which confers selectivity. The non-polar group is responsible for the
hydrophobic properties.
The flotation of sulphide minerals such as pentlandite is often performed with xanthate
type collectors (Figure 2.5)
Figure 2.5 – Schematic diagram of xanthate structure. M represents metal and R a hydrocarbonated
group

Chapter 2 14
The hydrocarbon chain length and structure (i.e., whether it is straight or branched)
introduces certain properties: in general, reagents with iso-structure are considered more
selective collectors than the straight-chain ones (Somasundaran and Wang, 2006). The
point of addition of collector (e.g. before or after pH adjustment) often has some effect
(Wiese et al., 2006).
Bozkurt et al. (1998) studied interactions between pentlandite, pyrrhothote and sodium
isobutyl xanthate by FTIR-ATR spectroscopy and open circuit potential measurements. It
was demonstrated that dixanthogen formation on pentlandite was promoted when the two
minerals were in direct contact.
2.6.2. Dispersants
Dispersants are reagents used to promote and keep particles dispersed in the slurry. They
act through several mechanisms, such as: being a good wetting agent for the particles to
be dispersed; lowering the viscosity of the dispersion; and stabilizing the dispersion by
controlling surface charge (Kissa, 1999). Both the wetting and stabilizing mechanisms
require adsorption of the dispersant onto the particle surface.
Dispersants may be classified as inorganic or organic, the latter being further sub-divided
as either low molecular weight or polymeric (macromolecular) (Table 2.2). Since
dispersion efficiency is related to adsorption of the dispersant, polymeric dispersants are
preferred over low molecular weight dispersants (Kissa, 1999). Dispersants derived from
natural sources are preferred to synthetic varieties because of environmental concerns.
Table 2.2 – Dispersants classification (Kissa, 1999)
Inorganic dispersants
Organic dispersants
Low molecular weight dispersants
Polymeric dispersants Natural or
derived from natural products
Synthetic
Homopolymers Copolymers

Background 15
Some macromolecular dispersants, especially those that belong to the polysaccharide
family, are used to reduce the natural floatability of some MgO-minerals (e.g., talc) in
pentlandite flotation. The most widely used are introduced below.
Carboxymethyl cellulose (CMC) type reagents have been used extensively. They are
derivates of cellulose with carboxymethyl groups bound to some of the hydroxyl groups
of the glucopyranose monomers. A schematic CMC structure is shown in the Figure 2.6.
Figure 2.6 – Carboxymethyl cellulose fragment
Adsorption of CMC on serpentine apparently reverses its positive surface charge, so
attraction forces between pentlandite and serpentine are eliminated (Bremmel et al.,
2005). However, Wellham et al. (1992) reported that the CMC dosage to achieve
satisfactory nickel selectivity is uneconomically high. They showed 10 % sodium
chloride solution gave superior results, particularly in the flotation of fine material.
Gums are macromolecular substances containing polysaccharides extracted from plants.
Guar gum is chemically modified from natural gums, which is used mainly as a
dispersant for silicate mineral slimes. There are several studies on the application of this
reagent for MgO-gangue (Shortridge et al., 2000; Kumar-Rath et al., 1997; Pugh, 1989).
Kumar-Rath et al. (1997) found that guar gum gave excellent depression of talc and its
effect was independent of pH. They proposed that the adsorption mechanisms are
hydrogen bonding and chemical interaction.

Chapter 2 16
Dextrin is a common dispersant made by the hydrolysis of natural starch with dilute
acids. It can vary in chain length and configuration, molecular weight and in level and
type of impurities. It has been widely used to depress hydrophobic minerals such as talc,
coal and molybdenite by producing an adsorbed hydrophilic coating as a result of the
polar groups of the macromolecule. Apparently, adsorption of dextrin on mineral
surfaces takes place through hydrogen bonding (Kumar-Rath et al., 1997).
Belonging to the synthetic class of dispersant, block copolymers may have a place in the
flotation of ultramafic ores. They are formed by two homopolymers joined at their edges.
Consequently, block copolymers are adsorbed onto a surface if one of the polymers has
an affinity for some surface sites while the other polymer remains in solution
(Hadjichristidis et al., 2003). This arrangement confers block copolymers with properties
that make them potential depressants/dispersants. Common monomers used to form
copolymers are isobutylene, ethylene oxide and acrylamide.
2.6.3. pH modifiers
The pH of mineral pulps is critical for optimum flotation selectivity. In commercial
practice, the majority of pH modifiers are alkalis with acids only used to achieve
selectivity if alkaline conditions fail.
Alkalis are divided in two main groups: reagents that produce hydroxyl (OH-) by
dissociation (e.g., sodium hydroxide) and reagents which form OH- by hydrolysis (e.g.,
sodium carbonate). Equations 2.1 and 2.2 show dissociation of sodium hydroxide and
hydrolysis of carbonate, respectively.
−+ +→ OHNaNaOH 2.1

Background 17
−−
−−−
−+
+↔+
+↔+
+→
OHCOHOHHCO
OHHCOOHCO
CONaCONa
3223
22
3
2332 2
2.2
The effects of pH on flotation systems are both on the mineral surfaces and on the
solution chemical species. These effects are briefly discussed.
Effect on the minerals
Surface charge – For many minerals, OH- and H+ are potential determining ions, i.e.,
they determine the surface charge and the electrochemical potential of the double layer
and thus hinder or promote chemical species adsorption.
Mineral dissolution – All solids dissolve to a different degree which can be controlled by
the pH of the media. Some silicates, for example, demonstrate incongruent dissolution
depending on the pH: alkaline conditions facilitate the detachment of silicon, while at
low pH magnesium is preferentially released from the lattice (Pokrovsky and Schott,
2000 a, b; Brady and Walther, 1989).
Surface hydration – pH affects the hydration of the surface by the direct adsorption of
hydroxyls and protons, which changes the stability of the hydrated layer surrounding the
particle. Sometimes, the effect is indirect: in the case of some silicates, the variability in
H+/OH- concentration can enhance or hinder the adsorption of other ions at sites that are
otherwise occupied by water molecules (He et al., 1999; Goldberg et al., 1996;
Ramachandran et al., 1993).

Chapter 2 18
Effect on chemical species
Active form of chemical species – pH can change the degree of dissociation of
compounds into ions and control the chemical species present by processes such as
hydrolysis. For example, most metallic ions precipitate as hydroxides at alkaline pH.
Stability of reagents – For example, the xanthate ion can hydrolyse to form xanthic acid,
which decomposes at acidic pH. In neutral and alkaline media, xantahtes decompose by
another mechanism known as hydrolytic decomposition (Rao, 1971).
Competition for surface sites – Hydroxyls and protons can compete with collectors and
other reagents for adsorption sites on mineral surfaces.
2.7. Some other factors affecting flotation
2.7.1. Dissolved species
Most minerals dissolve to some extent in aqueous solution. The dissolved species can
undergo further reactions such as hydrolysis, complexation, adsorption, and bulk
precipitation. The nature of the equilibria involved in such reactions will determine the
interfacial properties of the particle, and consequently its floatability.
For example, polyvalent metallic ions can absorb specifically on minerals; this
phenomenon occurs when the cation involved hydrolyses to its first hydroxy complex or
it precipitates on the particle surface as a hydroxide. In general, adsorption of cations
increases markedly at pH values just below that required for the precipitation of the
corresponding metal hydroxide. Fuerstenau and Palmer (1976), in experiments with
quartz, found that flotation arises only after metal ions are present in the system within a
pH range in which hydrolysis to the first hydroxy complex occurs.

Background 19
Not all metal ions have a flotation effect. Fuerstenau et al. (1965) observed that flotation
of quartz in presence of amyl xanthate did occur with Pb2+ and Zn2+ ions, but not with
copper or magnesium ions. If the first hydroxy complex of metal ions is the responsible
for activation, Cu2+ will not be expected to act as a activator because in the presence of
xanthate cupric ions are reduced to cuprous, thus there would not be a valence site for the
collector ion. In the case of Mg2+, since Mg-xanthate does not form (it is essentially
completely soluble) flotation is not possible.
In some contrast, Fornasiero and Ralston (2005) studying inadvertent activation of
silicate minerals noted that lizardite, chlorite and quartz can be activated with Cu2+ or
Ni2+ and floated with xanthate in the pH region from 7 to 10, where copper and nickel
form positively charged hydroxides that adsorb on the negatively charged silicate
surface. It was observed that activation was much more pronounced for copper than for
nickel. They concluded that the increased quartz flotation with Cu2+ was the result of
xanthate adsorption and the formation of hydrophobic species of cuprous xanthate and
dixanthogen. Nagaraj and Brinen (1996) studied the adsorption of sulphide collectors on
apparently copper-activated pyroxene by SIMS (secondary ion mass spectroscopy) and
XPS (X-ray photoelectron spectroscopy). They found that in the presence of thiol
collectors, copper on pyroxene was in the Cu+ form.
2.7.2. Process water
Process water always contains ions such as Ca2+, Mg2+, SO42-, etc. The type of chemical
species present in water is an essential factor in designing flotation conditions. It has
been observed that Ca2+ activates pentlandite, and to a lesser extent pyrrhotite (Malysiak
et al., 2002). Rao and Finch (1991) found that the presence of cations enhances uptake of
xanthate-dixanthogen by pyrrhotite at pH 8.4. Thiosulphate ions are reported to increase
pentlandite recovery (Kirjavainen et al., 2002).

Chapter 2 20
References
Azer M.K., Khalil A.E.S. (2005) Petrological and mineralogical studies of Pan-African
serpentinites at Bir Al-Edeid area, central Eastern Desert, Egypt. Journal of African
Earth Sciences 43: 525-536
Bacon W.G., Dalvi A.D., Rochon B.A., Selby M. (2002) Nickel Outlook – 2000 to 2010.
CIM Bulletin 95: 47-52
Bozkurt V., Xu Z., Finch J.A. (1998) Pentlandite/pyrrhotite interaction and xanthate
adsorption. International Journal of Mineral Processing 52: 203-214
Brady P.V., Walther J.V. (1989) Controls on silicate dissolution rates in neutral and basic
pH solutions at 25 0C. Geochimica et Cosmochimica Acta 53: 2823-2830
Bremmell K.E., Fornasiero D., Ralston J. (2005) Pentlandite-lizardite interactions and
implications for their separation by flotation. Colloids and Surfaces A:
Physicochemical and Engineering Aspects 252: 207-212
Ciullo P.A., “Silicate Structure”, Industrial Minerals and their uses–A Handbook and
Formulary, PA Ciullo, Ed., William Andrew Publishing, 1996, Westwood, NJ, USA,
1-16
Dana E.S., Ford W.E. (1952) Manual of Mineralogy. John Wiley & Sons: Cambridge
Elias M., Nickel Laterite Deposits – Geological overview, Resources and Exploitation. In
Giant Ore Deposits: Characteristics, Genesis, and Exploration, D.R. Cooke and J.
Pongratz (Eds.), Centre for Ore Deposit Research Special Publication 4. University
of Tasmania, 205-220. 2002

Background 21
Fornasiero D., Ralston J. (2005) Cu(II) and Ni(II) activation in the flotation of quartz,
lizardite and chlorite. International Journal of Mineral Processing 76: 75-81
Fuerstenau M.C., Lopez-Valdivieso A., Fuerstenau D.W. (1988) Role of hydrolyzed
cations in the natural hydrophobicity of talc. International Journal of Mineral
Processing 23: 161-170
Fuerstenau M.C., Miller J.D., Pray R.E., Perinne B.F. (1965) Metal ion activation in
xanthate flotation of quartz. Transactions of the American Institute of Mining,
Metallurgical and Petroleum Engineers 232: 359-364
Fuerstenau M.C., Palmer B.R. Anionic flotation of oxides and silicates. M.C. Fuerstenau
(Ed). Flotation A.M. Gaudin Memorial Volume 1, 148-196. 1976. New York
Goldberg S., Forster H. S., Lesch S. M., Heick E. L. (1996) Influence of anion
competition on boron adsorption by clays and soils. Soil Science 161: 99-103
Hadjichristidis N., Pispas S., Floudas G. (2003) Block Copolymers: Synthetic Strategies,
Physical Properties, and Applications. John Wiley and Sons Inc.
He J. Z., De Cristofaro A., Violante A. (1999) Comparison of adsorption of phosphate,
tartrate, and oxalate on hydroxy aluminum montmorillonite complexes. Clays and
Clay Minerals 47: 226-233
Hurlbut C.S., Sharp W.E. (1998) Dana's Minerals and how to study them. John Wiley &
Sons: New York
Kirjavainen V., Schreithofer N., Heiskanen K. (2002) Effect of some process variables
on flotability of sulfide nickel ores. International Journal of Mineral Processing 65:
59-72

Chapter 2 22
Kissa E. (1999) Dispersions. Characterization, Testing, and Measurements. At Hubbart
(Ed). Surfactant Science Series. Marcel Dekker: New York
Klein C., Hurlbut C.S., (1993) Manual of Mineralogy. John Wiley & Sons: New York
Kumar-Rath R., Subramanian S., Laskowski J.S. (1997) Adsorption of dextrin and guar
gum onto talc. A comparative study. Langmuir 13: 6260-6266
Lee, A. (2006) Pipe Lake Mineralogy. Internal Communication
Malysiak V., O'Connor C.T., Ralston J., Gerson A.R., Coetzer L.P., Bradshaw D.J.
(2002) Pentlandite-feldspar interaction and its effect on separation by flotation.
International Journal of Mineral Processing 66: 89-106
Miller J.D., Li J., Davidtz J.C., Vos F. (2005) A review of pyrrhotite flotation chemistry
in the processing of PGM ores. Minerals Engineering 18: 855-865
Morimoto N., Gyobu A., Mukaiyama H., Izawa E. (1975) Crystallography and stability
of pyrrhotites. Economic Geology 70: 824 -833
Nagaraj D.R., Brinen J.S. (1996) SIMS and XPS study of the adsorption of sulfide
collectors on pyroxene: a case for inadvertant metal ion activation. Colloids and
Surfaces A: Physicochemical and Engineering Aspects 116: 241-249
Nickel (2009). In Encyclopædia Britannica. Retrieved May 26, 2009, from
Encyclopædia Britannica Online:
http://www.britannica.com/EBchecked/topic/414238/nickel
Pokrovsky O.S., Schott J. (2000 a) Forsterite surface composition in aqueous solutions: a
combined potentiometric, electrokinetic, and spectroscopic approach. Geochimica et
Cosmochimica Acta 64: 3299-3312

Background 23
Pokrovsky O.S., Schott J. (2000 b) Kinetics and mechanism of forsterite dissolution at 25
°C and pH from 1 to 12. Geochimica et Cosmochimica Acta 64: 3313-3325
Pósfai M., Sharp T.G., Kontny A. (2000) Pyrrhotite varieties from the 9.1 km deep
borehole of the KTB project. American Mineralogist 85: 1406–1415
Pugh R.J. (1989) Macromolecular organic depressants in sulphide flotation - A review, 1.
Principles, types and applications. International Journal of Mineral Processing 25:
101-130
Ramachandran A. R., Grutzeck M. W. (1993) Effect of pH on the hydration of tricalcium
silicate. Journal of the American Ceramic Society 76: 72-80
Rao S.R. (1971) Xanthates and Related Compounds, Marcel Dekker, Inc., New York
Rao S.R., Finch J.A. (1991) Adsorption of amyl xanthate at pyrrhotite in the presence of
nitrogen and implications in flotation. Canadian Metallurgical Quarterly 30: 1-6
Shaw S.C., Groat L.A., Jambor J.L., Blowes D.W., Hanton-Fong C.J., Stuparyk R.A.
(1998) Mineralogical study of base metal tailings with various sulfide contents,
oxidized in laboratory columns and field lysimeters. Environmental Geology 33:
209-217
Shortridge P.G., Harris P.J., Bradshaw D.J., Koopal L.K. (2000) The effect of chemical
composition and molecular weight of polysaccharide depressants on the flotation of
talc. International Journal of Mineral Processing 59: 215-224
Somasundaran P., Wang D. (2006) Solution Chemistry: Minerals and Reagents. Elsevier:
Amsterdam

Chapter 2 24
Sutherland K.L., Wark I.W. (1955) Principles of Flotation. Australasian Institute of
Mining and Metallurgy: Melbourne
Tartaj P., Cerpa A., Garcia-Gonzalez M.T., Serna C.J. (2000) Surface instability of
serpentine in aqueous suspensions. Journal of Colloid and Interface Science 231:
176-181
Wiese J., Harris P., Bradshaw D. (2006) The role of the reagent suite in optimising
pentlandite recoveries from the Merensky reef. Minerals Engineering 19: 1290-1300
Wellham E.J., Elber L., Yan D.S. (1992) The role of carboxy methyl cellulose in the
flotation of a nickel sulphide transition ore. Minerals Engineering 5: 381-395
25
3
Experimental techniques
This chapter aims to determine the mechanisms of the interaction of pentlandite and
MgO-minerals. This was achieved through a systematic characterization of the minerals,
relating structure to relevant properties. This approach included a comparison of
isoelectric point (obtained by zeta potential calculated from electrophoretic mobility) and
point of zero charge (calculated using a titration technique) of some MgO-minerals
relevant to ultramafic ore systems. This was followed by zeta potential measurements on
samples of pentlandite and serpentine (main MgO-gangue) isolated from ultramafic ore
from the Thompson area (Manitoba). These measurements were conducted on the
individual minerals and on mixtures using different background solutions to
progressively approach actual flotation conditions. To help interpret the findings,
scanning electron microscopy with energy dispersive spectroscopy was used.

Chapter 3 26
The effect of dispersant, collector, and other chemical species and pH on the state of
aggregation/dispersion of the pentlandite-serpentine system was investigated by
turbidimetry. Direct observations by light microscopy provided visual support for the
aggregation/dispersion state of the systems.
Contact angle of pentlandite as a function of reagent dosage was measured using the
captive bubble technique and small-scale flotation tests were performed in a
Partridge/Smith cell. These techniques provided a guide to the effect of flotation reagents
and other chemical species on pentlandite hydrophobicity and floatability.
3.1. Surface charge
3.1.1. Mechanisms of surface charge development
Surface charge determines the adsorption of chemical species and is an important factor
in controlling particle-particle interactions (e.g., flocculation, coagulation, aggregation).
All solids immersed in polar media (e.g., aqueous solutions) develop a charged surface.
The main mechanisms of charging are described briefly below (Shaw, 1969).
The ionization/dissociation of ionogenic groups can take place on the surface of a
solid resulting in the development of surface charge. The ionization of these
groups is pH dependant. This mechanism is responsible for the development of
surface charge on oxides, metal hydroxides, silicates and polymers among others.
Charge can develop by adsorption of ions. Surfaces in contact with aqueous
media tend to acquire negative charge due to the fact that cations are more easily
hydrated than anions.
Unequal dissolution of ions in the case of certain ionic substances can lead to a
net charge on the substrate.

Experimental techniques 27
Lattice substitutions and defects which can, in many cases, lead to an exchange of
one ion for another of similar ionic radius, which is known as isomorphic
substitution (Figure 3.1).
Figure 3.1 – Representation of charge development in talc [Mg3Si4O10(OH)2] by the substitution of
silicon by aluminum in the tetrahedral sheet and magnesium by iron in the octahedral sheet
3.1.2. The electrical double layer
The surface charge developed on a particle surface results in an unequal distribution of
ions in the adjacent media: ions of opposite charge (counterions) are attracted to the
surface, and ions of like charges (co-ions) are repelled from the surface.
As a consequence of this uneven distribution of ions in the vicinity of the particle, an
increase in the potential across the interface occurs. The distribution of ions in the
vicinity of the surface is important because it determines the rate of potential decay with
distance into the bulk solution, which in turn influences phenomena occurring at the
interface. Several models have been developed to describe the distribution (Hunter,
2001).
Helmholtz model
Helmholtz developed the earliest model of the electrical double layer over a century ago.
The model considers the solution to be a plane layer with a charge opposite to that of the
solid. The potential as a function of distance from the surface was solved and the model
was able to explain some phenomena such the electrophoretic response (i.e., particle

Chapter 3 28
motion in an electric field) but it did not account for some other phenomena such as
adsorption from solution.
Gouy-Chapman model
Gouy and Chapman independently made improvements to the Helmholtz model by
introducing a diffuse layer into the electrical double layer. They considered point charges
whose concentration decreases exponentially from the surface into the bulk solution.
Stern-Graham model
The Stern-Graham model is commonly applied in many areas of flotation surface
chemistry. The approach combined the Helmholtz and Gouy-Chapman models, giving an
internal compact (Helmholtz) layer and an outer diffuse layer and replaced the point
charges with ions of finite size. In addition, the concept of specific adsorption of ions
within the Helmholtz layer was introduced. The plane in which specific adsorption of
non-hydrated ions occurs is known as the inner Helmholtz plane (IHP), while that of the
closest approach for more weakly adsorbed hydrated ions is known as outer Helmholtz
plane (OHP) (Figure 3.2).
3.1.3. Ions in the double layer
The effect of chemical species on the surface charge and electric potentials determines
their probable allocation at the solid-liquid interface. The potential determining ions
(p.d.i.) are those species that have a fundamental control over the surface charge and the
surface potential of the solid. The specifically adsorbed ions are those whose adsorption
at the surface obeys forces other than electrostatic interactions. Specifically adsorbed
ions can be recognized by their ability to change the iso-electric point (i.e.p.). On the
other hand, the effect of non-specifically adsorbed ions is only apparent when the
underlying surface is of the opposite sign. Finally, the indifferent ions are those species

Experimental techniques 29
that control the extent of the double layer but are not involved in any specific interaction
with the surface (Hunter, 1981).
Electrokinetic (zeta) potential is the potential drop across the mobile part of the double
layer, which can be assumed to be the outer Helmholtz plane (OHP). Figure 3.2
illustrates a possible ion arrangement at a negatively charged surface.
Pote
ntia
l
Figure 3.2 – Schema of a possible ions distribution on a surface and effect on the different potentials
3.1.4. Point of zero charge
Point of zero charge (p.z.c.) is defined as the condition at which the surface charge of a
solid is zero. It is normally reported as the negative logarithm (base 10) of the molar
Chapter 3 30
concentration of the potential determining ions. If the p.d.i.’s are H+ and OH-, the point
of zero charge becomes the pH at which the surface charge is zero3.
Titration with each potential determining ion one by one is commonly used to determine
p.z.c. (Ardizzone et al., 1981; Hunter, 1981; Breeuwsma and Lyklema, 1971). The
technique depends on the fact that when a solid is prepared at its p.z.c. then dialyzed and
dried, if it is placed in solution at the same pH as the p.z.c. at any ionic strength, the pH
will not change. The procedure, described in detail by Hunter (1981), requires a precise
measurement of the surface area of the sample, which is frequently difficult to obtain.
Mular and Roberts (1966) proposed a simplified titration. This technique exploits the
effect on surface charge as the concentration of indifferent (background) electrolyte is
changed. As with any titration method, it is only valid if there are no other competing
processes.
The Mular-Robert (M-R) technique is also referred to as batch equilibration (Čerović et
al., 2007; Milonjić et al., 2007). The procedure is as follows. Samples are prepared at
different pH but the same ionic strength. At a given pH (pH1) indifferent electrolyte is
added to increase the ionic strength. When the new pH reading is stable, the reading is
noted (pH2). The point of zero charge is read from the plot of ∆pH (i.e., pH2 minus pH1)
as a function of pH2 as the pH at which ∆pH is zero.
In the M-R technique, the underlying principle is that the p.z.c. is based on the
calculation of the net surface charge density, σ0, given by Equation 3.1 (Hunter, 1981):
3 From here on, all solids will be assumed to have H+ and OH- as the only potential determining ions.
Experimental techniques 31
∑ Γ=i
iio Fzσ 3.1
where F is the Faraday constant, Γi is the adsorption density of potential determining ion,
and zi is their corresponding valence. When p.d.i.’s are H+/OH-, Equation 3.1 becomes,
)(0 −+ Γ−Γ=OHH
Fσ 3.2
Indifferent electrolyte strongly influences the surface charge when surface potential is
not zero. According to Equation 3.3 (Hunter, 1981):
00
=
⎟⎠
⎞⎜⎝
⎛−=xdx
dψεσ 3.3
where ε is the permittivity of the dielectric, and (dψ/dx) the potential decay given by the
Debye-Hückel approximation,
κψψ−=
dxd 3.4
where the parameter κ is defined as,
21
202
⎟⎟⎠
⎞⎜⎜⎝
⎛= ∑
kTzne ii
εκ 3.5
and e is the elementary charge, ni0 the electrolyte concentration, k the Boltzmann
constant, and T the absolute temperature.
In the M-R technique, ionic strength (given by indifferent electrolyte) is increased, and
consequently more p.d.i.’s will be adsorbed at the surface in order to maintain a constant
surface potential and κ is increased (Eq. 3.5). Thus, the rate of potential decay increases

Chapter 3 32
(Eq. 3.4), which causes more p.d.i. to adsorb at the surface when ψ ≠ 0 (Eq. 3.3). As a
result, this phenomenon induces a change in pH. The p.z.c. is located where there is no
change in pH.
3.1.5. Isoelectric point
The iso-electric point i.e.p. is defined as the negative logarithm (base 10) of the molar
concentration of H+ (i.e., pH) at which the zeta potential is zero (i.e., particles show no
electrokinetic response).
3.1.6. Electrokinetic phenomena
Electrokinetic phenomena can be generally defined as all phenomena involving fluid
motion adjacent to a charged surface. The most important electrokinetic phenomena are
briefly described (Delgado et al., 2007; IUPAC, 1971).
Electro-osmosis
Electro-osmosis is the motion of a liquid through a membrane (or other porous) structure
caused by the application of an electric field across the membrane. The electro-osmotic
velocity, υeo, is the uniform velocity of the liquid far from the charged interface. Usually,
the measured quantity is the volume flow through the membrane per unit of field strength
(electro-osmotic volume flow, Jυ); υeo and Jυ are positive if the flow is in the direction of
lower potential. The electro-osmotic pressure, ∆p, is the pressure difference across the
membrane needed to stop the electro-osmotic flow; ∆p is positive if the higher pressure is
on the high potential side.
Streaming potential
Streaming potential, Est, is the potential difference at zero current caused by the flow of
liquid under a pressure gradient through a membrane. This potential difference is created

Experimental techniques 33
by charge accumulation caused by the flow of counter-charges inside capillaries or pores;
Est is positive if the higher potential is on the high-pressure side.
Sedimentation potential
Sedimentation potential, Esed, or Dorn effect, is the potential difference at zero current
caused by the sedimentation of particles (or rise of bubbles) by gravitational forces (or
another external force, e.g., in a centrifuge). Charge destabilization created by the fluid
drag surrounding each particle induces numerous dipoles in the suspension. These
individual dipoles add together to determine the macroscopic potential difference
between two identical electrodes at different levels (or a different distances from the
rotation axis). Esed is positive if the lower (peripheral) electrode is negative.
Electrophoresis
Electrophoresisis is the movement of particles in a liquid medium when a peripheral
electric field (E) is applied. Electrophoretic velocity (υe) is the velocity of the particle
during electrophoresis and electrophoretic mobility (μe) is the velocity divided by the
electric field strength. The mobility is counted as positive if the particles move toward
the negative electrode and negative if they move in the opposite direction.
3.1.7. Calculation of zeta potential
Several models have been developed to calculate zeta potential from electrokinetic
phenomena. In this study, zeta potential was calculated from the electrophoretic
response. Thus, it is worth reviewing the models related to this phenomenon.
Experimentally, what is measured is the electrophoretic mobility, from which zeta
potential is calculated. The relationship between zeta potential and electrophoretic
mobility depends on the chosen model.

Chapter 3 34
There are two classic models that result from two limiting conditions: the Smoluchowski
and the Hückel equations. The limits are defined by the dimensionless product κa, where
‘a’ is the radius of the particle. If κa << 1 (thick double layer case) the relationship
between electrophoretic mobility and zeta potential is given by the Hückel equation; if κa
>> 1 (thin double layer case) zeta potential can be calculated with the Smoluchowski
equation. Figure 3.3 is a schematic of the two limits.
Figure 3.3 – Effect of a non-conductive particle on the applied field (a) κa << 1; (b) κa >> 1. The
broken line is at the distance of 1/κ from the particle surface (adapted from Hunter, 2001)
For nanoparticles suspended in a low concentrating electrolyte it is fairly easy to satisfy
the Hückel limit. In this model Equation 3.6 defines the relationship between the
electrophoretic mobility and zeta potential:
ηζμ 3
2ee = 3.6
For microparticles suspended in a moderate to highly concentration electrolyte the
Smoluchowski limit is applicable and the equation is:
ηζμ e
e = 3.7
The majority of flotation systems approach this case.
(b)(a)
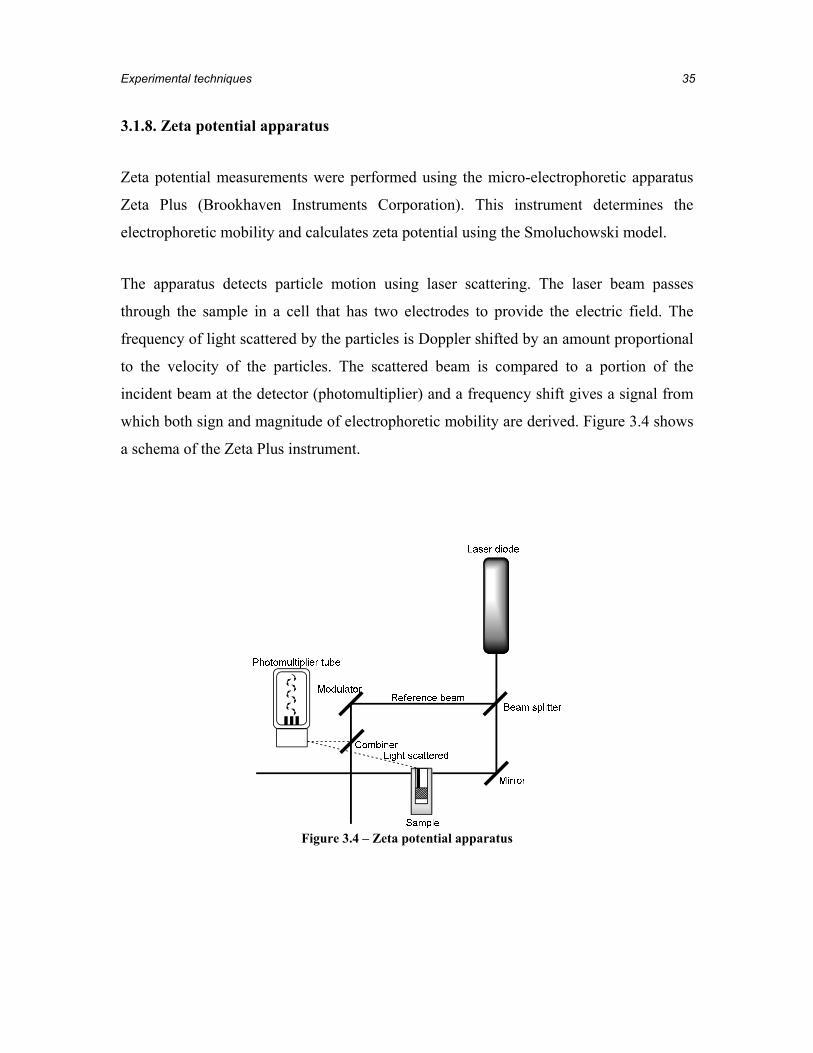
Experimental techniques 35
3.1.8. Zeta potential apparatus
Zeta potential measurements were performed using the micro-electrophoretic apparatus
Zeta Plus (Brookhaven Instruments Corporation). This instrument determines the
electrophoretic mobility and calculates zeta potential using the Smoluchowski model.
The apparatus detects particle motion using laser scattering. The laser beam passes
through the sample in a cell that has two electrodes to provide the electric field. The
frequency of light scattered by the particles is Doppler shifted by an amount proportional
to the velocity of the particles. The scattered beam is compared to a portion of the
incident beam at the detector (photomultiplier) and a frequency shift gives a signal from
which both sign and magnitude of electrophoretic mobility are derived. Figure 3.4 shows
a schema of the Zeta Plus instrument.
Figure 3.4 – Zeta potential apparatus

Chapter 3 36
3.2. Aggregation/dispersion
Numerous methods to study the state of aggregation/dispersion have been developed.
Generally, although several quantitative techniques are available, qualitative or semi-
quantitative methods are frequently chosen to perform routine tests or to study complex
(e.g. multi-component) systems.
The state of aggregation/dispersion can be studied by the examination of the whole
system or its components (i.e., the suspended particles, the aggregates and supernatant).
For studies monitoring the whole system, measures such as electrical conductance
(Mirnezami et al., 2003; Vergow et al., 1997; Ecanow et al., 1982), light scattering
(Moussa et al., 2007; Reinecke et al., 2000; Zentner et al., 1981) and rheological
properties (Hicyilmaz et al., 2006; Shapovalov et al., 2006; Muster and Prestidge, 1995)
have been used. For the inspection of an aggregated system by its components,
techniques such as sedimentation (Reichert et al., 2009), microscopy (Liu et al., 2009;
Zhang et al., 2008), particle size distribution (Atteia et al., 2001) and filtration (El
Ouriaghly et al., 1992) have been used.
In this study a dispersion index (DI) calculated from light scatter light and optical
microscopy was used to determine the state of aggregation/dispersion.
3.2.1. Dispersion index
Particles suspended in solution will aggregate or remain dispersed depending on the
particle-particle interaction forces. Aggregates usually settle faster than individual
particles, thus, dispersion index calculated from light scatter is a convenient, albeit
indirect measure.

Experimental techniques 37
The tests were conducted in a quartz cell in a UV/Visible spectrophotometer (Helios) set
at a wavelength of 550 nm. Dispersion index was reported as the slope of the absorbance-
time curve within the linear section. The technique proved straightforward, and suited to
the small amount of sample available. Figure 3.5 shows the experimental setup.
Figure 3.5 – Schematic arrangement for dispersion index measurements
3.2.2. Light microscopy
Optical (or light) microscopy is useful for visual examination of the state of
aggregation/dispersion. It has the advantage that size and shape of aggregated and
individual particles can be monitored in-situ, at least for particles larger than ca. 200 nm.
Electronic microscopy can handle smaller particles, but the required sample preparation
prior the inspection may distort the actual state of the aggregates (Kissa, 1999).
In this study, images of diluted suspension samples were taken rather than individual
aggregates. After sample conditioning, a pipette was used to transfer the sample of the
suspension to a beaker and the sample diluted several times with supernatant. A sub-
sample was withdrawn and placed in a Petri dish and examined under a petrographic
microscope (Leitz Laborluz 11POL) equipped with a video camera (Sony CCD Iris).
Chapter 3 38
3.3. Hydrophobicity and floatability
Flotation relies on mineral particles suspended in water attaching to passing gas bubbles.
The bubble must displace water from the surface and make an effective contact; in other
words, the mineral must be hydrophobic (Rao and Leja, 2004). A measure of
hydrophobicity is the contact angle.
The floatability can be defined as the response of minerals to the flotation process. Thus
parameter is closely related to the hydrophobicity.
3.3.1. Contact angle
The methods that have been developed for measurement of contact angle applicable to
mineral surfaces can be divided into two main groups: ones applicable to flat, smooth
surfaces (e.g., captive bubble technique), and ones used for particles (e.g., capillary
penetration method).
Measurement of contact angle using the captive bubble technique is popular due to its
simplicity and small sample mass requirements. The technique is not universally
accepted as providing a measure relevant to flotation processes. One argument is that real
solid surfaces are heterogeneous, composed of hydrophobic micro-domains coexisting
with hydrophilic areas (Rao and Leja, 2004).
In counterpoint, there are examples of successful description of flotation systems by
contact angle measurements using the captive bubble technique. Contact angle
measurements continue to show a correlation between hydrophobicity and flotation
recovery and between hydrophobicity and adsorption of reagents (Dávila-Pulido, 2010;
Beaussart et al., 2009; Holuszko et al., 2008; Mierczynska-Vasilev et al., 2008; Beattie et
al, 2006; Osasere, 2000).

Experimental techniques 39
The main experimental challenge in this technique lies in obtaining a clean, flat mineral
surface giving reproducible results. To address this problem, the experimental procedure
proposed by Wark and Cox (1934) as reported by Chau (2009) was adopted. The
technique consists of abrasion and/or polishing under distilled, deoxygenated water using
a meticulously controlled environment. The specimen is then ultrasonicated (to remove
particles of abrasive material and abraded mineral left on the surface after polishing) and
dried in an oxygen-free environment. After conditioning, the sample was transferred to
the experimental setup (Figure 3.6). A bubble of about 1 mm in diameter produced by a
digital syringe was placed in contact with the sample. Finally, a picture was taken and
processed with an image analyzer to determine the contact angle.
Figure 3.6 – Top view of the platform for contact angle measurements (modified from Dávila-Pulido, 2010)
3.3.2. Small-scale flotation
The flotation tests were carried out in the cell described by Partridge and Smith (1971).
The device is made of glass closed with a fritted glass disc at the bottom of the cell where
the gas is introduced. The cell had a transversal area of 5.3 cm2 and a height of ca. 26 cm
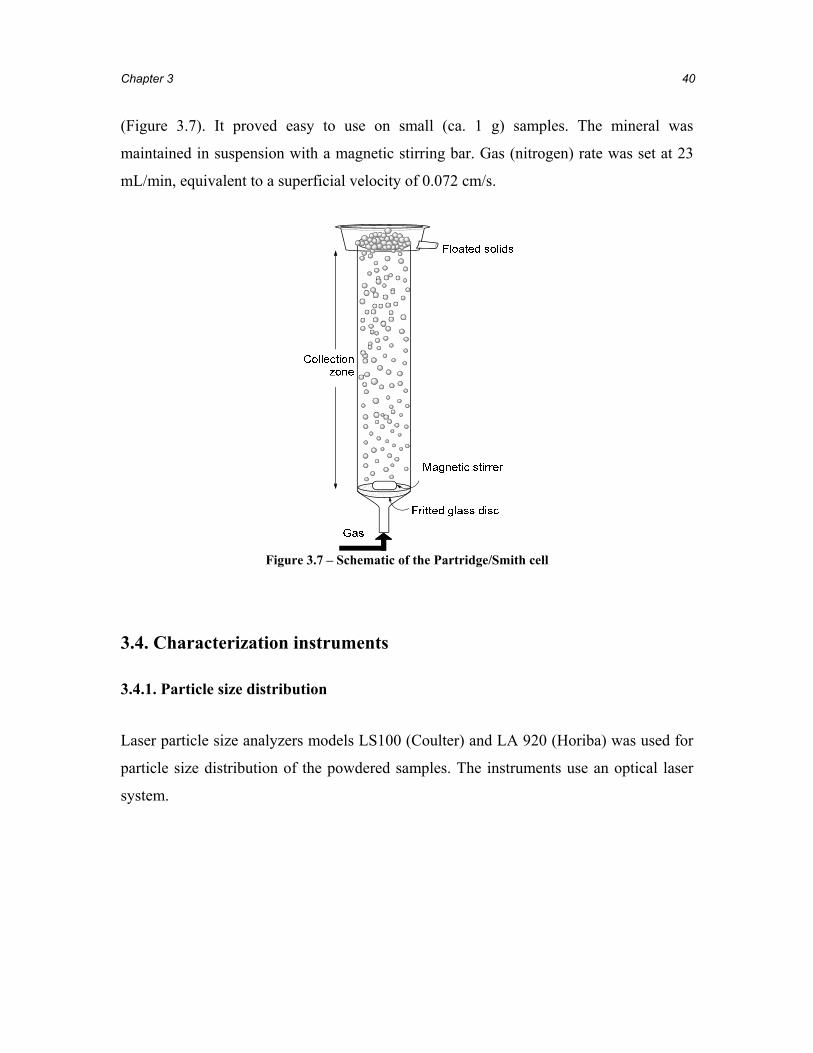
Chapter 3 40
(Figure 3.7). It proved easy to use on small (ca. 1 g) samples. The mineral was
maintained in suspension with a magnetic stirring bar. Gas (nitrogen) rate was set at 23
mL/min, equivalent to a superficial velocity of 0.072 cm/s.
Figure 3.7 – Schematic of the Partridge/Smith cell
3.4. Characterization instruments
3.4.1. Particle size distribution
Laser particle size analyzers models LS100 (Coulter) and LA 920 (Horiba) was used for
particle size distribution of the powdered samples. The instruments use an optical laser
system.
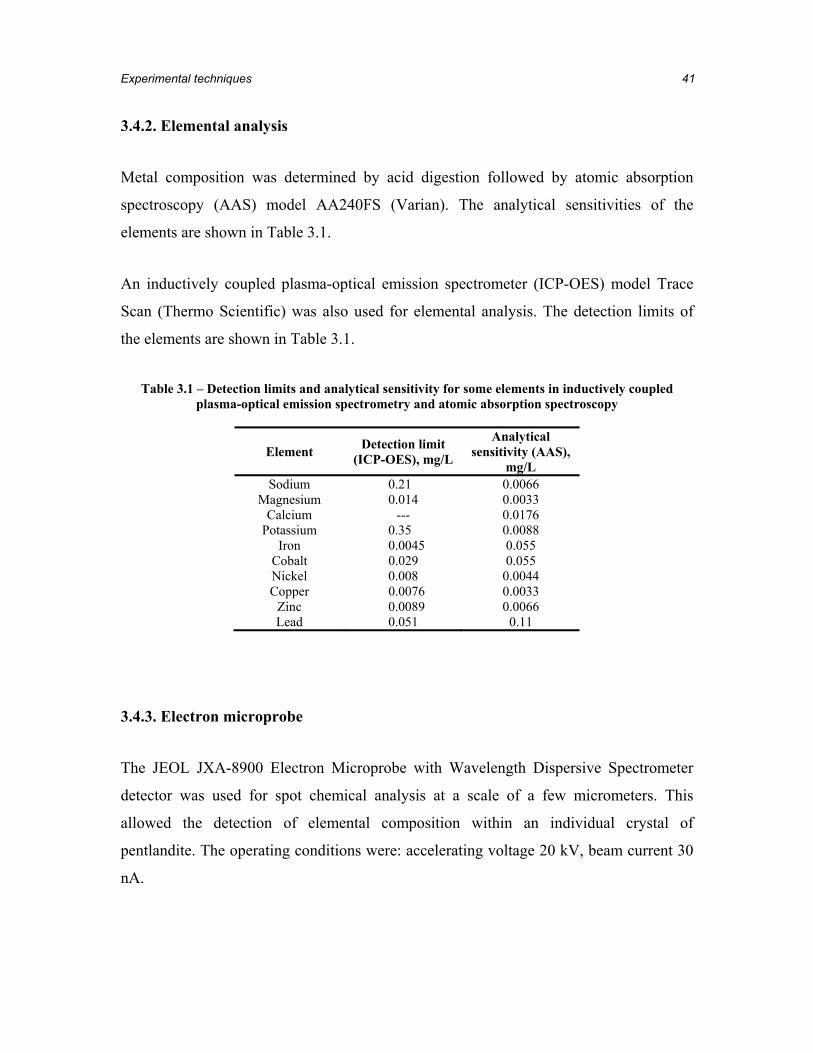
Experimental techniques 41
3.4.2. Elemental analysis
Metal composition was determined by acid digestion followed by atomic absorption
spectroscopy (AAS) model AA240FS (Varian). The analytical sensitivities of the
elements are shown in Table 3.1.
An inductively coupled plasma-optical emission spectrometer (ICP-OES) model Trace
Scan (Thermo Scientific) was also used for elemental analysis. The detection limits of
the elements are shown in Table 3.1.
Table 3.1 – Detection limits and analytical sensitivity for some elements in inductively coupled plasma-optical emission spectrometry and atomic absorption spectroscopy
Element Detection limit (ICP-OES), mg/L
Analytical sensitivity (AAS),
mg/L Sodium 0.21 0.0066
Magnesium 0.014 0.0033 Calcium --- 0.0176
Potassium 0.35 0.0088 Iron 0.0045 0.055
Cobalt 0.029 0.055 Nickel 0.008 0.0044 Copper 0.0076 0.0033
Zinc 0.0089 0.0066 Lead 0.051 0.11
3.4.3. Electron microprobe
The JEOL JXA-8900 Electron Microprobe with Wavelength Dispersive Spectrometer
detector was used for spot chemical analysis at a scale of a few micrometers. This
allowed the detection of elemental composition within an individual crystal of
pentlandite. The operating conditions were: accelerating voltage 20 kV, beam current 30
nA.

Chapter 3 42
3.4.4. X-ray diffraction
An X-Ray diffractometer Philips PW1710 with rotating Cu anode was used for mineral
phase identification. The X-ray tube was set at 40 kV and 20 mA. X’pert Quantify and
X’Pert High Score software were used for data acquisition and phase analysis,
respectively.
3.4.5. Scanning electron microscopy
The Philips XL30 field emission gun system scanning electron microscope was used for
the morphological characterization (secondary electrons) and elemental analysis of the
samples (energy dispersive spectroscopy).
References
Atteia O., Mondi C., Perret D. (2001) Aggregation rates of natural particle populations.
Water Research 35: 2429-2434
Ardizzone S., Siviglia P, Trasatti S. (1981) The point of zero charge of ruthenium
dioxide. Journal of Electroanalytical Chemistry 122, 1981, 395-401
Breeuwsma A., Lyklema J. (1971) Interfacial electrochemistry of haematite (α-Fe2O3).
Discussions of Faraday Society 52: 325-333
Beattie D.A., Huynh L. Kaggwa G.B., Ralston J. (2006) Influence of adsorbed
polysaccharids and polyacrylamides on talc flotation. International Journal of
Mineral Processing 78: 238-249
Beaussart A., Mierczynska-Vasilev A., Beattie D. (2009) Adsorption of dextrine on
hydrophobic minerals. Langmuir 25(17): 9913-9921
Experimental techniques 43
Čerović L.S., Milonjić S.K., Todorović M.B., Trtanj M.I., Pogozhev Y.S.,
Blagoveschenskii Y. Levashov E.A. (2007) Point of zero charge of different
carbides. Colloids and Surfaces. Section A: Physicochemical and Engendering
Aspects 297: 1-6
Chau T.T. (2009) A review of the techniques for measurement of contact angles and their
applicability on mineral surfaces. Minerals Engineering 58: 67-65
Dávila-Pulido G.I., (2010) Estudio Experimental sobre los Mecanismos de Activación y
Depresión de Esfalerita (Experimental Study of Activation and Depression of
Sphalerite) MSc Thesis, Centro de Investigación y Estudios Avanzados del IPN
Unidad Saltillo
Delgado A.V., Gonzalez-Caballero F., Hunter R.J., Koopal L.K., Lyklema J. (2007)
Measurement and interpretation of electrokinetic phenomena. Journal of Colloid and
Interface Science 309: 194-224
Ecanow B., Webster J.M., Blake M.I. (1982) Conductivity studies of suspension
systems in different states of aggregation. Journal of Pharmaceutical Sciences 71:
456-457
El Ouriaghli T., Francois J., Sarazin D., Nguyen T. D. (1992) Influence of nonionic
surfactant on aggregation state of scleroglucan in aqueous solution. Carbohydrate
Polymers 17: 305-312
Hicyilmaz, C., Oezuen S., Altun N. E. (2006) Rheological properties of asphaltite-water
surries. Energy and Fuels 20: 2037-2045
Chapter 3 44
Holuszko M.E., Franzidis J.P., Manlapig E.V., Hampton M.A., Donose B.C., Nguyen
A.V. (2008) The effect of surface treatment and slime coating on ZnS hydrophobicity.
Minerals Engineering 21: 958-966
Hunter R.J., Zeta Potential in Colloid Science–Principles and Applications, Academic
Press, New York, NY, USA, 1981
Hunter R.J. Foundations of Colloid Science, Oxford University Press, Oxford, OXON,
U.K., 2001
International Union of Pure and Applied Chemistry, Division of Physical Chemistry
(1971) Manual of symbols and terminology for physicochemical quantities and
unites. Appendix II: Definitions, terminology and symbols in colloid and surface
chemistry. London Butter Worths
Kissa E. Dispersions. Characterization, Testing, and Measurements. Surfactant Science
Series Vol. 84. Marcel Dekker. New York, NY, USA, 1999
Liu J., Aruguete D.M., Murayama M., Hochella M.F. (2009) Influence of size and
aggregation on the reactivity of an environmentally and industrially relevant
nanomaterial (PbS). Environmental Science and Technology 43: 8178-8183
Mierczynska-Vasilev A., Ralston J., Beattie D. (2008) Adsorption of modified dextrins in
talc: effect of surface coverage and hydration water on hydrophobicity reduction.
Langmuir 24: 6121-6127
Milonjić S.K., Čerović L.S., Čokeša D.M., Zec S. (2007) The influence of cationic
impurities in silica on its crystallization and point of zero charge. Journal of Colloid
and Interface Science 309: 155-159

Experimental techniques 45
Mirnezami M., Restrepo L., Finch, J.A. (2003) Aggregation of sphalerite: role of zinc
ions. Journal of Colloid and Interface Science 259: 36-42
Moussa A.S., Soos M., Sefcik J., Morbidelli M. (2007) Effect of solid volume fraction on
aggregation and breakage in colloidal suspensions in batch and continuous stirred
tanks. Langmuir 23: 1664-1673
Mular A.L., Roberts R.B., (1966) A simplified method to determine isoelectric points of
oxides. Transactions of the Canadian Institute of Mining and Metallurgy, 69, 438-
439
Muster T.H., Prestidge C.A. (1995) Rheological investigations of sulfide mineral
slurries. Minerals Engineering 8: 1541-55
Osasere O.F. (2000) Relation of contact angle data to Hallimond tube flotation of coal
with coagulants and flocculants. Fuel, 79: 193-199
Partridge A.C., Smith G.W. (1971) Small-sample flotation testing: a new cell. Institution
of Mining and Metallurgy Transactions. Section C: Mineral Processing and
Extractive Metallurgy 80: C199-C200
Rao S.R., Leja J. Surface Chemistry of Froth Flotation, Kluwer Academic Publishers,
New York, N.Y. USA, 2004
Reichert J.M., Norton L.D., Favaretto N., Huang C., Blume E. (2009) Settling velocity,
aggregate stability, and interrill erodibility of soils varying in clay mineralogy. Soil
Science Society of America Journal 73: 1369-1377
Reinecke H., Mijangos C., Lopez D. Guenet J.M. (2000) Light-scattering study of
thermoreversible aggregates from chemically modified PVCs: outcomes for the gel
state. Macromolecules 33: 2049-2054
Chapter 3 46
Shapovalov N.A., Slyusar' A.A., Slyusar' O.A. (2006) The effect of oligomeric
electrolytes on the aggregative stability and rheological properties of aqueous
mineral suspensions. Colloid Journal 68: 350-356
Shaw D. J. (1969) Electrophoresis, Academic Press: New York, NY, USA
Vergouw J.M., Anson J., Dalhke R., Xu Z., Gomez C., Finch J.A. (1997) An automated
data acquisition technique for settling tests. Minerals Engineering, 10: 1095-1110
Zhang Y., Gittins D. I., Skuse D., Cosgrove T., van Duijneveldt J. S. (2008) Composites
of kaolin and polydimethylsiloxane. Langmuir 24: 12032-12039
Zentner G.M., Cardinal J. R., Kim S. W. (1981) Free fatty acid-induced platelet
aggregation: studies with solubilized and nonsolubilized fatty acids. Journal of
Pharmaceutical Sciences 70: 975-81

47
4
Point of zero charge and isoelectric point of
phyllosilicate minerals
Abstract
The point of zero charge of electrokinetically anisotropic minerals (chlorite and
serpentine) was determined using the Mular-Roberts (M-R) titration technique, and
compared to the isoelectric point obtained from electrophoretic mobility measurements.
To validate the M-R technique, the point of zero charge and isoelectric point of two
isotropic minerals (alumina and silica) were shown to be comparable.
For serpentine and chlorite, respectively, the point of zero charge was found at pH 4.3
and 4.6, while the isoelectric point occurred at pH 3.2 and <3. Aggregation/dispersion
tests using light scattering showed the highest dispersion index (DI) for chlorite over a

Chapter 4 48
pH ranging from the i.e.p. to the p.z.c., suggesting that aggregation/dispersion is
determined by the charge at both the edge and the face. Serpentine remained largely
dispersed over the tested pH range.
4.1. Introduction
Magnesium silicates (MgO-minerals) are significant constituents of the gangue
associated with nickel minerals (mainly pentlandite) in mafic and ultramafic ores
(Edwards et al., 1980). A significant factor affecting flotation selectivity is considered to
be through MgO-mineral slime coating on pentlandite particles. The extent of slime
coating is principally controlled by the surface charge of the associated minerals.
Isoelectric point (abbreviated to i.e.p. according to the convention adopted by IUPAC in
1972) estimated from zeta potential measurements is frequently used to predict the
probability of slime coating occurring in a system. However, this may not be appropriate
in the case of some MgO-minerals.
For the class of MgO-gangue classified as phyllosilicate mineral (e.g., serpentine, talc
and chlorite depicted in Figure 4.1), the isoelectric point may differ depending whether
measurement is on the edge or face (Nalaskowski et al., 2007; Fuerstenau and Pradip,
2005). This is because phyllosilicates are electrokinetically anisotropic due to their
structure. These minerals are built of tetrahedral sheets bonded by octahedral sheets
(Ciullo, 1996). The tetrahedral and octahedral sheets form stable structural units (layers),
which are held together by van der Waals forces. During comminution, two kinds of
surfaces are formed, one produced by cleavage along the layers (basal plane or face), and
the other perpendicular to the face, created from breakage of chemical bonds (edge). The
faces have a permanent charge, independent of pH, which may develop through lattice
defects (e.g., vacancies and substitution) or incongruent dissolution (Fuerstenau and
Pradip, 2005; Lyklema et al., 1991; Shaw, 1969). In contrast, the edge behaves as a
mixed oxide (being acidic from the Si tetrahedral and basic from Mg octahedral) and its
surface charge exhibits strong pH dependence (Fuerstenau and Pradip, 2005; Lyklema et

Point of zero charge and isoelectric point of phyllosilicate minerals 49
al., 1991; Leja, 1983). Consequently, these minerals do not have a single defined i.e.p.
(Nalaskowski et al., 2007), making it impossible, for example, to infer the point of zero
charge (p.z.c. in the same convention) from the i.e.p. Therefore, the use of other
techniques to establish the p.z.c. is pertinent.
Potentiometric titration is a technique for measuring the point of zero charge (Ardizzone
et al., 1981; Breeuwsma and Lyklema, 1971). This technique requires a precise
measurement of the surface area of the particulate sample, which is frequently difficult to
obtain (Hunter, 1981). Mular and Roberts (1966) proposed a simplified titration method.
It exploits the effect on surface charge as the concentration of indifferent (background)
electrolyte is changed. As with any titration method, it is only valid if there are no other
processes competing for the potential determining ions.
Figure 4.1 – Sketch diagrams of serpentine [Mg3Si2O5(OH)4], talc [Mg3Si4O10(OH)2] and chlorite
[(Mg,Fe2+)5(Al,Fe3+)2Si3O10(OH)8].Structures viewed parallel to the sheets
In the Mular and Roberts (M-R) technique the samples are prepared at different pH, but
the same ionic strength (IS). The pH at IS1 is recorded: pHIS1. By adding indifferent

Chapter 4 50
electrolyte, the ionic strength is changed from IS1 to IS2 and when the new pH reading is
stable, the value is noted: pHIS2. From a plot of ΔpH (= pHIS1 – pHIS2) as a function of
pHIS2, the pH at which ΔpH equals zero (i.e., where there is no effect on pH by changing
ionic strength) corresponds to the point of zero charge.
The aim of the chapter is first to validate the M-R technique using electrokinetically
isotropic minerals then to use the method to determine the p.z.c. of some phyllosilicate
minerals encountered in processing ultramafic nickel ores and to compare the p.z.c. to the
i.e.p. determined from zeta potential measurements. Dispersion index is subsequently
used to determine which of the values, i.e.p. or p.z.c., controls state of
aggregation/dispersion, a system property that may be relevant to flotation.
4.2. Experimental
4.2.1. Minerals
Two electrokinetically isotropic minerals, high purity alumina (Sigma-Aldrich) and silica
(Fisher) were used in the validation tests. The anisotropic minerals were serpentine,
chlorite and talc (Ward’s Natural Science Establishment). These samples were crushed,
pulverized and wet sieved to isolate the –25 μm fraction.
Powder X-Ray Diffraction (XRD) was used for mineralogical examination (Philips
P1770 with rotating Cu anode set at 40 kV and 20 mA; X’Pert Quantify and X’Pert High
Score software were used for data acquisition and phase identification, respectively). The
detection limit is about 5 %.
4.2.2. Determination of isoelectric point
An electrophoretic method (ZetaPlus Brookhaven Instruments) using the Smoluchowski
approximation was used to measure zeta potential from electrokinetic mobility.
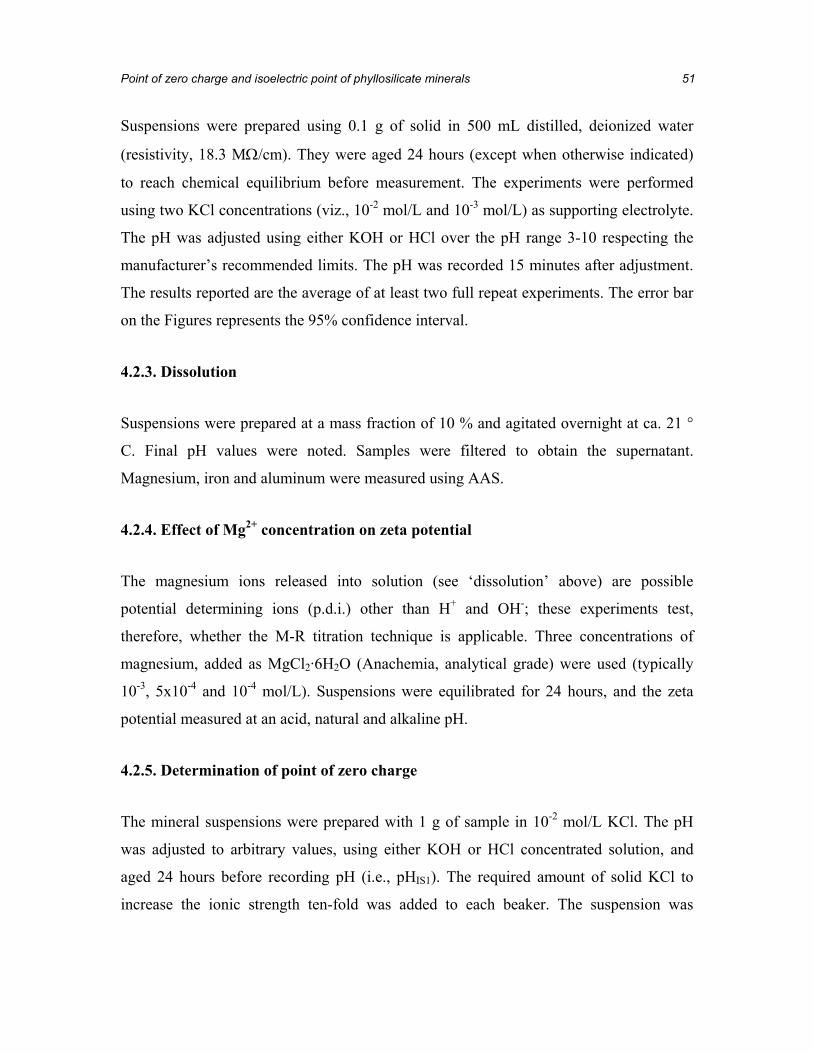
Point of zero charge and isoelectric point of phyllosilicate minerals 51
Suspensions were prepared using 0.1 g of solid in 500 mL distilled, deionized water
(resistivity, 18.3 MΩ/cm). They were aged 24 hours (except when otherwise indicated)
to reach chemical equilibrium before measurement. The experiments were performed
using two KCl concentrations (viz., 10-2 mol/L and 10-3 mol/L) as supporting electrolyte.
The pH was adjusted using either KOH or HCl over the pH range 3-10 respecting the
manufacturer’s recommended limits. The pH was recorded 15 minutes after adjustment.
The results reported are the average of at least two full repeat experiments. The error bar
on the Figures represents the 95% confidence interval.
4.2.3. Dissolution
Suspensions were prepared at a mass fraction of 10 % and agitated overnight at ca. 21 °
C. Final pH values were noted. Samples were filtered to obtain the supernatant.
Magnesium, iron and aluminum were measured using AAS.
4.2.4. Effect of Mg2+ concentration on zeta potential
The magnesium ions released into solution (see ‘dissolution’ above) are possible
potential determining ions (p.d.i.) other than H+ and OH-; these experiments test,
therefore, whether the M-R titration technique is applicable. Three concentrations of
magnesium, added as MgCl2·6H2O (Anachemia, analytical grade) were used (typically
10-3, 5x10⁻⁴ and 10-4 mol/L). Suspensions were equilibrated for 24 hours, and the zeta
potential measured at an acid, natural and alkaline pH.
4.2.5. Determination of point of zero charge
The mineral suspensions were prepared with 1 g of sample in 10-2 mol/L KCl. The pH
was adjusted to arbitrary values, using either KOH or HCl concentrated solution, and
aged 24 hours before recording pH (i.e., pHIS1). The required amount of solid KCl to
increase the ionic strength ten-fold was added to each beaker. The suspension was

Chapter 4 52
agitated using a magnetic stirrer to facilitate KCl dissolution. The final pH (i.e., pHIS2)
was recorded after it stabilized.
4.2.6. Aggregation/dispersion tests
Suspensions were prepared using 0.5 g of mineral in 100 mL of 10-2 mol/L of KCl
solution and equilibrated for 24 hrs. Solids were maintained in suspension with a
magnetic stirrer and the pH was adjusted using either KOH or HCl concentrated solution.
The sample was transferred to a spectrographic cell to measure absorbance as a function
of time using a UV/Visible spectrophotometer (Helios, Thermo) at a wavelength of 550
nm. The dispersion index reported is the slope of absorbance vs. time. The technique
proved suited to the small quantity of sample available. The results are the average of at
least two full repeats. Error bars on the Figures show the 95 % confidence interval.
4.3. Results
4.3.1. Mineralogical characterization
From XRD analysis, serpentine was identified as lizardite, chlorite as clinochlore with
traces of serpentine-chlorite, and talc as steatite (Table 4.1).
Table 4.1 – Mineralogical characterization (XRD) of samples
Sample General Formula Specific gravity Mineral Identified
Serpentine Mg3Si2O5(OH)4 2.3 Lizardite
Chlorite (Mg,Fe2+)5(Al,Fe3+)2Si3O10(OH)8 2.6-3.3 Clinochlore minor serpentine-chlorite
Talc Mg3Si4O10(OH)2 2.7-2.8 Steatite

Point of zero charge and isoelectric point of phyllosilicate minerals 53
4.3.2. Validating M-R technique
The isoelectric point of alumina was found at pH 7.9 (Figure 4.2), a value similar to the
point of zero charge measured by the M-R technique, pH 8.1 (Figure 4.3). Agreement
between the two values was also found for silica: i.e.p. pH <3 (Figure 4.2) and p.z.c. pH
~2 (Figure 4.4). The values of i.e.p. in both cases are within the range reported in
literature: for alumina pH 5 to 9.2, and for silica pH 1.6 to 3.5 (Kosmulski, 2002, 2004;
Parks, 1965). For silica, it should be noted that to determine the point of zero charge, it
was necessary to adjust the initial pH to <2. To mask the effect of the ionic strength
contributed by this high acid condition, the initial indifferent electrolyte concentration
was 0.1 mol/L and was increased to 1 mol/L.
In the case of alumina, the effect of the magnitude of the change in ionic strength on
p.z.c. was explored (Figure 4.3). The p.z.c. was not affected, although as expected the
larger change in ionic strength resulted in a greater change in pH (as a consequence of
more potential determining ions being adsorbed).
-80
-60
-40
-20
0
20
40
60
0 2 4 6 8 10 12
Silica
Alumina
pH
ζ, m
V
-80
-60
-40
-20
0
20
40
60
0 2 4 6 8 10 12
Silica
Alumina
pH
ζ, m
V
Figure 4.2 – Zeta potential of alumina (open squares) and silica (filled diamonds) as a function of pH. IS = 10-2 mol/L using KCl; i.e.p. occurs at ca. pH 7.9 and <3, respectively. The error bars represent
the 95 % confidence interval from three observations
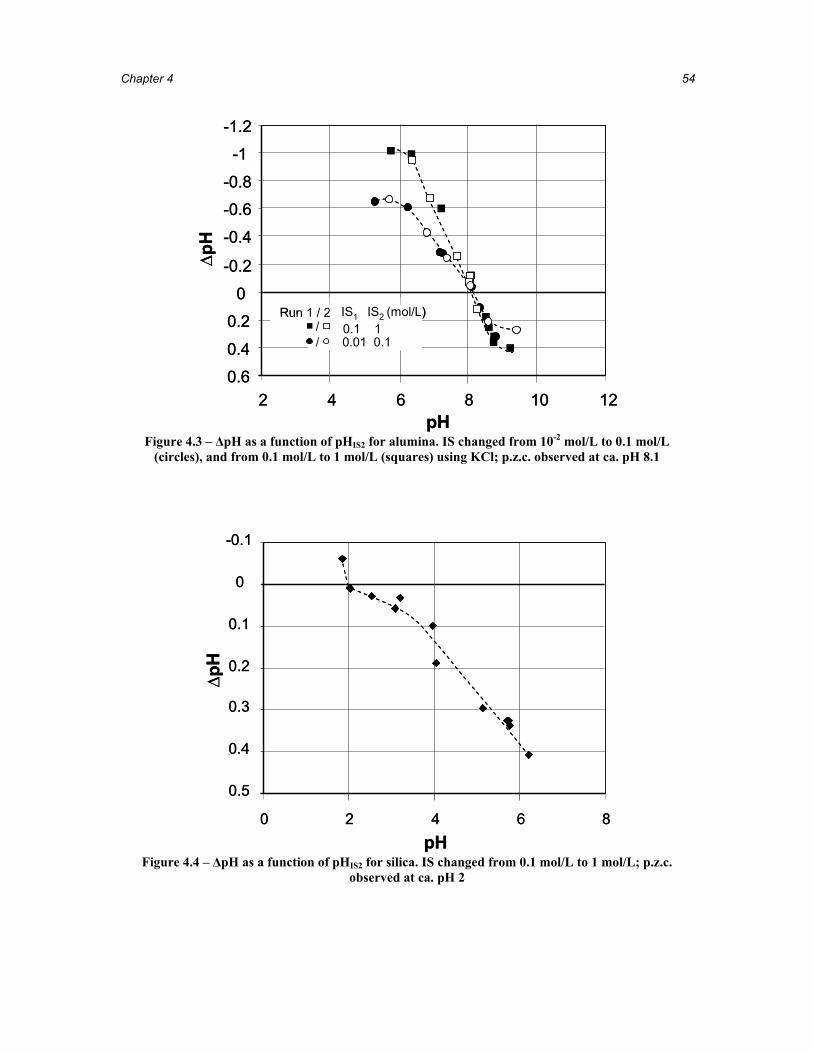
Chapter 4 54
-1.2
-1
-0.8
-0.6
-0.4
-0.2
0
0.2
0.4
0.62 4 6 8 10 12
pH
∆pH
IS1 IS2 (mol/L)0.1 10.01 0.1
//
Run 1 / 2
-1.2
-1
-0.8
-0.6
-0.4
-0.2
0
0.2
0.4
0.62 4 6 8 10 12
pH
∆pH
IS1 IS2 (mol/L)0.1 10.01 0.1
//
Run 1 / 2
Figure 4.3 – ΔpH as a function of pHIS2 for alumina. IS changed from 10-2 mol/L to 0.1 mol/L
(circles), and from 0.1 mol/L to 1 mol/L (squares) using KCl; p.z.c. observed at ca. pH 8.1
-0.1
0
0.1
0.2
0.3
0.4
0.5
0 2 4 6 8pH
∆pH
-0.1
0
0.1
0.2
0.3
0.4
0.5
0 2 4 6 8pH
∆pH
Figure 4.4 – ΔpH as a function of pHIS2 for silica. IS changed from 0.1 mol/L to 1 mol/L; p.z.c.
observed at ca. pH 2

Point of zero charge and isoelectric point of phyllosilicate minerals 55
4.4.3. Isoelectric point and effect of some experimental conditions
Effect of aging and solid/liquid ratio
The effect of aging is shown in Figures 4.5 to 4.7. Fresh and aged chlorite produced
similar values, with i.e.p. at pH <3 (Figure 4.5). The same behaviour was observed with
talc, where fresh and aged samples gave i.e.p. at pH <3 (Figure 4.7). In contrast, aging of
serpentine resulted in a significant change in i.e.p. (Figure 4.6); the i.e.p. decreased from
ca. pH 8 for the fresh sample to ca. pH 4 for the 24-hr aged sample which then remained
constant. This aging effect on serpentine dictated the use of 24-hr aged samples for the
comparison of i.e.p. and p.z.c.
The effect of solid/liquid ratio is shown for ‘aged’ chlorite in Figure 4.5. This variable
did not change the zeta potential significantly. The value was fixed at the highest
solid/liquid ratio, respecting equipment constraints (i.e., ~200 mg/L), to make the
measurement less sensitive to possible contamination effects.
Figure 4.8 establishes that KCl is an indifferent electrolyte, as changing concentration did
not affect the i.e.p. for either serpentine or chlorite (but the higher concentration did
decrease zeta potential due to ‘double layer compression’).
Species dissolution
Species released from minerals and later chemisorbed may change their i.e.p.
Magnesium, iron and aluminum ions were chosen as likely solution constituents of the
phyllosilcate minerals examined. After aging for 24 hours in KCl solution at natural pH,
the supernatant of serpentine and chlorite was tested by atomic absorption spectroscopy.
Neither iron nor aluminum was detected; however, magnesium was released: for
serpentine ca. 0.3 mg of Mg2+ per gram of sample, for chlorite 0.25 and talc 0.4.

Chapter 4 56
-60
-50
-40
-30
-20
-10
0
0 2 4 6 8 10 12pH
ζ, m
V
Fresh-High-solids
Aged-High-solids
Aged-Low-solids
-60
-50
-40
-30
-20
-10
0
0 2 4 6 8 10 12pH
ζ, m
V
Fresh-High-solids
Aged-High-solids
Aged-Low-solids
Figure 4.5 – Zeta potential of chlorite as a function of pH for aged (24-hr) and fresh samples. IS = 10-
2 mol/L using KCl. Solid-liquid ratio was 200 mg/L (filled squares and open diamonds) and 100 mg/L (filled triangles)
-50-40
-30-20
-100
1020
3040
50
0 2 4 6 8 10 12
pH
ζ, m
V
Fresh
Aged
-50-40
-30-20
-100
1020
3040
50
0 2 4 6 8 10 12
pH
ζ, m
V
Fresh
Aged
Figure 4.6 – Zeta potential of serpentine as a function of pH for aged (filled squares) and fresh (open
diamonds) samples. IS = 10-2 mol/L using KCl

Point of zero charge and isoelectric point of phyllosilicate minerals 57
-60
-50
-40
-30
-20
-10
0
0 2 4 6 8 10 12
pH
ζ, m
V
Fresh
Aged-60
-50
-40
-30
-20
-10
0
0 2 4 6 8 10 12
pH
ζ, m
V
-60
-50
-40
-30
-20
-10
0
0 2 4 6 8 10 12
pH
ζ, m
V
Fresh
Aged
Figure 4.7 – Zeta potential of talc as a function of pH for 24-hr aged (filled diamonds) and fresh
(open diamonds) samples. IS = 10-2 mol/L using KCl
-70
-60
-50
-40
-30
-20
-10
0
10
20
0 2 4 6 8 10 12
pH
ζ, m
V
0.001
0.01Chlorite
[KCl], mol/L
0.01
0.001
Serpentine
-70
-60
-50
-40
-30
-20
-10
0
10
20
0 2 4 6 8 10 12
pH
ζ, m
V
0.001
0.01Chlorite
[KCl], mol/L
0.01
0.001
Serpentine
Figure 4.8 – Zeta potential of serpentine (circles) and chlorite (squares) as a function of pH for 24-hr
aged samples. IS = 10-2 (filled symbols) and 10-3 mol/L (open symbols) using KCl

Chapter 4 58
Effect of Mg2+
It is understood that any titration technique for p.z.c. determination is only valid provided
there are no p.d.i. other than H+ and OH- ions. Given its detected release, the effect of
magnesium ions on zeta potential was tested.
For chlorite and serpentine (Figures 4.9, and 4.10, respectively), changes in zeta potential
as a consequence of Mg2+ addition were negligible from acid to near neutral pH,
although there was an effect at alkaline pH. In the case of talc (Figure 4.11), however,
differences in zeta potential were observed over the full pH range tested, suggesting an
exchange of Mg2+ between the mineral surface and the solution (i.e., Mg2+ is a p.d.i.).
Subsequent titration test work proved unrepeatable and measurement of p.z.c. for talc
was not pursued.
-60
-50
-40
-30
-20
-10
0
0 2 4 6 8 10 12
pH
ζ, m
V
[Mg2+], mol/L010-5
10-4
10-3
-60
-50
-40
-30
-20
-10
0
0 2 4 6 8 10 12
pH
ζ, m
V
[Mg2+], mol/L010-5
10-4
10-3
Figure 4.9 – Zeta potential of chlorite as a function of pH in 10-2 mol/L KCl for 0 mol/L (filled diamonds), 10-5 mol/L (open squares), 10-4 mol/L (filled triangles) and 10-3 mol/L (crosses) of
magnesium

Point of zero charge and isoelectric point of phyllosilicate minerals 59
-50
-40
-30
-20
-10
0
10
20
30
0 2 4 6 8 10 12
[Mg2+], mol/L010-4
5×10⁻⁴
10-3
pH
ζ, m
V
-50
-40
-30
-20
-10
0
10
20
30
0 2 4 6 8 10 12
[Mg2+], mol/L010-4
5×10⁻⁴
10-3
pH
ζ, m
V
Figure 4.10 – Zeta potential of serpentine as a function of pH in 10-2 mol/L KCl for 0 mol/L (filled
diamonds), 10-5 mol/L (open squares), 10-4 mol/L (filled triangles) and 10-3 mol/L (crosses) of magnesium
-60
-50
-40
-30
-20
-10
0
0 2 4 6 8 10 12
pH
ζ, m
V
[Mg2+], mol/L010-4
5×10⁻⁴
10-3
-60
-50
-40
-30
-20
-10
0
0 2 4 6 8 10 12
pH
ζ, m
V
[Mg2+], mol/L010-4
5×10⁻⁴
10-3
Figure 4.11 – Zeta potential of talc in 10-2 mol/L KCl for 0 mol/L (filled diamonds), 10-5 mol/L (open
squares), 10-4 mol/L (filled triangles) and 10-3 mol/L (crosses) of magnesium
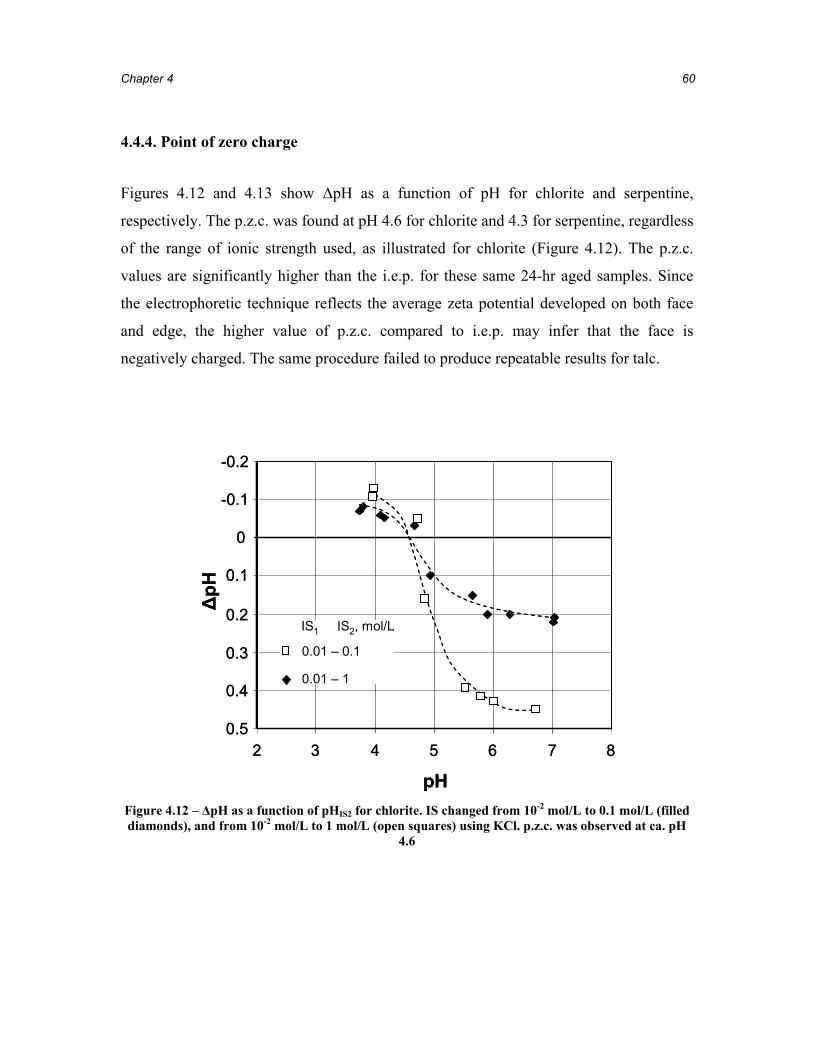
Chapter 4 60
4.4.4. Point of zero charge
Figures 4.12 and 4.13 show ΔpH as a function of pH for chlorite and serpentine,
respectively. The p.z.c. was found at pH 4.6 for chlorite and 4.3 for serpentine, regardless
of the range of ionic strength used, as illustrated for chlorite (Figure 4.12). The p.z.c.
values are significantly higher than the i.e.p. for these same 24-hr aged samples. Since
the electrophoretic technique reflects the average zeta potential developed on both face
and edge, the higher value of p.z.c. compared to i.e.p. may infer that the face is
negatively charged. The same procedure failed to produce repeatable results for talc.
-0.2
-0.1
0
0.1
0.2
0.3
0.4
0.52 3 4 5 6 7 8
pH
ΔpH
IS1 IS2, mol/L
0.01 – 0.1
0.01 – 1
-0.2
-0.1
0
0.1
0.2
0.3
0.4
0.52 3 4 5 6 7 8
pH
ΔpH
IS1 IS2, mol/L
0.01 – 0.1
0.01 – 1
Figure 4.12 – ΔpH as a function of pHIS2 for chlorite. IS changed from 10-2 mol/L to 0.1 mol/L (filled diamonds), and from 10-2 mol/L to 1 mol/L (open squares) using KCl. p.z.c. was observed at ca. pH
4.6

Point of zero charge and isoelectric point of phyllosilicate minerals 61
-0.06
0
0.06
0.12
0.18
0 2 4 6 8 10
pH
ΔpH
-0.06
0
0.06
0.12
0.18
0 2 4 6 8 10
pH
ΔpH
Figure 4.13 – ΔpH as a function of pHIS2 for serpentine. IS change was from 10-2 mol/L to 0.1 mol/L
using KCl. p.z.c. was observed at pH ca. 4.3
The i.e.p. and p.z.c. results for samples tested are summarized in Table 4.2.
Table 4.2 – Comparison between i.e.p. and p.z.c. for phyllosilicate minerals tested
Sample i.e.p. p.z.c. Chlorite <3 4.6
Serpentine 3.3 4.3 Talc <3 ND
4.4.5. Aggregation/dispersion tests
Dispersion index calculated from turbidimetry was used to determine whether i.e.p. or
p.z.c. controls aggregation/dispersion: high dispersion index is associated with
aggregation, which is usually counter-productive for flotation (e.g. Silvestre et al., 2009).
For chlorite, the maximum dispersion index was reached between pH 2.5 to 5.5; for
serpentine, no definite maximum was observed (Figure 4.14).

Chapter 4 62
The chlorite, therefore, showed aggregation over the range from the i.e.p. (less than pH
3) to the p.z.c. (4.6); i.e., both surface properties seem involved.
0
0.05
0.1
0.15
0.2
0.25
0.3
0.35
0 2 4 6 8 10 12
pH
DI,
A/s
Chlorite
Serpentine
0
0.05
0.1
0.15
0.2
0.25
0.3
0.35
0 2 4 6 8 10 12
pH
DI,
A/s
Chlorite
Serpentine
Figure 4.14 – Dispersion index in absorbance increment per second as a function of pH for chlorite
(open circles) and serpentine (filled squares)
4.5. Discussion
The focus of this chapter was on determining the p.z.c. using the Mular-Roberts titration
technique and comparing it to the i.e.p. determined by electrophoresis. A difference
between p.z.c. and i.e.p. can be seen with electrokinetically anisotropic minerals such as
the phyllosilicates examined here.

Point of zero charge and isoelectric point of phyllosilicate minerals 63
The M-R technique exploits the change in solution pH when ionic strength is adjusted;
when the ΔpH is zero this gives the p.z.c. The technique was validated by testing two
isotropic minerals, alumina and silica, and was shown to be robust in the face of changes
in solid/liquid ratio and range in ionic strength. In the case of phyllosilicates where the
charge on one crystal plane is pH dependent (i.e., the edge) while the other is not (basal
plane) the M-R technique responds only to the former, whereas electrophoresis reflects
an intermediate (average) behaviour resulting from both planes.
The i.e.p. values determined by electrophoresis in the case of phyllosilicates should be
treated with some caution. The Smoluchowski equation used to convert electrophoretic
mobility to zeta potential was developed for spherical particles and there is a lack of
appropriate mathematical models for sheet minerals. The heterogeneous nature of the
charge distribution discussed earlier also makes interpretation of results difficult
(Burdukova et al, 2007; Lyklema et al., 1991). Nevertheless zeta potential determinations
on such minerals are often reported (Kosmulski, 2002; Tartaj et al., 2000; Chowdhury
and Kitchener, 1975; Parks, 1965) and the estimates of i.e.p. by electrophoresis do serve
as a basis for comparison with p.z.c.
The measurement of zeta potential to estimate i.e.p. revealed an aging effect in the case
of serpentine that determined the use of 24-hour aged samples for the comparison with
p.z.c. Tartaj et al. (2000) also reported an i.e.p. shift on aging serpentine which they
explained in terms of preferential dissolution of magnesium. However, as noted in the
results, Mg2+ ions were released in quantities of the same order by all silicates. The
change in i.e.p. may be produced by the hydration of serpentine: water molecules can
change the adsorption of other ions.
The effect of ions released from the minerals was considered. Neither aluminum nor iron
were released even though both are constituent elements of chlorite and commonly
substitute magnesium and silicon in serpentine and talc (Tartaj et al., 2000);
consequently, their effect on zeta potential was not examined. Magnesium was released

Chapter 4 64
and on testing it was found did not change zeta potential of chlorite or serpentine until ca.
pH 10; correspondingly there was no shift in i.e.p. The effect at alkaline pH is the
common observation with polyvalent metallic ions (such as Mg2+). This phenomenon is
associated with cation hydrolysis and adsorption of hydroxy complexes (e.g., MgOH+)
and surface precipitation of metal hydroxide, which occurs at pH values just below those
for bulk precipitation (Fuerstenau and Palmer, 1976; James and Healey, 1972 a, b). Since
the i.e.p. did not change it is concluded that Mg2+ is not a p.d.i. in the case of chlorite and
serpentine. However, magnesium did change the i.e.p. of talc, thus it seems to be a
potential determining ion or at least a specifically adsorbing ion in the case of talc. The
presence of released Mg ions is considered the reason the M-R technique did not give a
result for this sample of talc. Others have succeeded in determining p.z.c. for talc using
the M-R technique (Burdukova et al., 2007), suggesting the origin of the sample is a
factor.
The results from the M-R technique are easy to interpret if there is only one plane
exhibiting charge. In principle a face that is defect and contaminant free should have zero
charge. There is no independent proof for this being the case here. Atomic force
microscopy, by making measurements on individual planes, is one way to delve further
into that aspect (Nalaskowski et al., 2007).
Rather, at this juncture a practical question is more pressing: which parameter, p.z.c. or
i.e.p., is the factor controlling system properties that may influence flotation? Particle
aggregation is one such property (Silvestre et al., 2009; El-Ammouri et al., 2002;
Vergouw et al., 1998 a, b). To explore aggregation/dispersion turbidimetry measurements
were employed. Given the small mass of sample available adapting a light scattering
technique proved well suited to the task. Chlorite showed its highest aggregation over a
pH ranging from the i.e.p. to the p.z.c., suggesting that aggregation/dispersion is
determined by the charge at both the edge and the face. It has been reported that under
certain conditions minerals with charges of different sign on the edge and face, can form

Point of zero charge and isoelectric point of phyllosilicate minerals 65
“house-of-cards” like aggregates (Lyklema et al., 1991). Serpentine, on the other hand,
seems to remain largely dispersed over the tested pH range, possibly due to hydration
effects maintaining a hydrophilic surface which promotes a dispersed condition. Chlorite
consists of a positively charged brucite-like sheet and a negatively charged mica-like
sheet, which make the interlayer bonding fairly strong (Hartman, 1983) and may restrict
hydration. The interlayer bonding of serpentine, in contrast, is produced by the
interaction between oxygen in the tetrahedral sheet and hydroxyl in the octahedral sheet
of the next layer. This is a comparatively weak bonding, depending on isomorfic
substitution (e.g., Al and Fe for Mg and Al for Si) to give it some amount of ionic
character (Lyklema et al., 1991), making serpentine structure more likely to hydrate.
Figure 4.15 shows a schematic of the interlayer conditions of serpentine (1:1
phyllosilicate) and chlorite (2:1 non-expanding phyllosilicate). The sketch of a 2:1
expanding phyllosilicate is also presented.
This chapter has presented results for specimen phyllosilicate minerals. The work
established concepts and techniques that will be applied to the probing of mineral surface
properties for a Ni-bearing ultramafic ore in subsequent chapters.
Figure 4.15 – Interlayer bonding for different types of phyllosilicates

Chapter 4 66
4.6. Conclusions
The Mular-Robert titration technique (M-R), verified using electrokinetically isotropic
minerals, was used to determine the point of zero charge (p.z.c.) for three anisotropic
phyllosilicate minerals. The p.z.c. was compared to the isoelectric point (i.e.p.)
determined by electrophoresis. For serpentine and chlorite, p.z.c. was greater than i.e.p.
(pH 4.3 vs. pH 3.3, and pH 4.6 vs. pH <3, respectively). The M-R technique did not yield
a p.z.c. for talc which is attributed to interference by released Mg ions. In the case of
chlorite, aggregation occurred over the pH range from i.e.p. to p.z.c., suggesting both
contribute to aggregation. The serpentine sample remained dispersed over the full pH
range, tentatively attributed to hydration effects dominating dispersion.
References
Ardizzone S., Siviglia P., Trasatti S. (1981) The point of Zero Charge of Ruthenium
Dioxide. Journal of Electroanalytical Chemistry 122: 395-401
Breeuwsma A., Lyklema J. (1971) Interfacial Electrochemistry of Haematite (α-Fe2O3).
Discussions of the Faraday Society 52: 325-333
Burdukova E., Bradshaw D.V., Laskowski J.S. (2007) Effect of CMC and pH on the
rheology of suspensions of isotropic and anisotropic minerals. Canadian
Metallurgical Quarterly 46: 273-278
Chowdhury S, Kitchener JA (1975) The zeta potential of natural and synthetic
chrysotiles. International Journal of Mineral Processing 2: 277-285

Point of zero charge and isoelectric point of phyllosilicate minerals 67
Ciullo, PA (1996). Silicate structure. In Industrial Minerals and their uses – A Handbook
and Formulary. PA Ciullo (Ed). William Andrew Publishing
Edwards C.R., Kipkie W.B., Agar G.E. (1980) The effect of slime coatings of the
serpentine minerals, chrysotile and lizardite, on pentlandite flotation. International
Journal of Mineral Processing 7: 33-42
El-Ammouri E., Mirnezami M., Lascelles D., Finch J.A. (2002) Aggregation index and a
methodology to study the role of magnesium in aggregation of sulphide slurries.
CIM Bulletin 95: 67-72
Fuerstenau D.W., Pradip (2005) Zeta potentials in the flotation of oxide and silicate
minerals. Advances in Colloid and Interface Science 114-115: 9-26
Fuerstenau M.C., Palmer B.R. (1976) Anionic flotation of oxides and silicates. M.C.
Fuerstenau (Ed). Flotation A.M. Gaudin Memorial Volume 1, New York, 148-196
Hartman P. (1983) Calculation of electrostatic interlayer bonding energy and lattice
energy of polar phyllosilicates: kaolinite and chlorite. Clays and Clay Minerals 31:
218-222
Hunter R.J. (1981) Zeta Potential in Colloid Science–Principles and Applications.
Academic Press: New York, NY, USA
International Union of Pure and Applied Chemistry, Division of Physical Chemistry
(1971) Manual of symbols and terminology for physicochemical quantities and
unites. Appendix II: Definitions, terminology and symbols in colloid and surface
chemistry. London Butter Worths

Chapter 4 68
James R.O., Healey T.W. (1972 a) Adsorption of hydrolysable metal ions at the oxide-
water interface. Journal of Colloid and Interface Science 40: 42-52
James R.O., Healey T.W. (1972 b), Adsorption of hydrolysable metal ions at the oxide-
water interface. Journal of Colloid and Interface Science 40: 53-63
Kosmulski M. (2002) The pH-dependent surface charging and the points of zero charge.
Journal of Colloid and Interface Science 253: 77-87
Kosmulski M. (2004) The pH-dependent surface charging and the points of zero charge.
II Update. Journal of Colloid and Interface Science 275: 214-224
Leja J. (1983) Surface Chemistry of Froth Flotation, Plenum Press: New York, NY, USA
Lyklema J., van Leeuwen H.P., van Vliet M., Cazabat A.M. (1991) Fundamentals of
Interface and Colloid Science. Volume II: Solid-Liquid Interfaces, Academic Press:
London, UK
Mular A.L., Roberts R.B. (1966) A simplified method to determine isoelectric points of
oxides. Transactions of the Canadian Institute of Mining, Metallurgy and Petroleum
69: 438-439
Nalaskowski J, Abdul B, Du H, Miller JD (2007) Anisotropic character of talc surfaces
as revealed by streaming potential measurements, atomic force microscopy,
molecular dynamics simulations and contact angle measurements. Canadian
Metallurgy Quarterly 46: 227-235
Parks A. (1965) The isoelectric points of solid oxides, solid hydroxides, and aqueous
hydroxo complex systems. Chemistry Reviews 65: 177-198

Point of zero charge and isoelectric point of phyllosilicate minerals 69
Shaw D. J. (1969) Electrophoresis, Academic Press: New York, NY, USA
Silvestre M.O., Pereira C.A., Galery R., Peres A.E.C. (2009) Dispersion effect on a lead-
zinc sulphide ore flotation. Minerals Engineering 11: 752-758
Tartaj P., Cerpa A., Garcia-Gonzalez M.T., Serna C.J. (2000) Surface instability of
serpentine in aqueous suspensions. Journal of Colloid and Interface Science 231:
176-181
Vergouw J.M., Difeo A., Xu Z., Finch, J.A. (1998 a) An agglomeration study of sulfide
minerals using zeta-potential and settling rate. Part I: pyrite and galena. Minerals
Engineering 11: 159-169
Vergouw J.M., Difeo A., Xu Z., Finch, J.A. (1998 b) An agglomeration study of sulfide
minerals using zeta potential and settling rate. Part II: sphalerite/pyrite and
sphalerite/galena. Minerals Engineering 11: 605-614

70
5
Effect of serpentine and dissolved mineral species
on electrokinetic behaviour of pentlandite
Abstract
This chapter examines the mechanisms of depression of pentlandite in flotation of
ultramafic ore through determination of the effect of dissolved metal ions and presence of
serpentine fines on pentlandite electrophoretic mobility. Zeta potential was measured
under three conditions designed to progressively approach the actual flotation
environment: pentlandite and serpentine alone with indifferent background electrolyte;
mixed mineral, with pentlandite in the presence of serpentine with indifferent background
electrolyte; and mixed mineral with supernatant from an ore suspension as background
Chapter 5 71
electrolyte. The “minerals alone” experiments showed that slime coating is expected as a
consequence of electrostatic attraction, confirmed in the mixed mineral experiments with
indifferent background electrolyte. In the presence of supernatant an additional effect on
zeta potential due to adsorption of Mg(OH)2 precipitates was detected and confirmed
with a scanning electron microscopy study.
5.1. Introduction
Pentlandite is the principal nickel sulphide and the source of the bulk of the world’s
current supply of nickel. The demand for nickel has increased significantly in recent
years as a consequence of the rise in stainless steel production in China and India (Reck
et al., 2010)
Some pentlandite deposits are associated with pyrrhotite and MgO-minerals (e.g.,
serpentine). These gangue minerals must be rejected in the flotation step to assist
subsequent smelting: eliminating pyrrhotite reduces sulphur dioxide emission and
eliminating MgO-minerals decreases the slag melting point. Flotation is usually with thiol
collectors in an alkaline pulp.
MgO-mineral slimes formed during comminution are suspected of interfering with
flotation by forming a coating on the pentlandite surface. Several studies have shown that
a small amount of serpentine can depress pentlandite recovery (Bremmell et al., 2005,
Mani et al., 1997, Edwards et al., 1980) and associated electrokinetic measurements
suggested the cause is hetero-aggregation between positively charged serpentine and
negatively charged pentlandite at the alkaline conditions of flotation (ca. pH 10).
Electrokinetic studies of minerals are frequently used to predict their behaviour in
aqueous systems. Several researchers have shown that it is possible to establish a
correlation between a desirable but difficult to measure parameter and the zeta potential,
i.e., zeta potential is a surrogate (Adler et al., 2000, Chibowski, 1979). Regarding

Effect of serpentine and dissolved mineral species on electrokinetic behaviour of pentlandite 72
flotation-related studies, some of the parameters that have been correlated to
electrokinetic behaviour are adsorption of collectors (Fuerstenau, 2001, Fuerstenau and
Shibata, 1999, Moudgil et al., 1988), oxidation of sulphide minerals (Fullston et al., 1999,
Das et al., 1997, Prestidge and Rowlands, 1997), slime coating (Xu et al., 2003 b,
Parsonage, 1985, Hunter and Neville, 1980), accidental activation of gangue (O'Connor
et al., 2006, Malysiak et al, 2004, Malysiak et al., 2002, Fuerstenau and Palmer, 1976)
and exchange of released ions among sulphide minerals (DiFeo et al., 1997; Zhang et al.,
1992). Zeta potential is then considered to be an important tool for understanding and
predicting the behaviour of flotation systems.
That being said, experiments are often performed under ideal conditions (e.g., pure
minerals using an indifferent electrolyte as background), which are far from actual
flotation conditions. Acar and Somasundaran (1992) showed that predictions based on
single mineral tests often failed in mixed mineral systems mainly due to the interactions
between the minerals and dissolved species. It is then necessary to mimic the pulp
conditions as much as possible. One approach is to perform zeta potential on mixed
minerals (at least pairs of minerals). In the present case the technique used by Zhang et al.
(1997) was adopted whereby minerals of different size are conditioned together then
separated to determine zeta potential.
The present work was conducted to determine the mechanism of depression of
pentlandite in the presence of serpentine and dissolved species using electrokinetic
measurements.
5.2. Experimental
5.2.1. Minerals
Pentlandite was isolated from a sample of concentrate obtained by processing a sample of
an ultramafic ore from Thompson, Manitoba in the Vale mini-plant (Xu et al., 2003 a).

Chapter 5 73
The concentrate contained mostly pentlandite, pyrrhotite and serpentine (clinochrysotile
type) as determined by X-ray diffraction (XRD). The concentrate was screened and the
fine material (-75 μm) discarded. The pentlandite content was upgraded by gravity and
magnetic separation. The -106/+75 μm fraction was cleaned with acetone to remove
flotation reagents and kept in a freezer to limit surface oxidation. The elemental analysis
of the sample determined by atomic absorption spectroscopy (model AA240FS, Varian)
is shown in Table 5.1 along with electron microprobe (model JXA-8900, JEOL) analyisis
of 20 pentlandite grains. The slightly elevated Fe content of the sample (and depressed
Ni assay) indicates some residual contamination primarily by pyrrhotite.
Serpentine was isolated from the same ultramafic ore sample by gravity and magnetic
separation. Examination by XRD showed clinochrysotile as the main phase with minor
pyrrhotite. The -25 μm fraction was used when the mineral was tested alone and the +45/-
75 μm when it was mixed with pentlandite.
Table 5.1 – Measured elemental composition of the sample determined by AAS compared to ideal pentlandite composition and composition determined by microprobe analysis on identified
pentlandite grains
Element, % Pentlandite Fe Ni Co Pb Zn Cu Insoluble Ideal composition[1] 31.26 32.85 --- --- --- --- --- Electron microprobe[2] 30.70 35.00 1.20 --- --- 0.07 --- Sample 40.35 30.99 0.88 0.00 0.15 0.04 8.56
[1] Ideal is based on (Ni,Fe)9S8
[2] Electron microprobe analysis based in 20 pentlandite grains
Effect of serpentine and dissolved mineral species on electrokinetic behaviour of pentlandite 74
5.2.2. Zeta potential
Serpentine
An electrophoretic method (ZetaPlus Brookhaven Instruments) which uses the
Smoluchowski approximation was used to measure the zeta potential from electrokinetic
mobility. Suspensions were prepared using 0.1 g of solid in 500 mL of distilled,
deionized water (resistivity, 18.3 MΩ/cm). The suspensions were conditioned for 24
hours before measurement to reach chemical equilibrium based on prior experience
(Chapter 4). The experiments were performed using two KNO3 concentrations (viz., 10-2
mol/L and 5×10⁻³ mol/L) as supporting electrolyte and supernatant derived from an ore
sample. The pH was adjusted using either KOH or HNO3 over the pH range 3 to10,
respecting the manufacturer’s recommended limits. The pH was recorded 15 minutes
after adjustment. The results reported are the average of at least two full repeats with the
95% confidence interval indicated.
Pentlandite
Prior to measurement, about 0.2 g of pentlandite was ultrasonicated (model 275DA Crest)
several times to eliminate slimes; the pentlandite was then placed in a flask with dilute
HCl solution (ca. pH 2) and agitated on an orbital shaker model G-33 (New Brunswick
Scientific) to dissolve oxidation products. The sample was then filtered and rinsed several
times with distilled, deoxygenated water and placed in a desiccator. When dry, the
pentlandite was ground in an agate mortar and placed in the test solution (N2 purged for
20 minutes). The suspension was left to sit for 24 hours before measurement (to be
consistent with the procedure used for serpentine). The pH was adjusted using either
KOH or HNO3 over the pH range of 3 to 10 and recorded 15 minutes after adjustment.
The results (mean and 95% confidence interval) represent at least two full repeat
experiments.

Chapter 5 75
The tested background solutions were: KNO3 (10-2 mol/L and 5×10⁻³ mol/L), supernatant,
and Mg concentrations from 5 to 80 mg/L, added as MgCl2·6H2O (Anachemia, analytical
grade). In order to fix the ionic strength (because variations could modify the zeta
potential) 10-2 mol/L KNO3 was added to the last two background solutions.
The supernatant was prepared from a ground ore (P80 ca. 100 μm) suspension (mass
fraction of solids 10 %) agitated for 1 day. The solution was recovered by a combination
of filter paper and membrane (pore size: 0.45 μm). The solution was analyzed by a
combination of atomic absorption spectroscopy (metal ions), argentometric titration
(chloride ion) and turbidimetry (sulphate ion).
Mixed mineral systems
The technique was based on Zhang et al., (1997). Different size fractions of pentlandite
and serpentine (-25 μm and +150/-212 μm) were mixed to facilitate subsequent
separation prior to zeta potential measurements. The coarse fraction (either pentlandite or
serpentine) was allowed to settle and a sample of the remaining fine particle suspension
was taken for zeta potential measurements. The background solutions for the mixed
mineral case were as described above.
5.2.3. Scanning electron microscopy
For microscopic examination, pentlandite (-106/+75 μm) was conditioned in a similar
way as for the zeta potential experiments. Samples were dried in a desiccator and placed
in holders before they were gold/platinum-coated for examination. The Philips XL30
field emission gun system scanning electron microscope (FEM-SEM) was used for
morphological characterization (secondary electrons) and elemental analysis (energy
dispersive spectroscopy).
Effect of serpentine and dissolved mineral species on electrokinetic behaviour of pentlandite 76
5.3. Results
5.3.1. Zeta potential
Individual minerals
In presence of indifferent electrolyte
For pentlandite (Figure 5.1) the isoelectric point (i.e.p.) was found at ca. pH 3. As with
most sulphide minerals, the i.e.p. of pentlandite can vary, in this case from pH 2 (non-
oxidized) to 10.5 (fully oxidized) (Bremmell et al., 2005, Fullston et al., 1999), the latter
value approximating the i.e.p. of nickel hydroxide (Parks, 1965). Therefore, an i.e.p. of
pH 3 approaches a largely oxide-free surface. The 95 % confidence interval indicates
some uncertainty. Experimental error can be attributed to surface oxidation: sulphide
minerals are relatively unstable and oxidize quickly in the presence of water containing
oxygen (Kitchener, 1992). Although water was bubbled with N2, it was not possible to
eliminate dissolved oxygen completely. The error increased at alkaline pH, where
hydroxide species form on the surface.
Figure 5.2 shows the zeta potential of serpentine as a function of pH. This serpentine
sample shows a positive zeta potential over a wide pH range with an isoelectric point at
about pH 10. Some caution regarding zeta potential measurements for minerals such as
serpentine is required. There are two concerns: serpentine is a phyllosilicate mineral, and
thus exhibits a heterogeneous surface charge (see Chapter 4); and the Smoluchowski
approximation assumes a spherical particle and this clinochrysotile type serpentine is
characterized by fibrous (acicular) morphology. However, the measurements can be used
for comparative purposes.

Chapter 5 77
-50
-40
-30
-20
-10
0
10
0 2 4 6 8 10 12
pH
ζ, m
V
[KNO3], mol/L
10-2
5×10⁻³
-50
-40
-30
-20
-10
0
10
0 2 4 6 8 10 12
pH
ζ, m
V
[KNO3], mol/L
10-2
5×10⁻³
Figure 5.1 – Zeta potential of pentlandite as a function of pH at two values of ionic strength: 10-2 mol/L (filled diamonds) and 5×10⁻³ mol/L (open squares) KNO3. (Note, error bars are the 95 %
confidence interval)
-20
-10
0
10
20
30
40
50
0 2 4 6 8 10 12
pH
ζ, m
V
[KNO3], mol/L
10-2
5×10⁻³
-20
-10
0
10
20
30
40
50
0 2 4 6 8 10 12
pH
ζ, m
V
[KNO3], mol/L
10-2
5×10⁻³
Figure 5.2 – Zeta potential of serpentine as a function of pH at two values of ionic strength: 10-2
mol/L (filled diamonds) and 5×10⁻³ mol/L (open squares) KNO3

Effect of serpentine and dissolved mineral species on electrokinetic behaviour of pentlandite 78
In presence of supernatant
Most minerals release some species to solution which may influence flotation. The
released species can undergo further reactions such as hydrolysis, complexation,
adsorption and precipitation. The nature of the complex equilibria involving such
reactions will determine the interfacial properties of the particle, and consequently its
floatability. In an attempt to take into consideration such effects, supernatant from an ore
suspension was used as background for the zeta potential measurements.
The composition of the supernatant is presented in Table 5.2. Magnesium and chloride
ions were the dominant species with Cu, Fe, Ni, Zn, Si and Al ions analyzed for but not
detected.
Figure 5.3 shows the zeta potential of pentlandite in the presence of supernatant. The
pentlandite became less negative over almost the whole range of pH tested and showed a
point of charge reversal (p.c.r.) at ca. pH 9. For comparison, the trend for pentlandite with
10-2 mol/L KNO3 as background is also presented.
For serpentine, the effect of supernatant became evident above pH 8: serpentine remained
positive and did not exhibit i.e.p. over the pH range tested (Figure 5.4).
Table 5.2 – Chemical species in the supernatant
Chemical species K+ [1] Na+ [1] Mg2+ [1] Ca2+ [1] Cl- [2] SO42- [3]
Concentration mmol/L 0.27 0.26 3.64 0.94 9.38 0.14 mg/L 10.69 5.93 88.5 37.55 332.5 13.5
[1] Determined by atomic absorption spectroscopy [2] Determined by argentometric titration [3] Determined by turbidimetry

Chapter 5 79
-25
-20
-15
-10
-5
0
5
10
15
0 2 4 6 8 10 12
pH
ζ, m
V
Pn in supernatant
Pn in KNO3
-25
-20
-15
-10
-5
0
5
10
15
0 2 4 6 8 10 12
pH
ζ, m
V
Pn in supernatant
Pn in KNO3
Figure 5.3 – Zeta potential of pentlandite as a function of pH with supernatant as background
electrolyte compared to 10-2 mol/L KNO3 as background electrolyte
-20
10
20
30
40
50
0 2 4 6 8 10 12
pH
ζ, m
V
-10
0 Serpentine in KNO3
Serpentine in supernatant
-20
10
20
30
40
50
0 2 4 6 8 10 12
pH
ζ, m
V
-10
0 Serpentine in KNO3
Serpentine in supernatant
Figure 5.4 – Zeta potential of serpentine as a function of pH with supernatant as background
electrolyte compared to 10-2 mol/L KNO3 as background electrolyte
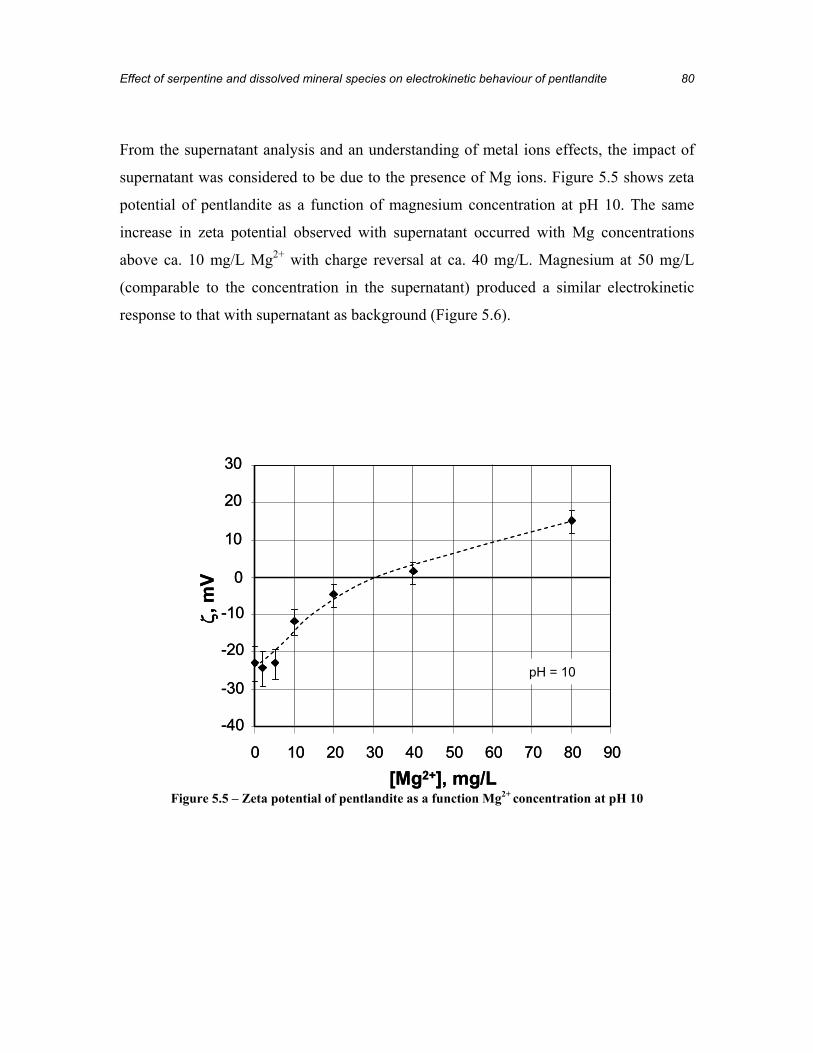
Effect of serpentine and dissolved mineral species on electrokinetic behaviour of pentlandite 80
From the supernatant analysis and an understanding of metal ions effects, the impact of
supernatant was considered to be due to the presence of Mg ions. Figure 5.5 shows zeta
potential of pentlandite as a function of magnesium concentration at pH 10. The same
increase in zeta potential observed with supernatant occurred with Mg concentrations
above ca. 10 mg/L Mg2+ with charge reversal at ca. 40 mg/L. Magnesium at 50 mg/L
(comparable to the concentration in the supernatant) produced a similar electrokinetic
response to that with supernatant as background (Figure 5.6).
-40
-30
-20
-10
0
10
20
30
0 10 20 30 40 50 60 70 80 90
[Mg2+], mg/L
ζ, m
V
pH = 10
-40
-30
-20
-10
0
10
20
30
0 10 20 30 40 50 60 70 80 90
[Mg2+], mg/L
ζ, m
V
pH = 10
Figure 5.5 – Zeta potential of pentlandite as a function Mg2+ concentration at pH 10
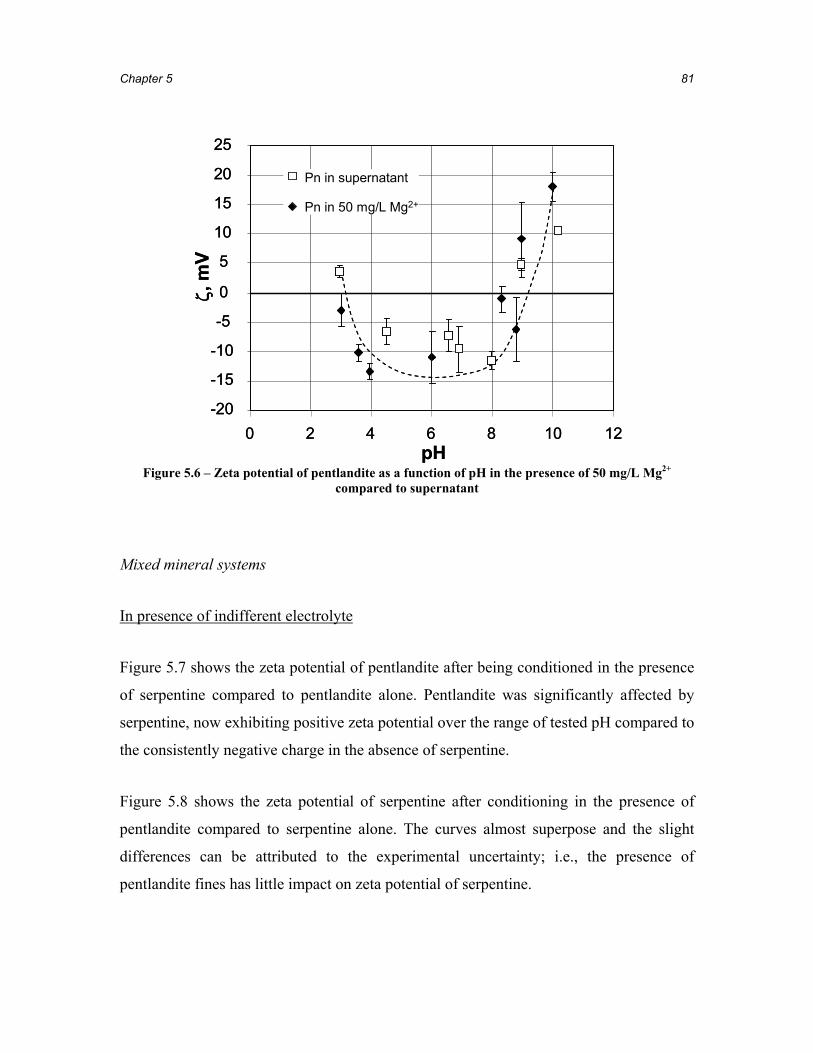
Chapter 5 81
-20
-15
-10
-5
0
5
10
15
20
25
0 2 4 6 8 10 12pH
ζ, m
VPn in supernatant
Pn in 50 mg/L Mg2+
-20
-15
-10
-5
0
5
10
15
20
25
0 2 4 6 8 10 12pH
ζ, m
VPn in supernatant
Pn in 50 mg/L Mg2+
Figure 5.6 – Zeta potential of pentlandite as a function of pH in the presence of 50 mg/L Mg2+
compared to supernatant
Mixed mineral systems
In presence of indifferent electrolyte
Figure 5.7 shows the zeta potential of pentlandite after being conditioned in the presence
of serpentine compared to pentlandite alone. Pentlandite was significantly affected by
serpentine, now exhibiting positive zeta potential over the range of tested pH compared to
the consistently negative charge in the absence of serpentine.
Figure 5.8 shows the zeta potential of serpentine after conditioning in the presence of
pentlandite compared to serpentine alone. The curves almost superpose and the slight
differences can be attributed to the experimental uncertainty; i.e., the presence of
pentlandite fines has little impact on zeta potential of serpentine.

Effect of serpentine and dissolved mineral species on electrokinetic behaviour of pentlandite 82
Pentlandite in presence of serpentine and supernatant
The above interpretation of Figure 5.7 implicates both adsorption of Mg species and
hetero-aggregation with serpentine fines. To investigate which effect might dominate, the
zeta potential of pentlandite conditioned with serpentine with supernatant as background
was measured (Figure 5.9). The result for pentlandite conditioned with serpentine with
KNO3 as background electrolyte is included for comparison. The zeta potential of
pentlandite under both these conditions is similar implying it is the presence of serpentine
that dominates up to ca. pH 8 but above this even in the absence of supernatant there
appears to remain a Mg species-like effect.
-30
-20
-10
0
10
20
30
40
50
0 2 4 6 8 10 12
pH
ζ, m
V
Pn + serpentine
Pn in 0.01 mol/L KNO3
-30
-20
-10
0
10
20
30
40
50
0 2 4 6 8 10 12
pH
ζ, m
V
Pn + serpentine
Pn in 0.01 mol/L KNO3
Figure 5.7 – Zeta potential of pentlandite conditioned with serpentine suspended in 10-2 mol/L KNO3
(open squares) compared to result for pentlandite in 10-2 mol/L KNO3 (filled diamonds)

Chapter 5 83
-20
-10
0
10
20
30
40
50
0 2 4 6 8 10 12
pH
ζ, m
V
Serpentine + Pn
Serpentine in 0.01 mol/L KNO3
-20
-10
0
10
20
30
40
50
0 2 4 6 8 10 12
pH
ζ, m
V
Serpentine + Pn
Serpentine in 0.01 mol/L KNO3
Figure 5.8 – Zeta potential of serpentine conditioned with pentlandite suspended in 10-2 mol/L KNO3
(open squares) compared to the result for pentlandite in 10-2 mol/L KNO3 (filled diamonds)
0
10
20
30
40
0 2 4 6 8 10 12
pH
ζ, m
V
Pn + serpentine in supernatantPn + serpentine
0
10
20
30
40
0 2 4 6 8 10 12
pH
ζ, m
V
Pn + serpentine in supernatantPn + serpentine
Figure 5.9 – Zeta potential of pentlandite conditioned with serpentine suspended in supernatant
compared to result for pentlandite conditioned with serpentine suspended in 10-2 mol/L KNO3 (open squares)

Effect of serpentine and dissolved mineral species on electrokinetic behaviour of pentlandite 84
5.3.2. Scanning electron microscopy
Scanning electron microscopy was used for direct surface inspection of pentlandite
particles (Figure 5.10). Micrographs of pentlandite conditioned in supernatant at pH 4
and 10 (i.e., a pH well below and at about the pH of magnesium hydroxide precipitation,
respectively) showed clear differences: the surface at pH 4 (Figure 5.10 b) looked similar
to that conditioned in KNO3 (Figure 5.10 a) while pentlandite conditioned in supernatant
at alkaline pH presented a rough surface, most likely due to Mg(OH)2 precipitation
(Figure 5.10 c). Energy dispersive analysis showed that magnesium and silicon are
present in the sample conditioned with supernatant. Micrographs of pentlandite
conditioned with serpentine at pH 10 showed a surface extensively covered with fibrous
particles (Figure 5.10 d) and EDS analysis revealed magnesium and silicon, presumably
from adsorbed serpentine. Figure 5.10 e showed the fibril disaggregation of a particle,
probably serpentine, which produced the slimes.

Chapter 5 85
Figure 5.10 – Scanning electron micrographs of pentlandite conditioned alone in 10-2 mol/L KNO3 solution at pH 10 [a]; conditioned alone in supernatant at pH 4 [b] and at pH 10 [c]; conditioned with
serpentine at pH 10 [d] and a particle of fibrous serpentine [e]
[a] [b]
[c] [d]
[e]
10 μm 10 μm
10 μm
10 μm
1 μm

Effect of serpentine and dissolved mineral species on electrokinetic behaviour of pentlandite 86
5.4. Discussion
Though surface charge is not the primary cause of attachment of particles to bubbles, it
plays other important roles in fine particle flotation systems notably controlling particle-
particle interactions and adsorption of some chemical species. Zeta potential
measurements are frequently used to predict aggregation/dispersion behaviour in aqueous
systems, but in the case of flotation such predictions are usually made on the basis of
experiments that differ from the operating conditions. The present work attempted to
address this limitation by progressively establishing conditions closer to reality.
The possibility of pentlandite heterocoagulating with and becoming coated with
serpentine slimes at the pH of flotation (ca. pH 9) is supported by the classical zeta
potential measurements made on individual minerals in the presence of indifferent
electrolyte: at pH 9, serpentine will be positively charged and pentlandite negatively
charged and, consequently, electrostatic attraction between these two minerals is
expected.
When the minerals were placed in supernatant derived from the ore, the results showed
that the species released interacted with pentlandite, increasing the zeta potential,
reversing the charge and making the surface positive at the flotation pH. Magnesium
species were suspected to be the cause of the change in electrokinetic response based
both on the concentration measured in the ore supernatant and previous experience with
sulphide minerals (Mirnezami et al. 2003; El-Ammouri et al., 2002). Similar observations
have been reported for other minerals in the presence of magnesium and other polyvalent
cations, which adsorb when they hydrolyze to from hydroxyl complexes (Fuerstenau and
Palmer, 1976). Charge reversal is associated with hetero-coagulation of Mg(OH)2
precipitates which form above ca. pH 10 and are positively charged (Mirnezami et al.,
2003). Tests where Mg2+ was introduced (as MgCl2) confirmed that Mg species could
account for the effect of supernatant. Scanning electron microscopy images provided

Chapter 5 87
evidence for their presence on the surface. The hetero-coagulation (or adsorption) of
Mg(OH)2 precipitates can be counted as another example of slime coating. This impact of
Mg ions makes predicting electrostatic interaction between pentlandite and serpentine at
alkaline (i.e., flotation) pH less certain.
The mixed mineral systems, while not designed to this end initially, however confirm that
slime coating of serpentine on pentlandite will occur. The evidence pointed to some
disintegration of the coarse serpentine providing sufficient fines (slimes) to hetero-
coagulate with pentlandite. The SEM micrographs confirmed that the surface carried fine
serpentine fibres. Heterocoagulation being dominant holds true to about pH 9, i.e.,
approximately up to the i.e.p. of serpentine. Unlike serpentine alone, however, above this
pH, the pentlandite (after contact with serpentine) remained positively charged.
Consequently, slime coating of serpentine alone cannot account completely for the
electrokinetic behaviour of pentlandite in contact with serpentine and seems to point to a
combined effect with some released species from the serpentine. At these pHs (>9) this
re-introduces a possible role of Mg(OH)2 precipitates, implying sufficient Mg being
released by serpentine, or possibly directly transferred on particle contact to affect
pentlandite zeta potential. It is evident that sufficient Mg release will also increase
serpentine zeta potential at pH > 9 (Figure 5.4). The SEM micrographs provided
ambiguous support for the combined adsorption of serpentine and Mg(OH)2 precipitates
and since magnesium is present in both, EDS analysis did not resolve either. Thus while
some uncertainty on the role of Mg species in the pentlandite-serpentine case with
indifferent electrolyte remains it is evident that under flotation conditions a combined
serpentine/Mg(OH)2 slime coating effect will be at play. The wide use of soda ash
(sodium carbonate) for pH adjustment in Ni-ore processing may have its origin in control
of Mg(OH)2 sliming by sequestering magnesium as the carbonate.

Effect of serpentine and dissolved mineral species on electrokinetic behaviour of pentlandite 88
5.5. Conclusions
An electrophoretic study was carried out to determine response of pentlandite and
serpentine under conditions progressively approaching actual flotation. The principal
outcomes are:
Zeta potential measurements performed on pentlandite and serpentine individually
in indifferent electrolyte showed the two minerals had opposite charge at flotation
pH 10 and that slime coating could occur as a consequence of electrostatic
attraction.
When pentlandite was suspended in ore supernatant, the zeta potential reflected
adsorption of magnesium species that reversed the charge at flotation pH.
The mixed mineral case revealed an effect on pentlandite zeta potential at
flotation pH attributed to a combined slime coating with serpentine and
magnesium hydroxide precipitates.
References
Acar S., Somasundaran P. (1992) Effect of dissolved mineral species on the
electrokinetic behavior of sulfides. Minerals Engineering 5: 27-40
Adler J.J., Singh P.K., Patist A., Rabinovich Y.I., Shah D.O., Moudgil B.M. (2000)
Correlation of particulate dispersion stability with the strength of self-assembled
surfactant films. Langmuir 16: 7255-7262
Bremmell K.E., Fornasiero D., Ralston J. (2005) Pentlandite-lizardite interactions and
implications for their separation by flotation. Colloids and Surfaces A:
Physicochemical and Engineering Aspects 252: 207-212

Chapter 5 89
Chibowski E. (1979) Zeta potential and surface free energy changes: Quartz/n-heptane-
water system. Journal of Colloid and Interface Science.69 (2): 326-329
Das K.K., Pradip, Natarajan K.A. (1997) The effect of constituent metal ions on the
electrokinetics of chalcopyrite. Journal of Colloid and Interface Science 196(1): 1-11
DiFeo A., Xu Z., Finch J. A. Electrokinetic study of sulfide minerals in mixed systems
J.A. Finch, S.R. Rao, I. Holubec (Eds.) Processing of Complex Ores, Mineral
Processing, and the Environment. International Symposium of the Metallurgical
Society of CIM, 257-271. 1997
Edwards C.R., Kipkie W.B., Agar G.E. (1980) The effect of slime coatings of the
serpentine minerals, chrysotile and lizardite, on pentlandite flotation. International
Journal of Mineral Processing 7: 33-42
El-Ammouri E., Mirnezami M., Lascelles D., Finch J. A. (2002) Aggregation index and
a methodology to study the role of magnesium in aggregation of sulphide slurries.
CIM Bulletin 95: 67-72
Fuerstenau D.W. (2001) Excess nonequilibrium collector adsorption and flotation rates.
Minerals and Metallurgical Processing 18(2): 83-86.
Fuerstenau D.W., Shibata J. (1999) On using electrokinetics to interpret the flotation and
interfacial behavior of manganese dioxide. International Journal of Mineral
Processing 57(3): 205-217
Fuerstenau M.C., Palmer B.R. Anionic flotation of oxides and silicates. M.C. Fuerstenau
(Ed). In Flotation A.M. Gaudin Memorial Volume 1, 148-196. 1976. American
Institute of Mining and Metallurgical Engineering, New York, U.S.A.
Effect of serpentine and dissolved mineral species on electrokinetic behaviour of pentlandite 90
Fullston D., Fornasiero D., Ralston J. (1999) Zeta potential study of the oxidation of
copper sulfide minerals. Colloids and Surfaces, A: Physicochemical and Engineering
Aspects 146(1-3): 113-121
Hunter R.J., Neville P.C. (1980) Colloid chemical aspects of slime coating removal.
Colloids and Surfaces 1(3-4): 257-68
Kitchener J.A. Minerals and Surfaces. J.S. Laskowski, J. Ralston (Eds) In Developments
in Mineral Processing Volume 12 (Colloid Chemistry in Mineral Processing), 1-35.
1992. Elsevier, Amsterdam, The Netherlands
Malysiak V., O'Connor C.T., Ralston J., Gerson A.R., Coetzer L.P., Bradshaw D.J.
(2002) Pentlandite-feldspar interaction and its effect on separation by flotation.
International Journal of Mineral Processing 66(1-4): 89-106
Malysiak V., Shackleton N.J., O'Connor C.T. (2004) An investigation into the floatability
of a pentlandite-pyroxene system. International Journal of Mineral Processing 74(1-
4): 251-262
Mani H., Xu M., Quinn P. The effect of ultramafic mineralogy on pentlandite flotation.
J.A. Finch, S.R. Rao, I. Holubec (Eds). Processing of Complex Ores, In Mineral
Processing, and the Environment. International Symposium of the Metallurgical
Society of CIM, 63-76. 1997
Mirnezami M., Hashemi M.S., Finch J.A. Aggregation effect of Zn2+ and Mg2+ ions in
sulphide mineral pulps. XXII International Mineral Processing Congress, Cape Town
2003
Chapter 5 91
Moudgil B.M., Soto H., Somasundaran P. (1988) Adsorption of surfactants on minerals,
In Reagents in Mineral Technology, P. Somasundaran and B.M. Moudgil (Eds),
Surfactants Science Series, Vol. 27, Marcel Dekker, New York, pp. 79-104
O'Connor C.T., Malysiak V., Shackleton N.J. (2006) The interaction of xanthates and
amines with pyroxene activated by copper and nickel. Minerals Engineering 19(6-8):
799-806
Parsonage P.G. (1985) Effects of slime and colloidal particles on the flotation of galena.
Developments in Mineral Processing 6: 111-139
Parks G.A. (1965) The isoelectric points of solid oxides, solid hydroxides, and aqueous
hydroxo complex systems. Chemical Reviews 65: 177-198
Prestidge C.A., Rowlands W.N. (1997) Electroacoustic measurements of sulfide mineral
particles. Minerals Engineering 10(10): 1107-1118
Reck B.K., Chambon M., Hashimoto S., Graedel T.E. (2010) Global stainless steel cycle
exemplifies China's rise to metal dominance. Environmental Science and
Technology 44: 3940-3946
Xu M., Quinn P., Wells P. (2003 a) A movable mineral processing miniplant. 35th Annual
Meeting of the Canadian Mineral Processors Ottawa, ON, 317-329
Xu Z., Liu J., Choung J.W., Zhou Z. (2003 b) Electrokinetic study of clay interactions
with coal in flotation. International Journal of Mineral Processing 68(1-4): 183-196
Zhang Q., Rao S.R., Finch J.A. (1992) Flotation of sphalerite in the presence of iron ions.
Colloids and Surfaces 66: 81-89

Effect of serpentine and dissolved mineral species on electrokinetic behaviour of pentlandite 92
Zhang Q., Xu Z., Bozkurt V., Finch J. (1997) Pyrite flotation in the presence of metal
ions and sphalerite. International Journal of Mineral Processing 52: 187-201

93
6
Effect of flotation reagents on hetero-aggregation
of pentlandite and serpentine
Abstract
This chapter investigates the effect of carboxymethyl cellulose (CMC), pH and xanthate
on hetero-aggregation of pentlandite and serpentine as it relates to the processing of
ultramafic Ni-ore. The state of aggregation/dispersion was determined using a light
scattering technique. A 3-factor, 3-level central composite design with a replicated
central point was used to determine the most important factors and their interactions. The
levels of the variables were: CMC, 0 mg/L, 25 mg/L and 50 mg/L; pH, 6, 8 and 10; and

Chapter 6 94
xanthate, 0 mg/L, 3 mg/L and 5 mg/L. The CMC concentration and the interaction
between CMC and pH were the most important factors determining
aggregation/dispersion. Optical microscopy validated the findings.
6.1. Introduction
Aggregation is usually counterproductive to physical separation processes unless
selective aggregation can be achieved. A common form of aggregation is slime coating.
Typically, this refers to fine particles (< 20 μm) of gangue that adhere to particles of
valuable mineral and reduce flotation selectivity. The example of interest here is slime
coating of serpentine minerals on pentlandite, which is a suspected hindrance to flotation
selectivity in processing ultramafic Ni-ores (Bremmell et al., 2005; Edwards et al., 1980).
Inter-particle forces control slime coating. Two principal forces are electrostatic and van
der Waals. Hydrophobic interaction, hydration and steric repulsion forces may also be
involved. The magnitude of these forces is controlled in practice by the addition of
reagents, including pH regulators.
Carboxymethyl cellulose (CMC) is a typical dispersant for gangue silicates like
serpentine. CMC is an anionic linear polymer prepared by reacting cellulose in the
presence of sodium hydroxide with chloro-acetic acid. CMC has proven to be effective at
preventing silicate slime coating in flotation of nickel minerals (Pugh, 1989). CMC
appears to adsorb onto silicates through hydrogen bonding between the hydroxyl groups
of the CMC and the mineral surface oxygen sites such as those on the edge plane of
serpentine (Shortridge et al., 2000). Adsorption of CMC on serpentine particles increases
the negative surface charge (due to the carboxy, COO-, group), which promotes
electrostatic repulsion between serpentine and pentlandite at flotation pH (ca. pH 10).
Additionally, the hydroxyl groups in the CMC structure render the serpentine
hydrophilic, which also aids its dispersion (and depression) (Wellham et al., 1992; Pugh,
1989).

Effect of flotation reagents on hetero-aggregation of pentlandite and serpentine 95
The purpose of this study is to determine the effect of amyl xanthate collector, CMC and
pH on the hetero-aggregation of pentlandite and serpentine using a calculated dispersion
index (DI) as the response.
6.2. Experimental
6.2.1. Minerals
Pentlandite concentrate was obtained from the Vale mini-plant processing an ultramafic
ore from Thompson, Manitoba (Xu et al., 2003). . The concentrate was sieved and the
fine material (-75 μm) discarded. The pentlandite content of the -106/+75 μm fraction
was further upgraded by gravity and magnetic separation. This purified pentlandite was
ground and sieved and the -25 μm fraction reserved for testing. Using this procedure,
creating fine material from coarse gives fresh surface and mitigates the effect of residual
reagents (Mirnezami and Finch, 2003).
Serpentine from a ground sample of the ultramafic ore was isolated by gravity and
magnetic separation. The final product was examined by X-ray diffraction, which showed
clinochrysotile as the main silicate phase with minor pyrrhotite. The upgraded sample
was sieved and the -25 μm fraction was used for testing.
6.2.2. Reagents
The following reagents were used:
Sodium carboxymethyl cellulose (Sigma) with a molecular weight of 700 000
g/mol and a degree of substitution of 0.65-0.85 (i.e., the amount of hydroxyl
groups substituted by carboxymethyl groups for each monomer of
glucopyranose). As a note, carboxymethyl cellulose for industrial flotation has a
wide range of molecular weight and degree of substitution. For example, CMC

Chapter 6 96
Depramin 347 (Akzo Nobel Functional Chemicals) has a molecular weight of
510 600 g/mol and a degree of substitution of 0.47, as reported by Bicak et al.
(2007).
Carboxymethyl cellulose was added from a stock solution with a concentration of
5000 mg/L agitated overnight to ensure its complete dissolution.
Potassium amyl xanthate (PAX Prospec Chemicals) industrial grade, purified by
dissolution-recrystallization, according to the procedure described by Rao (1971).
Potassium nitrate (Fisher) 99.6 % purity, as background electrolyte.
KOH and HCl (Fisher) as pH modifiers.
6.2.3. Aggregation/dispersion tests
Suspensions were prepared with 4 and 2 g/L of pentlandite and serpentine, respectively
(equivalent to a volumetric fraction of 0.08 % of each mineral); minerals were separately
placed in 10-2 mol/L KNO3 and PAX solution. The pH was then adjusted and allowed to
stabilize. Suspensions were mixed with a magnetic stirrer and CMC added as required.
An aliquot was transferred to a quartz cell (cell constant = 2) and placed in a UV/Visible
spectrophotometer (Helios, model etc). Absorbance as a function of time was monitored
to indicate dispersion index. This scale of test setup suited the limited amount of sample
available.
A 3-factor, 3-level central composite design (α = 1) with a replicated central point was
chosen, shown in Figure 6.1. This design allows major factors and interactions to be
identified. An estimation of experimental precision is calculated from the centre point
repeats. The levels were estimated from typical Vale mini-plant operation, the xanthate
and CMC dosage being converted from the original g/t basis to g/L based on typical pulp
% solids.

Effect of flotation reagents on hetero-aggregation of pentlandite and serpentine 97
Coded units
PAX-1 -1 -1 -1 -1 -1
-1 +1 +1 +1 +1 +1
+1 0 0
0 +1 0
0 -1 0
0 0 -1
0 0 +1
-1 0 0
+1 +1 -1
+1 -1 +1
0 0 0
-1 +1 -1
-1 -1 +1
PAX, mg/L CMC, mg/L pH
-1 1 0 6
35
2550
810
0+1
Figure 6.1 – Representation of the experimental design in coded units; original units are displayed in
the table on the right side
6.2.5. Optical microscopy
Optical microscopy was used to evaluate the state of aggregation/dispersion and augment
the dispersion index data. The sample conditioning procedure was the same as for the
aggregation/dispersion tests. After conditioning, a pipette was used to transfer an aliquot
of the suspension to a beaker and the sample was diluted ten times with supernatant. A
sub-sample was taken and placed in a Petri dish and examined under a microscope (Leitz
Laborluz 11POL) equipped with a video camera (Sony CCD Iris). The procedure is based
on that described by Kissa (1999). Single-mineral systems were also examined at the
same solids volumetric concentration as used in the mixed-mineral case.
6.3. Results
6.3.1. Dispersion index
Table 6.1 shows the dispersion index in absorbance units per second (A/s). Runs 9 and
10 correspond to the central points, which have a standard deviation of 0.0105 A/s and
relative standard deviation of 3.09 %.

Chapter 6 98
Table 6.2 displays the coefficient for the factors or interactions on the first regression
model. An F-test was used to verify the significance of individual coefficients; a P value
gives the probability of being wrong if it is assumed that the factor or interaction is
significant. The rule adopted was to drop all factors with P > 0.1 (10 % of probability of
being wrong). This retained the CMC factor, its quadratic term and the pH-CMC
interaction term. Also, a common rule is to retain a factor in the model if one of its
interaction terms is significant. Thus, pH was also retained, even though its P value was
high (0.5660).
To check the validity of the regression model an F-test was again used. If P < 0.05 the
model is considered significant at better than the 95 % confidence level. The model had a
P value = 0.0066 thus was significant at greater than the 99 % confidence level. A high
correlation coefficient (R2) is also an indication of the model fit. Both R2 and adjusted R2
were acceptable in the first regression.
Table 6.1 – Dispersion index for the experimental design
Factors
Run Random order
PAX, mg/L
CMC, mg/L pH Dispersion
index, A/s 1 10 1 0 6 0.4372 2 9 1 0 10 0.5520 3 4 1 50 6 0.3232 4 7 1 50 10 0.3160 5 15 5 0 6 0.4972 6 16 5 0 10 0.5120 7 2 5 50 6 0.3312 8 3 5 50 10 0.3012 9 8 3 25 8 0.3460
10 5 3 25 8 0.3312 11 13 1 25 8 0.3792 12 1 5 25 8 0.3032 13 14 3 0 8 0.4892 14 11 3 50 8 0.3200 15 12 3 25 6 0.3800 16 6 3 25 10 0.3440
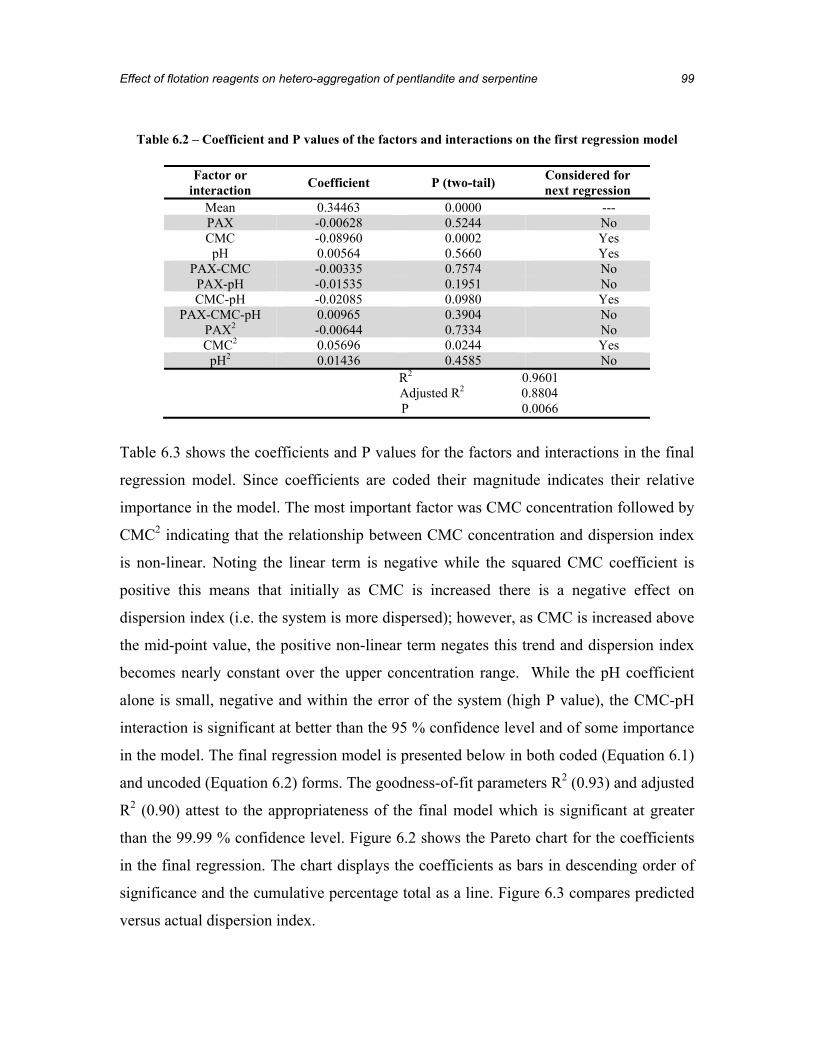
Effect of flotation reagents on hetero-aggregation of pentlandite and serpentine 99
Table 6.2 – Coefficient and P values of the factors and interactions on the first regression model
Factor or
interaction Coefficient P (two-tail) Considered for next regression
Mean 0.34463 0.0000 --- PAX -0.00628 0.5244 No CMC -0.08960 0.0002 Yes
pH 0.00564 0.5660 Yes PAX-CMC -0.00335 0.7574 No PAX-pH -0.01535 0.1951 No CMC-pH -0.02085 0.0980 Yes
PAX-CMC-pH 0.00965 0.3904 No PAX2 -0.00644 0.7334 No CMC2 0.05696 0.0244 Yes
pH2 0.01436 0.4585 No R2 0.9601 Adjusted R2 0.8804
P 0.0066
Table 6.3 shows the coefficients and P values for the factors and interactions in the final
regression model. Since coefficients are coded their magnitude indicates their relative
importance in the model. The most important factor was CMC concentration followed by
CMC2 indicating that the relationship between CMC concentration and dispersion index
is non-linear. Noting the linear term is negative while the squared CMC coefficient is
positive this means that initially as CMC is increased there is a negative effect on
dispersion index (i.e. the system is more dispersed); however, as CMC is increased above
the mid-point value, the positive non-linear term negates this trend and dispersion index
becomes nearly constant over the upper concentration range. While the pH coefficient
alone is small, negative and within the error of the system (high P value), the CMC-pH
interaction is significant at better than the 95 % confidence level and of some importance
in the model. The final regression model is presented below in both coded (Equation 6.1)
and uncoded (Equation 6.2) forms. The goodness-of-fit parameters R2 (0.93) and adjusted
R2 (0.90) attest to the appropriateness of the final model which is significant at greater
than the 99.99 % confidence level. Figure 6.2 shows the Pareto chart for the coefficients
in the final regression. The chart displays the coefficients as bars in descending order of
significance and the cumulative percentage total as a line. Figure 6.3 compares predicted
versus actual dispersion index.
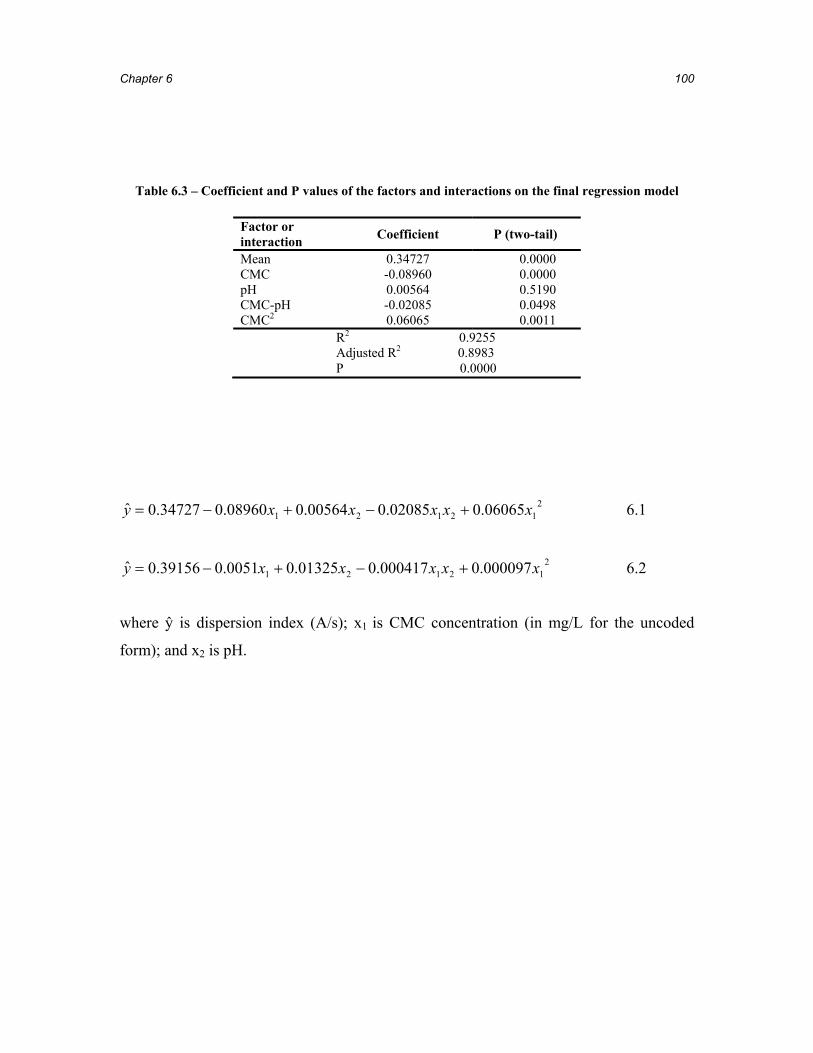
Chapter 6 100
Table 6.3 – Coefficient and P values of the factors and interactions on the final regression model
Factor or interaction Coefficient P (two-tail)
Mean 0.34727 0.0000 CMC -0.08960 0.0000 pH 0.00564 0.5190 CMC-pH -0.02085 0.0498 CMC2 0.06065 0.0011
R2 0.9255 Adjusted R2 0.8983 P 0.0000
212121 06065.002085.000564.008960.034727.0ˆ xxxxxy +−+−= 6.1
212121 000097.0000417.001325.00051.039156.0ˆ xxxxxy +−+−= 6.2
where ŷ is dispersion index (A/s); x1 is CMC concentration (in mg/L for the uncoded
form); and x2 is pH.

Effect of flotation reagents on hetero-aggregation of pentlandite and serpentine 101
%
0 0.02 0.04 0.06 0.08 0.1
CMC
CMC2
CMC-pH
pH
0 20 40 60 80 100
Coefficient (absolute value)
Fact
or o
r int
erac
tion
%
0 0.02 0.04 0.06 0.08 0.1
CMC
CMC2
CMC-pH
pH
0 20 40 60 80 100
Coefficient (absolute value)
Fact
or o
r int
erac
tion
Figure 6.2 – Pareto chart of regression coefficients
0.2
0.3
0.4
0.5
0.6
0.2 0.3 0.4 0.5 0.6
A/s, actual values
A/s
, pre
dict
ed v
alue
s
0.2
0.3
0.4
0.5
0.6
0.2 0.3 0.4 0.5 0.6
A/s, actual values
A/s
, pre
dict
ed v
alue
s
Figure 6.3 – Comparison of modeled versus actual dispersion indexes

Chapter 6 102
The contour plot of dispersion index as a function of pH and CMC concentration is
shown in Figure 6.4. This type of plot is selected to represent the three-dimensional
surface in a two-dimensional format. The lines show the equal values of the response.
Figure 6.4 shows that as CMC concentration increases dispersion index decreases (i.e.,
system is more dispersed) and dispersion index increases (i.e., system is less dispersed)
when pH increases.
6.0
6.4
6.9
7.3
7.8
8.2
8.7
9.1
9.6
10.0
0
6
11
17
22
28
33
39
44
50
pH
CM
C, m
g/L
0.3-0.36
0.36-0.42
0.48-0.54
0.42-0.48
DI A/s
6.0
6.4
6.9
7.3
7.8
8.2
8.7
9.1
9.6
10.0
0
6
11
17
22
28
33
39
44
50
pH
CM
C, m
g/L
0.3-0.36
0.36-0.42
0.48-0.54
0.42-0.48
DI A/s
Figure 6.4 – Contour plot of dispersion index (A/s) as a function of pH and CMC concentration
(mg/L). PAX content was fixed at its centre level (3 mg/L)
Dispersion index as a function of CMC concentration for pH 6, 8 and 10 is plotted in
Figure 6.5. This Figure demonstrates the interaction between CMC and pH. It is observed
that CMC is effective up to about 30 mg/L for pH 6 and 8. At pH 10 the dispersion index

Effect of flotation reagents on hetero-aggregation of pentlandite and serpentine 103
continues to decrease by increasing CMC concentration up to 40 mg/L. However the
advantage is small at the cost of consuming significantly more CMC and pH modifier. In
the range 25 mg/L to 35 mg/L the effect of pH is minimal. The slope of the trend
increases when pH increases, which implies that the same amount of CMC will produce a
larger change in dispersion index at higher pH (i.e., CMC is slightly more effective at
higher pH). This becomes more evident with the following example: at pH 6 if CMC is
increased from 0 to 10 mg/L, dispersion index decreases from 0.471 A/s to 0.407 A/s (net
variation: ca. 14 %) while at pH 10 the same increase in CMC decreases dispersion index
from 0.524 A/s to 0.441 A/s (net variation: ca. 16 %).
0.25
0.3
0.35
0.4
0.45
0.5
0.55
0 5 10 15 20 25 30 35 40 45 50
CMC, mg/L
DI,
A/s
68
pH
10
0.25
0.3
0.35
0.4
0.45
0.5
0.55
0 5 10 15 20 25 30 35 40 45 50
CMC, mg/L
DI,
A/s
68
pH
10
Figure 6.5 – Dispersion index as a function of CMC concentration for pH 6, 8 and 10. (Note, symbols
are to identify the trends)
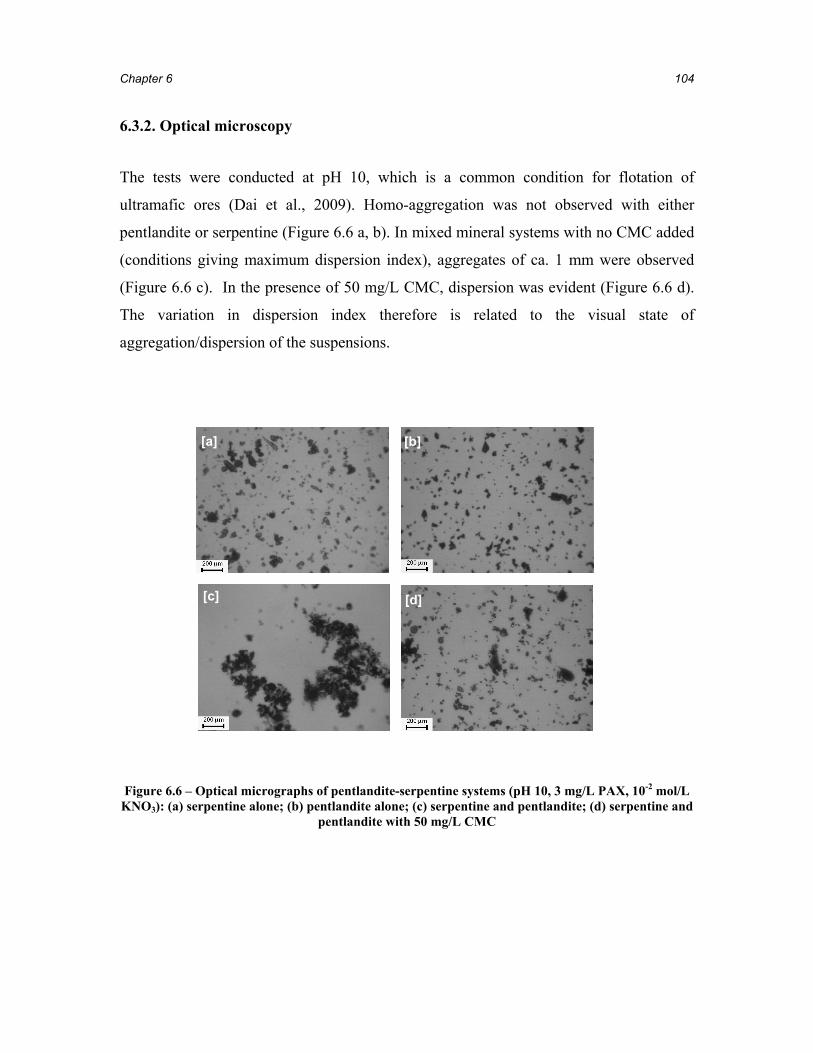
Chapter 6 104
6.3.2. Optical microscopy
The tests were conducted at pH 10, which is a common condition for flotation of
ultramafic ores (Dai et al., 2009). Homo-aggregation was not observed with either
pentlandite or serpentine (Figure 6.6 a, b). In mixed mineral systems with no CMC added
(conditions giving maximum dispersion index), aggregates of ca. 1 mm were observed
(Figure 6.6 c). In the presence of 50 mg/L CMC, dispersion was evident (Figure 6.6 d).
The variation in dispersion index therefore is related to the visual state of
aggregation/dispersion of the suspensions.
Figure 6.6 – Optical micrographs of pentlandite-serpentine systems (pH 10, 3 mg/L PAX, 10-2 mol/L
KNO3): (a) serpentine alone; (b) pentlandite alone; (c) serpentine and pentlandite; (d) serpentine and pentlandite with 50 mg/L CMC
[a] [b]
[c] [d]
Effect of flotation reagents on hetero-aggregation of pentlandite and serpentine 105
6.4. Discussion
An experimental design methodology was employed to determine the effect of three
variables (amyl xanthate concentration, CMC concentration, and pH) on the
aggregation/dispersion of -25 μm pentlandite-serpentine particle mixtures using
dispersion index as the response. To accommodate the small mass of sample available a
light scattering technique using a standard UV/Visible spectrophotometer was employed.
The dispersion index measured by rate of change in absorbance (A/s) proved reliable and
the inferred aggregation/dispersion state correlated with the visual information.
The aim is to identify conditions for processing ultramafic ores with high serpentine
content: those giving dispersion are considered a good starting point. The three variables
tested reflect common practice for processing Ni-sulphide ores with silicate gangue. The
concentrations of xanthate and CMC were selected based on conditions in the Vale mini-
plant processing ultramafic ore from the Thompson (Manitoba) area. A common pH for
Ni-sulphide flotation is ca. pH 10 but lower pH (i.e., requiring less pH modifier) is
generally desirable.
Initial tests employed dosages based on a g/t basis equivalent to that used in the mini-
plant. Using the same experimental design the variables showed no effect on dispersion
index. The decision was taken to re-test based on the equivalent solution concentration
(i.e. mg/L) knowing the slurry density (% solids). This approach yielded a response. This
observation points to a difficulty in scaling down to laboratory conditions.
Fundamentally, it may mean that reagent concentration in solution is the main driver and
not the more common mass per tonne basis used in concentrator practice.
The results showed the significance of CMC in promoting dispersion. Edwards et al.
(1980) found that hetero-aggregation between serpentine and pentlandite is controlled by
their surface charge, as demonstrated in Chapter 5: at alkaline pH the minerals are
oppositely charged and electrostatic attraction occurs. Aggregation is also promoted by

Chapter 6 106
compression of the double layer under the action of electrolytes (Klassen and
Mokrousov, 1963). In the present work, double-layer compression may be at play causing
the aggregation observed at pH 6, which is close to the isoelectric point of mildly
oxidized pentlandite (Bremmell et al., 2005, Fullston et al., 1999).
Another mechanism of hetero-aggregation is attributed to hydrophobic interaction
resulting from adsorbed collector (Johnson et al, 2000; Klassen and Mokrousov, 1963).
The concentration of PAX used (up to 5 mg/L, ca. 2.5×10⁻⁵ mol/L) does not seem
sufficient to produce this type of aggregation. It has been reported that the small amounts
of collector sufficient to make minerals hydrophobic are insufficient to produce
aggregation (Klassen and Mokrousov, 1963).
In some cases pH not only affects adsorption of chemical species by controlling mineral
surface charge but also by changing the degree of solution species dissociation. The latter
does not seem to be a factor here for either CMC or xanthate. In other cases, OH- and H+
may compete for the adsorption sites on the mineral surfaces. The final regression model
derived here indicates that pH alone is not as significant as the pH-CMC interaction term
in promoting dispersion in the pentlandite-serpentine system. In effecting dispersion, it is
evident that pH affects mineral-CMC interaction and not mineral-mineral interactions, as
supported by direct visual observation.
6.5. Conclusions
A UV/Visible spectrophotometer was utilized to estimate the dispersion index by
monitoring the light absorption of a suspension as a function of time. Optical microscopy
provided visual evidence of correlation between the dispersion index and the state of
aggregation/dispersion.
The technique was applied to investigate dispersion in the pentlandite-serpentine system
using an experimental design with carboxymethyl cellulose (CMC) concentration, amyl

Effect of flotation reagents on hetero-aggregation of pentlandite and serpentine 107
xanthate concentration and pH as factors. CMC and the interaction between pH and CMC
were the most important factors controlling dispersion. The effect of CMC is non linear
and works to reduce the effect on dispersion as concentration is increased. Interaction
between CMC and pH indicated that CMC is more effective in dispersion at high pH.
References
Bicak O., Ekmekci Z., Bradshaw D.J., Harris P.J. (2007) Adsorption of guar gum and
CMC on pyrite. Minerals Engineering 20: 996-1002
Bremmell K.E., Fornasiero D., Ralston J. (2005) Pentlandite-lizardite interactions and
implications for their separation by flotation. Colloids and Surfaces A:
Physicochemical and Engineering Aspects 252: 207-212
Dai Z., Bos J.A., Quinn P. Lee A., Xu M. Flowsheet development for Thompson
ultramafic low-grade nickel ores. C.O. Gomez; J.E. Nesset, S.R. Rao (Eds.)
Advances in Mineral Processing Science and Technology. International Symposium of
the Metallurgical Society of CIM, 217-228.2009
Edwards C.R., Kipkie W.B., Agar G.E. (1980) The effect of slime coatings of the
serpentine minerals, chrysotile and lizardite, on pentlandite flotation. International
Journal of Mineral Processing 7: 33-42
Johnson S.B., Franks G.V., Scales P.J., Boger D.V., Healy T.W. (2000) Surface
chemistry-rheology relationship in concentrated mineral suspension. International
Journal of Mineral Processing 58:267-304
Kissa E (1999) Dispersions. Characterization, Testing, and Measurements. A.T. Hubbart
(Ed). Surfactant Science Series. Marcel Dekker: New York, USA

Chapter 6 108
Klassen V.I., Mokrousov V.A. (1963) An Introduction to the Theory of Flotation,
Butterworths: London, UK
Mirnezami, M., Restrepo, L., Finch, J. A. (2003) Aggregation of sphalerite: role of zinc
ions. Journal of Colloid and Interface Science 259: 36-42
Pugh R.J. (1989) Macromolecular organic depressants in sulphide flotation-A review, 1.
Principles, types and applications. International Journal of Mineral Processing 25:
101-130
Rao S.R. (1971) Xanthates and Related Compounds, Marcel Dekker, Inc., New York
Shortridge PG, Harris PJ, Bradshaw DJ, Koopal LK (2000) The effect of chemical
composition and molecular weight of polysaccharide depressants on the flotation of
talc. International Journal of Mineral Processing 59: 215-224
Wellham E.J., Elber L., Yan D.S. (1992) The role of carboxy methyl cellulose in the
flotation of a nickel sulphide transition ore. Minerals Engineering 5: 381-395
Xu Z., Liu J., Choung J.W., Zhou Z. (2003) Electrokinetic study of clay interactions with
coal in flotation. International Journal of Mineral Processing 68(1-4): 183-196

109
7
Contact angle measurements and flotation study in
the pentlandite-serpentine system
Abstract
This chapter investigates the effect of carboxymethyl cellulose (CMC), pH, magnesium
ions, copper activation and presence of serpentine particles on hydrophobicity of
pentlandite as measured by captive bubble contact angle. The results are compared to
floatability determined by recovery in a Partridge/Smith cell through a 25-1 fractional
factorial experimental design. The pH was the most important factor, acidic pH favoring
both hydrophobicity and floatability. Copper activation enhanced both properties as well;
magnesium ions reduced hydrophobicity at alkaline pH, but it did not show a clear effect
on floatability; serpentine was detrimental over the range of pH tested; and CMC was

Chapter 7 110
capable of partially restoring both hydrophobicity and floatability in the presence of
serpentine.
7.1. Introduction
Among the suspected mechanisms that cause serpentine minerals to reduce selective
flotation of pentlandite is slime coating (Edwards et al., 1980). Slime coating can affect
performance through lowered grade by contamination of concentrate when ‘lightly’
coated pentlandite particles are floated, and through reduced recovery of ‘heavily’ coated
pentlandite.
The formation of slime coating is attributed to electrostatic attraction between the
positively charged serpentine and the negatively charged pentlandite at the typical
flotation pH (i.e., ca. pH 10) (Bremmell et al., 2005; Edwards et al., 1980). The presence
of MgO-minerals can release Mg ions which at alkaline pH form Mg(OH)2 precipitates
that can also produce slime coatings. Dispersants such as carboxymethyl cellulose (CMC)
are used to combat slime coating (Wellham et al., 1992).
The purpose of this study is to determine the effect of solution species, xanthate collector,
carboxymethyl cellulose dispersant and Mg ions, and the presence of serpentine particles
on the hydrophobicity and floatability of pentlandite. Copper ions as pentlandite activator
are considered as well. To accomplish the aim, contact angle (hydrophobicity) and small-
scale flotation (floatability) experiments were performed.

Contact angle measurements and flotation study in the pentlandite-serpentine system 111
7.2. Experimental techniques
7.2.1. Minerals
Contact angle experiments
Pentlandite crystals were obtained from Vale’s Voisey’s Bay operation. These were
analyzed by ICP-OES (inductively coupled plasma-optical emission spectroscopy) to
determine the elemental composition (Table 7.1).
Flotation experiments
Pentlandite was isolated from concentrate obtained in the Vale mini-plant processing
ultramafic ore from Thompson, Manitoba. The concentrate was sieved and the fine
material (-75 μm) discarded. The sample was further upgraded by gravity and magnetic
separation. The -106/+75 μm fraction was cleaned with acetone to remove flotation
reagents and kept in a freezer to limit surface oxidation. Particle size analysis (LS100
Coulter) showed a P80 ca. 120 μm. The elemental analysis is in Table 7.1.
Serpentine was isolated from the same ore by gravity and magnetic separation. The final
product was examined by XRD, showing clinochrysotile as the main phase with minor
pyrrhotite. Particle size distribution showed that the P80 is ca. 25 μm.
Table 7.1 – Elemental composition of pentlandite samples for contact angle and small-scale flotation tests. Theoretical composition of is also shown
Element, %
Pentlandite sample Fe Ni Co Pb Zn Cu Insoluble Theoretical composition 39.04 41.03 --- --- --- --- --- Used in contact angle 31.81 37.45 0.22 0.00 0.18 0.06 7.33 Used in small-scale flotation 40.35 30.99 0.88 0.00 0.15 0.04 8.56
Note: theoretical is based on (Ni,Fe)9S8

Chapter 7 112
7.2.2. Reagents
The reagents, supplier and purity are listed below:
Sodium carboxymethyl cellulose (Sigma) with a molecular weight of 700 000
g/mol and a degree of substitution of 0.65-0.85 (i.e., the amount of hydroxyl
groups substituted by carboxymethyl groups for each monomer of
glucopyranose). Carboxymethyl cellulose was added from a stock solution with a
concentration of 5000 mg/L agitated overnight to ensure its complete dissolution.
Potassium amyl xanthate (Química Michoacana) industrial grade, purified by
dissolution-recrystallization, according to the procedure described by Rao (1971).
Sodium nitrate (Sigma-Aldrich) 99.9 % purity, as background electrolyte.
Copper sulphate (Jalmek) >98 % purity, as pentlandite activator.
Magnesium nitrate (Fermont) >98 % purity, as source of Mg ions.
NaOH and HCl (Fisher) as pH modifiers.
7.2.3. Contact angle measurement
The crystals of pentlandite mounted in metallographic epoxy were polished and kept in
an oxygen-free environment. After conditioning, the sample was transferred to the
experimental set-up (Figure 3.6). A bubble of about 1 mm in diameter produced by a
digital syringe was placed in contact with the sample. A picture was then taken and
processed with an image analyzer to determine the advancing contact angle. Experiments
were done in duplicate, with three to five bubbles tested each time. The error bar on the
Figures represents the 95% confidence interval. Table 7.2 presents the conditioning
strategy.

Contact angle measurements and flotation study in the pentlandite-serpentine system 113
Table 7.2 – Conditioning of pentlandite for contact angle measurements
Stage I[1] Stage II
Exp. Cu2+,
50 mg/L
pH t, min
PAX, 10-4
mol/L
Mg2+, 50
mg/L
Serpentine, 1 g/L[1]
CMC, 50
mg/L pH t,
min
1 No 4, 7, 10 15 Yes No No No 4, 7, 10 5 2 Yes 10 30 Yes No No No 10 5 3 Yes 5.4[3] 30 Yes No No No 4, 7, 10 5 4 Yes 5.4 30 Yes Yes No No 4, 7, 10 5 5 Yes 5.4 30 Yes No Yes No 4, 7, 10 5 6 Yes 5.4 30 Yes No No Yes 4, 7, 10 5 7 Yes 5.4 30 Yes No Yes Yes 4, 7, 10 5
[1] The background electrolyte in conditioning solutions of both stage I and II was NaNO3 0.001 mol/L. [2] To remove the serpentine settled on pentlandite and not attached, sample was washed and transferred to a solution of NaNO3 10-3 mol/L at the pH of the experiment prior to image being taken. [3] Natural pH (ca. pH 5.4).
7.2.4. Flotation experiments
The tests were carried out in a flotation cell based on the design of Partridge and Smith
(1971) (Figure 3.7). One-gram samples of pentlandite (-106/+75 μm) were used for the
tests. Using this relatively coarse size restricts recovery by hydraulic entrainment,
estimated experimentally at <10 %. Flotation was for 5 minutes with nitrogen at 23
mL/min, equivalent to a superficial velocity of 0.072 cm/s. The conditioning prior to
flotation was comparable to that used for the contact angle measurements.
Concentrate and tails were filtered and dried at 50 °C and weighed to determine recovery
(the dependent variable or “response”) as a function of the pH, serpentine concentration,
CMC dosage, Mg2+ and Cu2+ concentration (the independent variables or “factors”). A
previous experiment showed that a mass fraction of 5 % serpentine was enough to
completely depress pentlandite under the current experimental conditions. In order to
detect an effect of the other factors, therefore, the high level of serpentine content was set
at 1 %.
Chapter 7 114
A 25-1 experimental design with three centre-point repeats was used. This is a resolution
V design in which no main effects or two-factor interactions are aliased with any other
main effect or two-factor interaction. The levels of the design are displayed in Table 7.3.
Table 7.3 – Levels of the factors considered in the experimental design
Level Factors Low High MiddlepH 4 10 7 Serpentine (%) 0 1 0.5 CMC (mg/L) 0 50 25 Mg (mg/L) 0 50 25 Cu (mg/L) 0 50 25
7.3. Results
7.3.1. Contact angle measurements
Effect of xanthate
Figure 7.1 shows the contact angle obtained in the presence of xanthate collector (PAX)
as a function of pH. It is observed that the contact angle decreases as the pH increases; at
pH 10 the pentlandite showed no interaction with the bubble. Contact angle in absence of
collector is also shown. It is observed that pentlandite alone was hydrophilic at neutral
and alkaline conditions and at pH < 4 became slightly hydrophobic with a contact angle
ca. 25 °.

Contact angle measurements and flotation study in the pentlandite-serpentine system 115
Cu-activation
It was initially surprising that pentlandite did not exhibit hydrophobic properties with
xanthate at alkaline pH, since the typical pH in operations is 9 or higher (Dai et al.,
2009). Xanthate concentration was increased two-fold and the pentlandite remained
hydrophilic at alkaline pH. This behaviour has been reported elsewhere (Malysiak et al.,
2004). Copper ions have been shown to activate various sulphides including pentlandite
(Kelebek et al., 2005; Malysiak et al., 2004).
Accordingly, the specimen was conditioned in the presence of Cu2+ (from CuSO4) for 30
minutes at natural pH (ca. pH 5), then conditioned with PAX (10-4 mol/L) as a function of
pH for 5 minutes. Figure 7.2 shows that the hydrophobicity of pentlandite is increased for
all tested pH and Cu-activation was more effective as the pH increased. Copper-activated
pentlandite was used for most subsequent studies into the effect of the other variables on
hydrophobicity.
0
10
20
30
40
50
60
2 4 6 8 10 12
pH
Con
tact
ang
le, °
0
10
20
30
40
50
60
pH
PAXNo PAX
0
10
20
30
40
50
60
2 4 6 8 10 12
pH
Con
tact
ang
le, °
0
10
20
30
40
50
60
pH
PAXNo PAX
Figure 7.1 – Contact angle of pentlandite as a function of pH; PAX = 10-4 mol/L (filled diamonds) and
no PAX (open squares), NaNO3 = 10-3 mol/L. Error bars indicate 95 % confidence interval

Chapter 7 116
0
10
20
30
40
50
60
2 4 6 8 10 12
pH
Con
tact
ang
le, °
Cu2+ and PAX
0
10
20
30
40
50
60
2 4 6 8 10 12
PAX
Cu
0
10
20
30
40
50
60
2 4 6 8 10 12
pH
Con
tact
ang
le, °
Cu2+ and PAX
0
10
20
30
40
50
60
2 4 6 8 10 12
PAX
Cu
Figure 7.2 – Contact angle of Cu-activated pentlandite as a function of pH (open squares). PAX = 10-4
mol/L, NaNO3 = 10-3 mol/L. For comparison the result for non-activated pentlandite is included (filled diamonds)
Effect of magnesium ions
The effect of magnesium ions on the hydrophobicity of Cu-activated pentlandite was a
visible reduction of contact angle at pH 10 but no effect at pH 4 and 7 (Figure 7.3).
Figure 7.4 shows that when soda ash is used to reach pH 10, the effect of magnesium is
less.
Effect of serpentine
The presence of serpentine particles had a notable impact on the hydrophobicity of the
(Cu-activated) pentlandite as reflected by the large reduction of contact angle at all tested
pH (Figure 7.6). The greatest effect was at pH 10 when the contact angle decreased to
zero. These findings are in accord with the zeta potential measurements on pentlandite
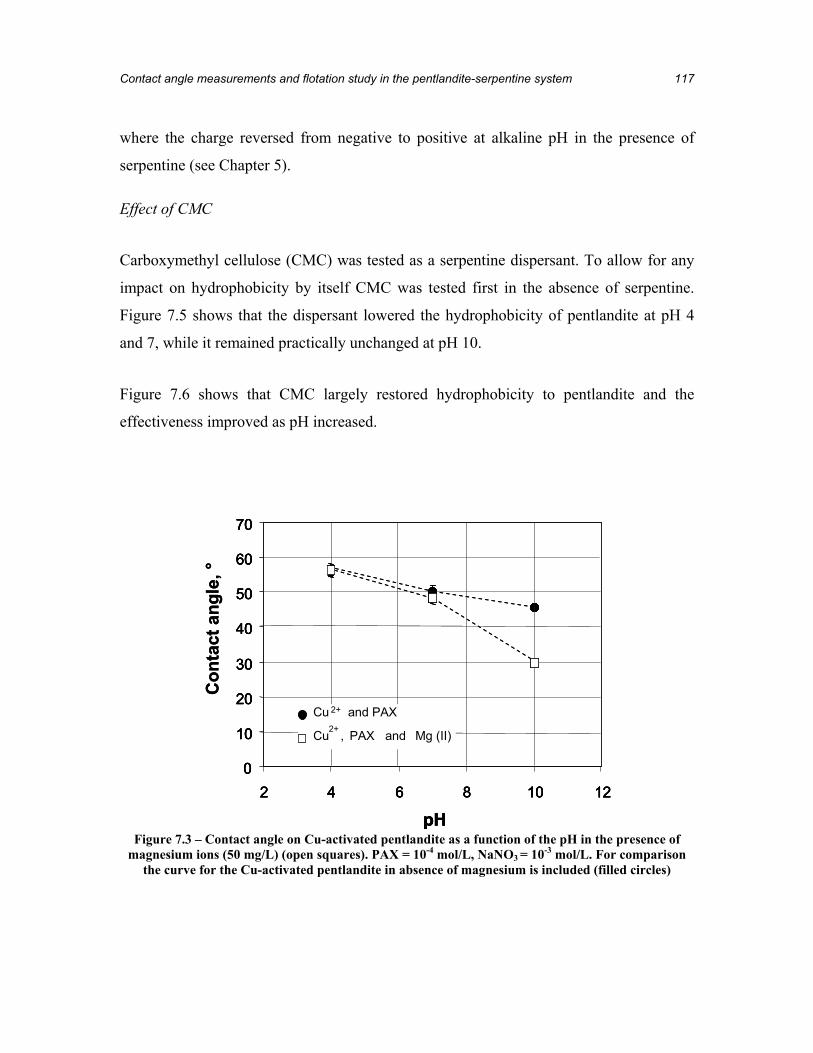
Contact angle measurements and flotation study in the pentlandite-serpentine system 117
where the charge reversed from negative to positive at alkaline pH in the presence of
serpentine (see Chapter 5).
Effect of CMC
Carboxymethyl cellulose (CMC) was tested as a serpentine dispersant. To allow for any
impact on hydrophobicity by itself CMC was tested first in the absence of serpentine.
Figure 7.5 shows that the dispersant lowered the hydrophobicity of pentlandite at pH 4
and 7, while it remained practically unchanged at pH 10.
Figure 7.6 shows that CMC largely restored hydrophobicity to pentlandite and the
effectiveness improved as pH increased.
0
10
20
30
40
50
60
70
2 4 6 8 10 12
pH
Con
tact
ang
le, °
0
10
20
30
40
50
60
70
2 4 6 8 10 12
pH
Cu2+ , PAX and Mg (II)
Cu and PAX2+
0
10
20
30
40
50
60
70
2 4 6 8 10 12
pH
Con
tact
ang
le, °
0
10
20
30
40
50
60
70
2 4 6 8 10 12
pH
Cu2+ , PAX and Mg (II)
Cu and PAX2+
Figure 7.3 – Contact angle on Cu-activated pentlandite as a function of the pH in the presence of
magnesium ions (50 mg/L) (open squares). PAX = 10-4 mol/L, NaNO3 = 10-3 mol/L. For comparison the curve for the Cu-activated pentlandite in absence of magnesium is included (filled circles)

Chapter 7 118
0
10
20
30
40
50
60
70
2 4 6 8 10 12
pH
Con
tact
ang
le, °
Cu2+, PAX and Mg2+
Na2CO3 as pH modifier
Cu2+ and PAX
0
10
20
30
40
50
60
70
2 4 6 8 10 12
pH
Con
tact
ang
le, °
Cu2+, PAX and Mg2+
Na2CO3 as pH modifier
Cu2+ and PAX
Figure 7.4 – Contact angle on Cu-activated pentlandite as a function of the pH in the presence of magnesium (50 mg/L) (filled circles) when Na2CO3 pH is used as pH modifier. PAX = 10-4 mol/L,
NaNO3 = 10-3 mol/L. For comparison the curves for the Cu-activated pentlandite in the presence of PAX (filled diamonds), and in the presence of PAX and magnesium (50 mg/L) (open squares) when
NaOH is used as pH modifier are included
0
20
30
40
50
60
2 4 6 8 10 12
pH
Con
tact
ang
le, °
0
20
30
40
50
60
2 4 6 8 10 12
10Cu2+ and PAX
10 Cu2+, PAX and CMC
0
20
30
40
50
60
2 4 6 8 10 12
pH
Con
tact
ang
le, °
0
20
30
40
50
60
2 4 6 8 10 12
10Cu2+ and PAX
10 Cu2+, PAX and CMC
Figure 7.5 – Contact angle on Cu-activated pentlandite as a function of the pH in the presence of CMC (50 mg/L) (open squares). PAX = 10-4 mol/L, NaNO3 = 10-3 mol/L. For comparison the curve
for the Cu-activated pentlandite is included (filled diamonds)

Contact angle measurements and flotation study in the pentlandite-serpentine system 119
0
10
20
30
40
50
60
2 4 6 8 10 12
pH
10
20
30
40
50
60
2 4 6 8 10 12
Cu2+, PAX and CMC
Cu2+, PAX, and serpentineCu2+, PAX, serpentine and CMC
Con
tact
ang
le, °
0
10
20
30
40
50
60
2 4 6 8 10 12
pH
10
20
30
40
50
60
2 4 6 8 10 12
Cu2+, PAX and CMC
Cu2+, PAX, and serpentineCu2+, PAX, serpentine and CMC
Con
tact
ang
le, °
Figure 7.6 – Contact angle on Cu-activated pentlandite as a function of the pH in the presence of
serpentine (0.1 g/L) and CMC (50 mg/L) (open triangles). PAX = 10-4 mol/L, NaNO3 = 10-3 mol/L. For comparison, curves for Cu-activated pentlandite with PAX and CMC (open squares), and with PAX
and serpentine (filled squares) are included
7.3.2. Flotation tests
The flotation experiments tested the impact of the variables under conditions closer to
practice. Table 7.4 summarizes the recovery of pentlandite for the experimental design.
The random order in which the tests were performed is also shown.
The effect of a factor is defined as the change in response produced by a change in the
level of the factor. This is normally called “main effect”. An interaction between two
factors occurs when the difference in response between the levels of one factor is
different at all levels from the other factor. The effect of a factor or interaction is given by
the coefficient of the regression model in coded units. The coefficients of the first
polynomial regression model are shown in Table 7.5. The most significant factor is pH

Chapter 7 120
(low pH favored recovery) followed by activation with copper (more pentlandite floated)
and serpentine content (an adverse effect on flotation). Serpentine-CMC was the most
significant interaction: CMC improved flotation when serpentine was present, and had an
adverse effect when it was not. The pH-Mg2+ and pH-CMC interactions were not
significant.
An F-test was used to verify the significance of individual coefficients; P < 0.05 suggests
the effect or interaction is significant at greater than 95 % confidence level. High
factor/interaction coefficients also indicate significance. These two significance criteria
were used to choose the factors and interactions considered for the next regression. The
correlation coefficient (R2) is indication of the model fit. Both R2 and adjusted R2 were
acceptable in the first regression.
Table 7.6 presents the final regression, the P values and the coefficients of correlation.
Equations 1 and 2 show the polynomial regression in coded and uncoded units,
respectively. The goodness-of-fit parameters R2 (0.98) and adjusted R2 (0.96) attest to the
appropriateness of the final model. Figure 7.7 shows a comparison of predicted and
actual pentlandite recoveries. A plot of studentized residuals (calculated by dividing
residuals by the estimated standard deviation) as a function of the predicted values is
shown in Figure 7.8. A random (even) distribution of the residuals about zero is evident;
if they were not evenly distributed, it would suggest there is a missing factor or
interaction in the model. Studentized residuals are preferred over simple residuals,
because they can be compared (Montgomery, 2005).

Contact angle measurements and flotation study in the pentlandite-serpentine system 121
Table 7.4 – Recovery of pentlandite according to experimental design
Run Random order
Pentlandite recovery, %
1 1 96.3 2 9 91.6 3 5 64.0 4 13 64.3 5 18 25.1 6 11 19.9 7 7 88.9 8 15 61.1 9 17 7.2
10 10 62.5 11 6 65.7 12 14 8.6 13 19 26.3 14 12 12.3 15 8 44.6 16 16 39.3 17 2 42.3 18 3 43.7 19 4 48.5
Table 7.5 – Coefficient of the first regression model
Factor or interaction Coefficient P (two-tail) Considered for next regression
Mean 47.987 0.0000 --- pH -15.298 0.0008 Yes Serpentine -8.925 0.0038 Yes CMC 5.955 0.0121 Yes Mg -3.661 0.0439 Yes Cu 9.306 0.0034 Yes pH-serpentine 6.233 0.0106 Yes pH-CMC 0.293 0.8060 No pH-Mg 1.019 0.4194 No pH-Cu 5.856 0.0127 Yes Serpentine-CMC 12.825 0.0013 Yes Serpentine-Mg -2.884 0.0775 No Serpentine-Cu -5.386 0.0159 Yes CMC-Mg -7.579 0.0061 Yes CMC-Cu 0.694 0.5701 No Mg-Cu -7.740 0.0058 Yes R2 0.9958 Adjusted R2 0.9747

Chapter 7 122
Table 7.6 – Coefficients of the final regression model
Factor or interaction Coefficient P (two-tailed) Mean 47.987 0.0000 pH -15.298 0.0000 Serpentine -8.925 0.0004 CMC 5.955 0.0036 Mg -3.661 0.0336 Cu 9.306 0.0003 pH-serpentine 6.233 0.0028 pH-Cu 5.856 0.0039 Serpentine-CMC 12.825 0.0000 Serpentine-Cu -5.386 0.0061 CMC-Mg -7.579 0.0009 Mg-Cu -7.740 0.0008 R2 0.9841 Adjusted R2 0.9590
5443523251
2154321
7.76.74.58.128.52.63.97.39.59.83.157.47xxxxxxxxxx
xxxxxxxy−−−++
+++−+−−= 7.1
5443523251
2154321
01.001.043.002.101.016.435.047.003.081.6113.933.101
xxxxxxxxxxxxxxxxxy
−−−+++++++−−=
7.2

Contact angle measurements and flotation study in the pentlandite-serpentine system 123
0
20
40
60
80
100
0 20 40 60 80 100
Actual recovery, %
Pred
icte
d re
cove
ry, %
0
20
40
60
80
100
0 20 40 60 80 100
Actual recovery, %
Pred
icte
d re
cove
ry, %
0
20
40
60
80
100
0 20 40 60 80 100
Actual recovery, %
Pred
icte
d re
cove
ry, %
Figure 7.7 – Comparison of modeled versus actual recoveries
-2.5
-2
-1.5
-1
-0.5
0
0.5
1
1.5
2
2.5
0 20 40 60 80 100 120Predicted recovery, %
Stud
entiz
edre
sidu
al
-2.5
-2
-1.5
-1
-0.5
0
0.5
1
1.5
2
2.5
0 20 40 60 80 100 120Predicted recovery, %
Stud
entiz
edre
sidu
al
Figure 7.8 – Studentized residuals as a function of the predicted recovery
Chapter 7 124
The Pareto chart of the coefficients in the final regression is displayed in Figure 7.9. Bars
give the absolute value of these coefficients in descending order of significance and the
curve shows the cumulative fit. This Figure reveals that pH, activation with copper and
serpentine content remain the most important factors. Serpentine-CMC continues to be
the main interaction. Magnesium content has the least effect (but is negative).
The contour plots of recovery as a function of serpentine and CMC and as a function of
pH and serpentine are shown in Figures 7.10 and 7.11, respectively. The other factors
were set constant at their centre point. This type of plot is useful to represent a three-
dimensional surface in a two-dimensional format. The contours display constant values of
the response. As seen in Figure 7.10, recovery of pentlandite decreases rapidly as the
content of serpentine increases. Carboxymethyl cellulose at 50 mg/L restores the
floatability of pentlandite completely when serpentine content is high. However, CMC
seems to decrease recovery slightly in the absence of serpentine. Similar observations
were also evident in the contact angle data.
Figure 7.11 shows that flotation is strongly impacted by pH, recovery being higher as pH
decreases. Recovery remains moderately high in the presence of serpentine at acidic pH.
Pentlandite depression is more severe when the serpentine and pH are at the highest
levels.

Contact angle measurements and flotation study in the pentlandite-serpentine system 125
pHSerpentine-CMC
Cu2+
0
Mg2+- Cu2+
Serpentine
pH-SerpentineCMC
CMC - Mg2+
pH - Cu2+
Serpentine - Cu2+
Mg2+
0 20 40 60 80 1000 20 40 60 80 100%
4 8 12 2016
Coefficient (absolute value)
Fact
or o
r int
erac
tion
pHSerpentine-CMC
Cu2+
0
Mg2+- Cu2+
Serpentine
pH-SerpentineCMC
CMC - Mg2+
pH - Cu2+
Serpentine - Cu2+
Mg2+
0 20 40 60 80 1000 20 40 60 80 100%
4 8 12 2016
Coefficient (absolute value)
Fact
or o
r int
erac
tion
Figure 7.9 – Pareto chart of regression coefficients
0.0
0.1
0.2
0.3
0.4
0.6
0.7
0.8
0.9
1.0
6
11
17
22
28
33
39
44
50
CM
C, m
g/L
0.0
0.1
0.2
0.3
0.4
0.6
0.7
0.8
0.9
1.0
6
11
17
22
28
33
39
44
50
56 -64
56 -64
48 -56
40 -48
32 -40
16 -24
0.0
0.1
0.2
0.3
0.4
0.6
0.7
0.8
0.9
1.0
6
11
17
22
28
33
39
44
50
0.0
0.1
0.2
0.3
0.4
0.6
0.7
0.8
0.9
1.0 0
6
11
17
22
28
33
39
44
50
Serpentine, %
56 -64
56 -64
48 -56
40 -48
32 -40
24 -32
16 -24
Recovery, %
0.0
0.1
0.2
0.3
0.4
0.6
0.7
0.8
0.9
1.0
6
11
17
22
28
33
39
44
50
CM
C, m
g/L
0.0
0.1
0.2
0.3
0.4
0.6
0.7
0.8
0.9
1.0
6
11
17
22
28
33
39
44
50
56 -64
56 -64
48 -56
40 -48
32 -40
16 -24
0.0
0.1
0.2
0.3
0.4
0.6
0.7
0.8
0.9
1.0
6
11
17
22
28
33
39
44
50
0.0
0.1
0.2
0.3
0.4
0.6
0.7
0.8
0.9
1.0 0
6
11
17
22
28
33
39
44
50
Serpentine, %
56 -64
56 -64
48 -56
40 -48
32 -40
24 -32
16 -24
Recovery, %
Figure 7.10 – Contour plot of pentlandite recovery as a function of serpentine content and CMC
concentration. pH, magnesium and copper concentrations were fixed at their centre level

Chapter 7 126
4.0
4.7
5.3
6.0
6.7
7.3
8.0
8.7
9.3
10.0
0.0
0.1
0.2
0.3
0.4
0.6
0.7
0.8
0.9
1.0
pH
72-80
72-80
56-64
48-56
40-48
32-40
Serp
entin
e, %
24-32Recovery, %
4.0
4.7
5.3
6.0
6.7
7.3
8.0
8.7
9.3
10.0
0.0
0.1
0.2
0.3
0.4
0.6
0.7
0.8
0.9
1.0
pH
72-80
72-80
56-64
48-56
40-48
32-40
Serp
entin
e, %
24-32Recovery, %
Figure 7.11 – Contour plot of pentlandite recovery as a function of pH and serpentine content. CMC,
magnesium and copper concentrations were fixed at their centre level
7.4. Discussion
The hydrophobicity developed by the pentlandite in the absence of xanthate at acidic pH
has been documented for pentlandite and other sulphide minerals and is known as self-
induced or collectorless flotation (Ralston et al., 2007; Rao and Leja, 2004; Kelebek and
Yoruk, 2002). The phenomenon is attributed to superficial oxidation releasing some
metal ions to solution and leaving metal deficient or polysulphide species on the surface
which present hydrophobic sites. With sufficient oxidation elemental sulphur may form.
The process is favored at low pH as metal ions readily solubilize while at alkaline pH
some competition with hydrophilic metal hydroxy species occurs. The system
electrochemical potential is another factor. For example, the oxidation of sulphide to

Contact angle measurements and flotation study in the pentlandite-serpentine system 127
elemental sulphur occurs above ca. 0 mV (vs. SHE) and typical open systems such as
those here exhibit potentials around 350 mV (Rao and Leja, 2004).
The hydrophobicity is enhanced by chemisorption of xanthate. Collector uptake on
pentlandite seems less at alkaline pH as revealed by the contact angle and flotation tests.
This observation is supported by the work of Malysiak et al. (2004) who found from zeta
potential measurements and surface analysis that only a small amount of xanthate was
adsorbed at alkaline pH.
The hydrophobicity and flotation response of pentlandite with xanthate at pH 10 was
increased by addition of copper ions. Shackleton et al. (2003) indicated that above pH 9
in the presence of copper ions pentlandite held some hetero-coagulated Cu(OH)2
precipitates which were reduced to their Cu+ equivalent. When xanthate is added the
hydrophobic cuprous-xanthate species forms, which renders the pentlandite hydrophobic.
Depression due to magnesium ions occurs at ca. pH 10 coinciding with hydroxide
precipitation (Figure 7.12). The results demonstrate that depression is not caused by
hindrance of collector uptake due to the precipitation of Mg(OH)2, but rather is
attributable to the hydrophilic character of the hydroxide itself. Lascelles et al. (2002)
observed similar behaviour in the case of Cu-activated sphalerite in the presence of Mg
ions. The effect of magnesium was diminished by using soda ash for pH regulation due to
precipitation and dispersion of magnesium carbonate. Soda ash is frequently used as
dispersant when magnesium ions are present (Sadler and Sim, 1991).
The flotation results were not as clear as the contact angle measurements in showing the
effect of pH-Mg interaction. This difference may be linked to experimental resolution:
the higher surface area available in the flotation system means the magnesium
concentration per unit of surface area is lower and the extent of precipitate coverage is
correspondingly less than in the contact angle case.

Chapter 7 128
0
20
40
60
80
100
6 8 10 12 14
pH
Mas
s fr
actio
n, %
Mg2+ Mg(OH)2
0
20
40
60
80
100
6 8 10 12 14
pH
Mas
s fr
actio
n, %
Mg2+ Mg(OH)2
Figure 7.12 – Species distribution diagram of magnesium in concentration percentage as a function
of pH. Mg species concentration equal to 50 mg/L (modified from Sui and Huang, 1998)
Experiments showed that a small amount of serpentine is enough to depress Cu-activated
pentlandite. The implication is that slime coating is responsible. Similar findings were
reported by Edwards et al. (1980), who observed almost total depression of pentlandite
flotation at chrysotile content of only 0.5 %. At much higher serpentine content the
fibrous nature of these minerals may create physical entrapment of pentlandite, which can
severely limit flotation (Uddin et al., 2010) but is not the focus here.
Carboxymethyl cellulose was effective in restoring pentlandite hydrophobicity as shown
by both contact angle and flotation experiments. It is believed that CMC adsorbs on
serpentine through hydrogen bonding (Shortridge et al., 2000). The contact angle
measurements showed CMC was more effective at alkaline pH but flotation did not
reveal any strong pH-CMC interaction. Again, the difference in pentlandite surface area
between the two test approaches may be the reason.

Contact angle measurements and flotation study in the pentlandite-serpentine system 129
7.5. Conclusions
Contact angle and flotation recovery measurements were performed to determine the
impact of process variables on, respectively, hydrophobicity and floatability of
pentlandite. The main findings are:
pH was the most important factor under the selected experimental conditions,
acidic pH enhancing hydrophobicity and floatability
Hydrophobicity was enhanced when pentlandite was activated with copper. Cu-
activation seems more efficient at alkaline than at acidic pH.
Serpentine depressed hydrophobicity and floatability markedly at all tested pH but
the effect was greatest at pH 10 which correlates with a hetero-coagulation
mechanism (serpentine being positively charged, pentlandite negatively charged
at alkaline pH).
Magnesium ions were detrimental to pentlandite hydrophobicity at pH 10,
suggesting interaction with Mg(OH)2 precipitates. When soda ash was used for
pH adjustment, the negative effect of magnesium on hydrophobicity was reduced.
Floatability did not show significant impact of Mg.
CMC restored hydrophobicity to pentlandite conditioned with serpentine but
floatability did not show a strong CMC/pH interaction effect.
The difference in available surface area between the two tests systems, much
higher in testing floatability than hydrophobicity, is considered to contribute to
differences in the two responses.
Chapter 7 130
References
Bremmell K.E., Fornasiero D., Ralston J. (2005) Pentlandite-lizardite interactions and
implications for their separation by flotation. Colloids and Surfaces A:
Physicochemical and Engineering Aspects 252: 207-212
Dai Z., Bos J.A., Quinn P. Lee A., Xu M. Flowsheet development for Thompson
ultramafic low-grade nickel ores. C.O. Gomez; J.E. Nesset, S.R. Rao (Eds.)
Advances in Mineral Processing Science and Technology. International Symposium
of the Metallurgical Society of CIM, 217-228.2009
Edwards C. R., Kipkie W. B. and Agar G. E. (1980). The effect of slime coatings of the
serpentine minerals, chrysotile and lizardite, on pentlandite flotation. International
Journal of Mineral Processing 7(1): 33-42
Kelebek S., Thompson J.M., Tukel C. (2005) The impact of copper activation on the
scavenging of Ni-Cu sulphide ores, in Proceedings Centenary of Flotation
Symposium, pp 869-873 (AusIMM: Brisbane) 6-9 June 2005
Kelebek S., Yoruk S. (2002) Bubble contact angle variation of sulfide minerals in relation
to their self-induced flotation. Colloids and Surfaces, A: Physicochemical and
Engineering Aspects 196: 111-119
Lascelles D., Finch J.A., Sui C. (2002) Depressant action of Ca and Mg on flotation of
Cu activated sphalerite. Canadian Metallurgical Quarterly 40(2): 133-140
Malysiak V., Shackleton N.J., O’Connor C.T. (2004) An investigation into the
floatability of a pentlandite-pyroxene system. International Journal of Mineral
Processing 74: 251-262

Contact angle measurements and flotation study in the pentlandite-serpentine system 131
Montgomery D.C. Design and Analysis of Experiments, John Wiley & Songs, Phoenix,
Arizona, USA, 2005
Partridge A.C., Smith G.W. (1971) Small-sample flotation testing: a new cell.
Transaction of the Institution of Mining and Metallurgy Section C: Mineral
Processing and Extractive Metallurgy 80: 199-200
Ralston J., Fornasiero D., Grano S., (2007) Pulp and Solution Chemistry. In Froth
Flotation: A Century of Innovation, M. Fuerstenau, G. Jameson R.H. Yoon Eds.
Society for Mining, Metallurgy and Exploration Inc., USA, 227-258
Rao S.R. Leja J. (2004) Surface Chemistry of Froth Flotation, Kluwer Academic
Publishers, New York
Rao S.R. (1971) Xanthates and Related Compounds, Marcel Dekker, Inc., New York
Sadler L.Y., Sim K.G. (1991) Reduction of coal-water mixture consistency with soda ash
and lime. Canadian Journal of Chemical Engineering 69: 1224-1228
Shackleton N. J., Malysiak V., O´Connor C.T. (2003) The use of amine complexes in
managing inadverted activation of pyroxene in pentlandite-pyroxene flotation
system. Minerals Engineering 16: 849-856J
Shortridge P.G., Harris P. J., Bradshaw D.J., Koopal L.K. (2000) The effect of chemical
composition and molecular weight of polysaccharide depressants on the flotation of
talc. International Journal of Mineral Processing , 59: 215-224
Sui C., Wang J. (1998) EQUILCOM A software for chemical thermodynamics analysis,
McGill University

Chapter 7 132
Uddin S. (2010) Acidic fiber disintegration in the grinding of ultramafic ore. Department
of Mining and Materials. McGill University. Work in progress
Wellham E.J., Elber L., Yan D.S. (1992) The role of carboxy methyl cellulose in the
flotation of a nickel sulphide transition ore. Minerals Engineering 5: 381-395

133
8
Conclusions, contributions and future work
8.1. Conclusions
This thesis comprises the results of a surface chemistry study initiated to determine
phenomena restricting selective flotation of pentlandite from ultramafic ore. The work is
divided in two parts. The first compared isoelectric point (obtained by zeta potential
calculated from electrophoretic mobility) and point of zero charge (calculated using the
Mular-Roberts titration technique) of some specimen MgO-minerals belonging to the
electrophoretically anisotropic phyllosilicate mineral class. The main findings are listed
below.

Chapter 8 134
For the serpentine and chlorite, p.z.c. was greater than i.e.p. (pH 4.3 vs. pH 3.3,
and pH 4.6 vs. pH <3, respectively) while the M-R technique did not yield a p.z.c.
for talc.
In the case of chlorite, aggregation occurred over the pH range from i.e.p. to
p.z.c., suggesting both contribute to aggregation, while for serpentine the sample
remained dispersed over the pH range, attributed to hydration effects.
The second part comprised an examination of the effect of selected variables on the two
main components isolated from an ore sample (Thompson, Manitoba): the valuable
mineral pentlandite and the main identified MgO-gangue, serpentine. This part includes
an electrokinetic study (zeta potential), aggregation/dispersion, hydrophobicity (contact
angle) and small-scale flotation.
Zeta potential measurements of pentlandite alone and mixed with serpentine using
different background solutions were carried out in an attempt to synthesize actual
flotation processing conditions. Scanning electron microscopy analysis helped validate
the findings. The main results are:
Zeta potential measurements on pentlandite and serpentine individually in
indifferent electrolyte showed that slime coating is predicted as a consequence of
electrostatic attraction at flotation pH 9-10.
The mixed mineral case revealed significant effect on pentlandite interpreted as
the result of slime coating by serpentine and magnesium hydroxide precipitates at
alkaline pH.
Dispersion was measured by turbidimetry using a UV/visible spectrophotometer. The
variables considered in an experimental design were carboxymethyl cellulose (CMC)
concentration, amyl xanthate concentration and pH. Optical microscopy helped confirm
the findings. The main results are:

Conclusions, contributions and future work 135
CMC and the interaction between pH and CMC were the most important factors
controlling dispersion.
The effect of CMC was non linear and worked to reduce the effect on dispersion
as concentration was increased.
Interaction between CMC and pH indicated that CMC has more influence on
dispersion at high pH.
Hydrophobicity was measured by captive bubble contact angle and floatability by
recovery in a small-scale Partridge/Smith flotation cell. The main results are:
The pH was the most important factor, acidic pH enhancing hydrophobicity.
Copper ions in presence of xanthate enhanced hydrophobicity being particularly
effective at alkaline pH.
Serpentine depressed pentlandite markedly at all tested pH but its effect was
greatest at pH 10.
Magnesium ions were detrimental to pentlandite hydrophobicity at pH 10,
suggesting interaction with Mg(OH)2. When soda ash was used, the negative
effect of magnesium was reduced. Floatability did not show significant response
to Mg/pH interaction.
Carboxy-methyl cellulose (CMC) restored hydrophobicity to pentlandite
conditioned with serpentine. Floatability did not show significant response to
CMC/pH interaction.

Chapter 8 136
8.2. Contribution to knowledge
Comparison of isoelectric point and point of zero charge of some phyllosilicates
relevant to processing ultramafic ores.
Study of mechanisms of depression of pentlandite through determination of the
effect of dissolved metal ions and serpentine fines on pentlandite electrophoretic
mobility under conditions approaching the flotation environment.
Validation of a technique for aggregation/dispersion studies suitable for small
samples.
Determination of effects and interactions of process variables (e.g., collector,
carboxymethyl cellulose dossage, pH) on hydrophobicity (contact angle) and
floatability (flotation recovery) of pentlandite.
8.3. Future work
The effect of aging on zeta potential of serpentine was attributed to the release of
magnesium ions. Although releasing magnesium to a similar extent, neither talc
nor chlorite showed an aging effect. Surface analysis (e.g., XPS) is suggested to
determine differences due to aging.
Testing the effect of dispersants and other flotation reagents on zeta potential
might be revealing.
In the same tenor, investigating the role of magnesium release by serpentine in
mixed mineral tests may help explain the persistent positive charge on pentlandite
at alkaline pH.

Conclusions, contributions and future work 137
Expand the dispersion and flotation studies to include the effect of selected
reagents and other species (e.g., the use of supernatant as background to simulate
actual flotation conditions).
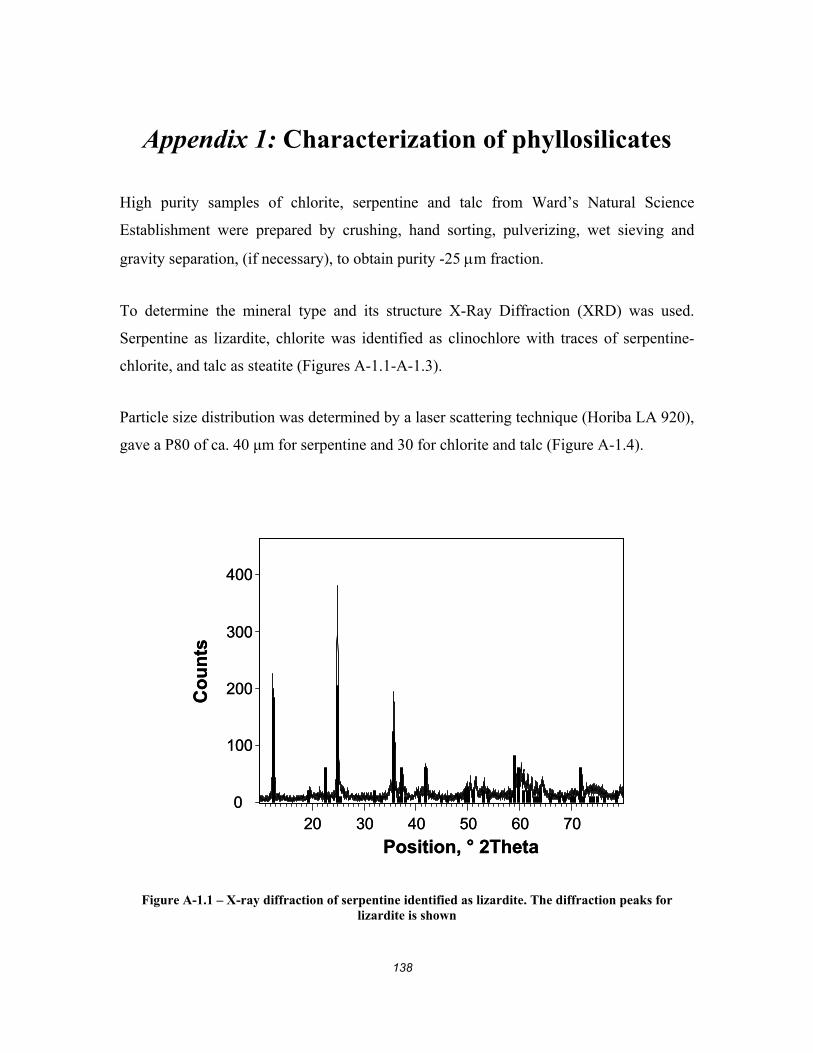
138
Appendix 1: Characterization of phyllosilicates
High purity samples of chlorite, serpentine and talc from Ward’s Natural Science
Establishment were prepared by crushing, hand sorting, pulverizing, wet sieving and
gravity separation, (if necessary), to obtain purity -25 μm fraction.
To determine the mineral type and its structure X-Ray Diffraction (XRD) was used.
Serpentine as lizardite, chlorite was identified as clinochlore with traces of serpentine-
chlorite, and talc as steatite (Figures A-1.1-A-1.3).
Particle size distribution was determined by a laser scattering technique (Horiba LA 920),
gave a P80 of ca. 40 μm for serpentine and 30 for chlorite and talc (Figure A-1.4).
20 30 40 50 60 700
100
200
300
400
Position, ° 2Theta
Cou
nts
20 30 40 50 60 700
100
200
300
400
Position, ° 2Theta
Cou
nts
Figure A-1.1 – X-ray diffraction of serpentine identified as lizardite. The diffraction peaks for lizardite is shown
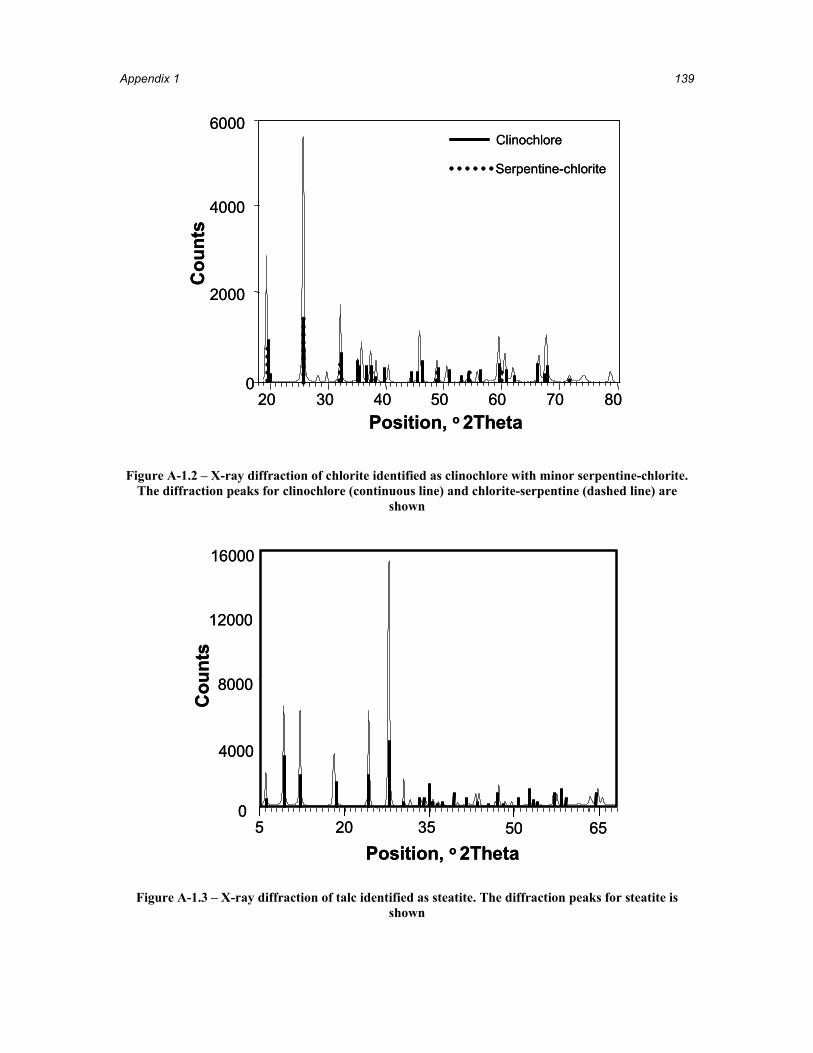
Appendix 1 139
Position, o 2Theta20 30 40 50 60 70 80
4000
0
2000
6000
Cou
nts
Clinochlore
Serpentine-chlorite
Position, o 2Theta20 30 40 50 60 70 80
4000
0
2000
6000
Cou
nts
Clinochlore
Serpentine-chlorite
Figure A-1.2 – X-ray diffraction of chlorite identified as clinochlore with minor serpentine-chlorite. The diffraction peaks for clinochlore (continuous line) and chlorite-serpentine (dashed line) are
shown
0
4000
8000
12000
16000
5 20 35 50 65Position, o 2Theta
Cou
nts
0
4000
8000
12000
16000
5 20 35 50 65Position, o 2Theta
Cou
nts
Figure A-1.3 – X-ray diffraction of talc identified as steatite. The diffraction peaks for steatite is shown

Characterization of phyllosilicates 140
0
20
40
60
80
100
0.1 1 10 100 1000
Particle size, μm
Cum
. vol
ume,
%
Serpentine
Talc
Chlorite
0
20
40
60
80
100
0.1 1 10 100 1000
Particle size, μm
Cum
. vol
ume,
%
Serpentine
Talc
Chlorite
Figure A-1.4 – Particle size distribution for serpentine, chlorite and talc. P80 ca. 40 μm for serpentine and 30 μm for chlorite and talc

141
Appendix 2: Isolation of mineral phases and
characterization of samples
For part of the study pentlandite and serpentine samples were isolated from Thompson
area ultramafic ore.
Pentlandite is the ore’s principal nickel mineralization, distantly followed by violarite, a
mineral associated with weathering and oxidation of pentlandite. More than 90 % of the
nickel in the ore is present in these two phases, the rest being split between minor nickel
sulphides and serpentine. Serpentine is the major MgO-gangue (it contributes more than
80 % of the magnesium present in the ore), followed by olivine and chlorite. The other
important minerals are pyrrhotite and magnetite. Table A-2.1 summarizes the main
mineral phases present in the ore, as identified by Vale. The specific gravity and
magnetic properties information was used to design the mineral isolation procedure.
A-2.1 – Main mineral phases in the Thompson ultramafic ore
Mineral phase Chemical formula Specific
gravity Magnetic properties
Volumetric fraction, %
Pentlendite (Fe,Ni)9S8 4.6-5 No 1.01 Violarite (Ni,Fe)3S4 4.79 No 0.15 Chalcopyrite CuFeS2 4.1-4.3 No 0.06 Pyrite FeS2 4.9 No 0.46 Magnetite Fe3O4 5.2 Strong 6.34 Pyrrhotite[1] Fe1-xS 4.6-4.7 Moderate 5.07 Olivine (Mg,Fe)2SiO4 3.3-4.3 No 11.99 Chlorites (Mg,Fe2+)5(Al,Fe3+)2Si3O10(OH)8 2.6-3.3 No 3.45 Mica (biotite) K(Fe,Mg)3AlSi3O10(OH)2 2.8-3.2 No 0.59 Serpentine Mg3Si5O10(OH)2 2.3 Weak 63.29 Talc Mg3Si4O10(OH)2 2.7-2.8 No 0.08 Dolomite CaMg(CO3)2 2.9 No 3.13
[1] Pyrrhotite predominantly monoclinic
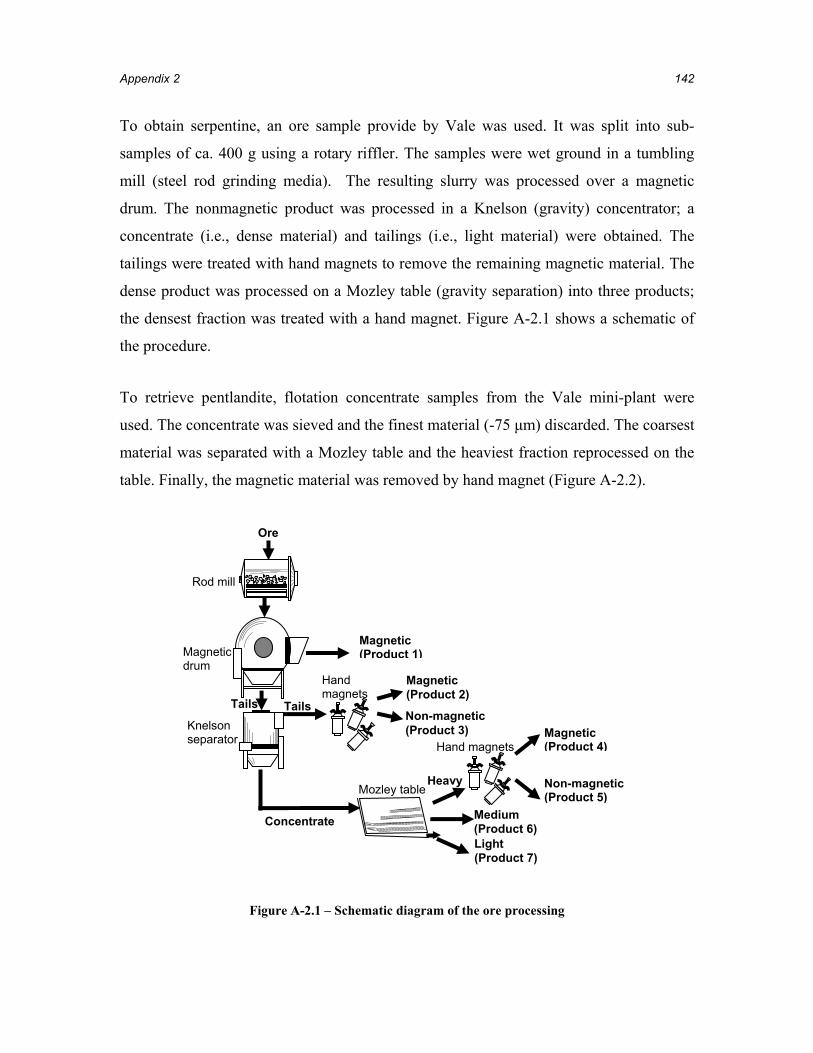
Appendix 2 142
To obtain serpentine, an ore sample provide by Vale was used. It was split into sub-
samples of ca. 400 g using a rotary riffler. The samples were wet ground in a tumbling
mill (steel rod grinding media). The resulting slurry was processed over a magnetic
drum. The nonmagnetic product was processed in a Knelson (gravity) concentrator; a
concentrate (i.e., dense material) and tailings (i.e., light material) were obtained. The
tailings were treated with hand magnets to remove the remaining magnetic material. The
dense product was processed on a Mozley table (gravity separation) into three products;
the densest fraction was treated with a hand magnet. Figure A-2.1 shows a schematic of
the procedure.
To retrieve pentlandite, flotation concentrate samples from the Vale mini-plant were
used. The concentrate was sieved and the finest material (-75 μm) discarded. The coarsest
material was separated with a Mozley table and the heaviest fraction reprocessed on the
table. Finally, the magnetic material was removed by hand magnet (Figure A-2.2).
Figure A-2.1 – Schematic diagram of the ore processing
Ore
Rod mill
Magnetic drum
Knelson separator
Concentrate
Tails Tails
Mozley table
Hand magnets
Light(Product 7)
Heavy
Medium(Product 6)
Non-magnetic (Product 5)
Magnetic (Product 4)
Magnetic(Product 1)
Non-magnetic(Product 3)
Magnetic(Product 2)
Hand magnets

Isolation of mineral phases and characterization of samples 143
Figure A-2.2 – Schematic diagram of the flotation concentrate processing
A-2.1. Product identification
The serpentine and pentlandite samples obtained were characterized by X-ray diffraction
(Figures A-2.3 and A-2.4). Product 3 (see Figure A-2.1) was identified as predominantly
clinochrysotile with other minor MgO-minerals (Figure A-2.4); products 5 and 10 were
mainly pentlandite with some hexagonal pyrrhotite (Figure A-2.3).
Particle size distribution was determined by a laser scattering technique (Coulter LS100),
gave a P80 of ca. 120 μm (Figure A-1.5) and 25 μm (Figure A-2.6), respectively. Figure
A-2.7 shows optical micrographs of these products.
Heavy Heavy
Magnetic(Product 9)
Wet screening
Mozley table
Mozley table
Medium(Product 11)
Light(Product 12)
Nonmagnetic (Product 10)
Heavy(Product 8)
Rougher concentrate

Appendix 2 144
10 20 30 40 50 60 70 80 90 100
Cou
nts
0
500
1000
1500
Position, ° 2Theta10 20 30 40 50 60 70 80 90 100
Pyrrhotite
Pentlandite
10 20 30 40 50 60 70 80 90 100
Cou
nts
0
500
1000
1500
Position, ° 2Theta10 20 30 40 50 60 70 80 90 100
Pyrrhotite
Pentlandite
Figure A-2.3 – X-ray diffraction of pentlandite used for small-scale flotation. The diffraction peaks
for pentlandite (continuous line) and pyrrhotite (dashed line) are shown
Position, ° 2Theta10 20 30 40 50 60 70 80 90 100
Cou
nts
0
50
100
150
10 20 40 50 60 70 80 90 100
0
50
100
150
Pyrrhotite
Serpentine (clinochrysotile)
Position, ° 2Theta10 20 30 40 50 60 70 80 90 100
Cou
nts
0
50
100
150
10 20 40 50 60 70 80 90 100
0
50
100
150
Pyrrhotite
Serpentine (clinochrysotile)
Figure A-2.4 – X-ray diffraction of serpentine used for small-scale flotation. The diffraction peaks for
clinochrysotile (continuous line) and pyrrhotite (dashed line) are shown

Isolation of mineral phases and characterization of samples 145
0
20
40
60
80
100
10 100 1000
Particle diameter, μm
Cum
. Vol
ume,
%
P80 = 120 μm
0
20
40
60
80
100
10 100 1000
Particle diameter, μm
Cum
. Vol
ume,
%
P80 = 120 μm
Figure A-2.5 – Particle size distribution for pentlandite used in the flotation tests. P80 ca. 120 μm
0
20
40
60
80
100
1 10 100Particle size, μm
Cum
. vol
ume,
%
P80 = 25 μm
0
20
40
60
80
100
1 10 100Particle size, μm
Cum
. vol
ume,
%
P80 = 25 μm
Figure A-2.6 – Particle size distribution for serpentine used in the flotation and contact angle tests.
P80 ca. 25 μm

Appendix 2 146
Figure A-2.7 – Optical micrographs of serpentine (left) and pentlandite (right)
A-2.2. Pentlandite for contact angle measurements
For the contact angle experiments, pentlandite crystals were obtained from Vale’s
Voisey’s Bay operation. Figure A-2.8 shows the X-ray diffraction pattern of the sample.
No other mineral phases other than pentlandite were indentified.
0
500
1000
1500
Cou
nts
0
500
1000
1500
10 20 30 40 50 60 70 80 90 100
Position, ° 2Theta
10 20 30 40 50 60 70 80 90 1000
500
1000
1500
Cou
nts
0
500
1000
1500
10 20 30 40 50 60 70 80 90 100
Position, ° 2Theta
10 20 30 40 50 60 70 80 90 100
Figure A-2.8 – X-ray diffraction pattern of Voisey’s Bay pentlandite used for contact angle
measurements compared to the standard diffraction pattern for pentlandite (thick lines)

147
Appendix 3: Supernatant analysis
Supernatant was prepared using a mass fraction of 10 % solids of Thompson ultramafic
ore (40 g of ore + 360 g of water) agitated using a magnetic stirrer. To determine the
preparation time, samples of supernatant were taken at 1, 15, 24 and 48 hours and
magnesium concentration was determined (Figure A-3.1). Equilibrium was reached after
about 15 hours. The preparation time was then set to 24 hours.
Metals in the supernatant were analyzed by atomic absorption spectrometry in at least
two different batches of supernatant (Table A-3.1). Sulphates were analyzed by
precipitation with barium and turbidity measurements (Table A-3.2). Chlorides were
analyzed by using the argentometric titration method (Table A-3.3).
0
20
40
60
80
100
0 10 20 30 40 50
Time, h
Mag
nesi
um, m
g/L
0
20
40
60
80
100
0 10 20 30 40 50
Time, h
Mag
nesi
um, m
g/L
Figure A-3.1 – Magnesium in solution as a function of time in supernatant

Appendix 3 148
Table A-3.1 – Metals in solution in supernatant
Element Supernatant concentration, mg/L
1 2 3 Average 95 % CI K 10.2 11.17 Missing 10.69 ±0.97
Mg 88.3 81.86 95.34 88.5 ±7.79 Na 8.09 4.76 4.94 5.93 ±2.16 Cu -- -- -- --- Fe -- -- -- --- Ni -- -- -- --- Zn -- -- -- --- Ca 33.76 41.31 Missing 37.535 ±7.55 Si -- -- -- --- Al -- -- -- ---
Table A-3.2 – Sulphate concentration in supernatant calculated by turbidimetry
Supernatant SO42-, mg/L Average 95 % CI
1 12.72 13.89 ±3.21
2 11.00 3 16.92
Table A-3.3 – Chloride concentration in supernatant calculated by argentometric titration
Supernatant Cl-, mg/L Average 95 % CI
1 343.87 332.48 ±33.28 2 353.87
3 299.70

149
Appendix 4: Analysis of sulphate and chloride
A-4.1. Analysis of sulphate: turbidimetric method
Apparatus
(a) Spectrophotometer at 420 nm, providing a light path of 4-5 cm
(b) Magnetic stirrer (important to keep the speed of stirring constant for each batch of
samples and standards; adjust to the maximum at which no splash occurs)
(c) Stopwatch
Reagents
(a) Conditioning reagent: Mix 50 mL glycerol (Anachemia) with a solution
containing 30 mL conc HCl, 300 mL distilled water, 100 mL 95 % ethyl or
isopropyl alcohol, and 75 g of NaCl.
(b) Barium chloride, BaCl2 (Anachemia), crystals sized for turbidimetric work. To
ensure uniformity of results, construct a standard curve for each batch of BaCl2
crystals.
(c) Standard sulphate solution. Dissolve 147.9 mg anhydrous Na2SO4 (Fisher
Scientific) in distilled water and dilute to 1000 mL.
Procedure
Measure 100 mL of sample or a suitable portion made up to 100 mL into a 250
mL Erlenmeyer flask. Add 5 mL conditioning reagent and mix in stirring
apparatus. While stirring, add a spoonful of BaCl2 crystals (about 1 g) and begin
timing immediately. Stir for 1 min at constant speed.
Immediately after the stirring period has ended, pour solution into adsorption cell
of photometer and measure turbidity at 30-s interval for 4 minutes. Consider
turbidity to be the maximum reading obtained in the 4 minutes interval.

Appendix 4 150
Prepare calibration curve (Figure A-4.1). Estimate sulphate concentration by
comparing turbidity with a calibration curve. Set photometer to zero using
distilled water treated for sulphate analysis. Space standards at 5 mg/L in 5 mg/L
increments over the 0 – 40 mg/L sulphate range.
0
0.05
0.1
0.15
0.2
0.25
0.3
0.35
0 10 20 30 40
SO42-, mg/L
A
y = 1.2×10-4 x2 + 3.4×10⁻⁴ xR2 = 0.99825
0
0.05
0.1
0.15
0.2
0.25
0.3
0.35
0 10 20 30 40
SO42-, mg/L
A
y = 1.2×10-4 x2 + 3.4×10⁻⁴ xR2 = 0.99825
Figure A-4.1 – Calibration curve for determining sulphate concentration
A-4.2. Analysis of chloride: argentometric titration
Apparatus
Erlenmeyer flask
Buret
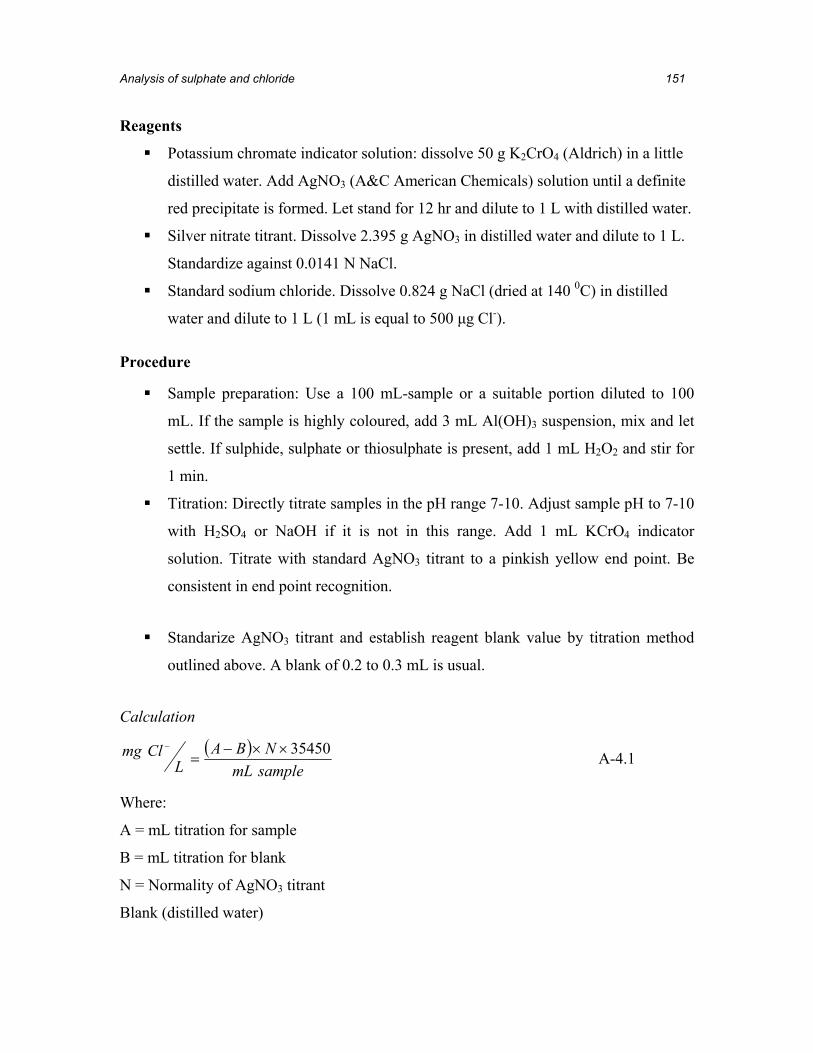
Analysis of sulphate and chloride 151
Reagents
Potassium chromate indicator solution: dissolve 50 g K2CrO4 (Aldrich) in a little
distilled water. Add AgNO3 (A&C American Chemicals) solution until a definite
red precipitate is formed. Let stand for 12 hr and dilute to 1 L with distilled water.
Silver nitrate titrant. Dissolve 2.395 g AgNO3 in distilled water and dilute to 1 L.
Standardize against 0.0141 N NaCl.
Standard sodium chloride. Dissolve 0.824 g NaCl (dried at 140 0C) in distilled
water and dilute to 1 L (1 mL is equal to 500 μg Cl-).
Procedure
Sample preparation: Use a 100 mL-sample or a suitable portion diluted to 100
mL. If the sample is highly coloured, add 3 mL Al(OH)3 suspension, mix and let
settle. If sulphide, sulphate or thiosulphate is present, add 1 mL H2O2 and stir for
1 min.
Titration: Directly titrate samples in the pH range 7-10. Adjust sample pH to 7-10
with H2SO4 or NaOH if it is not in this range. Add 1 mL KCrO4 indicator
solution. Titrate with standard AgNO3 titrant to a pinkish yellow end point. Be
consistent in end point recognition.
Standarize AgNO3 titrant and establish reagent blank value by titration method
outlined above. A blank of 0.2 to 0.3 mL is usual.
Calculation
( )samplemLNBA
LClmg 35450××−
=−
A-4.1
Where:
A = mL titration for sample
B = mL titration for blank
N = Normality of AgNO3 titrant
Blank (distilled water)
Appendix 4 152
Reference
Standard Methods for the Examination of Water and Wastewater (1981). American
Public Health Association, American Water Works Association, Water Pollution
Control Federation. A.E. Greenberg, J.J. Connors, D. Jenkins, M.A.H. Franson
(Eds.) Washington, D.C., USA

153
Appendix 5: Contact angle measurement
Contact angle developed in the aqueous solution/mineral/air interface was calculated by
the image analysis of photographic images using basic trigonometric functions.
Figure A-5.1 – A bubble on a hydrophobic surface
Figure A-5.1 shows a typical image. To calculate the contact angle, θ, a circle is drawn
around the bubble to intersect a line at the mineral surface. The radius of the bubble (R)
and the distance from the centre to the mineral surface (k) are obtained from the picture.
The distance x (the solid-water-air point) is obtained from Pythagoras’ theorem:
22 kRx −= A-5.1
k
Air
Water
θ’ θ
x Solid
R

Appendix 5 154
The angle θ’ is calculated by using:
⎟⎠⎞
⎜⎝⎛⎟⎠⎞
⎜⎝⎛=′
πθ 180arctan
xk A-5.2
Consequently, the contact angle is:
'θθ −= 90 A-5.3
Top Related