


Languages
Pages
Legal

1
Supporting Information
Probing the Metal Specificity Mechanism of Superoxide
Dismutase from human pathogen Clostridium difficile
Wei Lia†, Hongfei Wang
b†, Zheng Chen
a, Qing Ye
c, Yang Tian
c, Xin Xu
a, Zhongxian
Huanga, Pingwei Li
d,
and Xiangshi Tana*
aDepartment of Chemistry & Institutes of Biomedical Sciences, Fudan University,
Shanghai 200433, China.
bInstitute of Opto-Electronics & Institute of Molecular Science, Shanxi University,
Taiyuan 030006, China
cDepartment of Chemistry, Tongji University, Shanghai, China
dDepartment of Biochemistry and Biophysics, Texas A & M University, TX77843,
USA
*To whom correspondence should be addressed. Email: [email protected]
Electronic Supplementary Material (ESI) for Chemical CommunicationsThis journal is © The Royal Society of Chemistry 2013

2
Preparation of SODcd enzymes
The superoxide dismutase from human pathogen C. difficile (SODcd) was prepared
similarly as described1. The SODcd gene was amplified from C. difficile genomic
DNA as a template using a pair of primers:
5’-TAGGATCCCCTGAAAATAACAAATTTAAGG-3’(F);
5’-CCCTCGAGTTAATCTTGAGATTTTAAATTTTTG-3’(R).
The PCR products digested by BamH I and Xho I (New England Biolabs) were ligated
into the linearized MBPHT-mCherry2 vector with an N-terminal maltose binding
protein followed by 8× histidine tag and TEV protease cleavage site. The resulting
ligation mixture was transformed into XL10-Gold competent cells (Novagen) by heat
shock. The recombination plasmid was verified by DNA sequencing (Invitrogen) and
transformed into Rosseta (DE3) pLysS competent cells (Novagen), which grew in
modified LB media containing 50μg/ml ampicillin and 34 μg/ml chloramphenicol
with vigorous shaking at 37 °C until an OD600 of 0.6 was attained. The expression was
induced with the addition of 0.3 mM isopropyl-1-thio-D-galactopyranoside (IPTG)
and further incubated at 37 °C for 8 hours. Cells were collected by centrifugation at
4500×g for 10 min at 4 °C using a Sorvall (RC-6C Plus) centrifuge. Cell pellets were
re-suspended in 20 mM potassium phosphate, pH 7.4, 25 mM imidazole, 500
mMNaCl, 1 mM PMSF. Then the cells were sonicated and centrifuged at 12,000×g
for 30 min to clarify the lysate. The lysate was purified by a preformed Ni-NTA
His-Trap gravity column (Qiagen, Chatsworth, CA). SODcd fractions were then tested
for initial purity by SDS-PAGE and subjected to TEV protease for incision. After
Electronic Supplementary Material (ESI) for Chemical CommunicationsThis journal is © The Royal Society of Chemistry 2013

3
cleavage of the N-terminal maltose binding protein (MBP) tag, the protein solution
was subjected to Ni–NTA column again to remove the MBP tag. Pure (>85%)
fractions were combined, and subjected to the ÄKTA purifier FPLC system and
passed over a HiLoad™ 16/60 Superdex™ 200 gel filtration column. Fractions were
analyzed by SDS-PAGE (which indicated >95% purity), combined, and concentrated
for storage at -80 °C. Protein concentrations of SOD samples were determined by the
Bradford Method similarly as described.
To obtain metal (Mn, Fe, and Co) ion solely occupied SODcd, The method of
denaturing and refolding method was used with denaturant (urea) and chelator
(8-hydroxyl quinoline) according to literature2. The purified (Milli Q) water for this
experiment was treated by Chelex-100 resin (Bio-Rad). The isolated SODcd protein
(~20 mg) was treated with 20 mM TrisHCl (pH 3.4) containing 8 M urea, 10 mM
8-hydroxyl quilionine and 2 mM dithiothreitol (DTT) for 30 min. The Apo-SODcd
was obtained by dialyzing against 40 mM TrisHCl (pH 7.8), 8 M urea, 2 mM
8-hydroxyl quilionine and 1 mM DTT for 5 h, then against 20 mM TrisHCl, pH 7.8,
containing 1 mM 8-hydroxyl quilionine and 1 mM DTT overnight, and finally against
20 mM TrisHCl, pH 7.8, for 12 h. The Fe-sub-MnSODcd, MnSODcd, and
Co-sub-MnSODcd were prepared by dialyzing of the apo-enzyme in 10 mM TrisHCI,
pH 7.8, 8 M urea and 2 mM DTT containing 2 mM FeSO4·7H2O, 1 mM MnCl2 and 1
mM CoCl2·7H2O for 2h, respectively.
To examine the metal selectivity for SODcd, the unfolding Apo-SODcd was treated
with the metal mixture including Mn2+
, Fe2+
, Co2+
, Ni2+
, Cu2+
, Zn2+
(0.5 mM). Urea
Electronic Supplementary Material (ESI) for Chemical CommunicationsThis journal is © The Royal Society of Chemistry 2013

4
was removed by dialyzing the solution against 20 mM TrisHCl, pH 7.8, containing
0.2 mM metal salts and 1 mM DTT overnight, then against 20 mM TrisHC1, pH 7.8,
0.1 mM DTT for 6 h for three times. The precipitate formed during dialysis was
removed by centrifugation. The clear SODcd protein solution was applied to a Source
15S column equilibrated with 10 mM potassium phosphate at pH 7.8. The SODcd
enzyme was eluted from the column with 50 mM potassium phosphate, pH 7.8. The
SODcd protein concentration was determined by Bradford method3. The enzymes
with sole metal bound were subjucted to ICP/MS analysis.
Metal Analysis of different metal substituted SODcd
The metal determination and quantification were performed according to Hall et
al. with minor modifications4. Briefly, ICP/MS was operated on an Elan DRC II
ICP-MS from Perkin-Elmer. An analog detection mode was used with three averaged
replicates per reading. External calibration standards were prepared through the serial
dilution of a single 10 ppm stock mixture of Mn, Fe, Co and Ni ions in 2% trace select
nitric acid from Fluka. Freshly prepared standards generally contained 2, 20, and 200
ppb of the metal ions in 1% nitric acid, diluted in MilliQ deionized water. The metal
content of proteins was determined by overnight digestion in 1M HNO3 (Trace Metal
Grade). Digested samples were diluted to 0.2 M HNO3 for analysis. The results were
listed in Table S1.
Electronic Supplementary Material (ESI) for Chemical CommunicationsThis journal is © The Royal Society of Chemistry 2013

5
Spectroscopy:
Fluorescence spectra were recorded using a Cary Eclipse Spectrofluorimeter
(Varian)5. The metal uptake studies were initiated by adding an aliquot of the metals
stock solution (MnCl2, CoCl2, NiCl2 and Ferric citrate) to a thermally equilibrated,
stirred solution of 50 μg/ml Apo-SODcd buffered in 20 mM HEPES, pH 7.2, 100 mM
NaCl. Emission intensity was monitored at 333 nm using a dynode voltage of 680 V
with 1 s-1
sampling frequency. The kinetic time courses were imported into Origin 8.0
and fitted by a multi-exponential decay process (Fig. S2).
The far-UV CD6 (200 nm-250 nm) spectra of these SODcd were recorded on a
Jasco 720 Spectrometer using a 2.0 mm quartz cuvette. The data were recorded every
0.2 nm at a rate of 100 nm/min. The samples containing 10 µM Apo-SODcd, 20 mM
HEPES, pH 7.2, 100 mM NaCl in presence of desired metals (0.1 mM) were heated
from 30 °C-90 °C at a rate of 2 °C/min, and ellipticity was monitored at 222 nm; the
melting temperature7 were determined as reported previously
8. Tm value was
calculated according to eq.1 and solved for T at which ΔG = 0: ΔG = -RTln[(IF - I) / (I
- IU)] (1), Where I is the ellipticity at 222 nm at temperature T, IF is the initial (folded)
ellipticity, and IU is the final (unfolded) ellipticity. The intensity was normalized by
eq.2 : fraction changes of ellipticity = (IF - I) / (IF - IU) (2). The results were presented
in Fig. S3.
Electronic absorption spectra of SODcd enzymes were recorded on a HP8453
UV–visible spectrophotometer (Fig. S4). The metal valence determination was
performed by titration with reductant dithionite and oxidatant KMnO4. As shown in
Electronic Supplementary Material (ESI) for Chemical CommunicationsThis journal is © The Royal Society of Chemistry 2013

6
Fig. S5, the isolated MnSODcd is mainly in +3 states, partly with the +2 covalence
mixure while Fe-sub-MnSODcd is in +3 state solely in isolated sample9.
4K EPR spectra were recorded on a Bruker EMX X-band spectrometer equipped
with an Oxford-910 cryostat and ITC-503 temperature controller (Oxford Instruments
Ltd.) (Fig. 1). All SODcd samples (~15 mg/ml) were frozen in the presence of 10%
glycerol. Experimental conditions: temperature 4K, microwave frequency 9.44 GHz,
power 2.0 mW, modulation at 100 kHz, modulation amplitude 4 G, and time constant,
163.84 ms.
SOD Activity assay
The catalytic activity of SODcd was measured by the method described by McCord
and Fridovich10
, using inhibition of the xanthine/xanthine oxidase11
-induced reduction
of cyt c (Fig. S6). A 3.00 ml reaction system includes the following ingredients: 2.8
ml of 50 mM potassium phosphate, 0.1mM ethylenediaminetetraacetic acid, 0.01 mM
cytochrome c, 0.05 mM xanthine, 0.1 ml XO and 0.1 ml SODs or distilled water. The
SOD activity was calculated as following:
% Inhibition=
550nm 550nm
550nm 550nm
ΔA /min Uninhibited - ΔA /min Inhibited
ΔA /min Uninhibited - ΔA /min Blank ×100
Units/ml enzyme =
% Inhibition (df)
(50%) (0.1)
Where, df = Dilution factor; 0.1 = Volume (in milliliter) of enzyme used; 50% =
Inhibition of the rate of cytochrome c reduction as per the unit definition).
Electronic Supplementary Material (ESI) for Chemical CommunicationsThis journal is © The Royal Society of Chemistry 2013

7
Stopped-flow spectroscopy
To obtain the second reaction rate and the Km or kcat values for SODcd, the
stopped-flow kinetics were performed using KO2 as the superoxide source12
(Fig. S7).
KO2 (Sigma-Aldrich) with an equal-molar amount of 18-crown-6 ether were dissolved
in dry DMSO. A double mixing stopped-flow spectrophotometer (TgK Scientific
Limited, SF-61DX2) was applied to monitor the absorption change of superoxide at
260 nm (ε250 =2000 M-1
cm-1
). Substrate concentration change was achieved by
altering the initial KO2 concentration. The initial O2·- concentration was calculated by
the molar extinction coefficient at 260 nm. The experimental process was as
following: firstly, KO2 in DMSO in a 250μL syringe was mixed in a 1:10 ratio with
an aqueous solution at pH 11 containing 2 mM CAPS (sigma) and 1 mM EDTA.
After a 500 ms delay, the KO2 solution was rapidly mixed in a 1:1 ratio with 100nM
SODcd in 100 mM potassium phosphate with 1 mM EDTA at pH 9.5. The mean of
three or four catalytic traces was recorded and fitted with the first exponential decay
as pseudo-first order reaction for O2·-
in Origin 8.0. The second reaction rate was
obtained using the pseudo first order rate dividing the SOD concentration. Due to the
instability of O2·- in the low pH buffer, the values obtained by this method were under
pH 9.5. All the final SOD rates were obtained by subtracting the O2·-
auto-disproportionation rate (at pH 9.5, k = ~2000 M-1
s-1
)13
. All the SODcd activity
results were summarized in Table S1.
Electronic Supplementary Material (ESI) for Chemical CommunicationsThis journal is © The Royal Society of Chemistry 2013

8
Crystallography
MnSODcd, Fe-sub-MnSODcd and Co-sub-MnSODcd (~20 mg/ml) were crystallized by
hanging-drop vapor diffusion method at 16C under in 60% v/v tacsimateTM
at pH 7.0.
The SODcd crystals were frozen in the cryostream and the diffraction data were
collected using beamline BLXU17 of Shanghai Synchrotron Facility (SSRF) using an
ADSC QUANTUM 315 detector with wavelength of 0.9792 Å. The diffraction data
were processed and scaled with HKL-200014
. The structures were solved by
molecular replacement by MOLREP15
using the 1.6 Å structure of B. subtilis
Superoxide Dismutase (PDB code 2RCV)16
as the starting model. All water molecules
and metal atoms were omitted from the starting model. The best solution yielded one
monomer in the asymmetric unit. After simulated annealing refinement, the Rcryst was
32.3% (Rfree = ~33.5%) for data between 25 and 2.5 Å resolution. Subsequent cycles
of model building, isotropic B-value, and positional refinement to 1.8-2.2 Å
resolution were performed using REFMAC517
, COOT18
and PHENIX19
. At this point,
the metal ions and their ligands were modeled into the active sites, and the
orientations of the side chains of polar amino acids, dual conformers, and bound water
molecules were modeled according to Fo-Fc Fourier maps countered at 3σ level.
Occupancies of dual conformers were manually adjusted until positive and negative
Fo-Fc density peaks were disappeared. After all the models were build, the positions
of the coordination residues was carefully fitted with Real Space Refine Zone in
PHENIX to make sure that the residues matched density well and were in the center
of density. In the last stages of refinement, anisotropic B factors were refined. Finally,
Electronic Supplementary Material (ESI) for Chemical CommunicationsThis journal is © The Royal Society of Chemistry 2013

9
water molecules were added using PHENIX and positioned only if well defined
positive peaks were present in both the 2Fo-Fc and Fo-Fc electron density maps,
and/or if they were within hydrogen-bonding distance with either protein atoms or
other presumed water molecules. Modeled water molecules that refined with B factors
above three times the average protein B-value were deleted. The final structures were
refined to Rcryst = 16.3% and Rfree = 18.8% for MnSODcd, Rcryst = 18.0% and Rfree =
20.3% for Fe-sub-MnSODcd, Rcryst =18.2% and Rfree = 19.0% for Co-sub-MnSODcd,
respectively. The quality of the models were checked using PROCHECK20
. The data
collection and refinement statistics were listed in Table S2. Structural figures were
prepared using PyMOL21
(Fig. 2 and Fig. S8). All the structures of SODcd have been
deposited in the Protein Data Bank (PDB), with the accession codes of 4JZG
(MnSODcd), 3TJT (Fe-sub-MnSODcd) and 4JZZ (Co-sub-MnSODcd), respectively.
Fe K-edge X-ray absorption and X-ray fluorescence spectrum of Fe-sub-MnSODcd
The metal fidelity of Fe-sub-MnSODcd crystal was confirmed by X-ray absorption
and X-ray fluorescence spectrum (Fig. S9). Standard excitation and MAD scans
operations were done22
. Briefly, the rhombic crystal of Fe-sub-MnSODcd was
flash-cooled and mounted under a liquid N2 stream. Then the BLU-ICE softerware
was used to selective the excitation scan energy for Fe element from the periodic table
(500.0 eV above the edge energy). The wavelength changes were conducted
automatically and X-ray beam intensity was optimised at each stage. The scan time
was increased to improve the signals. Then the incident 1.74 Å X-ray (BL17U1, in
Electronic Supplementary Material (ESI) for Chemical CommunicationsThis journal is © The Royal Society of Chemistry 2013
10
Shanghai synchrotron radiation faculty, SSRF) was focused on the crystal and the
absorption spectrum was collected. After collecting, BLU-ICE will automatically
search for peaks and attempted to match them to the emission energy for all the stable
elements. The peak dispalyed in our exitation spectrum corresponded to Fe element
only, indicating the metal purity of this sample. Further, X-ray fluorescence 9 scans
were performed using excitation of the Fe K-edge energy. The Fe-K edge EXAFS
signals confirmed metal fidelity of Fe-sub-MnSODcd.
Electrochemistry
(1) Potentiometric Titration
Potentiometric titrations were performed using a Ag/AgCl/Pt electrode at 25°C
with an optical cell according to Stankovich method23
(Fig. S10 and Fig. 3). A
combination of Ag/AgCl/Pt electrode was inserted in one port, a syringe containing
titrant was mounted in a second, and the third port was connected to a vacuum line
and maintained a low flow of N2 gas to remove residual O2. The reaction buffer
contained 50 mM potassium phosphate at pH 7.8, containing 100 mM NaCl, 0.4 mM
SODcd. The mediators were 25μM p-benzoquinone for MnSODcd, and 10μM DCIP
for Fe-sub-MnSODcd, respectively. Fe-sub-MnSODcd was reduced by dithionite, and
the reduced form then was oxidized by titration of aliquots of KMnO4. The
absorbance of Fe-sub-MnSODcd at 350 nm and electrochemical potentials were
monitored during the oxidation titration process. For the MnSODcd, the sample in
Electronic Supplementary Material (ESI) for Chemical CommunicationsThis journal is © The Royal Society of Chemistry 2013
11
each equilibrating potential point was withdrawn, frozen in the liquid N2 quickly for
EPR spectra collection. For the determination of reduction potentials, the deduced
percentage of the oxidation SOD species was plotted as a function of the reduction
potential at equilibrium. The data were fit with the Nernst equation: E = Em + 0.059
log(Ox/(100-Ox)), where E is the measured ambient potential in Voltage, Ox is the
percentage of oxidized SOD and Em is the reduction midpoint potential. Although the
mediators and the potentials responded rapidly to titrant additions, they equilibrated
slowly with SODs, reaching equilibrium after up to 4 h, as reported by other groups24
.
During this long equilibrium process, SODcd lost some metals and its activity was
compromised. Hence, we failed to perform the back titrations and the Nernst
reversibility cannot to be obtained from our titrations. Considering to drawbacks of
the titration experiments, We further performed the CV scans to get the reduction
midpoint potentials of SODs (see below).
(2) Cyclic Voltammetry
Cyclic voltammetry (CV) of immobilized SODcd was carried out with BAS
100B/W electrochemical analyzer 25
and the CHI 604A (Shanghai Chenhua
instrument, China) (Fig. S11). A 5 ml compartment with a three-electrode
configurations was used as the electrochemical cell. A platinum wire was the counter
electrode. The reference electrode was an Ag/AgCl, 1M KCl electrode. The SODcd
immobilized glassy carbon electrode was used as working electrodes. The SODcd
immobilized glassy carbon electrode modification process was performed in the
ambient aerobic air as following: the naked glassy carbon electrode was boiled in 2.5
Electronic Supplementary Material (ESI) for Chemical CommunicationsThis journal is © The Royal Society of Chemistry 2013
12
M KOH for 4 h, sonicated for 5 min, then rinsed with Millipore water and stored in
concentrated sulfuric acid (H2SO4, 95~97%) overnight. Before modification, the
electrodes were rinsed with water, treated with concentrated nitric acid (HNO3, 65%)
for 10 min and rinsed again with Millipore water. The bare GC electrode was further
activated by CV scan in 0.5M H2SO4 electrolyte between -1.0 V and 1.0 V at 0.2
V/S-1
. For SODcd adsorption, the cleaned electrodes were first incubated in 2 mM
Ni-NTA aqueous solution (formed by mixing Ni2+
solution and NTA solution at room
temperature under constant stirring for overnight) for overnight at low temperature,
then incubated in 1 ml 200 μM of SODcd in 50 mM PBS buffer pH 7.5 at 4 ℃ for 12 h.
Further addition of EDC (N′-ethylcarbodiimide hydrochloride) (200 mM stock
solution in water) with a final concentration of 5 mM for 30 min was used for
covalent immobilization of SODcd. CV of SODcd solution was performed between
-500 and +500 mV at different potential scan rates in 50 mM PBS buffer pH 7.4. The
buffer was always purged with high pure N2 before use to remove residual O2. The
almost unchanged CV profiles along with long time scans at the rate of 100 mV/s
confirmed the stability and reproducibility of our SOD modified electrodes (Fig. S12).
To ascertain the activity of the immobilized SODcd, the amperometric titrations on
SOD/NTA modified electrodes using KO2-DMSO solution were also performed26
(Fig.
S13). To evaluate the mass transport process of these SOD immobilized electrodes,
the variation scans at different potential rates were performed (Fig. S14).
Optical, EPR titration and azide affinity
Electronic Supplementary Material (ESI) for Chemical CommunicationsThis journal is © The Royal Society of Chemistry 2013

13
Optical pH titrations of MnSODcd and Fe-sub-MnSODcd were performed using
Hewlett-Packard 8453 spectrophotometer (Fig. S15). pH values were measured
continuously using a combination pH microelectrode (Microelectrodes Inc.). pH was
increased in a small step by adding 100 mM KOH and then the optical spectrum was
recorded at each pH value. pK value was obtained by fitting the data with the
Henderson-Hasselbalch equation (AA-Aobs)/(AA-AB) = (K)/(K+10-(pH)
), where AA and
AB (as the acid and base forms) are absorbance values at 476 nm, respectively, Aobs is
the observed absorbance at a given pH value, K is the acid dissociation constant and
the Hill coefficient is set to 1. The EPR pH titration was performed as follows (Fig.
S16): The pH values of Fe-sub-MnSODcd were adjusted successively with 100 mM
KOH. The SODcd sample at each pH point, measured using a microelectrode, was
transferred into an EPR tube and promptly frozen in liquid nitrogen. Signal
amplitudes in the spectra were plotted as a function of pH values. The pK values were
evaluated by fitting with the Henderson-Hasselbalch equation neglecting
cooperativity.
Azide binding ability with these SODcd proteins was determined by titration of
azide to the different SODcd proteins, respectively, using Hewlett-Packard8453
spectrophotometer at 25℃ (Fig. S17). The apparent dissociation constant of azide to
each SODcd protein was obtained by fitting the absorbance data to the following eq (1),
which describes weak binding with an invariant absorbance background B and
addition absorbance Amax when SOD protein saturated with azide.
A([S])= Amax* [S]/(Kd’ + [S]) + B (1)
Electronic Supplementary Material (ESI) for Chemical CommunicationsThis journal is © The Royal Society of Chemistry 2013

14
The apparent Kd was corrected for the pK (4.7) of N3H based on the equilibrium
( N3H →H+ + N3
- ) using eq (2), generating the azide dissociation constant Kd’.
Kd’ = (1+10(pH-pK)
)Kd (2)
DFT Calculations
(1) DFT Models
From the crystal structures of MnSODcd, Fe-sub-MnSODcd and Co-sub-MnSODcd,
the metal coordination environment and the additional second-sphere residues Tyr64
and Gln178 were extracted. In all cases, the amino-acid residues were truncated at
their Cα atoms by replacing the adjacent backbone atoms with H atoms. The terminal
methyl of the ligands (including His56, His111, His197 and Asp193), as well as the
terminal methyl of Gln178 and Tyr64, were restrained when the geometries
optimization were performed (Table S4 and Fig. S18). For the metal ions models,
solvent effects also were considered by coordinating the sixth water to each metal ion
and using the integral equation formalism polarizable continuum model (IEFPCM)27,
28.
(2) Computational details
All calculations were carried out with the GAUSSIAN 09 software package. All
geometries were fully optimized with the hybrid density functional theory (DFT) at
the B3LYP/6-31G (d,p) level, except for iron, cobalt and manganese atoms, which
were optimized with the B3LYP/6-31G(2d,p) method29-31
. The final electronic
Electronic Supplementary Material (ESI) for Chemical CommunicationsThis journal is © The Royal Society of Chemistry 2013

15
energies are calculated at the level of B3LYP/ 6-31+G (d,p), except for metal
(manganese, iron and cobalt) atoms, which were calculated with the
B3LYP/6-31+G(2d,p) method and vibrational frequencies are analytically computed
at the same level in order to confirm that a local minimum has no imaginary
frequency. Geometries were considered converged when the maximum energy change
between subsequent cycles dropped below 10-3
hartree and the maximum Cartesian
gradient was less than 10-2
hartree/Å.
(3) The reaction free energy ΔG of metal substitution reactions
To assess the relative metal binding affinities for SODcd, we designed metal
substitution reactions 1 and 2. The reaction free energy (ΔG) was obtained from the
calculated G at 298 K and 101 kPa of each reactant and product. Fe3+
was chosen
because that Fe3+
was used in the experimental part.
[Fe(H2O)6]3+
(aq) + Mn2+
SOD ----- Fe3+
SOD + [Mn(H2O)6]2+
(aq) (1)
[Co(H2O)6]2+
(aq) + Mn2+
SOD ----- Co2+
SOD + [Co(H2O)6]2+
(aq)
(2)
The results were listed in Table S5 and Table S6. For equation 1, When Mn2+
was
substituted by Fe3+
, the reaction energy ΔG at 298 K and 101 kPa is 24.25 kcal/mol,
indicating that Mn2+
SODcd was stable than Fe3+
SODcd. On the other hand, for
equation 2, when Co2+
substituted Mn2+
, the reaction energy ΔG at 298 K and 101
kPa was -17.69 kcal/mol, indicating Mn2+
SODcd was less stable than Co2+
SODcd,
which was consistent with experiments.
(4) Perturbation Theory Energy Analysis
Electronic Supplementary Material (ESI) for Chemical CommunicationsThis journal is © The Royal Society of Chemistry 2013
16
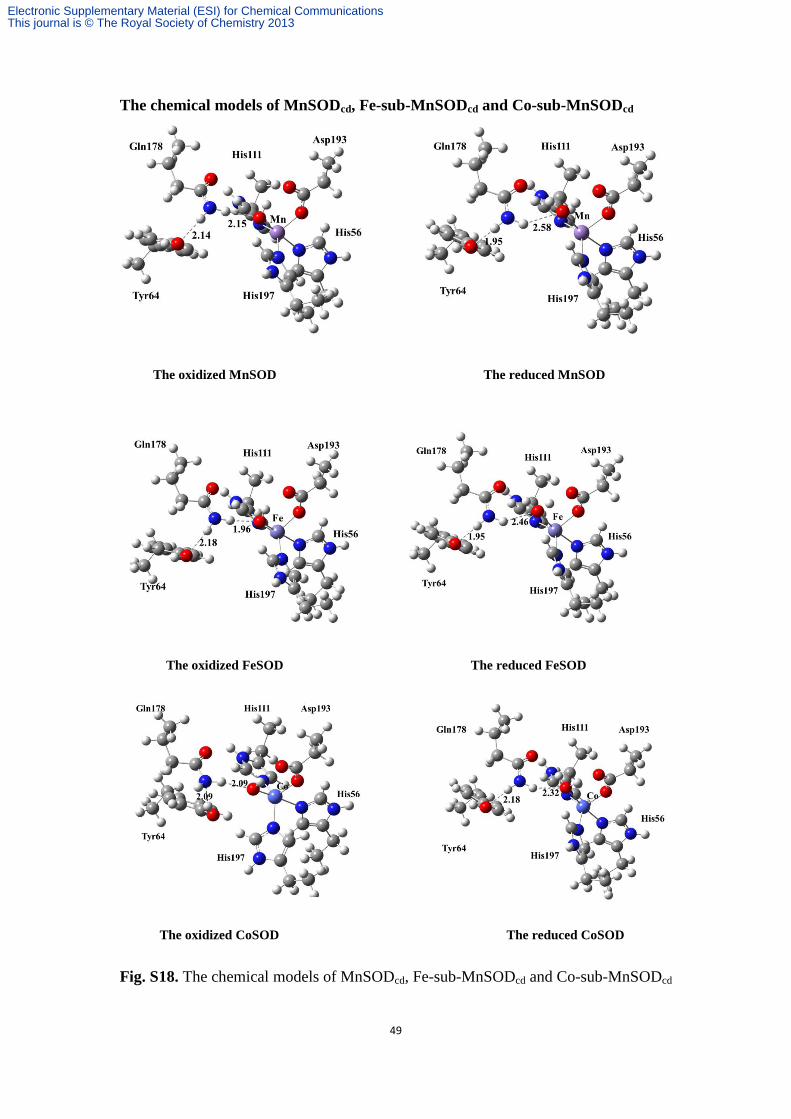
To investigate the roles of the second coordination key residues in the H-bond
network involving in the catalytic process, natural bond orbital analysis was
performed. The related atom coordinates at single point energy equilibrium were
shown in Table S4 and Fig. S18. Perturbation theory energy analysis was carried out
by examining all possible interactions between “filled” (donor) Lewis-type NBOs and
“empty” (acceptor) non-Lewis NBOs, and estimating their energetic importance by
2nd-order perturbation theory. At large inter-atomic separations, the NAOs {θi(0)
}
essentially reduce to the corresponding atomic natural orbitals32
33
of isolated atoms.
However, in a given molecular environment, the NAOs reflect the chemical give and
take of electronic interactions, with variations of shape (e.g., angular deformations
due to steric pressures of adjacent atoms) and size (e.g., altered diffuseness due to
increased anionic or cationic character) that distinguish them appreciably from
free-atom forms. Given an effective one-electron Hamiltonian F (e.g., Fock or
Kohn–Sham operator) for the system, with associated NAO orbital energies εi(0)
,
*000 F iii (1)
The interaction of unperturbed donor φi(0)
(e.g., a valence lone pair) with acceptor
φj∗(0)
(e.g., a valence anti-bond) leads to the corresponding second-order i→j*
stabilization estimate34
,
002
002*** 2 ijjiji
FE
(2)
The natural bond orbital second order perturbation theory output displayed “E (2)”.
The results were listed in Table S7, showing that the Gln178 couples more to
Tyr64 in MnSODcd than that of Fe-sub-MnSODcd [E(2) of Glu178-Tyr64 are
Electronic Supplementary Material (ESI) for Chemical CommunicationsThis journal is © The Royal Society of Chemistry 2013

17
~5.97/5.87 kcal/mol in reduced state and are ~3.10/2.77 kcal/mol in oxidatized state
for MnSODcd/Fe-sub-MnSODcd]. On the other hand, Gln178 of MnSODcd coupled
less to the coordination water than that of Fe-sub-MnSODcd [E(2) are ~0.43/0.74
kcal/mol in reduced state and ~2.62/4.36 kcal/mol in oxidized state for
MnSODcd/Fe-sub-MnSODcd]. Here, we could see that in the oxidized
Fe-sub-MnSODcd, Gln178 is tighter to the coordination hydroxyl, which may lower
its redox potential and thus impact its catalytic activity. The DFT calculation results
likely support the structural features regarding to the polarization patterns of the
hydrogen bond network and give a reasonable conjecture that the metal reactivity of
the SODcd may be tuned by the subtly differences in the hydrogen bond network.
Electronic Supplementary Material (ESI) for Chemical CommunicationsThis journal is © The Royal Society of Chemistry 2013

18
Table S1. Summary of metal contents, electrochemical Em values and SOD activity of
SODcd enzymes.
Sample
Specific
activity
(U·mg-1
)1
The second
reaction rate
(108 M
-1S
-1)
Km2
(μM)
kcat
(S-1
)
kcat/Km
(M-1
·S-1
)
Metal Contents
(mol/mol per monomer)
Metal
oxidatio
n state4
Electrochemi
cal Em values
(mV vs NHE) Mn Fe Co Ni
Apo-SODcd -3 - - - - - - - 0.01 - -
Mixed-SODcd5 - - - - - 0.24 0.1 0.47 0.02 - -
MnSODcd 8600±40 6 ±0.2 2 3000 6×10⁸ 0.51 0.02 - - +2/+3 480
Fe-sub-MnSODcd 800 ±20 0.2 ±0.03 18 360 2×10⁷ - 0.72 - - +3 120
Co-sub-MnSODcd - - - - - - - 0.82 - +2 >700
Note: 1. units/mg of protein/mol of metal ions /mol of subunit. 2. From the stopped-flow measurement in this research. 3. “-” Standing for not be detected.
4. As determined in this report by UV/vis spectra (supporting information). 5. This protein was prepared in the presence of various metals containing Mn, Fe,
Co, Ni.
Electronic Supplementary Material (ESI) for Chemical CommunicationsThis journal is © The Royal Society of Chemistry 2013

19
Table S2. Summary of data collection and refinement statistics of SODcd enzymes.
MnSODcd Fe-sub-MnSODcd Co-sub-MnSODcd
Wavelength 0.9795 0.9792 0.9792
Space group P6522 P6522 P6522
Unit-cell dimensions (Å, °)
a=80.592, b = 80.592,
c=249.509 α=β=90,
γ=120
a=80.399, b=80.399, c =251.631 α=β=90,
γ =120
a =80.321, b =80.321, c =250.991
α=β= 90, γ =120
Resolution (Å) 2.32 1.8 1.95
No. of observations 363844 882131 319042
No. of unique reflections 21721 (1055) [a] 44038 (2261)[a] 35695 (1756)[a]
Completeness (%) 99.9 (100.0) 96.3(100.0) 98.8 (100.0)
<I>/(I) 37.5 (11.7) 22.9 (12.5) 17.8 (3.2)
Redundancy 16.7 (18.0) 20.0(21.4) 8.9 (9.0)
Rsym[b]
0.084 (0.370) 0.133 (0.386) 0.144 (0.392)
Rcryst[c]
(%)/Rfree[d]
(%) 16.3 / 18.8 17.9 / 20.3 18.2 / 19.1
RMSD bonds (Å) / angles (°) [e]
0.007 / 0.967 0.006 / 0.979 0.007 / 0.978
DPI coordination errors (Å)[f]
0.128 0.080 0.084
Ramachandran plot, residues in:
Most favored regions (%)
Additional allowed regions (%)
Generously allowed regions (%)
Disallowed regions (%)
91.2 7.1 1.6 0.0
92.3 6.6 1.1 0.0
92.3 6.6 1.1 0.0
[a] Numbers in parentheses represent values in the highest resolution shell (Å). [b] Rsym = |Ij-<I>|/ Ij, where Ij is the observed
integrated intensity, <I> is the average integrated intensity obtained from multiple measurements, and the summation is over all
observed reflections. [c] Rcryst =||Fobs|-|Fcalc||/|Fobs|, Fobs and Fcalc are observed and calculated structure factor amplitudes,
respectively. [d] Rfree calculated with randomly selected reflections (5%). [e] Based on the ideal geometry values of Engh & Huber
(1991). [f] The errors associated with the bond lengths were calculated from the Cruickshank diffraction-component precision
index (DPI)35
.
Electronic Supplementary Material (ESI) for Chemical CommunicationsThis journal is © The Royal Society of Chemistry 2013

20
Table S3. Bond lengths and bond angles at metal active sites and the hydrogen bond
networks of SODcd enzymes.
MnSODcd Fe-sub-Mn
SODcd
Co-sub-Mn
SODcd
MnSOD
H. sapiens 2
FeSOD
E.coli3
A. Coordination bonds (Å)1
M-Nε2
His56 2.20 2.16 2.16 2.19 2.15
M-Nε2
His111 2.08 2.23 2.10 2.19 2.06
M-O2
Asp193 1.97 1.91 1.98 2.07 1.89
M-Nε2
His197 2.20 2.19 2.16 2.21 2.08
M-Ocoordsolv 2.35 2.23 2.41 2.27 1.92
B. Coordination bond angles ( )
Nε2
His197-M-Nε2
His56 93.13 101.54 96.44 89.48 90.66
Nε2
His56-M-O2
Asp193 84.88 84.95 83.71 83.80 85.66
O2Asp193-M-Ocoordsolv 79.62 83.90 82.11 88.99 91.60
Ocoordsolv-M-Nε2
His111 95.70 91.60 89.89 95.74 89.17
Nε2
His111-M-Nε2
His197 132.42 126.32 131.31 126.68 128.40
C. Hydrogen bonds (Å)
Ocoordsolv- Oδ1 Asp193 2.85 2.95 2.90 2.89 3.03
Nε1Gln178- Ocoordsolv 2.93 2.91 2.81 2.78 3.48
Nε1Gln178-Oδ1 Tyr64 2.86 2.91 2.99 4.424 3.10
Oδ1 Tyr64-Owater2 2.75 2.65 2.55 -4 2.76
Owater2- Owater3 2.83 2.74 - -4 3.00
Owater3- Nε1His 60 2.90 3.02 5.56 -
4 2.81
1. The error associated with the bond lengths is ~0.1 Å as calculated from the Cruickshank diffraction-component
precision index. 2. The data of Mn-specific SOD was from H. sapiens with PDB code: 2P4K, subunit D36. 3.
Fe-specific SOD was from E. coli with PDB code: 1ISB, subunit A11. 4. The water mediated hydrogen bond
network was interpreted due to the mutation of Tyr64 to Asn64 (named as SODcd) in PDB 2P4K.
Electronic Supplementary Material (ESI) for Chemical CommunicationsThis journal is © The Royal Society of Chemistry 2013

21
Supporting Figures
Fig. S1 The superdex 200 gel filtration profiles of different metal ions substituted
SODs.
Electronic Supplementary Material (ESI) for Chemical CommunicationsThis journal is © The Royal Society of Chemistry 2013

22
Fig. S2. Intrisinc fluorescence kinetics quenching fro the SODcd metallation. Panel A,
the active site of MnSODcd based on PDB 4JZ2. Panel B, schemematically
represented the energy transfer between the excited tryptophan residues and the metal
center via a Förster transition dipole coupling mechanism37
. Panel C, the metal
uptake process of Apo-SODcd at 40℃ in 20 mM HEPES, pH 7.2, 100 mM NaCl
buffer.
Electronic Supplementary Material (ESI) for Chemical CommunicationsThis journal is © The Royal Society of Chemistry 2013

23
Fig. S3. Thermal denaturation curves for different SODcds monitored by CD
spectroscopy at 222 nm. All the enzyme samples were in 20 mM HEPES, pH 7.2, 100
mM NaCl buffer.
Electronic Supplementary Material (ESI) for Chemical CommunicationsThis journal is © The Royal Society of Chemistry 2013
24
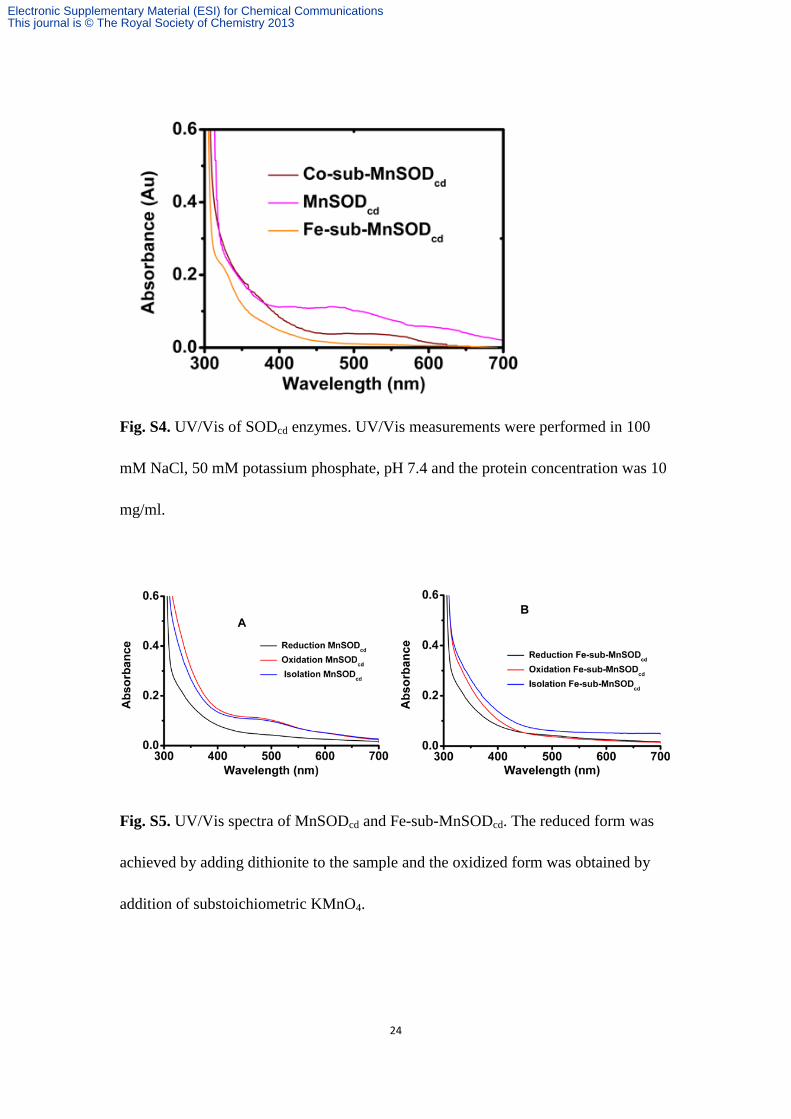
Fig. S4. UV/Vis of SODcd enzymes. UV/Vis measurements were performed in 100
mM NaCl, 50 mM potassium phosphate, pH 7.4 and the protein concentration was 10
mg/ml.
Fig. S5. UV/Vis spectra of MnSODcd and Fe-sub-MnSODcd. The reduced form was
achieved by adding dithionite to the sample and the oxidized form was obtained by
addition of substoichiometric KMnO4.
Electronic Supplementary Material (ESI) for Chemical CommunicationsThis journal is © The Royal Society of Chemistry 2013

25
Fig. S6 Xanthine oxidase coupling cyt c reduction method for determining the
different metal ions substituted SODcd. Panel A, the ability of SODcd (3 μM) to inhibit
the O2- mediated cyt c reduction. Panel B and panel C, the concentration dependence
of the MnSODcd and Fe-sub-MnSODcd activity. The measurement was performed in
the standard potassium phosphate buffer at 25℃ and the linear fitting was carried out
using Origin 8.0.
Electronic Supplementary Material (ESI) for Chemical CommunicationsThis journal is © The Royal Society of Chemistry 2013

26
Fig. S7. Stopped-Flow Spectrophotometry for the determination of Km and kcat values
of MnSODcd and Fe-sub-MnSODcd. Panel A and Panel B are for MnSODcd and
Fe-sub-MnSODcd, respectively.
Electronic Supplementary Material (ESI) for Chemical CommunicationsThis journal is © The Royal Society of Chemistry 2013

27
Fig. S8. The overall structure (A) and the metal coordinated residues of
Fe-sub-MnSODcd (B).
Fig. S9. X-ray absorption specrum (Panel A) and X-ray fluorescence spectrum
(Panel B) of Fe-sub-MnSODcd.
Electronic Supplementary Material (ESI) for Chemical CommunicationsThis journal is © The Royal Society of Chemistry 2013

28
Fig. S10. The potentiometric reductive titration of MnSODcd via EPR spectra (Panel
A, C) and oxidative titration of Fe-sub-MnSODcd (Panel B, D) by UV/Vis spectra.
The quantitative percentage of the oxidative state and reductive state could be inferred
by EPR amplitude at g=6.0 for MnSODcd and the absorption at 350 nm for
Fe-sub-MnSODcd at each equilibrium ambient potential. The Nernst fittings of the
[OX]/[RE] as function of ambient potential were shown.
Fig. S11. The CV of MnSODcd (Panel A), Fe-sub-MnSODcd (Panel B) and
Co-sub-MnSODcd at NTA-modified glassy carbon electrode in 50 mM PBS buffer
(pH 7.4) with a scan rate of 100 mV/S-1
.
Electronic Supplementary Material (ESI) for Chemical CommunicationsThis journal is © The Royal Society of Chemistry 2013
29
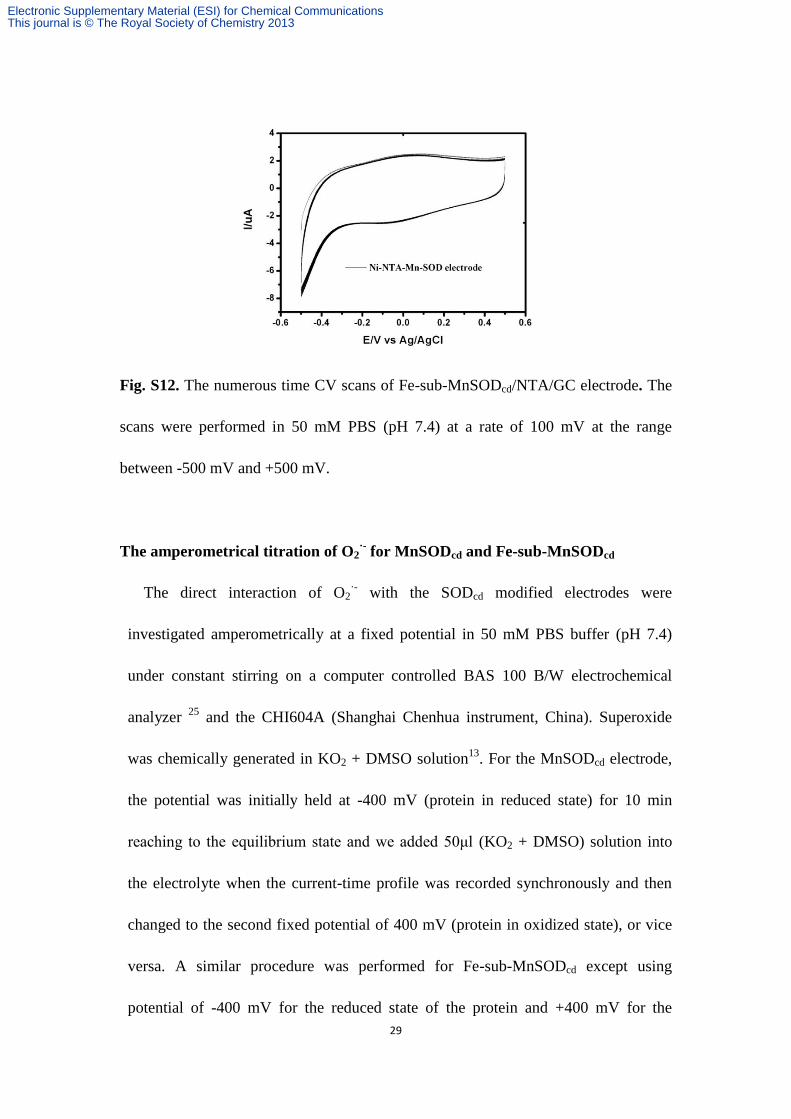
Fig. S12. The numerous time CV scans of Fe-sub-MnSODcd/NTA/GC electrode. The
scans were performed in 50 mM PBS (pH 7.4) at a rate of 100 mV at the range
between -500 mV and +500 mV.
The amperometrical titration of O2·- for MnSODcd and Fe-sub-MnSODcd
The direct interaction of O2·- with the SODcd modified electrodes were
investigated amperometrically at a fixed potential in 50 mM PBS buffer (pH 7.4)
under constant stirring on a computer controlled BAS 100 B/W electrochemical
analyzer 25
and the CHI604A (Shanghai Chenhua instrument, China). Superoxide
was chemically generated in KO2 + DMSO solution13
. For the MnSODcd electrode,
the potential was initially held at -400 mV (protein in reduced state) for 10 min
reaching to the equilibrium state and we added 50μl (KO2 + DMSO) solution into
the electrolyte when the current-time profile was recorded synchronously and then
changed to the second fixed potential of 400 mV (protein in oxidized state), or vice
versa. A similar procedure was performed for Fe-sub-MnSODcd except using
potential of -400 mV for the reduced state of the protein and +400 mV for the
Electronic Supplementary Material (ESI) for Chemical CommunicationsThis journal is © The Royal Society of Chemistry 2013

30
oxidized state of SOD. The sensitivity of the SOD-based electrodes towards O2·-
is
proposed to be dependent on the operation potential and the surface coverage of
SOD. As shown in the Fig. S13, the MnSODcd and Fe-sub-MnSODcd/NTA/GC
electrodes display amperometric response to successive addition of the KO2-DMSO
solution. Well defined steady-state currents response increasing linearly with O2·-
concentration. Based on the concentration of O2·-
used and the SOD coverage, the
sensitivity of MnSODcd and Fe-sub-MnSODcd modified electrodes are about 25 and
9 nA cm-2
/nM min-1
, which are as effective as some reported SOD-based
biosensors38
.
Fig. S13. Typical steady state current-time responses of MnSODcd and
Fe-sub-MnSODcd/NTA/glassy carbon electrode. Panel A is the amperometric
response for MnSODcd at +400 mV for the oxidation of O2·- and at -400 mV for
reduction of O2·-
with every titration of 2μM O2·-. Panel B is amperometric response
for Fe-sub-MnSODcd at +400 mV for the oxidation of O2·- and at -400 mV for
reduction of O2·-
with every titration of 20μM O2·-.
CV behaviors of MnSODcd and Fe-sub-MnSODcd at various potential scan rates
Electronic Supplementary Material (ESI) for Chemical CommunicationsThis journal is © The Royal Society of Chemistry 2013

31
In order to assess the adsorption effects of SODcd on the electrode and the
reversibility of the modified SOD electrodes, we performed CV scans at various
potential scan rates between 10 mV and 2000 mV for MnSODcd and 100 mV and 700
mV for Fe-sub-MnSODcd. CVs obtained at the SOD/NTA-modified GC electrodes in
phosphate buffer at different potential scan rate clearly show that the peak current (Ipa
and Ipc) obtained for each SOD are linear with v (but not v
1/2) in the potential scan
range, which reveals that the electron transfer of the SODcd is a surface-confined
process but not a diffusion-controlled one39
. This is very different from the redox
reaction of cyt c at the cysteine-modified gold electrode in which the peak current
change with v1/2
, being characteristic of a diffusion-controlled electrode reaction of
solution-phase species40
. The slopes of Ip-v curves are 20.89 for Ipa and -18.7 for Ip
c of
MnSODcd, 17.6 for Ipaand -17.9 for Ip
c of Fe-sub-MnSODcd. The almost comparable
slope values suggested a quasi-reversible redox chemistry at the modified electrodes26
.
Interestingly, the current responses of Fe-sub-MnSODcd along with the various volts,
regardless of the anode or cathode, was smaller than that of MnSODcd, which is
consistent to the above amperometric titration results of MnSODcd having more
response than Fe-sub-MnSODcd. This justifies the higher activity of MnSODcd than
Fe-sub-MnSODcd.
Electronic Supplementary Material (ESI) for Chemical CommunicationsThis journal is © The Royal Society of Chemistry 2013

32
Fig. S14. CV peak current changes as a function of scan rates for MnSODcd
(PanelA) and Fe-sub-MnSODcd (Panel B).The scan was performed in 50 mM PBS
(pH 7.4) at rate range of 0.01-2.0 V/s-1
for MnSODcd and 0.1-0.7 V/s-1
for
Fe-sub-MnSODcd, respectively. The linear fitting was carried out with Origin 8.0.
Electronic Supplementary Material (ESI) for Chemical CommunicationsThis journal is © The Royal Society of Chemistry 2013

33
Fig. S15. The optical pH titration of MnSODcd (panel A) and Fe-sub-MnSODcd
(Panel B).
Fig. S16. The relevant EPR signals amplitude change along with pH variation of
Fe-sub-MnSODcd. Panel A, the different EPR spectra under alterative pH for
Fe-sub-MnSODcd. Panel B, pK values of 7.5 for Fe-sub-MnSODcd by fitting the
signals amplitude change as a function of pH values with Henderson-Hasselbalch
(n=1) equation.
Electronic Supplementary Material (ESI) for Chemical CommunicationsThis journal is © The Royal Society of Chemistry 2013

34
Fig. S17. The optical azide titrations of the two SODcd enzymes. Panel A, B are the
spectra of azide binding to MnSODcd and Fe-sub-SODcd profiles, respectively. Insets
are the fitting curves of the related absorbance change as a function of azide
concentration, respectively.
Electronic Supplementary Material (ESI) for Chemical CommunicationsThis journal is © The Royal Society of Chemistry 2013

35
DFT calculation
(1) Computationally-derived Coordinates for MnSODcd, Fe-sub-MnSODcd and
Co-sub-MnSODcd.
Table S4a. Computationally-derived Coordinates for the oxidized MnSODcd
O 0.50531700 1.70858000 0.44391900
C 4.44290100 -5.07717200 -0.11146100
C 5.26245400 -4.01414800 -0.87287500
C 4.50506200 -2.72191400 -0.98742300
C 3.32152900 -2.28336500 -0.43049600
N 5.00356400 -1.61278000 -1.67832400
C 4.15767200 -0.55998600 -1.52229200
N 3.12164800 -0.93346300 -0.75922000
C -6.58914200 -4.84159300 0.23731100
C -5.90593400 -3.67137900 -0.52086300
C -5.33948700 -2.63745300 0.44151900
C -6.21263800 -1.87585100 1.24017100
C -3.95925400 -2.43256200 0.60492300
C -5.73279000 -0.95351900 2.17271800
C -3.46097800 -1.50911900 1.53190600
C -4.35251700 -0.77671500 2.31712400
O -3.81493700 0.16059600 3.22026900
C -0.76427000 -0.98953100 -5.69878600
C -0.91015800 -1.99359400 -4.52569800
C -0.67195000 -1.29404200 -3.22408400
C 0.40827000 -1.31713500 -2.37676600
N -1.48004900 -0.25634600 -2.74434700
C -0.89309800 0.31961000 -1.66458800
N 0.26913900 -0.30845300 -1.41140800
C -5.41820000 4.93973600 -0.19775400
C -5.81294200 3.45135500 -0.10044500
C -4.88858600 2.60662800 0.80120000
C -3.46721100 2.37093000 0.28020900
N -2.54708600 2.02803900 1.22532500
O -3.16191600 2.44434600 -0.94262400
C 3.73222800 5.11000900 -2.47011800
C 3.65944800 3.58169700 -2.38467000
C 2.69838000 3.05748900 -1.33570000
O 1.84312000 3.77011300 -0.75555700
O 2.81356000 1.74415400 -1.12197900
C 5.80922400 0.26906900 4.78829900
C 4.52045300 -0.59141000 4.79098200
Electronic Supplementary Material (ESI) for Chemical CommunicationsThis journal is © The Royal Society of Chemistry 2013

36
C 3.52540900 -0.17175500 3.75193600
C 3.40515900 -0.49546400 2.42114600
N 2.50973400 0.76237300 3.98516100
C 1.81958000 0.97774100 2.83299300
N 2.34296000 0.22275700 1.85656900
Mn 1.69963000 0.46605200 -0.12873800
H 6.20566200 -3.81993300 -0.34135400
H 5.54348300 -4.38340500 -1.86847900
H 2.61378000 -2.82049000 0.17550600
H 4.28529400 0.43182100 -1.91690200
H 3.91287000 -4.56932100 0.66697500
H -6.64721000 -3.18833000 -1.17245600
H -5.11298300 -4.04930800 -1.17766000
H -7.28585400 -2.00422700 1.13347000
H -3.26066400 -3.00837900 0.00434100
H -6.42868000 -0.37579200 2.77570400
H -2.39544800 -1.35596200 1.65716100
H -4.48581300 0.45011500 3.86877000
H -7.13959300 -4.40722400 1.04605200
H -0.17401100 -2.79900500 -4.62007400
H -1.89909400 -2.46941600 -4.55230300
H 1.27008900 -1.95875100 -2.40710700
H -1.31606100 1.16836500 -1.15145400
H 0.12390200 -0.41096900 -5.55347900
H -6.83608100 3.35505400 0.28721000
H -5.81057200 3.01467800 -1.10661900
H -4.82610900 3.05825000 1.80082000
H -5.33964000 1.61195000 0.93555600
H -2.83948800 1.74432500 2.15267700
H -1.57568000 1.87657700 0.96007200
H -4.44327100 4.97590800 -0.63804300
H 4.64332800 3.13320000 -2.19914700
H 3.31452200 3.16219500 -3.34217800
H 2.75333300 5.49939000 -2.28269100
H 4.05448900 -0.55923500 5.78439500
H 4.78594900 -1.64030800 4.61566300
H 4.00011800 -1.17695600 1.84137100
H 0.99103000 1.65003900 2.69882000
H 6.48179800 -0.08357300 5.54225200
H 0.75769900 2.62784200 0.13223600
H 5.86345500 -1.59213300 -2.20566700
H 2.31790500 1.20806100 4.86965400
H -2.36161700 0.05205700 -3.12750000
H 5.06888400 -5.82742500 0.32473800
Electronic Supplementary Material (ESI) for Chemical CommunicationsThis journal is © The Royal Society of Chemistry 2013

37
H 3.72954200 -5.52891400 -0.76880200
H 4.06806800 5.39135200 -3.44637000
H 4.40380200 5.50696000 -1.73768900
H -0.64398800 -1.47989100 -6.64201400
H -1.59420700 -0.31382800 -5.69516400
H 5.59303400 1.28514900 5.04489400
H 6.30964300 0.17995000 3.84688900
H -7.27917200 -5.38110500 -0.37725900
H -5.85599900 -5.49343300 0.66385800
H -5.30625200 5.38798100 0.76707400
H -6.07713100 5.47825300 -0.84630500
Table S4b. Computationally-derived Coordinates for the reduced MnSODcd
O 0.24045400 2.22390700 -0.26041300
C 4.54427900 -5.04870200 1.11593700
C 5.39701000 -4.18520000 0.16223800
C 4.63659500 -2.96282100 -0.26084900
C 3.38638400 -2.49338700 0.08653100
N 5.16677300 -1.97218900 -1.08985600
C 4.25990500 -0.95650400 -1.21061200
N 3.16274900 -1.24052600 -0.50095600
C -6.49153200 -4.73333300 1.07278400
C -5.78445400 -3.74350600 0.10221500
C -5.39307800 -2.47253300 0.84157000
C -6.39949100 -1.58057600 1.25852500
C -4.06956000 -2.18941700 1.21715800
C -6.10533100 -0.46022900 2.03826300
C -3.75644500 -1.06984900 1.99882200
C -4.78031100 -0.21829700 2.41493200
O -4.42589800 0.91364400 3.18197900
C -0.46950700 -2.35073800 -5.41301900
C -0.67352400 -3.08832600 -4.06535900
C -0.61981500 -2.13274000 -2.91577800
C 0.37999900 -1.86911000 -2.01245200
N -1.58270300 -1.14597200 -2.68004000
C -1.14963800 -0.32481500 -1.67960600
N 0.05178400 -0.73815700 -1.25146600
C -5.23605100 4.68551800 -1.56154100
C -5.60595100 3.25430600 -1.11601900
C -4.87105600 2.76491000 0.15134900
C -3.35379800 2.56648500 0.10877800
N -2.77253900 2.36045100 1.31804000
O -2.65410100 2.55383200 -0.95238100
Electronic Supplementary Material (ESI) for Chemical CommunicationsThis journal is © The Royal Society of Chemistry 2013

38
C 3.97675300 4.32501500 -3.53845600
C 3.86524000 2.86625400 -3.08533500
C 2.84159600 2.63064900 -1.98781600
O 2.03845500 3.54054200 -1.60710100
O 2.82255300 1.41334300 -1.50105300
C 5.80779300 1.27947900 4.69612500
C 4.48009500 0.48285700 4.81545500
C 3.50904300 0.76789500 3.70269300
C 3.13561000 0.03479400 2.59876400
N 2.79145700 1.96598200 3.58845200
C 2.02922100 1.92631200 2.45555500
N 2.21676800 0.76015400 1.82626500
Mn 1.57984800 0.40107700 -0.23106400
H 6.32129700 -3.87257900 0.66992300
H 5.71211600 -4.77138000 -0.71213400
H 2.63689500 -2.96023000 0.70149700
H 4.39195600 -0.04955300 -1.77309800
H 3.99578300 -4.37522300 1.74086400
H -6.47119800 -3.49004400 -0.71643500
H -4.90399700 -4.20811300 -0.35714300
H -7.43152100 -1.77056700 0.97822100
H -3.27274500 -2.86285500 0.91491900
H -6.89928100 0.21340300 2.34960800
H -2.73710000 -0.86646000 2.30562500
H -5.17947700 1.24166500 3.70953300
H -7.06147300 -4.12475800 1.74333200
H 0.11341700 -3.83680800 -3.92331700
H -1.62448600 -3.63776300 -4.08074200
H 1.31431400 -2.38237200 -1.87652900
H -1.69939800 0.54013800 -1.34286100
H 0.41860500 -1.75495200 -5.37811200
H -6.68024900 3.18814200 -0.89726400
H -5.41221200 2.55702800 -1.94103900
H -5.08405400 3.45530300 0.97959700
H -5.29665000 1.79487400 0.44903700
H -3.31843000 2.14187900 2.14858000
H -1.76819300 2.24469500 1.35370200
H -4.24896100 4.61930300 -1.96871500
H 4.82700400 2.46385700 -2.74196400
H 3.55729600 2.22401600 -3.92395400
H 2.99571700 4.74735500 -3.47461900
H 4.00697500 0.69847200 5.78350900
H 4.69025200 -0.59223400 4.81276100
H 3.46749900 -0.94411100 2.30204600
Electronic Supplementary Material (ESI) for Chemical CommunicationsThis journal is © The Royal Society of Chemistry 2013

39
H 1.38741100 2.71971300 2.11276100
H 6.45574600 1.10897300 5.53042100
H 0.86409700 2.89864500 -0.71353300
H 6.07689200 -1.99694500 -1.52354000
H 2.83526300 2.73932000 4.23448400
H -2.45125900 -1.03639300 -3.18071100
H 5.15192700 -5.67886000 1.73120000
H 3.84691600 -5.63883000 0.55888800
H 4.34269200 4.37426200 -4.54274200
H 4.62980700 4.87906700 -2.89699600
H -0.32528800 -3.04482200 -6.21449500
H -1.29402200 -1.69200000 -5.58938800
H 5.59172200 2.32737500 4.70586800
H 6.33450100 0.97620700 3.81551400
H -7.16692100 -5.39964900 0.57800600
H -5.77543600 -5.27050600 1.65892800
H -5.14932000 5.34358300 -0.72215100
H -5.87265200 5.06139000 -2.33511000
H -0.68958200 2.35574100 -0.57204600
Table S4c. Computationally-derived Coordinates for the oxidized Fe-sub-MnSODcd
Fe 1.59477200 0.54314000 -0.14760600
O 0.38735900 1.83971600 0.42424900
C 4.42550800 -5.03879800 0.07240400
C 5.26362300 -4.02543600 -0.73629800
C 4.51891100 -2.73711200 -0.91886700
C 3.31451800 -2.29306200 -0.41480600
N 5.03517500 -1.64248100 -1.61726200
C 4.17002100 -0.59302500 -1.51141900
N 3.11221000 -0.95465100 -0.77747100
C -6.55701200 -4.82247400 0.34843400
C -5.85768300 -3.68059300 -0.43892200
C -5.29981100 -2.61763400 0.49665900
C -6.18097300 -1.82677400 1.25723500
C -3.92115700 -2.41320500 0.67400500
C -5.71055200 -0.87803600 2.16776400
C -3.43228800 -1.46308700 1.57892000
C -4.33170700 -0.70307700 2.32833100
O -3.80381200 0.25620500 3.21300600
C -0.70724700 -1.24295400 -5.63608500
C -0.86947400 -2.21346600 -4.43583400
C -0.67956400 -1.45803800 -3.15538200
C 0.38187700 -1.41632100 -2.28660300
Electronic Supplementary Material (ESI) for Chemical CommunicationsThis journal is © The Royal Society of Chemistry 2013

40
N -1.52121600 -0.41658000 -2.74011500
C -0.97187200 0.22433700 -1.67804100
N 0.20094500 -0.36567700 -1.37307400
C -5.34435700 4.94180400 -0.37113900
C -5.72673700 3.45300300 -0.23913700
C -4.82768000 2.63993300 0.71276900
C -3.40094200 2.38410100 0.22220000
N -2.48923500 2.08169800 1.18441600
O -3.08732500 2.40820200 -1.00264300
C 3.80874900 5.00989600 -2.55933500
C 3.68051500 3.48823000 -2.43575800
C 2.67801400 3.04767000 -1.38839300
O 1.87550100 3.81717000 -0.81918500
O 2.70957800 1.72159500 -1.15866700
C 5.75923200 0.30483000 4.79119400
C 4.46339400 -0.54425400 4.75087700
C 3.47603900 -0.10801100 3.71053900
C 3.32174400 -0.45845600 2.39033200
N 2.48673300 0.85644800 3.94189700
C 1.77956300 1.06253700 2.79974200
N 2.26580600 0.27257900 1.82897600
H -6.58800000 -3.21633700 -1.11610600
H -5.05773000 -4.08350800 -1.07196600
H -7.25311800 -1.95364100 1.13847300
H -3.21633700 -3.01084800 0.10266100
H -6.41263100 -0.27906500 2.74221400
H -2.36808100 -1.31090300 1.71568700
H -4.48549900 0.57079000 3.83820100
H -7.10079900 -4.35869500 1.14464600
H -6.76108900 3.36425700 0.11959200
H -5.69188900 2.98641800 -1.23110000
H -4.78247800 3.12729100 1.69632500
H -5.28495500 1.65209100 0.87366800
H -2.79132600 1.84214200 2.12054200
H -1.50799700 1.93591700 0.93358500
H -4.36156300 4.99629000 -0.79036400
H 0.59379200 2.76728300 0.13744600
H 3.88289300 -4.49575000 0.81756300
H 6.20531900 -3.81652100 -0.20762700
H 5.54774600 -4.45136500 -1.70825900
H 2.59003200 -2.82380300 0.17714600
H 5.91235000 -1.62751800 -2.11529700
H 4.31114500 0.38462900 -1.93339800
H 0.17100500 -0.65306800 -5.47561200
Electronic Supplementary Material (ESI) for Chemical CommunicationsThis journal is © The Royal Society of Chemistry 2013

41
H -0.11622600 -3.00713400 -4.47992800
H -1.84878200 -2.70794100 -4.47159500
H 1.26144100 -2.03296700 -2.27163400
H -2.40011800 -0.14834600 -3.15795500
H -1.42571800 1.09295800 -1.21875300
H 2.83712800 5.42814500 -2.39884200
H 4.64158600 3.00789200 -2.21314600
H 3.33848500 3.05028600 -3.38556900
H 6.38868700 -0.04204100 5.58421500
H 3.98424500 -0.52919400 5.73875300
H 4.72566900 -1.59114300 4.56000600
H 3.88694300 -1.16766100 1.81460700
H 2.32213200 1.32521300 4.82005800
H 0.96389800 1.75116900 2.66678500
H 4.18185200 5.26142200 -3.53018200
H 4.47458800 5.40126700 -1.81879100
H 6.30356900 0.20977600 3.87503600
H 5.54862700 1.32693000 5.02708800
H 5.05387300 -5.76912200 0.53763300
H 3.71787000 -5.52407300 -0.56724000
H -1.54562600 -0.57863700 -5.66157100
H -0.56744100 -1.74315100 -6.57152400
H -7.24200800 -5.37803200 -0.25756800
H -5.83226100 -5.46706600 0.80021200
H -5.26553400 5.42127200 0.58205700
H -6.02096600 5.44484000 -1.03036900
Table S4d. Computationally-derived Coordinates for the reduced Fe-sub-MnSODcd
Fe -1.58470200 -0.38500700 -0.26899400
O -0.23546700 -2.20782900 -0.16517800
C -4.46146400 4.99807600 1.06656300
C -5.33482200 4.14431100 0.12245300
C -4.60136400 2.91094400 -0.30902500
C -3.35074600 2.42937100 0.01830300
N -5.16193300 1.91937500 -1.11440100
C -4.27030300 0.88859000 -1.23888700
N -3.15731200 1.16567100 -0.55403700
C 6.52214900 4.72068800 0.94662400
C 5.79581700 3.71893200 0.00310300
C 5.38504200 2.47136200 0.77137500
C 6.37836800 1.58048900 1.22085100
C 4.05449500 2.20707000 1.13586300
C 6.06490500 0.48001900 2.02107300
Electronic Supplementary Material (ESI) for Chemical CommunicationsThis journal is © The Royal Society of Chemistry 2013

42
C 3.72198400 1.10731900 1.93748600
C 4.73321500 0.25688900 2.38567300
O 4.35961100 -0.85404300 3.17362000
C 0.46285800 2.28367100 -5.39320000
C 0.67486600 3.04852700 -4.06007800
C 0.60825400 2.10655500 -2.89699000
C -0.41309200 1.83151200 -2.02145300
N 1.57764500 1.13335900 -2.62778900
C 1.12731800 0.31029000 -1.63748300
N -0.09284400 0.70738700 -1.24677700
C 5.21675200 -4.75312200 -1.47501400
C 5.55378500 -3.30215400 -1.06749200
C 4.81511600 -2.79424300 0.19016500
C 3.30071900 -2.58134000 0.13098100
N 2.70972500 -2.33833900 1.32831600
O 2.61198700 -2.58745700 -0.93789200
C -3.99884800 -4.41396300 -3.34486800
C -3.85195300 -2.93968800 -2.95706800
C -2.82262500 -2.67099400 -1.87502900
O -2.10963500 -3.58883200 -1.36629100
O -2.71132800 -1.40483700 -1.53613900
C -5.68496200 -1.10370600 4.78835000
C -4.35118700 -0.30829300 4.80160700
C -3.42950700 -0.63359700 3.65574700
C -3.08780600 0.07221200 2.52439000
N -2.71453200 -1.83507100 3.54787300
C -1.98460400 -1.82266900 2.39413400
N -2.19079500 -0.67166500 1.74196200
H 6.47600200 3.43514800 -0.81124100
H 4.92172100 4.18692300 -0.46501000
H 7.41541200 1.75512200 0.94926500
H 3.26708600 2.87967900 0.80807800
H 6.84930900 -0.19286600 2.35721400
H 2.69702800 0.91846000 2.23464100
H 5.10619400 -1.18043600 3.71204700
H 7.08752200 4.12090800 1.62839100
H 6.62775600 -3.20783800 -0.85768600
H 5.34005800 -2.63131800 -1.90927300
H 5.01540200 -3.47754000 1.02748500
H 5.24712400 -1.82499300 0.48106200
H 3.24997700 -2.10312500 2.15767900
H 1.70525800 -2.21478800 1.34992700
H 4.22211200 -4.73017400 -1.86630900
H -0.87892100 -2.90598700 -0.53407300
Electronic Supplementary Material (ESI) for Chemical CommunicationsThis journal is © The Royal Society of Chemistry 2013

43
H -3.89986800 4.33020500 1.68387200
H -6.25798500 3.84614900 0.64089700
H -5.65169700 4.73665000 -0.74719300
H -2.58244600 2.89443200 0.61100100
H -6.07896900 1.95263700 -1.53238900
H -4.42570900 -0.01456200 -1.79951900
H -0.41445400 1.67554900 -5.31271300
H -0.10647800 3.80517700 -3.93100800
H 1.63050200 3.58903600 -4.08092300
H -1.35918200 2.32974700 -1.91797100
H 2.46102700 1.03250900 -3.10385600
H 1.67829200 -0.54663200 -1.28376500
H -3.02647400 -4.85572900 -3.29420000
H -4.80606800 -2.50567500 -2.62820400
H -3.53894300 -2.34003100 -3.82382800
H -6.28711400 -0.90407500 5.65131900
H -3.82928300 -0.48427900 5.75262300
H -4.56127800 0.76632200 4.76612900
H -3.42967800 1.04338300 2.21599100
H -2.74039900 -2.59408900 4.21158900
H -1.34516700 -2.61872700 2.05420400
H -4.40498700 -4.48662800 -4.33314100
H -4.64521000 -4.93111600 -2.66667200
H -6.25759000 -0.84448300 3.92305200
H -5.47483000 -2.15174900 4.83112300
H -5.06983800 5.63525300 1.67442500
H -3.77122200 5.59069500 0.50165100
H 1.29482500 1.63310000 -5.56384800
H 0.29690800 2.94376300 -6.21821400
H 7.19190100 5.37547300 0.42835000
H 5.81666200 5.27512300 1.52937200
H 5.16588900 -5.39629200 -0.62182900
H 5.86986600 -5.13078900 -2.23546600
H 0.66701200 -2.34668900 -0.54911400
Table S4e. Computationally-derived Coordinates for the oxidized Co-sub-MnSODcd
C -3.64429200 5.10206100 -1.01076400
C -4.51646400 4.04445300 -1.71059800
C -3.92036400 2.67417000 -1.60694800
C -2.90007100 2.16401900 -0.83945500
N -4.42763200 1.57395700 -2.27958600
C -3.73118100 0.47138200 -1.90388500
N -2.79495000 0.79726800 -1.02642200
Electronic Supplementary Material (ESI) for Chemical CommunicationsThis journal is © The Royal Society of Chemistry 2013

44
C 7.21827500 4.04910300 0.30698500
C 6.48315300 2.92239100 -0.45401800
C 5.31395200 2.30201600 0.28438300
C 5.50875000 1.28187100 1.22792300
C 3.99408900 2.71216000 0.04005400
C 4.43290000 0.67212200 1.87673200
C 2.90507200 2.10137200 0.66877700
C 3.12391400 1.05977000 1.57270400
O 2.02938900 0.43507800 2.14465200
C 1.53844000 -0.10551300 -5.49041600
C 1.65509900 1.03099000 -4.44347000
C 1.21779400 0.54214200 -3.09591700
C 0.03852400 0.69415500 -2.41304100
N 1.93217500 -0.39282500 -2.35689400
C 1.20110800 -0.77435000 -1.29559200
N 0.03241600 -0.13194400 -1.29442000
C 5.80372200 -4.18246200 1.02861700
C 4.81627800 -3.19025700 1.68609700
C 3.49180300 -2.90703400 0.99555700
N 2.42665200 -2.66813400 1.84771400
O 3.37984600 -2.76956600 -0.22095800
C -3.66783900 -5.31004100 -1.89072400
C -3.44594300 -3.80377300 -2.00899000
C -2.67135200 -3.19605700 -0.85075700
O -2.12364800 -3.86550100 0.02467100
O -2.64291500 -1.87608600 -0.90383500
C -5.76803600 0.63870700 4.41232100
C -4.42217800 1.39209800 4.43550800
C -3.36857700 0.90677400 3.47377000
C -3.40043800 0.36224300 2.21244600
N -2.01394500 1.05192400 3.75084700
C -1.28546300 0.60239300 2.70347700
N -2.10396600 0.18184100 1.74693900
H -5.51382000 4.02514300 -1.24956100
H -4.67473300 4.31174500 -2.76345400
H -2.24460400 2.68400100 -0.15891900
H -3.91927000 -0.52514800 -2.26839300
H -3.22563100 4.66763800 -0.12713100
H 7.20517300 2.13511600 -0.70508600
H 6.12360600 3.32282400 -1.40993000
H 3.80812400 3.50929000 -0.67631600
H 6.51891500 0.94937000 1.45577400
H 1.88819400 2.40739900 0.44226700
H 4.60707500 -0.10641700 2.61439800
Electronic Supplementary Material (ESI) for Chemical CommunicationsThis journal is © The Royal Society of Chemistry 2013

45
H 2.23672800 -0.50793600 2.27735300
H 7.65980300 3.67928000 1.20850500
H 1.00599500 1.86702100 -4.72229200
H 2.67671000 1.42832000 -4.40480700
H -0.80353200 1.32049300 -2.65783200
H 1.54125400 -1.51134300 -0.58833500
H 0.60539100 -0.60009200 -5.31777900
H 6.62131400 -4.18144900 1.71901500
H 5.97446000 -3.95606300 -0.00305100
H 4.63197000 -3.49861600 2.72235800
H 5.30803800 -2.20991000 1.74840900
H 2.45892700 -3.08074700 2.77081700
H 1.49103300 -2.58309200 1.44100700
H -4.39105000 -3.25680600 -2.11055900
H -2.86689600 -3.56403100 -2.91203400
H -2.74616700 -5.76697100 -1.59650800
H -4.00731800 1.34899100 5.45055700
H -4.60560500 2.45671700 4.23403600
H -4.25339200 0.08586000 1.61300900
H -0.20296400 0.59265600 2.66258800
H -6.45708800 1.14309800 5.05715400
H 1.50091300 0.26476100 -6.49354800
H 2.31850100 -0.82629300 -5.36049300
H 6.52892100 4.82416700 0.56986900
H 7.98533500 4.44006600 -0.32861700
H -2.83524100 5.40574900 -1.64177400
H -4.24538600 5.94169700 -0.73040000
H -5.67024300 -0.34464400 4.82257500
H -6.20271100 0.64798700 3.43464000
Co -1.45799900 -0.68691700 -0.02028900
H -4.41070400 -5.52066800 -1.14992500
H -3.99821200 -5.69076400 -2.83454500
O -0.38577900 -1.91745800 0.86823900
H -0.91936100 -2.74837100 0.86108500
H 2.86183800 -0.74411100 -2.54870000
H -1.62630100 1.42643300 4.60643100
H -5.19815600 1.58462900 -2.93388600
C 5.23953375 -5.61518050 1.05330135
H 4.57741290 -5.75210638 0.22399604
H 6.04466192 -6.31675507 0.98650504
H 4.70452563 -5.77213989 1.96655382
Electronic Supplementary Material (ESI) for Chemical CommunicationsThis journal is © The Royal Society of Chemistry 2013

46
Table S4f. Computationally-derived Coordinates for the reduced Co-sub-MnSODcd
C -3.95773300 4.94461200 1.88533200
C -4.88463400 4.32136400 0.82840900
C -4.25660200 3.11890800 0.19714700
C -3.06544300 2.47751000 0.43170400
N -4.88755500 2.33646900 -0.75513500
C -4.09555200 1.27795000 -1.04839200
N -2.97828400 1.33081800 -0.33927400
C 6.98561500 3.93427600 1.63631300
C 6.19196000 3.17464200 0.54280300
C 5.61341800 1.87392800 1.07174700
C 6.47397000 0.81474200 1.39903600
C 4.24495300 1.68863400 1.30682900
C 5.99847400 -0.37111400 1.95366900
C 3.74772500 0.50472600 1.85936200
C 4.62946400 -0.52463100 2.19327800
O 4.11055400 -1.67999300 2.74209000
C 0.80059400 2.86913400 -4.97738400
C 1.04819300 3.38534400 -3.54071200
C 0.86632600 2.30317800 -2.52194500
C -0.21628600 1.97594200 -1.75101000
N 1.77517700 1.28254400 -2.28865500
C 1.23270700 0.39570900 -1.42476800
N 0.01066600 0.78486700 -1.07558000
C 5.68431300 -3.65577400 -1.67764700
C 4.79236800 -3.13238100 -0.52038100
C 3.29765400 -2.87768300 -0.71337800
N 2.56239400 -3.06700800 0.41953900
O 2.77412700 -2.49769100 -1.76753500
C -4.01632800 -3.68799500 -4.00208800
C -3.80852800 -2.29993800 -3.40142400
C -2.83811700 -2.23596700 -2.23279400
O -2.21776300 -3.24251600 -1.83907100
O -2.70972400 -1.05125100 -1.73106500
C -5.53647500 -1.70408700 4.55831300
C -4.15949100 -1.01649200 4.72601600
C -3.26417900 -1.16549400 3.52323000
C -2.96542100 -0.32073300 2.48431900
N -2.54892300 -2.32133500 3.23455900
C -1.86755300 -2.14472800 2.07879300
N -2.09686500 -0.93341600 1.58895800
H -5.82920600 4.01407500 1.29739300
H -5.15420000 5.06268300 0.06506700
Electronic Supplementary Material (ESI) for Chemical CommunicationsThis journal is © The Royal Society of Chemistry 2013

47
H -2.26660700 2.76668000 1.09702800
H -4.33179400 0.49853600 -1.75455100
H -3.45508600 4.15492800 2.40364700
H 6.86666300 2.94817700 -0.29247800
H 5.39448000 3.80554100 0.13420700
H 3.54967500 2.49078300 1.07041200
H 7.54179800 0.91849100 1.22313600
H 2.68775400 0.38002700 2.05715200
H 6.69037700 -1.17351400 2.20150700
H 4.83514300 -2.18890200 3.13019900
H 7.51242200 3.19304300 2.20018200
H 0.33561000 4.18193200 -3.30495900
H 2.04648000 3.83273000 -3.46052400
H -1.14953100 2.50639700 -1.65767800
H 1.74821300 -0.50249100 -1.11956000
H -0.10954100 2.30682500 -4.99639000
H 6.56365900 -3.95136900 -1.14445500
H 5.75522400 -2.94463100 -2.47397200
H 4.89650800 -3.81679200 0.32919400
H 5.21092600 -2.17506100 -0.17896200
H 3.01600400 -3.05495000 1.32331700
H 1.57760000 -2.82760400 0.38833300
H -4.75512200 -1.85016700 -3.07636400
H -3.40510000 -1.60974800 -4.15424100
H -3.06873300 -4.18298600 -4.04615500
H -3.64577500 -1.41166100 5.61132500
H -4.29568000 0.05416300 4.90779200
H -3.32449500 0.68285800 2.32201100
H -1.23243400 -2.88866700 1.62340100
H -6.16351100 -1.61590600 5.42083600
H 0.66634800 3.68086900 -5.66147400
H 1.59284200 2.21782700 -5.28239600
H 6.32075000 4.44479900 2.30130500
H 7.68717300 4.62449800 1.21641500
H -3.21362300 5.55900400 1.42303200
H -4.53339500 5.50751600 2.59006500
H -5.39556600 -2.75594400 4.42175800
H -6.06196200 -1.23924700 3.75042400
Co -1.60320100 -0.26818000 -0.32875000
H -4.68450800 -4.27184100 -3.40412500
H -4.43294300 -3.57385400 -4.98102300
O -0.29182900 -2.16433000 -0.52638800
H 0.42499000 -2.16750000 -1.18480800
H -1.01797300 -2.72508300 -0.96733200
Electronic Supplementary Material (ESI) for Chemical CommunicationsThis journal is © The Royal Society of Chemistry 2013

48
H 2.69144400 1.18761300 -2.70392700
H -2.53548600 -3.16309300 3.79298400
H -5.79513000 2.51648700 -1.16041900
C 5.13146686 -4.94336923 -2.31644249
H 4.41712418 -4.68875176 -3.07128318
H 5.93461276 -5.49605524 -2.75734480
H 4.65854344 -5.53992819 -1.56453768
Electronic Supplementary Material (ESI) for Chemical CommunicationsThis journal is © The Royal Society of Chemistry 2013
49
The chemical models of MnSODcd, Fe-sub-MnSODcd and Co-sub-MnSODcd
The oxidized MnSOD The reduced MnSOD
The oxidized FeSOD The reduced FeSOD
The oxidized CoSOD The reduced CoSOD
Fig. S18. The chemical models of MnSODcd, Fe-sub-MnSODcd and Co-sub-MnSODcd
Electronic Supplementary Material (ESI) for Chemical CommunicationsThis journal is © The Royal Society of Chemistry 2013

50
Table S5. The free energy G at 298K and 101kPa of the reduced MSODcd ( M = Fe3+
,
Co2+
, Mn2+
) model and M(H2O)6 ( M = Fe3+
, Co2+
, Mn2+
) are computed at the
B3LYP/6-31+g(d,p) -6-31+g(2d,p) level.
FeSODcd [Fe(H2O)6]
3+ CoSODcd [Co(H2O)6]
2+ MnSODcd [Mn(H2O)6]
2+
Reduced -3195.6388 -1721.6998 -3314.9923 -1840.9865 -3083.2855 -1609.3078
Table S6. The reaction free energy ΔG (in kcal/mol) at 298K and 101kPa of
substitution reaction.
[Fe(H2O)6]3+
-sub-MnSODcd [Co(H2O)6]2+
-sub-MnSODcd
ΔG 24.25 -17.69
Table S7. Distance (Å) and E(2) (in kcal/mol) between proton-donor and acceptor
atoms of Fe-sub-MnSODcd, Co-sub-MnSODcd and MnSODcd.
Reactant
Gln178-N-H…O-H Gln178-N-H…O-Tyr64
distance E(2) distance E(2)
Oxidized FeSOD 1.96 4.36 2.18 2.77
Reduced FeSOD 2.46 0.74 1.95 5.87
Oxidized MnSOD 2.15 2.62 2.14 3.10
Reduced MnSOD 2.58 0.43 1.95 5.97
Electronic Supplementary Material (ESI) for Chemical CommunicationsThis journal is © The Royal Society of Chemistry 2013

51
References
1. X. Zhu, X. Gu, S. Zhang, Y. Liu, Z. X. Huang and X. Tan, Protein Expr Purif, 2011, 78,
86-93.
2. F. Yamakura, K. Kobayashi, H. Ue and M. Konno, European Journal of Biochemistry, 1995,
227, 700-706.
3. M. M. Bradford, Anal Biochem, 1976, 72, 248-254.
4. R. S. Hall, D. F. Xiang, C. Xu and F. M. Raushel, Biochemistry, 2007, 46, 7942-7952.
5. M. M. Whittaker, K. Mizuno, H. P. Bähinger and J. W. Whittaker, Biophysical Journal, 2006,
90, 598-607.
6. Y. P. Lin, C. J. Kuo, X. Koleci, S. P. McDonough and Y. F. Chang, J Biol Chem, 2011, 286,
3957-3969.
7. G. W. T. M.J. Frisch, H.B. Schlegel, G.E. Scuseria, M.A. Robb, J.R. Cheesman, J.A.
Montgomery, Jr., T. Vreven, K.N. Kudin, J.C. Burant, J.M. Millam, S.S. Iyengar, J. Tomasi,
V.Barone, B. Mennucci, M. Cossi, G. Scalmani, G.A. Petersson, H. Nakatsuji, M. Hada, M.
Ehara, K. Toyota, R. Fukuda, J. Hasegawa, M. Ishoda, T. Nakajima, Y. Honda, O. Kitao, H.
Nakai, M. Klene, X. Li, J.E. Knox, H.P. Hratchian, J.B.Cross, C. Adamo, J. Jaramillo, R.
Gomperts, R.E. Stratmann, O. Yazyev, A.J. Austin, R. Cammi, C.Pomelli, J. Otcherski, P.Y.
Ayala, K. Morokuma, G.A. Voth, P.Salvador, J.J. Danneberg, V.G. Zakrzewski, S. Dapprich,
A.D. Daniels, M.C. Strain, O. Farkas, D.K. Malick, A.D. Rabuck, K. Raghavachari, J.B.
Foresman, J.V. Ortiz, Q. Cui, A. Baboul, S. Clifford, J. and B. B. S. Cioslowski, G. Liu, A.
Liashenko, P. Piskorz, I. Kamaromi, L.R. Martin, D.J. Fox, T. Keith, M.A. Al- Laham, C.Y.
Peng, A. Nanaykkara, M. Challacombe, P.M.W. Gill, B. Johnson, W. Chen, M.W. Wong, G.
Gonzalez, J.A. Pople, Gaussian Inc., 2003.
8. M. Ando, Y. C. Manabe, P. J. Converse, E. Miyazaki, R. Harrison, J. R. Murphy and W. R.
Bishai, Infect Immun, 2003, 71, 2584-2590.
9. M. Osawa, F. Yamakura, M. Mihara, Y. Okubo, K. Yamada and B. Y. Hiraoka, Biochim
Biophys Acta, 2010, 9, 6.
10. J. M. McCord and I. Fridovich, J Biol Chem, 1969, 244, 6049-6055.
11. M. S. Lah, M. M. Dixon, K. A. Pattridge, W. C. Stallings, J. A. Fee and M. L. Ludwig,
Biochemistry, 1995, 34, 1646-1660.
12. G. J. McClune and J. A. Fee, Biophys J, 1978, 24, 65-69.
13. S. Marklund, J Biol Chem, 1976, 251, 7504-7507.
14. Z. Otwinowski and W. Minor, in Methods in Enzymology, ed. Charles W. Carter, Jr.,
Academic Press, 1997, pp. 307-326.
15. A. Vagin and A. Teplyakov, Journal of Applied Crystallography, 1997, 30, 1022-1025.
16. P. Liu, H. E. Ewis, Y. J. Huang, C. D. Lu, P. C. Tai and I. T. Weber, Acta Crystallogr Sect F
Struct Biol Cryst Commun, 2007, 63, 1003-1007.
17. G. N. Murshudov, A. A. Vagin and E. J. Dodson, Acta Crystallogr D Biol Crystallogr, 1997,
53, 240-255.
18. P. Emsley and K. Cowtan, Acta Crystallogr D Biol Crystallogr, 2004, 60, 2126-2132.
19. P. D. Adams, P. V. Afonine, G. Bunkoczi, V. B. Chen, I. W. Davis, N. Echols, J. J. Headd, L.
W. Hung, G. J. Kapral, R. W. Grosse-Kunstleve, A. J. McCoy, N. W. Moriarty, R. Oeffner, R.
Electronic Supplementary Material (ESI) for Chemical CommunicationsThis journal is © The Royal Society of Chemistry 2013
52
J. Read, D. C. Richardson, J. S. Richardson, T. C. Terwilliger and P. H. Zwart, Acta
Crystallogr D Biol Crystallogr, 2010, 66, 213-221.
20. R. A. Laskowski, M. W. MacArthur, D. S. Moss and J. M. Thornton, Journal of Applied
Crystallography, 1993, 26, 283-291.
21. M. Pasi, M. Tiberti, A. Arrigoni and E. Papaleo, J Chem Inf Model, 2012, 5, 5.
22. M. A. Walsh, G. Evans, R. Sanishvili, I. Dementieva and A. Joachimiak, Acta
Crystallographica Section D, 1999, 55, 1726-1732.
23. M. T. Stankovich, Anal Biochem, 1980, 109, 295-308.
24. V. J. Leveque, C. K. Vance, H. S. Nick and D. N. Silverman, Biochemistry, 2001, 40,
10586-10591.
25. N. B. Surmeli, N. K. Litterman, A.-F. Miller and J. T. Groves, Journal of the American
Chemical Society, 132, 17174-17185.
26. K. B. Oldham and C. G. Zoski, in Comprehensive Chemical Kinetics, eds. C. H. Bamford and
R. G. Compton, Elsevier, 1986, pp. 79-143.
27. B. M. E. Cances, J. Tomasi, J. Chem. Phys., 1997, 107, 3032-3041.
28. V. B. M. Cossi, B Mennucci, J. Tomasi, ChemPhysLett, 1998, 286, 253-260.
29. A. D. Becke, Phys Rev A, 1988, 38, 3098-3100.
30. A. D. Becke, J. Chem. Phys., 1993, 98, 1372 - 1377.
31. A. D. Becke, J. Chem. Phys., 1993, 98, 5648 - 5652.
32. J. Almlöf, Taylor, PR., Adv Quant Chem, 1991, 22, 301.
33. C. Geslin, J. Llanos, D. Prieur and C. Jeanthon, Res Microbiol, 2001, 152, 901-905.
34. E. D. Glendening, C. R. Landis and F. Weinhold, Wiley Interdisciplinary Reviews:
Computational Molecular Science, 2012, 2, 1-42.
35. D. W. Cruickshank, Acta Crystallogr D Biol Crystallogr, 1999, 55, 583-601.
36. J. J. Perry, A. S. Hearn, D. E. Cabelli, H. S. Nick, J. A. Tainer and D. N. Silverman,
Biochemistry, 2009, 48, 3417-3424.
37. M. M. Whittaker and J. W. Whittaker, Biochemistry, 2008, 47, 11625-11636.
38. B. Prieto-Simón, M. Cortina, M. Campàs and C. Calas-Blanchard, Sensors and Actuators B:
Chemical, 2008, 129, 459-466.
39. Y. Tian, L. Mao, T. Okajima and T. Ohsaka, Anal Chem, 2004, 76, 4162-4168.
40. Y. L. Sun, Y. H. Wang, M. M. Yan, B. Y. Sun, Y. Xie, Z. X. Huang, S. K. Jiang and H. M.
Wu, J Mol Biol, 1999, 285, 347-359.
Electronic Supplementary Material (ESI) for Chemical CommunicationsThis journal is © The Royal Society of Chemistry 2013
Top Related