


Languages
Pages
Legal


1
Supplemental Data
Development of CD11b-IRF8 transgenic and MTAG double transgenic mice The CMV-
IRF8 transgenic mouse was previously developed by cloning complementary DNA, containing
the IRF-8 coding sequence, into pcDNA3.1+ under control of the CMV promoter (24). To
produce the CD11b-IRF8 transgenic mouse, we replaced the CMV promoter and transcription
initiation region with the murine CD11b promoter and accompanying transcription initiation
region. Using the genomic DNA purified from normal mouse cells, the mouse CD11b promoter
(-2000 to -1), including the 5’-untranslated region was amplified by PCR. Following subcloning,
the resultant 4.3 kb fragment, which contained the functional transcriptional unit (i.e., promoter,
gene, poly A sites) was purified and then microinjected into the pronuclei of one cell embryos of
fertilized eggs from B6 mice to obtain several founder mice. Transgene integration in progeny
was verified by Southern blot analysis using the 4.3 kb fragment as the probe and PCR
genotyping of tail snips.
Progeny for experimental studies were produced by mating IRF-8-Tg male mice with
either wild-type female B6 or BALB/c mice. The founder lines, 370 and 371, were selected for
this study based on the highest IRF-8 copy number and mRNA levels and in initial experiments
both behaved similarly in their ability to attenuate MDSC effects. No atypical effects of IRF-8
transgene expression were observed on diverse hematologic parameters, including phenotypic
analysis of the spleen, complete blood count (CBC) on peripheral whole blood and morphologic
analyses of the bone marrow (see Supplemental Figure 2 and Table IV). To develop double-Tg
mice expressing transgenes for both MTAG and IRF-8, male MTAG mice were bred with female
CD11b-IRF8 Tg mice. To ensure that the transgenes for both IRF-8 and spontaneous mammary

2
carcinoma development (i.e., MMTV-PyMT) were expressed, PCR analysis for IRF-8 and
MTAG expression of tail snip DNA was conducted using the conditions mentioned in the
PCR/RT-PCR section below. For simplicity, single-Tg refers to MTAG mice, whereas double-
Tg refers to MTAG/CD11b-IRF8 Tg mice.
Molecular analyses. RNA was isolated using RNeasy Mini kits (Qiagen; Valencia, CA).
cDNA was synthesized using the iScript cDNA synthesis kit (Bio-Rad, Hercules, CA). The
cDNA was then used for RT-PCR and qPCR analysis. RT-PCR was conducted on a PTC-200
thermal cycler (MJ Research, Waltham, MA) under the following standard conditions: 94oC for
2 min, 30 cycles (94oC for 30 sec, 60
oC for 30 sec and 72
oC for 1 min) and 72
oC for 10 min. The
following mouse primer sets were used: GAPDH forward: 5’-CATCACCATCTTCC
AGGAGCG-3' and reverse: 5'-ACGGACACATTGGGGGTAGG -3', IRF-8 forward: 5’-
CGTGGAAGACGAGGTTACGCTG-3’; reverse: 5’-GCTGAATGGTGTGTGTCATAGGC-3’;
C/EBP forward: 5’-AGCCCCTACCTGGAGCCGCTCGCG-3’ and reverse: 5’-
GCGCAGGGCGAACGGGAAACCG-3’. All qPCR reactions were conducted on an ABI
PRISM 7900HT Sequence Detection System (Applied Biosciences, Carlsbad, CA) using RT2
SYBR Green mastermix (Qiagen, Valencia, CA). The following primer sets were used for qPCR:
IRF-8 forward 5’-TGGAAGCATCCACCTCCTGATTGT-3’ and reverse 5’-
TGATCGAACAGATCG ACAGCAGCA-3’; GAPDH as previously indicated.
For genotyping, genomic DNA was extracted from tail tissue using DirectPCR tail
digestion (Viagen, Los Angeles, CA). MTAG transgene expression was determined using the
forward: 5'-AGTCACTGCTACTGCACCCAG-3' and reverse: 5'-CTCTCCTCAGTTCCTCGC

3
TCC-3' primer set. For IRF-8-/-
mice, genotyping was determined using the following primers:
5’-CATGGCACTGGTCCAGATGTCTTCC-3’, 5’-CTTCCAGGGATACGGAACATG GTC-3’
and 5’-CGAAGGAGCAAAGCTGCTATTGGCC. PCR products were separated on a 1%
agarose gel and the images captured with the Chemidoc Imaging System (BioRad).
For the ChIP studies, STAT3 occupation of the IRF-8 promoter was determined using the
following primer set (-1398 to -1223); forward 5’-ACTGGGTGGACATTTGGGATCTGT-3’
and reverse 5’-AAGTGTTTGCTGTGAAGGGCAGAG-3’. STAT5 occupation of the IRF-8
promoter was analyzed using the following primer set (-677 to -372): forward 5’-
CTGCAACGAAAGTCCCTCTC-3’ and reverse 5’-CTGAGTGTCAGCTGCTCAGG-3’.
Microarray analysis. Total RNA of flow-purified CD11b+ Gr-1
+ cells from naïve B6,
IRF-8-/-
or AT-3 tumor-bearing mice (~1500 mm3) was extracted and quantified using a ND-
1000 spectrophotometer (NanoDrop, Thermo Scientific). Quality control and direct hybridization
to the MouseWG-6 whole-genome gene expression array was conducted and analyzed, as
described.30
All data is MIAME compliant.

4
Supplemental Figures
1 2 3 4 5
Supplemental Figure 1. Gating strategy for purification of the different MDSC subsets
Upper, non-tumor-bearing control mice; lower, AT-3 tumor-bearing mice. Splenocytes from the
indicated groups of mice were collected and enriched for CD11b+ cells using magnetic bead
separation methods. Cells from each group were then triple-stained for CD11b (APC), Ly6C
(FITC) and Ly6G (PE) expression prior to flow sorting. Next, 1) live cell gate was established;
2) live cells were gated on the CD11b+ fraction; 3) gated CD11b+ fraction was plotted in relation
to Ly6C and Ly6G expression to identify the two non-overlapping subsets prior to sorting; 4)
post-sort collection of the CD11b+Ly6G-Ly6C+ monocytic fraction; and 5) post-sort collection of
the CD11b+Ly6G+Ly6Clo granulocytic fraction. In all cases, cell purity was > 97% for the
intended subset with < 0.3% contamination of the opposing subset.

5
A C
B 1 2 3
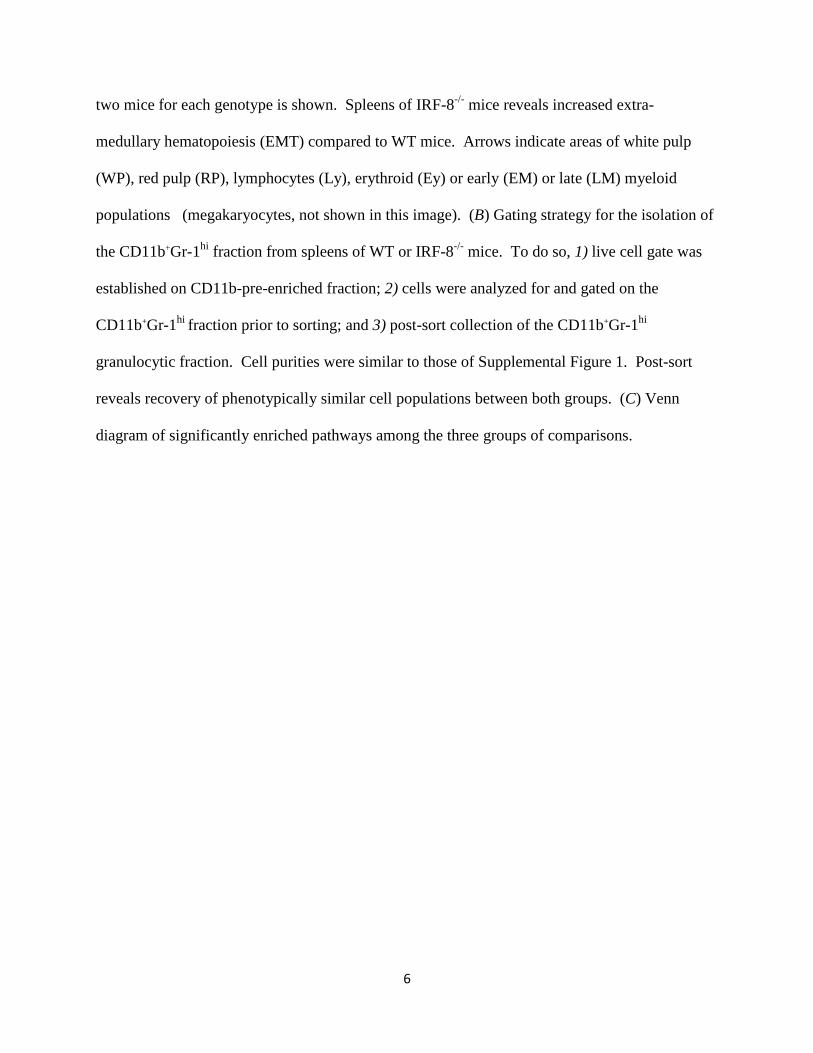
Supplemental Figure 2. IRF-8-deficiency results in the accumulation of MDSC-like cells.
(A) H&E staining of spleens of IRF-8-/-
(age=194 days) and WT (age=174 days) mice. One of
6
two mice for each genotype is shown. Spleens of IRF-8-/-
mice reveals increased extra-
medullary hematopoiesis (EMT) compared to WT mice. Arrows indicate areas of white pulp
(WP), red pulp (RP), lymphocytes (Ly), erythroid (Ey) or early (EM) or late (LM) myeloid
populations (megakaryocytes, not shown in this image). (B) Gating strategy for the isolation of
the CD11b+Gr-1hi
fraction from spleens of WT or IRF-8-/-
mice. To do so, 1) live cell gate was
established on CD11b-pre-enriched fraction; 2) cells were analyzed for and gated on the
CD11b+Gr-1hi
fraction prior to sorting; and 3) post-sort collection of the CD11b+Gr-1hi
granulocytic fraction. Cell purities were similar to those of Supplemental Figure 1. Post-sort
reveals recovery of phenotypically similar cell populations between both groups. (C) Venn
diagram of significantly enriched pathways among the three groups of comparisons.
7
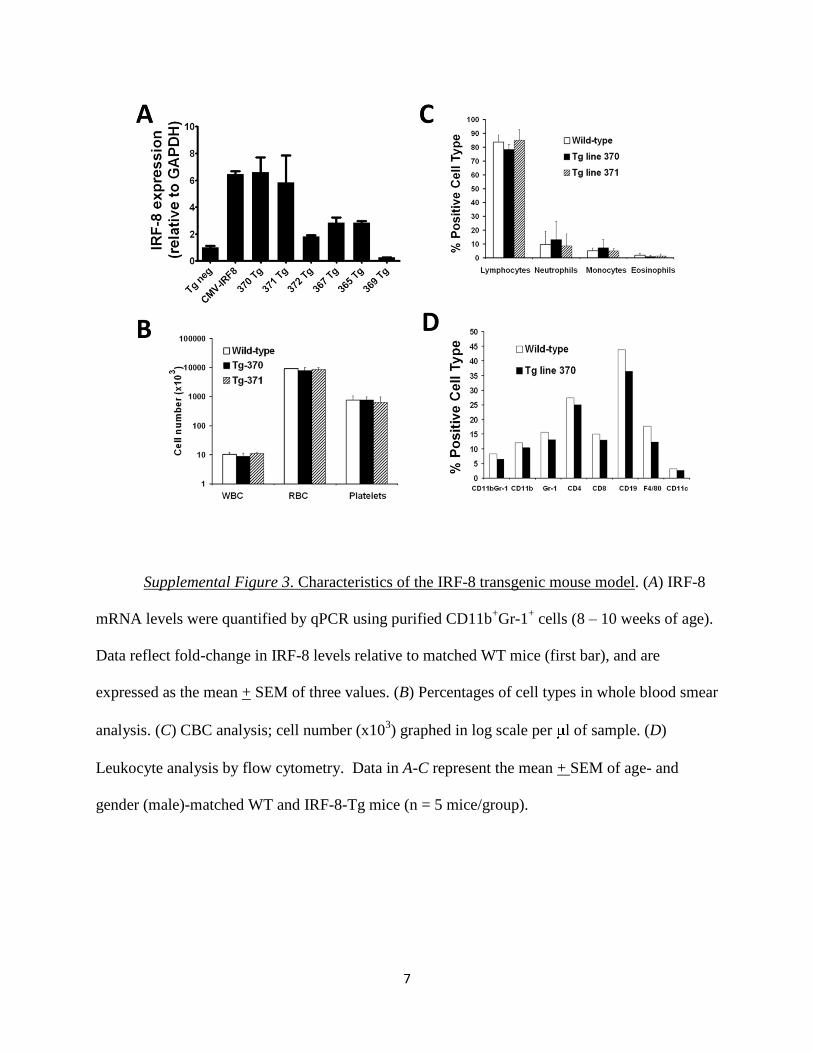
Supplemental Figure 3. Characteristics of the IRF-8 transgenic mouse model. (A) IRF-8
mRNA levels were quantified by qPCR using purified CD11b+Gr-1
+ cells (8 – 10 weeks of age).
Data reflect fold-change in IRF-8 levels relative to matched WT mice (first bar), and are
expressed as the mean + SEM of three values. (B) Percentages of cell types in whole blood smear
analysis. (C) CBC analysis; cell number (x103) graphed in log scale per l of sample. (D)
Leukocyte analysis by flow cytometry. Data in A-C represent the mean + SEM of age- and
gender (male)-matched WT and IRF-8-Tg mice (n = 5 mice/group).
8
F
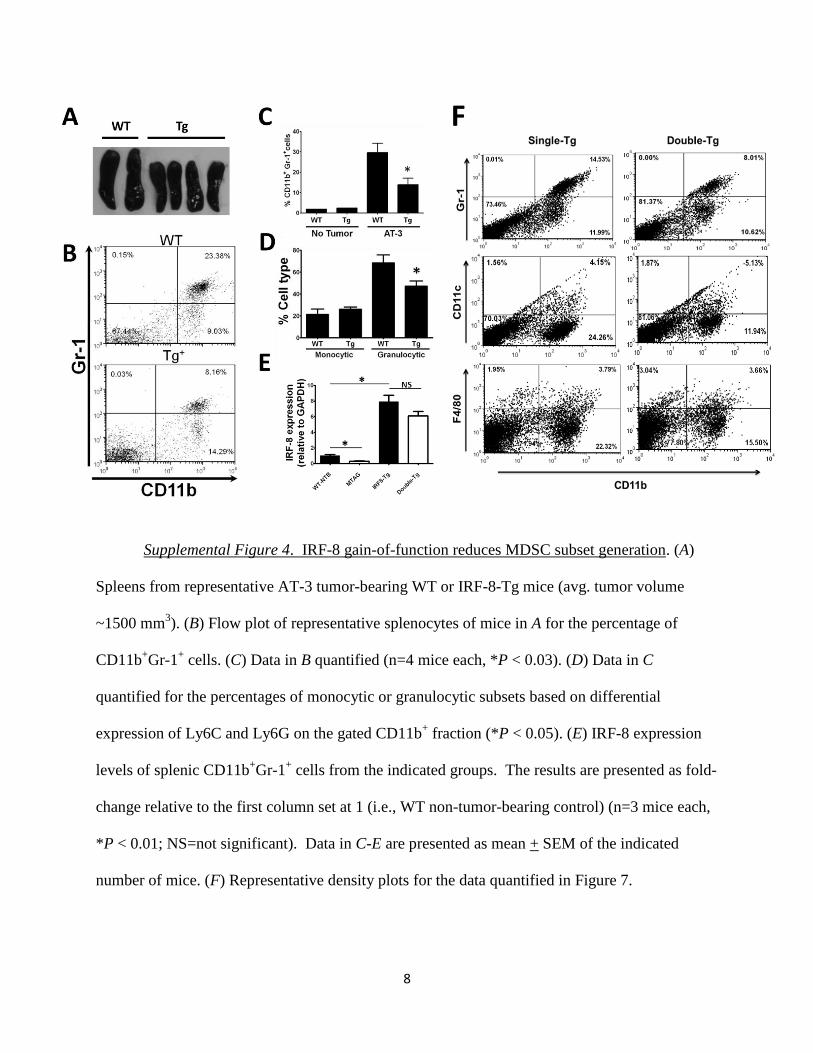
Supplemental Figure 4. IRF-8 gain-of-function reduces MDSC subset generation. (A)
Spleens from representative AT-3 tumor-bearing WT or IRF-8-Tg mice (avg. tumor volume
~1500 mm3). (B) Flow plot of representative splenocytes of mice in A for the percentage of
CD11b+Gr-1
+ cells. (C) Data in B quantified (n=4 mice each, *P < 0.03). (D) Data in C
quantified for the percentages of monocytic or granulocytic subsets based on differential
expression of Ly6C and Ly6G on the gated CD11b+ fraction (*P < 0.05). (E) IRF-8 expression
levels of splenic CD11b+Gr-1
+ cells from the indicated groups. The results are presented as fold-
change relative to the first column set at 1 (i.e., WT non-tumor-bearing control) (n=3 mice each,
*P < 0.01; NS=not significant). Data in C-E are presented as mean + SEM of the indicated
number of mice. (F) Representative density plots for the data quantified in Figure 7.

9
Supplemental Figure 5. Gating strategy for analyses of the different tumor-infiltrating
myeloid populations. Analyses are based on the following approach: 1) total live cells were
gated on the CD45+ leukocyte fraction; 2) the gated CD45+ fraction was then plotted in relation
to CD11b and Gr-1 to identify total MDSCs (upper right); 3a) total CD11b+ cells were identified
within the gated CD45+ fraction; 3b) the gated CD11b+ fraction was then plotted in relation to
Ly6C and Ly6G to identify the MDSC subsets. The purple and blue gates spotlight the fractions
analyzed, which represent the vast majority of cells within the respective quadrant; 3c) the gated
CD11b+ fraction was also plotted in relation to F4/80 and Gr-1 to identify the macrophages
(upper left); or 4) the gated CD45+ fraction was plotted in relation to CD11c and I-A
b (a major
MHC class II molecule) to identify total DCs (upper right). Data are from a tumor-bearing WT
mouse, although the same gating strategy was used for all tumor-bearing WT and Tg mice.
10
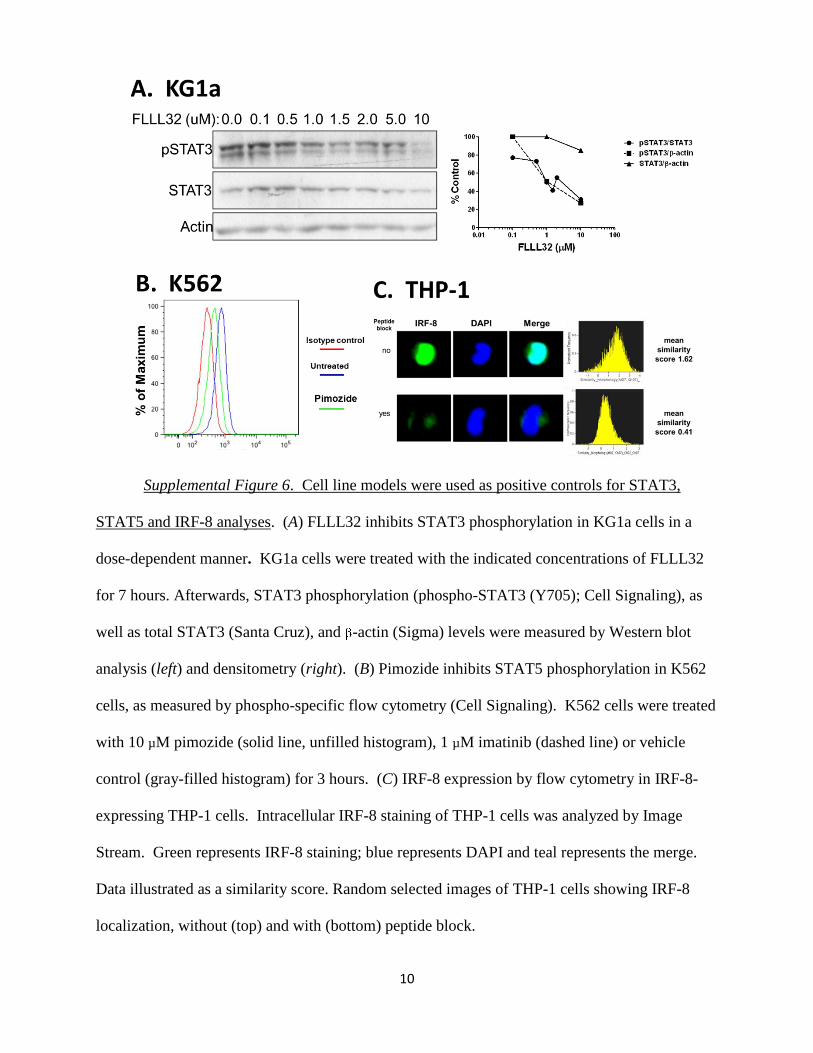
Supplemental Figure 6. Cell line models were used as positive controls for STAT3,
STAT5 and IRF-8 analyses. (A) FLLL32 inhibits STAT3 phosphorylation in KG1a cells in a
dose-dependent manner. KG1a cells were treated with the indicated concentrations of FLLL32
for 7 hours. Afterwards, STAT3 phosphorylation (phospho-STAT3 (Y705); Cell Signaling), as
well as total STAT3 (Santa Cruz), and -actin (Sigma) levels were measured by Western blot
analysis (left) and densitometry (right). (B) Pimozide inhibits STAT5 phosphorylation in K562
cells, as measured by phospho-specific flow cytometry (Cell Signaling). K562 cells were treated
with 10 µM pimozide (solid line, unfilled histogram), 1 µM imatinib (dashed line) or vehicle
control (gray-filled histogram) for 3 hours. (C) IRF-8 expression by flow cytometry in IRF-8-
expressing THP-1 cells. Intracellular IRF-8 staining of THP-1 cells was analyzed by Image
Stream. Green represents IRF-8 staining; blue represents DAPI and teal represents the merge.
Data illustrated as a similarity score. Random selected images of THP-1 cells showing IRF-8
localization, without (top) and with (bottom) peptide block.

11
1 2 3
Supplemental Figure 7. Gating strategy for the analysis of IRF-8 expression in the
CD33+CD15-HLA-DR- MDSC subset Buffy coat leukocytes from representative subjects
(healthy donor or patients with low or high MDSC levels, as defined in Figure 10) were stained
for expression of CD33, CD15, HLA-DR and IRF-8. Next, 1) live cells were gated on the CD33
fraction; 2) CD33+ cells from each group were plotted in relation to CD15 and HLA-DR
expression to identify the CD33+CD15-HLA-DR- fraction (in the lower left quadrant); and 3) the
gated CD33+CD15-HLA-DR- fraction was then analyzed for IRF-8 expression. To do so, during
the primary antibody incubation step, duplicate samples were prepared and incubated with or
without an IRF-8 Ab blocking peptide to improve accuracy for IRF-8 quantification. Specific
IRF-8 levels were then quantified using KS statistics and the data reported as the D-value as
described in detail in the Methods.

12
Table I. Gene Set Enrichment Analysis: IRF-8-/-
vs. Wild-type Controls a
GENE SET
#GENES FDR.q.val
b
MORI_IMMATURE_B_LYMPHOCYTE_DN 40 0
MORI_LARGE_PRE_BII_LYMPHOCYTE_UP 43 0
MARKEY_RB1_ACUTE_LOF_DN 144 0
HOFFMANN_LARGE_TO_SMALL_PRE_BII_LYMPHOCYTE_UP 69 0
YU_MYC_TARGETS_UP 29 0
BERENJENO_TRANSFORMED_BY_RHOA_UP 334 0
PAL_PRMT5_TARGETS_UP 116 0
LIAN_LIPA_TARGETS_6M 53 0
LIAN_LIPA_TARGETS_3M 47 0
ICHIBA_GRAFT_VERSUS_HOST_DISEASE_D7_UP 79 0
MARKEY_RB1_ACUTE_LOF_UP 171 0
HESS_TARGETS_OF_HOXA9_AND_MEIS1_DN 69 0
MARKEY_RB1_CHRONIC_LOF_DN 71 0
ZHANG_BREAST_CANCER_PROGENITORS_UP 229 0.00011
LE_EGR2_TARGETS_UP 62 0.000124
YAO_TEMPORAL_RESPONSE_TO_PROGESTERONE_CLUSTER_13 136 0.000496
RIZ_ERYTHROID_DIFFERENTIATION 50 0.000632
FOSTER_INFLAMMATORY_RESPONSE_LPS_DN 235 0.000865
GOLDRATH_ANTIGEN_RESPONSE 249 0.001154
SEKI_INFLAMMATORY_RESPONSE_LPS_UP 46 0.001165
MORI_EMU_MYC_LYMPHOMA_BY_ONSET_TIME_UP 76 0.001523
IVANOVA_HEMATOPOIESIS_EARLY_PROGENITOR 73 0.001818
STARK_PREFRONTAL_CORTEX_22Q11_DELETION_DN 355 0.002661
MARKEY_RB1_CHRONIC_LOF_UP 53 0.002706
VARELA_ZMPSTE24_TARGETS_UP 24 0.002838
OUELLET_OVARIAN_CANCER_INVASIVE_VS_LMP_UP 68 0.003657
MORI_MATURE_B_LYMPHOCYTE_DN 41 0.005326
MORI_MATURE_B_LYMPHOCYTE_UP 62 0.007333
BOYLAN_MULTIPLE_MYELOMA_PCA1_UP 55 0.013204
COATES_MACROPHAGE_M1_VS_M2_UP 42 0.013265
MORI_PRE_BI_LYMPHOCYTE_DN 54 0.013494
MORI_LARGE_PRE_BII_LYMPHOCYTE_DN 43 0.016997
BREDEMEYER_RAG_SIGNALING_NOT_VIA_ATM_UP 35 0.017263
MORI_IMMATURE_B_LYMPHOCYTE_UP 38 0.017823
MARTORIATI_MDM4_TARGETS_NEUROEPITHELIUM_DN 33 0.017885
ICHIBA_GRAFT_VERSUS_HOST_DISEASE_35D_UP 111 0.026818
YU_MYC_TARGETS_DN 45 0.02719
HOFFMANN_IMMATURE_TO_MATURE_B_LYMPHOCYTE_UP 19 0.027731
YAO_TEMPORAL_RESPONSE_TO_PROGESTERONE_CLUSTER_5 19 0.028404
YAO_HOXA10_TARGETS_VIA_PROGESTERONE_UP 37 0.031785
YAO_TEMPORAL_RESPONSE_TO_PROGESTERONE_CLUSTER_14 97 0.032518
MCBRYAN_PUBERTAL_BREAST_4_5WK_UP 100 0.036288
a Refer to Figure 3 for experimental details;
b FDR, false discovery rate

13
Table II Gene Set Enrichment Analysis: Tumor-Bearers vs. Wild-type Controls GENE SET
#GENES FDR.q.val
MORI_IMMATURE_B_LYMPHOCYTE_DN 40 0
HOFFMANN_LARGE_TO_SMALL_PRE_BII_LYMPHOCYTE_UP 69 0
MARKEY_RB1_ACUTE_LOF_DN 144 0
PAL_PRMT5_TARGETS_UP 116 0
YU_MYC_TARGETS_UP 29 0
MORI_LARGE_PRE_BII_LYMPHOCYTE_UP 43 0
YAO_TEMPORAL_RESPONSE_TO_PROGESTERONE_CLUSTER_13 136 0
BERENJENO_TRANSFORMED_BY_RHOA_UP 334 0
STARK_PREFRONTAL_CORTEX_22Q11_DELETION_DN 355 0
YAO_TEMPORAL_RESPONSE_TO_PROGESTERONE_CLUSTER_17 126 0
GOLDRATH_ANTIGEN_RESPONSE 249 0
IVANOVA_HEMATOPOIESIS_EARLY_PROGENITOR 73 0
SEKI_INFLAMMATORY_RESPONSE_LPS_UP 46 0
ICHIBA_GRAFT_VERSUS_HOST_DISEASE_D7_UP 79 0
MARKEY_RB1_ACUTE_LOF_UP 171 0
VARELA_ZMPSTE24_TARGETS_UP 24 0
RASHI_RESPONSE_TO_IONIZING_RADIATION_1 32 0
YAO_TEMPORAL_RESPONSE_TO_PROGESTERONE_CLUSTER_14 97 6.34E-05
LE_EGR2_TARGETS_UP 62 6.82E-05
OUELLET_OVARIAN_CANCER_INVASIVE_VS_LMP_UP 68 0.000131
ZHANG_BREAST_CANCER_PROGENITORS_UP 229 0.000301
ICHIBA_GRAFT_VERSUS_HOST_DISEASE_D7_DN 19 0.000462
MORI_EMU_MYC_LYMPHOMA_BY_ONSET_TIME_UP 76 0.000496
LEE_LIVER_CANCER_MYC_UP 26 0.0006
YAO_TEMPORAL_RESPONSE_TO_PROGESTERONE_CLUSTER_10 45 0.000631
HESS_TARGETS_OF_HOXA9_AND_MEIS1_DN 69 0.000636
IVANOVA_HEMATOPOIESIS_LATE_PROGENITOR 104 0.000759
FOSTER_INFLAMMATORY_RESPONSE_LPS_DN 235 0.000986
MORI_MATURE_B_LYMPHOCYTE_DN 41 0.001182
IVANOVA_HEMATOPOIESIS_INTERMEDIATE_PROGENITOR 26 0.001597
YAO_TEMPORAL_RESPONSE_TO_PROGESTERONE_CLUSTER_11 68 0.002257
RIZ_ERYTHROID_DIFFERENTIATION 50 0.002443
RASHI_RESPONSE_TO_IONIZING_RADIATION_2 86 0.003557
LIAN_LIPA_TARGETS_6M 53 0.00369
HOFFMANN_IMMATURE_TO_MATURE_B_LYMPHOCYTE_UP 19 0.003827
LIAN_LIPA_TARGETS_3M 47 0.004306
MODY_HIPPOCAMPUS_PRENATAL 19 0.005393
BREDEMEYER_RAG_SIGNALING_NOT_VIA_ATM_UP 35 0.008435
MORI_PRE_BI_LYMPHOCYTE_DN 54 0.009138
MORI_MATURE_B_LYMPHOCYTE_UP 62 0.010733
BOYLAN_MULTIPLE_MYELOMA_C_D_UP 64 0.010875
MARKEY_RB1_CHRONIC_LOF_UP 53 0.013204
SWEET_LUNG_CANCER_KRAS_DN 157 0.017183
MARTORIATI_MDM4_TARGETS_NEUROEPITHELIUM_UP 62 0.017396
BYSTRYKH_HEMATOPOIESIS_STEM_CELL_QTL_CIS 96 0.021923
MARKEY_RB1_CHRONIC_LOF_DN 71 0.024658
YU_MYC_TARGETS_DN 45 0.024977
MORI_PLASMA_CELL_UP 24 0.030429
14
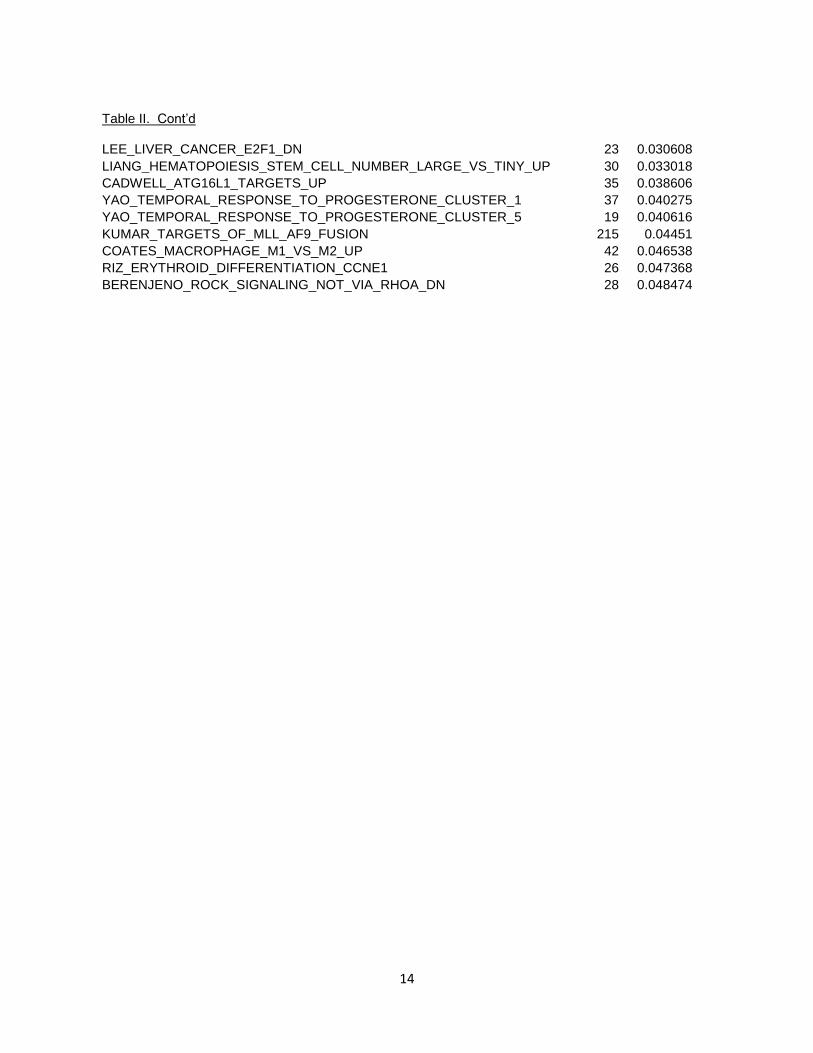
Table II. Cont’d LEE_LIVER_CANCER_E2F1_DN 23 0.030608
LIANG_HEMATOPOIESIS_STEM_CELL_NUMBER_LARGE_VS_TINY_UP 30 0.033018
CADWELL_ATG16L1_TARGETS_UP 35 0.038606
YAO_TEMPORAL_RESPONSE_TO_PROGESTERONE_CLUSTER_1 37 0.040275
YAO_TEMPORAL_RESPONSE_TO_PROGESTERONE_CLUSTER_5 19 0.040616
KUMAR_TARGETS_OF_MLL_AF9_FUSION 215 0.04451
COATES_MACROPHAGE_M1_VS_M2_UP 42 0.046538
RIZ_ERYTHROID_DIFFERENTIATION_CCNE1 26 0.047368
BERENJENO_ROCK_SIGNALING_NOT_VIA_RHOA_DN 28 0.048474
15
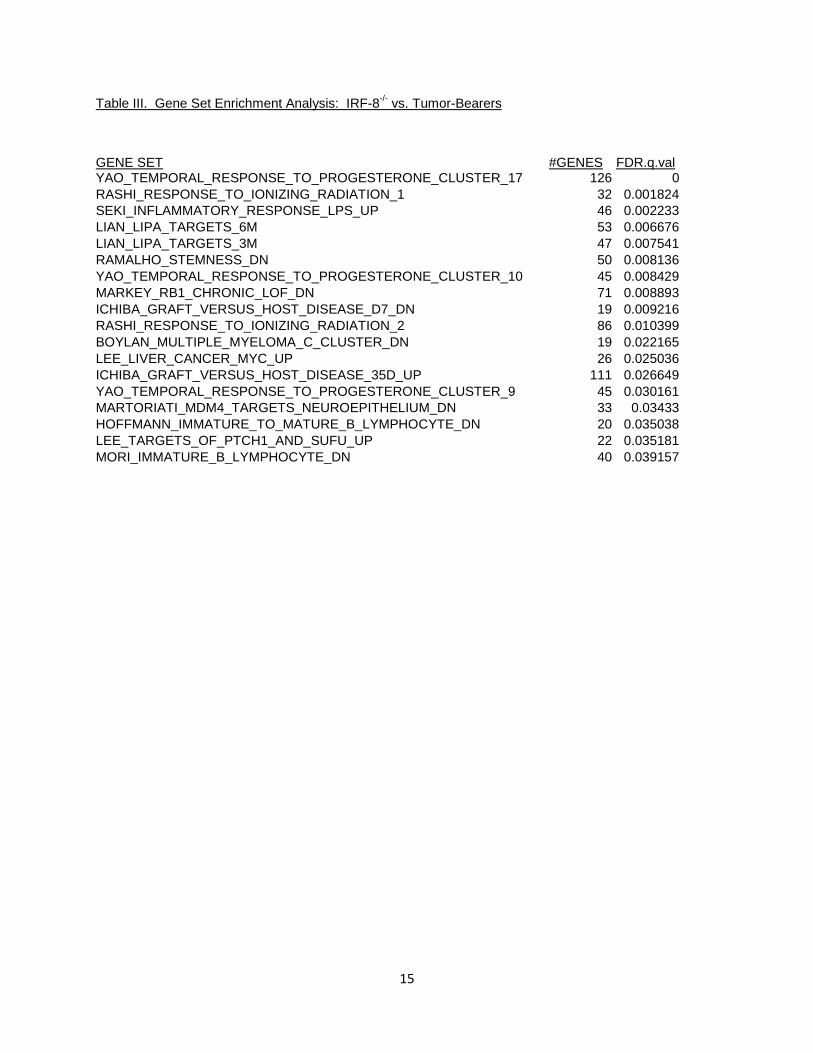
Table III. Gene Set Enrichment Analysis: IRF-8-/-
vs. Tumor-Bearers
GENE SET #GENES FDR.q.val
YAO_TEMPORAL_RESPONSE_TO_PROGESTERONE_CLUSTER_17 126 0
RASHI_RESPONSE_TO_IONIZING_RADIATION_1 32 0.001824
SEKI_INFLAMMATORY_RESPONSE_LPS_UP 46 0.002233
LIAN_LIPA_TARGETS_6M 53 0.006676
LIAN_LIPA_TARGETS_3M 47 0.007541
RAMALHO_STEMNESS_DN 50 0.008136
YAO_TEMPORAL_RESPONSE_TO_PROGESTERONE_CLUSTER_10 45 0.008429
MARKEY_RB1_CHRONIC_LOF_DN 71 0.008893
ICHIBA_GRAFT_VERSUS_HOST_DISEASE_D7_DN 19 0.009216
RASHI_RESPONSE_TO_IONIZING_RADIATION_2 86 0.010399
BOYLAN_MULTIPLE_MYELOMA_C_CLUSTER_DN 19 0.022165
LEE_LIVER_CANCER_MYC_UP 26 0.025036
ICHIBA_GRAFT_VERSUS_HOST_DISEASE_35D_UP 111 0.026649
YAO_TEMPORAL_RESPONSE_TO_PROGESTERONE_CLUSTER_9 45 0.030161
MARTORIATI_MDM4_TARGETS_NEUROEPITHELIUM_DN 33 0.03433
HOFFMANN_IMMATURE_TO_MATURE_B_LYMPHOCYTE_DN 20 0.035038
LEE_TARGETS_OF_PTCH1_AND_SUFU_UP 22 0.035181
MORI_IMMATURE_B_LYMPHOCYTE_DN 40 0.039157

16
Table IV. Characterization of bone marrow progenitors from CD11b-IRF8 transgenic mice *
* Analysis of bone marrow progenitors of the various lineages between WT and IRF-8-Tg
transgenic under steady state-conditions (founder line 370; n=3 mice each). Morphological
analysis was conducted in a blinded fashion.
17
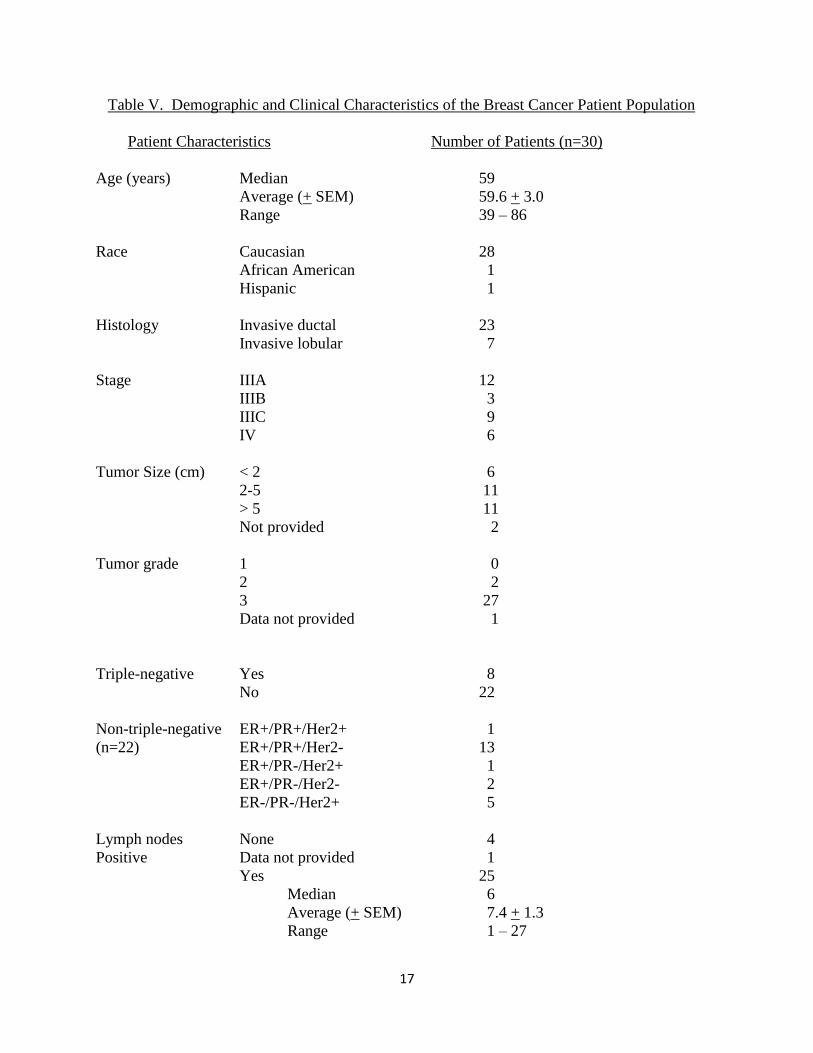
Table V. Demographic and Clinical Characteristics of the Breast Cancer Patient Population
Patient Characteristics Number of Patients (n=30)
Age (years) Median 59
Average (+ SEM) 59.6 + 3.0
Range 39 – 86
Race Caucasian 28
African American 1
Hispanic 1
Histology Invasive ductal 23
Invasive lobular 7
Stage IIIA 12
IIIB 3
IIIC 9
IV 6
Tumor Size (cm) < 2 6
2-5 11
> 5 11
Not provided 2
Tumor grade 1 0
2 2
3 27
Data not provided 1
Triple-negative Yes 8
No 22
Non-triple-negative ER+/PR+/Her2+ 1
(n=22) ER+/PR+/Her2- 13
ER+/PR-/Her2+ 1
ER+/PR-/Her2- 2
ER-/PR-/Her2+ 5
Lymph nodes None 4
Positive Data not provided 1
Yes 25
Median 6
Average (+ SEM) 7.4 + 1.3
Range 1 – 27
Top Related