


Languages
Pages
Legal

Superpave5: Constructing Asphalt Pavement with Road Air Voids Equal to Design Air Voids
Webinar being sponsored by; AFH60, Asphalt Pavement Construction and Reconstruction
Lee Gallivan, Chair
1

Today’s Webinar Includes Three Sessions will cover the following
Present the principles of constructing asphalt mixture to the same compaction level as the mixture design
Describe research to modify design requirements as listed in AASHTO M 323.
Describe construction of experimental mixture including production, placement and compaction.
Describe the results of the comparison of road cores taken from regular and experimental mixture.
2

Presenters Gerry Huber, P.E. – Director of Research, Heritage
Research Group, Indianapolis, Indiana (23 years), Asphalt Institute (5 years), Saskatchewan – Highways (10 years)
John Haddock, PhD, P.E. - Professor of Civil Engineering & Director, Indiana Local Technical Assistance Program, Purdue University, Lafayette, Indiana (15 years)
Matt Beason, P.E. - State Materials Engineer (just
appointed), Office of Materials Management- Indiana Department of Transportation, Indianapolis, Indiana (8 years)
d Technical Assistance Program
3

Questions
Questions can be posed though anytime using the questions box and I will be monitoring them as they come in but will be answered at the end.
Follow instructions for your PDH hours.
4

Subcommittee AFH60 Flexible Pavement Construction and Rehabilitation
Gerry Huber Heritage Research Group

Mix Design Historical Perspective

Typical 1900s Pavement
Surfacing Mix
Asphaltic Concrete Hydraulic Cement
Stabilized Aggregate
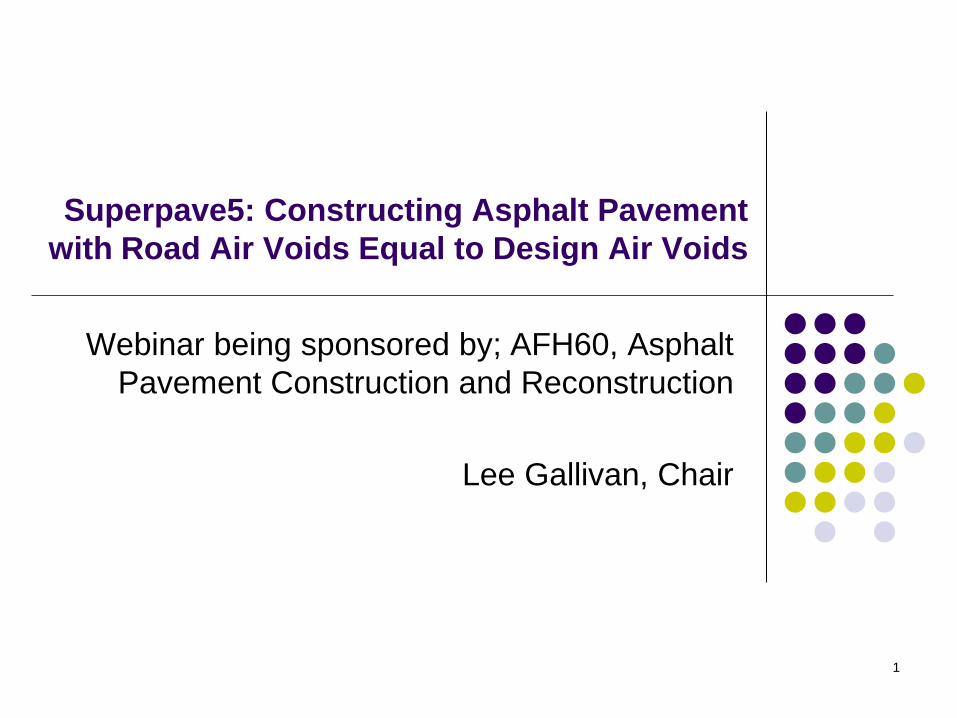
Surface Recipe Design Components (typical)
78% sand 12% lime 10% asphalt
Sand heated to 300ºF Asphalt added Lime added cold
Amount adjusted visually
Paper Pat Test Brown paper Mixture dumped on to paper

Surface Mix
Asphalt Content 11% Gradation
#10 100 #40 87% #80 49% #200 15%
Air Voids approx. 0%
City Street 1890s

Asphaltic Concrete Mixture Asphalt
7.4%
Air voids 0(?)%
VMA 13.2%

Hubbard Field Mix Design (1920s) Mixture Compacted
with rammer
Specifications Air voids Voids in
compacted aggregate
Hubbard Field Stability

Marshall Method of Mix Design (1930s)
Bruce Marshall of Mississippi Department of Highways 1943 joined U.S. Army Corps of
Engineers
Design used for airfields in World War II Post WWII method was “civilianized”

Marshall Mix Design Used drop hammer
instead of hand rammer Air voids calculated Stability test
Geometry different than Hubbard Field
No VMA No absorption
Added in 1962
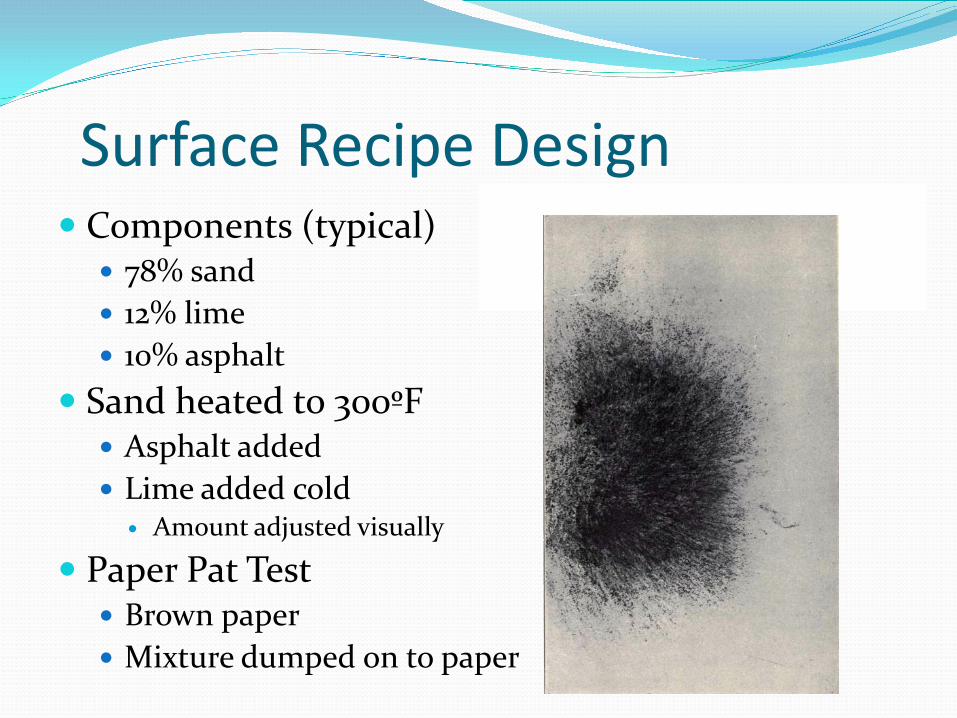
Design Air Voids Marshall Mix Design Design voids set at 3 to 5%
Field Compaction “Standard” rolling train used 8% will densify under traffic to 4%
“Density at end of life = Design Density”
Construction (8%)
Decreases to
Service Life (4%)

Strategic Highway Research Program
“Marshall” carried forward
Design air voids fixed at 4%
Recommended compaction Set at 92% Gmm

Design Air Voids NCHRP Report 573
Density Stabilizes after 2 years
Construction (8%)
Decreases to
Service Life (4%) 5.5%

1959 LCPC visit to Texas
Developed LCPC gyratory compactor

Early Texas Gyratory Compaction
1939, Texas Highway Department Philippi, Raines, and Love
Texas 4-Inch Gyratory Press

LCPC Gyratory Compactor Models Texas-type press 1968, 2nd prototype 1973, PCG1 1985, PCG2
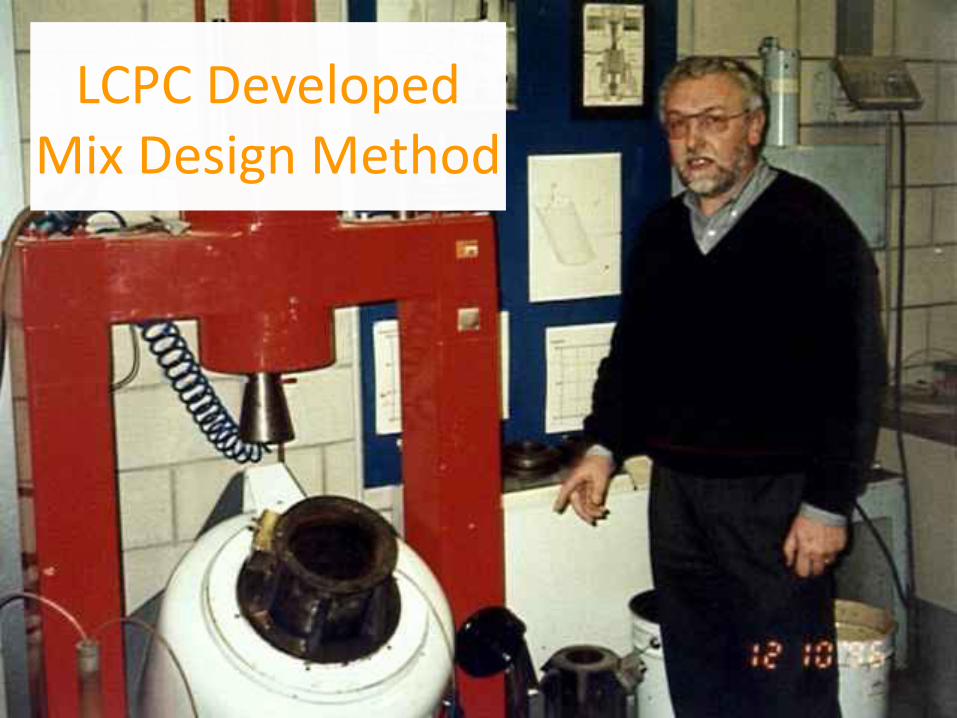
LCPC Developed Mix Design Method
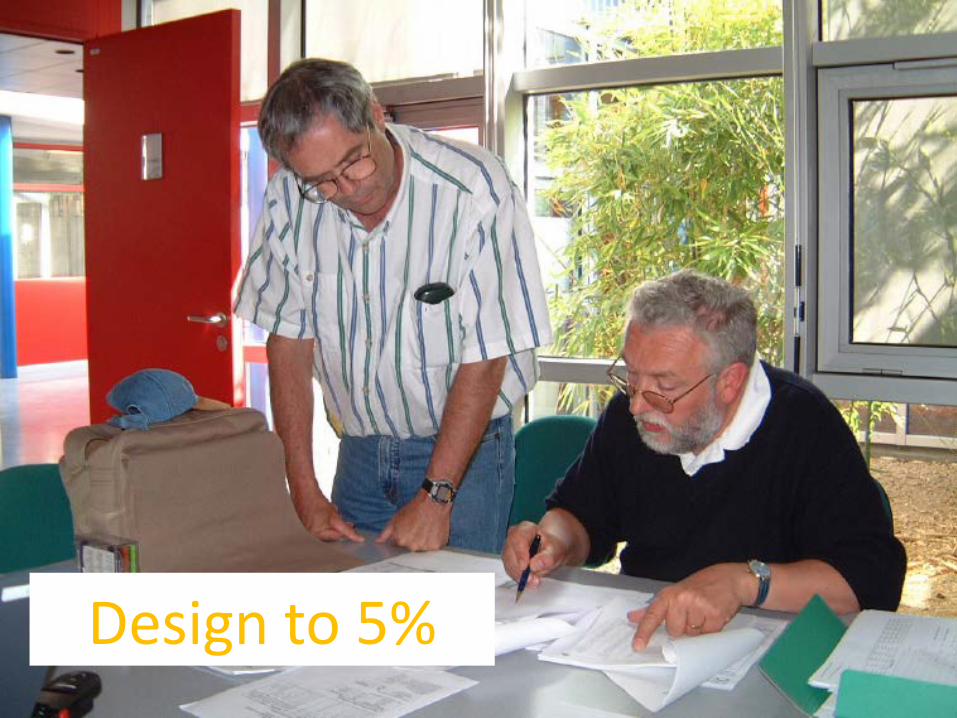
Design to 5%
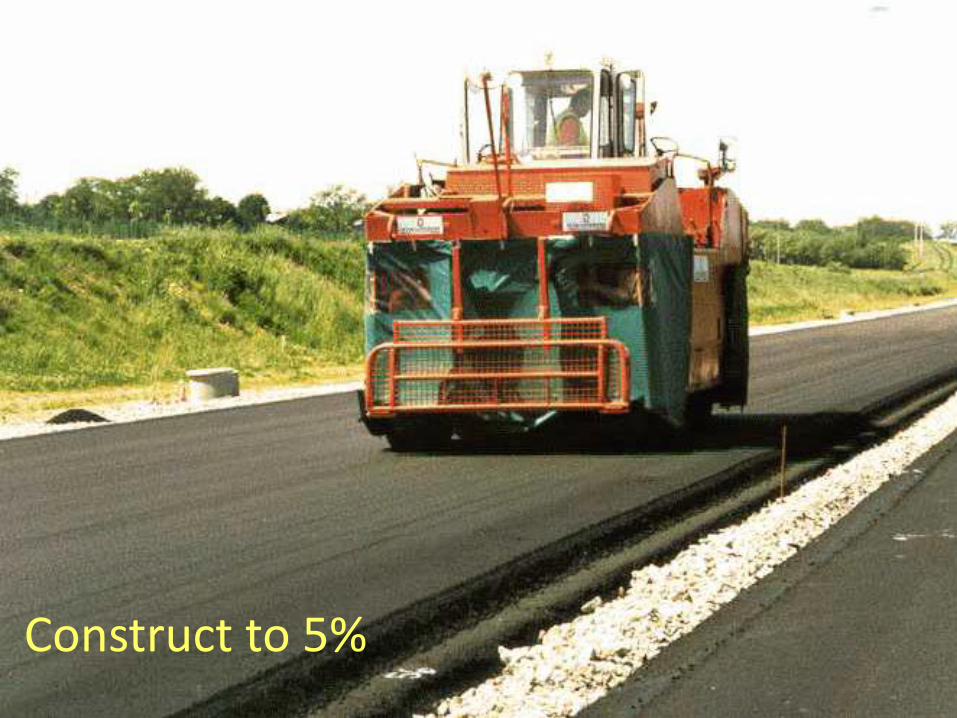
Construct to 5%
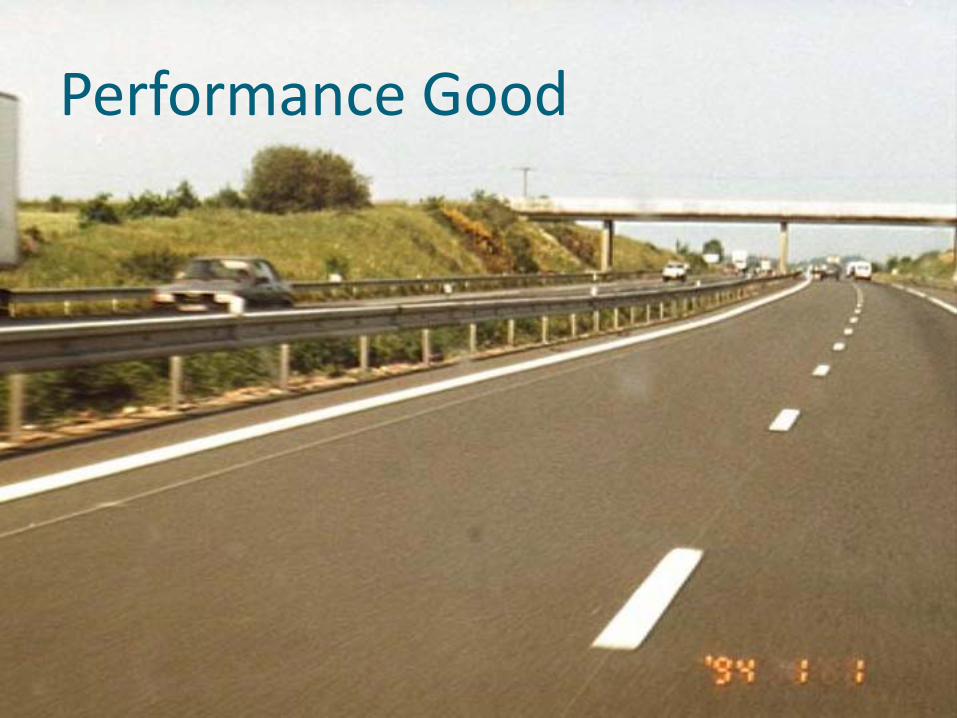
Performance Good
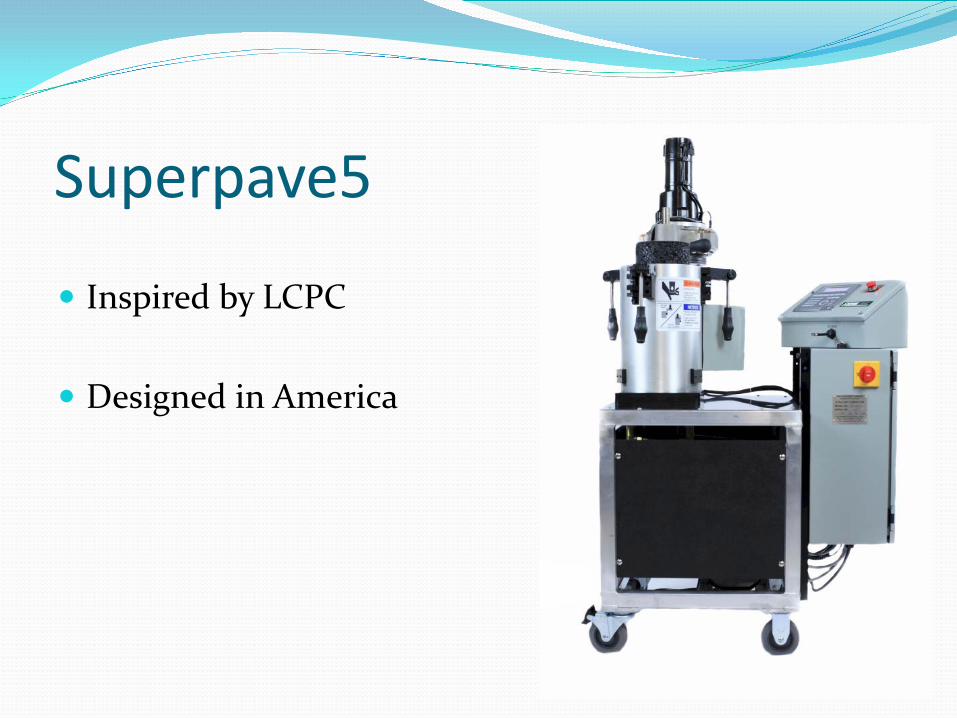
Superpave5
Inspired by LCPC
Designed in America

Superpave5 Concept Design at 5% air voids Compact to 5% (95% Gmm)
Increase air voids by 1%
5% instead of 4% Increase VMA by 1%
Aggregate specifications stay same Lift thickness stays same

Mix Designs (4% Air Voids) 125 gyrations
100 gyrations
75 gyrations
125 gyrations 15.2 VMA
?? VMA 4.0 air
?? VMA 4.0 air
100 gyrations
?? VMA 4.0 air
15.4 VMA ?? VMA 4.0 air
75 gyrations
?? VMA 4.0 air
?? VMA 4.0 air
15.3 VMA

Asphalt Content @ 4% Air Voids 125 gyrations
100 gyrations
75 gyrations
125 gyrations 5.8%
?? VMA 4.0 air
?? VMA 4.0 air
100 gyrations
?? VMA 4.0 air
5.7% ?? VMA 4.0 air
75 gyrations
?? VMA 4.0 air
?? VMA 4.0 air
5.7%

Superpave5 Benefit Asphalt content stays same Higher in-place density Lower permeability Reduced aging (?)
No(?) increase in cost
Thank You
Greetings from Billy Bob

John E. Haddock, PhD, PE Professor of Civil Engineering Director, Indiana Local Technical Assistance Program Purdue University

Indiana flexible pavements generally reach end of service because of durability issues after 15-20 years
Caused in part by oxidized binder
Rutting has been significantly reduced Reducing permeability decreases rate of binder
aging
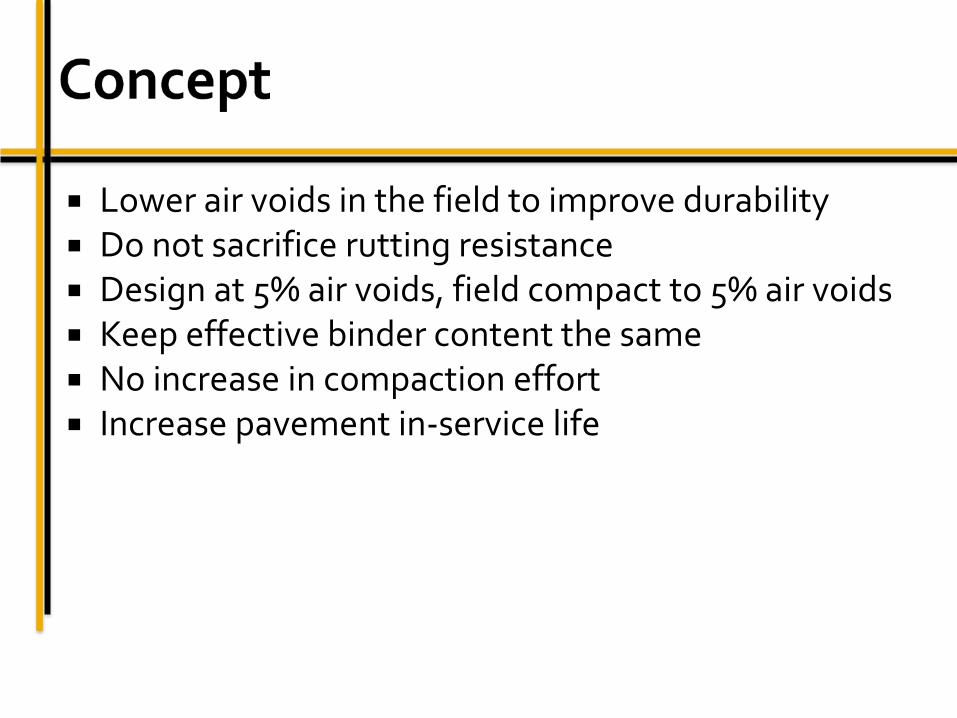
Lower air voids in the field to improve durability Do not sacrifice rutting resistance Design at 5% air voids, field compact to 5% air voids Keep effective binder content the same No increase in compaction effort Increase pavement in-service life
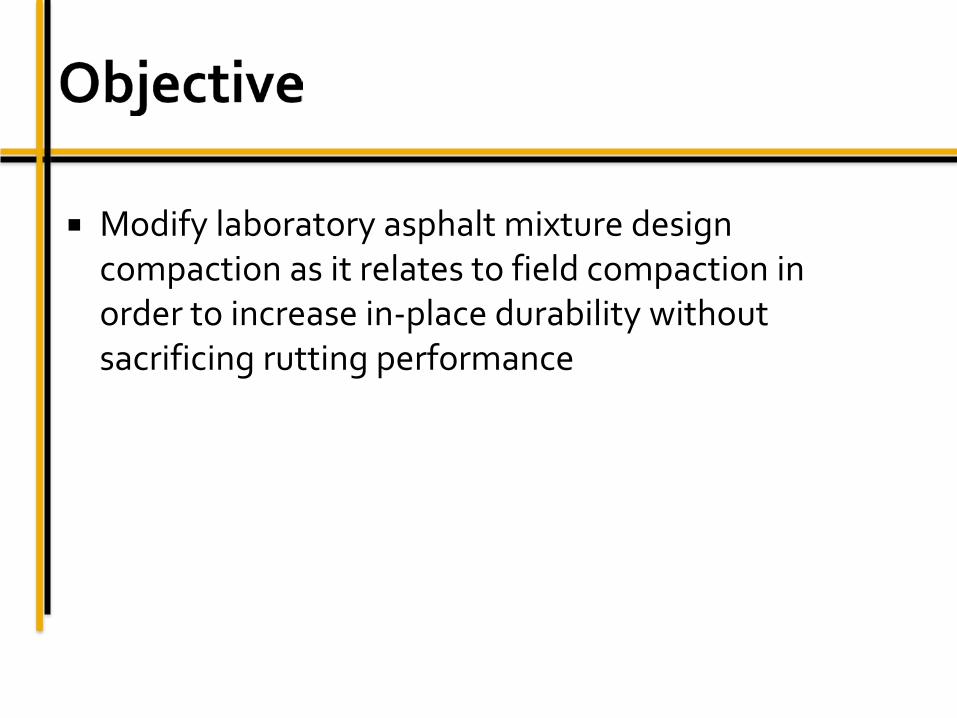
Modify laboratory asphalt mixture design compaction as it relates to field compaction in order to increase in-place durability without sacrificing rutting performance

Design 3 standard mixtures Re-design each mixture at 5% air voids
Maintain effective binder content
Use 70, 50, 30 gyrations Test all mixtures for dynamic modulus and flow
number (anticipated in-service air voids)

Traffic (MESAL)
No. Gyrations
9.5-mm 19.0-mm
Category 3 (3-10)
30 x 50 x 70 x
Category 4 (10-30)
30 x x 50 x x 70 x x
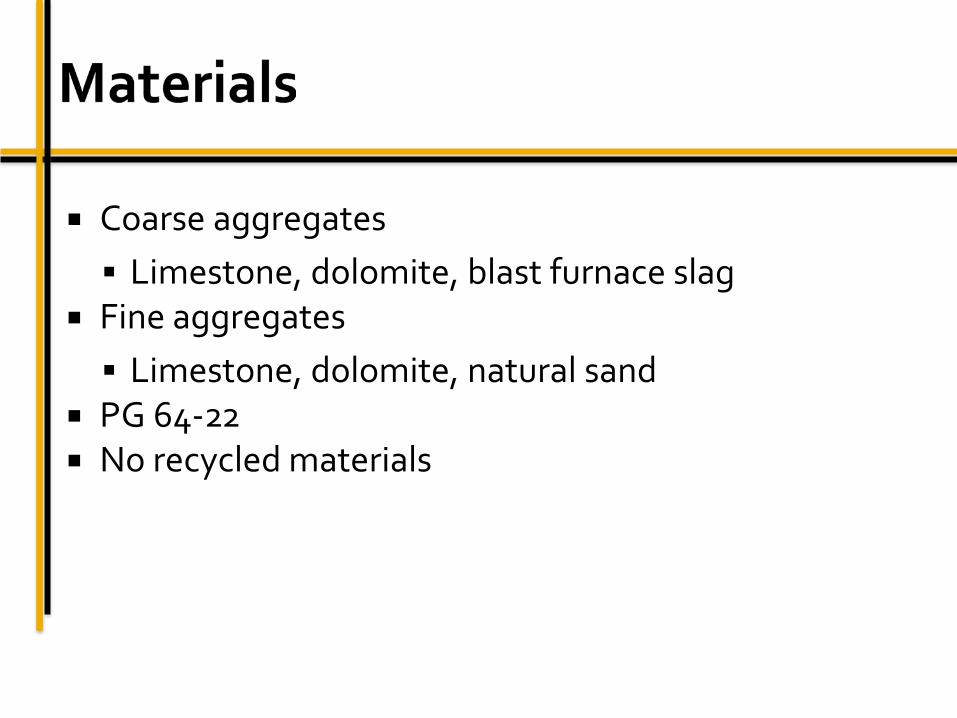
Coarse aggregates Limestone, dolomite, blast furnace slag
Fine aggregates Limestone, dolomite, natural sand
PG 64-22 No recycled materials
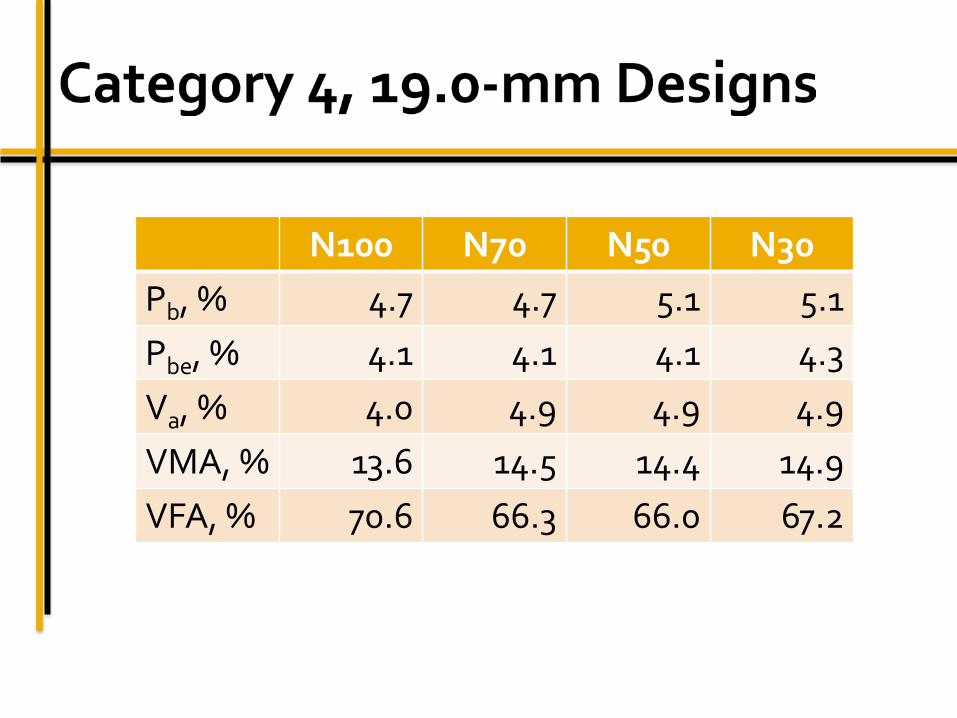
N100 N70 N50 N30 Pb, % 4.7 4.7 5.1 5.1 Pbe, % 4.1 4.1 4.1 4.3 Va, % 4.0 4.9 4.9 4.9 VMA, % 13.6 14.5 14.4 14.9 VFA, % 70.6 66.3 66.0 67.2
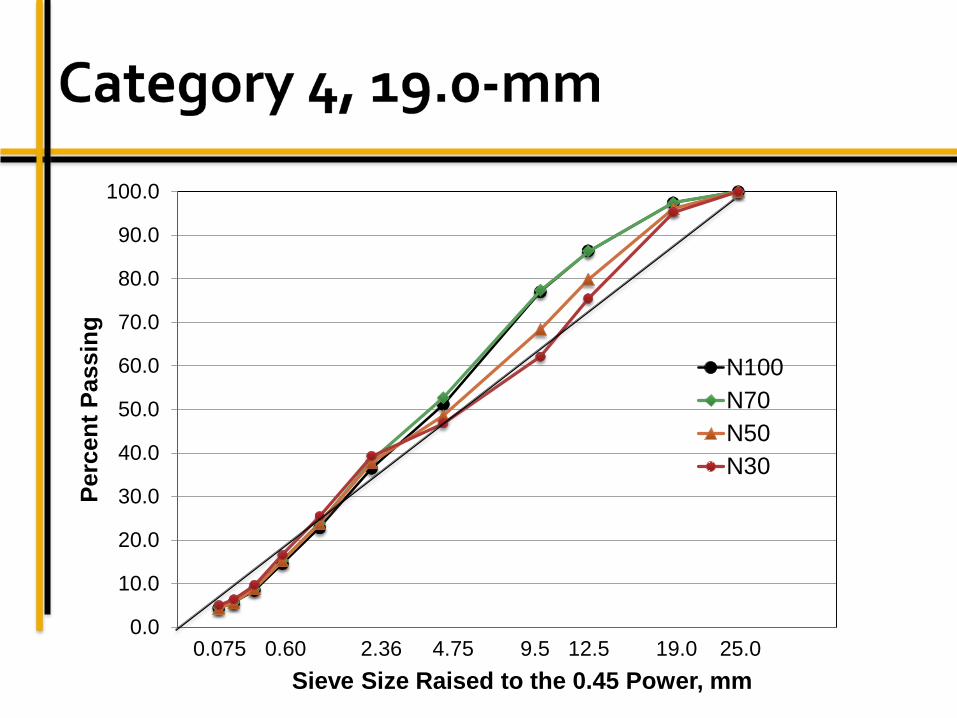
0.0
10.0
20.0
30.0
40.0
50.0
60.0
70.0
80.0
90.0
100.0
Perc
ent P
assi
ng
Sieve Size Raised to the 0.45 Power, mm
N100N70N50N30
19.0 4.75 0.60 2.36 9.5 0.075 25.0 12.5

N100 N70 N50 N30 Pb, % 5.9 5.9 6.0 6.0 Pbe, % 4.6 4.6 4.6 4.7 Va, % 4.1 5.1 4.9 5.3 VMA, % 15.0 16.0 15.8 16.3 VFA, % 72.9 67.9 68.9 67.6
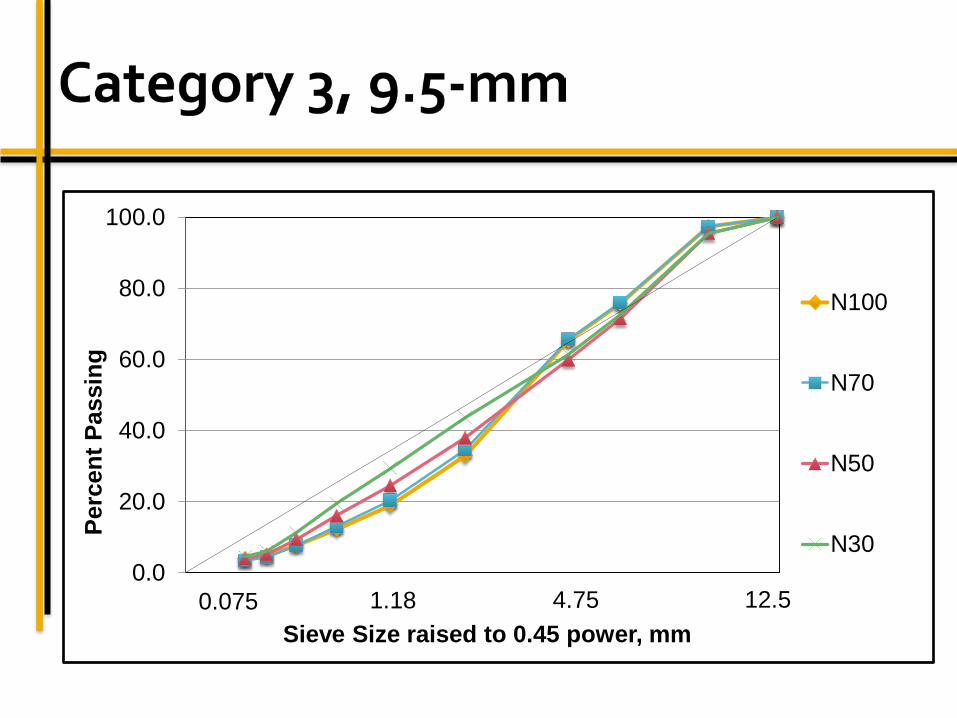
12.5 4.75 1.18 0.075 0.0
20.0
40.0
60.0
80.0
100.0
Perc
ent P
assi
ng
Sieve Size raised to 0.45 power, mm
N100
N70
N50
N30
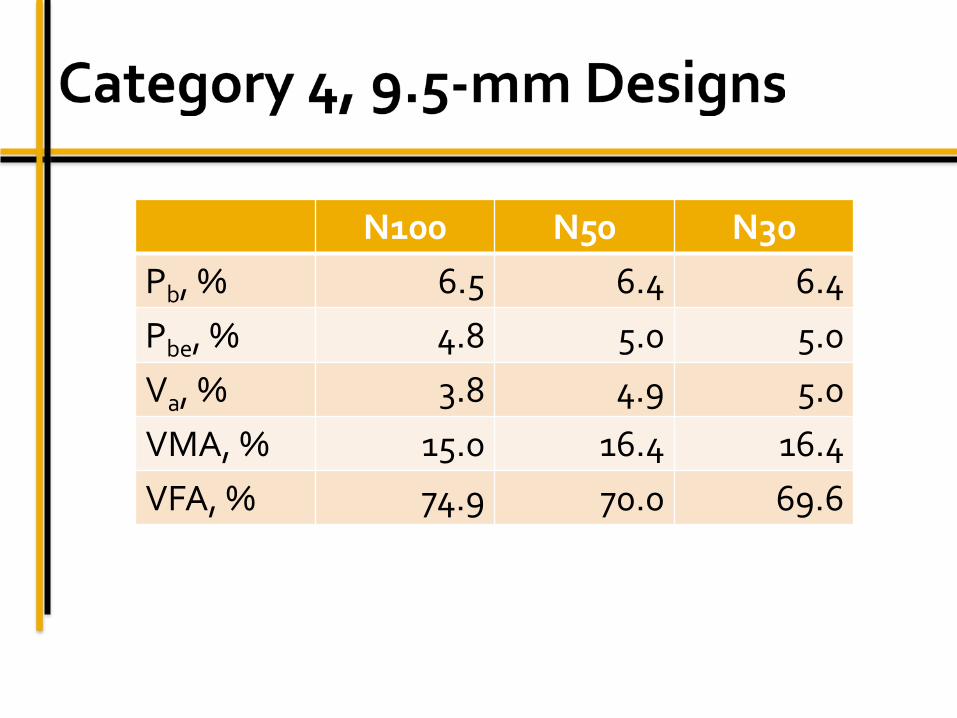
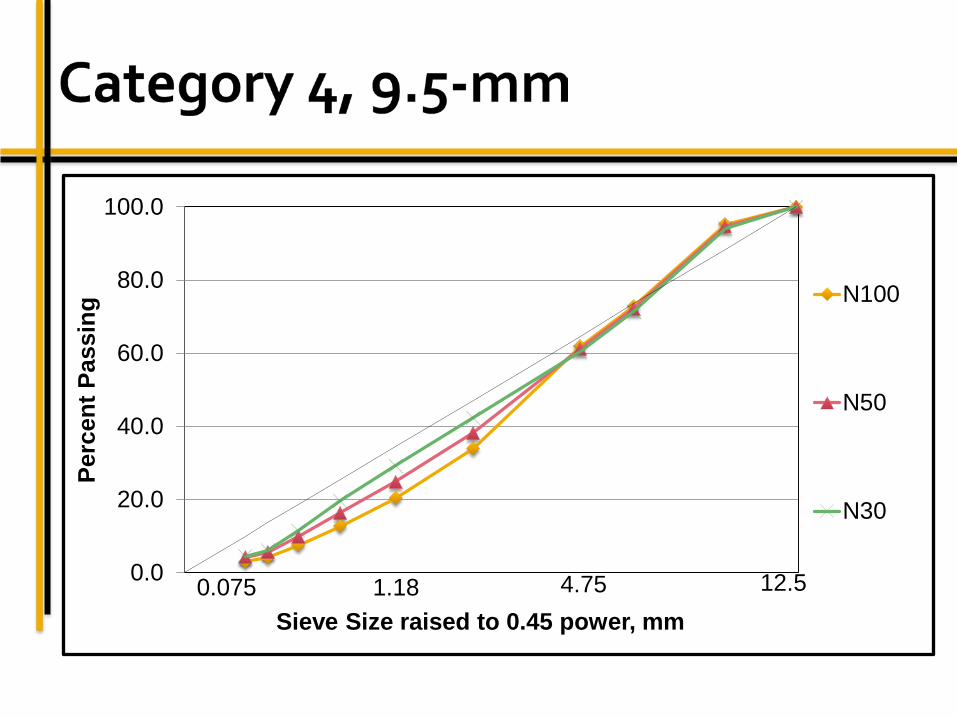
N100 N50 N30 Pb, % 6.5 6.4 6.4 Pbe, % 4.8 5.0 5.0 Va, % 3.8 4.9 5.0 VMA, % 15.0 16.4 16.4 VFA, % 74.9 70.0 69.6
12.5 4.75 1.18 0.075 0.0
20.0
40.0
60.0
80.0
100.0
Perc
ent P
assi
ng
Sieve Size raised to 0.45 power, mm
N100
N50
N30

Dynamic modulus Flow number

1.E+02
1.E+03
1.E+04
1.E+05
1.E-04 1.E-02 1.E+00 1.E+02 1.E+04
Dyn
amic
Mod
ulus
(MPa
)
Reduced Frequency (Hz)
N100/ 7%
N70
N50
N30

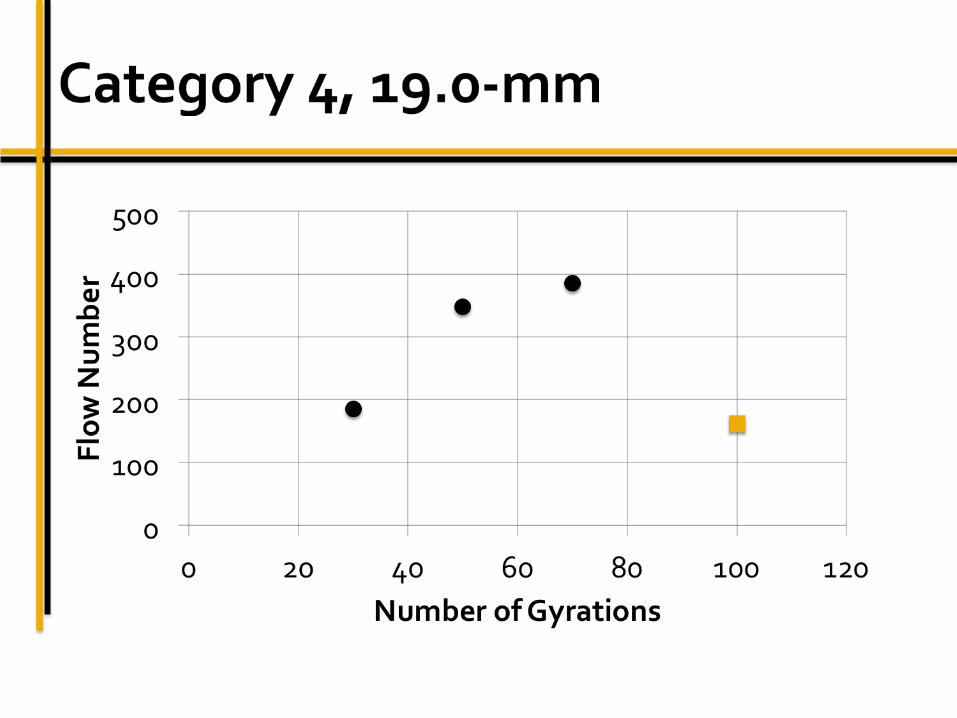
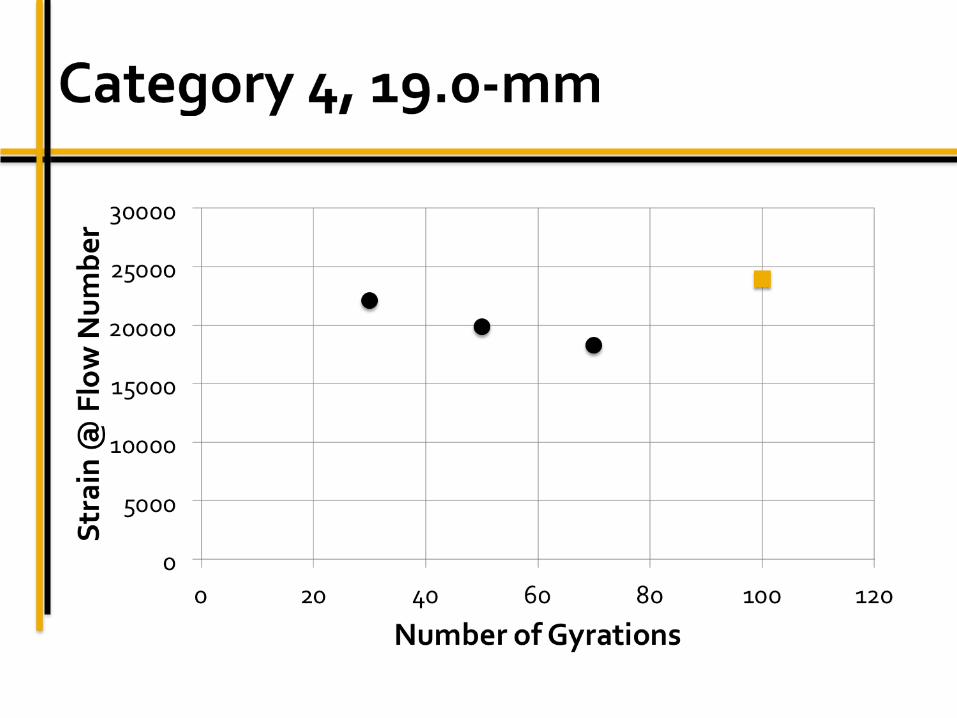
Gyrations Average Flow
Number
Average Strain at FN
(μm) 100 162 23,983 70 386 18,269 50 348 19,882 30 185 22,090

1.E+02
1.E+03
1.E+04
1.E+05
1.E-04 1.E-02 1.E+00 1.E+02 1.E+04
Dyn
amic
Mod
ulus
(MPa
)
Reduced Frequency (Hz)
N100/ 7%N70N50N30N100/ 5%
Gyrations Average Flow
Number
Average Strain at FN
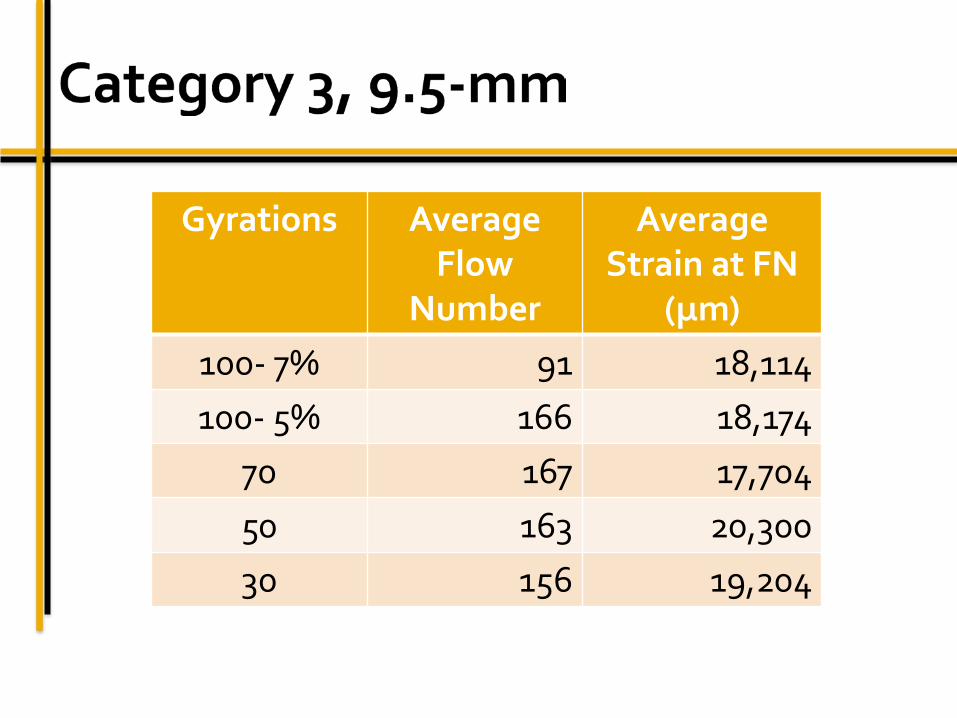
(μm) 100- 7% 91 18,114 100- 5% 166 18,174
70 167 17,704 50 163 20,300 30 156 19,204

1.E+02
1.E+03
1.E+04
1.E+05
1.E-04 1.E-01 1.E+02 1.E+05
Dyn
amic
Mod
ulus
(MPa
)
Reduced Frequency (Hz)
N100
N50
N30

Gyrations Average Flow
Number
Average Strain at FN
(μm) 100 160 23,983 50 253 20,935 30 211 21,033


Mixtures can be designed at 5% air voids without lowering effective binder content
Mixtures designed and tested at 5% air voids can have equivalent dynamic modulus and flow numbers as those designed at 4% and tested at 7% air voids
Results suggests if asphalt mixtures were designed at 5% air voids and placed in service at 5% air voids, they could potentially outperform mixtures designed and placed in a more conventional manner

Fatigue and low-temperature testing, as well as moisture susceptibility testing, should be completed
Future work should include additional traffic levels, mixtures containing RAP, RAS, or both, additional binder grades, aggregate types, mixture sizes
Place field projects
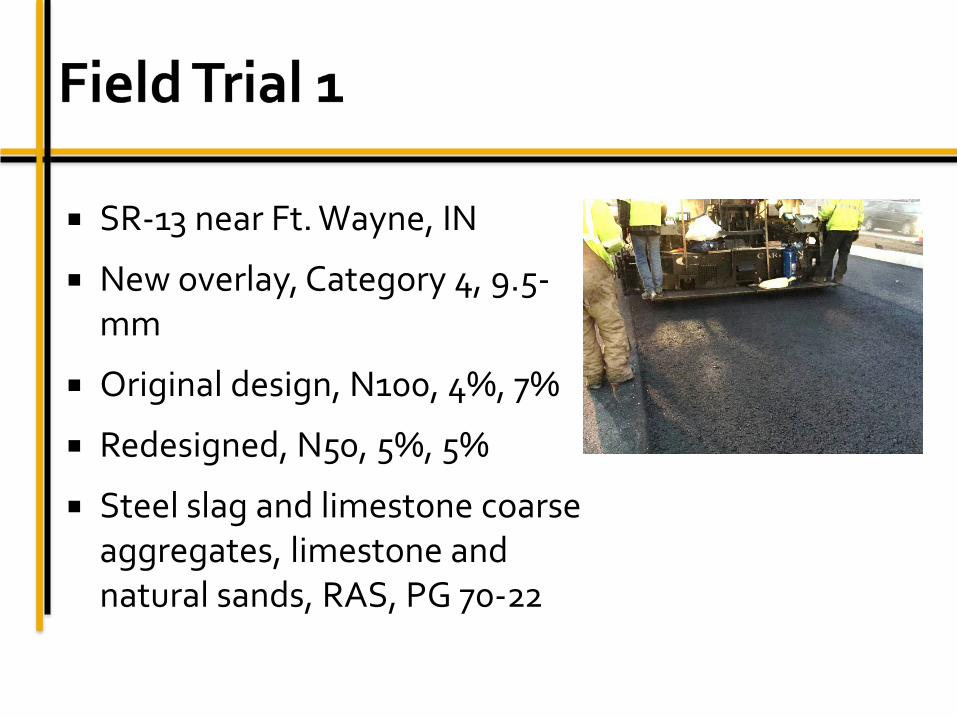
SR-13 near Ft. Wayne, IN
New overlay, Category 4, 9.5-mm
Original design, N100, 4%, 7%
Redesigned, N50, 5%, 5%
Steel slag and limestone coarse aggregates, limestone and natural sands, RAS, PG 70-22

Georgetown Road, Indianapolis , IN
Intermediate layer, Category 3, 19.0-mm
Original design, N100, 4%, 7%
Redesigned, N30, 5%, 5%
Limestone coarse aggregates, dolomite sand, RAS, RAP, PG 64-22

Matt Beeson, PE State Materials Engineer Indiana Department of Transportation

INDOT Concerns Benefit Cost Constructability Rutting 30 gyrations sounds “scary”

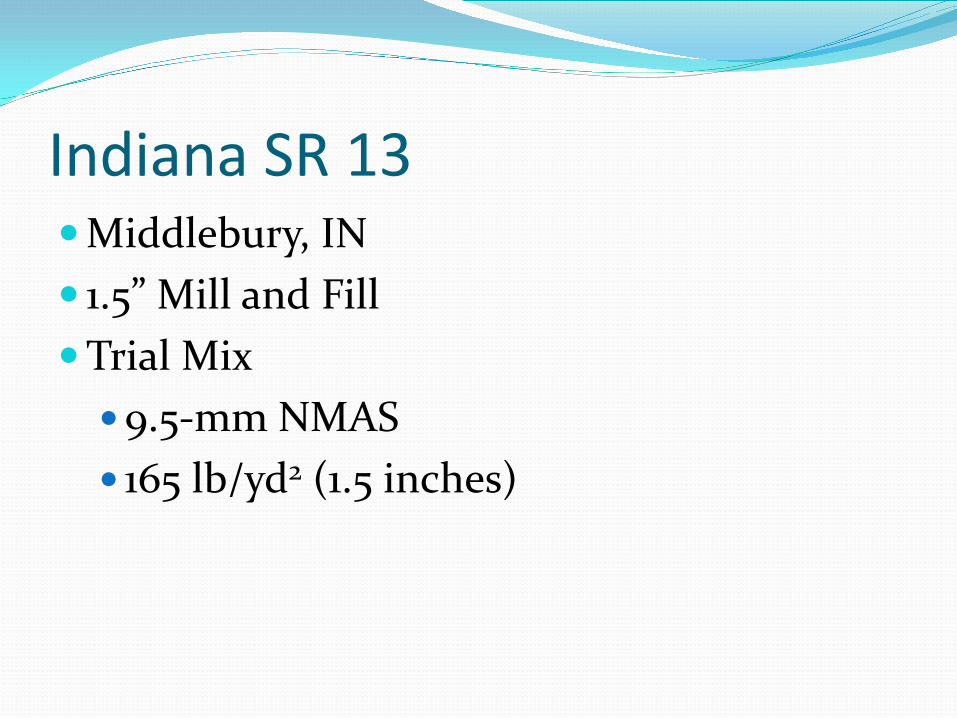
Indiana SR 13 Middlebury, IN 1.5” Mill and Fill Trial Mix 9.5-mm NMAS 165 lb/yd2 (1.5 inches)

Trial Mix 9.5 mm Steel slag coarse aggregate PG 70-22 Binder 7% RAS 20.2% Binder Replacement

QC Volumetric Properties
Superpave5
DMF Sub-lot 1
Sub-lot 2
Sub-lot 3
%AC 5.2 5.61 5.47 5.45 Air
Voids 5.0 5.1 4.8 4.7
VMA 17.0 17.2 16.6 17.2

QA Volumetric Properties Superpave5 Superpave4
DMF Sub-lot 1
Sub-lot 2
Sub-lot 3 Average
%AC 5.2 5.1 5.1 5.4 5.1 Air
Voids 5.0 4.5 4.6 3.4 3.8
VMA 17.0 16.8 15.8 17.4 14.8

Core Density Superpave5 Superpave4
Sublot 1 Sublot 2 Sublot 3 Average Gmm 2.750 2.761 2.737 2.754
Core Gmb 1 2.538 2.584 2.636 2.528
Core Gmb 2 2.600 2.614 2.646 %Gmm 1 92.3 93.6 96.3
91.8 %Gmm 2 94.5 94.7 96.7 Air Voids 1 7.7 6.4 3.7
8.2 Air Voids 2 5.5 5.3 3.3 Average AV 5.3

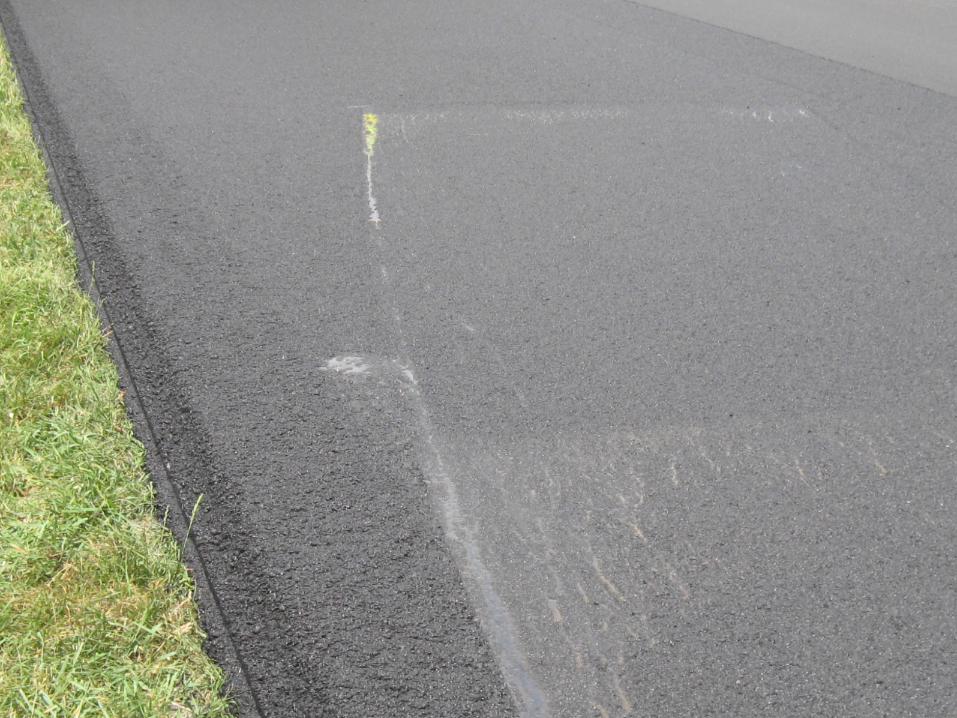


Georgetown Road

Georgetown Road Reconstruction and widening Trial Mix 19-mm NMAS 330 lb/yd2 (3 inches)
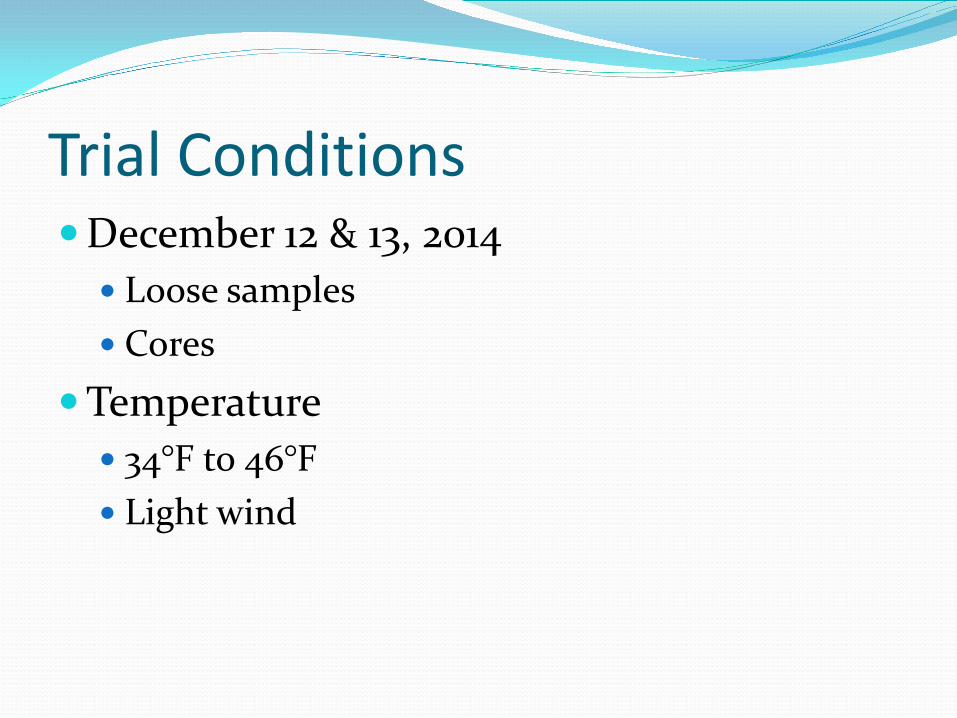
Trial Conditions December 12 & 13, 2014 Loose samples Cores
Temperature 34°F to 46°F Light wind
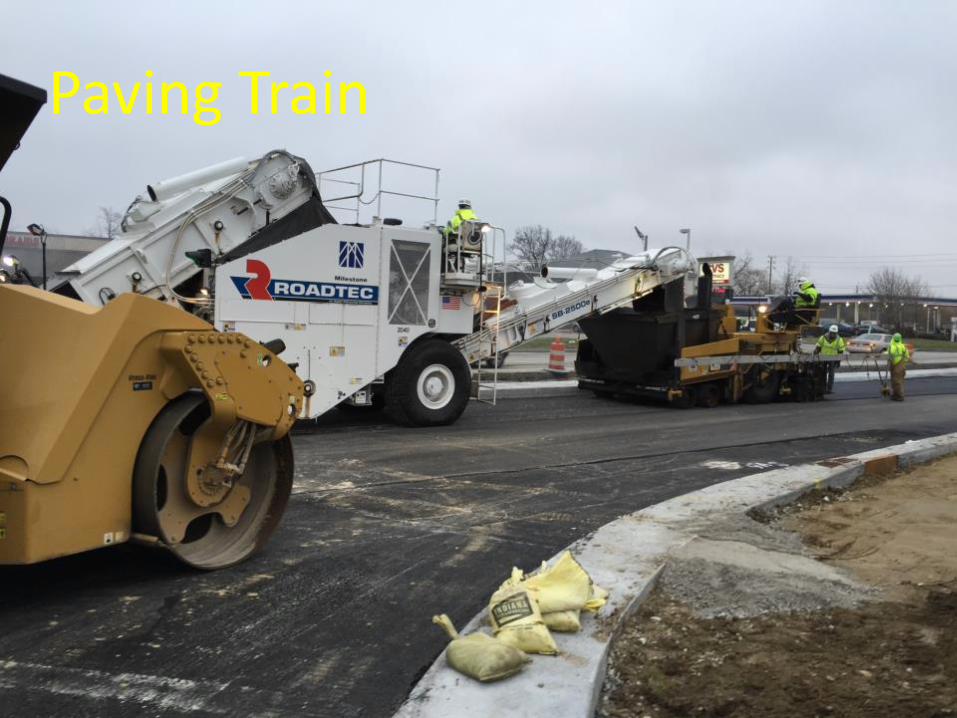
Paving Train

Paving Train
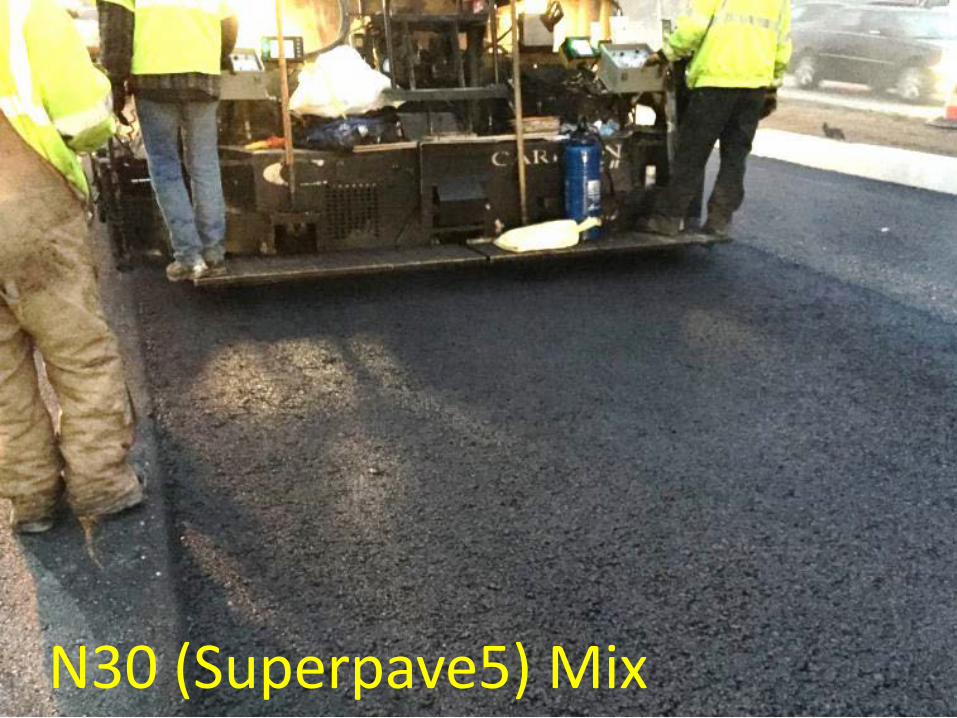
N30 (Superpave5) Mix

N30 (Superpave5) Mix

N30 (Superpave5) Mix

Field Density Quality Control

Research Cores

N30 (5% Air Void) Mix
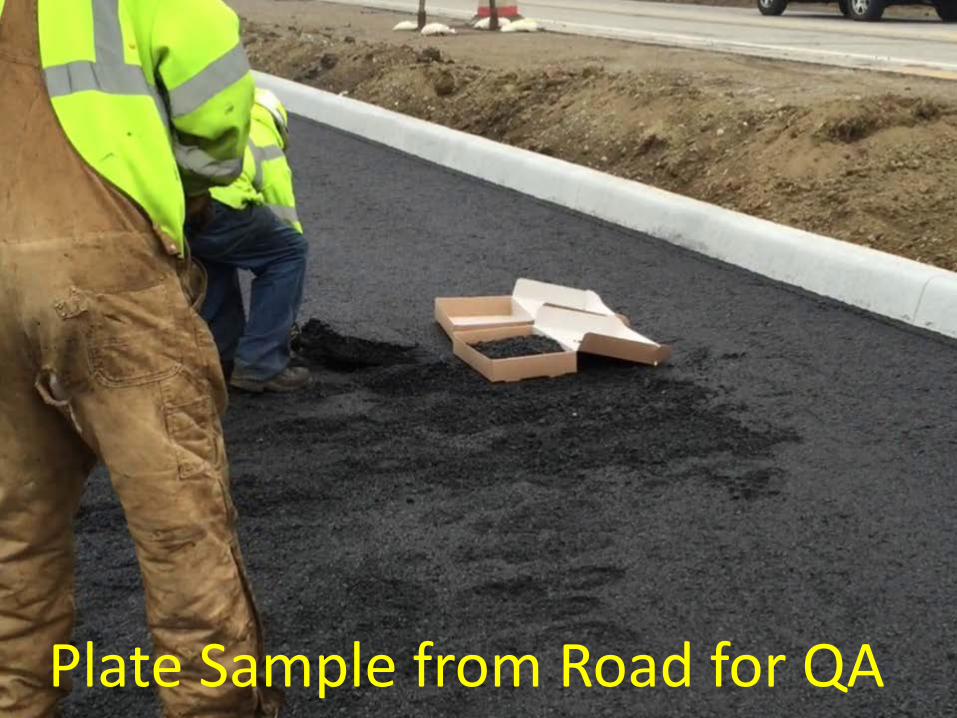
Plate Sample from Road for QA

Loose Research Samples

Research Samples (N30 and N100)
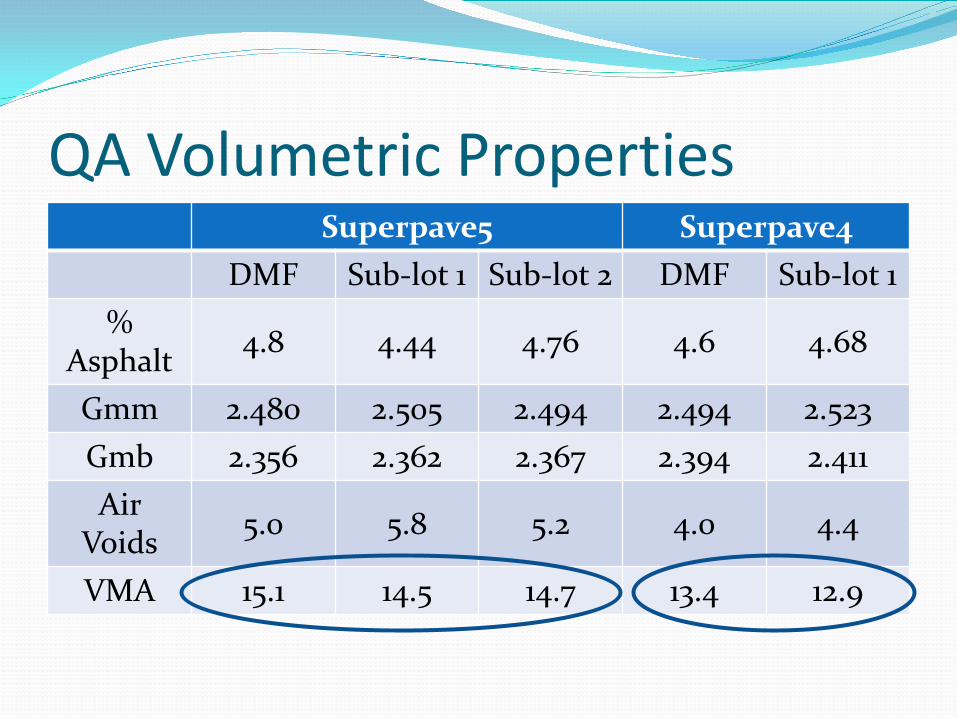
QA Volumetric Properties Superpave5 Superpave4
DMF Sub-lot 1 Sub-lot 2 DMF Sub-lot 1 %
Asphalt 4.8 4.44 4.76 4.6 4.68
Gmm 2.480 2.505 2.494 2.494 2.523 Gmb 2.356 2.362 2.367 2.394 2.411 Air
Voids 5.0 5.8 5.2 4.0 4.4
VMA 15.1 14.5 14.7 13.4 12.9

QA Core Density Superpave5 Superpave4
DMF Sublot 1 Sublot 2 DMF Sublot 1 Gmm 2.505 2.494 2.521
Core Gmb 1 2.412 2.345 2.351 Core Gmb 2 2.418 2.398 2.300
%Gmm 1 96.3 94.0 93.2 %Gmm 2 96.5 96.2 91.2 Air Voids 1 3.7 6.0 6.8 Air Voids 2 3.5 3.8 8.8
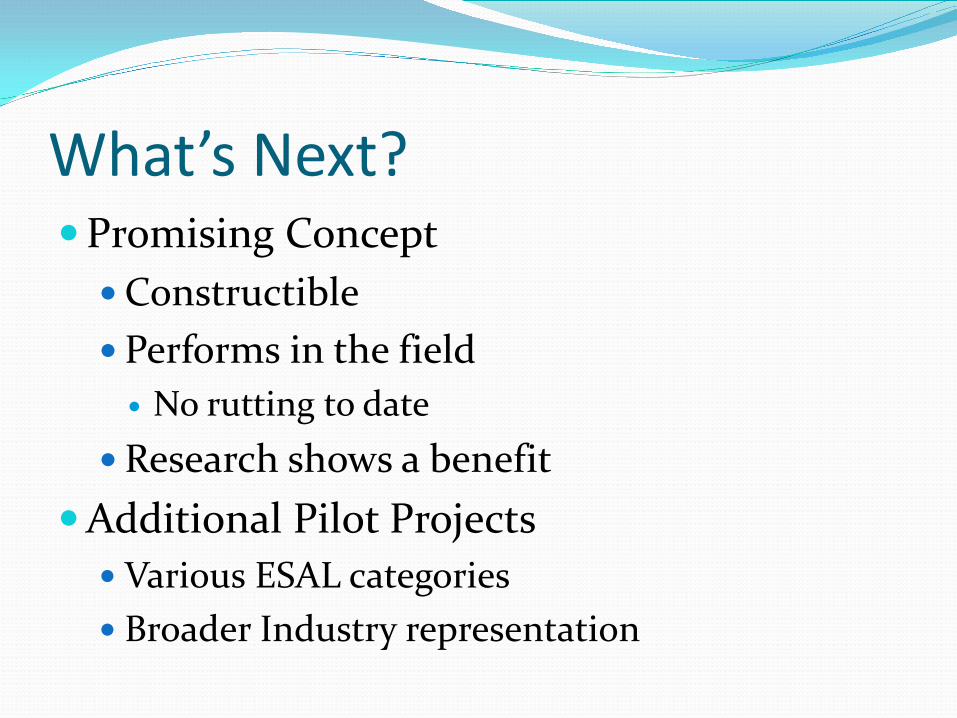
What’s Next? Promising Concept Constructible Performs in the field No rutting to date
Research shows a benefit Additional Pilot Projects Various ESAL categories Broader Industry representation

Thank you!
Top Related