


Languages
Pages
Legal

Stellenbosch University, Sasol Art Gallery
Stellenbosch, South Africa, 9 May 2007
UNIVERSITIES’ CONTRIBUTION
TO KNOWLEDGE ECONOMY
Professor Jorma Routti
CIM Creative Industries Management & Helsinki University of Technology
[email protected] [email protected]
Former President of Sitra & Director General of Research DG of European Commision


Finland Europe World

0
2
4
6
8
10
12
14
16
2003 2005 2007 2009 2011 2013 2015
Trillions of 1995 international $
India China Brazil
Canada France Germany
Italy Japan Mexico
Russian Federation United Kingdom United States
India
China
United States
JapanGermany
United Kingdom
France
Italy
Canada
Mexico
Russian Federation
Brazil
Real GDP (PPP): Projections 2004-2015 (Using 1991-2003 Average Growth Rates)
©cjd©cjd

Manufacturing Output by Region in 1750-2005, % of world total
0
10
20
30
40
50
60
70
1750 1800 1850 1900 1950 2000
East Asia
North America
Europe
East Asia: China, Japan, India
North America: USA, Canada
Europe: Germany, Great Britain,
France, Italy, Spain, Sweden,
Belgium, Switzerland
Sources: Bairoch (1982), UNSD,
ETLA
%
First Unbundling of Industries 1950-2000Second Unbundling of Services 2000-


Lisbon strategy
Research
Growth and Jobs
Education Innovation
S&T contributes to the Lisbon objectives: economic growth, employment creation, environmental protection, social challenges: fight poverty, improve human health and quality of life (GSM, remote working, safe roads, etc.)
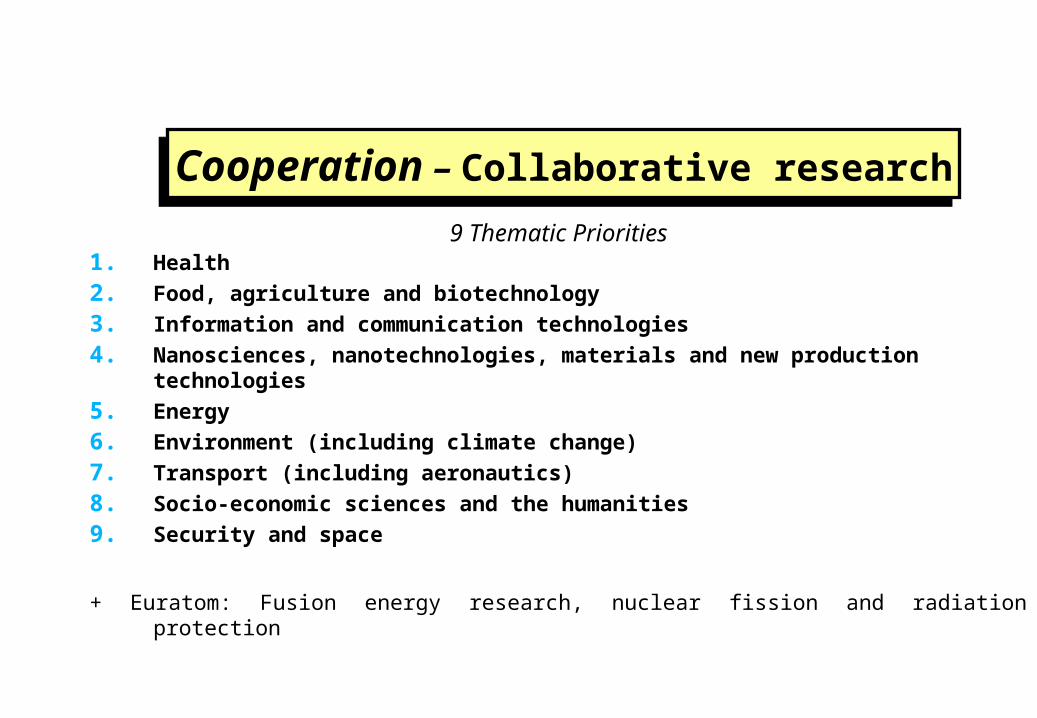
9 Thematic Priorities1. Health
2. Food, agriculture and biotechnology
3. Information and communication technologies
4. Nanosciences, nanotechnologies, materials and new production technologies
5. Energy
6. Environment (including climate change)
7. Transport (including aeronautics)
8. Socio-economic sciences and the humanities
9. Security and space
+ Euratom: Fusion energy research, nuclear fission and radiation protection
Cooperation – Collaborative researchCooperation – Collaborative research

Joint Technology Initiatives
Global Monitoring for Environment
and Security
Global Monitoring for Environment
and Security
Hydrogen and Fuel Cells for a Sustainable Energy
Future
Hydrogen and Fuel Cells for a Sustainable Energy
Future
Towards new Nanoelectronics
Approaches
Towards new Nanoelectronics
Approaches
Embedded systemsEmbedded systems
Aeronautics and Air Transport
Aeronautics and Air Transport
Innovative Medicines for the Citizens
of Europe
Innovative Medicines for the Citizens
of Europe
Other possible themes to be identified later…


The Four Pillars of the Knowledge Economy
Education
InnovationInformation
Infrastructure
Interconnected
Interdependent
Interconnected
Interdependent
Economic and Institutional
Regime

Strong Correlation: GDP/Capita & KEI
Source: KAM Africa GDP/capita = $2624
Regression KEI 2002 and GDP per capita 2002
0
5,000
10,000
15,000
20,000
25,000
30,000
35,000
40,000
0.00 1.00 2.00 3.00 4.00 5.00 6.00 7.00 8.00 9.00 10.00
Knowledge Economy Index 2002
GD
P p
er
ca
pit
a 2
00
2 (
19
95
co
ns
tan
t U
S$
20
02
)
R2 = 0.66Finland
Brazil
ChinaIndia
Korea
RussiaJordan
Ireland
Poland
South Africa
Ethiopia Ghana
Turkey
USA
UK
Slovenia
Taiwan
Africa

Stages of Industrial and Economic Development
FOREST-BASED INDUSTRIES
MACHINERY, ENGIN. IND.
FOREST-BASED IND
ICT, ELECTRONICSMACHINERY, ENG.FOREST-BASED INDCHEMICALS

0,00
0,50
1,00
1,50
2,00
2,50
3,00
3,50
4,00
4,50
19
81
19
84
19
87
19
90
19
93
19
96
19
99
20
02
20
05
Finland
Japan
USA
EU
Sw eden
China
R&D expenditure, % of GDP

Industrial Productionat 2000 prices
0
2
4
6
8
10
12
1951
1955
1959
1963
1967
1971
1975
1979
1983
1987
1991
1995
1999
2003
Bill. EUR
Electronics
Metals and engineering
Pulp and paper
Chemicals
Textiles and apparel
Sources: Statistics Finland, ETLA.

Telecommunications and Nokia's Change
1988 1998
Mobile Phones 60% Infrastructure 33% Other 7%
Floorings 1%
Chemicals 2%
Machinery 4%
Electrical Wholesale 4%
Rubber 6%
Information Systems 23%
Cables 9%
Paper 10%
Consumer Electronics 31%
Mobile Telephones 5%Telecommunications 5%
Mobile Telephones 5%Telecommunications 5%
2000
Net sales USD 5.2 billion 1988 Market capitalization USD 1.4 billion at year end 1988
Net sales USD 19.9 billion 1999Market capitalization USD 236.5 billion, as of February 28th 2000
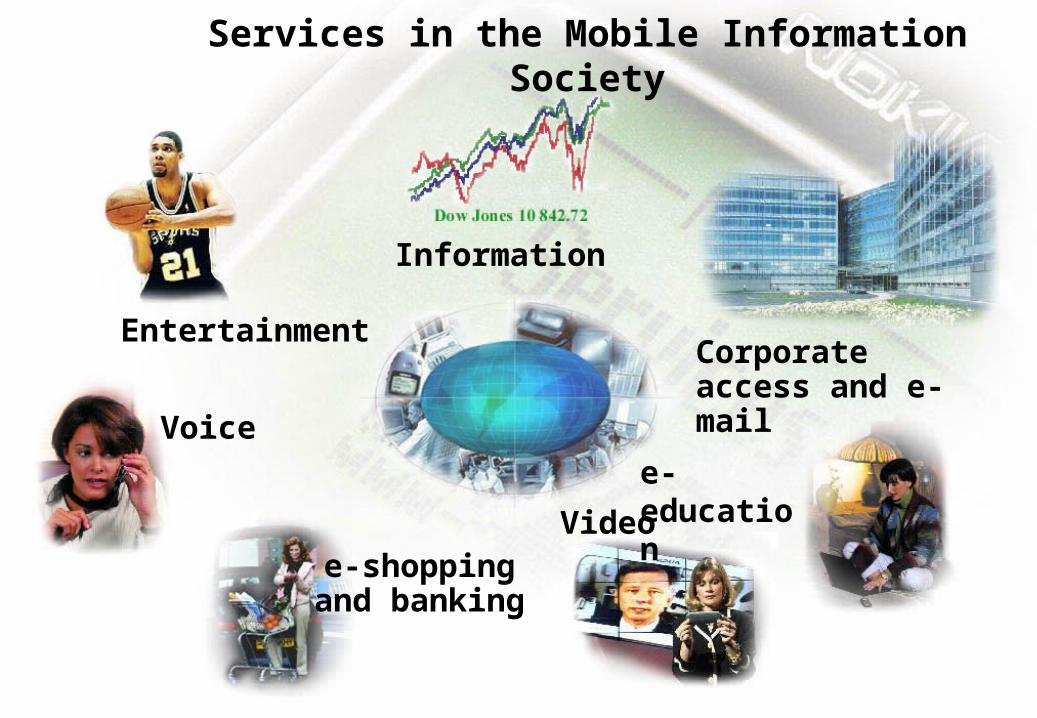
Services in the Mobile Information Society
Information
Entertainment
e-shoppingand banking
Voice
Corporate access and e-mail
e-education
Video

MARKETS quality
competitiveness price
competitiveness environmental
expertise
F O R E S T I N D U S T R Y
Pulp and paper technology
Wood products industry
Machines, machinery and processes
A11/ 99-08
Securing competitiveness inthe Forest Industry
FORESTRY
CONSTRUCTION AND WOOD TECHNOLOGY modification of wood construction
technology andarchitecture
logistics, assembly
MANUFACTURING TECHNOLOGY forestry machines process and production machinery material technology
BIOTECHNOLOGY enzymes rot prevention gene technology
ENERGY AND ENVIRON-MENTAL TECHNOLOGY biofuels, combustion technology ecobalances closed cycles energy-saving and
emissions
CHEMICAL TECHNOLOGY paper and bleaching chemicals surface treatment
substances pigments, adhesives
INFORMATIONTECHNOLOGY sensors, measuring
and control computational
intelligence,simulation andmachine vision
multimedia and telecommunication tomography

Co-operation between companies and universities and research institutes
Norway
UK
Sweden
FINLAND
Portugal
Austria
Netherlands
Ireland
Italy
France
Denmark
Germany
Belgium
EU
Norway
UK
Sweden
FINLAND
Portugal
Austria
Netherlands
Ireland
Italy
France
Denmark
Germany
Belgium
EU
0 20 40 60 %
Share of innovative companieshaving co-operation agreements
with universities (1994-1996)
Share of innovative companies havingco-operation agreements with public
research institutes (1994-1996)
Source: Eurostat, Enterprise DG, 2nd Community Innovation Survey
J05/ 00-06
0 20 40 60 %

Science Parks in 1980 – 2000 and CoE concept
University Company
in 1980’s
Companies
Universities
Science Park
in early 1990’s
Companies
Science Park
Centre of Expertise Programme Universities
Polytechnics
in late 1990’s and 2000’s

Regional networking with partners from Oulu in electronics and telecommunications programmes
DM 5862003-2004 Copyright © Tekes
Includes partners who participated in at least three projects in Tekes Electronics and Telecommunications technology programmes.
Lappeenranta University of Technology (Lappeenranta)
Salcomp Oy (Kemijärvi)
CCC (Oulu)
Sonera (Helsinki)
Nokia Mobile Phones (Oulu)National Semiconductor Finland Oy,former Fincitec Oy (Kemi)
University of Oulu (Oulu)
Efore Oy (Helsinki)
Projekti-Insinöörit Oy (Helsinki)
Cybelius Software Oy (Oulu)
Teleste (Turku)
Tampere University of Technology (Tampere)
Nokia Networks (Oulu)
ADC Telecommunications Oy (Oulu)
VTT, Technical ResearchCentre of Finland (Helsinki)
Helsinki University of Technology (Espoo)
JOT Automation Oy (Oulu)
Nokia Research Center (Helsinki)
VTT, Technical ResearchCentre of Finland (Oulu)
Extrabit Oy (Oulu)
ABB (Helsinki)
NetHawk Oy (Oulu)
Elektrobit Oy (Oulu)
Vaisala Oyj (Helsinki)
Polar Electro Oy (Oulu)
Filtronic LK Oy (Oulu)
Aspocomp Oy (Helsinki)
Elcoteq Network Oyj (Lohja)
Planar Systems Oy (Helsinki)Ultraprint Oy (Oulu)
Suunto Oy (Helsinki)
Picopak (Lohja)Nokia Mobile Phones (Salo)

Large companies (more than 500 employees) receive 16 % of Tekes total funding and 26 % of Tekesbusiness R&D funding. Large companies co-finance Tekes R&D projects in universities, publicresearch institutes and SMEs more than Tekes finances their projects.This system is managed by Tekes funding criteria. The system increases the quality of R&D projectsand has important externalities in:• knowledge transfer between large companies and research organisations• development of SMEs as subcontractors and strategic partners of large companies
Funding flows of Tekes funded R&D projectsbetween large companies (more than 500
employees), research organisations and SMEs
DM 5877408-2003 Copyright © Tekes
+ 60
- 31
- 15
- 16
- 2
UniversitiesPublic research
centresSMEs
Tekes
60 mill.euros
Projectvolume
180 mill. euros31 mill. euros 15 mill. euros
16 mill. euros
Annual average 2000-2002
Funding flows to/from large companies,million euros
• Tekes funding to R&D projectsof large companies
• Large companies projects buyresearch services from researchorganisations
• Large companies projects useSMEs as subcontractors
• Large companies co-financepublic research projects
• Net flow
Large companies

The stimulating effect of public funding on R&D
5 10 15 20 25
FINLAND
Sweden
OECD Max
USA
Increased public funding
strengthens the stimulating effect
Growth of the stimulating effect
decreases
Public funding compensates
corporate efforts
The chart is directional and the figures include uncertainty.
Share of public fundingin corporate
R&D spending,%
The stimulating effect ofpublic funding on R&D
Source: OECD, Science, Technology and Industry Outlook 2000. (statistics from 17 countries, compiled over a period of 15 years). DM 38065
04-2002 Copyright © Tekes

Innovation and Funding System
Pri
vate
Basic research Applied research Business R&D
Business developmentMarketingInternationalisation
Company R&D
Business Angels
Pu
blic
UniversitiesResearch Institutes
Technology Funding
Venture Funds
Sectorial research
ResearchCouncils
Science Parks


s
SOCIAL & HUMAN CAPITAL
TECHNOLOGY & INNOVATION
RE
SE
AR
CH
CA
PA
CI
TY A
BS
OR
TIO
N C
AP
AC
ITY
SUPPLY USERS
CREATORS DEMAND

s
SOCIAL & HUMAN CAPITAL
TECHNOLOGY & INNOVATION
RE
SE
AR
CH
CA
PA
CI
TY
AB
SO
RT
ION
CA
PA
CIT
Y
SUPPLY USERS
CREATORS DEMAND
JAPAN
USA
IRL
ITA
SWE
DE
FR
UK
FIN


ITERInternational Thermonuclear Experimental Reactor
Cleaner Energy for our Planet
Main ITER Parameters
Total Fusion Power (MW) 500
Q - Fusion Power/AuxiliaryHeating Power 10
Average (1 MeV) neutron wall loading (MW/m2) 0.57
Plasma major radius (m) 6.2
Plasma minor radius (m) 2.0
Plasma Current (MAmpere) 15
Toroidal Field at 6.2 m radius(T) 5.3
Plasma Volume (m3) 837
Installed auxiliary heating/current drive power (MW) 73

TIME – ENERGY - INFORMATION
E = 0
I = 0 T = 0
I = maxT = max
E = max
Top Related