


Languages
Pages
Legal


UNIVERSITA’ DEGLI STUDI DI PARMA
Faculty of Agriculture
Ph.D. in Food Science and Technology
XXIII cycle 2008-2010
STEAM OVEN COOKING :
EFFECT OF DIFFERENT RELATIVE HUMIDITIES ON
PHYSICAL CHARACTERISTICS, WATER STATUS AND
SENSORIAL QUALITY OF TURKEY MEAT.
Tutor Prof. Davide Barbanti Ph.D. coordinator Prof. Germano Mucchetti
Ph.D. Beatrice Mora

2
3
To my familyTo my familyTo my familyTo my family
Genius is one percent inspiration Genius is one percent inspiration Genius is one percent inspiration Genius is one percent inspiration
and ninetyand ninetyand ninetyand ninety----nine percent perspiration nine percent perspiration nine percent perspiration nine percent perspiration
T.A. Edison (1847T.A. Edison (1847T.A. Edison (1847T.A. Edison (1847----1931)1931)1931)1931)

4

5
Summary
Steam oven cooking of turkey meat is widely used in industrial processing, foodservice
and domestic cooking. Steam cooking is achieved by steam injection in the oven chamber
coupled with the air forced convection.
Despite the large application of steam in cooking, its effect on cooking yield, heating
profiles, texture, colour and sensory properties of cooked meat has not yet been clearly
explained. Published data about the use of steam-convection oven are still rather limited
and contradictory, and mainly deal with steam cooking in the saturation condition
compared to dry oven cooking. Only little information is available on the use of steam
quantities lower than the saturation condition.
In this work the effect of different steam levels (air relative humidities) on turkey meat
cooking with a systematic and multi-analytical approach was evaluated. The cooking trials
were performed with an experimental steam cooking device expressly designed to
modulate the air relative humidity. Quality evaluation of cooked turkey meat was carried
out investigating physical characteristics (texture, colour, shrinkage), water status and
sensorial properties. The description of the water status with different parameters such as
moisture content, water holding capacity and 1H NMR mobility resulted a very valuable
tool for a better understanding of physical characteristics and sensorial properties of
cooked meat, that were closely related to the different denaturation of protein induced by
the cooking process.
Results indicated that different steam levels (relative humidities) led to different meat
cooking performances and cooked meat quality.
The application of steam in cooking allows for shorter cooking times than dry oven
cooking when the temperature of the surface of meat results sufficiently higher than the
temperature of the centre. Low steam cooking, characterized by shorter cooking times
than those with no steam, resulted in higher cooking yield and greater perceived
tenderness of meat than high steam cooking (close to the saturation condition).
The minimum relative humidity values allowing positive effects on meat quality and higher
potential water saving at low cooking temperatures (80-150°C), were defined.
The use of low steam quantities at low cooking temperatures could be considered as a
valid alternative to saturation cooking, particularly indicated for industrial applications, due
to the increased quality of turkey meat and the potential water saving.

6

7
Table of contents
INTRODUCTION.................................................................................................. 13
1. OVEN COOKING .............................................................................................................................. 13 1.1 Aim of cooking foods................................................................................................................... 13 1.2 Heat and mass transfer............................................................................................................... 13
1.2.1 Heat transfer ........................................................................................................................ 13 1.2.2 Mass transfer ....................................................................................................................... 16
1.3 Oven cooking equipment ............................................................................................................ 18 1.4 Cooking modifications on foods .................................................................................................. 19
1.4.1 Texture................................................................................................................................. 19 1.4.2 Flavour, aroma and colour................................................................................................... 20 1.4.3 Nutritional value ................................................................................................................... 21
1.5 Cook value .................................................................................................................................. 22
2 AIR - STEAM MIXTURES.................................................................................................................. 23 2.1 Air - Steam mixtures properties .................................................................................................. 23 2.2 Mixtures parameters ................................................................................................................... 25
2.2.1 Relative humidity – RH - (ϕ ) ............................................................................................. 25
2.2.2 Absolute humidity ( x ) ......................................................................................................... 27 2.2.3 Degree of saturation (ψ ) ................................................................................................... 27
2.3 Psychrometric chart .................................................................................................................... 27 2.4 Methods of air humidity determination........................................................................................ 29
3. MEAT ................................................................................................................................................ 30 3.1 Structure of muscle ..................................................................................................................... 30 3.2 Composition of meat ................................................................................................................... 33
3.2.1 Water ................................................................................................................................... 33 3.2.2 Proteins................................................................................................................................ 33
3.2.2.2 Myofibrillar proteins .......................................................................................................35 3.2.2.3 Stromal proteins or connective tissue proteins ........................................................ ….36
3.2.3 Lipids ................................................................................................................................... 36 3.2.4 Carbohydrate, minerals and vitamins.................................................................................. 37
3.3 Poultry meat: Turkey................................................................................................................... 37
4. QUALITY OF COOKED MEAT PRODUCTS .................................................................................. 38 4.1 Physical properties...................................................................................................................... 38
4.1.1 Colour .................................................................................................................................. 38 4.1.2 Texture................................................................................................................................. 40 4.1.3 Shrinkage............................................................................................................................. 42

8
4.1.4 Cooking yield ....................................................................................................................... 43 4.2 Water properties of meat............................................................................................................. 43
4.2.1 Moisture Content ................................................................................................................. 43 4.2.2 Water Holding Capacity ....................................................................................................... 43 4.2.3 Molecular mobility - Proton Magnetic Resonance ............................................................... 45
4.3 Sensory properties ...................................................................................................................... 46
5. STEAM OVEN COOKING................................................................................................................. 48 5.1 Effect of steam on foods ............................................................................................................ 48 5.2 Steam ovens ............................................................................................................................... 48 5.3 Effect of steam oven cooking on meat at low temperatures ....................................................... 49
OBJECTIVE ......................................................................................................... 53
SET UP OF THE EXPERIMENTAL TRIALS........................................................ 55
1. COOKING EQUIPMENT: SET-UP OF AN EXPERIMENTAL STEAM CONVECTION OVEN
WITH CONTROLLED STEAM INJECTION (CONTROLLED HUMIDITY) ......................................... 55 1.1. Design and development of the experimental steam cooking device........................................ 55 1.2. Experimental steam cooking device performance and optimization.......................................... 57
2. MUSCLE PREPARATION ................................................................................................................ 59
3. COOKING TREATMENTS................................................................................................................ 60
METHODS OF ANALYSIS................................................................................... 61
1. PHYSICAL PROPERTIES ................................................................................................................ 61 1.1 Colour.......................................................................................................................................... 61 1.2 Texture ........................................................................................................................................ 61 1.3 Shrinkage .................................................................................................................................... 62 1.4 Cooking yield............................................................................................................................... 62
2 WATER PROPERTIES OF COOKED MEAT PRODUCTS.............................................................. 62 2.1 Moisture Content......................................................................................................................... 62 2.2 Water holding capacity (WHC).................................................................................................... 62 2.3 Low resolution nuclear magnetic resonance (1H NMR) .............................................................. 62
3. SENSORY ANALYSIS...................................................................................................................... 63
4. STATISTICAL ANALYSIS................................................................................................................ 63
9
SECTION A.......................................................................................................... 65
OVEN COOKING OF TURKEY MEAT AT DIFFERENT RELATIVE HUMIDITIES............................. 65 1. Abstract ......................................................................................................................................... 65 2. Aim of the Work............................................................................................................................. 65 3. Materials and Methods.................................................................................................................. 66
3.1 Sample Preparation ................................................................................................................ 66 3.2 Cooking trials .......................................................................................................................... 66 3.3 Analyses ................................................................................................................................. 66 3.4 Statistical Analysis .................................................................................................................. 66
4. Results and Discussion................................................................................................................. 66 4.1 Thermal profiles ...................................................................................................................... 66 4.2 Cooking time........................................................................................................................... 68 4.3 Cook value.............................................................................................................................. 68 4.4 Moisture content ..................................................................................................................... 69 4.5 Shrinkage................................................................................................................................ 69 4.6 Weight loss ............................................................................................................................. 69 4.7 Texture properties................................................................................................................... 70 4.8 Colour ..................................................................................................................................... 71
5. Conclusions................................................................................................................................... 72 6. List of Figures................................................................................................................................ 73 7. List of Tables................................................................................................................................. 78
SECTION B1........................................................................................................ 83
EFFECT OF DIFFERENT AIR/STEAM CONVECTION COOKING METHODS ON TURKEY
BREAST MEAT. PART 1. INSTRUMENTAL QUALITY AND SENSORY PROPERTIES. ................. 83 1. Abstract ......................................................................................................................................... 83 2. Aim of the Work............................................................................................................................. 83 3. Materials and Methods.................................................................................................................. 83
3.1 Sample Preparation ................................................................................................................ 83 3.2 Cooking treatments................................................................................................................. 84 3.3 Physical Analyses................................................................................................................... 84 3.4 Sensory analysis..................................................................................................................... 84 3.5 Statistical analysis .................................................................................................................. 85
4. Results and discussion ................................................................................................................. 85 4.1 Cooking treatments................................................................................................................. 85
4.1.1 Water consumption ..........................................................................................................85 4.1.2 Cooking rates and temperatures......................................................................................85 4.1.3 Cook value .......................................................................................................................86
4.2 Physical analyses ................................................................................................................... 86

10
4.2.1 Cooking yield ....................................................................................................................86 4.2.2 Shrinkage .........................................................................................................................87 4.2.3 Texture .............................................................................................................................88 4.2.4 Colour ...............................................................................................................................89
4.3 Sensory analysis..................................................................................................................... 90 5. Conclusions................................................................................................................................... 91 6. List of Figures................................................................................................................................ 92 7. List of Tables ................................................................................................................................. 96
SECTION B2........................................................................................................ 99
EFFECT OF DIFFERENT AIR/STEAM CONVECTION COOKING METHODS ON TURKEY
BREAST MEAT. PART 2. WATER STATUS....................................................................................... 99 1. Abstract ......................................................................................................................................... 99 2. Aim of the work ............................................................................................................................. 99 3. Materials and Methods................................................................................................................ 100
3.1 Muscle preparation and cooking treatments......................................................................... 100 3.2 Analysis of the water properties of cooked meat products................................................... 100 3.3 Statistical analysis ................................................................................................................ 100
4. Results and Discussion............................................................................................................... 100 4.1 Moisture content ................................................................................................................... 100 4.2 Water holding capacity (WHC) ............................................................................................. 101 4.3 1H NMR mobility ................................................................................................................... 102 4.4 1H NMR mobility post-centrifugation.................................................................................... 105
5. Conclusions................................................................................................................................. 107 6. List of Figures.............................................................................................................................. 108 7. List of Tables ............................................................................................................................... 115
SECTION C........................................................................................................ 117
STEAM OVEN COOKING AT LOW TEMPERATURES OF TURKEY MEAT: DETERMINATION
OF THE MINIMUM RELATIVE HUMIDITY VALUE TO OBTAIN THE BEST MEAT QUALITY
WITH THE HIGHEST WATER SAVING. ............................................................................................ 117 1. Introduction.................................................................................................................................. 117 2. Aim of the Work........................................................................................................................... 118 3. Materials and Methods................................................................................................................ 118
3.1 Relation between Wet Bulb Temperature and Relative Humidity: comparison between the
theoretic psychrometric results and experimental data. ............................................................. 118 3.2 Determination of the minimum relative humidity value to obtain the best meat quality at
different cooking temperatures and water saving evaluation. .................................................... 119 4. Results and Discussion............................................................................................................... 119

11
4.1 Relation between Wet Bulb Temperature and Relative Humidity: comparison between the
theoretic psychrometric results and experimental data. ............................................................. 119 4.2 Determination of the minimum relative humidity value to obtain the best meat quality at
different cooking temperatures and water saving evaluation. .................................................... 120 5. Conclusions................................................................................................................................. 120 6. List of Figures.............................................................................................................................. 122
REFERENCES................................................................................................... 127
VITA ................................................................................................................... 141

12

13
Introduction
1. OVEN COOKING 1.1 Aim of cooking foods
The oven cooking of foods is one of the most used operations both in industrial and in
domestic applications. It is a unit operation that use heated air, often combined with
steam, to make food more palatable, digestible and microbiologically safe (Bender, 1999;
Tornberg, 2005).
Cooking alters the eating quality of foods: the development of controlled physical-chemical
modifications leads to an increase of sensory acceptability from the consumers. Moreover,
cooking process increases the bio-availability of several nutrients and improves food
preservation by destruction of micro-organisms and reduction of the water activity at the
surface of the food (Fellows, 2000).
1.2 Heat and mass transfer
Cooking involves simultaneous heat and mass transfer; heat is transferred into the food
from the hot surfaces and from the air of the oven. Simultaneously the moisture is
transferred from the food to the dry air that surrounds it and then it is removed from the
oven (Figure.1).
Air
Solids
Moisture
Moist food Cooked food
Dry Air Moist AirAir
Solids
Moisture
Moist food Cooked food
Dry Air Moist Air
Figure 1. Diagram of material flow during cooking in an oven (Fellows, 2000)
1.2.1 Heat transfer
In an oven, heat is supplied to the surface of the food by a combination of the three
mechanisms of heat transfer: conduction, convection and radiation (Datta, 2002). All
three types may occur at the same time, and it is advisable to consider the heat transfer
by each type in any particular case.

14
Conduction is the transfer of heat from one part of a body to another part of the same
body, or from one body to another in physical contact with it, without appreciable
displacement of the particles of the body (Knudsen et al., 1997). The transfer of thermal
energy between neighbouring molecules in a substance is due to a temperature gradient.
It always takes place from a region of higher temperature to a region of lower
temperature, and acts to equalize the temperature differences. In solids, it is due to the
combination of vibrations of the molecules in a lattice and the energy transport by free
electrons. In gases and liquids, conduction is due to the collisions and diffusion of the
molecules during their random motion. The law of heat conduction, also known as
Fourier's law, states that the time rate of heat transfer through a material is proportional to
the negative gradient in the temperature and to the area, at right angles to that gradient,
through which the heat is flowing (Datta, 2002).
dx
dTk
A
qx −=
Where:
qx: rate of heat flow in the x direction [J/s],
A: is the area perpendicular to the x direction through which the heat flows [m2],
k: thermal conductivity of the medium [W/(m*K)],
dT: absolute temperature difference [K],
dx: space difference (m)
Conductive heat transfer in oven cooking occurs through the pan or tray on which the food
is placed to the food and through the food matrix itself (from the heated surface to the
geometric centre of the product). Heat passes through the food by conduction in most
cases, foods have low thermal conductivity that causes low rates of conductive heat
transfer and it has an important influence on cooking time. Conduction of heat through
cooking pans or trays increases the temperature difference at the base of the food and
increases the rate of cooking compared to the surface crust. The size of the pieces of food
is an important factor in cooking time as it determines the distance that heat must travel to
cook the centre of the food adequately (Fellows, 2000).
Convection heat transfer occurs from one point to another within a fluid, gas, or liquid
caused by molecular motion and by the mixing of one portion of the fluid with another. It
cannot take place in solids, since neither bulk current flows nor significant diffusion can
take place in solids. In natural convection, the motion of the fluid is entirely the result of
differences in density resulting from temperature differences; in forced convection, the

15
motion is produced by mechanical means. When the forced velocity is relatively low, it
should be realized that “free-convection” factors, such as density and temperature
difference, may have an important influence. (Knudsen, Hottel, Sarofim, Wankat, &
Knaebel, 1997). The law that describe this phenomenon is reported below.
)( 2121 TThAq −=−
Where:
q 1-2: rate of heat flow from the fluid 1 to the 2 ones [J/s]
A: is the surface of heat exchange [m2]
h: heat transfer coefficient [W/(m2*K)]
T1: fluid/bulk absolute temperature [K]
T2: fluid/surface absolute temperature [K]
In oven cooking the heat from circulating air, other gases and moisture vapour is
transferred to the food surface by a convective mechanism. The convection heat transfer
coefficient depends on the type of fluid, flow properties and temperature properties
(Knudsen et al., 1997).
The order of magnitude of the heat transfer coefficient of some typical heat flux/ medium
is reported in Figure 2.
Free convection, air
Forced convection, air
Forced convection, water
Boiling water
Condensing water vapour
Heat transfer coefficient (W/m2K)
1 10 102 103 104 105
Figure 2. Order of magnitude estimates of the heat transfer coefficient h for various
simulations (Datta, 2002).
It is important to highlight how condensing water vapour has a heat transfer coefficient
three times higher than forced convection air. Hence, the application of steam leads to an
acceleration of the heating process; indeed in oven cooking the air forced convection
method is often coupled with steam injection in the oven chamber to reduce the cooking
time and to prevent surface dehydration (Belk, Luchak, & Miller, 1993; Murphy, Johnson,
Duncan, Clausen, Davis & March, 2001).

16
Generally in oven cooking a boundary film of air acts as a resistance to heat transfer into
the food and to movement of water vapour from the food. The thickness of the boundary
layer is determined mostly by the velocity of the air and the surface properties of the food
and in part controls the rates of heat and mass transfer. Convection currents promote
uniform heat distribution throughout the oven, and many commercial designs are fitted
with fans to supplement natural convection currents and to reduce the thickness of
boundary films. This increases heat transfer coefficients and improves the efficiency of
energy utilisation (Fellows, 2000).
The radiative heat transfer is the transfer of energy (heat) from one body to another, not
in contact with it, by means of wave motion through space (electromagnetic waves,
Knudsen et al., 1997). The radiative heat transfer is described by the equation following:
4TA
q⋅= σ
Where:
q : heat-flux density, energy per time [W]
σ : Stefan-Boltzmann constant = 5.67*10-8 W/(m2*K4)
T : absolute temperature [K]
A: is the surface of heat exchange [m2]
In oven cooking the infrared radiation from the oven walls is absorbed into the food and
converted to heat.
1.2.2 Mass transfer
When a food is placed in a hot oven, the low humidity of air in the oven creates a moisture
vapour pressure gradient, which causes a moisture depletion at the surface of the food
and water evaporate from the surface of the food to the surrounding air. The evaporation
of water from the food’s surface in turn creates the water diffusion inside the food matrix
that is the movement of moisture from the interior of the food to the surface (Fellows,
2000).
The molecules of a liquid to evaporate must be located near the surface, be moving in the
proper direction, and have sufficient kinetic energy to overcome liquid-phase
intermolecular forces. If evaporation takes place in a closed vessel, the escaping
molecules accumulate as a vapour above the liquid. Many of the molecules return to the
liquid, with returning molecules becoming more frequent as the density and pressure of
the vapour increases. When the process of escape and return reaches an equilibrium, the

17
vapour is said to be "saturated," and no further change in either vapour pressure and
density or liquid temperature will occur. For a closed system consisting of vapour and
liquid of a pure substance, an equilibrium state takes place (liquid-vapour) that is directly
related to the vapour pressure of the substance, as given by the Clausius-Clapeyron
relation (Datta, 2002):
−⋅
∆−=
121
2 11ln
TTR
H
P
P vap
Where:
P1, P2: vapour pressures [Pa] at temperatures T1, T2 respectively [K],
∆Hvap: enthalpy of vaporization, [J/mol],
R: :universal gas constant. [J/(mol*K)].
The rate of evaporation in an open system is related to the vapour pressure found in a
closed system. If a liquid is heated, when the vapour pressure reaches the ambient
pressure the liquid will boil. The ability for a molecule of a liquid to evaporate is largely
based on the amount of kinetic energy an individual particle may possess. Even at lower
temperatures, individual molecules of a liquid can evaporate if they have more than the
minimum amount of kinetic energy required for vaporization. The water evaporation from
the food surface during the cooking process determine a water vapour pressure gradient
inside the food matrix that is the driving force of water diffusion from the centre to the
surface of the product. Diffusion is described by Fick’s First Law (reported below in the
double version for liquid and gasses), it relates flux of a component to its composition
gradient, employing a constant of proportionality called diffusivity (Hallstrom, 1992).
dx
dCDJ A
ABA ⋅−= for the liquids, dxTR
dPDJ A
ABA⋅⋅
⋅−= for the gases.
Where:
JA: Molar flux of A with respect to mean volume velocity [kmol/(m2*s)]
DAB : diffusivity [m2/s].
dCA/dx : concentration gradient along the axis of diffusion [kmol/m]
dPA/dx: pressure gradient along the axis of diffusion [Pa/m]
R: universal gas constant = 8.31 J/mol K
T : absolute temperature [K]

18
The extent of moisture loss is determined by the nature of the food, movement of air in the
oven and the rate of heat transfer. When the rate of moisture loss from the surface
exceeds the rate of movement from the interior, the zone of evaporation moves inside the
food, the surface dries out, its temperature rises to the temperature of the hot air and a
crust is formed (Fellows, 2000). Because cooking takes place at atmospheric pressure
and moisture escapes freely from the food, the internal temperature of the food does not
exceed 100ºC. These changes are similar to those in hot-air drying, but the more rapid
heating and higher temperatures used in cooking cause complex changes to the
components of the food at the surface. These changes both enhance eating qualities and
retain moisture in the bulk of the food. In contrast with dehydration, where the aim is to
remove as much water as possible with minimal changes in sensory quality, in cooking
the heat-induced changes at the surface of the food and retention of moisture in the
interior of some products (cake, bread, meats, etc.) are desirable quality characteristics. In
other products, such as biscuits and crispbread, loss of moisture from the interior is
required to produce the desired crisp texture.
The types of mass and heat transfer in the different zones of a food during cooking are
described in Table 1.
Zone in the food Type of mass transfer Type of heat transfer
Boundary layer Vapour diffusion Conduction, convection, radiation
Crust Vapour diffusion Conduction, vapour movement (convection)
Evaporation zoneVapour diffusion, surface diffusion, capillary flow
Conduction, movement of vapour and liquid water
Interior Capillary flow Conduction
Table 1.. Heat and mass transfer in food during cooking, adapted from Hallstrom & Skjoldebrand (1983). 1.3 Oven cooking equipment
The cooking procedure (cooking equipment, medium, and process parameters)
significantly affect the extent and the entity of the physical-chemical modifications that
lead to the characteristics of the final product (Belk et al. 1993; Fellows, 2000; Ferracane,
Pellegrini, Visconti, Graziani, Chiavaro, Miglio,& Fogliano, 2008).
Ovens are classified into direct or indirect heating types. In directly heated ovens, air
and the products of combustion are recirculated by natural convection or by fans. The
temperature in the oven is controlled automatically, by adjustment of air and fuel flow
rates to the burners. Natural gas is commonly used. Gas is burned in ribbon burners

19
located above and below conveyor belts in continuous ovens, and at the base of the
cabinet in batch ovens. The advantages of direct heating ovens include a short cooking
times, high thermal efficiencies, a good control over cooking conditions (using the fan
speed and the rate of fuel consumption) and a rapid start-up, as it is only necessary to
heat the air in the oven. However, care is necessary to prevent contamination of the food
by undesirable products of combustion, and gas burners require regular servicing to
maintain combustion efficiency. Electro-heating (radio-frequency, microwave and ohmic
heating) are another example of direct heating ovens.
In indirectly heated ovens there are steam tubes that are either heated directly by
burning fuel or supplied with steam from a remote boiler. The steam tubes then heat air in
the cooking chamber. Heated air is commonly recirculated through the cooking chamber
and through a separate heat exchanger. Alternatively, combustion gases are passed
through banks of radiator tubes in the cooking chamber, or fuel is burned between a
double wall and the combustion products are exhausted from the top of the oven. Electric
ovens are heated by induction heating radiator plates or bars. In batch ovens, the walls
and base are heated whereas in continuous ovens, heaters are located above, alongside
and below a conveyor (Fellows, 2000).
1.4 Cooking modifications on foods
Cooking causes changes in texture, flavour, aroma, colour and nutritional properties.
These main modifications determined by the cooking process on food are reported in the
sections below.
1.4.1 Texture
Changes in texture are determined by the nature of the food (moisture content and the
composition of fats, proteins and structural carbohydrates -cellulose, starches and
pectins-) and by the temperature and duration of heating. A characteristic of many cooked
foods is the formation of a dry crust which contains the moist bulk of the food (for example
meats, bread, potato). Other foods (for example biscuits) are baked to a lower moisture
content, and in these the changes that take place in the crust occur throughout the food.
In fruits and vegetables the principal heating modifications are starch gelatinization,
cellulose crystallisation and moisture content variations with food consequences as
rupture, crack, compression and permanently distort the relatively rigid cells food with a
shrunken and shrivelled appearance (Fellows, 2000).
When meat is heated, fats melt and become dispersed as oil through the food or drain out
as a component of ‘drip losses’. Collagen is solubilised below the surface, to form

20
gelatine. Proteins become denatured, lose their water-holding capacity and shrunk. This
forces out additional fats and water of to be expelled from the meat matrix, and they lead
to an increase of toughness of the food. Further increases in temperature cause the
drying of the surface, the texture becomes crisper and harder and a porous crust is
formed by coagulation, degradation and partial pyrolysis of proteins. A detailed discussion
of the physical changes of the meat is following given in section 4.
In cereal foods, changes to the granular structure of starch, gelatinisation and dehydration
produce the characteristic texture of the crust. Rapid heating produces an impermeable
crust which seals in moisture and fat and protects nutrients and flavour components from
degradation. A steep moisture vapour gradient is formed between the moist interior (high
aw) and hygroscopic exterior (low aw) of the food.
Slower heating permits larger quantities of moisture to escape from the surface of the food
before it is sealed by the crust as observed by Vittadini, Rinaldi, Chiavaro, Barbanti, &
Massini (2005) in their work on pork meat cooking. This results in a shallower moisture
vapour gradient and a drier interior in the food.
1.4.2 Flavour, aroma and colour
Cooking process leads to aroma development and important sensory characteristics of
cooked goods. Maillard browning reactions between sugars and amino acids occur on the
surface layers of food exposed at high temperatures (especially above about 140°C), so
you need to cook meats at high temperatures to develop “meaty” flavours. Details of the
chemistry of the Maillard reaction and Strecker degradation are discussed by a number of
workers including Mauron, (1982), Danehy (1986) and Bemiller & Whistler (1996). The
high temperatures and low moisture contents in the surface layers also cause
caramelisation of sugars and oxidation of fatty acids to aldehydes, lactones, ketones,
alcohols and esters. The Maillard reaction and Strecker degradation produce different
aromas according to the combination of free amino acids and sugars present in a
particular food. Each amino acid produces a characteristic aroma when heated with a
given sugar, owing to the production of a specific aldehyde. Different aromas are
produced, depending on the type of sugar and the heating conditions used (for example
the amino acid proline can produce aromas of potato, mushroom or burnt egg, when
heated with different sugars and at different temperatures). Further heating degrades
some of the volatiles produced by the above mechanisms to produce burnt or smoky
aromas. There are therefore a very large number of component aromas produced during
cooking. The type of aroma depends on the particular combination of fats, amino acids
and sugars present in the surface layers of food, the temperature and moisture content of
the food throughout the heating period and the time of heating.

21
The characteristic golden brown colour associated with roasted foods is due to Maillard
reactions, caramelisation of sugars and dextrins (either present in the food or produced by
hydrolysis of starches) to furfural and hydroxymethyl furfural, carbonisation of sugars, fats
and proteins (Mitsuo, 1988; Elizalde, Bressa, Dalla Rosa, 1992)
1.4.3 Nutritional value
Literature shows that the heat treatment of food (common culinary practice) significantly
influences cooking losses and content of basic chemical compounds (Clausen & Ovesen,
2001; Badiani et al. 2002; Fillion & Henry, 1998). The main nutritional changes during
cooking occur at the surface of foods, and the ratio of surface area to volume is therefore
an important factor in determining the effect on overall nutritional loss.
In general, water-soluble vitamins and minerals are lost in the cooking water, the amount
depending on the surface area– volume ratio, i.e. greater losses take place from finely cut
or minced foods. Fat-soluble vitamins are little affected except at frying temperatures.
Proteins suffer reduction of available lysine when they are heated in the presence of
reducing substances, and further loss at high temperature. Dry heat, as in cooking, results
in some loss of vitamin B1 and available lysine. The most sensitive nutrients are vitamins
C and B1 (Fellows, 2000). In meats, nutrient losses are affected by the size of the piece,
the type of joint, the proportions of bone and fat, pre- and post-slaughter treatments and
the type of animal. Cover, Dilsaver, Hays, & Smith (1949) studied the effect of cooking
temperature on vitamin losses in different meats. At 150ºC the meats were well cooked
and total thiamine losses were moderate. At higher temperatures the pan drippings were
charred and inedible, and total losses were therefore substantially increased. Thiamine is
the most important heat-labile vitamin in both cereal foods and meats, and losses are
reported in Table 2 In cereal foods the extent of thiamine loss is determined by the
temperature of cooking and the pH of the food. Loss of thiamine in pan bread is
approximately 15% (Bender, 1978) but in cakes or biscuits that are chemically leavened
by sodium bicarbonate, the losses increase to 50–95%.
The loss of amino acids and reducing sugars in Maillard browning reactions causes a
small reduction in nutritive value. In particular, lysine is lost in Maillard reactions, which
slightly reduces the protein quality. In bread the protein efficiency ratio is reduced by 23%
compared with that of the original flour (Bender, 1978). The extent of loss is increased by
higher temperatures, longer cooking times and larger amounts of reducing sugars.

22
Food Thiamin loss (%)
Beef 40-60Pork 30-40Ham 50Lamb 40-50Poultry 30-45Bread 15Cake 23Soya bean 90
Table 2 Thiamin losses during cooking, adapted from Farrer (1955).
Cooking induces significant changes in chemical composition, influencing the
concentration and bioavailability of bioactive compounds in vegetables. However, both
positive and negative effects have been reported depending upon differences in process
conditions and morphological and nutritional characteristics of vegetable species
(Podsêdek, 2007). In some cases cooking process improves food nutritional properties as
in vegetables, although consumption of fresh unprocessed plant food is widely advocated,
evidence is emerging that in vivo bioavailability of many protective compounds is
enhanced when vegetables are cooked (Link, & Potter, 2004).
1.5 Cook value
In the optimization / comparison of different cooking treatments the "cook value"
parameter can be used as a performance index. The cook value has been used
successfully to measure the product quality changes during thermal processing (Ohlsson,
1980; 1986; 1988).
The cook value (CZref) is defined, for analogy to the laws concerning the effect of
temperature on microbial selection, as the equivalent number of minutes the product
would have to spend at a reference temperature (usually Tref=100°C) to achieve a given
effect on the final product quality, for example, at the time needed to reach a particular
degree of tenderness of a piece of meat, rather than at the time when a nutrient probe is
degraded to a small percentage. In particular for meat products is considered the time
needed to the 3% reduce the content of thiamine (Vitamin B1).
Mathematically it is calculated as:
∫−
=t
Z
TT
Z dtC ref
ref
ref
0
)(
10
23
where Zref is the temperature increment needed to tenfold increase the rate of quality
change, generally is used the z-value equal to 33°C. When reference temperature is
100°C with a z-value equal to 33°C the cook value is denoted as C0 (Pompei, 2009).
The cook value is calculated by the integrating of the heat penetration curve recorded in a
particular position of the product, generally at the surface or at the middle (Holdsworth,
1985; Vittadini et al., 2005)., however the surface C0 is considered the more indicative
value because the external part of the product is the more degraded position.
The heating treatment time at which the C0 value reach the C0 target for a specific
degradation process or transformation (ex. C0=10min for the 3% reduce of thiamine
content) can be calculated. Hence, any extension of treatment beyond this time has the
effect of increase the cook value, at the expense of degradation of the other product
characteristics.
The degree of cooking can be measured in terms of cook value, in the centre and on the
surface of each sample, considering only the heating phase (Poon, Durance, & Kitts,
2001) or the total thermal process - both the heating and the cooling phase- (Van Roon,
Houben, Koolmess, Van Vliet, & Krol, 1994).
2 AIR - STEAM MIXTURES
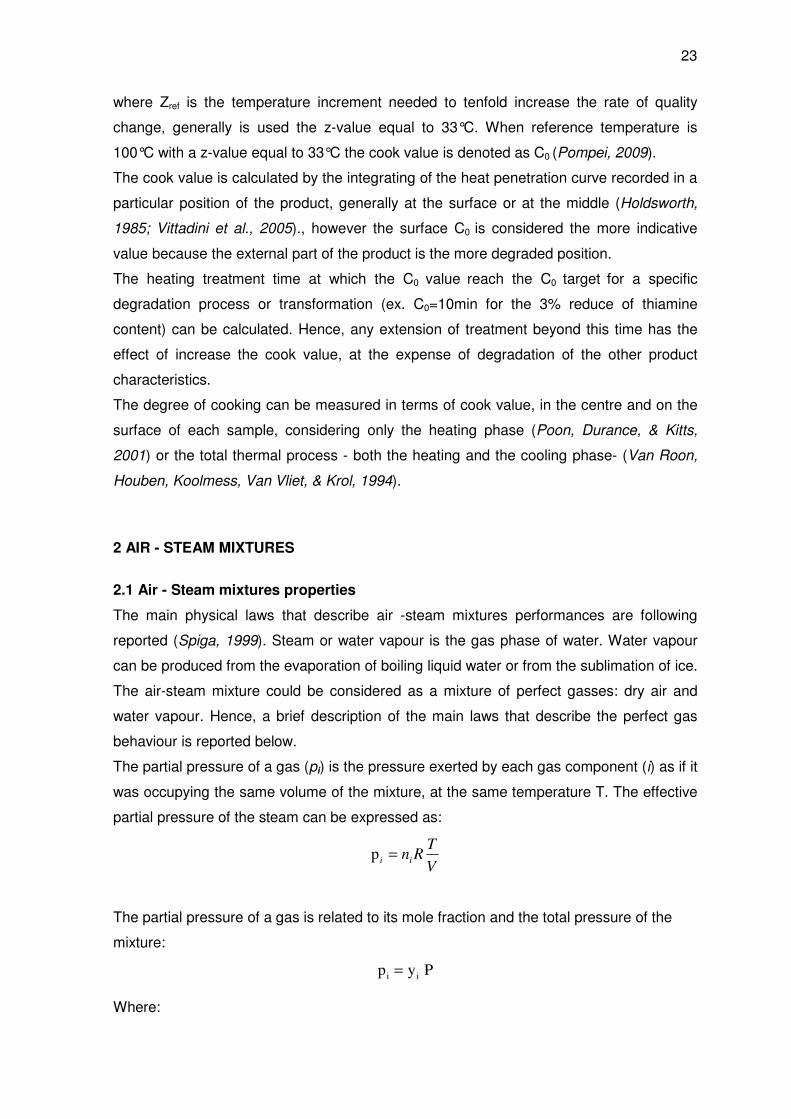
2.1 Air - Steam mixtures properties
The main physical laws that describe air -steam mixtures performances are following
reported (Spiga, 1999). Steam or water vapour is the gas phase of water. Water vapour
can be produced from the evaporation of boiling liquid water or from the sublimation of ice.
The air-steam mixture could be considered as a mixture of perfect gasses: dry air and
water vapour. Hence, a brief description of the main laws that describe the perfect gas
behaviour is reported below.
The partial pressure of a gas (pi) is the pressure exerted by each gas component (i) as if it
was occupying the same volume of the mixture, at the same temperature T. The effective
partial pressure of the steam can be expressed as:
V
TRnii =p
The partial pressure of a gas is related to its mole fraction and the total pressure of the
mixture:
P y p ii =
Where:

24
pi: partial pressure of a gas [Pa],
ni = number of moles of the gas i ,
yi: molar fraction of the gas, ni/n,
P: total pressure [Pa],
T: temperature [K],
V: total volume [m3],
R: is the gas constant =8,31 [J/(K* mol)].
The total pressure of an air-steam mixture, considered as a mixture of perfect gases, is
made up by the sum of the partial pressures of the components in the mixture as known
from Dalton's law of partial pressures. Similarly we have that the sum of partial volumes of
a mixture of perfect gases result from the total volume of the mixture.
p p P va +=
Where: pa = partial pressure of air [Pa],
pv = partial pressure of water vapour [Pa],
P: total pressure [Pa]
Moreover is important to indicate the dry air molar mass (Ma) and the water vapour molar
mass (Mv) respectively 28,95 *10-3Kg/mol and 18*10-3Kg/mol. In a single-phase air–steam
the mass of superheated steam and the mass of the system can vary, for example, the
vapour can condense, causing a decrease in mass of the system. At the steady state
phase, when doesn’t seem to happen the evaporation of the water droplets on the
surface, there is a dynamic equilibrium between the liquid and the vapour phases; the
number of liquid particles that evaporated is the same of the number of gas particles
condensed. Applying the Gibbs Phase rule to univocally describe the physical equilibrium
state of an air-steam mixture (bicomponent and monophase system) three thermodynamic
coordinates are necessary (the pressure, the temperature and a coordinate referred to the
composition of the mixture).
p p P va += K)J/(kg 52.614 with Tn Vp
K)J/(kg 287.06 with Tn Vp
vv
aa
⋅=⋅⋅=⋅
⋅=⋅⋅=⋅
vv
aa
RR
RR
Universal gas constant is R = 8,31 J/(K* mol) and the gas specific constant of a gas (Rx) is
determined as the universal gas constant divided to the molar mass (Mx) of the specific
gas or gas mixture.

25
M
R=xR
2.2 Mixtures parameters
The relative abundance of the two components of the air-steam mixture (air and water
vapour) can be expressed through different parameters (Spiga, 1999); the most widely
used are:
- relative humidity (ϕ ),
- absolute humidity (x),
- degree of saturation (ψ ).
The three parameters are dependent one to the other, hence only one of them is sufficient
to univocally define the composition of the moist air.
2.2.1 Relative humidity – RH - (ϕ )
The relative humidity – RH - (ϕ ) of an air-water mixture is defined as the ratio between
the mass of steam (Mv) and the mass of steam that would be present at the saturation
condition (Ms), at the same total pressure and temperature. In other terms, applying the
gas law pV = nRT, RH is the ratio of the partial pressure of water vapour (pv) to the
saturated water vapour pressure (ps) at a given temperature.
s
v
v
v
s
v
p
p
m
m
n
n
Ms
Mv→== *ϕ
In a saturated environment ϕ is equal to 1.
RH is dimensionless, and is usually expressed as a percentage (RH%). If a system is
isobarically heated (heating with no change in system pressure), by increasing the
temperature, the relative humidity of the system decreases, because the saturation
pressure of water (ps) increases with increasing temperature. The dependence of
saturated vapour pressure on temperature is represented in Figure 3. This relation is
given by the Clausius-Clapeyron equation, which expresses the saturated vapour
pressure above a flat surface of pure water. This formula can be approximated
experimentally by the formula of Magnus:
p v,sat [kPa] � exp[16.6536 − 4030.183 / (T [°C] + 235)].

26
Sat
urat
ion
vapo
urpr
essu
re(m
bar)
Sat
urat
ion
vapo
urpr
essu
re(m
bar)
Temperature (°C)
Figure 3. Relation between saturation vapour pressure and temperature.
The saturated vapour pressure increases rapidly with temperature. Above the boiling point
of water (100°C), the saturation vapour pressure ps is greater than 1013 hPa (normal
atmospheric pressure). Therefore relative humidity cannot reach RH =100% above 100°C
in an unpressurized system.
By considering the system at T < 100°C and at atmospheric pressure (Patm), it is possible
to achieve 100% of relative humidity at any temperature while for T > 100°C, the
possibility of reaching the maximum relative humidity drastically falls, being ps > Patm. As
an example, pure water steam may reach 100% RH at 100°C, while it will only reach 20%
RH at 150°C. The maximum RH values that can be obtained at temperatures above the
100°C (100<T<180°C) are reported in Table 3.
0,098180
0,124170
0,160160
0,209150
0,276140
0,370130
0,505120
0,702110
0,995100
T (°C)
0,098180
0,124170
0,160160
0,209150
0,276140
0,370130
0,505120
0,702110
0,995100
T (°C) CTMAX °≥⋅ 100ϕ
Table 3. Saturation relative humidity at temperatures above 100°C at atmospheric
pressure.

27
2.2.2 Absolute humidity ( x )
The absolute humidity (x) or humidity ratio, is defined by the ratio between the steam
mass (Mv) in the system and the mass of the dry air (Ma).
s
s
v
v
a
v
a
vv
pp
p
pp
p
TVRp
TVRp
m
m
na
n
Ma
Mvx
⋅−
⋅=
−====
ϕ
ϕ622,0622,0
29
18*
0
0
Therefore at the saturation condition the absolute humidity is defined as :
s
s
spp
px
−= 622,0
airdry
steam
kg
kg
_
.
The absolute humidity (x) and the total pressure of the mixture (p) are necessary to
calculate the pressure of the air (pa) and of the steam (pv) as following reported:
⇒−
=⋅
⋅==
v
v
av
va
pp
p
pR
pR
Ma
Mvx 622,0 p
xpa ⋅
+=
622.0
622.0 p
x
xpv ⋅
+=
622.0
In a transformation with a constant total pressure, as generally takes place, pa and pv
remain separately constant until the absolute humidity (x) is constant.
2.2.3 Degree of saturation (ψ )
The degree of saturation is the ratio between the absolute humidity (x) and the absolute
humidity at the saturation condition (xs) at the same total pressure and temperature of the
mixture.
ϕϕ
ϕϕϕ
ψ ≤⋅−
−=
−⋅
⋅−⋅⋅==
s
s
ss
ss
s pp
pp
ppp
ppp
x
x
)/(622.0
)/(622.0
Generally the terms ps and ϕ *ps are approximately negligible, hence results that ϕψ ≅ .
The degree of saturation is equal to 1 at the saturation condition. The saturation pressure
(ps) is function of the pressure and of the temperature of the mixture, hence the absolute
humidity at the saturation condition (xs) is function of the thermodynamic conditions.
2.3 Psychrometric chart
A psychrometric chart is a graph that describe the thermodynamic properties of moist air
at a constant pressure (often equated to an elevation relative to sea level, P=101325 Pa,
Knudsen et al., 1997). The Mollier psychrometric chart is a shaft whose angular
coordinate are dry bulb temperature and enthalpy, it is generally known in ASHRAE style
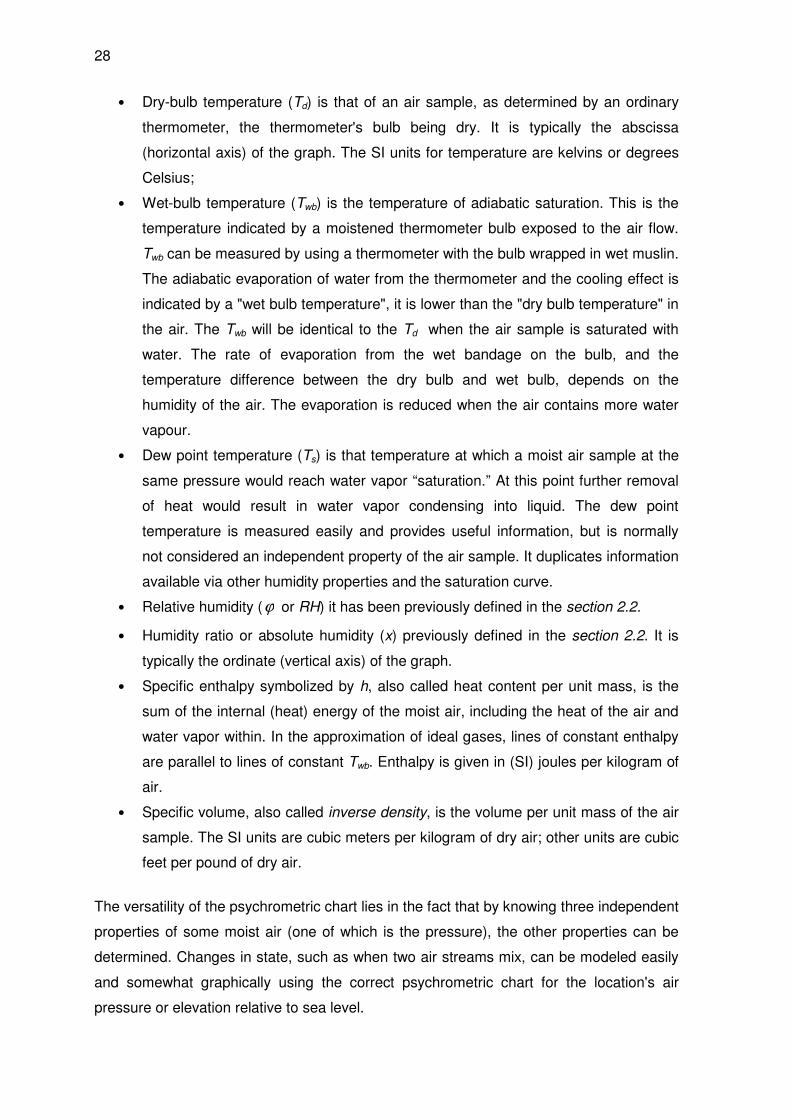
(Figure 4). The psychrometric chart depicts the properties reported below and it is thus a
graphical equation of state. The represented properties are:
28
• Dry-bulb temperature (Td) is that of an air sample, as determined by an ordinary
thermometer, the thermometer's bulb being dry. It is typically the abscissa
(horizontal axis) of the graph. The SI units for temperature are kelvins or degrees
Celsius;
• Wet-bulb temperature (Twb) is the temperature of adiabatic saturation. This is the
temperature indicated by a moistened thermometer bulb exposed to the air flow.
Twb can be measured by using a thermometer with the bulb wrapped in wet muslin.
The adiabatic evaporation of water from the thermometer and the cooling effect is
indicated by a "wet bulb temperature", it is lower than the "dry bulb temperature" in
the air. The Twb will be identical to the Td when the air sample is saturated with
water. The rate of evaporation from the wet bandage on the bulb, and the
temperature difference between the dry bulb and wet bulb, depends on the
humidity of the air. The evaporation is reduced when the air contains more water
vapour.
• Dew point temperature (Ts) is that temperature at which a moist air sample at the
same pressure would reach water vapor “saturation.” At this point further removal
of heat would result in water vapor condensing into liquid. The dew point
temperature is measured easily and provides useful information, but is normally
not considered an independent property of the air sample. It duplicates information
available via other humidity properties and the saturation curve.
• Relative humidity (ϕ or RH) it has been previously defined in the section 2.2.
• Humidity ratio or absolute humidity (x) previously defined in the section 2.2. It is
typically the ordinate (vertical axis) of the graph.
• Specific enthalpy symbolized by h, also called heat content per unit mass, is the
sum of the internal (heat) energy of the moist air, including the heat of the air and
water vapor within. In the approximation of ideal gases, lines of constant enthalpy
are parallel to lines of constant Twb. Enthalpy is given in (SI) joules per kilogram of
air.
• Specific volume, also called inverse density, is the volume per unit mass of the air
sample. The SI units are cubic meters per kilogram of dry air; other units are cubic
feet per pound of dry air.
The versatility of the psychrometric chart lies in the fact that by knowing three independent
properties of some moist air (one of which is the pressure), the other properties can be
determined. Changes in state, such as when two air streams mix, can be modeled easily
and somewhat graphically using the correct psychrometric chart for the location's air
pressure or elevation relative to sea level.

29
Figure 4. The psychrometric chart in ASHRAE style.
2.4 Methods of air humidity determination
The most simple method to measure air humidity is the Assmann psychrometer or
hygrometer. The instrument consists of two thermometers that measure the dry bulb and
in the wet bulb temperature. On the basis of the psychrometric chart the instrument give
the absolute humidity value of the air-steam mixture and therefore its relative humidity.
The procedure to calculate the RH value from the temperatures of the dry bulb and the
wet bulb (http://home.fuse.netclymer/water/wet.html) is listed below.
100,
⋅=dbs
v
p
pRH
+
−⋅=
3.237
9.11678.16exp,
db
db
dbsT
Tp , )(, wbdbwbsv TTPApp −⋅⋅−= ,

30
+
−⋅=
3.237
9.11678.16exp,
wb
wb
wbsT
Tp , )00115.00.1(00066.0 wbTA ⋅+⋅= .
Where:
Twb = wet bulb temperature (°C),
Tdb = dry bulb temperature (°C),
ps, wb = saturation vapour pressure at Twb (kPa),
ps, db = saturation vapour pressure at Tdb (kPa),
pv = vapour pressure (kPa),
P = air pressure (kPa).
In addition to this method there are three major types of hygrometers (Morris, 1998):
mechanical, electrical (resistive, electrolytic -P2O5 -, capacitive and with detection by
impedance -Al2O3-), and cold-spot or dew-point (condensing with optical sensing or
condensing with saturated salts –LiCl-).
Capacitive hygrometers are electrical hygrometers, these relative humidity and
temperature sensors showed high performances in a miniature format with the possibility
to measure air humidity over than 100°C. Non-contact capacitive sensors work by
measuring changes in an electrical property called capacitance. The capacitive
hygrometers have a function similar to a capacitor where the dielectric is a hygroscopic
material (usually polymer or ceramic). Usually one electrode is permeable to the water
vapour. The humidity balance established between the insulation and the environment,
change the relative dielectric permittivity. The result is a variation of capacity of the
sensitive information that becomes representative of the relative humidity of the air. This
type of device is sensitive to the relative humidity as it is in equilibrium with the
environment to characterize.
3. MEAT
3.1 Structure of muscle
Because muscle is converted to meat post slaughter it serves as a raw material for the
meat industry and hence its composition and structure are likely to influence the overall
meat quality. It is therefore important to understand the structure and composition of
muscle (Lawrie, 1998).

31
Based on such specializations there are three different types of muscles in a meat animal
(striated voluntary or skeletal muscles, striated involuntary or cardiac muscles and smooth
muscles or involuntary muscles).
As now we know that skeletal muscles constitute the bulk of a slaughtered animals
muscle mass therefore special emphasis shall be laid upon the structure and organization
of skeletal muscles.
Muscle fibre (Figure 5) is the structural unit of skeletal muscle. Muscle fibre constitutes
75-92% of skeletal muscle volume, the rest is contributed by nerve fibres blood vessels,
connective tissue.
In the muscle important layers holding different structural elements together:
- Epimysium is connective tissue sheath surrounding the entire muscle,
- Perimysium a layer beneath epimysium which divide the muscle fibres into small groups
or fascicule. These groups are also known as primary bundles. When few primary bundles
come together they form secondary bundles and secondary bundles coming together
leads to formation of tertiary bundles.
- Endomysium a layer beneath perimysium with surrounds each muscle fibre individually.
These are very thin strands. The endomysium should not be confused with sarcolemma or
muscle cell membrane.
The epimysium, perimysium and endomysium serve as the structural basis for skeletal
muscles. They conduct the vascular and neural supply to and from the muscle. Larger
nerves and blood vessels lie at the periphery of perimysium and between the adjacent
fasciculi. The size of fasciculi, in fact, has bearing on the texture of the muscle i.e.
muscles engaged in lighter activities have fine texture and it is reverse for the heavier
muscles or muscles which have to work more.
Each fibre (muscle cell) present several cell nuclei. The muscle tissue, with a polarizing
microscope vision, show an alternating light and dark areas that take place regularly and
that are the muscle functional unit: the sarcomeres, contractile elements that join in thin
filaments (myofibrils). The reason for appearance for these light and dark bands of
myofibrils is a different behaviour under polarized light of the different bands. The Light
bands are a singly refractive when viewed under polarized light, they are therefore
isotropic and derives name I - bands or isotropic bands. Whereas, the Dark bands are
doubly refractive or anisotropic thus they are known as A –bands (Figure 6).
In the I- band there is a dense line called Z-line, each sarcomere is in-between two Z-
lines. Sarcomeres are divided into bands of thin and thick filaments respectively made of
actin or myosin. In the I- band there are the thin filaments (actin) whereas in the A-band
both the thin (actin) and the thick filaments (myosin) are present. During muscle
contraction, the filaments slide over each other to cause shortening of the sarcomere.

32
Figure 5. Muscle fibre structure.
Figure 6. The structural build-up of the sarcomere, the thin and thick filaments (Tornberg,
Olsson, & Persson., 1990).

33
3.2 Composition of meat
The meat muscle consists of 75% water, 20% protein, 3% fat and 2% soluble non-protein
substances. Out of the latter 2%, metals and vitamins constitute 3%, nonprotein nitrogen-
containing substances 45%, carbohydrates 34% and inorganic compounds 18%
(Tornberg, 2005).
3.2.1 Water
Water serves as a vehicle for transport of nutrients in the body. It constitutes about 75% of
fresh meat (Cavani & Bianchi, 2004). Water content varies inversely with the fat content in
meat and with the age of the animal. The ratio of water to protein is relatively constant 3.6
or 3.7 to 1. The retained water contributes to the juiciness and palatability of meat. Water
within muscle is attached to protein as water is bipolar. Water is present in muscle in three
forms:
i) Bound water – about 4-10g/100g of protein. It is the water directly bound to the protein
molecules through interactions with amino acid polar chains and it isn’t available as
solvent. This kind of water is tightly bound and remains so even during application of
severe mechanical or any other physical force.
ii) Immobilized water– about the 20-60g/100g of protein. The water molecules are
slightly away from the protein molecules and are attached to the bound water molecules
but the binding force (hydrogen bounds) is weaker as compared to bound water and
became more and more weak as the distance from proteins polar groups increases.
iii) Free water – 300-600g/100g of protein. The water is held by the surface forces i.e.
capillary forces. The orientation of free water molecules is independent of the charged
groups. It is the water category with the major technological importance because it tends
to be lost during processing. The ability of meat to retain its water during application of
external forces such cutting, heating, grinding and pressing is quantified by the water
holding capacity (WHC) parameter that will be thoroughly discussed in the section 4.2.2.
3.2.2 Proteins
Muscle proteins represent about the 20% of meat muscle, they can be divided into three
groups based on their solubility characteristics: sarcoplasmic proteins, the metabolic
proteins that are soluble in water or dilute salt solutions; myofibrillar proteins, the
contractile proteins that are soluble in concentrated salt solutions; and stromal proteins,
the connective-tissue proteins that are insoluble both in water and in concentrated salt
solutions (Lawrie, 1998).

34
3.2.2.1 Sarcoplasmic Proteins
Sarcoplasmic proteins represent 30-35% of the total muscle proteins or about 5% of the
muscle weight (Asghar, Samejima, & Yasui, 1985). There are around 200 different
proteins known to be present in the sarcoplasmic fraction, many of which are glycolytic
enzymes responsible for the control of enzymatic reactions in muscle (Kijowski, 2001).
Despite the various biological functions in muscle, sarcoplasmic proteins exhibit many
common physicochemical characteristics: relatively small molecule size, globular or rod-
shaped structure, low viscosity (Asghar et al., 1985), poor water holding properties and
weak /fragile gels formation (Miyaguchi et al., 2000).
Myoglobin is the most important sarcoplasmic protein, it is responsible of meat colour
(the major pigment in well-bled meat) which is associated with product quality (Kijowski,
2001). Myoglobin consists of a protein portion and a non-protein porphyrin ring with a
central iron atom (Figure 7), it has the function to store oxygen for aerobic metabolism in
the muscle. The iron atom is an important player in meat colour. The defining factors of
meat colour are the oxidation (chemical) state of the iron and which compounds (oxygen,
water or nitric oxide) are attached to the iron portion of the molecule. Because muscles
differ greatly in activity, their oxygen demand varies. Consequently different myoglobin
concentrations are found in the various muscles of the animal. Also, as the animal gets
older there is more myoglobin. With a greater myoglobin concentration yields a more
intense colour. Muscle pigment concentration also differs among animal species. For
example, beef has considerably more myoglobin than pork or lamb, thus giving it a more
intense colour.
As reviewed by Lawrie (1998), the colour of the meat depends not only on the quantity of
myoglobin present, but also on the type and chemical state of the myoglobin molecule.
The colour of meat is largely determined at the meat surface by the relative amounts of
three forms of myoglobin, i.e. deoxymyoglobin (DeoxyMb, purplish-red), metmyoglobin
(MetMb, brownish-red), and oxymyoglobin (OxyMb, cherry-red; Bemiller & Whistler, 1996;
Kinsman, Kotula, & Breidenstein, 1994; Lawrie, 1998; Zhu & Brewer, 1998).
.
Figure 7. Myoglobin: chemical structure.

35
3.2.2.2 Myofibrillar proteins
Myofibrillar proteins constitute about 55-60% of the total muscle protein, or 10% of the
weight of the skeletal muscle (Asghar et al., 1985). It is well known that myofibrillar
proteins are largely responsible for the textural properties of processed meat products
(Asghar et al., 1985; Yasui, Ishioroshi, & Samejima, 1980).
They are generally extracted in intermediate or high ionic strength buffer, so are referred
to as salt-soluble proteins. The adequate extraction of myofibrillar proteins is particularly
important for promoting gel formation in meat products (Li-Chan, Nakai, & Wood,,1987).
Myosin and actin are two major proteins of the myofibrillar proteins, they are responsible
for muscle contraction in the living animal, as well as many functional characteristics in
processed meat products.
The thick myofilaments of the sarcomeres are mainly composed of myosin, which
comprises 43-45% of the myofibrillar proteins in the muscle of mammals, birds, and fish
(Maruyama, 1985; Robson, 1995; Yates & Greaser, 1983). Myosin is a large fibrous
molecule (~ 500 kDa), composed of two large subunits called myosin heavy chains and
four small subunits called myosin light chains. The two heavy chains form the rod portion
and a large part of the myosin head. The two light chains are located in each of the
myosin heads (Bechtel, 1986). In living muscle, myosin exhibits important biological
properties: myosin molecules can assemble themselves and build filaments, the myosin
head has the catalytic site for ATPase activity whose action provides the energy for
muscle contraction and myosin forms natural complexes with actin. This interaction is
critical for the generation of the force that moves the thick and thin filaments on each other
(Stryer, 1995). Myosin can be extracted with salt (e.g., NaCl, KCl) solutions of
concentrations higher than 0.15 M. The isoelectric point of myosin is ~5.3, which means
under normal meat processing conditions where the pH value is around 6, the myosin
molecule will be negatively charged and have the ability to bind water (Harrington, 1979).
Salt will further enhance the water-binding ability of myosin by increasing the effective net
negative charge and breaking ionic bonds, causing molecular swelling and water uptake
(Acton, Ziegler, & Burge., 1983). The presence of myosin is essential in protein gel
formation of meat systems, while other myofibrillar proteins (actin, titin, tropomyosin,
troponin and nebulin) are supposed to have a strong influence on the viscoelastic
properties of gels by influencing the formation of the myosin gel matrix. Gaining an
understanding of the gelation properties of myosin and meat gel systems is beneficial for
the development of processed meat products as well as maintaining quality in meat
products (Westphalen, Briggs, & Lonergan, 2005).

36
Actin is the major constituent of the thin myofilaments and accounts for 22% of the
myofibrillar protein (Yates & Greaser, 1983). Actin is a globular protein (G-actin), under
physiological conditions, G-actin molecules polymerize into a double-stranded fibrous
form (F-actin) (Huxley, 1963; Steiner, Laki, & Spicer, 1952). The F-actin forms the
backbone of the thin filament and also provides binding sites for tropomyosin and troponin
complex which regulates the activity of myosin ATPase. Actin also has a binding site to
myosin. When calcium is present, F-actin comes into contact with the myosin heads of the
thick filaments and there is a rapid breakdown of ATP, ultimately resulting in muscle
contraction (Bechtel, 1986).
Actin alone does not exhibit any binding property (Fukazawa, Hashimoto, & Yasui, 1961;
Samejima, Hashimoto, Yasui, & Fukazawa, 1969), however, in the presence of myosin,
actin exerts a “synergistic effect”. The formation of the actomyosin complex in the system
determine an high ability to form strongest gel.
3.2.2.3 Stromal proteins or connective tissue proteins
Stromal proteins are a salt insoluble protein fraction. Collagen, elastin, and lipoproteins of
the cell membrane, are among the most important connective tissue proteins in the
muscle. They have a fibrous structure, and in the majority of tissues, collagen
quantitatively predominates. Collagen is generally associated with the toughness of the
meat. Collagen is made of three helically twisted polypeptide chains stabilized by
intramolecular and intermolecular bonds (e.g., hydrogen bonds). As animals age, more
covalent bonds are formed inside and between collagen molecules, which contribute to
the toughness of the meat (Asghar et al., 1985; Kijowski, 2001). The stromal proteins
have no gelation ability, as the fraction only coagulated upon heating to 80 °C (Ziegler and
Acton, 1984).
3.2.3 Lipids
Lipid content present an high variability because is affected by several animal factors such
as species, age, feed, breeding, muscle type, etc. (Cavani & Bianchi, 2004). The lipid
fraction could be classified in three main types:
- adipose tissue that is represented by deposition of fat at the muscle surface or in the
abdominal cavity, hence it is easily separable. The adipose tissue is mainly constituted by
the triglyceride and saturated fat acids. This tissue is very important in the ham
productions.
- intermuscolar fat or marbling, the fat localized between muscle bundles of a particular
anatomic area. It is difficult to remove. A certain degree of marbling have a positive effect
because it improve meat sensory properties such as tenderness and flavour.

37
- intramuscular fat is the less likely to variability (1-4%) because it is mainly composed
by phospholipids of cell membranes. Hence the intramuscular fat in general is
characterized by a major polyunsaturated fat content than the intermuscolar fat and the
adipose tissue (Cavani & Bianchi, 2004).
3.2.4 Carbohydrate, minerals and vitamins
In meat other than water, proteins and lipids there are:
- carbohydrate, mainly glycogen. The energy required for muscle activity in the live
animal is obtained from the glycogen of the muscle. In the healthy and well-rested animal,
the glycogen content of the muscle is high. After the animal has been slaughtered, the
glycogen in the muscle is converted into lactic acid, and the muscle and carcass becomes
firm (rigor mortis). This lactic acid is necessary to produce meat, which is tasteful and
tender, of good keeping quality and good colour. If the animal is stressed before and
during slaughter, the glycogen is used up, and the lactic acid level that develops in the
meat after slaughter is reduced. This will have serious adverse effects on meat quality
(Chambers, & Grandin, 2001).
- minerals: about 1%, mainly Na, K in the ionic state and Ca and Mg associate to proteins
and phosphorylated compounds,
- vitamins: mainly of the B group (B1 and B2), and liposoluble ones (A, D, E, K)
principally in the fat cuts and in the guts,
- non protein nitrogen compounds (Cavani & Bianchi, 2004).
3.3 Poultry meat: Turkey
Poultry meats are currently receiving increasing interest from both consumers and
industries. Poultry meat consumption is drastically increased in the last ten years,
particularly for turkey meat: the per capita turkey meat consumption in the U.S. increased
from 3.5kg in the 1970 to 7.5kg in the 2009, with a stable trend in the last twenty years
(http://www.eatturkey.com/consumer/stats/stats.html).
The increasing demands of turkey products by consumers have shifted turkey sales from
whole birds, just for holidays, to further processed products (pre-cooked, refrigerated
ready-to-eat) bought year-round that now compose a large proportion of the turkey market
(Owens, Hirschler, McKee, Martinez-Dawson, & Sams, 2000). Relatively low and
competitive pricing of poultry meat compared to the other meat, the absence of cultural or
religious obstacles, and in particular the dietary and nutritional qualities are the main
factors explaining its attractiveness.
The chemical composition of turkey meat is characterized by an high protein content
(higher than the 20g/100g of edible part –e.p.- ) and a low collagen content compared to

38
pork and beef meat. Moreover turkey meat has a low fat quantity: the breast muscles is
characterized by a very low fat content (1-4 g/100g of e.p), while the turkey thigh have a
major lipid content (3-9 g/100g of e.p). The lipid fraction of turkey meat presents a
relatively high quantity of polyunsaturated fatty acids (0.34 g/100g of e.p.), with a
favourable balance between polyunsaturated and saturated fatty acids (P:S = 0.9), and a
low cholesterol content (50 mg/100g of e.p.,
http://www.inran.it/646/tabelle_di_composizione_degli_alimenti.html?idalimento=106850&
quant=100), all strongly desirable attributes from a nutritional standpoint.
4. QUALITY OF COOKED MEAT PRODUCTS
Meat undergoes many changes during cooking, both physical and chemical, including
protein denaturation, weight loss (up to 40% of its weight), muscle fibres shrinkage, aroma
development and modifications of water holding capacity, texture and colour.
Quality characteristics of cooked meat products are strongly dependent both on the
inherent composition and characteristics of the muscles and on the method of heating as
well as on the time/temperature combinations applied (Bouton, Harris, & Ratcliff, 1981;
Christensen, Purslow & Larsen, 2000).
Proteins undergo substantial structural changes on heating and, therefore, the quality of
the meat product, which is mainly governed by the meat structure, also changes
drastically after cooking (Tornberg, 2005). Changes of meat induced by cooking have
been studied for many years and extensively discussed (Hamm, 1977; Offer, 1984;
Tornberg, 2005); however few reports have specifically dealt with turkey meat (Sammel &
Claus, 2007; Mielnik, Sem, Egelandsdal, & Skrede, 2008).
4.1 Physical properties
The evaluation of physical characteristics of meat, like water-holding capacity, tenderness
and colour, is necessary to assess meat quality within a processing operation, and/or on
final products. Moreover, in a research tool, the determination of the physical properties of
meat is fundamental for structural studies of muscle and meat.
4.1.1 Colour
Colour is the visual characteristic of meat that is the critical initial impression a consumer
gets of a product, hence it is a very important parameter with an high impact on the
purchase decision. Because colour is of paramount importance, it has received the

39
attention of the food industry and numerous investigators. There have been many reviews
on colour and meat (Hunt and Kropf, 1987; Cornforth, 1994).
As previously described (section 3.2.2.1) meat colour is determined by the quantity of
myoglobin present, by the type and chemical state of the myoglobin molecule (Lawrie,
1998) and on muscle micro-structure (Cornforth, 1994). Moreover it is influenced by the
ultimate pH, the rate of pH decline post-mortem, the physical characteristics of muscle
and the presence of some ingredients in elaborated meat products such as nitrates and
nitrites.
During external processes such as cooking, storage, and irradiation, the three forms of
myoglobin i.e. deoxymyoglobin (DeoxyMb, purplish-red), metmyoglobin (MetMb,
brownish-red), and oxymyoglobin (OxyMb, cherry-red) interconvert and are degraded
through oxygenation, oxidation and reduction reactions, ultimately influencing the
appearance of meat colour. Moreover, myoglobin could be transformed into other forms
such as sulfmyoglobin (green) by the specific activity of some bacteria (Nicol, Shaw, &
Ledward, 1970).
Meat colour can be measured both subjectively (sensory analysis) and instrumentally.
Guidelines for human evaluation of meat colour have been published by Kinsman et al.
(1991) and the “Guidelines for Meat Color Evaluation” (Hunt et al.,1991) has been a
valuable source of information to encourage uniformity in collecting colour data. There are
several methods to meat colour evaluation: from the measure of the concentration of
heme pigments and colour cards to the use of an image analysis software (Warriss,
2000).
The analysis of visible absorption characteristics with a reflectance colorimeter is the
most applied method for meat colour quantification (Liu & Chen, 2000; Nanke, Sebranek,
& Olson, 1998; Swatland, 1989). This is a non-destructively and sensitively measure of
colour. Colour data could be processed using the colour scale L*a*b* or reflectance
spectrophotometry.
The colour scale L*a*b* is the method of measure meat colour most applied
(Commission International de l’Eclairage, 1976): colour is measured with a reflectance
colorimeter, where the recommended parameters are a light source of D65 with the
illumination/viewing system as 45/O or O/45 or diffuse/8 (d/8), the recommended standard
observer angle is 10° (Honikel, 1998). The CIELAB system is the system based on L*a*b*
colour scale (Warriss, 2000).
The reflectance spectrophotometry (spectral features in the visible region) allows to
explain colour changes during the cooking of meat due to the degradation of the
myoglobin protein through oxygenation, oxidation and reduction reactions, influencing the
appearance of meat colour (Figure 8) as reported by several authors (King, & Whyte,
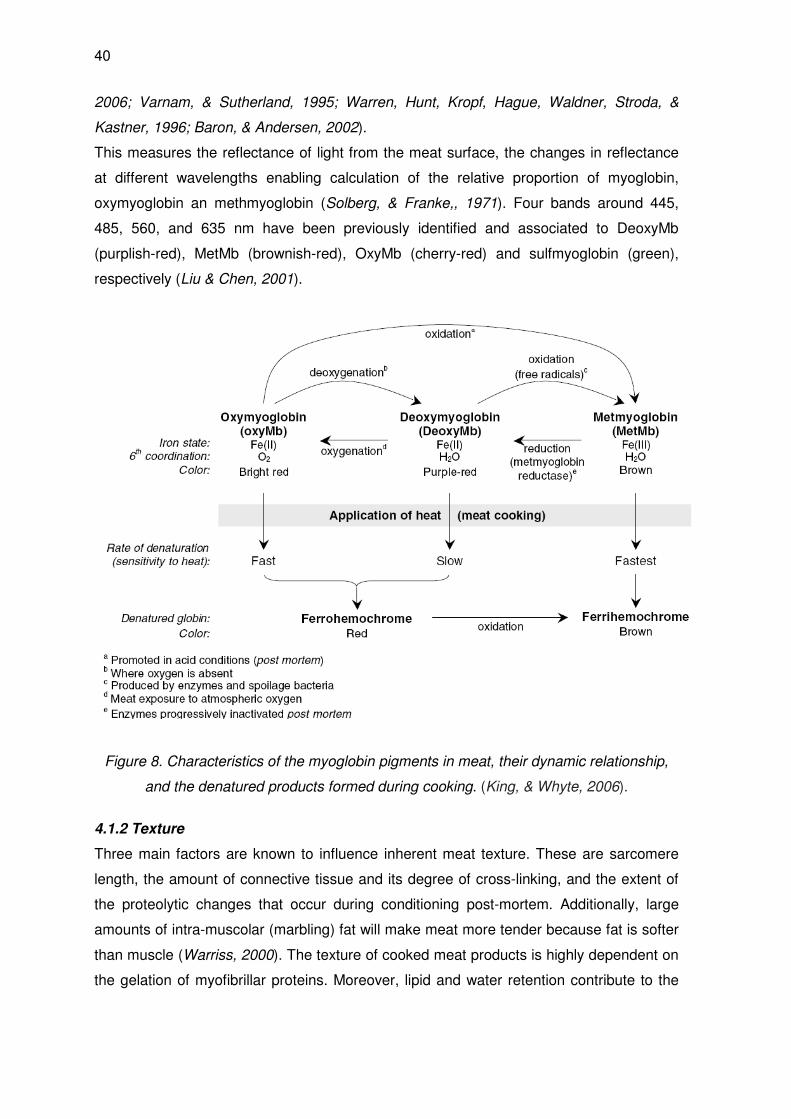
40
2006; Varnam, & Sutherland, 1995; Warren, Hunt, Kropf, Hague, Waldner, Stroda, &
Kastner, 1996; Baron, & Andersen, 2002).
This measures the reflectance of light from the meat surface, the changes in reflectance
at different wavelengths enabling calculation of the relative proportion of myoglobin,
oxymyoglobin an methmyoglobin (Solberg, & Franke,, 1971). Four bands around 445,
485, 560, and 635 nm have been previously identified and associated to DeoxyMb
(purplish-red), MetMb (brownish-red), OxyMb (cherry-red) and sulfmyoglobin (green),
respectively (Liu & Chen, 2001).
Figure 8. Characteristics of the myoglobin pigments in meat, their dynamic relationship,
and the denatured products formed during cooking. (King, & Whyte, 2006).
4.1.2 Texture
Three main factors are known to influence inherent meat texture. These are sarcomere
length, the amount of connective tissue and its degree of cross-linking, and the extent of
the proteolytic changes that occur during conditioning post-mortem. Additionally, large
amounts of intra-muscolar (marbling) fat will make meat more tender because fat is softer
than muscle (Warriss, 2000). The texture of cooked meat products is highly dependent on
the gelation of myofibrillar proteins. Moreover, lipid and water retention contribute to the

41
yield, texture, and cohesion of the final product and both are influenced by the gelling
capacity of these proteins (Foegeding, 1987).
Cooking drastically influence meat tenderness. Myofibrillar and connective tissue proteins
undergo several temperature and time dependent structural changes during cooking
which impact directly on product yield, texture and overall eating quality. Cooking causes
denaturation of the myofibrillar components which results in toughening. Conversely, it
may also promote structural alterations and solubilization of collagen which results in
more tender meat (Christensen, Purslow, & Larsen, 2000; Sims & Bailey, 1992). Thus,
cooking can cause either tenderization or toughening of meat with the net effect being
dependent on the inherent composition and characteristics of the muscles, the method of
heating and the time/temperature combination employed (Bouton, Harris, & Ratcliff, 1981;
Christensen et al., 2000; Laakkonen, Wellington, & Sherbon, 1970; Lawrence, King,
Obuz, Yancey, & Dikeman, 2001; Obuz, Dikeman, & Loughin, 2003).
The most diffuse instrumental techniques to measure meat texture carried out on cooked
meat are: Warner-Bratzler test, tensile test method and penetrometer measure –
TPA (Texture profile analysis).
Warner-Bratzler test also called compressive or shear test is a very common and widely
used method to measure the tenderness of both raw and cooked meat. Meat samples
should have a specific fixed shape and size with the grain of muscle running parallel to the
long axis. Each sample is cut through by a metal blade about 1mm thick. The force
required to move the blade to shear through the sample is measured, the blade being
moved by a geared electronic motor and the force measured using a scale.
The tensile test method is best suited for structural investigations (Purslow, 1985) rather
than to predict sensory evaluation of tenderness. It is a useful test in conjunction with
other methods. The test can be carried out on raw or cooked meat. Results will be
affected by sample size and by strain rate, but this latter effect is small. The standard
thickness of the slices is 3-5 mm but for some species and some muscles thinner slices
may be required. Testing may be conducted either transverse or parallel to the fibre
direction. A load deformation curve to complete rupture should be obtained. Criteria for
the acceptance of test results is that fracture should occur in the parallel-sided region of
the specimen. Breaking stress is calculated as the ratio between the peak force and the
measured width multiplied by thickness. The total energy to fracture (area under the
curve) and breaking strain (breaking strain = extension of peak force/original gauge
length) could be also determined. Larger amounts of connective tissue in the samples
tested cause high variability. Problems with gripping the samples are a major cause of
measurement failure, especially with raw meat. Cyanacrolate adhesives or freezing grips
can be employed (Lewis and Purslow, 1991).

42
The penetrometer measure – TPA (Texture profile analysis) is a simply mechanical
reproduction of the chewing process of meat. In TPA test a cylindrical flat ended plunger
(diameter 1-3,5 cm) in a test frame. The plunger is driven with a constant speed vertically
for a fixed distance, generally 50-80% of the sample thickness, through meat sample with
a constant thick so that the fibre axis is perpendicular to the direction of the plunger
penetration. The plunger is driven twice into the meat at each location (Honikel, 1998).
A minimum of eight to ten samples should be measured for each texture test.
When testing is used to evaluate consumer products it is strongly recommended that the
methods should be validated against sensory panels. (Honikel, 1998)
4.1.3 Shrinkage
Meat cooking shrinkage is very important meat quality parameter to the consumer
(Barbera, & Tassone, 2006). During cooking, the consumer observes some shrinkage
often thought to be an indicator of poor meat quality and/or the effect of hormone
treatments. The consumer buys a steak with a certain appearance and size; the size or
weight determining the cost. The alteration in size due to meat shrinkage strikes the
consumer unfavourably. The cooking loss, tenderness and shrinkage, despite being
different expressions of the same phenomenon, are perceived by the consumer as
different events because they are observed in different time frames.
During heating, at varying temperatures (37–75°C). the different meat proteins denature
causing meat structural changes, such as the destruction of cell membranes (Rowe,
1974), transversal and longitudinal shrinkage of meat fibres, the aggregation and gel
formation of sarcoplasmic proteins and the shrinkage and the solubilisation of the
connective tissue (Tornberg, 2005). Changes in muscle fibres, observed by Palka and
Daun (1999) confirm the opinion of Offer, Restall, and Ick (1984), that meat shrinkage
during cooking in the 45–90°C range occurs in two phases. At a temperature of about 45–
60°C the shrinkage is primarily transverse to the fibre axis (transverse shrinkage) and at
60–90°C primarily parallel (longitudinal shrinkage). At a higher temperature of about
121°C there may be a third shrinkage of meat which is transversal to the fibre axis
(Barbera, & Tassone, 2006). Most of the water in the living muscle is held within the
myofibrils and any large changes in the distribution of water within the meat structure
originate from changes in this spacing. Shrinkage on cooking causes the greatest water
loss at 60–70°C and it is presumed that water is expelled by the pressure exerted by the
shrinking connective tissue on the aqueous solution. (Barbera, & Tassone, 2006).
Shrinkage of meat could be measured and calculated by different methods from the most
simple (manual calliper) to the new generation ones using a digital video camera to obtain
images and an image processing software to elaborate them.

43
4.1.4 Cooking yield
Water loss in cooked whole meat is a fundamental meat quality parameter for both
sensorial and economic aspects. Among different methods to evaluate cooking effects on
meat, the cooking loss measurement represents the most rapid and important to estimate
some correlated quality characteristics, such as juiciness, and evaluate some economic
aspects (Barbera, & Tassone, 2006).
During heating, the different meat proteins denature at varying temperatures (37-75°C).
Denaturation causes structural changes such as the destruction of cell membranes,
transverse and longitudinal shrinkage of muscle fibres, the aggregation of sarcoplasmic
proteins and shrinkage of the connective tissue. All these events, particularly the
connective tissue changes, result in cooking losses in meat. Relevant reviews on the
effect of heat on muscle proteins and structure have been given by Hamm (1977) and
Offer (1984).
The cooking conditions must be defined and controlled (heating rate and the end-point
temperature at the thermal centre) as the dimension and the geometry of the sample.
4.2 Water properties of meat
Water plays a key role in defining the properties of fresh and cooked meat (Van Oeckel,
Warnants, & Boucque, 1999; Bertram, Engelsen, Buska, Karlsson, & Andersen, 2004) as
well as the development of the cooking process and it is, therefore, very important to
characterize the status of water in meat and its dependence on the cooking process.
Many analytical techniques have been used to study water status in meat.
4.2.1 Moisture Content
The determination of moisture content is very often carried out to characterize water
status in meat, especially as an indicator of water loss upon cooking and, therefore, it
doesn’t provide an insight of water interactions in the meat matrix.
4.2.2 Water Holding Capacity
Water in meat can also be characterized by the water holding capacity (WHC), that is one
of the most important quality parameters used in meat industries. WHC defines the quality
of fresh meat and its capability to retain water (free water), that are related to drip loss,
technological performance and also to the quality of the final product (Offer et al., 1989).
Low WHC is associated with high drip or purge loss and subsequently reduces profitability
in meat production.

44
Water losses originate from volume changes of myofibrils induced by pre-rigor pH fall and
the attachment of myosin heads to actin filaments at rigor where myofibrils shrink owing to
pH fall.
Numerous and complex factors contribute to the considerable variability in WHC of meat.
Genotype (Hamilton, Ellis, Miller, McKeith, & Parrett, 2000), different stunning methods
(Stoier, Aaslyng, Olsen, & Henckel, 2001), aging (Kristensen & Purslow, 2001), chilling
rate (Maribo, Olsen, Barton-Gade, Moller, & Karlsson, 1998) and even protein oxidation
(Rowe, Maddock, Lonergan, & HuV-Lonergan, 2004) may all affect the WHC of meat.
Recently, several authors have shown that degradation of cytoskeletal and other structural
proteins plays an important role in drip loss (Huff-Lonergan & Lonergan, 2005).
There are a very large number of methods that have been used to measure WHC
(Warriss, 2000). WHC is not definable in absolute units since each method measures
slightly different things. Working definition of WHC as “the ability of meat to hold its own or
added water during the application of any force” (Hamm, 1986), or as “the ability of meat
to retain its water during application of external forces, such as cutting, heating, grinding
or pressing” (Lawrie, 1998).
Methods of measure WHC can be divided into three categories: those in which the only
force applied is that of normal gravity the drip loss method (Honikel bag method -
Honikel, 1987), those in which a greater force is applied (press, centrifuge or capillary)
called enhanced force methods and indirect methods.
The gravity method or drip loss method is the simplest method: sample joints or stakes
are stored for a period of time and the loss of drip measured. It is common to suspend
whole “chops” (slice of meat) inside polyetilene bags (to prevent evaporative losses) at 1
to 5°C for 48-72 hours. Results for whole chops are affected by the fat : lean : bone ratio
but the advantage is comparability with actual practice. An improvement is to use always
the same muscle and to use defined-geometry samples of it.
Enhanced force methods include filter paper, centrifugation and capillary methods.
In the filter paper method originally develop by Grau and Hamm (1952) a small (0,2g)
piece of meat is pressed on a filter paper between two clear plastic plates to form a thin
film. Water is squeezed out and absorbed by the filter paper to form a ring of expressed
juice. The area of this ring relative to the area of the meat is an index of WHC. Meat with
an high WHC forms a larger area on pressing than meat with a low WHC. In fact, the area
of meat is more variable than that of the expressed juice and can be used alone to asses
WHC. A major advantage of the press method is that it can be employed with ground or
processed meat. The pressure exerted can be controlled with a hydraulic press or tensile
test machine (filter paper press method) but there appears to be little improvement in
precision over that in methods where pressure is exerted manually. The centrifugation

45
methods involve centrifuging small samples of meat at high speed and under high
gravitational forces (60-100,00g) for long periods (Bouton et al., 1971). The exudate forma
as a supernatant and can be poured off and weighed. Capillary methods engage the use
of absorbent material such as gypsum (CaSO4) or filter paper. A sample of meat is
pressed between a plate and a block of gypsum. Air is displaced from the block by
exudates and rises up capillary tube, in turn displacing a coloured liquid. The volume of
exudates is read off a scale.
An example of indirect methods is protein solubility quantification to asses WHC. The
contractile (myofibrillar) proteins are extracted only at high ionic strength, e.g. by 1,1M KI
in 0,1 M potassium phosphate at pH 7,4. Non-structural (sarcoplasmic) proteins are
extracted by low ionic strength buffers, e.g. by 0,04 M potassium phosphate at pH 7,4.
The correlations with drip loss measured directly are higher with sarcoplasmic than with
myofibrillar or total protein concentrations and only sarcoplasmic protein concentrations
reliably differentiate between normal and DFD (Dark, firm, dry) pork. (Lopez-Bote,
Warriss, & Brown., 1989).
4.2.3 Molecular mobility - Proton Magnetic Resonance
In the past two decades proton nuclear magnetic resonance (NMR) relaxometry has also
been applied to describe water status in meat. This technique can provide direct
information about the interactions between water and proteins and it has been extensively
applied in meat science (Cope, 1969; Hazlewood, Nichols, & Chamberlain, 1969; Belton,
Jackson, & Packer, 1972; Hazlewood, Chang, Nichols, & Woessner, 1974; Pearson, Duff,
Derbyshire, & Blanshard, 1974; Bertram & Andersen, 2004) and also coupled with WHC
(Bertram, Donstrup, Karlsson, & Andersen, 2002; Tornberg, Andersson, Göransson, &
von Seth, 1993; Brøndum, Munck, Henckel, Karlsson, Tornberg, & Engelsen, 2000;
Brown, Capozzi, Cavani, Cremonini, Petracci, & Placucci, 2000; Bertram, Andersen, &
Karlsson, 2001), Differential Scanning Calorimetry (Bertram, Wu, van den Berg, &
Andersen, 2006), microscopy (Mortensen, Andersen, Engelsen, & Bertram; Bertram, Wu,
Straadt, Aagard, & Aaslying, 2006) and sensory analysis (Bertram, Aaslyng, & Andersen
2005). NMR relaxometry has also been used to investigate the modifications occurring in
meat during cooking, as water status and cooked meat properties are strongly dependent
on the nature of meat and on the processing parameters (e.g. cooking temperature,
movement of air in the oven, amount of steam present) that will determine the rate of heat
transfer (Fellows, 2000) and consequently affect cooked meat properties. Water status
changes related to the cooking of meat have been studied with NMR to verify the effect of
different temperatures, in relation to protein denaturation and shrinkage of the muscle
fibres (Bertram et al.; 2004; Micklander, Peshlov, Purslow, & Engelsen, 2002). Most of the

46
studies published in scientific literature have been carried out on pork meat (Bertram et
al.; 2004; Micklander, et al., 2002) and they were performed simulating the cooking
process in the NMR tube, without considering the mass transfer and the changes that
samples undergo in the oven environment (e.g., surface dehydration). These studies
reported the presence of different types of water that are physically compartmentalized
and characterized by multiple 1H T2 relaxation times (Cole, LeBlanc, & Jhingran, 1993;
Yamada, 1998; Lillford, Clark, & Jones1980; Bertram, Karlsson, Rasmussen, Pedersen,
Dønstrup, & Andersen, 2001). Few literature is available on NMR relaxometry studies on
other types of meat, such as chicken (Rongrong, & Li, 2000; Sharifudin, Nott, & Hall,
2006) and turkey (Bianchi, Capozzi, Cremonini, Laghi, Petracci, Placucci, & Cavani,
2004).
The denaturation of protein and its relation to water status and distribution among the
different domains has been investigated by means of 1H NMR (1H T2) and differential
scanning calorimetry (DSC) by Bertram et al. (2006). They reported that the denaturation
of myosin and actin were correlated to changes in water distribution and mobility and also
to the expulsion of water from meat. Different cooking processes may result in a different
degree of denaturation and, therefore, affect water mobility and distribution.
4.3 Sensory properties
Sensory properties are the characteristic that can be detected by the sense organs, for
foods used particularly of the combination of taste, texture and stringency (perceived in
the mouth) and aroma (perceived in the nose, Bender, 1999) .
During cooking, a complex series of thermally induced reactions occur between non-
volatile components of lean and fatty tissues resulting in a large number of reaction
products which contribute to the flavour of cooked meat (Mottram, 1998). Lipid oxidation
and other degradation reactions lead to the formation of low molecular compounds, which
contribute to sensory profile. Hydroperoxides and secondary oxidation products can react
with protein and amino acids during processing, heat treatment and storage period
affecting the flavour, odour and texture of meat products (Frankel, 1998).
The overall eating quality is strongly related to temperature and time dependent structural
changes that occur during cooking in particular those involving the protein fraction
(myofibrillar, sarcoplasmatic and connective tissue proteins, Walsh, Martins, O’ Neill,
Kerry , Kenny & Ward, 2010).
The sensory properties of meat perceived by the consumer are the result of both physical
and water properties of meat, for example, a sample characterized by higher WHC
presents a higher juiciness perception (Omojola et al., 2009).

47
Instrumental assessment of the components of eating quality can only be approximations
to the true measure of particular attribute, because no machine can measure the range of
interacting characteristic that contribute to eating quality and palatability. Sensory
perception is a complex task that depends at the same time from many quality of the food.
We don’t perceive tenderness in isolation, we perceive it in relation to juiciness and
“mouth feel” and perhaps even apparently unrelated attributes such as flavour and odour.
For some assessments there is therefore no alternative to the use of a taste panel
(Warriss, 2000).
Test panelling and sensory evaluation can be made by trained or consumer panels (8-10
panelists), the former is composed by individuals screened and trained while the latter
include selected members of the general public that asses the meat in less controlled
conditions.
There are different types of methods available to evaluate the sensory properties of meat,
the appropriate method to apply must be choose in relation to the specific properties to
assess and to the aim of the analysis. The are four many type of tests: difference or
discrimination tests, ranking tests, category scaling and sensory profiling. In
difference or discrimination test panellists are asked to make a choice between two or
more samples in regard to either witch they prefer or which is less or greater for some
characteristic. Examples of difference tests are Triangle test and Paired-Comparison
consumer tests. In ranking test more than two samples can be compared, with the aim to
rank a series of samples according to some characteristic.
The category scaling give information on how the samples are different from one other. It
is a descriptive test (ISO, 1985) that though category scales enable samples to be
categorized in regard to specified characteristics such as texture, juiciness and flavour
(Warriss, 2000). Prior to the analysis, the panel have to be trained in the definition and
intensities of attributes. An example of descriptive test is reported by Mielnik et al. (2008),
they showed as descriptive characteristics for turkey meat: odours (turkey, acidic, spicy,
rancid), flavours (turkey, acidic, salty, spicy, bitter, metallic, rancid), colour (whiteness,
hue, intensity) and texture attributes (hardness and juiciness). In sensory profiling
testing the assessors develop a unique set of descriptors to define the characteristic of the
sample. This leads to quite subtle descriptions of sensory characteristics of the sample
than category scaling. (Warriss, 2000)

48
5. STEAM OVEN COOKING
5.1 Effect of steam on foods
Steaming is one of the methods most used in Oriental cuisine but also in Occidental
countries has had a lot of success and nowadays is widely diffuse with various
applications. Steamed foods are appreciated because they retain their original flavour,
without this being affected by other substances (water, oil, butter, etc.), they have a
reduced fat content, for the loss of melt fats during cooking and to the absence of
condiments, and furthermore they show a smaller lost of water-soluble components
(vitamins, mineral, proteins, etc.) compared to boiled foods.
In particular for meat based foods steam cooking is reported to retain more proteins and
less fat than traditionally cooked samples. Foods cooked with steam are characterized by
a valuable retention of substances with attractive sensory properties (Choubert &
Baccaunaud, 2010) and recognized nutritional value i.e. vitamins and antioxidants
(Ferracane et al. 2008). Miglio, Chiavaro, Visconti, Fogliano, & Pellegrini (2008) in their
study on the effects of different cooking methods on nutritional characteristics of
vegetables, observed that, for carrots and courgettes, steaming determined a lower loss
of total phenols than boiling and frying. Moreover, they found that steaming was the only
cooking method that completely preserved glucosinolates and even significantly increased
by 30% of their initial concentration.
Nevertheless the scientific literature that analyzes the effect of different cooking
treatments on food properties is limited and moreover often the cooking conditions aren’t
clearly defined, making difficult the comparison between different processes.
All the steam cooking techniques exploit the high capacity of the water vapour to transfer
heat that leads to a speeding up of the cooking process (improvement of the efficiency of
the treatment). Steam cooking can be classified in function of the pressure which the
process is carried out in high pressure steam cooking (in pressure cookers), where
temperature reached by the steam is higher than boiling water, and room pressure steam
cooking traditionally conduct in steamers or in steam convection ovens.
5.2 Steam ovens
Steam ovens operating by steam and air-convection (commonly known as “combi”
ovens), are appliances who gained popularity since their introduction about twenty years
ago (Barbanti & Pasquini, 2005). “Combi” ovens combine the accurate heat control of an
air-convection oven with the efficiency of steam that can be used individually, sequentially

49
or in combination to give the operator multiple cooking choices in a single appliance
(Vittadini et al., 2005; Chiavaro, Rinaldi, Vittadini, & Barbanti, 2009).
Mainly two types of steam ovens are available on the market: the first type, commonly
used in catering services, has the steam generator external to the oven cavity, while in the
second one, mainly for domestic use, the steam is produced inside the oven cavity.
Whatever the type, ovens do not normally allow an accurate humidity control inside the
cooking chamber. Ovens with an external steam generation have the possibility to apply
alternating air-steam cycles and some models present a modulation system of the RH of
the air that allow to create different RHs, but with a rough control of the steam quantity.
These type of ovens have considerable dimensions and require a connection to the water
network of the building.
Ovens with a steam generation directly inside the oven cavity have a water tank and the
steam is created by the injection of nebulised water on the heating coil. In this kind of
ovens there isn’t the possibility to control air RH; there are only two possible modulations:
presence/absence of steam, that is no steam injection -dry air- or steam injection,
corresponded to the steam saturation condition. It is important to specify that above 100°C
the saturation condition don’t correspond to 100% RH but at different RH values as
reported in table 3 and thoroughly explained in section 2.2.1.
5.3 Effect of steam oven cooking on meat at low temperatures
Steam oven cooking is widely used both in industrial processing and domestic cooking
for several foods (e.g., cooked ham, ready-to-eat meals, various vegetables and
seafoods).
In oven cooking the air forced convection method is often coupled with steam injection in
the oven chamber to reduce the cooking time and to prevent surface dehydration (Belk,
Luchak, & Miller, 1993; Murphy et al., 2001). Steam oven cooking of meat, and in
particular of turkey meat, is widely used in commercial processing and foodservice
operations.
Operators gain several advantages in the steam oven cooking of meat, such as improved
yields and lower energy consumption (Danowska-Oziewicz, Karpinska-Tymoszczyk, &
Borowski, 2007). Nevertheless, the effect of steam on cooking parameters (cooking yield,
surface temperature) and on texture, colour and sensory properties (juiciness, tenderness,
palatability) of the cooked meat has not yet been clearly explained. Published data about
the use of steam-convection oven and its effects on the quality of the final products are
still rather limited and contradictory, making harder to understand the effect of different
cooking methods on meat.

50
Moreover, it is quite difficult to compare results of different research papers on air-and-
steam cooking mainly because of (i) different experimental conditions (e.g. oven
temperatures or different cooking end point temperatures) and in particular (ii)
unsatisfactory definitions of the thermodynamic conditions of steam (Skog, Eneroth, &
Svanberg, 2003, Barbanti et al., 2005, Danowska-Oziewicz et al., 2007, Białobrzewski et
al., 2010). Danowska-Oziewicz et al. (2007) found that weight losses in chicken cooked in
oven with/without steam were comparable, while Barbanti, & Pasquini (2005) reported that
the presence of steam in oven cooking resulted in an higher weight loss of chicken breast.
Few papers are published on steam oven cooking and most of them considered only the
steam saturation condition, that is the most diffused and simple steam cooking method
and is often compared to dry oven cooking (Vittadini et al., 2005; Chiavaro et al.2009).
Vittadini et al., (2005) compared samples of pork meat cooked in a commercial oven using
different cooking conditions: natural convection, forced convection or combined forced
convection/steam (FC/S) heating. FC/S treatment showed shorter cooking times
compared to natural and forced convection methods. FC/S samples also had significantly
higher weight loss than samples cooked by the other methods and resulted in a paler
colour on the meat surface.
Chiavaro et al. (2009) reported that saturated steam cooking proved to be particularly
attractive for pork meat compared to dry oven cooking at 100 and 110°C rather than 120
and 140°C: at lower temperatures the presence of steam resulted in similar or better
cooked meat quality (texture, colour, water holding capacity) in a shorter time.
Only little information is available on the use of steam quantities lower than saturation that
identify different relative humidity in the oven chamber. It was previously reported that the
heat flux is closely related to the relative humidity of the oven air and results in different
meat heating profiles (Murphy et al. 2001). Murphy et al., (2001) analyzed the effects of
different RHs (range, 40-95%) during oven cooking of chicken breast patties by means of
the evaluation of heat transfer properties and product yield between 149 and 218°C.
Heat transfer, cooking time and meat modifications during steam cooking were reported to
be strongly different from traditional oven cooking. They reported increased heat flux and
heat transfer coefficient (shorter cooking time) with increasing RH. An increased product
yield was achieved by reducing oven temperature or final internal temperature of the
product, and increasing RH.
The heating profile during cooking affects the sequence and the extent of meat protein
denaturation in the cooking process and, consequently, the physical and sensory
properties of the final product: a higher heating rate was previously associated to the
production of a leathery material where collagen and actomyosin underwent aggregation
almost simultaneously (Riva & Schiraldi, 1994).

51
Changes occurring in the cooking process were associated to structural modifications due
to the denaturation of proteins and to the loss of water (Tornberg, 2005).
In particular the application of a heating profile characterized by a slow cooking rate has
been reported to have a desirable effect on meat cooking characteristics in terms of
higher cooking yield and tenderness (Lawrence et al., 2001).
Studies of treatment at low temperature also have nutritional relevance because it has
been shown that the presence of steam reduced the mutagenic activity, except when high
temperature was used in combination with high air velocity.” (Skog et al. 2003).

52

53
Objective
The objective of this work was to study the effect of cooking with different steam quantities
(different relative humidities) on physical characteristics, water status and sensory
properties of turkey meat samples. The minimum relative humidity value that allows to
obtain a positive effect on meat quality and a higher potential water saving at low cooking
temperatures (80-150°C) has also been evaluated.

54

55
Set up of the experimental trials
1. COOKING EQUIPMENT: SET-UP OF AN EXPERIMENTAL STEAM CONVECTION
OVEN WITH CONTROLLED STEAM INJECTION (CONTROLLED HUMIDITY)
1.1. Design and development of the experimental steam cooking device
An improved steam cooking device was developed to investigate the relationship between
the application of different steam quantities/RH (different from the saturation condition)
and turkey cooking performances in terms of instrumental quality, sensory properties and
water status. The experimental cooking device was expressly designed to maintain fixed
air RH conditions. The apparatus allowed online monitoring and data-logging of air RH,
and temperature profile of both oven and samples during cooking.
The experimental set-up (Figure 9) consists of two major components, the cooking unit
(1), and the automated data acquisition system (2). The cooking unit consists of a
domestic electric convection oven (Whirlpool AKZ 190/IX) modified by connecting an
external steam generator (Tosca 100, Parma, Italy) to its cavity. Steam was injected
inside the oven chamber through a tube set in the centre of the vertical right panel,
towards the bottom of the cavity, to maximize and homogenize the steam diffusion. A
capacitive humidity-temperature sensor (Rotronic HygroClip HC2-IC302, Zurich,
Switzerland), characterized by a humidity accuracy of ±3% over the 80-150°C operating
range, was fixed in the centre of the vertical right panel in the oven cavity. The steam
generator had an on-off steam injection switch allowing to set the relative humidity in the
oven on the basis of the relative humidity measured by the sensor. The steam generator
was weighed before and after each cooking trial with an electronic bench-top balance
(Tamagnini, EP series, Parma, Italy), in order to estimate the water consumption.
Wire thermocouples (type K, Ni/Al–Ni/Cr) were placed inside the oven cavity to measure
dry and wet bulb temperatures as described by Chiavaro et al., (2009) and to calculate the
RH value (principle of the Assmann psychrometer, as reported in the introduction section
2.4). Temperature of each sample was recorded on the surface and at the geometric
centre during cooking using wire thermocouples (type K, Ni/Al–Ni/Cr).
(2) The computer based data acquisition system consisted of a personal computer
associated to a DAQ acquisition device (National Instruments, Austin, Texas), connected
to the thermocouples and the capacitive humidity-temperature sensor. A LabVIEW 8.0
graphical interface software (National Instruments, Austin, Texas) was used to develop a
graphical interface for the real–time measurement and recording of time/temperature and
humidity data profiles (Figure 10).

56
thermocouples
fan
tray
heatingcoil transmitter box
interface
T/RH probe
control valve
steam inlet
steam injector
computer
meatsamples
A) cooking unit A) cooking unit
B) automated data acquisition systemB) automated data acquisition system
Figure 9. Steam cooking device.
Figure 10. Graphical interface for the real–time measurement and recording of
time/temperature and humidity data profiles.

57
1.2. Experimental steam cooking device performance and optimization
Preliminary cooking experiments were carried out to characterize the performances of the
oven and to select the better cooking procedure.
A brief description of the performance parameters of the cooking equipment is reported
below.
- Heating condition: the “thermo-ventilation” was chosen among the several heating
conditions of the oven (natural convection/no ventilation, ventilation with two heating coils,
one in the upper part of the oven and another one in the lower, etc.) in order to minimize
the heating time and quickly reach the set cooking temperature. The thermo-ventilation
heating condition consisted of a forced convection cooking where the air was heated by a
circular heating coil located around the fan of the oven. The oven temperature resulted
very stable during the entire the cooking trial.
- Air speed measure: the airflow was measured with an air velocity probe (Testo, Milan
Italy) Air speed was 0,90 +/- 0,13m/s in thermo-ventilation cooking condition and the flux
variation of was about 14%.
- Oven’s thermal inertia: the time necessary to reach the target cooking temperature
was about 20 minutes for all the temperatures considered. Hence, the samples were
inserted in the oven after this time.
- Quantification of steam flux at different steam generator settings (from SET1 to SET9,
13.2-56.6 g/min). Steam flux uniformity is reached after only 3-4 minutes of continue
steam injection. SET3 -16.3±3.3g/min- and SET5 (only for the condition of 110°C at 62%)
-31,6±1.41g/min- were chosen for the trials in order to have a controlled steam injection
with adequate on-off time breaks.
A low and a high steam cooking of hygroscopic samples (white bread, 3x3x6cm) were
considered (100°C RH:24%, 110°C RH:62% -the saturation condition-) in order to quantify
the temperature/humidity reproducibility and uniformity of the treatments. The heating
profile in the geometric centre of each sample was monitored with wire thermocouples
and sample weight loss was recorded after cooking in order to evaluate the heat and
mass transfer of the samples. Three trials of each treatment were carried out to assess
the reproducibility of the system. Samples were put in different positions on the cooking
tray to quantify the uniformity of each treatment. The obtained results are reported below.
- Heating reproducibility: a good reproducibility was recorded with a maximum standard
deviation between treatments of ±0.9°C.

58
- Humidity reproducibility: a maximum difference of ± 1.5 - 2% of the mean weight loss
value between the samples in the same position was obtained. The system allowed for a
good reproducibility.
- Heating uniformity: the temperature difference between samples was high in the first 3-
4 minutes of the cooking process, while it reached at most 1°C at the end of the warm up
and the device was correctly working at full capacity (corresponding to a coefficient of
variation percentage (C.V.%) of about 1.5%). The recorded temperature difference was
considered negligible.
- Humidity uniformity: samples in different positions of the cooking tray, after the steam
treatment, showed a maximum weight difference of 4-5% (corresponding to a coefficient
of variation percentage (C.V.%) of about 10-15%). This humidity uniformity has been
considered a good standard.
The apparatus (a common electric oven) could not be considered a close system nor an
open one from a thermodynamic point of view, but rather a semi-open system. Hence, the
only feasible regulation of the air relative humidity was the “on-off steam injection” (Figure
11). Different RH target levels and the corresponding RH ranges were identified (Table 4)
with several experimental trials. A maximum RH variation of ±5% from the target level was
considered a tolerable variation in order to create different RH ranges clearly separated
among each other and to have a manageable process (the on-off regulation was manually
performed).
The RH ranges, clearly separated and well centred on the target levels were obtained and
they are showed in Figure 12.
Range RH%RH% target level
MIN
MAX
Range RH%RH% target level
MIN
MAX
Figure 11. On-off steam injection
43
40.5
43
38-48
62
59.5
62
57-67
933424-ON-OFF
833121.5-ON-OFF
8835245RH % centre
of the level
83-9330-4019-290-10RH % level
43
40.5
43
38-48
62
59.5
62
57-67
933424-ON-OFF
833121.5-ON-OFF
8835245RH % centre
of the level
83-9330-4019-290-10RH % level
Table 4. Experimental trials: RH target levels, the corresponding RH ranges and the ON-OFF applied.

59
0
10
20
30
40
50
60
70
80
90
100
0 1 2 3 4 5 6 7t (min)
RH
(%
)
5%
24%
88%
43%
62%
35%
RH target
levels
Figure 12. Examples of the time/RH profiles at the cooking temperature of 100°C.
2. MUSCLE PREPARATION Turkey (Meleagris gallopavo) breast samples (pectoralis major), from the same
processing plant and stored at 4°C, were purchased from a local supermarket 72 hours
after slaughter and analyzed within 8 hours. Two slices (3 cm thick) were obtained from
halved breasts and four samples of 3x3x6 cm (about 50g each) with muscle fibres running
parallel to the major dimension were taken from each slice (Figure 13) . A total of 200 g of
turkey meat was used in each cooking trial (4 pieces of 50 g). Meat samples were
extracted from the fridge, equilibrated at room temperature (20-25°C) for 15 minutes until
they reached an ultimate temperature of about 13-15°C of the geometric core of the
samples prior to cooking.
Figure 13. Preparation of the turkey meat samples.

60
3. COOKING TREATMENTS The specific cooking conditions will be described in the following sections (A, B, C).
Three cooking trials for each treatment were carried out placing 4 meat samples
positioned on the tray located in the middle height of the oven. The four meat samples
were placed on the cooking tray at the same distance from each other and the oven walls,
symmetrically. A total of 12 samples were analyzed for each cooking condition.
Temperature of each cooked sample was recorded during cooking using wire
thermocouples (type K, Ni/Al–Ni/Cr) which were placed on the surface and at the
geometric centre of each sample.
Cooking treatments finished when meat samples reached 74°C at their thermal centre,
that is the recommended safety temperature for turkey meat (United States Department of
Agriculture, 2006). Cooked samples were then cooled at room temperature for 30 minutes
to reach a temperature of 27±2°C in the geometric core of the samples.
The degree of cooking in the centre and on the surface of each sample was expressed in
terms of cook value, considering only the heating phase (Poon et al. 2001). The cook
value was calculated by integrating the heat penetration curve in the centre and on the
surface of meat samples, as previously reported (Holdsworth, 1985; Vittadini et al., 2005).

61
Methods of analysis
The specific application of each method is described in the following sections (A, B, C).
1. PHYSICAL PROPERTIES 1.1 Colour
Colour of fresh and cooked samples was measured by means of a Minolta Colorimeter
(CM 2600d, Minolta Co., Osaka, Japan) with the standard illuminant D65 at 10° position of
the standard observer (CIE, 1976). 16 readings for each sample at different positions (8 at
the surface and 8 at the centre) were taken. Colour data were processed using the colour
scale L*a*b* and the analysis of the VIS reflection spectra.
L*(lightness), a*(redness), b*(yellowness), C*(chroma), h* (hue angle) parameters
and colour difference ∆E between cooked and raw sample (Sosa-Morales et al., 2006)
were considered.
The VIS reflection spectra (400÷700 nm) were also recorded and the spectral data were
converted to log (1/R) units, (where R is reflectance), as reported by Brùndum, Byrne,
Bak, Bertelsen, & Engelsen (2000).
1.2 Texture
Objective texture was measured on raw and cooked meat with a Texture Analyser (TA-
XT2, Stable Micro Systems, Goldalming, UK) equipped with a 25 kg load cell. The
performed tests were: shear force test and texture profile analysis (TPA).
Shear force test
For the shear force test, fresh and cooked meat samples (n = 8) were cut perpendicularly
to muscle fibers with a Warner–Bratzler blade (3 mm thickness) moving down at 2 mm*s-1
(test speed). Shear (maximum) force and the work after the maximum force were
measured. The shear force (N) was then normalized to the shear surface (N/m2) and the
work after the maximum force (J) to the shear section (J/m2).
Texture profile analysis (TPA)
The TPA, double compression test, was performed on 2x2x2 cm samples of fresh and
cooked meat. The test was carried out perpendicularly to muscle fibres by means of a
cylindrical probe (code P35) at 5 mm*s-1. The contact area was 4 cm2, the final strain was
set at 50% and the time interval between the first and the second compression was 1 s.
Hardness (N) was calculated as reported by Cheng, Sum, & Scannell., (2005) as peak
force required for the first compression. All experimental data were collected and analysed
by Texture Expert software version 1.22.

62
1.3 Shrinkage
Length (L), width (W) and height (H) of each sample were measured by means of a
manual calliper before and after each cooking trial and the total volume (V) of the meat
sample was calculated. Each parameter was expressed as the ratio (dimensionless)
between raw (i) and cooked value (f), identified, respectively, with Lf/Li, Wf/Wi, Hf/Hi, and
Vf/Vi.
1.4 Cooking yield
Cooking weight loss percentage (WL%) was calculated by weight difference between
uncooked and cooked samples on weight of uncooked samples * 100 as reported by
Vittadini et al. (2005).
2 WATER PROPERTIES OF COOKED MEAT PRODUCTS 2.1 Moisture Content
Moisture content of samples was determined for raw and cooked samples by weight loss
at 105°C (ISCO NSV 9035, ISCO, Milan, Italy) to constant weight, 4 measurements for
each sample were carried out. In particular moisture content of cooked samples were
evaluated both in the external (EXT) and internal (INT) positions.
2.2 Water holding capacity (WHC)
WHC for raw and cooked samples was obtained following the method of Bouton et al.
(1971), with few modifications. After equilibration at room temperature, meat samples of
about 0.25–0.35 g taken from the external (EXT) and the internal (INT) positions of each
sample were weighed and centrifuged at 4°C at 14000 rpm for 30 min (Centrifuge 5810R,
Eppendorf AG Barkhausenweg, Hamburg, DE). Meat WHC was expressed as the
percentage fraction water lost referred to 100 g of water in raw samples (Chiavaro et al.,
2009). Six determinations were performed for EXT and INT for each cooking trial. Eight
pieces were analyzed for the raw sample.
2.3 Low resolution nuclear magnetic resonance (1H NMR)
A low resolution (20 MHz) 1H NMR spectrometer (the minispec, Bruker Biospin, Milano,
Italy) operating at 25°C was used to study proton molecular mobility by measuring the
free induction decay (FID), transverse (T2) and longitudinal (T1) relaxation times. 24 NMR
determinations for RAW, cooked (INT and EXT) and post- centrifugation samples
(RAWWHC and INT cooked samples – NSWHC, LSWHC, HSWHC) were carried out. Samples
were placed in the NMR tube that was then sealed with Parafilm® to prevent moisture loss

63
during the NMR experiment. Recycle delays for all experiments ranged from 1 to 3 s,
depending on the sample 1H T1. 1H FIDs were acquired using a single 90° pulse, followed
by dead time of 7 µs. T2 (transverse relaxation times) were obtained with a CPMG pulse
sequence (Carr, & Purcell, 1954; Meiboom, & Gill, 1958) and an interpulse spacing of
0.15 ms and a number of data points varying from 3000 to 6000, depending on the
sample relaxation time. 1H T1 (longitudinal relaxation times) were determined by the
inversion recovery pulse sequence with a log-spaced interpulse ranging from 1 ms to
6000 ms depending on the sample relaxation time and 20 data points were collected. 1H
T2 and 1H T1 curves were analyzed as quasi-continuous distributions of relaxation times
using a UPEN software (Borgia, Brown, & Fantazzini, 1998; 2000).
3. SENSORY ANALYSIS All sensory tests were performed by a semi-trained panel. Cooked turkey samples were
halved to evaluate both the internal and the external parts of the sample and equilibrated
at room temperature for at least 30 minutes prior to be evaluated by the assessors.
Cooked samples were ranked for liking of overall aspect and flavour (taste and oral
texture) by a panel of 10 people.
Three additional sensory tests were carried out to thoroughly evaluate the effect of low
and high steam on the sensory properties of cooked meat:
• A triangle test was carried out to assess if the subjects (n=9) could perceive a
sensory difference in terms of aspect and tenderness (by handling the samples).
• A ranking test was performed with 20 subjects, as described above, to assess the
overall liking for aspect and flavour.
• A paired-comparison consumer tests (two sided) with 17 subjects was carried out
to assess the sensory perception of tenderness.
Data analysis was carried out as previously reported (Jellineck, 1985).
4. STATISTICAL ANALYSIS Means and standard deviations (SD) of experimental data were calculated with SPSS
(Version 16.0, SPSS Inc., Chicago, Illinois, USA) statistical software. One-way-analysis of
variance (ANOVA) with a Tukey-high significant difference test, at a 95% confidence level
(p < 0.05) was applied to identify significant differences among the different cooking
conditions.

64

65
Section A
OVEN COOKING OF TURKEY MEAT AT DIFFERENT RELATIVE HUMIDITIES
B. Mora, D. Barbanti, G. Betta, F. Bozzoli
1. Abstract
Some selected physical characteristics of turkey meat (weight loss, texture, colour,
volume shrinkage and cook value) were evaluated after oven cooking at 100 and 110°C.
For each cooking temperature, dry air (only air convection, RH = 5%) and three
predetermined relative humiditiy values (RH = 24, 43 and 62%, respectively) were
obtained inside the oven cavity by means of a steam generator.
Significant cooking time decrement of about 70-90% (compared to air convection
condition) was achieved by using steam, both at 100 and 110°C with the exception of the
treatment at 100°C and RH= 24%. Moreover, the steam presence during cooking
increased the cooking yield when steam treatments were shorter than the dry air
convection treatment. About 10% cooking yield increase (as compared to air convection
condition) was found at 100°C (at RH = 43% and 62%) and at 110°C (at RH = 62%). An
additional cooking yield increase up to +15% was measured at RH = 24% and 43% at
110°C. Steam cooking lead to a noticeable decreases of shrinkage, shear force and
hardness of meat samples both at 100 and 110°C. The best cooking conditions, in terms
of short cooking time, high cooking yield, high tendernss and minor chewiness were
obtained at 100°C with RH = 62% and 110°C with RH = 43%.
2. Aim of the Work
The objective of this work was to study the effect of cooking with diffferent steam
quantities on some physical characteristics of turkey meat samples.
The cooking trials were carried out at three relative humidities (24, 43 and 62% RH) and
two cooking temperatures (100 and 110°C) in an air-and-steam convection oven. The
standard cooking trials at 100 and 110°C were carried out without steam injection (RH =
5%). In order to verify the experimental relative humidities and temperatures, a continuous
check and control of these parameters were carried out. The effects of the different
cooking trials on the selected physical characteristics of turkey meat samples were
evaluated by means of analyses of cooking yield, hardness, shear force, shrinkage and
colour.

66
3. Materials and Methods
3.1 Sample Preparation
Turkey breast samples were obtained as reported in the section Set up of the
experimental trials.
3.2 Cooking trials
Turkey breast samples were cooked at two air temperatures (100 and 110°C) and three
relative humidities (RH = 24, 43 and 62%) under forced air circulation with the cooking
equipment described in the section Set up of the experimental trials. Another cooking
treatment was carried out without steam injection (RH = 5%, convection cooking, coded
as CC). The other conditions (RH = 24, 43 and 62%, ± 5%) were maintained by means of
manual on-off control of the steam generator. These steam convection cooking were
coded as 24SCC, 43SCC and 62SCC respectively, and all the steam convection cooking
treatments were coded as SCC.
Temperature of the surface and at the geometric centre of the sample were recorded
during cooking in order to obtain the thermic profiles of the samples. The cook value was
calculated both at the surface and in the centre of the samples as reported in the section
Set up of the experimental trials. The final surface temperatures and the cooking time
were also recorded.
3.3 Analyses
Turkey meat samples were characterized for the following physical properties: volume
shrinkage (Vf/V0), weight loss, texture properties –Shear Force test and Texture Profile
Analysis – and colour scale L*a*b* parameters. The detailed procedures of the analysis
were reported in the section Methods of analysis.
3.4 Statistical Analysis
Statistical analysis were performed as described in in the section Methods of analysis.
4. Results and Discussion
4.1 Thermal profiles
In order to have constant temperature and RH inside the oven cavity and also to reach 74
°C at the thermal centre of each sample, a continuous check of these parameters for each
cooking trial was carried out. In Figure A/ 1 an example of the evolution of dry and wet
bulb temperatures and RH inside the oven cavity and the temperatures of meat sample
surface and centre were reported (110 °C, RH = 24%). The set oven temperature
resulted very stable all along the cooking trial.

67
Surface and centre temperatures of meat samples increased with time during cooking with
different rates, as expected. Surface temperature of meat samples was affected by the
on-off steam injection: the on-off steam injection caused little variations of the temperature
of the surface of samples during cooking. When the steam was injected it condensed on
the surface of the samples and the latent heat produced by condensation was given up to
the surface that increased its temperature.
In Figures A/ 2a and A/ 2b, the temperature profiles of sample surface and wet bulb at 100
and 110 °C and different RH were reported. Each cooking treatment was considered
finished when meat samples reached 74 °C at its thermal centre, hence different cooking
lenghts were obtained. SCC and CC treatments resulted in different heating kinetics of the
sample surfaces, both at 100 and 110 °C. SCC treatments always showed an initial rapid
increase of surface temperature; this behaviour was due to the latent heat of
condensation transferred from the steam to the meat samples surface, about 2260kJ*kg-1,
(Perrot, 1998) and to the higher heat transfer coefficient of condensing water vapour
(h=104-105 W m-2 K-1) compared to that of forced convection air (h=102 W m-2 K-1) (Datta,
2002). Moreover, at the beginning of the cooking process (after about 10 min) the
sample’s heating rate was directly proportional to the relative humidity of the air, as
already reported by Murphy, Johnson, Duncan, Clausen, Davis & March (2001). The
relation between the heating rate of samples and the RH of the air in the oven was
quantified considering the surface temperature of the samples after 10 minutes. At both
the examined cooking temperatures (100-110°C) the surface temperatures of samples
were proportional to the RH of the air with a second degree relation:
100°C: T(°C) = -0.0055 RH2 + 1.06 RH + 44.237 R2=0.99
110°C: T(°C) = -0.0052 RH2 + 1.1317 RH + 46.985 R2=0.99
After an initial phase characterized by a surface temperature increase a constant
temperature period was observed at 100 °C, 24% and 43% RH and at 110 °C, 24% RH.
These conditions allowed sample surfaces to behave like a wet-bulb, in terms of mass
transfer and temperature, according to the drying theory (Fellows, 2000). The temperature
equilibrium is reached at the surface of the food if it is maintained perfectly wet by the
migration of water from the interior of the food itself; when this condition occurs, the
surface shows constant temperature, equal to wet bulb temperature and it is a function of
cooking T and RH. At other SCC conditions (100 °C, 62% RH, 110 °C, 43 and 62% RH)
meat sample surfaces reached 74 °C at the thermal centre in few minutes (about 10 min)
hence the constant temperature period did not appear.

68
During CC treatment, a continuous increase of surface temperature both at 100 and 110
°C was observed: the surface temperature did not behave like a wet bulb and a slow and
constant surface temperature increase during the entire cooking trial occurred. It was due
to the dehydration caused by the vapour partial pressure gradient between the food and
the surrounding air, in agreement with the second phase of drying theory (Fellows, 2000).
In Table A/ 1, a summary of final surface temperature, cooking time, cook values,
moisture content and volume shrinkage has been reported. The final surface
temperature of meat samples always turned out lower than 100 °C because of water
evaporation and consequent cooling effect at the meat surface. Nevertheless, the
increasing of RH values (both at 100 and 110 °C) reduced the vapour pressure gradient
between the food and the surrounding air, thus resulting in a lower water evaporation and
in an increase of meat surface temperature.
4.2 Cooking time
In SCC treatments the cooking time was in inverse proportion to the RH value, both at 100
and 110 °C. At 100 °C a significant cooking time reduction in comparison with CC
condition was observed: -82 % for 43SCC and -89% for 62SCC, with no significant
differences between them. These values depended on the faster initial heating kinetic of
SCC, as previously described.
An “apparent” abnormal value of cooking time was repeatedly observed at 24SCC and
100 °C, significantly higher than CC at 100 °C (+17.7%). Taking into account that during
the 24SCC trials the wet bulb temperature (Twb) was about 74.5 °C, the extension of
cooking time depended on the low temperature gradient between sample surface and
centre until the end of cooking (T=74 °C at sample’s thermal centre).
At 110 °C, 24SCC, 43SCC and 62SCC showed a noticeable cooking time reduction in
comparison with CC: -72, -86 and -87%, respectively.
4.3 Cook value
Surface and centre cooking values (CzTref ) are the measure of the cumulative heat impact
of the time/temperature history on a food quality attribute (Poon, Durance, & Kitts, 2001).
The surface CzTref value of SCC, except 24SCC at 100 °C, resulted three to four times
lower than CC at both temperatures of 100 and 110 °C, mainly due to their respective
shorter cooking time. By considering the limit threshold of thermal damage of 13,56
minutes at 100°C, defined as the time necessary to reduce thiamine content by 3%
(Pompei, 2009), the surface CzTref of CC treatments and 24SCC at 100 °C exceeded this
value, while at the other SCC treatments a limited nutritional quality degradation of meat
(CzTref <13,56 min) can be hypothesized. The centre Cz
Tref value, both at 100 and 110 °C

69
was always lower than surface CzTref value, due to the lower temperature reached in the
centre of the sample (74 °C).
4.4 Moisture content
The moisture content of heat treated samples with steam injection (at 100 °C) decreased
with the decrasing of RH. The lowest MC value was obtained at 24SCC because of the
longest cooking time, while the highest MC value was measured at 62SCC (2,18
kgwater/kgdry matter). At 110 °C the higher MC decreasing was observed for the CC condition
(1,56 kgwater/kgdry matter), while for 24SCC, 43SCC and 62SCC the shorter cooking times
reduced MC decrease (2,13, 2,1 and 2,06 kgwater/kgdry matter, respectively).
4.5 Shrinkage
The cooking process induced a volume reduction of meat samples; the volume shrinkage
value (Vf/V0) of SCC meat samples was always higher (hence their volume reduction was
lower) than the corresponding CC samples both at 100 and 110 °C. In details, at 100 °C
the Vf/V0 value of 43SCC samples was the highest (+20%) in comparison with CC sample.
At 110 °C the shrinkage value of all SCC samples resulted significantly higher than CC
samples (+20-27%), but no significant differences were found among SCC samples.
4.6 Weight loss
Weight loss (WL) is the measure of the product cooking yield, the higher weight loss the
lower cooking yield.. The average WL values obtained at 100 and 110 °C have been
reported in Figure A/ 3. The presence of steam significantly reduced meat sample WL
(with the exception of 24SCC at 100 °C), in comparison with CC both at 100 and 110 °C.
At 100 °C, 43SCC and 62SCC the WL of meat samples resulted to be of about 20%
(+10% of cooking yield compared to CC at the same temperature), whereas at 100 °C,
the WL of 24SCC was greater than CC mainly because of the long time needed for this
cooking condition. The lowest WL were observed at 110 °C, 24SCC and 43SCC, where
they were about 15% lower than CC. At 110 °C the sample’s WL at RH = 62%
(corresponding to the pure steam condition at this temperature) was higher than the WL at
lower relative humidities probably due to the highest cooking rate of this particular thermo-
hygrometric condition compared to the other ones. The presence of steam reduce the
vapour pressure gradient between the surface of the sample and the air, hence steam
cooked samples with a cooking length lower than CC presented a lower weight loss than
the ones cooked without steam. However, when the cooking length of steam cooked
samples resulted greather that CC (24SCC at 100 °C) we obtained the opposite result: an
higher WL in steam cooked samples, because the crust formation in CC samples obstacle
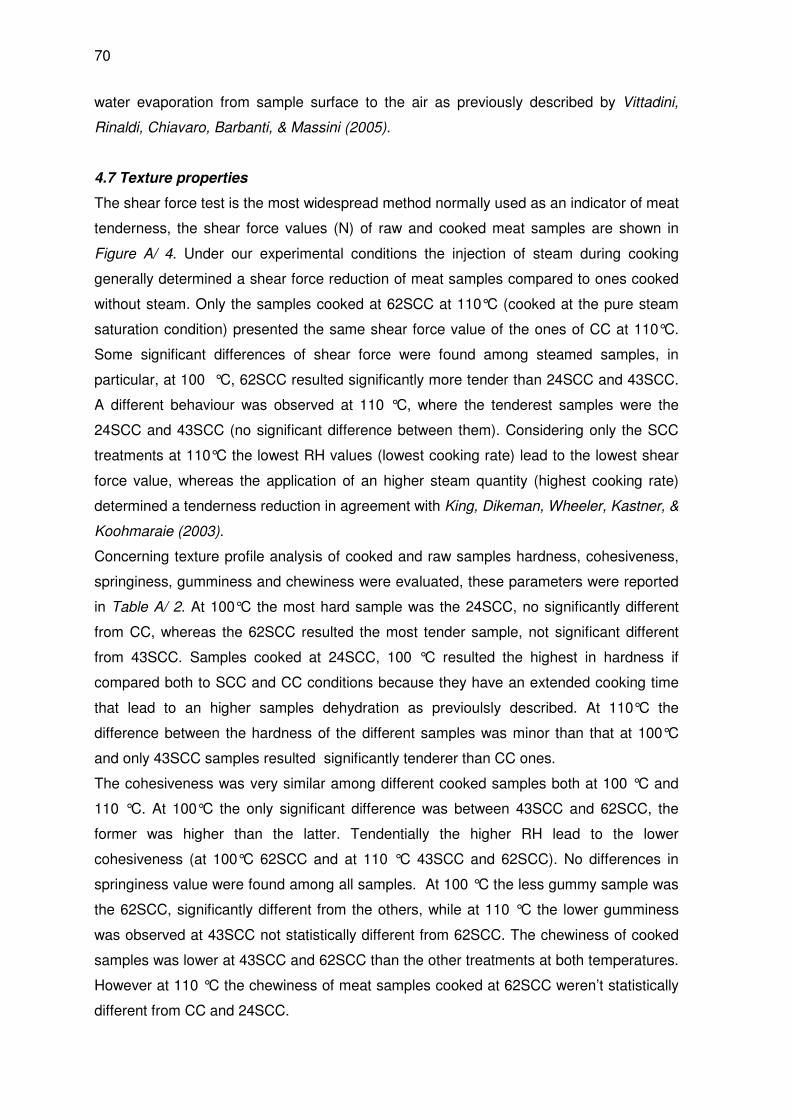
70
water evaporation from sample surface to the air as previously described by Vittadini,
Rinaldi, Chiavaro, Barbanti, & Massini (2005).
4.7 Texture properties
The shear force test is the most widespread method normally used as an indicator of meat
tenderness, the shear force values (N) of raw and cooked meat samples are shown in
Figure A/ 4. Under our experimental conditions the injection of steam during cooking
generally determined a shear force reduction of meat samples compared to ones cooked
without steam. Only the samples cooked at 62SCC at 110°C (cooked at the pure steam
saturation condition) presented the same shear force value of the ones of CC at 110°C.
Some significant differences of shear force were found among steamed samples, in
particular, at 100 °C, 62SCC resulted significantly more tender than 24SCC and 43SCC.
A different behaviour was observed at 110 °C, where the tenderest samples were the
24SCC and 43SCC (no significant difference between them). Considering only the SCC
treatments at 110°C the lowest RH values (lowest cooking rate) lead to the lowest shear
force value, whereas the application of an higher steam quantity (highest cooking rate)
determined a tenderness reduction in agreement with King, Dikeman, Wheeler, Kastner, &
Koohmaraie (2003).
Concerning texture profile analysis of cooked and raw samples hardness, cohesiveness,
springiness, gumminess and chewiness were evaluated, these parameters were reported
in Table A/ 2. At 100°C the most hard sample was the 24SCC, no significantly different
from CC, whereas the 62SCC resulted the most tender sample, not significant different
from 43SCC. Samples cooked at 24SCC, 100 °C resulted the highest in hardness if
compared both to SCC and CC conditions because they have an extended cooking time
that lead to an higher samples dehydration as previoulsly described. At 110°C the
difference between the hardness of the different samples was minor than that at 100°C
and only 43SCC samples resulted significantly tenderer than CC ones.
The cohesiveness was very similar among different cooked samples both at 100 °C and
110 °C. At 100°C the only significant difference was between 43SCC and 62SCC, the
former was higher than the latter. Tendentially the higher RH lead to the lower
cohesiveness (at 100°C 62SCC and at 110 °C 43SCC and 62SCC). No differences in
springiness value were found among all samples. At 100 °C the less gummy sample was
the 62SCC, significantly different from the others, while at 110 °C the lower gumminess
was observed at 43SCC not statistically different from 62SCC. The chewiness of cooked
samples was lower at 43SCC and 62SCC than the other treatments at both temperatures.
However at 110 °C the chewiness of meat samples cooked at 62SCC weren’t statistically
different from CC and 24SCC.

71
Hardness, gumminess and chewiness at 100°C resulted linearly related in inverse
proportion to the moisture content of samples with a R2 higher than 0,93 (correlations not
reported). At 110°C the same tendency was observed however the presence of an outlier
(the sample 24SCC) made difficult any relation between texture parameters and moisture
content. No relation between moisture content of samples and shear force data was
observed (R2 ~0,3).
Sensorial quality of meat is strongly affected by its moisture content, hence, since TPA
results were better related to the moisture content of samples than shear force results, it
could be hypothesized that TPA analysis could better relate to the sensorial quality of
meat than shear force test in agreement with Ruiz De Huidobro, Miguel, Blàzquez, &
Onega (2005) which affirmed that texture profile analysis (TPA) seems to be the most
useful and accurate method for predicting sensory texture of cooked meat.
4.8 Colour
The differences of colour parameters between cooked and raw samples (∆) are shown in
Table A/ 3. The surface colour parameters of the uncooked meat was characterized by
lightness L* = 49.2 ± 2.9, redness a* = -0.7± 0.6, yellowness b* = 3.1 ± 1.1. Cooking
caused an increase of the sample’s surface colour in terms of L*, a* and b*, consequently
cooked meat sample’s surfaces were brighter (higher L*), more red (higher a*) and yellow
(higher b*) than the raw uncooked samples.
SCC samples compared to CC samples showed a paler colour: they resulted in lower a*
and b* than CC sample and also by higher L*. Significant differences in terms of surface
colour increase between SCC (with short cooking times) and CC were found. In SCC
samples with short cooking times the presence of steam prevented surface dehydration
thus reducing Maillard reactions while, as expected, under CC condition a uniform brown
crust formation was clearly observed and instrumentally detected. No color differences
were found between steam cooked samples at different RH with short cooking times.
Meat samples cooked at 24SCC, 100 °C (steam cooking with long cooking time) showed
an increased a* values (browning degree) in-between CC and SCC samples: a non
uniform crust formation, localized on edges and corners, the more dehydrated areas, was
observed.
Concerning the colour of the internal part of meat samples contrasting results between the
two temperatures were obtained. At 100°C the higher ∆E value was recorded in CC
sample, while at 110°C in absence of steam the ∆E value was the lowest, and the same
behaviour was observed for ∆L* values. An high ∆a* value was observed at 24SCC at
100°C no significantly different from CC at the same temperatures.

72
5. Conclusions
In this study the attention has been focused to the control of the relative humidity under
different cooking conditions. Important information have been obtained from the analysis
of the heating profiles of samples during cooking: at the beginning of the cooking process
the presence of steam increased the heating rate of meat samples with increasing relative
humidity of the air.
Different relative humidities led to different meat cooking performances. The presence of
steam significantly reduced meat sample weight loss, increased their tenderness and
prevented high volume reductions when cooking times were shorter than dry oven
cooking. Whereas, when longer cooking times occurred (100°C, 24%) the steam presence
led to a worsening of the selected quality parameters of turkey meat.
The best cooking performances (maximum cooking yield, highest tendernss, minor
chewiness, etc) were found at RH = 62 % at 100 °C and at RH = 43 % at 110°C. At 110°C
relative humidities lower than saturation allowed to obtain better quality characteristics of
cooked meats with a potential energy saving.
A good knowledge of cooking behaviour under different relative humidities could be
usefull to improving food quality and reducing energy consumption.

73
6. List of Figures
Figure A/ 1. Thermal profile of a turkey meat sample during steam-convection cooking at
oven’s air temperature of 110°C and relative humidity of 24 %.
Figures A/ 2. Sample surface temperature and wet bulb temperature evolution at 100°C
(a) and 110°C (b) at the different relative humidity conditions (RH= 5%, 24%,43% and
62%).
Figure A/ 3. Weight loss values of meat samples cooked at the different T/RH conditions,
(weight loss difference between fresh and cooked samples) expressed as percentage on
fresh sample weight (WL%).
Figure A/ 4. Shear force results (expressed as N*cm-2) for uncooked turkey meat samples
and cooked samples at 100 and 110°C under different relative humidity conditions.

74
Figure A/ 1. Thermal profile of a turkey meat sample during steam-convection cooking at
oven’s air temperature of 110°C and relative humidity of 24 %.
0
10
20
30
40
50
60
70
80
90
100
110
120
0 5 10 15 20 25
t (min)
T (
°C)
0
10
20
30
40
50
60
70
80
90
100
RH
(%
)
Dry bulb oven temperature Sample surface temperature Sample centre temperature
Wet bulb temperature RH

75
Figures A/ 2. Sample surface temperature and wet bulb temperature evolution at 100°C
(a) and 110°C (b) at the different relative humidity conditions (RH= 5%, 24%,43% and
62%).
20
30
40
50
60
70
80
90
100
110
0 20 40 60 80 100 120 140
t (min)
T (
°C)
RH=62%
RH=43%
RH=24%
RH=5% (no steam)
20
30
40
50
60
70
80
90
100
110
0 20 40 60 80 100 120 140
t (min)
T (
°C)
RH=62%
RH=43%
RH=24%
RH=5% (no steam)
a)
b)
Wet bulb
Sample surface
Wet bulb
Sample surface
100°C
110°C

76
Figure A/ 3. Weight loss values of meat samples cooked at the different T/RH conditions,
(weight loss difference between fresh and cooked samples) expressed as percentage on
fresh sample weight (WL%).
0
5
10
15
20
25
30
35
40
5 24 43 62
Relative humidity (%)
Weig
ht
loss (
%)
T=100°C
T=110°C
c c
b b
a
d
c
d

77
Figure A/ 4. Shear force results (expressed as N*cm-2) for uncooked turkey meat samples
and cooked samples at 100 and 110°C under different relative humidity conditions.
0
20
40
60
80
100
120
140
160
_5 24 43 62
RH (%)
Sh
ear
Fo
rce (N
)
raw meat T =100°C T = 110°C
cccd
b
bbb
d
a
0
20
40
60
80
100
120
140
160
_5 24 43 62
RH (%)
Sh
ear
Fo
rce (N
)
raw meat T =100°C T = 110°C
cccd
b
bbb
d
a

78
7. List of Tables
Table A/ 1. Meat cooking results at the different temperatures and hygrometric conditions:
samples’ final surface temperature (°C), cooking time (min), surface and center cook
values (min), moisture content (kg water/kg dry matter) and volume shrinkage
(dimensionless). Numbers in parenthesis are the standard deviation of the mean (+/-).
Samples’ final surface temperature, cooking time, surface and center cook values n=2,
moisture content n=4, shrinkage n=8. Means with the same letter are not significantly
different (p<0.05).
Table A/ 2. TPA results of raw and cooked meat samples at the different temperatures
and hygrometric conditions: hardness, cohesiveness, springiness, gumminess and
chewiness values are reported. Numbers in parenthesis are the standard deviation of the
mean (+/-). n=8. Means with the same letter are not significantly different (p<0.05).
Table A/ 3.
Meat cooking results at the different temperatures and hygrometric conditions: external
surface and centrals section colour parameters. Differences (∆) are between cooked and
uncooked samples. Numbers in parenthesis are the standard deviation of the mean (+/-).
n=32. Means with the same letter are not significantly different (p<0.05).

79
Table A/ 1. Meat cooking results at the different temperatures and hygrometric conditions:
samples’ final surface temperature (°C), cooking time (min), surface and center cook
values (min), moisture content (kg water/kg dry matter) and volume shrinkage
(dimensionless). Numbers in parenthesis are the standard deviation of the mean (+/-).
Samples’ final surface temperature, cooking time, surface and center cook values n=2,
moisture content n=4, shrinkage n=8. Means with the same letter are not significantly
different (p<0.05).
TreatmentFinal surface
temperature (°C)
Cooking time
(min)
MC (kg water/kg
dry matter)Shrinkage (Vf/V0)
Surface Centerraw meat:
2.7 (0.06) a
100°C
CC 80.1 (1.7) de 98.2 (5.5) b 12.4 (1.7) a 8.1 (0.1) b 1.52 (0.02) d 0.69 (0.08) c
24SCC 74.5 (2.2) e 115.7 (3.2) a 15.8 (0.7) a 14.2 (0.1) a 1.38 (0.07) e 0.73 (0.07) bc
43SCC 82.8 (0.4) cd 17.6 (0.6) de 3.9 (0.2) b 0.9 (0.1) e 2.08 (0.04) c 0.83 (0.09) a
62SCC 90.4 (0.3) ab 10.6 (1.8) e 3.4 (0.1) b 0.6 (0.1) e 2.18 (0.05) b 0.76 (0.08) abc
110°C
CC 82.2 (2.8) cd 79.9 (4.7) c 12.1 (1.3) a 7.1 (0.3) c 1.56 (0.04) d 0.67 (0.05) c
24SCC 76.6 (1.2) e 22.3 (0.5) d 3.3 (0.3) b 1.5 (0.1) d 2.13 (0.08) bc 0.81 (0.06) ab
43SCC 87.4 (1.6) bc 11.3 (1.6) de 3.0 (1.3) b 0.6 (0.1) e 2.1 (0.06) c 0.80 (0.09) ab
62SCC 95.0 (0.2) a 10.1 (1.3) e 3.0 (0.9) b 0.4 (0.1) e 2.06 (0.03) c 0.85 (0.13) a
Cook values (min)

80
Table A/ 2. TPA results of raw and cooked meat samples at the different temperatures
and hygrometric conditions: hardness, cohesiveness, springiness, gumminess and
chewiness values are reported. Numbers in parenthesis are the standard deviation of the
mean (+/-). n=8. Means with the same letter are not significantly different (p<0.05).
Treatment Hardness (N) Cohesiveness Springiness Gumminess (N) Chewiness (N*mm)
raw meat 47.0 (20.5) f 0.40 (0.08) c 0.56 (0.12) a 17.77 (7.08) f 9.61 (3.83) f
100°C
CC 103.3 (41.5) ab 0.45 (0.04) ab 0.57 (0.04) a 46.17 (15.70) ab 26.39 (8.64) ab
24SCC 113.0 (30.7) a 0.46 (0.05) ab 0.59 (0.04) a 51.43 (14.87) a 30.34 (9.99) a
43SCC 66.0 (21.6) cde 0.49 (0.06) a 0.53 (0.03) a 32.03 (10.47) cd 16.99 (5.99) de
62SCC 48.9 11.4) ef 0.43 (0.04) bc 0.57 (0.03) a 20.54 (3.40) ef 11.72 (2.30) ef
110°C
CC 84.5 (29.1) bc 0.45 (0.03) ab 0.60 (0.05) a 38.22 (15.06) bc 22.96 (9.37) bc
24SCC 78.5 (21.5) cd 0.45 (0.08) ab 0.60 (0.05) a 36.14 (14.34) c 22.01 (9.95) bcd
43SCC 61.7 (13.5) def 0.43 (0.04) bc 0.58 (0.04) a 26.69 (7.25) de 15.45 (4.18) e
62SCC 65.3 (15.9) cde 0.43 (0.06) bc 0.61 (0.02) a 28.77 (10.60) cde 17.46 (6.27) cde

81
Table A/ 3.
Meat cooking results at the different temperatures and hygrometric conditions: external
surface and centrals section colour parameters. Differences (∆) are between cooked and
uncooked samples. Numbers in parenthesis are the standard deviation of the mean (+/-).
n=32. Means with the same letter are not significantly different (p<0.05).
∆ E ∆ L* ∆ a* ∆b*
100°C
CC 24.4 (3.3) c 17.7 (4.3) c 6.6 (1.8) a 15.0 (2.3) a
24SCC 22.0 (5.0) c 17.7 (6.7) c 4.7 (1.8) b 11.2 (2.0) b
43SCC 29.8 (2.6) b 27.7 (2.7) b 1.9 (0.6) c 10.4 (1.8) b
62SCC 33.3 (2.6) a 31.5 (2.8) a 1.3 (0.6) c 10.6 (1.4) b
110°C
CC 24.4 (2.9) c 18.3 (3.5) c 6.6 (1.6) a 14.3 (2.5) a
24SCC 32.1 (3.0) ab 30.2 (3.4) ab 1.9 (0.9) c 10.5 (1.3) b
43SCC 31.4 (3.3) ab 29.6 (3.5) ab 1.9 (0.8) c 10.1 (1.6) b
62SCC 32.8 (3.9) a 30.8 (4.0) ab 1.7 (0.9) c 11.1 (1.7) b
∆ E ∆ L* ∆ a* ∆b*
100°C
CC 36.3 (2.1) a 35.0 (2.2) a 1.6 (0.5) ab 9.3 (1.0) ab
24SCC 32.8 (2.1) de 31.9 (2.0) bc 1.9 (0.6) a 7.4 (1.1) d
43SCC 31.9 (1.8) e 30.9 (1.8) c 1.4 (0.5) b 7.7 (1.0) d
62SCC 33.5 (2.8) cd 32.0 (3.1) bc 1.4 (0.6) b 9.8 (1.6) a
110°C
CC 34.1 (2.0) bc 32.8 (2.1) b 1.6 (0.5) b 9.1 (1.2) b
24SCC 35.2 (2.3) ab 34.1 (2.4) a 1.4 (0.6) b 8.4 (1.3) c
43SCC 35.7 (3.2) a 34.5 (3.2) a 0.9 (0.6) c 9.1 (1.4) b
62SCC 35.7 (3.1) a 34.3 (3.1) a 1.4 (0.5) b 9.4 (1.4) ab
Surface
Central section
Treatment
Treatment

82
83
Section B1
EFFECT OF DIFFERENT AIR/STEAM CONVECTION COOKING METHODS ON
TURKEY BREAST MEAT. PART 1. INSTRUMENTAL QUALITY AND SENSORY
PROPERTIES.
B. Mora, E. Curti, E.Vittadini, D. Barbanti
1. Abstract
Turkey breast samples were cooked using a forced convection oven at three relative
humidity levels (RH= 8, 35 and 88%) at the same temperature (100°C). Cooking
temperatures, cook value, yield, texture, colour and sensory properties of cooked turkey
samples were evaluated.
The application of different RH levels resulted in different cooking performances and
cooked meat quality. Longitudinal shrinkage was proportional to the heating rate with
significant differences among treatments. Low steam cooking conditions (RH=35%)
significantly increased cooking yield (7% higher than the high steam cooking) and had a
positive effect on perceived tenderness, as shown by sensory analysis, where steam
cooked samples were recognized to be more tender.
Low steam cooking resulted in a higher quality cooked turkey breast meat and in a
reduced water consumption, making this process an attractive cooking method as
compared to high steam.
2. Aim of the Work
The objective of this study was therefore to evaluate the effect of different cooking
treatments on turkey meat, comparing forced convection oven cooking (dry air, RH= 8%),
low steam (RH= 35%) and high steam (RH= 88%) oven cooking at the same temperature
(100°C). In particular the effect of the two steam cooking conditions was evaluated in
relation to cooking rate, cooking yield, surface temperature, meat texture, colour and
sensory properties of the final product.
3. Materials and Methods
3.1 Sample Preparation
Samples of turkey breast were obtained as reported in the section Set up of the
experimental trials.

84
All the experiments have required a total of 36 turkey breast samples (3x3x6 cm).
3.2 Cooking treatments
Turkey breast samples were cooked at 100°C under forced air circulation with three
different cooking conditions:
� dry air RH=8% – No Steam injection; NS,
� moist air RH=35%+/-5% - Low Steam injection; LS,
� moist air RH=88%+/-5% (the saturation condition) - High Steam injection; HS.
The procedure of the cooking treatment and the water consumption determination were
already described in the section Set up of the experimental trials.
Temperature of each turkey breast sample was recorded during cooking using wire
thermocouples (type K, Ni/Al–Ni/Cr) which were placed on the surface and at the
geometric centre of each sample.
Sample cooking rate was calculated (both for surface and centre positions) as the ratio
between temperature gradient and time variation (°C/min).
The degree of cooking in the centre and on the surface of each sample was expressed in
terms of cook value, considering only the heating phase (Poon, Durance, & Kitts, 2001).
The cook value was calculated by integrating the heat penetration curve in the centre and
on the surface of meat samples, as previously reported (Holdsworth, 1985; Vittadini,
Rinaldi, Chiavaro, Barbanti, & Massini,, 2005).
3.3 Physical Analyses
- Cooking yield determination as reported by Vittadini et al. (2005).
- Objective texture measurement with the shear force test. Fresh and cooked meat
samples (n = 8) were cut perpendicularly to muscle fibres with a test speed of 2 mm/s.
Shear (maximum) force and the work after the maximum force were obtained. The shear
force (N) was then normalized to the shear surface (N/m2) and the work after the
maximum force (J) to the shear section (J/m2).
- Shrinkage characterization as the ratio (dimensionless) between raw (i) and cooked
value (f) of the length (Lf/Li), width (Wf/Wi) height (Hf/Hi) and the total volume (Vf/Vi) of
each sample.
- Colour of fresh and cooked samples was measured and colour data were processed
both using the colour scale L*a*b* and the analysis of the VIS reflection spectra.
The detailed procedures of the analysis were reported in the section Methods of analysis.
3.4 Sensory analysis
The sensory analysis are described in the section Methods of analysis.

85
3.5 Statistical analysis
In addition to the statistical analysis described in the section Methods of analysis in this
section were also applied other tests listed below.
A paired sample student t-test was used to identify differences between the surface and
centre positions for cooking rate and cook values of samples that underwent the same
cooking process. Similarly the differences between the two steam cooking processes (LS
and HS) for cooking time and cook values of samples at the same position (surface and
centre) were evaluated with an independent t- test.
4. Results and discussion
4.1 Cooking treatments
4.1.1 Water consumption
Water consumption data are shown in Table B1/ 1. In our cooking equipment the water
quantity used to produce steam in LS cooking was approximately half of that necessary in
HS cooking. Hence, the application of LS cooking implies a significant water saving
compared to the saturation condition (HS cooking), that is currently the most applied
industrial steam cooking processes.
4.1.2 Cooking rates and temperatures
Cooking times and the average cooking rates of surface and centre of all samples (NS, LS
and HS) are shown in Table B1/ 1.
The injection of steam (LS and HS) significantly reduced the cooking time as compared to
NS, as expected (Gardes, Burg, & Fraile, 1995; Murphy, Johnson, Duncan, Clausen,
Davis & March, 2001, Vittadini et al. 2005). Low and high steam cooking (LS and HS) had
cooking times 6 and 12-fold lower than no steam cooking respectively: HS resulted in the
fastest cooking with a 50% time reduction as compared to HS (10 minutes v.s. 20
minutes).
Heat flux increased as the RH increased as previously reported (Murphy et al., 2001). The
increase in the heat flux in steam cooking was due to the higher convective heat transfer
coefficient of moist air (h = 104-105 W/m2K) as compared to dry air (h =102 W/m2K) (Datta,
2002) and to the condensation of steam on the meat surface in the steam cooking
treatments (steam latent heat of condensation ~ 2260kJ/kg) (Roos, 1992).
It is important to highlight that the low steam injection (LS) drastically increased the
sample heating rate as compared to NS. Both surface and centre average cooking rates
were 5-fold faster with increasing RH of the oven air from 8% (NS) to 35% (LS). The rise

86
in RH from 8 to 88% increased the average cooking rate 12- fold in the centre and 16-fold
on the sample surface.
Surface temperature progressively rose in NS samples during the entire cooking time
causing surface dehydration, while in LS and HS the surface remained always wet and
the temperature asymptotically tended to a constant value equal to the wet bulb
temperature, that is a function of the air thermo-hygrometric conditions (Bengtsson,
Jakobsson, & Dagerskog, 1976, Fellows, 2000).
The different cooking conditions induced different meat heating rates and consequently
different final surface temperatures. The surface temperature reached a significantly
higher temperature in HS samples (97.7 ± 2.3 °C) as compared to LS (75.7 ± 0.3 °C) and
NS samples (79.1 ± 0.2 °C).
4.1.3 Cook value
Cook values of the surface and the centre were calculated for all samples and are
reported in Table B1/ 1.
In all treatments surface cook value was higher than the centre value, as expected.
Cook values (surface and centre ) of NS samples were about 4-fold higher than steam
cooked samples (LS and HS). In particular the cooking value of the surface of NS was
higher than the limit of thermal damage of 13 minutes at 100°C, defined as the time
necessary to reduce thiamine content by 3% (Pompei, 2009), suggesting a higher
reduction of the nutritional quality of NS sample as compared to the steam cooked
samples LS and HS.
Surface cook values were not significantly different between LS and HS, while centre cook
value of HS samples was significantly lower than LS. A lower cook value difference
between the surface and the centre might be associated to a more uniform heating: the
difference between surface and centre cook values was smaller in LS cooking, followed
by HS and NS respectively.
4.2 Physical analyses
4.2.1 Cooking yield
Cooking yield of all samples are shown in Table B1/ 1. Meat samples cooked with low
steam (LS) showed the highest cooking yield, 7% higher than HS. The NS samples,
instead, showed the lowest cooking yield as compared to the other samples. These
samples (NS) were characterized by a higher surface dehydration that was induced both
by the higher vapour pressure gradient between the product and the air and by the longer
cooking time. Meat surface dehydration led to the development of an uniform crust and to
non-enzymatic browning in NS samples.
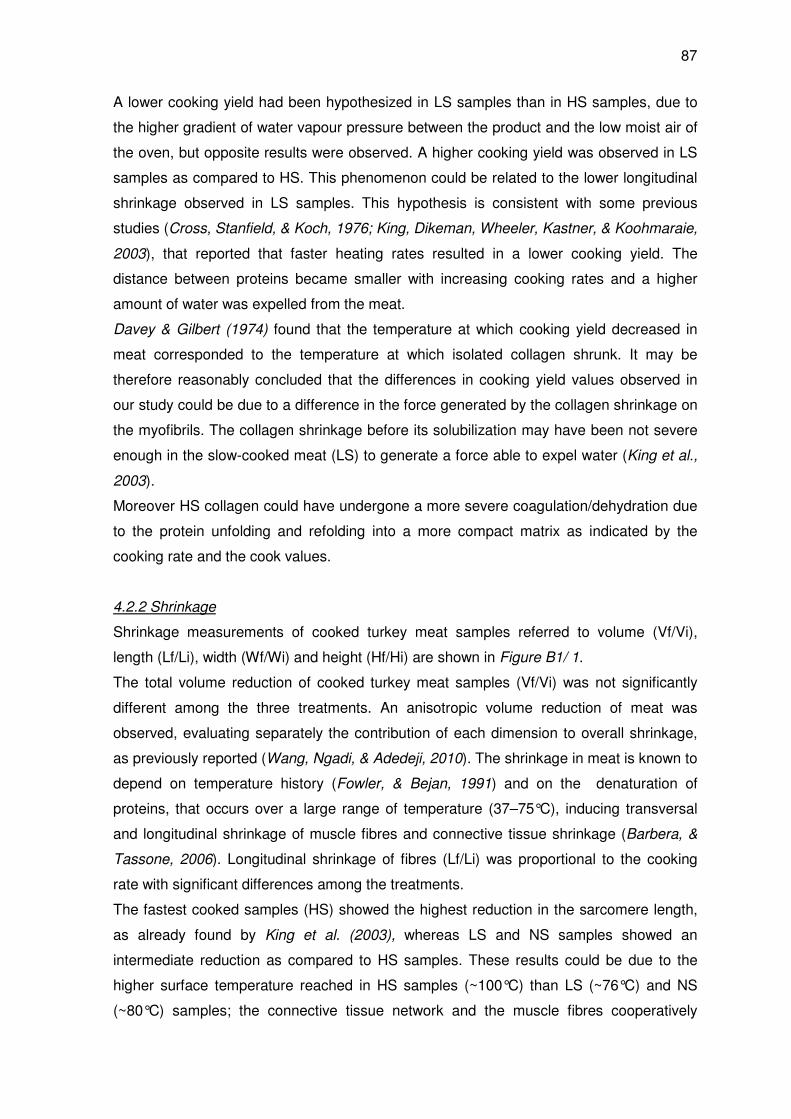
87
A lower cooking yield had been hypothesized in LS samples than in HS samples, due to
the higher gradient of water vapour pressure between the product and the low moist air of
the oven, but opposite results were observed. A higher cooking yield was observed in LS
samples as compared to HS. This phenomenon could be related to the lower longitudinal
shrinkage observed in LS samples. This hypothesis is consistent with some previous
studies (Cross, Stanfield, & Koch, 1976; King, Dikeman, Wheeler, Kastner, & Koohmaraie,
2003), that reported that faster heating rates resulted in a lower cooking yield. The
distance between proteins became smaller with increasing cooking rates and a higher
amount of water was expelled from the meat.
Davey & Gilbert (1974) found that the temperature at which cooking yield decreased in
meat corresponded to the temperature at which isolated collagen shrunk. It may be
therefore reasonably concluded that the differences in cooking yield values observed in
our study could be due to a difference in the force generated by the collagen shrinkage on
the myofibrils. The collagen shrinkage before its solubilization may have been not severe
enough in the slow-cooked meat (LS) to generate a force able to expel water (King et al.,
2003).
Moreover HS collagen could have undergone a more severe coagulation/dehydration due
to the protein unfolding and refolding into a more compact matrix as indicated by the
cooking rate and the cook values.
4.2.2 Shrinkage
Shrinkage measurements of cooked turkey meat samples referred to volume (Vf/Vi),
length (Lf/Li), width (Wf/Wi) and height (Hf/Hi) are shown in Figure B1/ 1.
The total volume reduction of cooked turkey meat samples (Vf/Vi) was not significantly
different among the three treatments. An anisotropic volume reduction of meat was
observed, evaluating separately the contribution of each dimension to overall shrinkage,
as previously reported (Wang, Ngadi, & Adedeji, 2010). The shrinkage in meat is known to
depend on temperature history (Fowler, & Bejan, 1991) and on the denaturation of
proteins, that occurs over a large range of temperature (37–75°C), inducing transversal
and longitudinal shrinkage of muscle fibres and connective tissue shrinkage (Barbera, &
Tassone, 2006). Longitudinal shrinkage of fibres (Lf/Li) was proportional to the cooking
rate with significant differences among the treatments.
The fastest cooked samples (HS) showed the highest reduction in the sarcomere length,
as already found by King et al. (2003), whereas LS and NS samples showed an
intermediate reduction as compared to HS samples. These results could be due to the
higher surface temperature reached in HS samples (~100°C) than LS (~76°C) and NS
(~80°C) samples; the connective tissue network and the muscle fibres cooperatively

88
shrank longitudinally at 60–70°C and the extent of shrinkage increased with temperature.
The larger the shrinkage, the greater the water loss during cooking. It is therefore
hypothesized that water may be expelled by the pressure exerted by the shrinking
connective tissue on the aqueous solution in the extracellular void (Tornberg, 2005).
Transverse shrinkage to the fibre axis was represented by Wf/Wi and Hf/Hi. A significantly
higher height reduction (lower Hf/Hi) was observed in NS (slowest cooking process) than
in steam cooked samples (LS, HS). These results could be due to the longer time that NS
samples were subjected to 40–60°C temperature range as compared to the steam cooked
samples. The transverse shrinkage of the fibre axis mainly occurs in this temperature
range, widening the gap already existing between the fibres and their surrounding
endomysium at rigor (Tornberg, 2005). However a different behaviour was observed in the
transverse shrinkage of the width dimension: no difference were found among NS, LS and
HS meat samples. Moreover the shrinkage of the width dimension was reduced: although
the mean Wf/Wi values for each treatment were lower than 1, Wf/Wi data often resulted
higher than 1 for cooked samples, showing the same tendency reported in other works,
where meat could shrink in two dimensions and expands in the third dimension (Offer,
Restall, & Trinck, 1984; Rowe, 1974). The difference in the transverse shrinkage relative
to width and height dimensions is possibly due to the action of the force of gravity, that
may have enhanced the shrinkage of the height dimension at the expense of the width
dimension.
4.2.3 Texture
Shear force tests results are reported in Figure B1/ 2. Shear force is indicative of the
sample surface consistency while the area under the texturogram after the maximum
force (work) is indicative of texture properties of the meat inner portion of the sample.
The NS samples were found to require a significantly higher shear force and work after
the maximum force than the steam cooked samples (LS and HS). It was due to the
surface crust formation and the higher centre dehydration that the samples underwent
during cooking.
No significant differences were found between LS and HS texture parameters. This result
is in contrast with other studies where slower cooking rates were reported to improve
tenderness (Bayne, Meyer, & Cole, 1969; Cross et al., 1976; Lawrence, King, Obuz,
Yancey, & Dikeman, 2001), but it must be taken into consideration that no steam was
used during the cooking process in these studies. Higher heating rates determine protein
unfolding immediately followed by the simultaneous aggregation of collagen and
actomyosin, resulting in meat with leathery consistency, as previously reported by
differential scanning calorimetry studies (Riva & Schiraldi, 1994). The tenderizing effect of

89
slow cooking is also commonly attributed to the solubilization of collagen (Bayne et al.,
1969; Penfield & Meyer, 1975), that mainly takes place in the 60-80°C temperature range
(Møller, 1981). In slow cooking treatments (NS and LS) the time at which meat was
subjected to this temperature range was longer. Moreover connective tissue content is
related to the differences observed in tenderness, as previous works on beef meat
reported; texture of muscles with a low collagen content was not influenced by different
cooking rates (King et al., 2003) and a similar behaviour could be hypothesized for turkey
meat.
4.2.4 Colour
The major colour change due to cooking is the discoloration of meat, from red/pink to
greyish/brown colour due to complex reactions such as denaturation of myoglobin,
Maillard browning and formation of denatured globin nicotinamide hemichromes.
(Swatland, 1989).
A strongly visible surface colour difference was observed between NS and steam cooked
samples (LS-HS) due to the non-enzymatic browning (Maillard reaction) that occurred on
the surface of NS samples. These were characterized by higher a* and b* values (red and
yellow, respectively) and lower L* values (brightness) due to the minor surface water
content (data not shown).
In the centre NS samples differed from other samples only for lower b* and C* values.
LS and HS samples were not significantly different between each other for all colour
parameters (L*, a*, b*, C* and h*). The only significant differences were found between
the surface and the centre of cooked meat in all treatments (data not shown).
The changes in the appearance of meat due to the heating processes were thoroughly
studied by visible spectroscopy analysis. The spectral features in the visible region
allowed us to observe colour changes during the cooking of meat due to the myoglobin
protein degradation by oxygenation, oxidation and reduction reactions, thus influencing
the appearance of meat colour. Representative VIS spectra of the surface and the centre
of raw and cooked samples are shown in Figure B1/ 3. Three well-defined chromophores
at 420, 550 and 580nm were identified in all samples. The first one was previously
associated to deoxymyoglobin (DeoxyMb) (purplish-red), while the others to oxymyoglobin
(OxyMb) (cherry-red); moreover the band at 485nm was attributed to the metmyoglobin
(MetMb) (brownish-red) reflectance (Liu & Chen, 2001). Only in cooked samples a fourth
chromophore at 650nm was observed corresponding to sulfmyoglobin (green) (Liu &
Chen, 2001).

90
The surface of NS samples was characterized by a lower decrease of DeoxyMb, MetMb
and OxyMb peaks intensity; it was also hypothesized that this result might not be due to
these species but to the presence of non-enzymatic browning reaction products.
The samples cooked with a low steam presence (LS) showed a lower decrease of
DeoxyMb and OxyMb peak intensity with a higher difference from the other samples
especially in the centres in correspondence to DeoxyMb wavelength. A lower loss of
reddishness was observed in LS samples, that were characterized by a more pink colour.
The normally expected colour for cooked poultry breast meat is grayish brown; therefore,
the pink colour observed in LS samples might be considered a defect because consumers
could think that meat is undercooked or contaminated (Nam & Ahn, 2002).
The pinker colour observed in LS samples was not expected, due to their higher internal
cook value as compared to HS samples, in contrast with the results of Ryan Seyfert, Hunt,
& Mancini (2006) on beef meat. The pinker colour of LS samples could be due to the
incomplete denaturation of myoglobin or oxymyoglobin and/or to the reactivity of
endogenous meat compounds with the production of denaturated globin hemochromes
characterized by many authors as pinking pigments of well cooked meats (Holownia,
Chinnan, & Reynolds, 2003).
4.3 Sensory analysis
A ranking test was carried out to assess the overall liking for aspect and flavour (taste and
oral texture) of the NS, LS and HS samples. The rank sums were 17 for NS, 22 for LS and
21 for HS for aspect and 21 for NS, 18 for LS and 21 for HS for flavour. All these values
fell within the 15-25 range (Jellineck, 1985) and therefore, samples were equally liked by
the panel (p < 0.05). The differences between LS and HS were further investigated with a
triangle test. The sample NS was not considered because of its roasted appearance. The
samples LS and HS were compared for aspect and tenderness (by handling) and the
different sample was recognized by 6 out of 9 subjects, indicating a significant difference
(p < 0.05) between the two steam cooked samples (Jellineck, 1985).
A second ranking test was performed with 20 subjects to assess the overall liking for
aspect and flavour of LS and HS samples. The rank sums were 29 and 31 for LS and HS
respectively for both the aspect and the flavour. The values fell within the 26-34 range
(Jellineck, 1985) and therefore, samples were equally liked by the panel (p < 0.05). The
samples cooked with low steam (LS ) were expected to be the less liked when compared
to HS for their more pink colour but the ranking test did not indicate any preferred sample
between LS and HS for aspect and flavour. Moreover the scored preferences were
equally distributed between the two samples, that were, therefore, considered equally
appreciated.

91
A paired-comparison consumer tests (two sided) using 17 subjects was carried out to
asses which sample was more tender, LS or HS. The majority of consumers (13 out of
17) identified LS samples to be more tender (p < 0.05) than HS samples (Jellineck, 1985).
It is noteworthy to mention that samples with similar shear force values were perceived
significantly different in terms of tenderness. This result could be explained by the fact that
tenderness is a very complex perception that originates from several factors and it is
strongly affected by the moisture content. Water can have a plasticizing/lubricant effect
that increases the perception of tenderness. The samples LS had the highest cooking
yield (i.e. highest moisture content) and were perceived to be the most tender.
5. Conclusions
The different heating conditions (dry air, low moist air, high moist air) at the same cooking
temperature (100°C) led to strongly different heating rate profiles and consequently to
different properties of cooked turkey breast.
The presence of steam drastically reduced cooking time, in agreement with previous
studies. Dry air cooking showed the highest cooking time compared to the other
treatments and the relative samples resulted parched, with an uniform crust formation and
a non-enzymatic browning (Maillard reaction). The heat flux and heat transfer coefficient
increased with increasing RH.
The most visible change in sample structure was observed in the longitudinal shrinkage,
that was proportional to the cooking rate with significant differences among treatments.
Low steam cooked samples were significantly different from high steam samples, showing
a higher cooking yield and a higher perceived tenderness, probably due to a lower meat
longitudinal shrinkage that led to lower water loss upon cooking.
Low steam cooking resulted in a pinker colour of samples, but the difference did not affect
the product acceptance for the aspect; these samples were appreciated equally in
comparison to the high steam cooked ones.
Low steam cooking could be considered as a valid alternative to steam saturation
cooking, especially in industrial applications, due to the appreciable quality of turkey meat
and the markedly reduced water consumption.
92
6. List of Figures
Figure B1/ 1. Shrinkage of cooked turkey meat.
Total volume (Vf/Vi), length (Lf/Li), width (Wf/Wi) and height (Hf/Hi) of NS, LS and HS
samples. Shrinkage values (n=12) are expressed as means±S.D.; means with the same
letter are not significantly different (p<0.05).
Figure B1/ 2. Texture of turkey meat.
Warner–Bratzler shear force values (A) and work after the maximum force (B), raw meat
(R) and cooked meat samples (NS, LS and HS). Values are expressed as means±S.D.
(n=8); means with the same letter are not significantly different (p<0.05).
Figure B1/ 3. Turkey meat colour: VIS spectra.
Representative VIS spectra (400<λ<700nm) (n=32) of the external (A) and the central
parts (B) of raw (R) and cooked samples (NS, LS and HS).

93
Figure B1/ 1. Shrinkage of cooked turkey meat.
Total volume (Vf/Vi), length (Lf/Li), width (Wf/Wi) and height (Hf/Hi) of NS, LS and HS
samples. Shrinkage values (n=12) are expressed as means±S.D.; means with the same
letter are not significantly different (p<0.05).
0,5
0,6
0,7
0,8
0,9
1,0
1,1
Vf/Vi Lf/Li Wf/Wi Hf/Hi
NS
LS
HS
a a a
ab
c
a a a
b
a a

94
Figure B1/ 2. Texture of turkey meat.
Warner–Bratzler shear force values (A) and work after the maximum force (B), raw meat
(R) and cooked meat samples (NS, LS and HS). Values are expressed as means±S.D.
(n=8); means with the same letter are not significantly different (p<0.05).
0200000400000600000800000
10000001200000140000016000001800000
R NS LS HS
Sh
ea
r fo
rce
(N
/m2)
a
b
b b
0
500
1000
1500
2000
2500
3000
3500
R NS LS HS
Wo
rk a
fter
max f
orc
e (
J/m
2)
a
b
b b
B
A

95
Figure B1/ 3. Turkey meat colour: VIS spectra.
Representative VIS spectra (400<λ<700nm) (n=32) of the external (A) and the central
parts (B) of raw (R) and cooked samples (NS, LS and HS).
0,5
0,6
0,7
0,8
0,9
1
1,1
400 450 500 550 600 650 700l (nm)
1/L
og
(R)
raw
NS int
LS int
HS int
R
0,5
0,6
0,7
0,8
0,9
1
1,1
400 450 500 550 600 650 700l (nm)
1/L
og
(R)
raw
NS int
LS int
HS int
R
0,5
0,6
0,7
0,8
0,9
1
1,1
400 450 500 550 600 650 700
l (nm)
1/L
og
(R)
raw
NS ext
LS ext
HS ext
0,5
0,6
0,7
0,8
0,9
1
1,1
400 450 500 550 600 650 700
l (nm)
1/L
og
(R)
raw
NS ext
LS ext
HS ext
B
A

96
7. List of Tables
Table B1/ 1. Turkey meat cooking performance parameters of NS, LS and HS: water
consumption for the steam generation (g), cooking time (min), cooking rate (°C/min) and
cook values (equivalent min at 100°C, z=33) of surface and centre positions and cooking
yield (%).

97
Table B1/ 1. Turkey meat cooking performance parameters of NS, LS and HS: water
consumption for the steam generation (g), cooking time (min), cooking rate (°C/min) and
cook values (equivalent min at 100°C, z=33) of surface and centre positions and cooking
yield (%).
Treatment NS LS HS
Water consumption (g) absent 423,5 (54,4)A bB 715,7 (112,5) a
Cooking time (min) 119,3 (18,1) a 24,0 (2,5) b * 10,4 (0.9) b
Surface 0,5 (0,1) c 2,4 (0,2) b 7,8 (0,7) a #
Center 0,5 (0,1) c 2,5 (0,2) b 5,9 (0,6) a
Surface 13,9 (2,2) a # 2,8 (0,2) b # 3,5 (0,7) b #
Center 9,5 (2,3) a 1,7 (0,1) b * 0,4 (0,1) b
Cooking yield (%) 67,8 (3,0) c 84,1 (1,3) a 77,2 (3,1) b
* Significant difference with independent student t-test (p < 0.05) between LS and HS samples in the same position
# Significant difference with paired samples student t-test (p < 0.05) between surface and centre of samples of the same cooking process
Cooking rate (°C/min)
Cook values (min)
A Numbers in parenthesis are the standard deviation (+/-) of the mean, n=3 for all parameters reported,
except cooking yield where n=12
B Means with the same letter are not significantly different with ANOVA, Tukey-high significant
difference test (p<0.05)

98
99
Section B2
EFFECT OF DIFFERENT AIR/STEAM CONVECTION COOKING METHODS ON
TURKEY BREAST MEAT. PART 2. WATER STATUS
E. Curti, B. Mora, D. Barbanti, E.Vittadini
1. Abstract
Cooking turkey meat at 100°C by forced convection with low steam air (relative humidity,
RH=35%) resulted in interesting quality attributes as compared to forced convection oven
with dry (RH=8%) and high steam (RH=88%) air. Quality attributes of cooked meat are
related to water status; consequently, moisture content, water holding capacity (WHC)
and NMR water mobility were investigated in low steam, high steam and dry air cooked
samples.
Low steam cooked samples showed a higher moisture content and higher WHC. Low and
high steam cooked samples showed an overall higher water mobility (slower 1H FID
decays, 1H T2 distributed data extended to higher relaxation times and higher 1H T1
relaxation times) as compared to the dry air samples. In particular, 1H T2 distribution data
in low steam samples (reduced presence of protons relaxing at times longer than 1 s)
were related to the higher perceived tenderness.
2. Aim of the work
In the preceding section (Section B1) the effect of different heating/cooking conditions (dry
air, low steam, high steam) at the same cooking temperature (100°C) on turkey meat has
been evaluated: low steam cooking (low cooking rate) resulted in samples with a higher
cooking yield and a higher perceived tenderness as compared to high steam cooking. The
different properties of low steam cooked meat were associated to a lower water loss upon
low steam cooking related to a different protein denaturation and to the lower longitudinal
shrinkage of these samples.
The present work was undertaken to study how water and proton mobility of turkey meat
samples were affected by forced convection oven cooking (dry air, RH= 8%), low steam
oven cooking (RH= 35%) and high steam oven cooking (RH= 88%), close to the
saturation condition at the same temperature (100°C).
The presence of steam is expected to strongly affect water status and its interactions with
protein in cooked meat. The external and internal positions of samples were investigated

100
to understand how water distributes across the sample. Turkey samples were analyzed in
the NMR spectrometer after the cooking process, to consider the water loss and the
changes the samples underwent in the oven environment that would not be taken into
account in in-tube NMR cooking. Moreover, 1H NMR was carried out on the samples after
they were subjected to centrifugation to better investigate water interactions in the cooked
meat matrix.
3. Materials and Methods
3.1 Muscle preparation and cooking treatments
Details about samples preparation and cooking treatments were thoroughly described in
the section Set up of the experimental trials. Briefly, samples were cooked at 100°C,
under forced air circulation, according to the following cooking conditions:
� dry air RH=8% – No Steam injection; NS,
� moist air RH=35% - Low Steam injection; LS,
� moist air RH=88% (the saturation condition) - High Steam injection; HS.
The central section (2x3x3 cm) of the sample was identified. From this, two samples
(0.8x0.8x2 cm) were extracted (with the major dimension parallel to muscle fibres) from
either the external part (EXT) and the internal part (INT) of the sample and separately
analyzed.
3.2 Analysis of the water properties of cooked meat products
The analysis performed on turkey meat to characterized the water status were: moisture
content, water holding capacity through the centrifugation method and low resolution
nuclear magnetic resonance (1H NMR). The procedures of the analysis were described in
the section Methods of analysis.
3.3 Statistical analysis
In addition to the One-way-analysis of variance (ANOVA), reported in Methods of
analysis, in this section data were also analyzed with a Student t-test (p < 0.05) to identify
differences between EXT and INT of each cooked sample.
4. Results and Discussion
4.1 Moisture content
Moisture content of all turkey samples are shown in Figure B2/ 1. Raw turkey meat had a
moisture content of ~ 74% (g H2O / 100 g sample). Cooking significantly decreased

101
moisture content of samples, as expected, from ~ 74% to ~ 68% (g H2O / 100 g sample).
Moisture content of cooked samples was found to be dependent on the cooking process
(Figure B2/ 1). The cooking length was reduced in steam cooking processes as previously
reported (Section B1), resulting in a higher moisture content of the steam cooked samples
LS and HS (both EXT and INT). The significantly lower moisture content observed in NS
(both EXT and INT) was linked to longer cooking time needed for turkey samples to reach
the selected temperature (74°C at their thermal centre) as previously reported in Section
B1.
The different cooking conditions affected water distribution across the sample: moisture
contents of EXT and INT in NS and LS samples were found to be significantly different
between each other (Figure B2/ 1).
Low steam cooking (LS) resulted in a higher water retention (higher moisture content)
than HS, both EXT and INT. This result was not expected as the water pressure gradient
between meat surface and oven air was higher in LS cooking, probably indicating that
water evaporation from turkey meat is not the sole effect contributing to water loss during
cooking. Previous studies reported that the cooking profiles and longitudinal shrinkage of
muscle fibres could affect water loss (Bouton, Harris, & Shorthose, 1975). In Section B1 a
lower longitudinal shrinkage was observed in low steam cooked samples (LS),
characterized by a lower heating rate, that resulted in a lower release of water from the
myofibrils, in agreement with some previous studies (Cross, Stanfield, & Koch, 1976;
King, Dikeman, Wheeler, Kastner, & Koohmaraie, 2003). Moreover, the similar moisture
distribution in HS (comparable moisture content between EXT and INT) could be probably
associated to the higher longitudinal shrinkage of HS samples (Section B1).
4.2 Water holding capacity (WHC)
WHC of turkey meat was measured for RAW and cooked samples and it is shown in
Figure B2/ 2. WHC was ~ 76% (g of lost water / 100 g water in raw samples) in RAW and
it was almost halved in cooked samples due to the structural changes that decrease both
the moisture content and the water-holding capacity of meat (Offer, 1984; Tornberg,
2005).
WHC of EXT was not affected by the different cooking condition as WHC were
comparable in all EXT samples while WHC of INT was significantly higher in LS.
In this work WHC was measured as the quantity of extra-myofibrillar water that can be
expelled from the meat matrix by means of centrifugation and the results were in
agreement with a previous study on pork meat where the presence of steam significantly
affected WHC (Chiavaro, Rinaldi, Vittadini, & Barbanti, 2009).

102
WHC results have been also related to the instrumental quality attributes of the samples
(cooking heating rate, cook value, yield, shrinkage, shear force value, perceived
tenderness) that were discussed in Section B1.
In our study the higher WHC observed in INT of LS, as compared to HS, could be
attributed to the lower longitudinal shrinkage of LS in agreement with Offer (1984) and
Tornberg (2005). Moreover, WHC is strongly dependent on how proteins are denaturated
during cooking (Bertram, Wu, Straadt Aagard, & Aasling, 2006), and hence, it has been
hypothesised that protein denaturation was affected by the different heating rates in LS
and HS cooking processes (average cooking rate of ~2.5°C/min and ~ 7°C/min
respectively). WHC results have been related to the instrumental quality attributes of the
samples, that were discussed in Section B1.
However NS samples, that were characterized by a higher cooking loss as compared to
HS, as discussed in the preceding paper, showed WHC values comparable to HS. WHC
values in NS samples may be attributed to a higher denaturation of sarcoplasmic proteins,
due to their higher cook value and the lower cooking yield, that was previously associated
to a decrease in WHC (Monin, & Laborde, 1985). The lower values of WHC observed in
HS samples, as compared to LS samples, could be due to the higher longitudinal
shrinkage of HS samples that promoted the loss of water retained in the spaces between
the thick and thin filaments (Offer et al., 1989). WHC is also related to the eating quality
(texture/tenderness and juiciness) of meat: LS samples, showing higher values of WHC,
were, in fact, recognized significantly tenderer than HS by a semi-trained panel even
though they had the same shear force value. WHC of INT and EXT did not result
significantly different between each other only in LS samples, in agreement to the more
uniform heating and smaller cooking value difference between the surface and the centre
observed in this cooking method evidenced in Section B1 results.
4.3 1H NMR mobility
Molecular characterization was carried out with multiple 1H NMR experiments to cover a
large range of molecular relaxation events. 1H mobility was studied at 20 MHz, for the
fastest-relaxing component with a FID experiment while the slower relaxing proton
fractions were characterized in terms of 1H T2 and 1H T1 relaxation times distributions. 1H FID decays of RAW and cooked samples (NS, LS and HS) of EXT and INT are shown
in Figure B2/ 3A and Figure B2/ 3B respectively. The first, fast relaxing portion of the FID
decay (0.0073 < t < 0.1000 ms) is indicative of the presence of a very rigid 1H population. 1H FID decay of RAW was slower than all cooked samples, both EXT and INT, as
expected, indicating a higher molecular mobility due to a significantly higher water content
(Sereno, Hill, Mitchell, Scharf, & Farhat, 2007). The water loss due to cooking significantly

103
affected 1H FID decays. 1H FID were sharper in all cooked samples, more relevantly in
EXT, that underwent more drastic changes during cooking as compared to the INT
positions. 1H FID decays in NS, both EXT and INT, were sharper than LS and HS, as
expected, due to the lower moisture content related to the major increase of cooking time
in absence of steam. 1H FID decays (t < 0.1 ms) were then fitted (Kim, & Cormillon, 2001; Choi, & Kerr, 2003,
Farhat, Blanshard, & Mitchell, 2000) to characterize FID decay slopes and verify a
correlation with the samples moisture content. All FIDs exhibited a monoexponential
decay [y= a + b * exp (-x * c-1); R2 > 0.96]. The mean coefficient (b), descriptive of the
decay slopes, was plotted (Figure B2/ 3C) as a function of moisture content (g water / 100
g sample) and showed a good correlation (R2 > 0.9) with the moisture content by a
quadratic polynomial regression (y = -0.0005 * x2 + 0.0610 * x + 1.5681), suggesting that 1H FID decays well reflected the differences in the moisture content of the samples and
were directly related to them.
The 1H T2 distributions, obtained using an UPEN software, were analyzed for T2 > 2 *
interpulse spacing (+ instrument dead time) to avoid extrapolation of T2 values at times
shorter than the first point measured with the CPMG experiment. 1H T2 quasi-continuous
distributions of RAW and cooked samples, EXT and INT, are shown in Figure B2/ 4A.
Three 1H T2 populations were found in RAW and were named starting from the shorter to
the longer relaxation time A, B and C, respectively. 1H populations abundance and peak
relaxation times are shown in Figure B2/ 4C. 1H population abundances and relaxation
times are showed only for the external position (EXT) of the samples since no significant
differences were found between EXT and INT samples for all the cooking processes. 1H T2 populations of RAW relaxed in the ~ 0.3 - 20 ms range (peak centred at T2A ∼0.8
ms; ∼3% of the total detectable protons), in the 20-80 ms range (peak centred at T2B ∼44
ms; ~90% of the total detectable protons) and at times longer than 80 ms (peak centred at
T2C ∼100 ms; ~7% of the total detectable protons). Similar results were previously reported
in pork (Bertram et al., 2001) and chicken meat (Sharifudin, Nott, & Hall, 2006). 1H
population A was tentatively assigned to protons associated to the water-macromolecules
domain, population B to protons associated to the water - myofibrillar proteins domain and
population C to the protons associated to water - sarcoplasmatic proteins domain based
on the findings of low resolution 1H NMR studies carried out on pork and chicken meat
(Bertram, Karlsson et al., 2001; Venturi, Rocculi, Cavani, Placucci, Dalla Rosa, &
Cremonini, 2007).
The 1H T2 distributions of RAW significantly changed upon cooking: 1H T2 distributions of
cooked samples (NS, LS and HS) showed the presence of only two resolved protons

104
populations. The major population (B) observed in RAW was centred at ∼44 ms (~90% of
the total detectable protons) and moved towards shorter relaxation times (∼20 ms; ~97%
of the total detectable protons); the faster relaxing population (A, centred at ∼0.8 ms; ~3%
of the total detectable protons) remained unchanged; the slower relaxing population (C,
centred at ∼100 ms ) likely merged with population B for all cooked samples. 1H T2
distributions of LS and HS samples showed a tail at longer relaxation times up to ~ 1.2 s
and ~ 2.5 s for LS and HS respectively (Figure B2/ 4B), that was not observable in NS.
Our results on cooked meat are in agreement with some previous works on pork meat
(Micklander Peshlov, Purslow, & Engelsen, 2002, Bertram, Wu, van den Berg et al., 2006)
that studied transversal relaxation times T2 of cooked meat and the changes occurring
during cooking to water and protein domains. However, Micklander et al. (2002), Bertram
et al. (2005) and Bertram, Wu, van den Berg et al. (2006) found a resolved fourth protons
population with relaxation times above 1 s that was associated to free/bulk water,
expelled by the meat matrix at temperatures higher than 40°C during cooking. This 1H
population was not detected in our 1H T2 distributions due to the fact that the cooking
process was carried out in a real oven and not in the NMR tube and, hence, meat
samples were also subjected water loss.
Slower relaxing protons (t >1 s) were not observed in the 1H T2 distributions of NS. This
result may suggest that those water molecules were lost during the NS cooking process
and may be related to the significant lower moisture content found in NS samples. The
steam cooking processes imply different heat and mass transfers, resulting in a different
denaturation process that is known to involve water re-distribution among domains
characterized by different mobilities and molecular changes in the structure of meat. The
different denaturation may result in an altered water distribution and mobility that is
reflected in the 1H T2 distributions: in particular the tail observed in HS, that included
protons relaxing at much longer relaxation times as compared to LS, may suggest that in
HS some water molecules retained a higher mobility upon cooking. In fact, HS also
showed lower WHC values (Figure B2/ 2), as compared to LS, indicating that water
molecules in this sample were less tightly associated to the meat matrix. 1H NMR T2 relaxation profiles have been previously related to the sensory properties of
pork meat, in particular to juiciness (Bertram et al., 2005). T2 protons relaxing at times
longer than 1 s, associated to the expelled water molecules, were negatively correlated to
juiciness (Bertram et al., 2005). In agreement with this study, HS samples, where T2
protons relaxing at times longer than 1 s were detected, were also perceived as the less
tender in sensory analysis as compared to LS (Section B).

105
1H T1 quasi-continuous distributions of RAW and cooked samples, EXT and INT, were
unimodal and representative of one observable proton population (distributions not
shown). The peak relaxation times, representative of the 1H T1 distributions for all
samples, are shown in Table 1. 1H T1 relaxations times of RAW were significantly higher (~ 520 ms) than in cooked
samples (~ 280-330 ms), as expected, and confirmed previous results on chicken meat
(Rongrong, & Li, 2000). 1H T1 relaxation times in LS were significantly higher (~ 328 ms) than HS (~300 ms) and
NS (~280 ms) respectively, in the EXT position while no significant differences were found
among the INT samples.
The statistical differences observed in the EXT 1H T1 values were reflected in the relative
moisture content values (Figure B2/ 1), indicating that 1H T1 might be related to moisture
content. 1H NMR T1 experiments were previously carried out on chicken meat and 1H T1
was
associated to an “index” of muscle structure (Rongrong et al., 2000). It was reported that 1H T1 values are affected by cooking, due to water loss and muscle shrinkage, and also by
the application of an external compressive load that further reduced the cellular and
extracellular spaces. It has been therefore hypothesized that the differences observed in
EXT among NS, LS and HS indicated a different muscle structure in the samples, that
could be related to the different cooking profiles and to the different shrinkage as
previously reported in Section B.
4.4 1H NMR mobility post-centrifugation
1H NMR post-centrifugation was carried out to investigate the effect of centrifugation drip
loss on cooked meat proton mobility and also a possible effect of the cooking process on
retainment of water. 1H FID decays of RAW and INT cooked samples after the centrifugation are shown in
Figure B2/ 5. 1H FID decays of samples were significantly sharper than the “not
centrifuged” samples, as expected, as a consequence of the extraction of the “most
mobile” water from the meat matrix. 1H FID decay of HSWHC was slightly less sharper than NSWHC and LSWHC. This result is not
in agreement with the relative WHC values previously discussed. 1H FID decay slope of
HSWHC was expected to be more similar to NSWHC (comparable WHC values) while 1H FID
decay of LSWHC should have been slower (higher WHC). Hence other factors could have
contributed to the different decays, such as a different protein denaturation. Riva &
Schiraldi (1994) reported that the sequence and the extent of meat protein denaturation in
106
the cooking process is affected by the meat heating profile: in particular water release
during denaturation is strictly related to the heating rate of the cooking process. 1H T2 quasi-continuous distributions of relaxation times, compared to the samples before
the centrifugation (no-WHC), are shown in Figure 6A. Three 1H T2 populations were found
in RAWWHC, as previously observed in RAW, and were therefore named starting from the
shorter to the longer relaxation time A, B and C, respectively. 1H populations abundance
and peak relaxation times of samples after centrifugation are shown in Figure B2/ 6B and
6C respectively. 1H T2 distributions of RAWWHC showed the same lineshape of RAW but
population A (faster relaxing protons) abundance was significantly higher and population
C (slower relaxing protons) was significantly lower than in RAW (Figure B2/ 4C). 1H T2
relaxation times T2B and T2C were significantly reduced upon centrifugation from ~44 to
~40 ms and from ~105 to ~ 70 ms respectively.
The 1H T2 distributions characterized by the presence of three resolved 1H populations of
RAW was preserved also after the centrifugation (RAWWHC), whereas 1H T2 distributions of
NSWHC, LSWHC and HSWHC were strongly different from the cooked samples before
centrifugation. The 1H T2 slower relaxing protons observed at longer relaxation times (up
to ~ 2.5 s) in LS and HS were not observable in LSWHC and HSWHC. Previous studies
discussed the correlation between the more mobile T2 protons and the water molecules
that are lost in WHC measurements (Tornberg, Andersson, Goransson, & von Seth.,
1993, Bertram, Andersen et al., 2001). These protons, associated to extra-myofibrillar
water and to sarcoplasmatic proteins (Bertram, Karlsson, et al., 2001) were not
observable in the 1H T2 distributions of RAWWHC (population C) and cooked samples as
they were removed upon centrifugation.
The 1H T2 distributions of samples before and after centrifugation also had different T2B
relaxation time: T2B significantly decreased and the region of the distribution characterized
by relaxation times longer than ~ 30 ms was not observable, possibly because water
molecules associated to the myofibrillar proteins may have been partially removed and/or
became less mobile. 1H T2 distributions of NSWHC, LSWHC and HSWHC had the same
lineshape and the relative times 1H T2B were comparable and not dependent on the extent
of meat protein denaturation (different cooking process), possibly due to a mechanic effect
of the centrifugation that may have altered the samples structure.
Moreover the faster relaxing population (A), attributed to protons associated to the water-
macromolecules domain, was not observed possibly because these protons relaxed at
faster relaxation times and were, therefore, not detectable in the NMR experimental
window considered. 1H T1 quasi-continuous distributions of RAW and cooked samples after the WHC
measurements were unimodal and representative of one observable proton population

107
(distributions not shown). The peak relaxation times, representative of the 1H T1
distributions, were ~ 470 ms for RAWWHC and ~ 200 ms for NSWHC, LSWHC and HSWHC
(comparable among each other). 1H T1 relaxations times of RAWWHC were significantly higher than in NSWHC, LSWHC and
HSWHC, as expected. The relaxation times of all samples after the centrifugation were
significantly lower than the corresponding values before the centrifugation, due to the loss
of water molecules that were weakly interacting with the protein matrix. 1H T1 values of
NSWHC, LSWHC and HSWHC were comparable, possibly because the samples structure was
strongly altered by centrifugation (mechanic - altering effect) and/or due to the fact that the
samples retained water molecules, tightly associated to protein, that are not detected in
the 1H T1 experimental time frame.
5. Conclusions
The present study investigated the effect of dry air, low steam and high steam oven
cooking (at 100°C) on water status and distribution in turkey meat samples. Different RH
in cooking affected water status in turkey meat. Steam cooked samples were
characterized by a higher moisture content and a higher water mobility (slower 1H FID
decays, higher presence of T2 protons relaxing at longer times and higher T1 relaxation
times). In particular, low steam cooking resulted in samples with a higher moisture
content, higher WHC and a lower presence of more mobile T2 protons, indicating that
water was more tightly retained. Water status helped to explain the instrumental quality
and sensory properties (evaluated in Section B) of turkey meat, mainly due to the different
denaturation of protein induced by the cooking process. Moreover the higher perceived
tenderness was possibly related to the lower water mobility observed in low steam cooked
samples.

108
6. List of Figures
Figure B2/ 1. Moisture contents of RAW and cooked meat samples (NS, LS and HS) both
EXT and INT. Average moisture contents (n=4) are expressed as means±S.D.
Different letters above (lower case for EXT and upper case for INT) the bars indicate
significant difference among the samples (p < 0.05); bars with an asterisk at the same
cooking condition are significantly different (p < 0.05).
Figure B2/ 2. WHC values of RAW and cooked meat samples (NS, LS and HS) both EXT
and INT, expressed as the percentage fraction of the total water content of fresh samples
Average WHC (n=6) are expressed as means±S.D.
Different letters above (lower case for EXT and upper case for INT) the bars indicate
significant difference among the samples (p < 0.05); bars with an asterisk at the same
cooking condition are significantly different (p < 0.05).
Figure B2/ 3. 1H FID decays (0.08–0.10 ms range) of RAW and cooked meat samples:
EXT samples (A) and INT samples (B). “b” values from FID curve monoexponential fitting
(C).
Figure B2/ 4. Characteristics 1H T2 quasi continuous distributions of relaxation times for
RAW and cooked meat samples (NS, LS and HS) both EXT and INT (A); 1H T2
distributions at relaxation times in the 20 ms –7000 ms time range (B); protons abundance
and peak relaxation times (C).
Figure B2/ 5. 1H FID decays (0.08–0.10 ms range) of RAW and cooked samples (INT)
after centrifugation.
Figure B2/ 6. Characteristics 1H T2 quasi continuous distributions of relaxation times for
RAW and cooked samples (INT) (A), protons abundance (B), and peak relaxation times
(C) after centrifugation.

109
Figure B2/ 1. Moisture contents of RAW and cooked meat samples (NS, LS and HS) both
EXT and INT. Average moisture contents (n=4) are expressed as means±S.D. Different
letters above (lower case for EXT and upper case for INT) the bars indicate significant
difference among the samples (p < 0.05); bars with an asterisk at the same cooking
condition are significantly different (p < 0.05).
EXT
INT
c
ba
C
B
A
*
*

110
Figure B2/ 2. WHC values of RAW and cooked meat samples (NS, LS and HS) both EXT
and INT, expressed as the percentage fraction of the total water content of fresh samples
Average WHC (n=6) are expressed as means±S.D.
Different letters above (lower case for EXT and upper case for INT) the bars indicate
significant difference among the samples (p < 0.05); bars with an asterisk at the same
cooking condition are significantly different (p < 0.05).
a aa
AB
B
**
EXT
INT

111
Figure B2/ 3. 1H FID decays (0.08–0.10 ms range) of RAW and cooked meat samples:
EXT samples (A) and INT samples (B). “b” values from FID curve monoexponential fitting
(C).
NS
RAW
LS
HS
NS
RAW
LS
HS
A
B
EXT
INT
C

112
Figure B2/ 4. Characteristics 1H T2 quasi continuous distributions of relaxation times for
RAW and cooked meat samples (NS, LS and HS) both EXT and INT (A); 1H T2
distributions at relaxation times in the 20 ms –7000 ms time range (B); protons abundance
and peak relaxation times (C).
RAW
NS
LS
HS
EXT
INTR
elat
ive
Inte
nsity
T2aT2b
T2c
T2aT2b
T2c
A
C
B
B
CA

113
Figure B2/ 5. 1H FID decays (0.08–0.10 ms range) of RAW and cooked samples (INT)
after centrifugation.
NSWHC
RAWWHC
LSWHC
HSWHC

114
Figure B2/ 6. Characteristics 1H T2 quasi continuous distributions of relaxation times for
RAW and cooked samples (INT) (A), protons abundance (B), and peak relaxation times
(C) after centrifugation.
NSWHC
LSWHC
HSWHC
RAWWHC
Rel
ativ
e In
tens
ity
T2a
T2b
T2c
T2a
T2b
T2c
WHC
No-WHC
WHC
No-WHC
LSWHC HSWHCRAW WHC NSWHC
LSWHC HSWHCRAW WHC NSWHC
A
C
B
B
CA

115
7. List of Tables
Table B2/ 1. 1H T1 peak relaxation times of RAW and cooked samples (NS, LS and HS)
both EXT and INT. Average 1H T1 relaxation times values are expressed as means ± S.D.
a, b, c: p<0.05, bars with an asterisk at the same cooking condition are significantly
different (p < 0.05).

116
Table B2/ 1. 1H T1 peak relaxation times of RAW and cooked samples (NS, LS and HS)
both EXT and INT. Average 1H T1 relaxation times values are expressed as means±S.D.
a, b, c: p<0.05, bars with an asterisk at the same cooking condition are significantly
different (p < 0.05).
328.28 ± 10.88a*300.94 ± 11.35bHS
330.97 ± 14.62a328.66 ± 20.79aLS
316.71 ± 17.37a*280.17 ± 12.20c NS
INTEXT
1H T1 (peak time) (ms)Treatment
328.28 ± 10.88a*300.94 ± 11.35bHS
330.97 ± 14.62a328.66 ± 20.79aLS
316.71 ± 17.37a*280.17 ± 12.20c NS
INTEXT
1H T1 (peak time) (ms)Treatment
Means with the same letter are not significantly different (ANOVA, p<0.05)*Significant difference with independent t-test (p < 0.05) between LS and HS samples in the same position

117
Section C
STEAM OVEN COOKING AT LOW TEMPERATURES OF TURKEY MEAT:
DETERMINATION OF THE MINIMUM RELATIVE HUMIDITY VALUE TO OBTAIN THE
BEST MEAT QUALITY WITH THE HIGHEST WATER SAVING.
B. Mora
1. Introduction
At low temperatures the cooking of turkey meat at relative humidities below the saturation
condition resulted in cooked products with better characteristics (higher cooking yield,
greater perceived tenderness, etc.) than those obtained at the saturation condition, as
reported in the results of sections A and B1. Moreover the cooking of meat with low steam
quantity led to a potential water saving.
In our experimental trials the presence of low steam quantity had a positive effect on
cooking of turkey meat when a temperature gradient between the surface and the center
of the product existed. Cooking treatments finished when meat samples reached 74°C at
their thermal centre, that is the recommended safety temperature for turkey meat (United
States Department of Agriculture, 2006). The temperature of the surface of meat should
be always higher than this value in order to allow a rapid heating by conduction through
the product and then short cooking times.
When particular thermo-hygrometric conditions are applied the surface temperature value
reached by the product can be close to the target temperature of the end of cooking, as
observed at RH=24% at 100°C (section A). In this particular condition the application of
steam resulted in an increase of cooking time and in a worsening of the physical
characteristics of the product compared to the meat cooked without steam (low cooking
yield, lower tenderness, etc.).
The surface temperature of meat is related to the thermo-hygrometric conditions of the air:
in fact the surface of steam cooked meat tends to behave as a wet bulb, as in the
dehydration process, and the surface temperature tends to the value of wet bulb
temperature (section A).
Psychrometry is a simple and inexpensive method to measure the relative amounts of air
and water vapour in a humid air stream. The state of a given air-water mixture is
commonly described with the wet bulb temperature and the dry bulb temperature.
Properties such as relative humidity can be evaluated using the dry bulb and the wet bulb

118
temperatures from the psychrometric chart and calculated with the Assmann
psychrometer or hygrometer formula that describes the relationship among relative
humidity, dry bulb temperature and wet bulb temperature as already explained in the
Introduction section.
In steam cooking the final surface temperature of the product tends to the wet bulb
temperature: the setting of the final temperature to be reached at the surface of the
product allows to calculate the relative humidity that should be applied using the
psychrometric formula.
A final surface temperature of meat of 76 °C was chosen and considered adequate to
reach a temperature gradient of 2°C from the central target temperature. It gave the
advantage to reach a temperature high enough to obtain a short cooking time by the
application of steam and to maximize the positive characteristics of the cooked meat
products and water saving, as previously reported.
2. Aim of the Work
The aim of this study was to determine which was the minimum relative humidity value
that allowed to obtain a positive effect on meat quality, cooking performances (cooking
time reduction, higher cooking yield, etc.) and the higher water saving at low cooking
temperatures (80-150°C), by applying the psychrometric method in order to reach. the set
minimum surface temperature
3. Materials and Methods
3.1 Relation between Wet Bulb Temperature and Relative Humidity: comparison
between the theoretic psychrometric results and experimental data.
The experimental data of the cooking conditions performed in the previous sections that
led to a positive effect of the steam application were considered. They were compared
with the theoretic psychrometric results for wet bulb temperature and relative humidity
(RH). At 100°C the steam conditions were 35%, 43%, 62% and 88% RH, and at 110°C
24%, 43%, 62% RH.
The experimental cooking trials procedure applied was already explained in the previous
section Set up of the experimental trials.
Dry and wet bulb temperatures inside the oven and the temperatures of the surface and of
the geometric centre of each sample were recorded with wire thermocouples (type K,
Ni/Al–Ni/Cr) as described by Chiavaro, Rinaldi, Vittadini& Barbanti (2009).
The theoretic wet bulb temperatures were calculated with the Assmann psychrometer or
hygrometer formula as reported by Vega-Mercado, Góngora-Nieto and Barbosa-Cánovas

119
(2001), setting the dry bulb temperatures (oven’s temperatures) and the RH values of the
treatments, as already showed in the Introduction section.
The calculated wet bulb temperature data were compared to the experimental data of the
wet bulb temperature and to the surface temperature of the product.
3.2 Determination of the minimum relative humidity value to obtain the best meat
quality at different cooking temperatures and water saving evaluation.
The minimum RH values in the dry bulb temperatures range 80-150°C were calculated
setting a final surface temperature of the product (wet bulb) at 76°C.
The dry bulb temperatures and the corresponding calculated minimum RH values were
then fitted with a power equation by means of an Excel® spreadsheet.
The difference between the relative humidity value of saturation at different temperatures
and the minimum relative humidity value that allowed to obtain a positive effect of steam
was calculated. This difference was considered as an indicator of the potential water
saving in the low steam treatment and it was expressed both in terms of relative humidity
and absolute humidity (x, kgwater / kgdry air).
4. Results and Discussion
4.1 Relation between Wet Bulb Temperature and Relative Humidity: comparison
between the theoretic psychrometric results and experimental data.
The theoretic psychrometric results of the wet bulb temperature resulted very similar to
the experimental data of the final wet bulb temperature and the final surface temperature
of the samples for each cooking treatment (Figure C/ 1).
The calculated wet bulb temperatures resulted closer to the final surface temperatures of
the product (-2,5±1,9°C) than the final wet bulb temperatures using the wet cloth (-
5,7±1,4°C). Hence, in our trials, the final surface temperatures of the product showed a
behaviour more similar to the theoretic wet bulb temperature than the wet cloth
temperature.
The calculated wet bulb temperature resulted always lower than the experimental data of
the final wet bulb temperature and of the final surface temperature of the product. Hence,
it was concluded that the theoretic model underestimated the real wet bulb temperature
data both for the final wet bulb temperature and the final surface temperature of the
sample.
The final surface temperature of a product cooked with steam and with a short cooking
time could be predicted by knowing the thermo-hygrometric properties of the air (T/RH).

120
4.2 Determination of the minimum relative humidity value to obtain the best meat
quality at different cooking temperatures and water saving evaluation.
The psychrometric formula allowed to calculate the minimum RH value to be applied in
order to have a temperature of 76°C (wet bulb) at the product’s surface in the 80-150°C
dry bulb temperatures range.
The minimum RH values that determined a positive effect of steam were reported in
Figure C/ 2 as function of the dry bulb temperatures in comparison with the saturation RH
values (calculated as reported in the Introduction section.
The relation between the minimum RH values and the dry bulb temperatures at the wet
bulb temperature of 76°C could be well described by the following simple power equation:
RH=9*108*Tdb-3,6816 (R2 = 0,999).
Hence, after the choice of a selected the cooking temperature (Tdb), it is possible to
predict which is the minimum RH to apply in order to have the better turkey meat quality
characteristics and the higher water saving.
In the 80-150°C dry bulb temperatures range the minimum RH values obtained resulted
well below the saturation conditions.
The gap between the minimum RH value and the saturation RH depends on the several
dry bulb temperatures. The higher the difference between the minimum RH and the
saturation RH at the different temperatures, the greater the water savings can be
obtained. The potential water saving expressed both in terms of relative humidity and
absolute humidity (x, kgwater / kgdry air) was calculated as the difference between the
minimum RH and the saturation RH.
In Figure C/ 3 the difference between the minimum RH values and the saturation ones
(potential water saving) at low cooking temperatures (different dry bulb temperatures)
were reported.
The highest potential water saving (0,93 kgwater/kgdry air). could be obtained at 100°C. Also
at 90, 110 and 120°C a consistent water saving (higher than 0,2 kgwater / kgdry air) could be
reached.
5. Conclusions
The final surface temperatures of the product in steam oven cooking resulted well
estimated by the wet bulb temperatures values calculated by the psychrometric method.
Hence, with the selected cooking temperature to use (Tdb) it is possible to determine
which is the minimum RH value to apply in order to have a positive effect of the
application of steam on turkey breast meat cooking. The positive effects of the application

121
of low steam on cooking were shortest cooking times, highest cooking yields, greater
perceived tenderness and a potential water saving.
The highest improvement in terms of potential water saving could be obtained at 100°C,
but also the application of low steam quantities at 90, 110 and 120°C leads to interesting
results.
However it is noteworthy to mention that these interesting results are referred to the set
cooking conditions, with the limitation of the product geometry (parallelepipeds of 3x3x6
cm). Further studies will be necessary to evaluate the behaviour on cooking of turkey
meat pieces with higher dimensions and different shapes.

122
6. List of Figures
Figure C/ 1. Comparison between the calculated wet bulb temperature data (theoretic
psychrometric results), the experimental data of the wet bulb temperature and the surface
temperature of the product.
Figure C/ 2. The minimum RH values that allowed to obtain a positive effect of steam and
the saturation RH values as a function of the dry bulb temperatures.
Figure C/ 3. Potential water saving due to low RH in steam cooking at low temperatures
(different dry bulb temperatures): difference between minimum RH values and saturation
RH both in terms of relative humidity (%) and absolute humidity (x, kgwater / kgdry air).

123
Figure C/ 1. Comparison between the calculated wet bulb temperature data (theoretic
psychrometric results), the experimental data of the wet bulb temperature and the surface
temperature of the product.
30
40
50
60
70
80
90
100
110
0 20 40 60 80 100
RH (%)
T (
°C)
Sample's Final Surface T (°C) Final Twb (°C) Calculated Twb (°C)
Tdb=100°C
30
40
50
60
70
80
90
100
110
0 20 40 60 80 100
RH (%)
T (
°C)
Sample's Final Surface T (°C) Final Twb (°C) Calculated Twb (°C)
Tdb=110°C

124
Figure C/ 2. The minimum RH values that allowed to obtain a positive effect of steam and
the saturation RH values as a function of the dry bulb temperatures.
0
10
20
30
40
50
60
70
80
90
100
80 90 100 110 120 130 140 150
T (°C)
RH
(%
)
saturation RH (%)
minimum RH (%)
RH = 9*108*Tdb
-3,6816
R 2 =0,999
T wb = 76°C
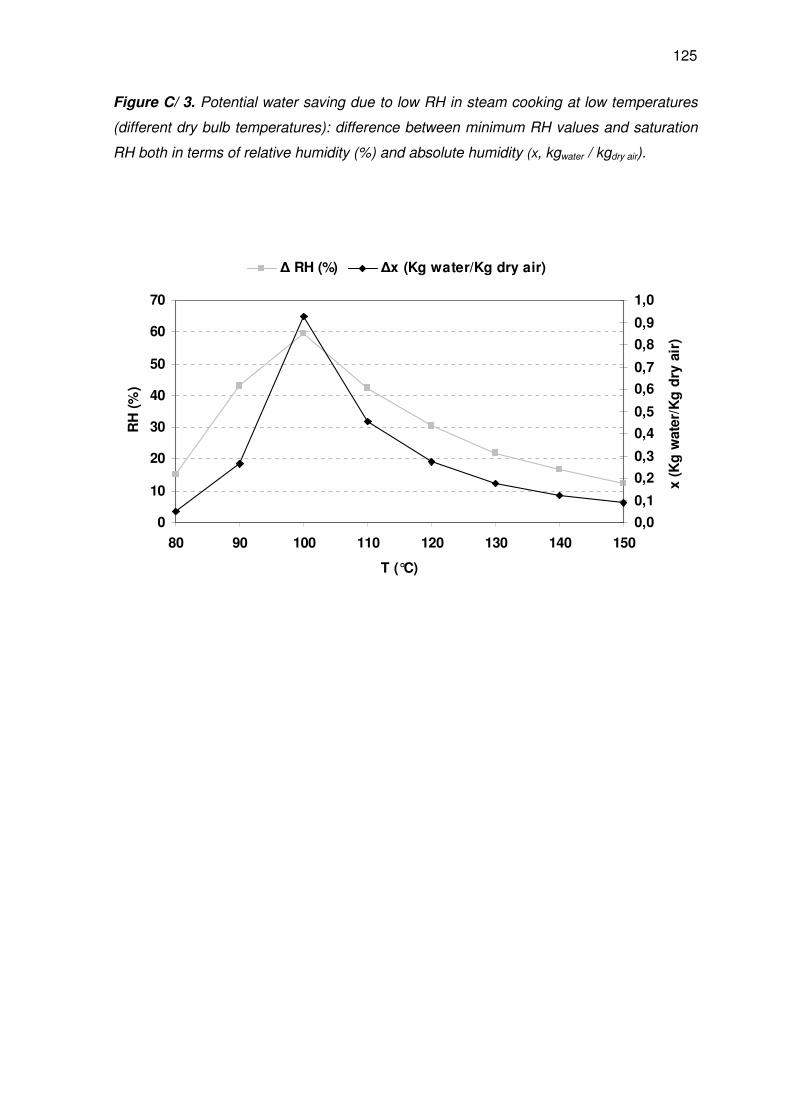
125
Figure C/ 3. Potential water saving due to low RH in steam cooking at low temperatures
(different dry bulb temperatures): difference between minimum RH values and saturation
RH both in terms of relative humidity (%) and absolute humidity (x, kgwater / kgdry air).
0
10
20
30
40
50
60
70
80 90 100 110 120 130 140 150
T (°C)
RH
(%
)
0,0
0,1
0,2
0,3
0,4
0,5
0,6
0,7
0,8
0,9
1,0
x (
Kg
wate
r/K
g d
ry a
ir)
∆ RH (%) ∆x (Kg water/Kg dry air)

126

127
References
– Acton, J. C., Ziegler, G. R., & Burge, D. L. (1983). Functionality of muscle constituents
in the processing of comminuted meat products. CRC Critical Reviews in Food
Science and Nutrition, 18 (2), 99-121.
– Kinsman, D. M., Kotula, A. W., & Breidenstein, B. C. (1991). AMSA, American Meat
Science Association and National Livestock and Meat Board, Chicago, IL. Guidelines
for Meat Color Evaluation. Muscle foods. New York: Chapman & Hall.
– Asghar, A., Samejima, K., & Yasui, T. (1985). Functionality of muscle proteins in
gelation mechanisms of structured meat products. CRC Critical Reviews in Food
Science and Nutrition, 22 (1), 27-106.
– Badiani, A., Stipa, S., Bitossi, F., Gatta, P. P., Vignola, G., & Chizzolini, R. (2002).
Lipid composition, retention and oxidation in fresh and completely trimmed beef
muscles affected by common culinary practices. Meat Science, 60, 69-78.
– Barbanti, D., & Pasquini, M., (2005). Influence of cooking conditions on cooking loss
and tenderness of raw and marinated chicken breast meat. LWT- Food Science and
Technology, 38, 895-901.
– Barbera, S., & Tassone, S. (2006). Meat cooking shrinkage: Measurement of a new
meat quality parameter. Meat Science, 73, 467–474.
– Baron, C., Andersen, H. (2002).Myoglobin-induced lipid oxidation. A review. Journal of
Agricultural and Food Chemistry, 50, 3887–3897.
– Bayne, B. H., Meyer, B. H., & Cole, J. W. (1969). Response of beef roasts differing in
finish, location, and size to two rates of heat application. Journal of Animal Science,
29, 283–287.
– Bechtel, P. J. (1986). Muscle development and contractile proteins. In P. J. Bechtel
(Ed.), Muscle as Food. Orlando, FL: Academic Press Inc.
– Belk, K.E., Luchak, G.L., & Miller, R.K. (1993). Physical characteristics of beef roasts
prepared with different foodservice cooking methods. Journal of Muscle Foods, 4, 119-
139.
– Belton, P. S., Jackson, R. R., & Packer, K. J. (1972). Pulsed NMR studies of water in
striated muscle. I. Transverse nuclear spin relaxation times and freezing effects.
Biochimica Biophysica Acta, 286, 16–25.
– Bemiller, J. N., & Whistler, R.L. (1996). Carbohydrates. In Fennema, O. R., (3rd ed.),
Food Chemistry (pp. 171–174). New York: Marcel Dekker.
– Bender, A. E. (1978) Food Processing and Nutrition. Academic Press, London.

128
– Bender, D. A. (1999). Benders' dictionary of nutrition and food technology. (8th Ed.).
London, UK: CRC Press, (pp.115).
– Bengtsson, N. E., Jakobsson, B., Dagerskog Sik, M. (1976). Cooking of beef by oven
roasting: a study of heat and mass transfer, 1365-2621.
– Bertram, H. C., Andersen, H. J., & Karlsson, A.H. (2001). Comparative study of low-
field NMR relaxation measurements and two traditional methods in the determination
of water holding capacity of pork, Meat Science, 57, 125-132.
– Bertram, H. C., Karlsson, A. H., Rasmussen, M., Pedersen, O. D., Dønstrup, S., &
Andersen, H. J. (2001). Origin of Multiexponential T2 Relaxation in Muscle Myowater.
Journal of Agricultural and Food Chemistry, 49, 3092-3100.
– Bertram, H. C., Donstrup, S., Karlsson, A. H., & Andersen, H. J. (2002). Continuous
distribution analysis of T2 relaxation in meat—an approach in the determination of
water holding capacity. Meat Science, 60, 279–285.
– Bertram, H. C., & Andersen, H. J. (2004). Applications of NMR in meat science.
Annual Reports on NMR Spectroscopy, 53, 157–202.
– Bertram, H.C., Engelsen, S. B., Buska H., Karlssona, A. H., & Andersen, H. J. (2004)
Water properties during cooking of pork studied by low-field NMR relaxation: effects of
curing and the RN -gene. Meat Science, 66, 437–446.
– Bertram, H.C., Aaslyng M. D., & Andersen H. J. (2005). Elucidation of the relationship
between cooking temperature, water distribution and sensory attributes of pork – a
combined NMR and sensory study, Meat Science, 70, 75–81.
– Bertram, H. C., Wu, Z., Van den Berg, F., Andersen, H. J. (2006). NMR relaxometry
and differential scanning calorimetry during meat cooking, Meat Science, 74, 684–689
– Bertram, H.C., Wu, Z., Straadt, I.K., Aagard, M., & Aaslying, M.D. (2006). Effects of
Pressurization on Structure, Water Distribution, and Sensory Attributes of Cured Ham:
Can Pressurization Reduce the Crucial Sodium Content?, Journal of Agricultural and
Food Chemistry, 54 (26), 9912-9917.
– Białobrzewski, I., Danowska-Oziewicz, M., Karpinska-Tymoszczyk, M., Nalepa, B.,
Markowski, M., & Myhan, R. (2010). Turkey breast roasting – Process optimization.
Journal of Food Engineering, 96, 394–400.
– Bianchi, M., Capozzi, F., Cremonini, M. A., Laghi, L., Petracci, M., Placucci, G., &
Cavani, C. (2004). Influence of the season on the relationships between NMR
transverse relaxation and WHC in turkey breast. Journal of the Science of Food and
Agriculture, 84, 1535–1540.
– Borgia, G. C., Brown, R. J. S., & Fantazzini, P. (1998). Uniform-Penalty Inversion of
Multiexponential Decay Data. Journal of Magnetic Resonance, 132 (1), 65-77.

129
– Borgia, G. C., Brown, R.J.S., & Fantazzini, P. (2000). Uniform-Penalty Inversion of
Multiexponential Decay Data II. Data Spacing, T2 Data, Systematic Data Errors, and
Diagnostics. Journal of Magnetic Resonance, 147 (2), 273-285.
– Bouton, P.E., Harris, P.V., & Shorthose, W.R. (1971). Effect of ultimate pH upon the
water-holding capacity and tenderness of mutton. Journal of Food Science, 36, 435–
439.
– Bouton, P. E., Harris, P. V., & Shorthose, W. R., (1975). Changes in shear parameters
of meat associated with structural changes produced by aging, cooking, and
myofibrillar contraction. Journal of Food Science, 40, 122–1126.
– Bouton, P. E., Harris, P. V., & Ratcliff, D. (1981). Effect of cooking temperature and
time on the shear properties of meat. Journal of Food Science, 46, 1082–1087.
– Brøndum, J., Munck, L., Henckel, P., Karlsson, A., Tornberg, E., & Engelsen, S. B.
(2000). Prediction of water-holding capacity and composition of porcine meat with
comparative spectroscopy. Meat Science, 55, 177–185.
– Brown, R. J. S., Capozzi, F., Cavani, C., Cremonini, M. A., Petracci, M., & Placucci, G.
(2000). Relationships between 1H NMR relaxation data and some technological
parameters of meat: a chemometric approach. Journal of Magnetic Resonance, 147,
89–94.
– Brùndum, J., Byrne, D.V., Bak, L.S., Bertelsen, G., & Engelsen, S.B. (2000). Warmed-
over flavour in porcine meat -a combined spectroscopic, sensory and chemometric
study. Meat Science, 54, 83-95.
– Carr, H. Y., & Purcell, E. M. (1954). Effects of diffusion on free precession in nuclear
magnetic resonance experiments. Physical Reviews, 94, 630-638.
– Cavani, C. & Bianchi, M. (2004). Carne. In P. Cabras & A. Martelli, Chimica degli
alimenti (pp. 355-379). Padova, Italy: Ed. Piccin.
– Chambers, P.G., Grandin, T. (2001). Section A meat quality (Chapter 2): Effects of
stress and injury on meat and by-product quality. In Guidelines for humane handling,
transport and slaughter of livestock. Ed. Gunter Heinz, Thinnarat Srisuvan, Thailand
http://www.fao.org/DOCREP/003/X6909E/x6909e04.htm
– Cheng, Q., Sun, D.W., & Scannell, A.G.M. (2005). Feasibility of water cooking for pork
ham processing as compared with traditional dry and wet air cooking methods. Journal
of Food Engineering, 67, 427-435.
– Chiavaro, E., Rinaldi, M., Vittadini, E., & Barbanti, D. (2009). Cooking of pork
Longissimus dorsi at different temperature and relative humidity values: effects on
selected physico-chemical properties. Journal of Food Engineering, 93, 158–165.
– Choi, S.G., & Kerr, W.L. (2003). 1H NMR studies of molecular mobility in wheat starch,
Food Research International, 36, 341-348.

130
– Choubert, G., & Baccaunaud, M. (2010). Effect of moist or dry heat cooking
procedures on carotenoid retention and colour of fillets of rainbow trout
(Oncorhynchus mykiss) fed astaxanthin or canthaxanthin. Food Chemistry, 119, (1),
265-272.
– Christensen, M., Purslow, P. P., & Larsen, L. M. (2000). The effect of cooking
temperature on mechanical properties of whole meat, single muscle fibres and
perimysial connective tissue. Meat Science, 55, 301–307.
– Clausen, I., & Ovesen, L. (2001). Proximate contents, losses or gains of fat, protein
and water comparing raw, hospital-and household- cooked pork cuts. Journal of food
composition and analysis, 14, 491-500.
– Cole, W. C., LeBlanc, A. D., Jhingran, S. G. (1993). The Origin of Biexponential T2
Relaxation in Muscle Water. Magnetic Resonance in Medicine, 29, 19-24.
– Cope, F. W. (1969). Nuclear magnetic resonance evidence using D2O for structured
water in muscle and brain. Biophysics Journal, 9, 303–319.
– Cornforth, D. (1994) . Color: Its basis and importance. In A.M. Pearson & T.R. Dutson,
Quality attributes and their measurement in meat, poultry and fish products. Advances
in meat research series (pp. 35-77). Glasgow: Blackie Academic & Professional.
– Cover, S., Dilsaver, E. M., Hays, R. M. and Smith, W. H. (1949) Retention of B-
vitamins after large scale cooking of meat, II, Roasting by two methods. J. Am. Diet.
Assoc. 25, 949–954.
– Cross, H. R., Stanfield, M. S., & Koch, E. J. (1976). Beef palatability as affected by
cooking rate and final internal temperature. Journal of Animal Science, 43,114–121.
– Danehy, J. P. (1986) Maillard reactions: non-enzymic browning in food systems with
specific reference to the development of flavour. Adv. Food Res. 30, 77–138.
– Danowska-Oziewicz, M., Karpinska-Tymoszczyk, M., & Borowski, J. (2007). The effect
of cooking in a steam-convection oven on the quality of selected dishes. Journal of
Foodservice, 18, 187-197.
– Datta, A.K. (2002). Biological and bioenvironmental heat and mass transfer. Chapter
6, (pp.111). New York Basel: Marcel Dekker Inc.
– Davey, C. L., & Gilbert, K. V. (1974). Temperature-dependent cooking toughness in
beef. Journal of Science of Food Agricolture, 25, 931–938.
– Elizalde, B. E.; Bressa, F.; Dalla Rosa, M. (1992). Antioxidative action of Maillard
reaction volatiles: influence of the Maillard solution browning level. J. Am. Oil Chem.
Soc., 68, 758-762.
– Farhat, I.A., Blanshard, J.M.V., & Mitchell, J.R. (2000). The retrogradation of waxy
maize starch extrudates: Effects of storage temperature and water content
Biopolymers, 53, 411-422.

131
– Farrer, K. T. H. (1955). The thermal destruction of vitamin B1 in foods. Adv. Food Res.
6, 257–311.
– Fellows, P. (2000). Dehydration. In P. Fellows (Ed.), Food processing technology –
Principle and practice (2nd ed. pp. 311-317). Cambridge, UK: Woodhead Publishing.
– Ferracane R., Pellegrini N., Visconti A., Graziani G., Chiavaro E., Miglio, C. and
Fogliano, V. (2008). Effects of Different Cooking Methods on Antioxidant Profile,
Antioxidant Capacity, and Physical Characteristics of Artichoke. Journal of Agricultural
and Food Chemistry, 56, 8601-8614.
– Fillion, L., & Henry, C.J.K. (1998). Nutrient losses and gains during frying: a review.
International journal of food science and nutrition, 49(1), 57-65.
– Foegeding, E. A. (1987) Functional Properties of Turkey Salt-Soluble Proteins, Journal
of Food Science, 52, 6, 1495–1499.
– Fowler, A. J., & Bejan, A. (1991). The effect of shrinkage on the cooking of meat.
International Journal of Heat and Fluid Flow, 12, 375-383.
– Frankel, E.N. (1998). Foods. In Lipid oxidation vol. 10 (pp. 187–226), in the Oily Press
lipid Library. Glasgow, Skotland: Bell, Bain Ltd
– Fukazawa, T., Hashimoto, Y., & Yasui, T. (1961). Effect of some proteins on the
binding quality of an experimental sausage. Journal of Food Science, 26, 541-547.
– Gardes, N., Burg, P., & Fraile, P. (1995). Influence de trois modes de cuisson sur
quelques caracteristiques d’un roti de porc. Sciences des Aliments, 15, 125–137.
– Grau, R., & Hamm, R. (1952). Eine einfache Methode zur Bes-timmung der
Wasserbindung im Fleisch. Fleischwirtschaft, 4, 295-297.
– Hallstrom, B.(1992). Mass transfer in foods. In D. R. Heldman, & D. B. Lund (Eds.),
Handbook of food engineering (pp. 167-168). New York: Marcel Dekker Inc.
– Hallstrom, B., & Skjoldebrand, C. (1983) Heat and mass transfer in solid foods. In: S.
Thorne (ed.) Developments in Food Preservation, vol. 2 (pp. 61–94)., London, UK:
Applied Science.
– Hamilton, D. N., Ellis, M., Miller, K. D., McKeith, F. K., & Parrett, D. F. (2000). The
effect of the Halothane and Rendement Napole genes on carcass and meat quality
characteristics of pigs. Journal of Animal Science, 78, 2862–2867.
– Hamm, R. (1977). In T. Höyem & O. Kvåle (Eds.), Physical, chemical and biological
changes in food caused by thermal processing (pp. 101–134). UK: Applied Science
Publishers Limited London
– Hamm, R. (1986). Functional properties of myofibrillar system and their measurement.
In P. J. Bechtel (Ed.), Muscle as food (pp. 136–199). New York: Academic Press.
– Harrington, W. F. (1979). Contractile proteins of the myofibril. In H. Neurath, & R. L.
Hill (Eds.), The Proteins. New York: Academic Press.

132
– Hazlewood, C. F., Chang, D. C., Nichols, B. L., & Woessner, D. E. (1974). Nuclear
magnetic resonance transverse relaxation times of water protons in skeletal muscle.
Biophysics Journal, 14, 583–606.
– Hazlewood, C. F., Nichols, B. L., & Chamberlain, N. F. (1969). Evidence for the
existence of a minimum of two phases of ordered water in skeletal muscle. Nature,
222, 747–750.
– Holdsworth, S. D. (1985). Optimization of thermal processing – a review. Journal of
Food Engineering, 4, 89–116.
– Holownia, K., Chinnan, M.S., & Reynolds, A.E. (2003). Pink color defect in poultry
white meat as affected by endogenous conditions. Journal of Food Science, 68, 3,
742-747.
– Honikel, K. O. (1987). How to measure the water-holding capacity of meat?
Recommendation of standardized methods. In P. V. Tarrant,
– Honikel, K. O. (1998). Reference methods for the assessment of physical
characteristics of meat. Meat Science, 49, 447-457.
– http://www.eatturkey.com/consumer/stats/stats.html, Turkey statistic, 2010 National
Turkey Federation.
– http://www.inran.it/646/tabelle_di_composizione_degli_alimenti.html?idalimento=1068
50&quant=100
– Huff-Lonergan, E., & Lonergan, S. M. (2005). Mechanism of water-holding capacity of
meat: the role of postmortem biochemical and structural changes. Meat Science, 71,
194–204.
– Hunt, M.C. & Kropf, D. H. (1987). Color and appearance. In: Adv. Meat Research. Vol.
3. Restructured Meat and Poultry Products (pp. 125-159). AVI Publishing Co., Inc.,
Westport, CT.
– Hunt, M.C., Acton, J.C., Benedict, R.C., Calkins, C. R., Cornforth, D.P., Jeremiah,
L.E., Olson, D.G., Salm, C.P., Savell, J.W., and Shivas, S.D. (1991). Guidelines for
meat colour evaluation. Proceedings 44th Reciprocal Meat Conference. Appendix pp.
1-17.
– Huxley, H. E. (1963). Electron microscope studies on the structure of natural and
synthetic protein filaments from striated muscle. Journal of Molecular Biology, 7, 281-
288.
– ISO. (1985). Sensory analysis–methodology–flavour profile methods (pp. 6564).
Geneva: International Organization for Standardization.
– Jellineck, G. (1985). Sensory Evaluation of Food. UK: Ellis Horwood Ltd., (Chapter 10
and 11).
133
– Kijowski, J. (2001). Muscle proteins. In Z. E. Sikorski (Ed.), Chemical & Functional
Properties of Food Proteins. Technomic Publishing Company, Inc., Lancaster, PA
– Kim, Y.,& Cormillon, P. (2001). Effects of temperature and mixing time on molecular
mobility in wheat dough, Lebensmittel-Wissenschaft und-Technologie, 34, 417-423.
– King, D. A., Dikeman, M. E., Wheeler, T. L., Kastner, C. L. & Koohmaraie, M. (2003).
Chilling and cooking rate effects on some myofibrillar determinants of tenderness of
beef. Journal of Animal Science, 81, 1473–1481.
– King, N. J., & Whyte, R. (2006). Does it look cooked? A review of factors that influence
cooked meat color. Journal of Food Science,71, 4.
– Knudsen, J.G., Hottel, H.C., Sarofim, A.F., Wankat, P.C., Knaebel, K.S. (1997). Heat
and mass transfer, Heat transfer 5-1 / 5-42. In Perry’s Chemical Engineers’ Handbook,
7th Edition, McGraw-Hill Companies Inc.
– Kristensen, L., & Purslow, P. P. (2001). The effect of ageing on the water-holding
capacity of pork: role of cytoskeletal proteins. Meat Science, 58, 17–23.
– Laakkonen, E., Wellington, G. H., & Sherbon, J. W. (1970). Low-temperature, long
time heating of bovine muscles. 1. Changes in tenderness, water-binding capacity, pH
and amount of water-soluble components. Journal of Food Science, 35, 175–177.
– Lawrence, T. E., King D. A., Obuz E., Yancey E. J., & Dikeman M. E. (2001).
Evaluation of electric belt grill, forced-air convection oven, and electric broiler cookery
methods for beef tenderness research. Meat Science, 58, 239–246.
– Lawrie, R.A. (1998). Lawrie's meat science, Sixth Edition, Cambridge UK: Woodhead
Publishing Ltd.
– Lewis, G. J. & Purslow, P. P. (1991) The effect of marination and cooking on the
mechanical properties of intramuscular connective tissue. Journal of Muscle Foods, 2,
177-195.
– Li-Chan, E., Nakai, S., & Wood, D. F. (1987). Muscle protein structure – functionality
relationships and discrimination of functionality by multivariate analysis. Journal of
Food Science, 52, 31-36.
– Lillford, P. J., Clark, A. H., & Jones, D. V. (1980). Distribution of water in
heterogeneous food and model systems. In S. P. Rowland, Water in polymers. ACS
symposium series, 127 (pp. 177–195). American Chemical Society.
– Link, L. B., Potter, J. D. (2004). Raw versus cooked vegetables and cancer risk.
Cancer Epidemiology, Biomarkers & Prevention, 13, 1422–1435.
– Liu, Y., & Chen, Y. R. (2000). Two-dimensional correlation spectroscopy study of
visible and near- infrared spectral intensity variations of chicken meats in cold storage.
Applied Spectroscopy, 54, 1458–1470.
134
– Liu, Y., & Chen, Y. R. (2001). Analysis of visible reflectance spectra of stored, cooked
and diseased chickenmeats. Meat Science, 58, 395–401.
– Lopez Bote,C, Warriss,P.D., Brown, S.N. (1989). The use of muscle protein solubility
measurements to assess pig lean meat quality Meat-Science.; 26(3): 167-175.
– Maribo, H., Olsen, E. V., Barton-Gade, P., Moller, A. J., & Karlsson, A. (1998). Effect
of early post-mortem cooling on temperature, pH fall and meat quality in pigs. Meat
Science, 50, 115–129.
– Maruyama, K. (1985). Myofibrillar cytoskeletal proteins of vertebrate striated muscle.
In R. Lawrie (Ed.), Development in Meat Science. Elsevier Applied Science Publisher,
London.
– Mauron, J. (1982). Effect of processing on nutritive value of food: protein. In: M.
Rechcigl (ed.) Handbook of the Nutritive Value of Processed Food, Vol. 1. CRC Press,
Boca Raton, Florida, pp. 429–472.
– Meiboom, S., & Gill, D. (1958). Modified spin-echo method for measuring nuclear
relaxation times. Review of Scientific Instruments, 29 (8), 688-691.
– Miyaguchi Y., Nagayama, K., Tsutsumi, M. (2000) Thermal and functional properties
of porcine sarcoplasmic proteins. A comparison with some water-soluble animal
proteins. Journal of animal science, 71 (4), 416-424.
– Micklander, E., Peshlov, B., Purslow, P. P., & Engelsen, S. B. (2002). NMR cooking:
monitoring the changes in meat during cooking by low field 1H-NMR. Trends in Food
Science and Technology, 13, 341–346.
– Mielnik, M. B., Sem, S., Egelandsdal, B., & Skrede, G. (2008). By-products from herbs
essential oil production as ingredient in marinade for turkey thighs. LWT- Food
Science and Technology, 41, 93–100.
– Miglio C., Chiavaro, E., Visconti, A., Fogliano, V., & Pellegrini, N. (2008) Effects of
different cooking methods on nutritional and physicochemical characteristics of
selected vegetables. Journal of . Agriculture and Food Chemistry, 56, 139–147.
– Mitsuo, N. (1988). Chemistry of Maillard reactions: recent studies on the browning
reaction mechanism and the development of antioxidant and mutagens. In Advances
in food research, Vol.32, Academic Press Inc., LONDON.
– Møller, A. J. (1981). Analysis of Warner-Bratzler shear pattern with regard to
myofibrillar and connective tissue components of tenderness. Meat Science, 5, 247–
260.
– Monin, R., & Laborde, D. (1985). Water holding capacity of pig muscle proteins:
interaction between the myobrillar proteins and sarcoplasmic compounds. Science
Aliments, 5, 341–345.

135
– Morris, E.C. (1998) Humidity measurement Chap.7, (pp. 139-146), In Temperature
and humidity measurements. Vol.1 Edited by Robert E. Bentley Springer-Verlag,
Singapore.
– Mortensen, M., Andersen, H.J., Engelsen, S. B., & Bertram, H.C. (2006). Effect of
freezing temperature, thawing and cooking rate on water distribution in two pork
qualities, Meat Science, 72, 34–42.
– Mottram, D.S. (1998). Flavour formation in meat and meat products: a review. Food
Chemistry, 62 (4), 415–424.
– Murphy, R.Y., Johnson, E. R., Duncan, L.K., Clausen, E.C., Davis, M. D., & March,
J.A. (2001). Heat transfer properties, moisture loss, product yield, and soluble proteins
in chicken breast patties during air convection cooking. Poultry Science, 80, 508–514.
– Nam, K.C. & Ahn, D.U. (2002). Mechanisms of pink color formation in irradiated
precooked turkey breast meat. Journal of Food Science, 67, 600-607.
– Nanke, K. E., Sebranek, J. G., & Olson, D. G. (1998). Color characteristics of
irradiated vacuum-packed pork, beef, and turkey. Journal of Food Science, 63, 1001–
1006.
– Nicol, D. J., Shaw, M. K., & Ledward, D. A. (1970). Hydrogen sulfide production by
bacteria and sulfmyoglobin formation in prepacked chilled beef. Applied Microbiology,
19, (6), 937-939.
– Obuz, E., Dikeman, M. E., & Loughin, T. M. (2003). Effects of cooking method,
reheating, holding time and holding temperature on beef longissimus lumborum and
biceps femoris tenderness. Meat Science, 65, 841–851.
– Offer, G. (1984). Progress in the biochemistry, physiology and structure of meat. In
Proceedings from the 30th European Meeting of meat Research Workers, (pp. 87–93)
Bristol, September, 1984.
– Offer, G., Restall, D. & Trinck, J. (1984). Water-holding in meat. In A. J. Bailey (Eds.),
Recent Advances in Chemistry of Meat (pp. 71–83). London: The Royal Society of
Chemistry.
– Offer, G., Knight, P., Jeacocke, R., Almond, R., Cousins, T., Elsey, J., Parsons, N.,
Sharp, A., Starr, R., & Purslow, P. (1989). The structural basis of the water-holding,
appearance and toughness of meat and meat products. Food Microstructure, 8, 151-
170.
– Ohlsson, T. (1980). Temperature dependence of sensory quality changes during
thermal processing. Journal of Food Science, 45, 836-840.
– Ohlsson, T. (1986). Boiling in water. IUFoST Int. Symp. On “Progress in Food
Preparation Processes”, June 8-11, Halmstad, Sweden.

136
– Ohlsson, T. (1988) The cook-value as a tool in optimizing thermal processes. SIKs
Service-Serie n. 786, Göteborg, Sweden.
– Omojola, A.B., Isah, O.A., Adewumi, M.K., Ogunsola, O.O. & Attah, S. (2003).
Evaluation of the effects of various additives on the acceptability of Kilishi. Tropical
Journal of Animal Science, 2, 97-101.
– Omojola A.B.( 2009). An assessment of ‘‘Suya’’ prepared from different muscle type.
Nutrition & Food Science, 39 (3), 277-282.
– Owens, C.M., Hirschler, E.M., McKee, Martinez-Dawson R., & Sams, A.R. (2000). The
characterization and incidence of pale, soft, exudative turkey meat in a commercial
plant. Poultry Science, 79, 553-558.
– Palka, K., & Daun, H. (1999). Changes in texture, cooking losses, and miofibrillar
structure of bovine M. semitendinosus during heating. Meat Science, 51, 237–243.
– Pearson, R. T., Duff, I. D., Derbyshire, W., & Blanshard, J. M. V. (1974). An NMR
investigation of rigor in porcine muscle. Biochimica Biophysica Acta, 362, 188–200.
– Penfield, M. P., & Meyer B. H. (1975). Changes in tenderness and collagen of beef
semitendinosus heated at two rates. Journal of Food Science, 40, 150–154.
– Perrot P. (1998). A to Z of thermodynamics. pp. 160-165. New York:.Oxford University
Press Inc.
– Podsêdek, A. (2007). Natural antioxidants and antioxidant capacity of Brassica
vegetables: A review. LWT. 40, 1–11.
– Pompei, C. (2009). Operazioni unitarie della tecnologia alimentare., Chapter 7, La
pastorizzazione e la sterilizzazione (pp. 188-192). Milan, Italy: Ed. Ambrosiana. ISBN
978-88-08-18342-2
– Poon, P.W.B., Durance, T., & Kitts, D.D. (2001). Composition and retention of lipid
nutrients in cooked ground beef relative to heat-transfer rates. Food Chemistry, 74,
485–491.
– Purslow, P. P. (1985). The physical basis of meat texture: observations on the fracture
behaviour of cooked bovine m. semitendinosus. Meat Science 12, 39-60.
– Riva, M. & Schiraldi, A. (1994). A DSC investigation of the effects of heating rate on
cooking indexes of ground meat. Italian Journal of Food Science, 6, 43-58.
– Robson, A. M. (1995). Myofibrillar and cytoskeletal structures and proteins in mature
skeletal muscle cells. In A. Quali, D. I. Demeyer, & F. J. Smulders (Eds.), Expression
of Tissue Proteinase and Regulations of Protein Degradation as Related to Meat
Quality. Utrecht, Netherlands: Ecceamst.
– Rongrong, L., Kerr, W.L., Toledo, R.T., & Carpenter, J.A. (2000). 1H NMR Studies of
Water in Chicken Breast Marinated with Different Phosphates. Journal Of Food
Science, 65 (4), 575-580.

137
– Roos, Y.H. (1992). Phase transitions and transformation in food systems. In D. R.
Heldman, & D. B. Lund (Eds.), Handbook of food engineering (pp. 167-168). New
York: Marcel Dekker Inc.
– Rowe, R. W. D. (1974). Collagen fibre arrangement in intramuscular connective tissue.
Changes associated with muscle shortening and their possible relevance to raw meat
toughness measurements. Journal of Food Technology, 9, 501–508.
– Rowe, L. J., Maddock, K. R., Lonergan, S. M., & HuV-Lonergan, E. (2004). Oxidative
environments decrease tenderization of beef steaks through inactivation of calpain.
Journal of Animal Science, 82, 3254–3266.
– Ruiz de Huidobro F., Miguel E., Blàzquez B. & Onega, E. (2005). A comparison
between two methods (Warner–Bratzler and texture profile analysis) for testing either
raw meat or cooked meat. Meat Science, 69, 527–536.
– Ryan, S. M., Seyfert, M., Hunt, M. C., & Mancini, R. A. (2006). Influence of cooking
rate, endpoint temperature, post-cook hold time, and myoglobin redox state on internal
color development of cooked ground beef patties. Journal of Food Science, 71, 216-
221.
– Samejima, K., Hashimoto, Y., Yasui, T., & Fukazawa, T. (1969). Heat gelling
properties of myosin, actin, actomyosin and myosin-subunits in a saline model system.
Journal of Food Science, 34, 242-248.
– Sammel, L. M., Claus, J. R. (2007). Calcium chloride and tricalcium phosphate effects
on the pink color defect in cooked ground and intact turkey breast. Meat Science ,77,
492–498.
– Sereno, N.M., Hill, S.E., Mitchell, J.R., Scharf, U., & Farhat, I.A. (2007). Probing water
migration and mobility during the aging of bread. In Farhat, I.A., Belton, P.S., Webb,
G.A. (Eds.), Magnetic Resonance in Food Science: From Molecules to Man, (pp. 89-
95). UK: RSC Publishing.
– Sharifudin, Md. S., Nott, K. P., & Hall, L. D. (2006). Combination of NMR and MRI
quantification of moisture and structure changes for convection cooking of fresh
chicken meat. Meat Science, 72, 398–403.
– Sims, T. J., Bailey, A. J. (1992). Structural aspects of cooked meat. In D. A. Ledward,
D. E. Johnston, M. K. The chemistry of muscle based foods (pp. 106– 124).
Cambridge, UK: Knight (Eds.), Royal Society of Chemistry.
– Skog, K., Eneroth, A., & Svanberg, M. (2003). Effects of different cooking methods on
the formation of food mutagens in meat. International Journal of Food Science &
Technology, 38,(3), 313-319.
– Solberg, M., Franke, W.C. (1971). Photo sensitivity of fresh meat colour in the visible
spectrum. Journal of Food Science, 36 (7), 990-993.

138
– Sosa-Morales, M.E., Orzuna-Espìritu, R., & Vélez-Ruiz, J.F. (2006). Mass, thermal
and quality aspects of deep-fat frying of pork meat. Journal of Food Engineering, 77.
731-737.
– Spiga M. (1999). Lezioni di fisica tecnica, -Cap. Miscele aria-vapore- (pp. 95-110),
Bologna, Italy: Ed.Esculapio.
– Steiner, R. F., Laki, K., & Spicer, S. (1952). Light scattering studies on some muscle
proteins. Journal of Polymer Science, 8 (1), 23-33.
– Stoier, S., Aaslyng, M. D., Olsen, E. V., & Henckel, P. (2001). The effect of stress
during lairage and stunning on muscle metabolism and drip loss in Danish pork. Meat
Science, 59, 127–131.
– Stryer, L. (1995). Biochemistry, 4th edition. New York: W. H. Freeman Company.
– Swatland, H. J. (1989). A review of meat spectrophotometry (300 to 800 nm).
Canadian Institute of Food Science and Technology journal, 22, 390–402.
– Tornberg, E., Olsson, A. & Persson, K. (1990). The structural and interfacial properties
of food proteins in relation to their function in emulsions. In K. Larsson, & S. E. Friberg,
Food Emulsions (pp. 247–324). New York: Basel.
– Tornberg, E., Andersson, A., Göransson, Å., & von Seth, G. (1993). Water and fat
distribution in pork in relation to sensory properties. In E. Puolanne, D. I. Demeyer, M.
Ruusunen, & S. Ellis (Eds.), Pork quality: genetic and metabolic factors. UK:
CABInternational.
– Tornberg, E. (2005). Effects of heat on meat proteins – Implications on structure and
quality of meat products. Meat Science, 70, 493–508.
– United States Department of Agriculture (USDA), National Advisory Committee on
Microbiological Criteria for Foods (NACMCF). Food Safety and Inspection Service.
(2006). FSIS Issues News Release on Single Minimum Internal Temperature for
Cooked Poultry. Food Safety and Inspection Service constituent update, 7 (14), 1.
– Van Oeckel, M. J., Warnants, N., & Boucque, C. V. (1999). Comparison of different
methods for measuring water holding capacity and juiciness of pork versus on-line
screening methods. Meat Science, 51, 313–320.
– Van Roon, P. S., Houben, J. H., Koolmess, P. A., Van Vliet, T., & Krol, B. (1994).
Mechanical and microstructural characteristics of meat doughs, either heated by a
continuous process in a radiofrequency field or conventionally in a waterbath. Meat
Science, 38, 103–116.
– Varnam, A., Sutherland, J., (1995). Meat and meat products. London: Chapman &
Hall, pp. 430.
– Vega-Mercado, H. Góngora-Nieto, M. M., Barbosa-Cánovas, G.V. (2001) Advances in
dehydration of foods. Journal of Food Engineering, 49, 4, 271-289.

139
– Venturi, L., Rocculi, P., Cavani, C., Placucci, G., Dalla Rosa, M., & Cremonini, M. A.
(2007). Water Absorption of Freeze-Dried Meat at Different Water Activities: a
Multianalytical Approach Using Sorption Isotherm, Differential Scanning Calorimetry,
and Nuclear Magnetic Resonance. Journal of Agricultural and Food Chemistry, 55,
10572–10578.
– Vittadini, E., Rinaldi, M., Chiavaro, E., Barbanti, D., & Massini, R. (2005). The effect of
different convection cooking methods on the instrumental quality and yield of pork
longissimus dorsi. Meat-Science, 69, 749-756.
– Walsh H., Martins S., O’ Neill E.E., Kerry J.P., Kenny T., Ward P. (2010). The effects
of different cooking regimes on the cook yield and tenderness of non-injected and
injection enhanced forequarter beef muscles. Meat Science, 84, 444–448.
– Wang, Y., Ngadi, M.O., & Adedeji, A.A. (2010). Shrinkage of Chicken Nuggets During
Deep-Fat Frying. International Journal of Food Properties, 13, 404-410.
– Warren. K.E., Hunt, M.C., Kropf, D.H., Hague, M.A., Waldner, C.L., Stroda, S.L.,
Kastner, C.L. (1996). Chemical properties of ground beef patties exhibiting normal and
premature brown internal cooked color. Journal of Muscle Foods, 7, 303–314.
– Warris, P.D. (2000). Measuring the composition and the physical characteristics of
meat. In “Meat science an introductory text” (pp. 229-251). Bristol (U.K.): CABI
Publishing.
– Westphalen, A.D., Briggs, J.L., & Lonergan, S.M. (2005). Influence of pH on
rheological properties of porcine myofibrillar protein during heat induced gelation. Meat
Science, 70, 293–299.
– Yamada, T. (1998) 1H NMR spectroscopy of the intracellular water of resting and rigor
frog skeletal muscle. In Sugi, H., Pollack, G.H (Eds.), Mechanisms of Work Production
and Work Absorption in Muscle, (pp 145-155). New York: Plenum Press.
– Yasui, T., Ishioroshi, M., & Samejima, K. (1980). Heat induced gelation of myosin in
the presence of actin. Journal of Food Biochemistry, 4, 61-80.
– Yates, L. D., & Greaser, M. L. (1983). Quantitative determination of myosin and actin
in rabbit skeletal muscle. Journal of Molecular Biology, 168, 123-141.
– Zhu, L. G., & Brewer, M. S. (1998). Discoloration of fresh pork as related to muscle
and display conditions. Journal of Food Science, 63, 763–767.
– Ziegler, G. R., & Acton, J. C. (1984). Mechanisms of gel formation by proteins of
muscle tissue. Food Technology, 38 (5), 77-81.

140
141
Vita
Beatrice Mora January 3, 1981 …………………………..
Studies 2000 – 2005 ………………………………...
2008 - 2010 ……………………………….. Publications list
- Mora, B., Barbanti, D., Betta, G., Bozzoli, F. Oven cooking of turkey meat at different
relative humidities. Italian Journal of Food Science. Submitted Sept. 2010.
- Mora, B., Curti, E., Vittadini, E., Barbanti, D. Effect of different air/steam convection
cooking methods on turkey breast meat. Part 1. Instrumental quality and sensory
properties. Meat Science. Submitted Sept. 2010.
- Curti, E., Mora, B., Barbanti, D., Vittadini, E. Effect of different air/steam convection
cooking methods on turkey breast meat. Part 2. Water status. Meat Science. Submitted
Sept. 2010.
- Barbanti, D., Betta, G., Mora, B., Piva, M., Rinaldi, M. An experimental study on some
physical properties of industrial ice creams under non-steady thermal conditions. Poster
Programme: Poster n.P0322, Section 13 Food Processing, New Technologies & Process
Degree in Food Science and Technology,
University of Parma, Parma, Italy.
Ph.D. in Food Science Technology.
Department of Industrial Engineering,
University of Parma, Parma, Italy.
Born in San Secondo P.se, Parma
(Italy).

142
Optimisation. IUFoST 2010, 15th World Congress of Food Science and Technology (22-
26/08/2010 Cape Town, South Africa).
- Mora, B. Low temperature cooking of meat in a steam convection- oven: physical-
chemical modifications. Proceedings of the 14th Workshop on the developments in the
Italian PhD Research of Food Science Technology and Biotechnology tenuto ad Oristano
16-18 September, 2009. Votazione di A “ottimo livello” e il riconoscimento di n=3 CFU da
parte della Commissione presieduta dal presidente coordinatore della commissione Prof
G.A. Farris.
- Mora, B., Barbanti, D., Tornielli, G.B., Ferrarini, R. (2008). Controllo e innovazione nel
processo di appassimento delle uve. Vignevini, 10 (35), 58-62.
- Mora, B., Barbanti, D., Sordato, G., Tornielli, G.B., Ferrarini, R. (2008). Induzione di
B.cinerea in forma nobile durante l’appassimento delle uve in post-raccolta. L’ Enologo, 9
(Sept.), 79-85.
- Mora, B. Low temperature cooking of meat in a steam convection- oven: physical-
chemical modifications, Proceedings of the 13th Workshop on the developments in the
Italian PhD Research of Food Science Technology and Biotechnology, Alba (CN) 10-12
September, 2008. Votazione di B “buon livello” e il riconoscimento di n=2 CFU da parte
della Commissione presieduta dal presidente coordinatore della commissione Prof
Vincenzo Gerbi.
- Tornielli G.B., Nicolis E., Mora B., Barbanti D., Ferrarini R. L’appassimento in fruttaio
come tecnica per il potenziamento dell’identità dei vini Recioto e Amarone della
Valpolicella. Atti del convegno: XXXI Congresso mondiale della Vigna e del Vino - OIV -
15-20 Giugno 2008- , Verona, Italia -Poster- supporto multimediale.
- Barbanti, D., Mora, B., Ferrarini, R., Tornielli G.B., Cipriani, M. (2008) Effect of various
thermo-hygrometric conditions on the withering kinetics of grapes used for the production
of ‘‘Amarone” and ‘‘Recioto” wines. Journal of Food Engineering, 85, 350–358.

143
Acknowledgements Ringrazio il Prof Davide Barbanti, il mio tutor, per i consigli, gli insegnamenti e l’appoggio dimostrato in questo lavoro. Un doveroso ringraziamento a tutti i professori del gruppo di ricerca di tecnologie alimentari per i momenti di confronto. Grazie ai tecnici del dipartimento di Ingegneria Industriale per l’allestimento e la messa appunto del forno. Grazie al gruppo di microbiologia per la disponibilità delle attrezzature per le misure di WHC. Un grazie ai miei colleghi, in particolare un enorme grazie a Elena, Eleonora e Romina, per avermi sopportato ed aiutato tanto. Grazie agli amici, un pensiero speciale per ognuno di voi. Ed infine, ma la base di tutto, un sincero grazie alla mia famiglia per il supporto che mi ha sempre dato, grazie di cuore. Grazie a tutti quelli che mi sono stati accanto in questo tratto di strada…
Top Related