


Languages
Pages
Legal


SRSA
PRESENTATION TO THE
PORTFOLIO COMMITEE
OF SPORT AND RECREATION
10 SEPTEMBER 2013

SRSA
Total Budget vs ExpenditureCurrent Expenditure
Budget vs Expenditure Report as at 31 August 2013
DEPARTMENT OF SPORT & RECREATION SA
Budget Adjusted Budget Expenditure Budget Balance %
BUDGET R'000 R'000 R'000 R'000 % Current payments Compensation of employees 99,325 99,325 32,244 67,081 32% Goods and services 159,095 159,095 64,707 94,388 41% Administrative Fees 760 760 22 738 3% Advertising 6,344 6,344 4,611 1,733 73% Catering 1,464 1,464 902 562 62% Communication 4,641 4,542 1,475 3,067 32% Contractors 38,671 38,770 6,277 32,493 16% Consultants 3,121 3,121 308 2,813 10% Audit Costs 4,153 4,153 1,945 2,208 47% Training & Development 1,634 1,634 275 1,359 17% Inventory 4,003 4,003 1,780 2,223 44% Travel & Subsistence 36,999 37,071 10,890 26,181 29% Operating Payments 2,968 2,896 562 2,334 19% Venues & Faficlities 29,154 29,154 22,323 6,831 77% Other 23,978 23,978 13,015 10,963 54% Assets<R5000 1,205 1,205 1 1,204 0% Total current payments 258,420 258,420 96,951 161,469 38%

SRSA
Total Budget vs Expenditure Transfers & Capital Expenditure
Budget vs Expenditure Report as at 31 August 2013
DEPARTMENT OF SPORT & RECREATION SA Budget Adjusted Budget Expenditure Budget Balance %
BUDGET R'000 R'000 R'000 R'000 % Transfers and subsidies to: Provinces 497,591 497,591 169,148 328,443 34% Municipalities 120,000 120,000 840 119,160 0% Departmental agencies and accounts 20,648 20,648 17,325 3,323 84% Public corporations and private enterprises - - - - 0% Non-profit institutions 174,656 174,656 14,910 159,746 9% Households - - 227 (227) -100% Total Transfers and Subsidies 812,895 812,895 202,450 610,445 25% Payments for capital assets Machinery and equipment 2,171 2,171 236 1,935 11% Total payments for capital assets 2,171 2,171 236 1,935 11%
Total 1,073,486 1,073,486 299,637 773,849 28%

SRSA
Budget vs ExpenditureAdministration
Budget vs Expenditure Report as at 31 August 2013
PROGRAMME 1 ADMINISTRATION
Budget Adjusted Budget ExpenditurePercentage (Exp plus Com)
Available Budget
Current payments R'000 R'000 R'000 % R'000 Compensation of employees 68,100 68,100 23,629 35% 44,471 Goods and services 54,036 54,036 29,583 55% 24,453 Administrative Fees 42 42 22 52% 20 Advertising 2,555 2,555 2,731 107% (176) Catering 530 530 357 67% 173 Communication 2,486 2,486 1,263 51% 1,223 Contractors 2,346 2,346 471 20% 1,875 Consultants 1,240 1,240 308 25% 932 Audit Costs 4,153 4,153 1,945 47% 2,208 Training & Development 1,071 1,071 275 26% 796 Inventory 2,151 2,151 701 33% 1,450 Travel & Subsistence 10,431 10,431 6,953 67% 3,478 Operating Payments 1,090 1,090 196 18% 894 Venues & Faficlities 1,619 1,619 1,024 63% 595 Other 23,978 23,978 13,015 54% 10,963 Assets<R5000 344 344 1 0% 343 Total current payments 122,136 122,136 53,212 44% 68,924 Transfers and subsidies to: Machinery and equipment 2,171 2,171 236 11% 1,935 Total payments for capital assets 2,171 2,171 236 11% 1,935 Total 124,379 124,379 54,407 44% 69,972

SRSA
Total Budget vs ExpenditureSport Support Services
Budget vs Expenditure Report as at 31 August 2013
PROGRAMME 2 SPORT SUPPORT SERVICES
Budget ExpenditurePercentage (Exp
plus Com)Available Budget
Current payments R'000 R'000 % R'000 Compensation of employees 9,271 3,614 38.98% 5,657 Goods and services 46,084 6,568 14.25% 39,516 Advertising 270 254 94% 16 Catering 76 203 267% (127) Communication 963 88 9% 875 Contractors 28,852 3,965 14% 24,887 Consultants 1,881 - 0% 1,881 Training & Development 28 - 0% 28 Inventory 907 1,054 116% (147) Travel & Subsistence 8,561 968 11% 7,593 Operating Payments 187 24 13% 163 Venues & Faficlities 3,671 12 0% 3,659 Assets<R5000 688 - 0% 688 Total current payments 55,355 10,182 18% 45,173 Transfers and subsidies to: Departmental agencies and accounts 20,576 17,300 84% 3,276 Non-profit institutions 138,656 14,910 11% 123,746 Total Transfers and Subsidies
159,232 32,343 20% 126,889
Total 214,587 42,525 20% 172,062

SRSA
Total Budget vs Expenditure Mass Participation
Budget vs Expenditure Report as at 31 August 2013
PROGRAMME 3 MASS PARTICIPATION
Budget ExpenditurePercentage (Exp plus Com)
Available Budget
Current payments R'000 R'000 % R'000 Compensation of employees 16,160 3,122 19% 13,038 Goods and services 39,710 26,352 66% 13,358 Administrative Fees 45 - 0% 45 Advertising 1,813 1,626 90% 187 Catering 577 310 54% 267 Communication 442 90 20% 352 Contractors 1,379 1,255 91% 124 Training & Development 35 - 0% 35 Inventory 637 26 4% 611 Travel & Subsistence 12,586 2,052 16% 10,534 Operating Payments 512 216 42% 296 Venues & Faficlities 21,684 20,777 96% 907 Total current payments 55,870 29,474 1 26,396 Transfers and subsidies to: Provinces 497,591 169,148 34% 328,443 Total Transfers and Subsidies 497,591 169,148 34% 328,443
Total 553,461 198,622 36% 354,839

SRSA
Budget vs ExpenditureInternational Liaison & Major Events
Budget vs Expenditure Report as at 31 August 2013
PROGRAMME 4 INTERNATIONAL LIAISON & MAJOR EVENTS
Budget ExpenditurePercentage (Exp plus Com)
Available Budget
Current payments R'000 R'000 % R'000 Compensation of employees 3,375 878 26% 2,497 Goods and services 12,385 1,510 12% 10,875 Administrative Fees 673 - 0% 673 Advertising 1,673 - 0% 1,673 Catering 281 25 9% 256 Communication 558 25 5% 434 Contractors 1,068 170 15% 997 Training & Development 500 - 0% 500 Inventory 277 - 0% 277 Travel & Subsistence 3,907 751 19% 3,228 Operating Payments 1,095 29 0% 994 Venues & Faficlities 2,180 510 23% 1,670 Assets<R5000 173 - 0% 173 Total current payments 15,760 2,388 15% 13,372 Transfers and subsidies to: Municipalities 120,000 - 0% 120,000 Non-profit institutions 36,000 - 0% 36,000 Total Transfers and Subsidies 156,000 - 0% 156,000
Total 171,760 2,388 1% 169,372

SRSA
Budget vs ExpenditureFacilities
Budget vs Expenditure Report as at 31 August 2013
PROGRAMME 5 FACILITIES
Budget ExpenditurePercentage (Exp plus Com)
Available Budget
Current payments R'000 R'000 % R'000 Compensation of employees 2,419 1,001 41% 1,418 Goods and services 6,880 694 10% 6,186 Advertising 33 - 0% 33 Catering - 7 0% (7) Communication 192 9 5% 183 Contractors 5,026 416 8% 4,610 Inventory 31 (1) -3% 32 Travel & Subsistence 1,514 166 11% 1,348 Operating Payments 84 97 0% (13) Total current payments 9,299 1,695 18% 7,604 Total 9,299 1,695 18% 7,604
SRSA
Budget vs ExpenditureFacilities
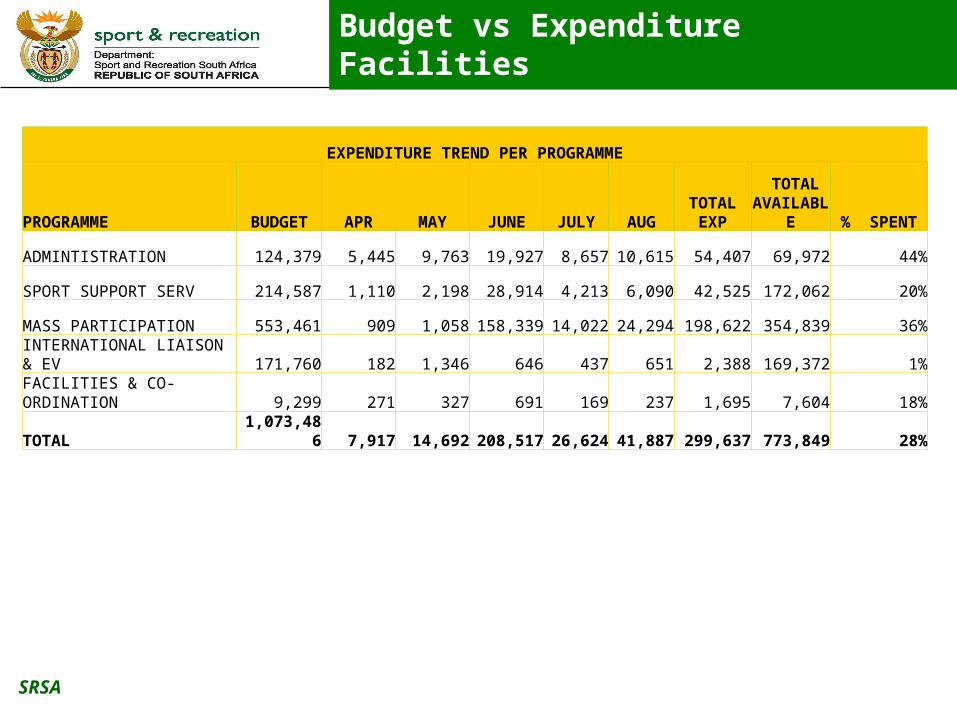
EXPENDITURE TREND PER PROGRAMME
PROGRAMME BUDGET APR MAY JUNE JULY AUG TOTAL EXP TOTAL
AVAILABLE % SPENT
ADMINTISTRATION 124,379 5,445 9,763 19,927 8,657 10,615 54,407 69,972 44%
SPORT SUPPORT SERV 214,587 1,110 2,198 28,914 4,213 6,090 42,525 172,062 20%
MASS PARTICIPATION 553,461 909 1,058 158,339 14,022 24,294 198,622 354,839 36%
INTERNATIONAL LIAISON & EV 171,760 182 1,346 646 437 651 2,388 169,372 1%
FACILITIES & CO-ORDINATION 9,299 271 327 691 169 237 1,695 7,604 18%
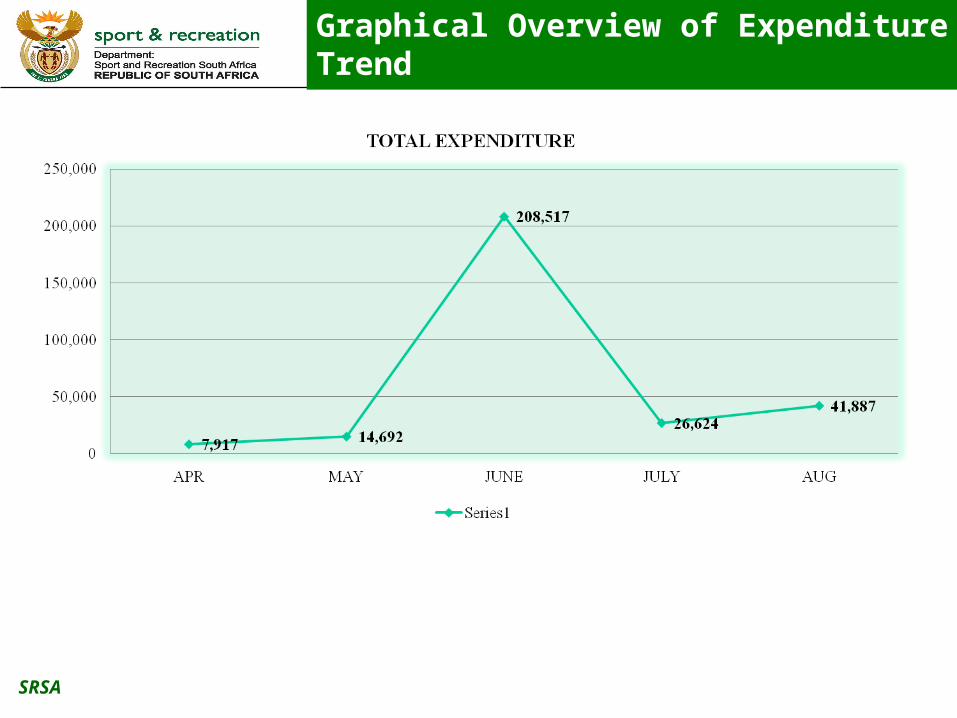
TOTAL 1,073,486 7,917 14,692 208,517 26,624 41,887 299,637 773,849 28%

SRSA
Budget vs ExpenditureFacilities
EXPENDITURE TREND PER PROGRAMME
PROGRAMME BUDGET APR MAY JUNE JULY AUG TOTAL EXP TOTAL
AVAILABLE % SPENT
ADMINTISTRATION 124,379 5,445 9,763 19,927 8,657 10,615 54,407 69,972 44%
SPORT SUPPORT SERV 214,587 1,110 2,198 28,914 4,213 6,090 42,525 172,062 20%
MASS PARTICIPATION 553,461 909 1,058 158,339 14,022 24,294 198,622 354,839 36%
INTERNATIONAL LIAISON & EV 171,760 182 1,346 646 437 651 2,388 169,372 1%
FACILITIES & CO-ORDINATION 9,299 271 327 691 169 237 1,695 7,604 18%
TOTAL 1,073,486 7,917 14,692 208,517 26,624 41,887 299,637 773,849 28%
SRSA
Graphical Overview of Expenditure Trend

SRSA
Budget vs ExpenditureFacilities
EXPENDITURE TREND PER ECONOMICATION CLASSIFICATION
PROGRAMME BUDGET APR MAY JUNE JULY AUG TOTAL EXP TOTAL
AVAILABLE % SPENT
COMPENSATION OF EMPLOEEYS 99,325 6,236 6,517 6,175 6,373 6,943 32,244 67,081 32%
GOODS & SERVICES 159,095 1,681 8,175 19,456 5,315 30,080 64,707 94,388 41%
TOTAL CURRENT PAYMENT 258,420 7,917 14,692 25,631 11,688 37,023 96,951 161,469 38%
PROVINCES 497,591 0 156051 13,097 0 169,148 328,443 34%
MUNICIPALITIES 120,000 0 120,000
DEPARTMENTAL AGENCIES & ACCOUNTS 20,648 0 17,325 17,325 3,323 84%
NON-PROFIT INSTITUTIONS 174,656 0 8910 1,000 5,000 14,910 159,746 9%
TOTAL TRANSERS & SUBSID 812,895 0 0 182,336 14,874 5,240 202,450 610,445 25%
MACHINERY AND EQUIPMENT 2,171 0 134 62 40 236 1,935 11%
TOTAL FOR CAPITAL ASSETS 2,171 0 0 134 62 40 236 1,935 11%
GRAND TOTAL 1,073,486 7,917 14,692 208,101 26,624 42,303 299,637 773,849 28%

SRSA
THANK YOU
Top Related