


Languages
Pages
Legal


Spray Performance of the High Pressure Air Inclusion
Nozzle Used in Japan
—— In the aspects of the relative spray drift and the influence ——
of key design parameters on spray performance
Geng Bai
Doctoral Program in Environmental Science and Technology
Graduate School of Science and Technology
Niigata University

I
Contents
Chapter 1 General introduction ............................................................................................................. 1
1.1. From pesticide to pesticide application ................................................................................. 1
1.1.1. Definition of pesticide ................................................................................................. 1
1.1.2. Development of pesticide ............................................................................................ 2
1.1.3. Advantages and disadvantages of pesticide application ............................................. 3
1.1.4. Category of pesticide .................................................................................................. 4
1.1.5. Word market of pesticide ............................................................................................. 7
1.2. Pesticide spray ...................................................................................................................... 8
1.2.1. Development of agricultural sprayers ........................................................................ 8
1.2.2. Spray nozzles ............................................................................................................. 10
1.3. Initial spray characteristics.................................................................................................. 10
1.3.1. Droplet size characteristics ....................................................................................... 10
1.3.2. Spray angle ............................................................................................................... 12
1.3.3. Amount of included air .............................................................................................. 12
1.3.4. Liquid flow rate ......................................................................................................... 13
1.4. Key design parameters of flat fan nozzle ............................................................................. 13
1.5. The spray drift ...................................................................................................................... 15
1.5.1. Definition of spray drift............................................................................................. 15
1.5.2. The mechanism of spray drift .................................................................................... 16
1.5.3. The potential hazard of spray drift ............................................................................ 16
1.5.4. The factors influence the spray drift ......................................................................... 17
1.5.5. Drift control methods ................................................................................................ 18
1.5.6. Spray drift estimation ................................................................................................ 18
1.5.7. The nozzle classification based on the spray drift..................................................... 20

II
1.6. Study objectives .................................................................................................................. 21
Chapter 2 Characteristics and classification of Japanese nozzles based on relative spray drift
potential .............................................................................................................................................. 22
Abstract ....................................................................................................................................... 22
2.1. Introduction .......................................................................................................................... 22
2.2. Materials and methods ......................................................................................................... 24
2.2.1. Wind tunnel parameters ............................................................................................ 24
2.2.2. Measurement ............................................................................................................. 26
2.2.3. Information on the investigated nozzles .................................................................... 26
2.2.4. Index calculation and nozzle drift classification ....................................................... 28
2.3. Results and discussion ......................................................................................................... 29
2.3.1. Effect of nozzle size ................................................................................................... 29
2.3.2. Effect of nozzle height ............................................................................................... 34
2.3.3. Effect of nozzle pressure ............................................................................................ 34
2.3.4. Drift classification .................................................................................................... 35
2.4. Conclusion ........................................................................................................................... 37
Chapter 3 The influence of design parameters on the initial spray characteristics of the high-pressure
air inclusion nozzle used in Japan ....................................................................................................... 38
Abstract ....................................................................................................................................... 38
3.1. Introduction .......................................................................................................................... 38
3.2. Material and methods ........................................................................................................... 41
3.2.1. Spray nozzles ............................................................................................................. 41
3.2.2. Measurement of droplet size characteristics, liquid flow rate and fan angle............ 44
3.2.3. Measurement of included air within droplets ............................................................ 46
3.3. Results and Discussion ........................................................................................................ 48
3.3.1. The influence of nozzle design parameters on the droplet size characteristics ......... 48
3.3.2. The influence of nozzle design parameters on the spray angle and liquid flow rate 54
3.3.3. The influence of nozzle design parameters on the quantity of the included air within
III
droplet ................................................................................................................................. 56
3.4. Conclusions .......................................................................................................................... 56
Chapter 4 The influence of the air inlet design on the spray performance of the air inclusion nozzle
used in Japan ....................................................................................................................................... 58
Abstract ....................................................................................................................................... 58
4.1. Introduction .......................................................................................................................... 59
4.2. Materials and methods ......................................................................................................... 61
4.2.1. Spray nozzles ............................................................................................................. 61
4.2.2. Measurement of included air within droplets ............................................................ 63
4.2.3. Measurement of droplet size characteristics ............................................................. 65
4.2.4. Measurement of spray angle ..................................................................................... 66
4.2.5. Measurement of coverage rate .................................................................................. 67
4.3. Results and Discussions ....................................................................................................... 68
4.3.1. Included air within droplets ...................................................................................... 68
4.3.2. Droplet characteristics and liquid flow rate ............................................................. 70
4.3.3. Spray angle ............................................................................................................... 71
4.3.4. Deposit weight and coverage rate............................................................................. 71
4.4. Conclusion ........................................................................................................................... 75
Chapter 5 Summary ............................................................................................................................ 76
5.1. Characteristics and classification of Japanese nozzles based on relative spray drift potential
76
5.2. The influence of nozzle parameters on the droplet size characteristics, spray angle, liquid
flow rate and included air within droplers for the high pressure air inclusion nozzle used in
Japan ........................................................................................................................................... 76
5.3. The influence of the air inlet design on the spray performance of the air inclusion nozzle
used in Japan ............................................................................................................................... 78
References ........................................................................................................................................... 79
Acknowledgments .............................................................................................................................. 83
IV
List of tables
Table 1 Percent reduction in yield of different agricultural products under different application plan
of pesticide .................................................................................................................................... 5
Table 2 Name and the corresponding functions of different categories of pesticide based on the type
of pest they control........................................................................................................................ 6
Table 3 Global pesticide expenditures and the amount of pesticide active ingredient used, 2006 and
2007 estimates (EPA, 2011) .......................................................................................................... 7
Table 4 Main equipment for pesticide application in Japan .................................................................. 9
Table 5 Overview of the investigated nozzle-pressure combinations and the environment parameters
in the measurement of the relative spray drift ............................................................................. 27
Table 6 Nozzle classification of ES series nozzles based on the relative drift potential ..................... 36
Table 7 Investigated design and working parameters included the nozzle tip areas, the diameter of
pre-orifice and the nozzle pressure ............................................................................................. 43
Table 8 Pre-test result of spray stability under all possible combinations of nozzle tip areas and
pre-orifice diameters ................................................................................................................... 45
Table 9 Droplet size characteristics under different combinations of pre-orifice diameter, nozzle tip
area and nozzle pressure with the average values from 5 repetitions and the corresponding
standard deviations (Part of the investigated data) ..................................................................... 51
Table 10 Values of correlation coefficients (R) obtained in the correlation analysis of droplet size
characteristics .............................................................................................................................. 53
Table 11 General information of the investigated nozzle, including the nozzle number, nozzle
pressure and the processing of the air inlet ................................................................................. 63
Table 12 Droplet size characteristics and the corresponding standard deviations of KIRINASHI ES
series nozzles (unsealed and sealed groups) under different nozzle number and pressure
combinations with the average values from 5 repetitions. ES5-1.0-U: KIRINASHI ES series
nozzles with the nozzle number of 5 and the nozzle pressure of 1.0MPa with unsealed air inlet;
ES5-1.0-S: KIRINASHI ES series nozzles with the nozzle number of 5 and the nozzle pressure
of 1.0MPa with sealed air inlet ................................................................................................... 72
V
List of figures
Figure 1 Comparison of coverage area between two groups of droplets with equivalent volume ..... 11
Figure 2 Illustration of the difference of coverage rates produced by small and big droplets ............ 11
Figure 3 Potential spray pattern of nozzles when the spray angle is too narrow at low nozzle height
.................................................................................................................................................... 12
Figure 4 Illustration of the good deposit performance of the droplet with included air produced by air
inclusion nozzle (Internet picture) .............................................................................................. 13
Figure 5 Photo and the corresponding structure view of the pre-orifice nozzle (SAVING series,
YAMAHO Company) used on boom sprayers in Japan ............................................................. 14
Figure 6 Photo and the corresponding structure view of the air inclusion nozzle (KIRINASHI ES
series, YAMAHO Company) used on boom sprayers in Japan................................................... 15
Figure 7 Sketch of the wind tunnel and the layout of the nozzle and polyethylene lines for the
measurement of the relative drift potential ................................................................................. 25
Figure 8 DIXRP values and standard deviations obtained under different nozzle-pressure
combinations of ES series nozzle for various nozzle heights ranging from 0.3 to 0.7 m for a
nozzle pressure of 1.00 MPa ....................................................................................................... 31
Figure 9 DIXRP values and standard deviations obtained under different nozzle-pressure
combinations for ES series nozzles and for different nozzle heights of from 0.3 to 0.7 m for a
nozzle pressure of 1.50 MPa ....................................................................................................... 32
Figure 10 DIXRP values and standard deviations obtained under different nozzle-pressure
combinations of ES series nozzle under various nozzle pressures of from 1.00 to 1.50 MPa for a
nozzle height of 0.30 m ............................................................................................................... 35
Figure 11 Design features of KIRINASHI ES series nozzles. The range of the pre-orifice diameter is
0.5 -1.1mm with a 0.1mm interval; the size of the air inlet and the diameter of the mixing throat
keep consistent; the corresponding range of the nozzle tip area is 0.57-2.19 mm2 ..................... 42
Figure 12 Sketch of the measurement of the spray liquid density ...................................................... 47
Figure 13 Accumulation percentage of the droplet volume (Part of the investigated data). The
notation 05-SR1A-1.0 means the measurement of the droplet size was carried out with a

VI
pre-orifice diameter of 0.5mm, a nozzle tip of SR1A with an area of 0.57mm2 and a nozzle
pressure of 1.0MPa ..................................................................................................................... 50
Figure 14 Design features of KIRINASHI ES series nozzles. The range of the pre-orifice diameter is
0.5 -1.1mm with a 0.1mm interval; the size of the air inlet and the diameter of the mixing throat
keep consistent; the corresponding range of the nozzle tip area is 0.57-2.19 mm2 ..................... 62
Figure 15 Sketch of the measurement of the spray liquid density. T&RH: a automatic
hygrothermograph used to record the air temperature and relative humidity ............................. 65
Figure 16 Sketch of the measurement of the spray coverage rate ....................................................... 67
Figure 17 Spray liquid density and the corresponding standard deviations of KIRINASHI ES series
nozzles (unsealed and sealed groups) under different nozzle number and pressure combinations.
ES5-1.0: KIRINASHI ES series nozzles with the nozzle number of 5 and the nozzle pressure of
1.0MPa ........................................................................................................................................ 69
Figure 18 Included air quantity and the corresponding standard deviations of KIRINASHI ES series
nozzles (unsealed and sealed groups) under different nozzle number and pressure combinations.
ES5-1.0: KIRINASHI ES series nozzles with the nozzle number of 5 and the nozzle pressure of
1.0MPa ........................................................................................................................................ 69
Figure 19 Volume median diameter (Dv0.5) and the corresponding standard deviations of
KIRINASHI ES series nozzles (unsealed and sealed groups) under different nozzle number and
pressure combinations. ES5-1.0: KIRINASHI ES series nozzles with the nozzle number of 5
and the nozzle pressure of 1.0MPa ............................................................................................. 70
Figure 20 Spray angle and the corresponding standard deviations of KIRINASHI ES series nozzles
(unsealed and sealed groups) under different nozzle number and pressure combinations.
ES5-1.0: KIRINASHI ES series nozzles with the nozzle number of 5 and the nozzle pressure of
1.0MPa ........................................................................................................................................ 73
Figure 21 Deposit weight of spray liquid and the corresponding standard deviations of KIRINASHI
ES series nozzles (unsealed and sealed groups) under different nozzle number and pressure
combinations. ES5-1.0: KIRINASHI ES series nozzles with the nozzle number of 5 and the
nozzle pressure of 1.0MPa .......................................................................................................... 73

VII
Figure 22 Coverage rate and the corresponding standard deviations of KIRINASHI ES series nozzles
(unsealed and sealed groups) under different nozzle number and pressure combinations.
ES5-1.0: KIRINASHI ES series nozzles with the nozzle number of 5 and the nozzle pressure of
1.0MPa ........................................................................................................................................ 74

1
Chapter 1 General introduction
Agricultural industry in the modern world highly depends on pesticide application.
However, the application not only brings us benefit but also suffering. A lot of health
and environmental issues occur due to pesticide application. Therefore, the spray
performance including spray drift control has been paid much attention. In this chapter,
the basic information of pesticide, pesticide usage, pesticide spray and also spray drift
were introduced. Therefore, a big picture of pesticide application could be drawn to get
better understanding to the study carried out in the thesis. The study objectives of the
thesis were also brought forward at the end of the chapter.
1.1. From pesticide to pesticide application
To understand the situation of pesticide application in the world, some basic information
from the definition of pesticide to the consumption of pesticide was introduced in this
section.
1.1.1. Definition of pesticide
Though different countries and regions may have their own definitions of pesticide, the
contents are similar. According to the Food and Agriculture Organization of the United
Nations (FAO, 2005), pesticide means any substance or mixture of substances intended
for preventing, destroying or controlling any pest, including vectors of human or animal
disease, unwanted species of plants or animals causing harm during or otherwise
interfering with the production, processing, storage, transport or marketing of food,
agricultural commodities, wood and wood products or animal feedstuffs, or substances

2
which may be administered to animals for the control of insects, arachnids or other pests
in or on their bodies. The term includes substances intended for use as a plant growth
regulator, defoliant, desiccant or agent for thinning fruit or preventing the premature fall
of fruit, and substances applied to crops either before or after harvest to protect the
commodity from deterioration during storage and transport.
1.1.2. Development of pesticide
Human beings are fighting with crop disease since ancient period for avoiding hunger
(Cremlyn, 1991). Theophrastus (300BC) described many plant diseases known today
such as scorch, rot scab, and rust. Until today, locusts cause vast food losses in the Near
East and Africa.
Human being uses their own methods to prevent the occurrence of the insects, fungi
and weeds, which are the main pests harmful to the agricultural products. Some record
could be found in ancient history of human being and only a few examples were given
as follows. Sulphur was used as one kind of fumigant before 1000BC by Homer.
Arsenic was used as an insecticide by Pliny (AD79) and also by the Chinese, who were
applying the moderate amount of arsenic compounds as insecticides. Careful
observation and large amounts of trial and error applications with patient may attribute
to the development of these early pesticide.
The application of the systematic scientific methods of controlling agricultural pests
has been carried out since the middle of the nineteenth century. The development of the
systematic research of pesticide has always been related to the development of modern
chemistry industry to a certain degree. The details of the development could be found in
the reference (Cremlyn, 1991). Nowadays, a pesticide industry with a complicated
system has been established.

3
In Japan, people are also confronting agriculture pest management since ancient time
(Science of pesticide, 2004). Based on the record, Japanese used whale oil and
rape-seed oil to create an oil film on the surface of the paddy field to kill the unwanted
insects by suffocation in 1670. The shifting of the development of pesticide science was
in the periods of Meiji (1868-1912) and Taisho (1912-1926) eras. During these periods,
the new science and technology from Western Europe was introduced into Japan. In
1921, with the successful development of the chloropicrin by the domestic manufacturer,
the systematic research of pesticide and the pesticide industry in Japan was initiated.
Until 1955, the introduced pesticide from overseas were the main pesticide being used
in Japan. After that, different kinds of new pesticide developed by research institutes
were registered and entered the domestic market. After the popularization of these
pesticide in the domestic market, the international market share of the pesticide
manufactured in Japan also increased.
1.1.3. Advantages and disadvantages of pesticide application
From the definition, it could be generally understood that the application of the
pesticide in agriculture sector can increase the yielding and quality of the agricultural
products without heavy work, comparing with the pest management works without
pesticide. To better illustrate this benefit, the investigation result of the crop yielding
between using and without using pesticide was shown in Table 1 (Knutson, 1999). The
result shows that the yielding of the agricultural products experienced a sharp decrease
when no pesticide was applied. Besides, the broader the group of pesticide eliminated,
the greater the yield impacts. In addition, comparing with fruits and vegetables, the field
crops are relatively more independent on pesticide. And differences of yielding
reduction were found among different agricultural products. In the region where had
high humidity without hard frost, the yielding of the agricultural products are more

4
depend on pesticide. With the application of the herbicides in paddy field from 1949 to
1997, a rapid decrease of the labor time for weeding was observed (Japan Association
for Advancement of Phyto-Regulators).
Despite of the obvious benefit of pesticide application, it should be mentioned that lots
of health and environmental issues caused by pesticide application were also found. One
part of the pesticide deposits on the wanted target may lead to the issue of pesticide
residues. The untargeted pesticide enters the environment include soil, water,
atmosphere, which may lead to pollution or contamination at different places
(Kanazawa, 1992). Therefore, the combination of the development of low-toxic or
biopesticide and the new application technology which causes less untargeted pesticide
residues could possibly contribute to solve the serious problem.
1.1.4. Category of pesticide
Generally, the pesticide could be divided into several categories based on the type of
pest they control, the chemical structure, the physical state and also the toxicity. Usually,
the classification method based on the type of pest they control is used. Table 2 shows
the name and the corresponding functions of different categories of pesticide based on
the type of pest they control (Science of pesticide, 2004; Agricultural pharmacology,
2003).

5
Table 1 Percent reduction in yield of different agricultural products under different application plan
of pesticide
Crop 1990 1993 1999
No
pesticide
No
herbicides
No
insecticides
and no
fungicides
No
pesticide
50%
reduction
No
organophosphates
and no
carbamates
Corn 32 30 5 4
Cotton 39 17 26 14
Peanuts 78 29 66 9
Rice 57 53 16 8
Soybeans 37 35 3 5
Wheat 24 23 4 1
Apples 100 43 38
Carrots 7
Grapes 89 57 9
Lettuce 67 47
Onions 64 48
Oranges 55 28 3
Peaches 81 59 2
Potatoes 57 27 3
Tomatoes 77 38 15

6
Table 2 Name and the corresponding functions of different categories of pesticide based on the type
of pest they control
Macro classification Category name Function
Insects control agent
(I) Insecticides Kill insects and other arthropods
Vermin control agent
(V)
Miticides Kill mites that feed on plants and animals
Nematicides Kill nematodes (microscopic, worm-like organisms
that feed on plant roots)
Rodenticides Control mice and other rodents
Disease control agent
(D) Disinfectants
Kill or inactivate disease-producing microorganisms
on inanimate objects
Weed control agent
(W) Herbicides
Kill weeds and other plants that grow where they are
not wanted
(I)+(D) a Insect-fungicide Mixture of disinfectants and insecticides
Plant growth
regulators (P)
Plant growth
regulators
Substances (excluding fertilizers or other plant
nutrients) that alter the expected growth, flowering,
or reproduction rate of plants
(I)+(V) Repellents Repel pests, including insects (such as mosquitoes)
and birds
(I)+(V) Attractants
Attract pests (for example, to lure an insect or rodent
to a trap). (However, food is not considered a
pesticide when used as an attractant.)
No corresponding
category Spreader or adjuvant
b
Improve the attachment result of pesticide on the
body of unwanted insect and the surface of the plant
when less volume of pesticide is applied
a (I)+(D) means the insect-fungicide could work as either insects control and disease control agents.
b In some references, spreader or adjuvant are not considered as one category of pesticide because
they are not themselves active in kill pests.

7
1.1.5. Word market of pesticide
As shown in Table 1, the modern agricultural industry all over the world became highly
dependent on pesticide application because of its advantages of increasing yielding and
also of saving working hours. In current market economy, the application of pesticide
often means the increase of the income, which is vital to farmers. Therefore, a huge
market of pesticide has been formed since pesticide was invented. Table 3 shows the
global pesticide expenditures and the amount of pesticide active ingredient used (United
States Environmental Protection Agency (EPA), 2011).
Table 3 Global pesticide expenditures and the amount of pesticide active ingredient used, 2006 and
2007 estimates (EPA, 2011)
Year and
pesticide type
Millions of
dollar
% Millions of
metric ton
%
2006
Herbicides 12247 40 0.916 39
Insecticides 10259 29 0.434 18
Fungicides 7987 22 0.236 10
Other 3320 9 0.774 33
Total 35814 100 2.359 100
2007
Herbicides 15512 39 0.952 40
Insecticides 11158 28 0.405 17
Fungicides 9216 23 0.235 10
Other 3557 9 0.774 33
Total 39443 100 2.366 100
8
1.2. Pesticide spray
1.2.1. Development of agricultural sprayers
Nowadays, agricultural sprayers are the most widely used equipment to carry out
pesticide application. Several kinds of sprayers have been developed from
hand-operated, hydraulic sprayer to boom/speed sprayer or aircraft sprayer with the
development of the agricultural engineering. Normally, the spray efficiency, which
usually be estimated by cost-income of agricultural industry, increases from
hand-operated sprayer with low application rate, small coverage area in a certain time
interval and low travel speed to large-scale sprayers which could apply pesticide with
much higher application rate, bigger coverage area in a certain time interval and also
higher travel speed.
Based on the internet information, horse-drawn traction sprayer was firstly invented in
1887. Since then, many industry productions were applied on the sprayers and were
improved for specific goals of pesticide application later, such as gasoline engines
(1900), pressure regulator and air chamber for smooth and continuous spray (1911),
attachments for water injection and low pressure, low volume sprayers (1944), etc.
Similarly, other kinds of agricultural sprayers has been highly mechanized and
automated to a certain degree by introducing the new products of industry community
into the agricultural sprayer manufacture.
To carry out efficient spray works, many kinds of sprayers have been developed by
domestic manufactures in Japan (Miyahara, 2013). Table 4 shows the main sprayer
types which are currently used in Japan. Because of the limited area of the agriculture
field, no large-scale aircraft sprayer is used in Japan based on literature. Therefore, the

9
boom sprayer and the speed sprayer might be the most efficient sprayer for large-scale
field crop and vertical target, respectively. In these years, the sales of the two kinds of
sprayers were about 2500/year.
Table 4 Main equipment for pesticide application in Japan
Formulation Working style
/Situation Application equipment
Ground Application
Liquid
Walking
Manual sprayer (knapsack type, etc.)
Power sprayer (knapsack type, portable,
self-propelled)
Riding Boom sprayer (tractor mounted, self-propelled), Air
blast sprayer
in Orchard Sprinkler
in Green house
Power sprayer (portable, self-propelled/motor
driven),
Cold fogger
by RC helicopter Low volume sprayer unit
Granule
Walking Manual applicator (hanging type, knapsack type)
Power applicator (knapsack type, self-propelled)
Riding
Power applicator (self-propelled/boom type blow
head)
Rice transplanter attachment type applicator unit
by RC helicopter Granule applicator unit
Dust Walking Manual duster (hanging type, knapsack type)
Power duster (knapsack type, tractor mounted)
Smoke in Green house Smoking machine
Aerial Application
Liquid by Manned helicopter Low/Ultra-low volume sprayer unit
Granule by Manned helicopter Granule applicator unit

10
1.2.2. Spray nozzles
Several kinds of nozzles have been developed for application of different kinds of
pesticide on different sprayers. There are two main nozzle types including flat fan type
and cone type. The flat fan nozzles are widely used on boom sprayers while cone
nozzles are usually used on hand-operated sprayers and orchard sprayers.
For flat fan nozzles, a very uniform distribution of spray could be achieved by the
overlap of the individual application patterns along the boom. This is one main reason
to use flat fan nozzles on the boom sprayers. There are several subdivisions among the
flat fan nozzles which includes conventional flat fan nozzle, pre-orifice flat fan nozzle
and air inclusion nozzle.
The biggest difference among the three kinds of flat fan nozzles is the droplet size.
Generally, the biggest droplet size is produced by the air inclusion nozzle, followed by
pre-orifice flat fan nozzle and the conventional flat fan nozzle. In addition, the
manufactures acclaim that the air inclusion nozzle could produce included air within
droplet which results in a better deposition result than pure water droplet.
1.3. Initial spray characteristics
Initial spray characteristics include droplet size characteristics, spray angle, amount of
include air and also the liquid flow rate. These characteristics influence the spray
performance which is vital for pesticide spray.
1.3.1. Droplet size characteristics
The droplet size is a very important parameter related to the spray drift and the spray

11
coverage rate. Keeping the total application volume unchanged, smaller droplets which
have more number of droplets have higher coverage rate than that of larger droplets
with small number of droplets (Fig. 1 and 2). However, the smaller droplets have longer
drift distance than bigger droplets due to the ballistic theory of droplet movement.
Therefore, more spray drift might be produced when small droplets are sprayed.
Figure 1 Comparison of coverage area between two groups of droplets with equivalent volume
Figure 2 Illustration of the difference of coverage rates produced by small and big droplets

12
1.3.2. Spray angle
The spray angle means the angle between the two edges of the spray sheet along the
major axis of the spray pattern. For the boom sprayer, the combined spray pattern of the
nozzles might be uneven when the spray angle is too narrow at low nozzle height (Fig.
3).
1.3.3. Amount of included air
Almost all the manufactures claim that the air inclusion nozzle could produce droplets
with included air within it which improve the deposit efficiency of the droplets (Fig. 4).
However, no solid data was provided to investigate the independent influence of the
included air within droplets on important spray performance indicators, such as
coverage rate.
Figure 3 Potential spray pattern of nozzles when the spray angle is too narrow at low nozzle height

13
1.3.4. Liquid flow rate
Liquid flow rate of the individual nozzle has strong effect on the forward speed of the
boom sprayer. Therefore, it might decide the working time of pesticide application when
spray drift level is acceptable at higher forward speed. A shorter working time means
lower labor cost and energy consumption.
1.4. Key design parameters of flat fan nozzle
For the conventional flat fan nozzle, the only orifice at the end of the liquid passage
controls all the initial spray characteristics. For the pre-orifice type, a pre-orifice was
inserted right before the conventional orifice to decreases the nozzle pressure and
control the liquid flow rate (Fig. 5). Therefore, coarser droplet size could be produced
due to the reduced nozzle pressure.
Figure 4 Illustration of the good deposit performance of the droplet with included air
produced by air inclusion nozzle (Internet picture)

14
Comparing with the conventional and pre-orifice flat fan nozzles, air inclusion nozzle
is the most complicated nozzle (Fig. 6). A pre-orifice is set to control the liquid flow
rate. In addition, an air inlet is set right below the pre-orifice to induce the air into the
liquid passage. A nozzle tip was assembled at the end of the liquid passage. Therefore,
the key parameters for the air inclusion nozzle include the pre-orifice, the air inlet and
the nozzle tip. The influence of the parameters on the initial spray characteristics will be
discussed in details in Chapter 3 and 4.
Figure 5 Photo and the corresponding structure view of the pre-orifice nozzle (SAVING
series, YAMAHO Company) used on boom sprayers in Japan

15
1.5. The spray drift
Nowadays, spray drift produced by the pesticide spray has caused much attention since
1970s in many developed countries or regions. To understand the reason why spray drift
should be controlled, the definition, mechanism and the potential hazard of the spray
drift should be understood. In addition, the influence factors of spray drift are also
necessary to understood for carry out spray drift control. The information was already
concluded by public institutes. Therefore, the relative materials were used as a brief
introduction.
1.5.1. Definition of spray drift
Spray drift of pesticide is defined as the physical movement of a pesticide through air at
the time of application or soon thereafter, to any site other than that intended for
application (often referred to as off-target). The movement of pesticide to off-target site
caused by erosion, migration, volatility, or contaminated soil particles that are
Figure 6 Photo and the corresponding structure view of the air inclusion nozzle (KIRINASHI
ES series, YAMAHO Company) used on boom sprayers in Japan

16
windblown after application are not included, unless specifically addressed on a
pesticide product label with respect to drift control requirements (EPA).
1.5.2. The mechanism of spray drift
Different sizes of pesticide droplets are produced by sprayers. Compared with big
droplets, the small droplets are earlier to move with the wind. When the droplets are
sprayed out from sprayers, bigger droplets tend to deposit at the location close to the
sprayer while the smaller ones tend to deposit at the location relatively far from the
sprayer. A part of the small droplets evaporated before they deposit (Japan Plant
Protection Association, 2010).
1.5.3. The potential hazard of spray drift
The spray drift could lead to the uncomfortable feelings or even health problems of
nearby residents, contamination of nearby crops and mixture with nearby public water
resources. And some examples were introduced as fellow (Japan Plant Protection
Association, 2010):
For the influence on the nearby residents, the nasty smell and the deposit of pesticide
on washed clothes on utensils are always complained. In recent years, the requests to
considerate the anaphylaxis of chemical substance has been brought forward by nearby
residents. It is also necessary to consider the spray drift which has potential to deposit
on the people and vehicles passing by. The guidance announcement of pesticide
application near residential block must be followed.
For the risk of the contamination of nearby crops, more and more people have realized

17
the problem caused by spray drift after the positive list system for pesticide residues
was introduced. The system for pesticide residues, as part of a revision of the Food
Sanitation Law, was enacted in May 2006, in which the uniform criterion of 0.01 mg/kg
as the maximum residue limit for pesticide residues was set for the first time (Mizukami
et al., 2012).
If large amount of spray drift enters into the nearby public water resources, it will not
only lead to the water contamination but also has bad influence on the fish and shellfish.
It should be noticed that the pesticide residues limitation has also been set for the fish
and shellfish, especially when high-toxic pesticide is sprayed near the water resources.
Regardless of the pesticide category, the spray should be paid attention when spraying
near drinking water sources. It is also important to pay attention when spraying
pesticide near mulberry fields and the region of beekeeping.
1.5.4. The factors influence the spray drift
The property of the pesticide, the type of the spray system, operation parameters and the
environmental conditions are the main factors which could potentially cause the
problem by spray drift (Japan Plant Protection Association, 2010). According to the
examples of problem mentioned in the last section, the corresponding suggestions were
provided to users.
Although there are lots of specific situations need to be paid attention to avoid the
problems caused by spray drift, one of the most direct and fundamental method is to
decrease the quantity of the spray drift itself. The main factors that influence the risk of
drift from boom sprayers are the droplet size characteristics, nozzle height, wind speed,
the forward speed and the variables relating to the mounting of the nozzles on the boom
(Miller et al., 2011).
18
1.5.5. Drift control methods
From the last section, it could be known that the drift control can be achieved by
controlling the main factors which influence the spray drift for boom sprayers. For
common pesticide application, spraying under low wind speed, using appropriate nozzle
and working pressure, spraying appropriate volume are encouraged (Japan Plant
Protection Association, 2010).
1.5.6. Spray drift estimation
Droplet size measurement, measurement of the relative spray drift in the wind tunnel
and real spray drift measurement in the field have been used to estimate the drift
reduction ability of the nozzle or the whole boom sprayer. Many relative researches
were carried out and a comprehensive review was done by Nuyttens (2007). The main
advantages and disadvantages of the methods were concluded as follows:
The reason why the droplet size measurement could be used to estimate the spray drift
is because that the strong relationship was found between the volume proportion with
the small droplets accounts and the drift reduction ability. Comparing with other two
methods, the advantages of the method includes its maturity, high speed and also low
labor cost. However, the influence of the nozzle height, which was mentioned as one of
the most important factors influence the spray drift reduction ability, could not be
investigated by droplet size measurement.
Comparing with the droplet size measurement, the measurement of the relative spray
drift in the wind tunnel could investigate the influence of the nozzle height on the spray
19
drift reduction ability. In addition, the method could be considered as a cost-saving
method when compared with the field measurement of real spray drift. It should be also
mentioned that the method could only obtain the relative result of spray drift reduction
ability.
On one hand, the real spray drift measurement requires high cost and the repeatability
of the measurement decreases due to the variation of the environment parameter during
the experiment. On another hand, this method could estimate the spray drift reduction
ability of the whole boom sprayer.
In Japan, the experiment of spray drift on boom sprayer was carried out as a part of a
3-year project which developed new spray technologies with low spray drift, such as the
development of the new nozzles which could produces large droplets (Japan Plant
Protection Association, 2004-2006). Since 2004, adequate field experiments of spray
drift measurement were carried out. For boom sprayer, spray drift produced by the
conventional and new nozzles was investigated.
In 2004, one kind of pre-orifice flat fan nozzle (SAVING series, YAMAHO Company)
was proved to have better drift reduction ability while keeping similar result of pest
control (Japan Plant Protection Association, 2004). In addition, one kind of new boom
sprayer under development was also investigated (Japan Plant Protection Association,
2004). The result shows that the new boom sprayer had potential to reduce a large
amount of spray drift.
In 2005, the performance of the nozzle which produce large droplet was investigated.
The main performance investigated included deposit characteristics, pest control ability
and drift reduction ability. For boom sprayer, the performance of the two new developed
nozzles was investigated in cabbage field. The result showed that the new nozzles had

20
much better drift reduction ability while had similar pest control result, comparing with
the conventional nozzles (Japan Plant Protection Association, 2005).
The experiment carried out in Japan focused on the field test and also the droplet size
measurement. The field test could estimate the situation of real spray drift and obtain
the real performance of the pest control ability, which means that the result is relatively
convincing. However, there are also some disadvantages for the field measurement. The
cost of the field test is extremely high in Japan and the results could vary due to the
unstable environment parameters during the test. If the categories of the nozzle series
increase in the future, it might be difficult to test the performance of every new nozzle
by the field test. In addition, it is also very difficult to test the performance of new
nozzles on different types/brands of boom sprayers under different environment
parameters.
1.5.7. The nozzle classification based on the spray drift
Wind tunnel test was introduced to compare the drift reduction ability among different
nozzle systems without the influence of other parameters of the boom sprayer on the
drift reduction ability. The advantages of this method also include the relatively high
repeatability, time-saving and the possibility of investigating the nozzle height effect,
comparing with the above field test and the droplet size measurement. Therefore, useful
information could be obtained by the wind tunnel method, such as the classification of
nozzles based on the spray drift and the influence of nozzle parameters on the spray
drift (Donkersley and Nuyttens, 2011; Herbst, 2001; Nuyttens et al., 2011; Qi et al.,
2008; Southcombe et al., 1997; Taylor et al., 2004).

21
1.6. Study objectives
To obtain a better understanding of the performance of the drift reduction nozzle used in
Japan, the study objective of this thesis are: to (1) fill in the gap of the relative spray
drift measurement of drift reduction nozzles used in Japan by wind tunnel method; and
(2) investigate the influence of key design parameters of drift reduction nozzles used in
Japan on initial spray characteristics.
22
Chapter 2 Characteristics and classification of Japanese nozzles based
on relative spray drift potential
Abstract
European spray nozzle drift classifications have enabled the objective evaluation of the
drift reduction performance of different nozzles with various operating parameters
available in certain areas. The drift potential index reduction percentage (DIXRP) for
one series of drift reduction nozzles used in Japan was investigated by wind tunnel tests.
Based on the reference spray (Hypro ISO F110 03), most of the YAMAHO KIRINASHI
ES nozzles had DIXRP values above 50% at nozzle heights from 0.3 m to 0.5 m, which
means these nozzles can be considered as drift reduction nozzles. The best nozzle height
range was found to be between 0.3 m and 0.4 m above the crop canopy. In addition, the
DIXRP values were above 80% for a nozzle height of 0.3 m, except for one nozzle (the
ES 05). Its smallest droplet size and low liquid flow rate could contribute to the large
decrease in the DIXRP values for this nozzle size when nozzle pressure increased. Large
droplet diameter, high droplet velocity and low recommended nozzle height are
considered to be important factors that can provide good drift reduction performance
although droplet velocity was not measured in this study. The DIXRP value was
inversely proportional to nozzle height. In addition, the influence of nozzle size on the
DIXRP values was found to be statistically significant (**P < 0.01), although the
influence was not as obvious as that of nozzle height. Finally, a nozzle classification
system for use in Japan based on the relative drift potential has been established.
2.1. Introduction
Spray drift from agricultural sprayers has attracted a great deal of attention in Japan

23
because of its influence on neighboring residents, pollution of nearby crops, and
contamination of adjacent water bodies (Japan Plant Protection Association, 2010).
Boom sprayers are often used in field agriculture, and spray drift produced by boom
sprayers is a potential pollution source (Miller and Butler Ellis, 2000; Kennedy et al.,
2012). The construction and working parameters of spray nozzles are the main factors
that influence spray drift from boom sprayers. Droplet size characteristics can be
considered as an important factor related to spray drift (Taylor et al., 2004), and the
effects of nozzle type, size and pressure on spray droplet size characteristics have been
investigated (Nuyttens et al., 2007). In addition, the influence of nozzle type and size on
relative spray drift potential was also found to be statistically significant (Nuyttens et al.,
2009). Besides, droplet size distribution and nozzle height were investigated as two of
the most important factors that influenced the spray drift from boom sprayers (Carlsen
et al., 2006; Baetens et al., 2009; Miller et al., 2011). Therefore, air-inclusion nozzles
that produce relatively larger droplet sizes have been developed to control spray drift in
Japan, and these nozzles are commercially available (Japan Plant Protection Association,
2009). Drift reduction performance of the nozzles developed was evaluated qualitatively
(Kubota et al., 2010). This type of nozzle now accounts for a substantial percentage of
new agricultural nozzle sales in the UK (Miller et al., 2011). Recently, the demand for
air inclusion nozzles in Japan has been increasing in the market (Miyahara, 2012).
The measurement of relative drift potential of drift reduction nozzles through wind
tunnel tests was introduced in order to evaluate the drift reduction performance of the
nozzles investigated (Herbst, 2001; Southcombe et al., 1997). The wind tunnel method
has been proven to be a valuable alternative to field measurement of drift potential for
evaluating the drift reduction performance of the spray nozzles (Nuyttens et al., 2011).
Compared to field drift experiments, which can evaluate the drift reduction performance
of the entire spray system, wind tunnel tests provide a repeatable and economical way to
measure relative drift reduction potential of different nozzle types, sizes, pressures,

24
heights and air speeds. This means that this method can consider not only the droplet
size distribution but also important working parameters of nozzles (Taylor et al., 2004;
Donkersley and Nuyttens, 2011). Wind tunnel tests have also been applied to drift
classifications of nozzles (Southcombe et al., 1997; Herbst, 2001; Qi et al., 2008;
Nuyttens et al., 2011) and an international standard for the wind tunnel measurement of
the spray drift potential has been established (ISO 22856, 2008).
Due to the higher nozzle pressures (above 1.0 MPa) used in Japan, droplet size
distribution, droplet velocity and nozzle height were assumed to differ from those of
European nozzles, which are operated at lower pressures (usually below 0.5 MPa).
Therefore, the drift reduction performance might also be different from that produced
by lower pressure nozzles.
The objectives of the present study were (1) the measurement of relative spray
potential for one series of Japanese drift reduction nozzles under different working
parameters by the wind tunnel method and estimation of the drift reduction performance
by comparison with the internationally accepted reference spray, (2) to investigate the
influence of nozzle size, pressure and height on the drift reduction performance of this
series of nozzles, and (3) to establish a nozzle classification system for drift reduction
nozzles used in Japan.
2.2. Materials and methods
2.2.1. Wind tunnel parameters
The present study was carried out in the Bio-oriented Technology Research
Advancement Institution (BRAIN), Saitama City, Japan. A sketch of the wind tunnel
used in the present study is presented (Fig. 7). In this study, we did not adopt the

25
horizontal deposit but focused on the vertical deposit at 2 m downwind of the wind
tunnel because the length of the wind tunnel was not great enough for the horizontal
deposit measurement according to the ISO standard (ISO 22856, 2008). The working
section of the tunnel of the present study was from 0.3 m to 1.2 m above the tunnel floor
at a location of 0–2 m downwind from the nozzle. The height of the lowest sampling
line was set to be 0.3 m above tunnel floor for preventing droplet splash from the floor
because there was no artificial turf on the floor and this gave an acceptable wind speed
distribution for drift test. Owing to the various nozzle heights used in the field, the
upper limitation of the nozzle height was set to be 1.2m.
Figure 7 Sketch of the wind tunnel and the layout of the nozzle and polyethylene lines for the
measurement of the relative drift potential
The wind tunnel produced a uniform flow with an average airspeed in the range from
0 to 5 m/s. In the present study, a wind speed of 2 m/s was applied in order to simulate
the forward moving speed of a boom sprayer with a speed of 8 km/h (Nuyttens et al.,
2009). In addition, other measurement results were found to be the most similar for the
wind tunnel test when air speed was between 2.0 and 2.5 m/s (Parkin and Wheeler,
1996). According to the ISO standard (ISO 22856, 2008), the measurement of airflow
parameters was performed using a three-cup anemometer, and the degree of turbulence

26
and the local variability of air velocity were below 5% and 8% at 2 m downwind from
the nozzle for nozzle heights of 0.3 and 1.2 m, respectively. An electronic pressure
monitor and an electronic switch were installed directly above the investigated nozzle.
In addition, one hygrothermograph was installed approximately 20 cm above the nozzle.
2.2.2. Measurement
In order to simultaneously obtain vertical deposits from nozzles with various working
parameters, the nozzles were installed 1.2 m above the floor, and 10 polyethylene lines
(V1–V10), with a diameter of 2 mm, were placed horizontally across the wind tunnel 2
m downwind from the nozzle at heights from 0.3 m to 1.2 m at 0.1 m intervals. A tracer
(Sodium fluorescein, liquid type, 0.02%, w/w) and a non-ionic surfactant (Tween 20,
0.1%, w/w) were used in the present study. The non-ionic surfactant was used to
simulate the real condition when the pesticide was applied. An Excel spreadsheet (Fritz
et al., 2011) was used for recording and calculating the calibration equation between the
relative fluorescence and the dye concentration. After spraying, the polyethylene lines
were washed using 0.1 L of deionized water, and the liquid was collected in order to
measure the tracer concentration. The deposit volume at one collector, v(i), was then
obtained by the calibration equation.
2.2.3. Information on the investigated nozzles
The nozzle information and relative environmental parameters of the nozzles
investigated in the present study are shown in Table 5.
27
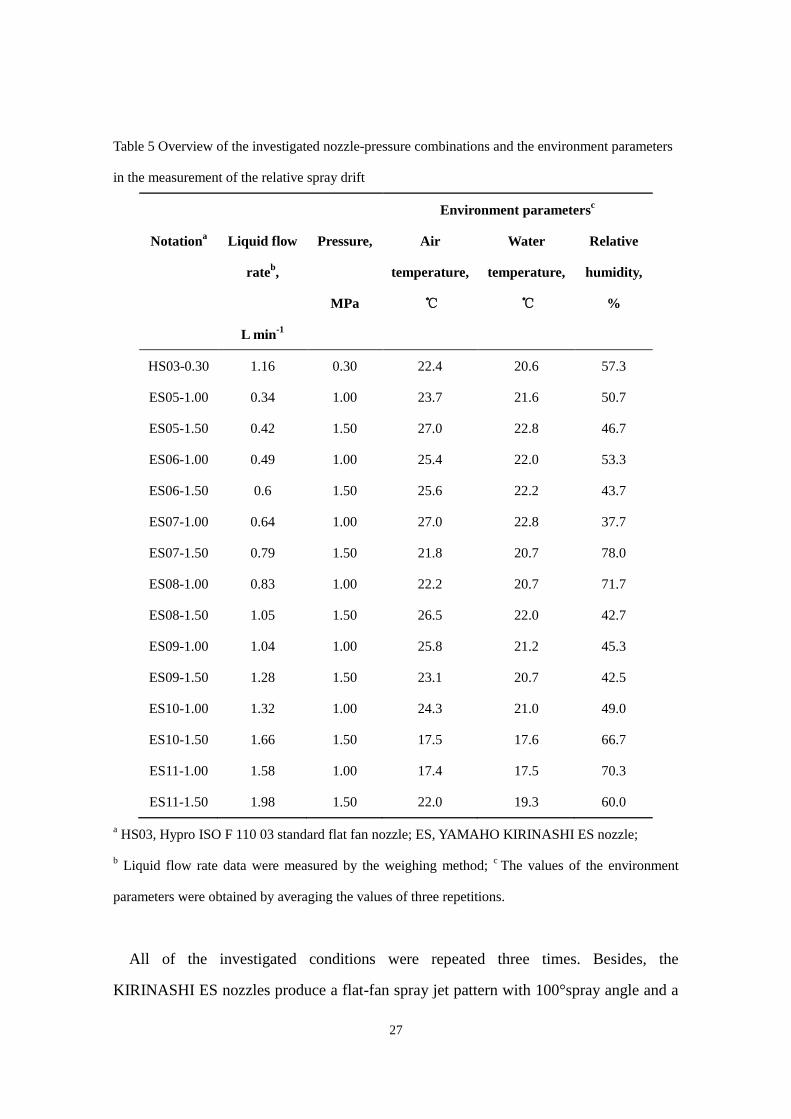
Table 5 Overview of the investigated nozzle-pressure combinations and the environment parameters
in the measurement of the relative spray drift
Environment parametersc
Notationa Liquid flow
rateb,
L min-1
Pressure,
MPa
Air
temperature,
℃
Water
temperature,
℃
Relative
humidity,
%
HS03-0.30 1.16 0.30 22.4 20.6 57.3
ES05-1.00 0.34 1.00 23.7 21.6 50.7
ES05-1.50 0.42 1.50 27.0 22.8 46.7
ES06-1.00 0.49 1.00 25.4 22.0 53.3
ES06-1.50 0.6 1.50 25.6 22.2 43.7
ES07-1.00 0.64 1.00 27.0 22.8 37.7
ES07-1.50 0.79 1.50 21.8 20.7 78.0
ES08-1.00 0.83 1.00 22.2 20.7 71.7
ES08-1.50 1.05 1.50 26.5 22.0 42.7
ES09-1.00 1.04 1.00 25.8 21.2 45.3
ES09-1.50 1.28 1.50 23.1 20.7 42.5
ES10-1.00 1.32 1.00 24.3 21.0 49.0
ES10-1.50 1.66 1.50 17.5 17.6 66.7
ES11-1.00 1.58 1.00 17.4 17.5 70.3
ES11-1.50 1.98 1.50 22.0 19.3 60.0
a HS03, Hypro ISO F 110 03 standard flat fan nozzle; ES, YAMAHO KIRINASHI ES nozzle;
b Liquid flow rate data were measured by the weighing method;
c The values of the environment
parameters were obtained by averaging the values of three repetitions.
All of the investigated conditions were repeated three times. Besides, the
KIRINASHI ES nozzles produce a flat-fan spray jet pattern with 100°spray angle and a
28
spacing of 0.3 m between nozzles on boom sprayers. And the nozzles investigated have
been widely used as drift reduction nozzles in Japan, especially in the Hokkaido region
(Miyahara, 2012). A Hypro ISO F 110 03 standard flat fan nozzle with a nozzle pressure
of 0.3 MPa at a nozzle height of 0.5 m was used as the reference spray following the
ISO standard (ISO 22856, 2008). The spray time for the nozzle-pressure combinations
was 10 s when liquid flow rate was above 0.8 L/min and was 20 s for the other
combinations.
2.2.4. Index calculation and nozzle drift classification
In the present study, the DIXRP value was calculated in order to estimate the drift
reduction performance of the investigated nozzle-pressure combinations. The DIX
method considered not only the total deposit volume and the weight of the collection
height, but also the relationship between the data from wind tunnel test and those from
the field test by introducing two parameters (Herbst, 2001). Additionally, RP (Reduction
Percentage) was adopted because its value was easy to understand based on the drift
reduction performance (Nuyttens et al., 2009). The drift potential index reduction
percentage (DIXRP), which is a combination of the reduction percentage and the DIX,
were obtained as follows:
N
n
i
i
V
ziv
V
1
)(
(1)
n
i
i
n
i
ii
ziv
zziv
h
1
1
)(
)(
(2)
%100
)(78.088.0
78.088.078.088.0
rsrs
isisrsrs
Vh
VhVhDIXRP (3)
where V: the relative drift potential volume; v(i): the deposit volume at one collector;
29
△zi: the representative height interval of one collector; VN: the nozzle output; h: the
characteristic height of the drift potential cloud; zi: the collector height; hrs: the
characteristic height of the drift potential cloud of the reference spray; Vrs: the relative
drift potential volume of the reference spray; his: the characteristic height of the drift
potential cloud of the investigated spray; Vis: the relative drift potential volume of the
investigated spray.
In the calculation process, the nozzle height was 0.5 m for the reference spray, while
the nozzle heights were 0.3 m, 0.4 m, 0.5 m, 0.7 m and 0.9 m for ES series nozzles. This
allowed the influence of nozzle height on DIXRP values to be investigated. The virtual
floors (h = 0 m) in the index calculation were assumed to be 0.2 m, 0.4 m and 0.6 m
above the floor of the wind tunnel corresponding to the respective nozzle heights. Thus,
the nozzle heights, which were equal to the vertical distance between the nozzle and the
lowest polyethylene line, were 0.9 m, 0.7 m and 0.5 m. The nozzle drift classification
for nozzle-pressure combinations investigated was carried out by following the methods
adopted by the former Federal Biological Research Centre for Agriculture and Forestry
(BBA, Germany) (Herbst, 2001).
2.3. Results and discussion
2.3.1. Effect of nozzle size
The influence of nozzle size on the DIXRP value for a nozzle pressure of 1.0 MPa and
different nozzle heights is shown (Fig. 8). As shown in the figure, the index exhibited a
trend of growth as nozzle size increased for a certain nozzle height and pressure. The
index increased rapidly as nozzle size increased from 05 to 06. Considering the standard
deviation, indices for nozzle sizes of 06 and 07 were found not to differ at all nozzle
heights while the indices for other nozzle sizes showed an increasing trend as the nozzle
30
size increased. The index increased linearly as nozzle size increased from 07 to 09.
Finally, the index stopped increasing when nozzle sizes were 10 and 11. The reason why
the index increased as nozzle size increased might be that droplet size and liquid flow
rate also increased with the increase in nozzle size. However, the droplet size did not
experience an increase when nozzle size increased. In this study, a laser analyzer,
LDSA-1400A (Nikkiso), was used to measure the volume median diameter (VMD) at
0.3 m below the nozzle. The VMD for all nozzle sizes was in the range from 300 to 400
μm and from 250 to 350 μm for nozzle pressures of 1.0 and 1.5 MPa, respectively. The
difference of the VMD for same nozzle size but at different nozzle pressures was about
50 μm while the smallest VMD was found with ES05-1.50. Based on the equation
reported by Herbst (2001), relative drift potential volume was divided by the nozzle
output. Therefore, the DIXRP value might increase as liquid flow rate increases when
the absolute values of drift volume remains the same. The increase rate of liquid flow
rate with the increase of nozzle size can be obtained through simple calculation based
on Table 5. The maximum growth rate of liquid flow rate was observed when nozzle
size increased from 05 to 06. This growth might contribute to the rapid increase in the
DIXRP value from 05 to 06.
Generally, all of the index values were positive except for ES 05, 06 and 07 for a
nozzle height of 0.7 m at a pressure of 1.0 MPa. The index values at a nozzle height of
0.9 m were all negative and are not shown in the figures. The results indicated that this
series of nozzles can reduce the drift under the working conditions considered herein.
When nozzle heights were between 0.3 and 0.5 m, the DIXRP values were above 50%
with nozzle sizes from 06 to 11. However, only nozzle sizes of 10 and 11 had a drift
reduction performance above 50% when nozzle height was increased to 0.7 m. Based on
the BBA classification system, nozzles that have a drift reduction performance above 50%
can be classified into three categories (50%+, 75%+ and 90%+) of drift reduction
nozzles (Herbst, 2001). In addition, when nozzle height was between 0.3 and 0.4 m, all

31
of the nozzles investigated could be classified into the 75%+ category, except for nozzle
sizes of 05 and 06. In addition, most of the indices could achieve 90%+ when nozzle
size was larger than 07 for a nozzle height of 0.3 m.
The influence of nozzle size on the DIXRP value for a nozzle pressure of 1.50 MPa
for various nozzle heights and sizes are illustrated (Fig. 9). When nozzle height was
between 0.3 and 0.5 m, the DIXRP values were high and were close to the values
obtained under 1.00 MPa for nozzle sizes from 06 to 11. However, no index value for
the ES nozzles was found to be above 50% at a nozzle pressure of 1.50 MPa when
nozzle height was 0.7 m. For a nozzle size of 05, all of the index values were negative
for nozzle pressure of 1.50 MPa, which means that 05 nozzle could not be considered as
a drift reduction nozzle under these conditions. In addition, the index was -76%, -178%,
and -484% for the 05 nozzle at 1.50 MPa for nozzle heights of 0.4, 0.5, and 0.7 m,
-80
-60
-40
-20
0
20
40
60
80
100
Dri
ft P
ote
ntia
l In
de
x R
ed
uctio
n P
erc
en
tag
e (
%)
0.3 0.4 0.5 0.7
ES05 ES06 ES07 ES08 ES09 ES10 ES11
Nozzle height (m)
Figure 8 DIXRP values and standard deviations obtained under different nozzle-pressure
combinations of ES series nozzle for various nozzle heights ranging from 0.3 to 0.7 m for a
nozzle pressure of 1.00 MPa

32
respectively. Therefore, nozzle height should be restricted to 0.3 m when 05 nozzle is
used. The large increase of liquid flow rate was considered to be the important reason
for the increase of DIXRP value from 05 to 06 nozzle.
From the data obtained by Nuyttens et al. (2009), the drift reduction index of air
inclusion nozzles (Hardi ISO injet nozzle) increased gradually as nozzle size increased,
although the trend was not statistically significant. All of the index values of injet
nozzles were above 80%, which indicated good drift reduction performance under the
investigated conditions. In the present study, the influence of nozzle size on the index
value was found to be statistically significant by one-way analysis of variance (**P <
0.01). In addition, most of the DIXRP values produced by ES series nozzles were above
50% except 05 nozzle when nozzle height was between 0.3 and 0.5 m. It should be
-100
-80
-60
-40
-20
0
20
40
60
80
100
Dri
ft P
ote
ntia
l In
de
x R
ed
uctio
n P
erc
en
tag
e (
%)
0.3 0.4 0.5 0.7
ES05 ES06 ES07 ES08 ES09 ES10 ES11
Nozzle height (m)Nozzle height (m)Nozzle height (m)Nozzle height (m)
-178% -484%
Figure 9 DIXRP values and standard deviations obtained under different nozzle-pressure
combinations for ES series nozzles and for different nozzle heights of from 0.3 to 0.7 m for a nozzle
pressure of 1.50 MPa

33
stressed that the ISO nozzle code cannot be directly compared with the nozzle size
number of ES series nozzle due to the different coding methods. The ISO nozzle
number was decided by liquid flow rate under a certain nozzle pressure, where the ES
05 nozzle has a nozzle diameter of 0.5 mm. For example, liquid flow rates of the ISO 03,
04 and 05 nozzles under 0.3 MPa are 1.2 L/min, 1.6 L/min and 2.0 L/min, respectively.
Compared with ES nozzles, the ISO nozzles are relatively larger for the same nozzle
numbers for ES nozzles. The difference in nozzle sizes indicates that a comparison of
drift reduction performance between the two types of air inclusion nozzles for the same
nozzle size is not possible. The reason for the existence of this difference may be that
the nozzle pressures of ISO nozzles were much lower than those of ES nozzles.
Therefore, a larger nozzle size was required in order to obtain a similar liquid flow rate
to that of the ES nozzle. However, the drift reduction indices of nozzles investigated and
Hardi ISO injet nozzles exhibited a similar trend of gradual growth when nozzle size
increases. For the Hardi ISO injet nozzle, the increase in liquid flow rate and VMDs
with nozzle size contributed to the increase in the drift reduction index. For the ES
series nozzle with an average VMD of about 300 μm, the increase in liquid flow rate
may be an important cause of the increase in the DIXRP values. In addition, since
VMDs of the injet nozzles were above 500 μm (Nuyttens et al., 2007) while the value of
the ES series nozzles were approximately 300 μm, the drift reduction indices of the ES
series nozzles were assumed to be much smaller than those of the injet nozzles.
However, the potential higher jet velocity due to the much higher nozzle pressure of ES
series nozzles might contribute to the improved drift reduction performance because
droplet velocity distribution is an important factor which influences the nozzle
performance including drift risk (Miller and Butler Ellis, 2000). Therefore, jet velocity
should be also investigated in the future.

34
2.3.2. Effect of nozzle height
When nozzle height increased from 0.3 to 0.7 m, the DIXRP values decreased rapidly
(Fig. 8 and 9). In the present study, the influence of nozzle height on the index value
was statistically significant by one way analysis of variance (**P < 0.01). When nozzle
height was between 0.3 and 0.4 m, which was the recommended range of the nozzle
height by the manufacturer, most of the index values were above 75% and at least half
of the values were above 90%. These results indicated that a good drift reduction
performance can be achieved if the users strictly adopt the recommended nozzle height.
However, this range might be difficult to be meet in uneven fields or if higher work
rates are wanted (Miller et al., 2011). When nozzle height was between 0.3 and 0.5 m,
the index values for all the conditions investigated were higher than 50%, except for ES
05. When nozzle height increased to 0.7 m, the index values were negative for nozzle
sizes smaller than ES 07, and all of the index values were negative when nozzle height
reached 0.9 m. Thus, for a nozzle height of 0.9 m, the ES series nozzles might have no
greater drift reduction ability compared with the reference spray because all the DIXRP
values at 0.9m nozzle height were smaller than 19% based on the calculation result.
Therefore, in order to obtain good drift reduction performance, users are recommended
to apply pesticide at a nozzle height of less than 0.5 m.
2.3.3. Effect of nozzle pressure
The DIXRP values for the ES series nozzles under two different nozzle pressures at a
nozzle height of 0.3 m are shown (Fig. 10). As shown in the figure, the influence of
nozzle pressure on the index values is obvious for the ES 05, but is not clear for nozzle
sizes from 06 to 11. The reason why the difference occurred was the drift volumes of ES
05-1.50 were much higher than those from other conditions at each height. The low
liquid flow rate and the smallest VMD of ES 05-1.50 should be considered as an

35
important factor that can increase drift risk. Therefore, other drift reduction methods
should be applied in order to reduce the potential drift risk, otherwise relatively high
drift might occur. For other nozzle heights, very similar conclusions can be obtained,
where nozzle pressure did not have an obvious influence on the drift reduction
performance of ES series nozzles, except for the ES 05 nozzle. In the present study, the
influence of nozzle pressure on DIXRP values was statistically significant (**P < 0.01)
only for nozzle sizes of 05 and 07 at all nozzle heights by one way analysis of variance.
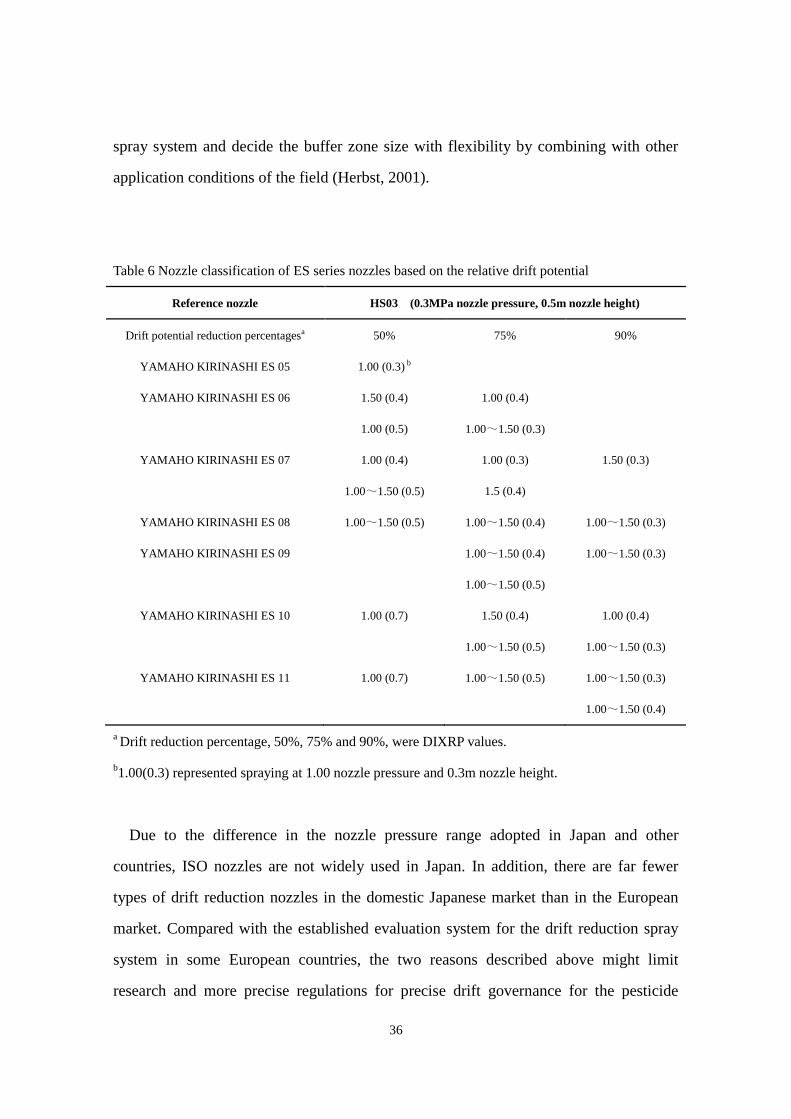
2.3.4. Drift classification
Based on the nozzle classification system of the drift reduction nozzle by BBA, the drift
reduction performance of ES series nozzles of various sizes, pressures and heights was
investigated (Table 6). The result revealed that the most important factor influencing the
drift reduction performance was the nozzle height, followed by the nozzle size. Based
on the above results, nozzle height should be controlled at least 0.3 to 0.5 m or even 0.3
to 0.4 m to achieve the best drift reduction performance of ES series nozzles. Moreover,
this classification could help users to estimate the drift reduction level of the entire
Figure 10 DIXRP values and standard deviations obtained under different nozzle-pressure combinations
of ES series nozzle under various nozzle pressures of from 1.00 to 1.50 MPa for a nozzle height of 0.30
m
-20.00
0.00
20.00
40.00
60.00
80.00
100.00
Dri
ft P
ote
ntia
l In
de
x
Re
du
ctio
n P
erc
en
tag
e, %
1.00MPa 1.50MPa
ES05 ES06 ES07 ES08 ES09 ES10 ES11
Number of the nozzle size
36
spray system and decide the buffer zone size with flexibility by combining with other
application conditions of the field (Herbst, 2001).
Table 6 Nozzle classification of ES series nozzles based on the relative drift potential
Reference nozzle HS03 (0.3MPa nozzle pressure, 0.5m nozzle height)
Drift potential reduction percentagesa 50% 75% 90%
YAMAHO KIRINASHI ES 05 1.00 (0.3) b
YAMAHO KIRINASHI ES 06 1.50 (0.4) 1.00 (0.4)
1.00 (0.5) 1.00~1.50 (0.3)
YAMAHO KIRINASHI ES 07 1.00 (0.4) 1.00 (0.3) 1.50 (0.3)
1.00~1.50 (0.5) 1.5 (0.4)
YAMAHO KIRINASHI ES 08 1.00~1.50 (0.5) 1.00~1.50 (0.4) 1.00~1.50 (0.3)
YAMAHO KIRINASHI ES 09 1.00~1.50 (0.4) 1.00~1.50 (0.3)
1.00~1.50 (0.5)
YAMAHO KIRINASHI ES 10 1.00 (0.7) 1.50 (0.4) 1.00 (0.4)
1.00~1.50 (0.5) 1.00~1.50 (0.3)
YAMAHO KIRINASHI ES 11 1.00 (0.7) 1.00~1.50 (0.5) 1.00~1.50 (0.3)
1.00~1.50 (0.4)
a Drift reduction percentage, 50%, 75% and 90%, were DIXRP values.
b1.00(0.3) represented spraying at 1.00 nozzle pressure and 0.3m nozzle height.
Due to the difference in the nozzle pressure range adopted in Japan and other
countries, ISO nozzles are not widely used in Japan. In addition, there are far fewer
types of drift reduction nozzles in the domestic Japanese market than in the European
market. Compared with the established evaluation system for the drift reduction spray
system in some European countries, the two reasons described above might limit
research and more precise regulations for precise drift governance for the pesticide

37
application.
The present study may be the first investigation of relative drift potential of pesticide
nozzles used in Japan. The classification table provides the users with relatively
objective and visual information of the drift reduction performance of ES series nozzles.
The table can be expanded as more types of drift reduction nozzles become available.
Finally, note that, in the present study, the air temperature and the relative humidity
cannot be controlled, which means that the results may vary when this test is carried out
under different environment parameters.
2.4. Conclusion
In conclusion, the relative drift potential for one series of drift reduction nozzles used in
Japan was measured under different combinations of nozzle size, pressure and height.
The results reveal that the influence of nozzle height and nozzle size on the index value
were statistically significant (**P < 0.01), whereas the nozzle pressure has a significant
effect (**P < 0.01) on the index value only for nozzle sizes of 05 and 07. Compared
with the reference spray, the ES series nozzles had drift reduction abilities above 50%
when the nozzle height was between 0.3 and 0.5 m, except for the ES 05 nozzle.
According to the spray distribution performance, the best nozzle height range is
between 0.3m and 0.4m above the crop canopy. The results provided the users objective
information for the relative drift reduction performance of ES nozzles and could also be
expanded as more types of drift reduction nozzles become available.

38
Chapter 3 The influence of design parameters on the initial spray
characteristics of the high-pressure air inclusion nozzle used in Japan
Abstract
Over 40000 sets of the air inclusion nozzles, KIRINASHI ES series with high nozzle
pressure, have being already used as one of the best drift control methods on the boom
sprayers in Japan. To get better understanding of the relationship between the key
nozzle design parameters and the initial spray characteristics, the influence of the key
design parameters and nozzle pressure of KIRINASHI ES series nozzles on the droplet
size characteristics, spray angle, liquid flow rate and included air within droplets was
investigated. The results show that the nozzle pressure and the pre-orifice diameter had
negative correlations with the volume median diameter (Dv0.5) while the nozzle tip area
had a positive effect on the Dv0.5. In addition, the nozzle pressure and the pre-orifice
diameter had positive correlations with the spray angle. The pre-orifice diameter and the
nozzle tip area significantly influence the spray liquid density which could indicate the
quantity of included air within droplets. The corresponding multivariate regression
analysis was carried out and relative high values of the coefficient of determinations
(R2) were obtained between several nozzle parameters and the Dv0.5, the spray liquid
density and the liquid flow rate.
3.1. Introduction
Spray drift control of the pesticide application has caused much attention all over the
world because the drift could not only do harm to the human health but also lead to the
environmental pollution. In the field of the drift reduction technology for boom sprayers,
air inclusion nozzles which can produce large droplet with included air within droplets
have been commercially popularized for users to control spray drift. In the UK, the
39
pesticide nozzles with air-injection designs now account for a substantial proportion in
the sale market of new agricultural nozzle (Miller et al., 2011). In Japan, approximately
400,000 sets of air inclusion nozzles for boom sprayers have been sold (Miyahara,
2012).
Initial spray characteristics of nozzles are very important due to their influence on the
different aspects of spray performance. Droplet size was proved to be a vital factor
because it has strong relationship with the spray drift, droplet velocity and also coverage
rate (Butler Ellis et al., 2002; Nuyytens et al., 2007). Liquid flow rate of the individual
nozzle might have strong effect on the forward speed of the boom sprayer if spray drift
level is acceptable at higher forward speed. A shorter working time means lower labor
cost and energy consumption. For the boom sprayer, the combined spray pattern of the
nozzles might be uneven when the spray angle is too narrow at low nozzle height.
The included air within droplets produced by air inclusion nozzles is another important
feature to improve spray performance. Almost all the manufactures claim that the air
inclusion nozzle could produce droplet with included air within droplets which improve
the deposit efficiency of the droplets. The presence of air within droplets influences
droplet size and velocity, impaction, retention, and spray drift (Combellack & Miller,
2001). However, the quantitative study of the included air within droplets produced by
air inclusion nozzles was limited. Butler Eillis et al. (2002) obtained the spray liquid
density by matching the droplet velocities between the calculated and measured values.
However, no deeper analysis between nozzle design parameters and spray liquid density
was carried out. Faggion, Miller and Butler Ellis (2006) compared two different
methods for measuring the quantity of included air and concluded that the measurement
of the density of collected spray by a cylinder (Hereafter, cylinder method) could
discriminate between different air inclusion nozzle designs while the measurement of
impact force could only discriminate the quantity of included air between an air
40
inclusion nozzle and a conventional nozzle. Using cylinder method, Dorr et al. (2013)
found that spray mixtures significantly affect the spray liquid density of air inclusion
nozzles. The spray liquid density was approximately 1000kg m-3 when only water was
sprayed which means no included air was found. This might be the reason that Guler et
al. (2007) doubted the existence of the included air within droplets.
With the development and application of air inclusion nozzles, several researches were
carried out to investigate the influence of the nozzle design parameters, nozzle pressure,
and the properties of the spray liquid on the spray characteristics including droplet
characteristics, spray angle, spray liquid density, liquid flow rate and spray drift (Butler
Ellis et al., 2002; Dorr et al., 2013; Guler et al., 2007; Miller & Butler Ellis, 2000;
Nuyttens et al., 2007). However, no deeper analysis and the regression relationships
were obtained between key design parameters and the droplet size characteristics in the
studies above. Among the influential factors above, the nozzle design parameters should
play very important roles. However, only a few deep researches were found. Butler Ellis
et al. (2002) manufactured an air inclusion nozzle to investigate the influence of Venturi
injector diameter, Venturi throat diameter, nozzle tip size, air inlet size on the spray
performance. The result showed that (1) liquid flow rate was only controlled by Venturi
injector diameter; (2) The estimated quantity of included air within droplets increased
with the increasing of the air flow rate from air inlet, however, was independent of the
nozzle tip size; and (3) the droplet size was controlled by nozzle tip size. However, only
2 liquid flow rates were available and 2 nozzle tips were compared in the measurement
of the droplet size. Therefore, no further analysis was able to carry out. Nuyttens et al.
(2007) found that the volume median diameter (Dv0.5) of the investigated air inclusion
nozzles (Hardi Injet) was directly proportional to the International Standard
Organisation (ISO) nozzle size. However, when nozzle size increases for the
investigated nozzle, the sizes of the pre-orifice, air inlet and finial orifice increase at the
same time. Therefore, the independent influence of these key design parameters could

41
not be obtained.
The different design and working parameters of air inclusion nozzles from different
manufactures might also result in different relationship between key design parameters
and droplet size characteristics. The nozzle pressure of air inclusion nozzles on boom
sprayers is normally between 1.0-1.5 MPa in Japan, which is much higher than the
nozzle pressure used in other regions, such as Europe. Therefore, it is necessary to
investigate the influence of the key design parameters on the droplet size characteristics,
spray angle, liquid flow rate and included air within droplets of the high-pressure nozzle
used in Japan.
The objectives of the present study were to investigate the influence of the pre-orifice
diameter, the nozzle tip area and the nozzle pressure on the initial spray characteristics
including droplet size characteristics, liquid flow rate, spray angle and included air
within droplets by multivariate regression analysis.
3.2. Material and methods
3.2.1. Spray nozzles
The design of KIRINASHI ES series nozzle (YAMAHO) follows the common design
principles of air inclusion flat fan nozzles. As shown in Fig. 1, the spray liquid goes
through the pre-orifice and mixed with the induced air entering from the air inlet by
Venturi effect to form a liquid jet with included air. A mixing chamber was created at
the downstream of the mixing throat by a two-hole washer to provide sufficient mixing
of the air and liquid. Finally, the air included droplets spray out from a rectangular
shaped nozzle tip.

42
Figure 11 Design features of KIRINASHI ES series nozzles. The range of the pre-orifice diameter is
0.5 -1.1mm with a 0.1mm interval; the size of the air inlet and the diameter of the mixing throat keep
consistent; the corresponding range of the nozzle tip area is 0.57-2.19 mm2
The nozzle pressure of the ES series nozzle was from 1.0 to 1.5MPa, which is much
higher than that of the air inclusion flat fan nozzles being used on the boom sprayer in
other countries. Hardi Inject nozzle (HARDI) was compared as a typical low-pressure
air inclusion nozzle as follows. Compared with the pre-orifice diameter of Hardi Injet
nozzles, the pre-orifice diameter of KIRINASHI ES series nozzles is much smaller for
controlling the liquid flow rate with similar values when higher nozzle pressure was
used. In addition, the shape of the air inlet and the nozzle tip of KIRINASHI ES series
nozzles are rectangle while Hardi Injet nozzles have a circular air inlet and a nozzle tip
with ellipse shape. When the nozzle size increases, the size of the air inlet and the
nozzle tip increase with pre-orifice diameter for Hardi Injet nozzles, which is not the
case for KIRINASHI ES series nozzles. For KIRINASHI ES series nozzle, the sizes of
the air inlet remain the same as the size of the pre-orifice and the nozzle tip increase.
There are 7 and 6 different sizes of pre-orifice and the nozzle tip, respectively. Besides,
the pre-orifice and the nozzle tip could be taken apart with each other which mean 42

43
potential combinations of the pre-orifice and nozzle tip were obtained while the size of
the air inlet kept constant. Table 7 shows the detail information of the nozzle tip area,
the pre-orifice diameter and the investigated nozzle pressure. The influence of the two
design parameters on the initial spray characteristics was investigated under different
nozzle pressures.
The nozzle tip area were measured by image processing method with a CCD camera
(DFK 31BF03, The Imaging Source), MATLAB software (MATLAB 2012, Mathworks)
and a computer. In addition, there are 7 different pre-orifice diameters with the range
from 0.5 to 1.1mm.
Table 7 Investigated design and working parameters included the nozzle tip areas, the diameter of
pre-orifice and the nozzle pressure
Nozzle tip Pre-orifice Pressure
Notationa Area of the nozzle tip
b,
mm2
Numberc Diameter of the
pre-orifice, mm
Nozzle pressure,
MPa
SR1A 0.57 05 0.5 1.00
KS8 1.01 06 0.6 1.25
KS9 1.08 07 0.7 1.50
KS10 1.40 08 0.8
KS11 1.63 09 0.9
SR4 2.19 10 1.0
11 1.1
a: Notations are from Company data sheet;
b: Area of the nozzle tip was obtained by image
processing technique; c: Numbers are from Company data sheet.

44
3.2.2. Measurement of droplet size characteristics, liquid flow rate and fan angle
The measurement of droplet size characteristics under all available combinations of
pre-orifice and nozzle tip at three nozzle pressures were carried out (Table 8). A laser
diffraction analyser, LDSA-1400A (Nikkiso), was used in this study to measure the
droplet size characteristics. Using the accessory software, the volume distribution of
droplet sizes can be determined, in addition to important characteristics of droplet size
including volume diameters below which smaller droplets constitute 10%, 50% and
90% of the total volume (Dv0.1, Dv0.5 and Dv0.9), relative span factor indicating the
uniformity of the droplet size distribution (RSF), arithmetic mean diameter (D10),
surface mean diameter (D20), volume mean diameter (D30), Sauter mean diameter (D32),
the volume percentage of droplets smaller than 50μm (V50), 100μm (V100), 150μm
(V150), 200μm (V200) and 250μm (V250), respectively (Nuyttens et al., 2007). The
calculation equations for RSF, D10, D20, D30 and D32 were shown in the equations as
below (Eq. (4)-(8)).When measuring the droplet size characteristics, the vertical
distance between the nozzle and the laser beam was 0.3m. For each combination of the
nozzle size and nozzle pressure, the measurement was repeated five times. Tween 20
used in the measurement of the relative spray drift was also applied to tap water to
obtain a 0.1% w/w solution with similar physical properties to those of real pesticide
(Nuyttens, 2007). One automatic hygrothermograph was placed near the spray nozzle to
record the environment parameters during the experiment. During the measurement, the
average air temperature and the relative humidity were 30℃ and 70%, respectively.
Liquid flow rates were recorded by mass method and repeated 3 times.
5.0
1.09.0
v
vv
D
DDRSF
(4)
n
d
D
n
i
i 1
10 (5)

45
n
d
D
n
i
i 1
2
20 (6)
31
3
30n
d
D
n
i
i
(7)
n
i
i
n
i
i
d
d
D
1
2
1
3
32 (8)
Where di: the diameter of droplet i, μm; n: the total number of droplets.
Table 8 Pre-test result of spray stability under all possible combinations of nozzle tip areas and
pre-orifice diameters
Nozzle tip number
Pre-orifice
number SR1A KS8 KS9 KS10 KS11 SR4
05 ○ ○ ○ ● ● ●
06 ○ ○ ○ ○ ○ ○
07 ※ ○ ○ ● ● ●
08 ※ ○ ○ ○ ○ ○
09 ※ ※ ○ ● ● ●
10 ※ ※ ※ ○ ○ ○
11 ※ ※ ※ ※ ● ●
※: Combinations which produce unstable spray; ○: Combinations which produced stable sprays and
the measurement of droplet size characteristics, spray angle and liquid flow rate were carried out
under the combinations; ●: Combinations which produced stable sprays and the measurement of
droplet size characteristics, spray angle, liquid flow rate and the included air within droplet were
carried out under the combinations.
The measurement of the spray angle under same combinations of design parameters at

46
three nozzle pressures were carried out (Table 8). One digital camera (FinePix
F200EXR, Fujifilm) was used to take the photo of the spray sheet at the area of the
nozzle tip after adjusting the nozzle pressure and before and measurement of the droplet
size measurement. Image analysis software (IrfanView, Irfan Skiljan, Graduate of
Vienna University of Technology) was used to measure the fan angle of the spray sheet
by manually drawing 2 straight lines at the boundary between spray sheet and air. The
measurement by the software was repeated 5 times under each spray.
3.2.3. Measurement of included air within droplets
Fig. 12 shows the sketch of the measurement of the spray liquid density (Faggion et al.,
2006; Dorr et al., 2013). 11 combinations which covered the whole range of the
pre-orifice diameter were investigated under nozzle pressures of 1.0 and 1.5MPa (Table
8). A higher spray liquid density indicates less quantity of included air exists within
droplets. Black curtains were used to create a relative static environment without any
potential air flow turbulence during the experiment. A 250ml glass cylinder (2ml
resolution) was placed right below the nozzle tip of the investigated nozzle to collect the
spray droplet with included air with a vertical distance of 1.0m between the nozzle tip
and the bottom of the cylinder. An automatic hygrothermograph was placed near the
spray nozzle to record the air temperature and the relative humidity during the
experiment.
The spraying was then carried out and a foam layer above the liquid surface with a
certain thickness was observed in the cylinder. In the previous study, liquid was sprayed
until the cylinder was approximately three quarters full (Faggion et al., 2006; Dorr et al.,
2013). However, it took too long time to achieve three quarters full for small pre-orifice
diameters (0.5 and 0.7mm) and the thickness of the foam layer decreases when
collecting time passed based on the pre test. Therefore, a fix spray duration of 10min

47
was set for the pre-orifice diameters of 0.5 and 0.7mm. After 10min spray, approximate
100ml of the foam and liquid was collected by the cylinder for 0.7mm pre-orifice
diameter. In addition, a fix spray duration of 6min was set for large pre-orifice diameters
(0.9 and 1.1mm) to collect approximate 100ml by the cylinder. After spraying, the
cylinder was removed on a flat surface nearby as soon as possible. Then, the scale on
the top of the foam was recorded to estimate the volume of spray. The weight of the
collected liquid was then measured by an electrical scale. The density of the spray liquid
and the average percentage of air within spray droplets were calculated based on the Eq.
(9) (Dorr et al., 2013).
1000f
sV
w (9)
Where ρs: spray liquid density, kg m-3
; Vf: volume of spray, L; w: weight of spray, kg.
Figure 12 Sketch of the measurement of the spray liquid density

48
3.3. Results and Discussion
3.3.1. The influence of nozzle design parameters on the droplet size characteristics
Fig. 13 and Table 9 show the volume accumulation of droplet size and the result of the
droplet size characteristics under same investigated conditions. 18 of 31 investigated
combinations of the pre-orifice, nozzle tip and nozzle pressure were given to
demonstrate the influence of the three factors on the droplet size characteristics.
The influence of nozzle pressure on the droplet size characteristics was obtained. The
volume accumulation line of droplet size moved rightwards as nozzle pressure
decreased which means that the droplet size increased as nozzle pressure decreased
from 1.5MPa to 1.0MPa while the size of the pre-orifice and the nozzle tip kept constant.
Table 9 shows the specific change of the droplet size characteristics. Dv0.5 was the most
frequently and widely used indicator representing the droplet size characteristics.
Besides, the whole droplet size distribution characteristics could be obtained by
introducing Dv0.1, Dv0.5 and Dv0.9. The RSF is an indicator calculated from the three
characteristics to estimate the uniformity of the droplet size distribution (Nuyttens et al.,
2007). The volume percentage of droplets smaller than a certain diameter was found to
be the best indicator of the spray drift index with a range from 75 to 200μm (Donkersley
& Nuyttens, 2011). Therefore, these droplet size characteristics were also shown. The
relationship among the droplet size characteristics will be discussed later in this study.
Table 9 shows that Dv0.1, Dv0.5 and Dv0.9 increased as nozzle pressure decreased with the
maximum increase of 30, 44 and 62μm, respectively, when nozzle pressure decreased
from 1.5 to 1.0MPa at all the investigated conditions. The result also indicated that the
influence of the nozzle pressure was relative small. In addition, the effect of the nozzle
pressure on the droplet size characteristics of the investigated flat fan nozzles was found
to be very limited when comparing with the effect of nozzle size and type (Nuyttens et

49
al., 2007).
The influence of the nozzle tip area on the droplet size characteristics was investigated.
When the nozzle tip area increased from SR1A (0.57mm2) to SK11 (1.63mm2) with a
constant pre-orifice diameter of 0.5mm and a nozzle pressure of 1.0MPa, the volume
accumulation line of droplet size moved rightwards and Dv0.1, Dv0.5 and Dv0.9 increased
from 166.5, 269.1 and 372.5μm to 243.4, 395.8 and 550.6μm, respectively. The same
trend was also found under other nozzle pressures and pre-orifice diameters. These
trends indicated that the nozzle tip area was proportional to the droplet size for ES
nozzles. Miller et al (2002) concluded that the nozzle tips dominated the influence of
the design factors on the droplet size for the investigated air inclusion nozzle. However,
only 2 nozzle tips were tested and only qualitative result was obtained.
Except Miller et al (2002), little literature was found which studied the independent
influence of the nozzle tip area on the droplet size without changing other key design
parameters, such as pre-orifice diameter. Based on the previous studies, the droplet size
characteristics of air inclusion nozzles increased when nozzle size increased (Guler et
al., 2007; Nuyytens et al., 2007). However, with the increase of the nozzle size, the size
of the pre-orifice, the air inlet and the nozzle tip increased simultaneously which means
that it was difficult to investigate the independent influence of the key design
parameters on the droplet size characteristics due to the lack of the available
combinations of these parameters. Therefore, the potential reason why Dv0.5 increased in
the previous study might be that the influence of the nozzle tip area surpassed the
opposite influence of the pre-orifice diameter. In this study, Dv0.1, Dv0.5 and Dv0.9
decreased from 243.4, 395.8 and 550.6μm to 148.0, 256.6 and 369.7μm when the
pre-orifice diameter increased from 0.5 to 1.1mm under a nozzle pressure of 1.0MPa
and a KS11 nozzle tip (Table 9). The similar trends between the pre-orifice diameter and
the droplet size characteristics were also found under other combinations of nozzle tip

50
area and nozzle pressure.
Figure 13 Accumulation percentage of the droplet volume (Part of the investigated data). The
notation 05-SR1A-1.0 means the measurement of the droplet size was carried out with a pre-orifice
diameter of 0.5mm, a nozzle tip of SR1A with an area of 0.57mm2 and a nozzle pressure of 1.0MPa
0
10
20
30
40
50
60
70
80
90
100
0 100 200 300 400 500 600 700 800 900
Accum
ula
tion p
erc
eta
ge o
f d
ropelt v
olu
me,
%
Droplet diameter, mm
05-SR1A-1.0 05-SR1A-1.25 05-SR1A-1.5
05-KS9-1.0 05-KS9-1.25 05-KS9-1.5
05-KS11-1.0 05-KS11-1.25 05-KS11-1.5
08-KS9-1.0 08-KS9-1.25 08-KS9-1.5
08-KS11-1.0 08-KS11-1.25 08-KS11-1.5
11-KS11-1.0 11-KS11-1.25 11-KS11-1.5
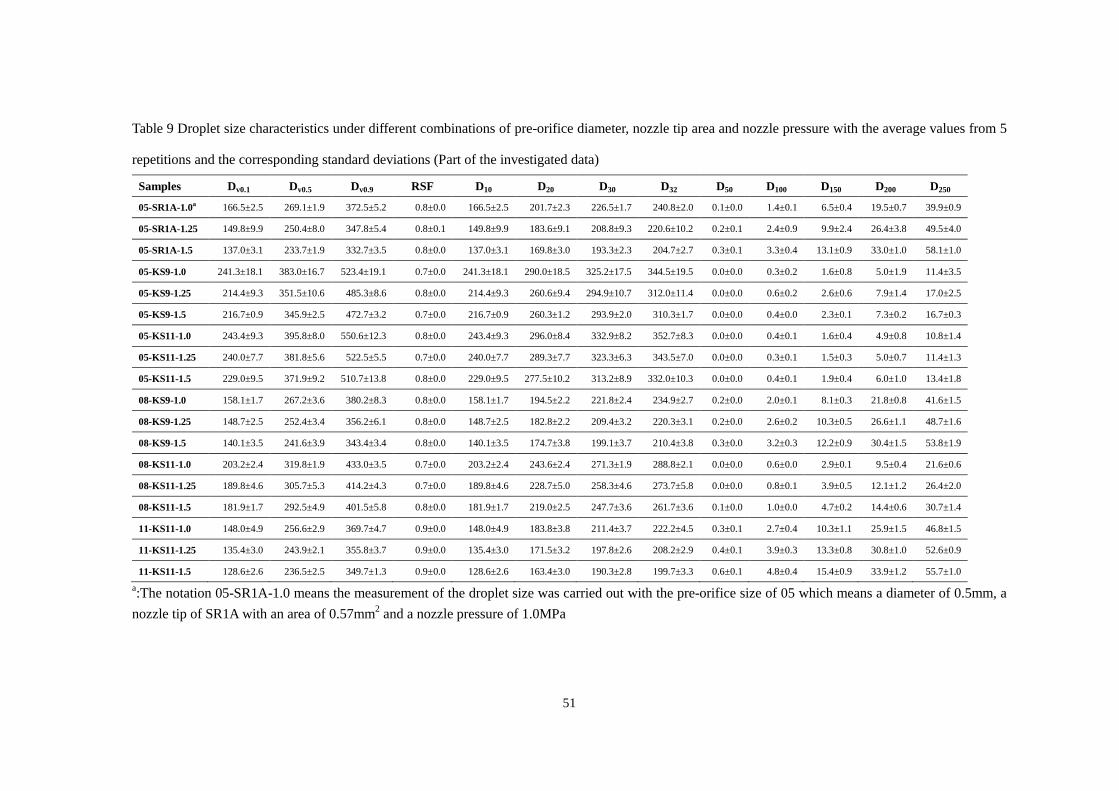
51
Table 9 Droplet size characteristics under different combinations of pre-orifice diameter, nozzle tip area and nozzle pressure with the average values from 5
repetitions and the corresponding standard deviations (Part of the investigated data)
Samples Dv0.1 Dv0.5 Dv0.9 RSF D10 D20 D30 D32 D50 D100 D150 D200 D250
05-SR1A-1.0a 166.5±2.5 269.1±1.9 372.5±5.2 0.8±0.0 166.5±2.5 201.7±2.3 226.5±1.7 240.8±2.0 0.1±0.0 1.4±0.1 6.5±0.4 19.5±0.7 39.9±0.9
05-SR1A-1.25 149.8±9.9 250.4±8.0 347.8±5.4 0.8±0.1 149.8±9.9 183.6±9.1 208.8±9.3 220.6±10.2 0.2±0.1 2.4±0.9 9.9±2.4 26.4±3.8 49.5±4.0
05-SR1A-1.5 137.0±3.1 233.7±1.9 332.7±3.5 0.8±0.0 137.0±3.1 169.8±3.0 193.3±2.3 204.7±2.7 0.3±0.1 3.3±0.4 13.1±0.9 33.0±1.0 58.1±1.0
05-KS9-1.0 241.3±18.1 383.0±16.7 523.4±19.1 0.7±0.0 241.3±18.1 290.0±18.5 325.2±17.5 344.5±19.5 0.0±0.0 0.3±0.2 1.6±0.8 5.0±1.9 11.4±3.5
05-KS9-1.25 214.4±9.3 351.5±10.6 485.3±8.6 0.8±0.0 214.4±9.3 260.6±9.4 294.9±10.7 312.0±11.4 0.0±0.0 0.6±0.2 2.6±0.6 7.9±1.4 17.0±2.5
05-KS9-1.5 216.7±0.9 345.9±2.5 472.7±3.2 0.7±0.0 216.7±0.9 260.3±1.2 293.9±2.0 310.3±1.7 0.0±0.0 0.4±0.0 2.3±0.1 7.3±0.2 16.7±0.3
05-KS11-1.0 243.4±9.3 395.8±8.0 550.6±12.3 0.8±0.0 243.4±9.3 296.0±8.4 332.9±8.2 352.7±8.3 0.0±0.0 0.4±0.1 1.6±0.4 4.9±0.8 10.8±1.4
05-KS11-1.25 240.0±7.7 381.8±5.6 522.5±5.5 0.7±0.0 240.0±7.7 289.3±7.7 323.3±6.3 343.5±7.0 0.0±0.0 0.3±0.1 1.5±0.3 5.0±0.7 11.4±1.3
05-KS11-1.5 229.0±9.5 371.9±9.2 510.7±13.8 0.8±0.0 229.0±9.5 277.5±10.2 313.2±8.9 332.0±10.3 0.0±0.0 0.4±0.1 1.9±0.4 6.0±1.0 13.4±1.8
08-KS9-1.0 158.1±1.7 267.2±3.6 380.2±8.3 0.8±0.0 158.1±1.7 194.5±2.2 221.8±2.4 234.9±2.7 0.2±0.0 2.0±0.1 8.1±0.3 21.8±0.8 41.6±1.5
08-KS9-1.25 148.7±2.5 252.4±3.4 356.2±6.1 0.8±0.0 148.7±2.5 182.8±2.2 209.4±3.2 220.3±3.1 0.2±0.0 2.6±0.2 10.3±0.5 26.6±1.1 48.7±1.6
08-KS9-1.5 140.1±3.5 241.6±3.9 343.4±3.4 0.8±0.0 140.1±3.5 174.7±3.8 199.1±3.7 210.4±3.8 0.3±0.0 3.2±0.3 12.2±0.9 30.4±1.5 53.8±1.9
08-KS11-1.0 203.2±2.4 319.8±1.9 433.0±3.5 0.7±0.0 203.2±2.4 243.6±2.4 271.3±1.9 288.8±2.1 0.0±0.0 0.6±0.0 2.9±0.1 9.5±0.4 21.6±0.6
08-KS11-1.25 189.8±4.6 305.7±5.3 414.2±4.3 0.7±0.0 189.8±4.6 228.7±5.0 258.3±4.6 273.7±5.8 0.0±0.0 0.8±0.1 3.9±0.5 12.1±1.2 26.4±2.0
08-KS11-1.5 181.9±1.7 292.5±4.9 401.5±5.8 0.8±0.0 181.9±1.7 219.0±2.5 247.7±3.6 261.7±3.6 0.1±0.0 1.0±0.0 4.7±0.2 14.4±0.6 30.7±1.4
11-KS11-1.0 148.0±4.9 256.6±2.9 369.7±4.7 0.9±0.0 148.0±4.9 183.8±3.8 211.4±3.7 222.2±4.5 0.3±0.1 2.7±0.4 10.3±1.1 25.9±1.5 46.8±1.5
11-KS11-1.25 135.4±3.0 243.9±2.1 355.8±3.7 0.9±0.0 135.4±3.0 171.5±3.2 197.8±2.6 208.2±2.9 0.4±0.1 3.9±0.3 13.3±0.8 30.8±1.0 52.6±0.9
11-KS11-1.5 128.6±2.6 236.5±2.5 349.7±1.3 0.9±0.0 128.6±2.6 163.4±3.0 190.3±2.8 199.7±3.3 0.6±0.1 4.8±0.4 15.4±0.9 33.9±1.2 55.7±1.0
a:The notation 05-SR1A-1.0 means the measurement of the droplet size was carried out with the pre-orifice size of 05 which means a diameter of 0.5mm, a
nozzle tip of SR1A with an area of 0.57mm2 and a nozzle pressure of 1.0MPa

52
After obtaining different droplet size characteristics, the correlation analysis among the
droplet size characteristics were carried out (Table 10). The investigated droplet size
characteristics were as same as that of Table 9 and the correlation coefficient (R)
between different droplet size characteristics were shown. The R values show that the
diameter characteristics (Dv0.1, Dv0.5, Dv0.9, D10, D20, D30 and D32) have negative
correlation with characteristics of volume percentages (D50, D100, D150, D200 and D250).
Besides, RSF has negative correlation with diameter characteristics and positive
correlation with volume percentages. In addition, the average value of the absolute
values of R (ABS) for each droplet size characteristic was obtained to estimate whether
it could represent other droplet size characteristics. The result shows that most of the
characteristics had relative high average values which mean they could be used to
represent other characteristics except the volume percentage of droplet size smaller than
50μm and RSF. Therefore, Dv0.5 was used to carry out the regression analysis between
key design parameters and the droplet size characteristics under different nozzle
pressures.
Eq. (10) shows the result of the multivariate regression analysis between the key
nozzle design parameters and Dv0.5 under different nozzle pressures. The nozzle tip area,
pre-orifice diameter and nozzle pressure were found to have significantly effect on the
Dv0.5 (P<0.05) with a coefficient of determination (R2) of 0.81. Previous study showed
that the nozzle tip area controlled the droplet size due to the atomization (Butler Ellis et
al., 2002). In this study, the positive proportion relation between the nozzle tip area and
the Dv0.5 was also found. In addition, Eq. (10) also shows that the pre-orifice diameter
was negative proportional with the Dv0.5 and this trend was not reported in the previous
study. The reason of the above relationship between the pre-orifice diameter and the
Dv0.5 might be the variation of the mixing condition in the mixing chamber by varying
the liquid flow rate controlled by the pre-orifice diameter when the nozzle pressure and
the nozzle tip area were kept constant. However, the relative mechanism needs to be

53
Table 10 Values of correlation coefficients (R) obtained in the correlation analysis of droplet size characteristics
Dv0.1 Dv0.5 Dv0.9 RSF D10 D20 D30 D32 D50 D100 D150 D200 D250
Dv0.1
0.99 0.98 -0.89 1.00 1.00 1.00 1.00 -0.80 -0.87 -0.91 -0.95 -0.98
Dv0.5 0.99
1.00 -0.84 0.99 1.00 1.00 1.00 -0.77 -0.84 -0.89 -0.94 -0.97
Dv0.9 0.98 1.00
-0.79 0.98 0.99 0.99 0.99 -0.73 -0.81 -0.87 -0.92 -0.96
RSF -0.89 -0.84 -0.79
-0.89 -0.87 -0.86 -0.86 0.88 0.92 0.93 0.92 0.91
D10 1.00 0.99 0.98 -0.89
1.00 1.00 1.00 -0.80 -0.87 -0.91 -0.95 -0.98
D20 1.00 1.00 0.99 -0.87 1.00
1.00 1.00 -0.79 -0.86 -0.91 -0.95 -0.98
D30 1.00 1.00 0.99 -0.86 1.00 1.00
1.00 -0.78 -0.85 -0.90 -0.95 -0.98
D32 1.00 1.00 0.99 -0.86 1.00 1.00 1.00
-0.78 -0.86 -0.91 -0.95 -0.98
V50 -0.80 -0.77 -0.73 0.88 -0.80 -0.79 -0.78 -0.78
0.99 0.96 0.92 0.86
V100 -0.87 -0.84 -0.81 0.92 -0.87 -0.86 -0.85 -0.86 0.99
0.99 0.97 0.93
V150 -0.91 -0.89 -0.87 0.93 -0.91 -0.91 -0.90 -0.91 0.96 0.99
0.99 0.96
V200 -0.95 -0.94 -0.92 0.92 -0.95 -0.95 -0.95 -0.95 0.92 0.97 0.99
0.99
V250 -0.98 -0.97 -0.96 0.91 -0.98 -0.98 -0.98 -0.98 0.86 0.93 0.96 0.99
ABS
Values 0.87 0.86 0.85 0.81 0.87 0.87 0.87 0.87 0.77 0.83 0.86 0.88 0.88
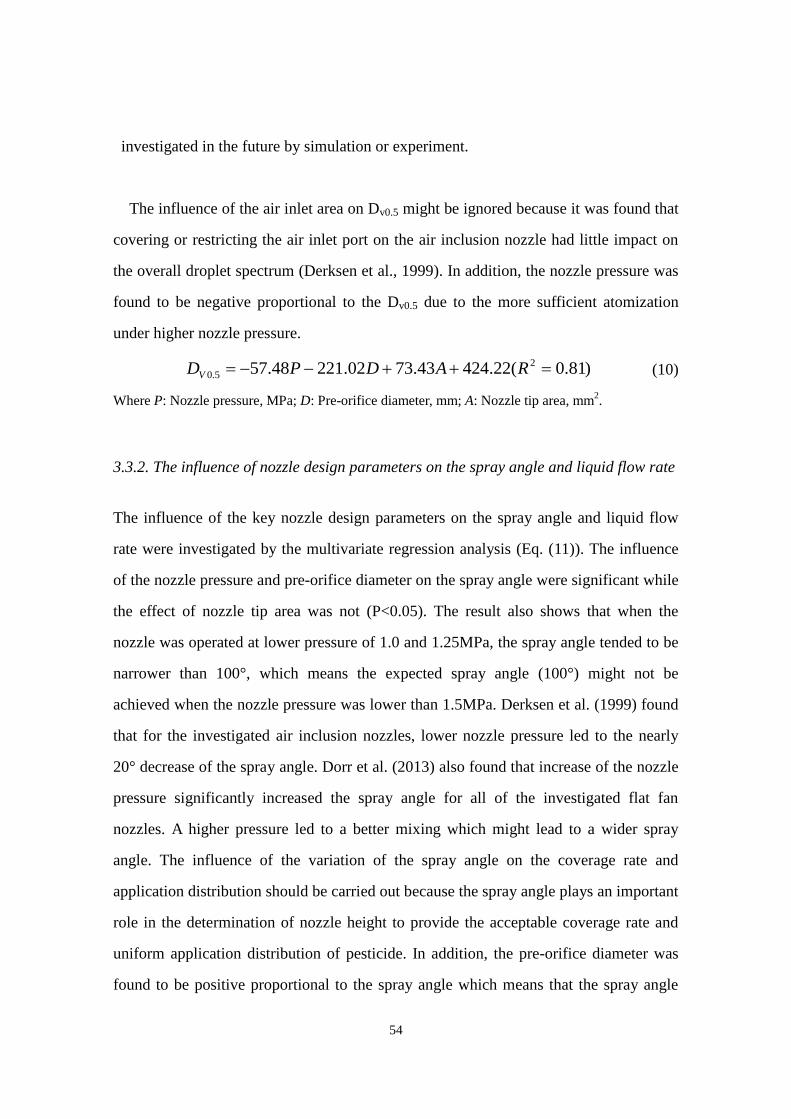
54
investigated in the future by simulation or experiment.
The influence of the air inlet area on Dv0.5 might be ignored because it was found that
covering or restricting the air inlet port on the air inclusion nozzle had little impact on
the overall droplet spectrum (Derksen et al., 1999). In addition, the nozzle pressure was
found to be negative proportional to the Dv0.5 due to the more sufficient atomization
under higher nozzle pressure.
)81.0(22.42443.7302.22148.57 2
5.0 RADPDV (10)
Where P: Nozzle pressure, MPa; D: Pre-orifice diameter, mm; A: Nozzle tip area, mm2.
3.3.2. The influence of nozzle design parameters on the spray angle and liquid flow rate
The influence of the key nozzle design parameters on the spray angle and liquid flow
rate were investigated by the multivariate regression analysis (Eq. (11)). The influence
of the nozzle pressure and pre-orifice diameter on the spray angle were significant while
the effect of nozzle tip area was not (P<0.05). The result also shows that when the
nozzle was operated at lower pressure of 1.0 and 1.25MPa, the spray angle tended to be
narrower than 100°, which means the expected spray angle (100°) might not be
achieved when the nozzle pressure was lower than 1.5MPa. Derksen et al. (1999) found
that for the investigated air inclusion nozzles, lower nozzle pressure led to the nearly
20° decrease of the spray angle. Dorr et al. (2013) also found that increase of the nozzle
pressure significantly increased the spray angle for all of the investigated flat fan
nozzles. A higher pressure led to a better mixing which might lead to a wider spray
angle. The influence of the variation of the spray angle on the coverage rate and
application distribution should be carried out because the spray angle plays an important
role in the determination of nozzle height to provide the acceptable coverage rate and
uniform application distribution of pesticide. In addition, the pre-orifice diameter was
found to be positive proportional to the spray angle which means that the spray angle

55
became larger as the pre-orifice diameter increased under the constant nozzle pressure
and nozzle tip area. It might be that the increase of the liquid flow rate is the reason why
the increase of the nozzle pressure and pre-orifice diameter lead to the increase of the
spray angle. Under a certain nozzle tip area, a larger liquid flow rate led to more liquid
existed in the mixing chamber at a certain time interval and then led to a wider spray
angle. In addition, the influence of the nozzle tip area on the spray angle was found to
be not significant in this study and low R2 was obtained in the regression equation.
)25.0(56.5209.2367.15 2 RDPSA (11)
Where SA: spray angle, degree.
Eq. (12) shows the results of the multivariate regression analysis between the key
nozzle design parameters, nozzle pressures and the liquid flow rate. The regression
equation validated that the nozzle pressure and the pre-orifice diameter significantly
influenced the liquid flow rate with a R2 value of 0.98. Meanwhile, the nozzle tip area
has no significant influence on the liquid flow rate. When the nozzle pressure increased,
the liquid was speeded up which led to the increasing of the liquid flow rate. Besides,
the increasing of the pre-orifice diameter resulted in the increasing of the area of the
narrowest cross-section of the nozzle flow passage, which also led to the increasing of
the liquid flow rate. The main reason why the nozzle tip area had no significant
influence on liquid flow rate should be that the pre-orifices areas were always smaller
than that of the nozzle tips under all the available combinations in the study (Table 7).
In addition, the spray liquid runs out from the air inlet which was considered as an
unstable spray when the pre-orifice area was bigger than that of the nozzle tip.
)98.0(03.129964.228269.382 2 RDPQ (12)
Where Q: liquid flow rate, ml/min.

56
3.3.3. The influence of nozzle design parameters on the quantity of the included air
within droplet
Eq. (13) shows the results of the multivariate regression analysis between the key
nozzle design parameters and the spray liquid density with a R2 of 0.70. The pre-orifice
diameter and the nozzle tip area had significant influence on the spray liquid density.
Based on the inverse relationship between the pre-orifice diameter and droplet size, the
increase of the pre-orifice diameter led to smaller droplet size (Eq. 13). Therefore, small
droplets which might have less included air within droplets resulted in the increase of
the spray liquid density. In addition, the increase of the pre-orifice diameter also led to
the growth of liquid flow rate, which might lead to higher spray liquid density due to the
increase of the ratio of the liquid flow rate to the included air flow rate. When the nozzle
tip area increased, the droplet size increased (Eq. 13). The larger droplet size might have
more included air within droplets which lead to the decrease of the spray liquid density.
)70.0(95.55905.10058.273 2 RADs (13)
3.4. Conclusions
In conclusion, the influence of the key nozzle design parameters for high-pressure air
inclusion nozzles, which includes pre-orifice diameter and nozzle tip area on the droplet
size characteristics, spray angle, included air within droplet and liquid flow rate were
investigated under different nozzle pressures. The combinations of 7 pre-orifice
diameters, 6 nozzle tip areas and 3 nozzle pressures, were tested in the pre-test and 93
stable spray conditions were chosen to carry out the measurement of droplet size
characteristics, spray angle and liquid flow rate. The correlation analysis among
important droplet size characteristics were carried out. The result shows that most of the
characteristics had relative high average values which mean they could be used to

57
represent other characteristics. Therefore, Dv0.5 was used to carry out the regression
analysis between key design parameters and the droplet size characteristics under
different nozzle pressures.
The result of the multivariate regression analysis between the key nozzle design
parameters and Dv0.5 under different nozzle pressures shows that nozzle tip area,
pre-orifice diameter and nozzle pressure were found to have significantly effect on the
Dv0.5 (P<0.05) with a coefficient of determination (R2) of 0.81. The positive proportion
relation between the nozzle tip area and the Dv0.5 was found. In addition, pre-orifice
diameter was negative proportional with the Dv0.5 and this trend was not reported in the
previous study. The further investigation should be carried out to explain the result. In
addition, nozzle pressure was found to be negative proportional to the Dv0.5 due to the
more sufficient atomization under higher nozzle pressure.
The results of the multivariate regression analysis between the key nozzle design
parameters and spray angle under different nozzle pressures shows that the influence of
nozzle pressure and pre-orifice diameter on the spray angle were significant while the
effect of nozzle tip area was not (P<0.05). In addition, pre-orifice diameter and nozzle
pressure were found to be positive proportional to the spray angle. The result shows that
the nozzle pressure and pre-orifice diameter controlled the liquid flow rate with a R2
value of 0.98. From 22 investigated sprays, the regression equation between the key
nozzle design parameters and the spray liquid density was obtained. The pre-orifice
diameter and nozzle tip area significantly affect the spray liquid density. The influence
of the pre-orifice diameter and nozzle tip on droplet size characteristics might be the
main reason why the two design parameters significantly influence the spray liquid
density.

58
Chapter 4 The influence of the air inlet design on the spray
performance of the air inclusion nozzle used in Japan
Abstract
The application of air inclusion nozzles was proved to be one of the most effective ways
to decrease the spray drift because the nozzle could produce much larger droplet than
that produced by the conventional spray nozzles. However, the effect of the air inlet on
spray performance of the air inclusion nozzle and whether this kind of nozzle could be
replaced by other cheaper nozzles has been debated. Besides, the nozzle pressure and
the corresponding nozzle deign parameters of the air inclusion nozzles used in Japan are
different from other regions. Therefore, the influence of the air inlet design on the spray
performance of one series of air inclusion nozzles used on boom sprayers in Japan was
carried out. The result showed that sealing of the air inlet significantly decreased the
quantity of the included air within droplets under the investigated conditions. The
included air quantity of KIRINASHI ES series nozzles was slightly higher, comparing
with that of low pressure air inclusion nozzles. No significant difference of volume
median diameter (Dv0.5) was found between the unsealed and sealed group. The
existence of the air inlet led to a more uniform distribution of the droplet size based on
its influence on the RSF and might result in a better drift control due to less volume
proportion of small droplets it produced. The sealing of the air inlet slightly increased
the liquid flow rate but not significantly. No significant difference of the spray angle,
deposit weight of spray liquid and coverage rate were found between the two groups. It
could be concluded that the unsealed group might have the potential to decrease the
volume proportion of small droplets which indicated a better drift control while keeping
the coverage rate as same as the sealed group.

59
4.1. Introduction
Spray drift control is one of the most important tasks during pesticide spray. Among all
the drift control methods, the application of the air inclusion nozzle was proved to be
one of the most effective ways to decrease the spray drift because the nozzle could
produce much larger droplet than that produced by the conventional spray nozzles
(Derksen et al., 1999; Nuyttens, et al., 2010). The sales of the air inclusion nozzle are
also increasing in the market (Miller et al., 2011; Miyahara, 2012). For the working
mechanism of the air inclusion nozzle, a Venturi design near the pre-orifice section was
applied to inhale the outside air from an air inlet into the liquid flow passage. Then, the
air and liquid mix with each other in the mixing chamber and produce larger droplet
after leaving the nozzle tip.
The effect of the air inlet on spray performance of the air inclusion nozzles and
whether this kind of nozzle could be replaced by other cheaper nozzles has been
debated. On one hand, Derksen et al (1999) used tape to cover the air inlet to investigate
the influence of covering or restricting the air inlet on the droplet size characteristics,
liquid flow rate and drift deposit. The result showed that covering the air inlet increased
the liquid flow rate slightly, decreased the volume median diameter (Dv0.5) by less than
8.5%, decreased the volume percentage of droplets smaller than 100μm (V100) by less
than 1% and might affect other nozzle spray performance, such as spray coverage
which the test was not carried out. Therefore, the drift reduction ability which has a
close relationship with the volume of small droplets was not significantly affected by
covering or restricting the air inlet. Guler et al (2007) also investigated the droplet size,
spray pattern width, spray coverage and also the drift deposit of different types of
nozzles. They concluded that the spray performance of the air inclusion nozzles could
be achieved by normal flat fan nozzles with similar size of the nozzle tip with air
inclusion nozzles under reduced nozzle pressure. They also found that the spray of the

60
air inclusion nozzles with sealed air inlet and reduced nozzle pressure could achieve
spray performance which was similar to that produced by the same nozzle with
unsealed air inlet and normal nozzle pressure.
On the other hand, almost all the manufactures claim that the air inclusion nozzle
could produce droplet with included air within droplets which improve the deposit
efficiency of the droplets. Miller and Butler Ellis (2000) said that air inclusions within
droplets are probably crucial to modifying the droplet behaviour on impact with a target
surface, resulting in retention characteristics much closer to that of a finer spray. Other
research also brought forward that the presence of air within droplets influences droplet
size and velocity, impaction, retention, and spray drift (Combellack & Miller, 2001).
In addition, the quantitative study of the included air within droplets produced by air
inclusion nozzles was limited. Based on reviewed literatures, the cylinder method was
proved to be a better method to indirectly estimate the included air quantity within
droplets. Butler Eillis et al., (2002) obtained the spray liquid density by matching the
droplet velocities between the calculated and measured value. The result showed that
the quantity of included air depended on the air flow rate into the nozzle and the
quantity did not significantly affect the droplet size. However, this method was
established by the assumptions of droplet movement simulation and also needs the
measurement of the droplet velocity. Faggion et al., (2006) compared two different
methods for measuring the quantity of included air and concluded that the measurement
of the density of collected spray by a cylinder (Hereafter, cylinder method) could
discriminate differences between different air inclusion nozzle designs while the
measurement of impact force could only discriminate differences between an air
inclusion nozzle and a conventional nozzle. Using cylinder method, Dorr et al (2013)
found that spray mixtures significantly affect the spray liquid density of air inclusion
nozzles. The spray liquid density was approximately 1000kg m-3
when only water was

61
sprayed, which means no included air was found. This might be the reason that Guler et
al., (2007) doubts the existence of the included air within droplets.
Besides, the nozzle design and working parameters of the air inclusion nozzles are
different from each other between different manufactures and regions. Comparing with
the air inclusion nozzles used in other regions, the nozzle parameters which include key
nozzle design parameters and nozzle pressure of air inclusion nozzles used in Japan are
different. Therefore, the influence of the air inlet on the spray performance might also
be different.
The objective of this study were to investigate the influence of the air inlet design on
the spray performance of the air inclusion nozzle on boom sprayers used in Japan by
carrying out the measurement of the included air quantity, droplet size characteristics,
liquid flow rate, spray angle, deposit weight of spray liquid and also coverage rate.
4.2. Materials and methods
4.2.1. Spray nozzles
The design of KIRINASHI ES series nozzle (YAMAHO) follows the common design
principles of air inclusion flat fan nozzles. As shown in Fig. 14, the spray liquid goes
through the pre-orifice and mixed with the induced air entering from the air inlet by
Venturi effect to form a liquid jet with included air. A mixing chamber was created at
the downstream of the mixing throat by a two-hole washer to provide sufficient mixing
of the air and liquid. Finally, the air included droplets spray out from a rectangular
shaped nozzle tip.

62
The nozzle pressure of the ES series nozzle was from 1.0 to 1.5MPa, which is much
higher than that of the air inclusion flat fan nozzles being used on the boom sprayer in
other countries. Hardi Inject nozzle (HARDI) was compared as a typical low-pressure
air inclusion nozzle as follows. Compared with the pre-orifice diameter of Hardi Injet
nozzles, the pre-orifice diameter of KIRINASHI ES series nozzles is much smaller for
controlling the liquid flow rate with similar values when higher nozzle pressure was
used. In addition, the shape of the air inlet and the nozzle tip of KIRINASHI ES series
nozzles are rectangle while Hardi Injet nozzles have a circular air inlet and a nozzle tip
with ellipse shape. When the nozzle size increases, the size of the air inlet and the
nozzle tip increase with pre-orifice diameter for Hardi Injet nozzles, which is not the
case for KIRINASHI ES series nozzles. For KIRINASHI ES series nozzle, the sizes of
the air inlet remain the same as the size of the pre-orifice and the nozzle tip increase.
Figure 14 Design features of KIRINASHI ES series nozzles. The range of the pre-orifice diameter is
0.5 -1.1mm with a 0.1mm interval; the size of the air inlet and the diameter of the mixing throat keep
consistent; the corresponding range of the nozzle tip area is 0.57-2.19 mm2

63
There are 7 different nozzle numbers in the whole series of KIRINASHI ES nozzle
from No. 05 to 11. The nozzle number indicates the pre-orifice diameter of the nozzle
which means No. 05 nozzle has a 0.5mm diameter pre-orifice diameter. Besides, the
nozzle tip area increases when the pre-orifice diameter increases. In this study, 4 nozzle
numbers covering the whole series (No. 05, 07, 09, 11) were investigated under the
nozzle pressure of 1.0 and 1.5MPa for the measurements of included air quantity,
droplet size characteristics, liquid flow rate, spray angle, deposit weight of spray liquid
and coverage rate. A silicone sealant was used to seal the air inlet. The unsealed and
sealed groups were investigated to study the influence of the air inlet on the above spray
characteristics. The general information of the investigated nozzle in this study is shown
in Table 11. During the whole measurement, the average air temperature and the relative
humidity were 30℃ and 70%, respectively.
Table 11 General information of the investigated nozzle, including the nozzle number, nozzle
pressure and the processing of the air inlet
Nozzle number Nozzle pressure, MPa Processing of the air inlet
ES05a 1.00 Unsealed
ES07 1.50 Sealedb
ES09
ES11
a ES05, KIRINASHI ES series nozzle with the nozzle number of 05;
b Sealed, the air inlet was
sealed by the silicone sealant.
4.2.2. Measurement of included air within droplets
Fig. 15 shows the sketch of the measurement of the spray liquid density (Faggion et al.,
2006; Dorr et al., 2013). A higher spray liquid density indicates less quantity of included
air exists within droplets. Black curtains were used to create a relative static

64
environment without any potential air flow turbulence during the experiment. A 250ml
glass cylinder (2ml resolution) was placed right below the nozzle tip of the investigated
nozzle to collect the spray droplet with included air with a vertical distance of 1.0m
between the nozzle tip and the bottom of the cylinder. An automatic hygrothermograph
was placed near the spray nozzle to record the air temperature and the relative humidity
during the experiment.
The spraying was then carried out and a foam layer above the liquid surface with a
certain thickness was observed in the cylinder. In the previous study, liquid was sprayed
until the cylinder was approximately three quarters full (Faggion et al., 2006; Dorr et al.,
2013). However, it took too long time to achieve three quarters full for small pre-orifice
diameters (0.5 and 0.7mm) and the thickness of the foam layer decreases when
collecting time passed based on the pre test. Therefore, a fix spray duration of 10min
was set for the pre-orifice diameters of 0.5 and 0.7mm. After 10min spray, approximate
100ml of the foam and liquid was collected by the cylinder for 0.7mm pre-orifice
diameter. In addition, a fix spray duration of 6min was set for large pre-orifice diameters
(0.9 and 1.1mm) to collect approximate 100ml by the cylinder. After spraying, the
cylinder was removed on a flat surface nearby as soon as possible. Then, the scale on
the top of the foam was recorded to estimate the volume of spray. The weight of the
collected liquid was then measured by an electrical scale. The density of the spray liquid
and the average percentage of air within spray droplets were calculated based on the
equations (14)-(15) (Dorr et al., 2013).
1000
f
sV
w (14)
100
f
l
f
dV
wV
a
(15)
Where ρs: spray liquid density, kg m-3
; Vf: volume of spray, L; w: weight of spray, kg;

65
ad: percentage of air quantity in spray, %; ρl: density of spray liquid before spraying,
1000kg m-3
.
Figure 15 Sketch of the measurement of the spray liquid density. T&RH: a automatic
hygrothermograph used to record the air temperature and relative humidity
4.2.3. Measurement of droplet size characteristics
A laser diffraction analyser, LDSA-1400A (Nikkiso), was used in this study to measure
the droplet size characteristics. Using the accessory software, the volume distribution of
droplet sizes can be determined, in addition to important characteristics of droplet size
including volume diameters below which smaller droplets constitute 10%, 50% and
90% of the total volume (Dv0.1, Dv0.5 and Dv0.9), relative span factor indicating the
uniformity of the droplet size distribution (RSF), arithmetic mean diameter (D10),
surface mean diameter (D20), volume mean diameter (D30), Sauter mean diameter (D32),
the volume percentage of droplets smaller than 50μm (V50), 100μm (V100), 150μm
(V150), 200μm (V200) and 250μm (V250), respectively (Nuyttens et al., 2007). The
calculation equations for RSF, D10, D20, D30 and D32 were shown in the equations as
below (Eq. (16)-(20)).When measuring the droplet size characteristics, the vertical

66
distance between the nozzle and the laser beam was 0.3m. For each combination of the
nozzle size and nozzle pressure, the measurement was repeated five times. Tween 20
used in the measurement of the relative spray drift was also applied to tap water to
obtain a 0.1% w/w solution with similar physical properties to those of real pesticide
(Nuyttens, 2007). One automatic hygrothermograph was placed near the spray nozzle to
record the environment parameters during the experiment. During the measurement, the
average air temperature and the relative humidity were 30℃ and 70%, respectively.
Liquid flow rates were recorded by mass method and repeated 3 times.
5.0
1.09.0
v
vv
D
DDRSF
(16)
n
d
D
n
i
i 1
10 (17)
n
d
D
n
i
i 1
2
20 (18)
31
3
30n
d
D
n
i
i
(19)
n
i
i
n
i
i
d
d
D
1
2
1
3
32 (20)
Where di: the diameter of droplet i, μm; n: the total number of droplets.
4.2.4. Measurement of spray angle
One digital camera (FinePix F200EXR, Fujifilm) was used to take the photo of the
spray sheet at the area of the nozzle tip after adjusting the nozzle pressure and before

67
and measurement of the droplet size measurement. Image analysis software (IrfanView,
Irfan Skiljan, Graduate of Vienna University of Technology) was used to measure the
fan angle of the spray sheet by manually drawing two straight lines at the boundary
between spray sheet and air. The measurement by the software was repeated 5 times at
each spray.
4.2.5. Measurement of coverage rate
Fig. 16 shows the sketch of the measurement of the spray coverage rate. A wind tunnel
was used to conduct the test. The investigated nozzle was installed on an automatic
track with an average travel speed of 0.85m s-1
. The spray coverage at 1.0m below the
nozzle tip was obtained by using water-sensitive paper (WSP, 52×76mm, Spraying
system) to collect the spray deposit. The placement of 4 WSPs is also shown in Fig. 16.
4 culture dishes were used to measure the deposit weight of the spray liquid. WSPs were
dried and scanned by a portable scanner. Then a image processing software was used to
calculate the coverage rate of each spray (Coverage rate measurement software,
NARO).
Figure 16 Sketch of the measurement of the spray coverage rate

68
4.3. Results and Discussions
4.3.1. Included air within droplets
Fig. 17 and 18 show the comparisons of the spray liquid density and the percentage of
air quantity produced by the investigated nozzles between the unsealed and sealed
nozzles under two nozzle pressures. The ranges of the spray density were 599-729kg
m-3
and 845-953kg m-3
for the unsealed and sealed nozzle group, respectively. Besides,
the ranges of the percentage of air quantity were 27.12-40.13% and 4.74-15.49%,
respectively. The spray liquid density and the percentage of air quantity were
significantly different between the two groups (t-test, P<0.05). Therefore, it could be
concluded that sealing of the air inlet significantly decreased the quantity of the
included air within droplets under the investigated conditions. In addition, Faggion et al
(2006) showed that the included air quantity of air inclusion nozzles varied from
14-36% by different measuring methods. Comparing with the above result, the included
air quantity of KIRINASHI ES series nozzles was slightly higher. The reason might be
that the nozzle pressure used by KIRINASHI ES series nozzles was much higher than
that of other investigated air inclusion nozzles, which led to a much smaller pre-orifice
to control the liquid flow rate. Therefore, the diameter difference between the flow
passage prior to pre-orifice and the pre-orifice were larger than that of low pressure
nozzles. Based on the Venturi theory, the pressure differential, which controls the
included air quantity entering from the air inlet, is decided by the difference of the
liquid flow speed at the wider and narrower place. Because the larger diameter
difference means a larger difference of the liquid flow speed, it is possible that the
KIRINASHI ES series nozzle could produce the droplet with more included air quantity,
compared to the low pressure air inclusion nozzles.

69
0
200
400
600
800
1000
1200
Sp
ray
liq
uid
den
sity
, kg
m-3
Nozzle number and pressure combinations
Unsealed Sealed
0
5
10
15
20
25
30
35
40
45
Per
cen
tag
e o
f ai
r q
uan
tity
, %
Nozzle number and pressure combinations
Unsealed Sealed
Figure 17 Spray liquid density and the corresponding standard deviations of KIRINASHI ES series
nozzles (unsealed and sealed groups) under different nozzle number and pressure combinations.
ES5-1.0: KIRINASHI ES series nozzles with the nozzle number of 5 and the nozzle pressure of
1.0MPa
Figure 18 Included air quantity and the corresponding standard deviations of KIRINASHI ES
series nozzles (unsealed and sealed groups) under different nozzle number and pressure
combinations. ES5-1.0: KIRINASHI ES series nozzles with the nozzle number of 5 and the
nozzle pressure of 1.0MPa

70
4.3.2. Droplet characteristics and liquid flow rate
Fig. 19 shows the Dv0.5 of unsealed and sealed groups under different nozzle number
and pressure combinations. Though the Dv0.5 of unsealed group were relative larger than
that of sealed group except ES07 based on the average values, no significant difference
was found between the results of the two groups (t-test, P<0.05). Derksen et al (1999)
found that covering the air inlet increased the liquid flow rate slightly, decreased the
volume median diameter (Dv0.5) by less than 8.5%, decreased the volume percentage of
droplets smaller than 100μm (V100) by less than 1%. The high nozzle pressure might be
the reason why there was no significant difference of Dv0.5 between the two groups for
KINASHI ES series nozzles.
Table 12 shows the droplet size characteristics of the investigated sprays. The one way
ANOVA analysis was carried out for each droplet size characteristic between unsealed
and sealed groups. The analysis result shows that RSF, D50 and D100 of the two groups
0.0
50.0
100.0
150.0
200.0
250.0
300.0
350.0
Vo
lum
e m
edia
n d
iam
eter
(㎛
)
Nozzle number and pressure combinations
Unsealed Sealed
Figure 19 Volume median diameter (Dv0.5) and the corresponding standard deviations of
KIRINASHI ES series nozzles (unsealed and sealed groups) under different nozzle number and
pressure combinations. ES5-1.0: KIRINASHI ES series nozzles with the nozzle number of 5 and
the nozzle pressure of 1.0MPa
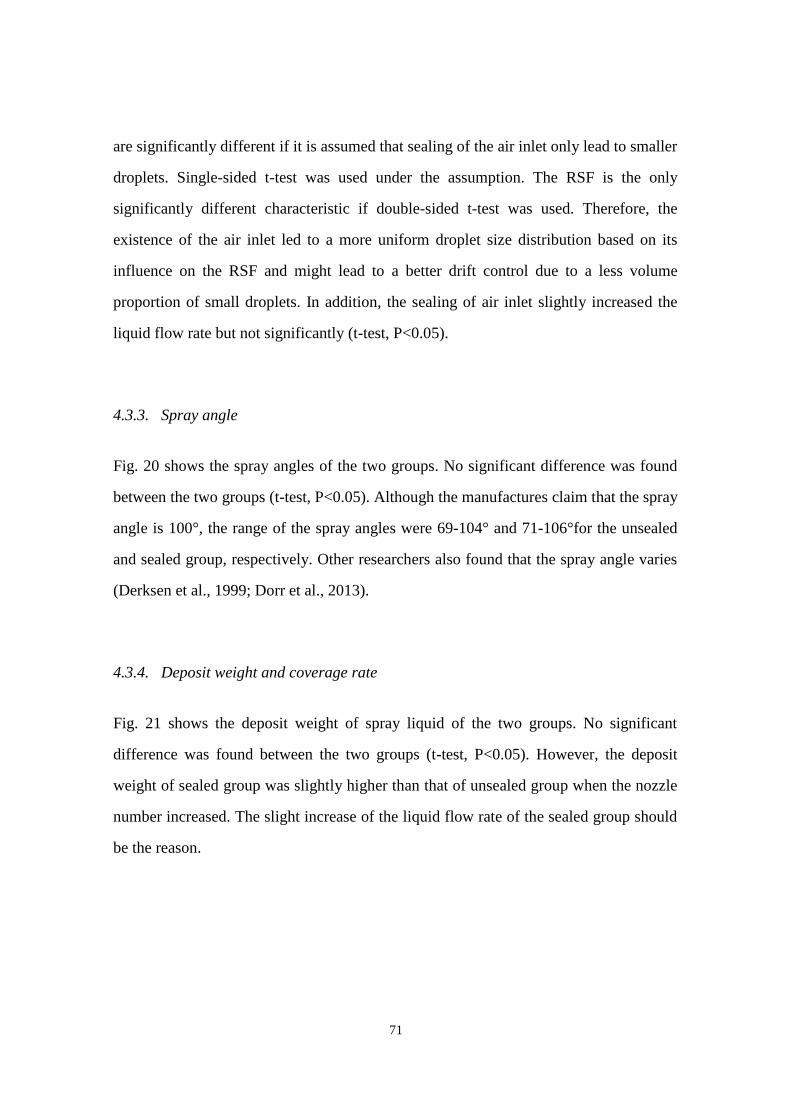
71
are significantly different if it is assumed that sealing of the air inlet only lead to smaller
droplets. Single-sided t-test was used under the assumption. The RSF is the only
significantly different characteristic if double-sided t-test was used. Therefore, the
existence of the air inlet led to a more uniform droplet size distribution based on its
influence on the RSF and might lead to a better drift control due to a less volume
proportion of small droplets. In addition, the sealing of air inlet slightly increased the
liquid flow rate but not significantly (t-test, P<0.05).
4.3.3. Spray angle
Fig. 20 shows the spray angles of the two groups. No significant difference was found
between the two groups (t-test, P<0.05). Although the manufactures claim that the spray
angle is 100°, the range of the spray angles were 69-104° and 71-106°for the unsealed
and sealed group, respectively. Other researchers also found that the spray angle varies
(Derksen et al., 1999; Dorr et al., 2013).
4.3.4. Deposit weight and coverage rate
Fig. 21 shows the deposit weight of spray liquid of the two groups. No significant
difference was found between the two groups (t-test, P<0.05). However, the deposit
weight of sealed group was slightly higher than that of unsealed group when the nozzle
number increased. The slight increase of the liquid flow rate of the sealed group should
be the reason.

72
Table 12 Droplet size characteristics and the corresponding standard deviations of KIRINASHI ES series nozzles (unsealed and sealed groups) under different
nozzle number and pressure combinations with the average values from 5 repetitions. ES5-1.0-U: KIRINASHI ES series nozzles with the nozzle number of 5 and
the nozzle pressure of 1.0MPa with unsealed air inlet; ES5-1.0-S: KIRINASHI ES series nozzles with the nozzle number of 5 and the nozzle pressure of 1.0MPa
with sealed air inlet
Samples Dv0.1 Dv0.5 Dv0.9 RSF D10 D20 D30 D32 D50 D100 D150 D200 D250
ES5-1.0-U 166.5±2.5 269.1±1.9 372.5±5.2 0.8±0.0 166.5±2.5 201.7±2.3 226.5±1.7 240.8±2.0 0.1±0.0 1.4±0.1 6.5±0.4 19.5±0.7 39. 9±0.9
ES5-1.0-S 133.8±4.0 254.9±2.0 388.8±9.4 1.0±0.0 133.8±4.0 173.3±3.5 202.9±2.4 211.4±3.2 0.6±0.1 4.4±0.6 13.5±0.9 29.0±0.8 47.9±0.8
ES5-1.5-U 137.0±3.1 233.7±1.9 332.7±3.5 0.8±0.0 137.0±3.1 169.8±3.0 193.3±2.3 204.7±2.7 0.3±0.1 3.3±0.4 13.1±0.9 33.0±1.0 58.1±1.0
ES5-1.5-S 90.8±6.8 197.7±4.9 328.0±3.3 1.2±0.1 90.8±6.8 124.0±7.0 150.4±6.5 152.0±8.8 2.5±0.8 12.5±2.0 29.7±2.6 50.9±1.9 70.4±0.8
ES7-1.0-U 177.8±3.2 300.6±3.2 421.3±5.1 0.8±0.0 177.8±3.2 218.0±3.1 249.7±3.3 262.9±3.7 0.1±0.0 1.4±0.2 5.5±0.5 15.1±0.9 29.9±1.2
ES7-1.0-S 189.7±1.8 310.3±2.3 424.8±4.1 0.8±0.0 189.7±1.8 230.1±2.1 260.6±2.0 276.4±2.4 0.1±0.0 0.9±0.0 4.0±0.2 12.0±0.4 25.6±0.8
ES7-1.5-U 160.9±2.6 272.9±2.9 389.2±6.1 0.8±0.0 160.9±2.6 198.6±2.6 226.1±2.3 239.6±2.6 0.2±0.0 1.9±0.2 7.6±0.5 20.4±0.8 39.2±1.1
ES7-1.5-S 161.8±1.7 279.6±2.6 401.3±4.9 0.9±0.0 161.8±1.7 201.5±1.7 230.1±1.7 243.5±1.8 0.2±0.0 1.9±0.1 7.5±0.3 19.6±0.5 37.1±0.8
ES9-1.0-U 187.0±1.6 307.2±2.4 420.6±3.4 0.8±0.0 187.0±1.6 227.1±2.0 257.8±1.9 272.9±2.3 0.1±0.0 0.9±0.0 4.2±0.2 12.7±0.4 26.7±0.8
ES9-1.0-S 182.0±1.7 304.0±3.0 422.0±5.7 0.8±0.0 182.0±1.7 222.1±2.2 253.8±2.3 267.7±2.8 0.1±0.0 1.1±0.1 4.9±0.2 14.0±0.5 28.4±0.9
ES9-1.5-U 161.7±2.7 272.1±3.2 386.5±4.3 0.8±0.0 161.7±1.7 199.0±3.2 226.0±2.9 239.7±3.3 0.1±0.0 1.8±0.2 7.4±0.5 20.3±1.0 39.4±1.4
ES9-1.5-S 143.0±1.6 263.0±1.1 393.7±3.4 1.0±0.0 143.0±2.7 182.2±0.9 212.6±0.8 222.0±1.1 0.4±0.0 3.4±0.2 11.3±0.3 25.8±0.3 44.4±0.4
ES11-1.0-U 159.7±2.6 273.3±1.7 391.9±2.8 0.8±0.0 159.7±2.6 197.8±2.6 225.7±2.1 239.1±2.5 0.2±0.0 2.0±0.2 7.8±0.5 20.7±0.8 39.2±0.8
ES11-1.0-S 136.6±1.7 259.8±1.9 395.4±3.3 1.0±0.0 136.6±1.7 177.4±1.6 207.8±2.0 215.9±1.9 0.5±0.0 4.1±0.2 12.7±0.4 27.6±0.6 46.0±0.7
ES11-1.5-U 142.1±1.8 252.6±1.0 368.5±2.9 0.9±0.0 142.1±1.8 179.1±1.1 206.3±1.4 216.6±1.4 0.3±0.0 3.2±0.2 11.6±0.4 27.8±0.5 48.7±0.5
ES11-1.5-S 112.2±1.7 228.5±1.9 362.6±2.3 1.1±0.0 112.2±1.7 149.6±1.8 178.4±1.8 183.0±2.3 1.2±0.1 7.4±0.3 20.1±0.6 38.6±0.8 58.3±0.7

73
Figure 20 Spray angle and the corresponding standard deviations of KIRINASHI ES series
nozzles (unsealed and sealed groups) under different nozzle number and pressure combinations.
ES5-1.0: KIRINASHI ES series nozzles with the nozzle number of 5 and the nozzle pressure of
1.0MPa
Figure 21 Deposit weight of spray liquid and the corresponding standard deviations of
KIRINASHI ES series nozzles (unsealed and sealed groups) under different nozzle number and
pressure combinations. ES5-1.0: KIRINASHI ES series nozzles with the nozzle number of 5 and
the nozzle pressure of 1.0MPa
40
60
80
100
120
Sp
ray
an
gle
, deg
ree
Nozzle number and pressure combinations
Unsealed Sealed
-0.02
-0.01
0
0.01
0.02
0.03
0.04
0.05
0.06
0.07
0.08
Dep
osi
t wei
gh
t of
spra
y li
qu
id (
g)
Nozzle size and pressure combinations
Unsealed Sealed

74
Fig. 22 shows the coverage rate of the two groups. It was expected that the
coverage rate of the unsealed group could be significantly higher than that of sealed
group due to the significantly higher quantity of included air when the Dv0.5, liquid
flow rate, deposit weight of spray liquid and spray angle had no significantly
difference between the two groups. However, no significant difference was found
between the two groups (t-test, P<0.05). In addition, Fig. 21 and 22 also indicated that
higher deposit weights of spray liquid might result in higher coverage rates. Besides,
because the results of the D50 and D100 indicated that the unsealed group had the
potential to decrease the volume proportion of small droplets, using unsealed group
might have a better drift control while keeping the coverage rate as same as the sealed
group.
Figure 22 Coverage rate and the corresponding standard deviations of KIRINASHI ES
series nozzles (unsealed and sealed groups) under different nozzle number and pressure
combinations. ES5-1.0: KIRINASHI ES series nozzles with the nozzle number of 5 and the
nozzle pressure of 1.0MPa
0
10
20
30
40
50
60
Co
ver
age
rate
, %
Nozzle number and pressure combinations
Unsealed Sealed

75
4.4. Conclusion
To get a better understanding of the role air inlet design plays in the air inclusion
nozzle, the influence of the air inlet design on the included air within droplets, droplet
size characteristics, liquid flow rate, spray angle, deposit weight of spray liquid and
coverage rate of the KIRINASHI ES series air inclusion nozzle was carried out.
The result showed that the quantity of the included air within droplets was
significantly different between the unsealed and sealed group. In addition, the sealing
of the air inlet significantly decreased the quantity of the included air within droplets
under the investigated conditions. Besides, the included air quantity of KIRINASHI
ES series nozzles was slightly higher, comparing with that of low pressure air
inclusion nozzles based on previous research. No significant difference of Dv0.5 was
found between the results of the two groups. The existence of the air inlet led to a
more uniform droplet size distribution based on its influence on the RSF and might
lead to better drift control due to a less volume proportion of small droplets. In
addition, the sealing of air inlet slightly increased the liquid flow rate but not
significantly. For the spray angle, no significant difference of the spray angle was
found between the two groups. Although the manufacture claims that the spray angle
is 100°, the range of the spray angle varies under different nozzle number and
pressure combinations. For the deposit weight of spray liquid, no significant
difference were found between the two groups. However, the deposit weight of sealed
group was slight higher than that of unsealed group when the nozzle number
increased. The test of the coverage rate of the two groups showed that no significant
difference was found between the two groups. However, based on the results of the
D50 and D100, it could be concluded that the unsealed group might have the potential
to decrease the volume proportion of small droplets and have a better drift control
while keeping the coverage rate as same as the sealed group.
76
Chapter 5 Summary
5.1. Characteristics and classification of Japanese nozzles based on relative spray
drift potential
In conclusion, the relative drift potential for one series of drift reduction nozzles used
in Japan was measured under different combinations of nozzle size, pressure and
height. The results reveal that the influence of nozzle height and nozzle size on the
index value were statistically significant (**P < 0.01), whereas the nozzle pressure
has a significant effect (**P < 0.01) on the index value only for nozzle sizes of 05 and
07. Compared with the reference spray, the ES series nozzles had drift reduction
abilities above 50% when the nozzle height was between 0.3 and 0.5 m, except for the
ES 05 nozzle. According to the spray distribution performance, the best nozzle height
range is between 0.3m and 0.4m above the crop canopy. The results provided the
users objective information for the relative drift reduction performance of ES nozzles
and could also be expanded as more types of drift reduction nozzles become available.
5.2. The influence of nozzle parameters on the droplet size characteristics, spray
angle, liquid flow rate and included air within droplers for the high pressure air
inclusion nozzle used in Japan
In conclusion, the influence of the key nozzle design parameters for high-pressure air
inclusion nozzles, which includes pre-orifice diameter and nozzle tip area on the
droplet size characteristics, spray angle, included air within droplet and liquid flow
rate were investigated under different nozzle pressures. The combinations of 7
pre-orifice diameters, 6 nozzle tip areas and 3 nozzle pressures, were tested in the
pre-test and 93 stable spray conditions were chosen to carry out the measurement of
droplet size characteristics, spray angle and liquid flow rate. The correlation analysis
among important droplet size characteristics were carried out. The result shows that

77
most of the characteristics had relative high average values which mean they could be
used to represent other characteristics. Therefore, Dv0.5 was used to carry out the
regression analysis between key design parameters and the droplet size characteristics
under different nozzle pressures.
The result of the multivariate regression analysis between the key nozzle design
parameters and Dv0.5 under different nozzle pressures shows that nozzle tip area,
pre-orifice diameter and nozzle pressure were found to have significantly effect on the
Dv0.5 (P<0.05) with a coefficient of determination (R2) of 0.81. The positive
proportion relation between the nozzle tip area and the Dv0.5 was found. In addition,
pre-orifice diameter was negative proportional with the Dv0.5 and this trend was not
reported in the previous study. The further investigation should be carried out to
explain the result. In addition, nozzle pressure was found to be negative proportional
to the Dv0.5 due to the more sufficient atomization under higher nozzle pressure.
The results of the multivariate regression analysis between the key nozzle design
parameters and spray angle under different nozzle pressures shows that the influence
of nozzle pressure and pre-orifice diameter on the spray angle were significant while
the effect of nozzle tip area was not (P<0.05). In addition, pre-orifice diameter and
nozzle pressure were found to be positive proportional to the spray angle. The result
shows that the nozzle pressure and pre-orifice diameter controlled the liquid flow rate
with a R2 value of 0.98. From 22 investigated sprays, the regression equation between
the key nozzle design parameters and the spray liquid density was obtained. The
pre-orifice diameter and nozzle tip area significantly affect the spray liquid density.
The influence of the pre-orifice diameter and nozzle tip on droplet size characteristics
might be the main reason why the two design parameters significantly influence the
spray liquid density.
78
5.3. The influence of the air inlet design on the spray performance of the air
inclusion nozzle used in Japan
To get a better understanding of the role air inlet design plays in the air inclusion
nozzle, the influence of the air inlet design on the included air within droplets, droplet
size characteristics, liquid flow rate, spray angle, deposit weight of spray liquid and
coverage rate of the KIRINASHI ES series air inclusion nozzle was carried out.
The result showed that the quantity of the included air within droplets was
significantly different between the unsealed and sealed group. In addition, the sealing
of the air inlet significantly decreased the quantity of the included air within droplets
under the investigated conditions. Besides, the included air quantity of KIRINASHI
ES series nozzles was slightly higher, comparing with that of low pressure air
inclusion nozzles based on previous research. No significant difference of Dv0.5 was
found between the results of the two groups. The existence of the air inlet led to a
more uniform droplet size distribution based on its influence on the RSF and might
lead to better drift control due to a less volume proportion of small droplets. In
addition, the sealing of air inlet slightly increased the liquid flow rate but not
significantly. For the spray angle, no significant difference of the spray angle was
found between the two groups. Although the manufacture claims that the spray angle
is 100°, the range of the spray angle varies under different nozzle number and
pressure combinations. For the deposit weight of spray liquid, no significant
difference were found between the two groups. However, the deposit weight of sealed
group was slight higher than that of unsealed group when the nozzle number
increased. The test of the coverage rate of the two groups showed that no significant
difference was found between the two groups. However, based on the results of the
D50 and D100, it could be concluded that the unsealed group might have the potential
to decrease the volume proportion of small droplets and have a better drift control
while keeping the coverage rate as same as the sealed group.
79
References
Baetens, K., Ho, Q., T., Nuyttens, D., De Schampheleire, M., Endalew, A., Hertog, M., Nicolaï, B.,
Ramon, H., Verboven, P., 2009. Development of a 2-D-diffusion advection model for fast
prediction of field drift. Atmospheric Environment, 43, 1674-1682.
Butler Ellis, M., C., Swan, T., Miller, P., C., H,, Waddelow, S., Bradley, A., Tuck, C., R., 2002.
Design factors affecting spray characteristics and drift performance of air induction nozzles.
Biosystems Engineering. 82(3), 289-296.
Carlsen, S.C.K., Spliid, N.H., Svensmark, B., 2006. Drift of 10 herbicides after tractor spray
application. 2. Primary drift (droplet drift). Chemosphere. 64, 778-786.
Cremlyn, R., J., 1991. Agrochemicals: preparation and mode of action. West Sussex: John Wiley
& Sons Ltd. P3-6.
Combellack, J., H., Miller, P., C., H., 2001. Effect of adjuvants on spray patternation and the
volume of air inducted by selected nozzles. Proceedings 6th International Symposium on
Adjuvants for Agrochemicals. 557-562.
Derksen, R., C., Ozkan, H., E., Fox, R., D., Brazee, R., D., 1999. Droplet spectra and wind tunnel
evaluation of Venturi and pre-orifice nozzles. Transactions of the ASAE. 42(6), 1573-1580.
Donkersley, P., Nuyttens, D., 2011. A meta analysis of spray drift sampling: drift in drift. Crop
Protection. 30, 931-936.
Dorr, G., J., Hewitt, A., J., Adkins, S., W., Hanan J., Zhang, H., C., Noller, B., 2013. A
comparison of initial spray characteristics produced by agricultural nozzles. Crop Protection. 52,
109-117.
Faggion. F., Miller, P., C., H., Butler Ellis, M., C., 2006. Techniques for assessing the quantity of
included air in droplets produced by air induction nozzles. Aspects of Applied Biology. 77,
163-170.
Fritz, B.K., Hoffmann, W.C., Jank, P., 2011. A fluorescent tracer method for evaluating spray
transport and fate of field and laboratory spray applications. Journal of ASTM International. 8,
1-9.
Herbst, A., 2001. A method to determine spray drift potential from nozzles and its link to buffer
zone restrictions. ASAE International Meeting, Sacramento, California, Paper number: 01-1047.
Food and Agriculture Organization of the United Nations (FAO), 2005. International code of
80
conduct on the distribution and use of pesticides, revised version. Rome. P6.
Grube, A., Donaldson, D., Kiely T., Wu L., 2011. Pesticides industry sales and usage: 2006 and
2007 market estimates. United States Environmental Protection Agency (EPA). P4, P8.
Guler, H., Zhu, H., Ozkan, H., E., Derksen, R., C., Yu, Y., Krause, C., R, 2007. Spray
characteristics and drift reduction potential with air induction and conventional flat-fan nozzles.
Transactions of the ASABE. 50(3), 745-754.
Herbst, A., 2001. A method to determine spray drift potential from nozzles and its link to buffer
zone restrictions. ASAE International Meeting, Sacramento, California, Paper number, 01-1047.
ISO 22856, 2008. Equipment for crop protection – Methods for the laboratory measurement of
spray drift – Wind tunnels.
Japan Plant Protection Association, 2004. Report of the investigation and research of the
technology development of the spray drift control. P57-61, P150-151. (in Japanese)
Japan Plant Protection Association, 2005. Report of the investigation and research of the spray
drift strategy. P38-42. (in Japanese)
Japan Plant Protection Association, 2006. Report of the investigation and research of the spray
drift strategy. (in Japanese)
Japan Plant Protection Association, 2010. Menu of technical countermeasures for spray drift.
Japan Plant Protection Association. (in Japanese)
Kanazawa, J., 1992. Environmental science of pesticide: the movement of pesticide in the
environment and its influence on untargeted organism. Koudou Press. P21. (in Japanese)
Kennedy, M., C., Butler Ellis, M.C., Miller, P.C.H., 2012. BREAM: A probabilistic bystander and
resident exposure assessment model of spray drift from an agricultural boom sprayer. Computers
and Electronics in Agriculture, 88, 63-71.
Knutson, R., D., 1999. Economic impacts of reduced pesticide use in the united states:
measurement of costs and benefits. AFPC Policy Issues Paper 99-2.
Kubota, Y., Usui, Y., Hayashi, K., Mizukami, M., Miyahara, S., Osato, D., Nakano, K., 2010.
Development of image-processing software for simple and high-precision measurement of
cover-area ratio on water-sensitive paper. Agricultural Information Research. 19, 16-22. (In
Japanese)
Kuwano, E., Shuto Y., Tamura H., 2004. Science of pesticide: biocontrol and crop protection.
Asakura Publishing Co. Ltd. P3-9. (in Japanese).

81
Miller, P.C.H., Butler Ellis, M.C., 2000. Effects of formulation on spray nozzle performance for
applications from ground-based boom sprayers. Crop Protection. 19, 609-615.
Miller, P., C., H., Butler Ellis, M., C., Lane, A., G., Sullivan, C., M., O., Tuck, C., R., 2011.
Methods for minimizing drift and off-target exposure from boom sprayer applications. Aspects of
Applied Biology, 106, 281-288.
Miyahara, S., 2012. Recent advances and future prospects on pesticide application equipment in
Japan. Proceedings of 4th International Sympsium on Pesticides and Environmental Safety,
Beijing, 253-254.
Miyahara, S., 2013. Recent situation and future prospects of pesticide application equipment in
Japan. The 33rd
Japan Agricultural Formulation and Application Symposium. Sep. 12-13,
Shizuoka, 16-23. (in Japanese)
Mizukami, T., Yoshida T., Miyahara, S., Oota, T., Oonishi, M, 2012. Reduced-drift nozzles for
high-volume dilute pesticide application. Proceedings of 4th International Sympsium on Pesticides
and Environmental Safety, Beijing, 248-249.
Nuyttens, D., 2007. Drift from field crop sprayers: the influence of spray application technology
determined using indirect and direct drift assessment means. PhD Dissertation nr. 772, Katholieke
Universiteit Leuven.
Nuyttens, D., Baetens, K., De Schampheleire, M., Sonck, B., 2007. Effect of nozzle type, size and
pressure on spray droplet characteristics. Biosystems Engineering. 97, 333-345.
Nuyttens, D., De Schampheleire, M., Baetens, K., Brusselman, E., Dekeyser, D., Verboven, P.,
2011. Drift from field crop sprayers using an integrated approach: Results of a 5 year study.
Transactions of the ASABE. 54(2), 403-408.
Nuyttens, D., Taylor, W.A., De Schampheleire, M., Verboven, P., Dekeyser, D., 2009. Influence of
nozzle type and size on drift potential by means of different wind tunnel evaluation methods.
Biosystems Engineering. 103, 271-280.
Parkin, C.S., Wheeler, P., 1996. Influence of spray induced vortices on the movement of drops in
wind tunnels. Journal of Agricultural Engineering Research. 63, 35-44.
Qi, L., J., Miller, P., C., H., Fu, Z., T., 2008. The classification of the drift of sprays produced by
spinning discs based on wind tunnel measurements. Biosystems Engineering. 100, 38-43.
Sado, K., Miyamoto, T., 2003. Agricultural pharmacology. Asakura Publishing Co. Ltd. P1-4. (in
Japanese)

82
Southcombe, E., S., E., Miller, P., C., H., Ganzelmeier, H., van de Zande, J., C., Miralles A.,
Hewitt A., J., 1997. The international (BCPC) spray classification system including a drift
potential factor. The Brighton Crop Protection Conference - Weeds. 371-380.
Taylor, W., A., Womac, A., R., Miller, P., C., H., Taylor, B., P., 2004. An attempt to relate drop size
to drift risk. Proceedings of the International conference on pesticide application for drift
management. 210-223.

83
Acknowledgments
First and foremost, I would like to express my deepest gratitude to my supervisor, Dr.
Kazuhiro Nakano, for his instructive discussions, precious advices and never-ending
encouragement. It was impossible for me to finish all the relative work without him.
I would like to express my gratitude to Dr. Ohashi for the countless help through all
these years. I would also like to thank Dr. Wang, Yang, Takizawa, Mr. Higuchi, Benz,
Chote, Ms. Nakamura, Mu, Mr. Miyashita, Hiroi, Kimura and all the former and
current undergraduate students who helped and supported me in the aspects of
research and life ever since I arrived Niigata. Without the help from NASER members,
the life of study abroad would be difficult.
I would like to thank Dr. Miyahara, Mr. Mizukami, Dr. Usui, Kubota and other
people in BRAIN who supported me to finish my experiment. I shall also express my
deep appreciation to Dr. Mizawa, Morii, Hasegawa, Yoshikawa, Watanabe and other
teachers who helped me during these years.
I would like to thank China Scholarship Council for the scholarship support in
these years.
Last but not least, I would like to thank all the friends I met in Niigata. Their
friendship supported me a lot.
Top Related