


Languages
Pages
Legal

Special Features of Women’s Economic Participation in MENA
Susan JoekesERF/IDRC Conference, Cairo,
24-25 October 2015
An international perspective
• A descriptive account to set the scene. What do the international statistics show? (draft report, OECD MENA-OECD Investment Initiative).
• Will lay out key indicators, some well known others more surprising.
• Covers labour supply, employment and entrepreneurship; bias towards paid work; not care work or working conditions (informality, precariousness, wages). Not explanation.
General findings• MENA has the lowest rates of any region of female labour force
participation and, even more, so employment: 1 in 5 women only. • A large pool of human capabilities (women’s labour/skills/
entrepreneurial potentials) is underutilised. • Women themselves try to make up for lack of paid employment
opportunity by becoming entrepreneurs, to a greater extent than men do.
• MENA has unusual patterns of 1) participation, peaked at 30yrs 2) employment by occupation (higher levels in top/tech/professional jobs and, notably, in the public sector).
• There is less information on gender demand than supply side issues, especially employment practices; statistical relation between employment and entrepreneurship is missing, as is detail on aspects of gender and entrepreneurship. For almost all measures, coverage of MENA countries is incomplete.
Women’s labour force participation
• Rates; characteristics of women entering LF• The labour force (i.e. employed, self-employed
or seeking employment; paid or unpaid). LFP indicates interest in working on women’s part
• MENA region has lowest FLFPR in the world, 1 in 4 adult women (Fig 1) - half low/middle income, OECD rates
• Big country variations within the region (Fig 2)
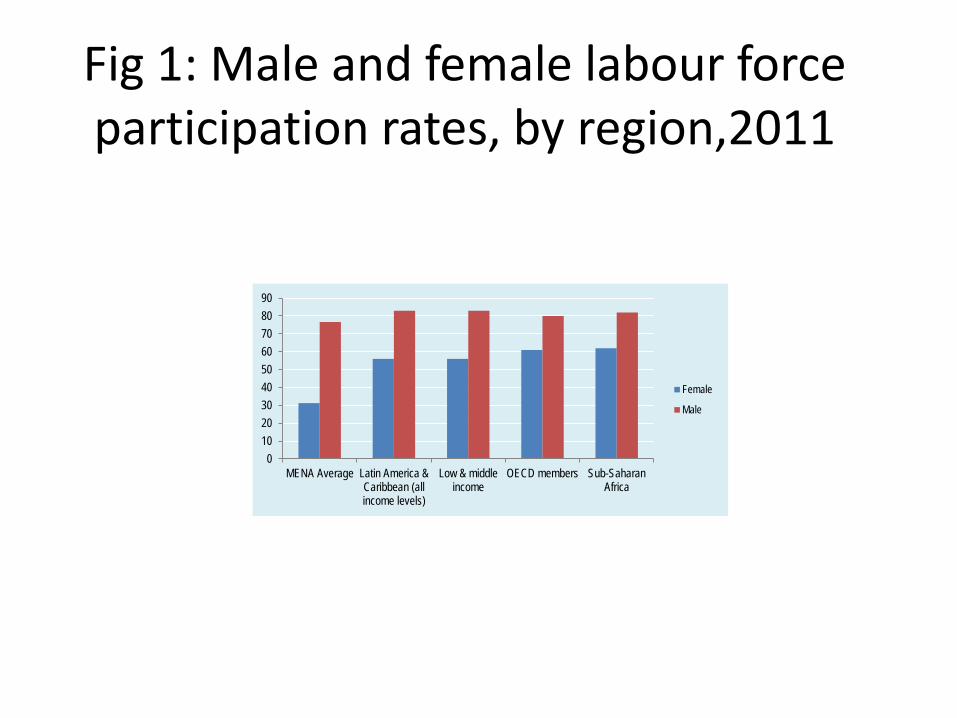
Fig 1: Male and female labour force participation rates, by region,2011
0102030405060708090
MENA Average Latin America &Caribbean (allincome levels)
Low & middleincome
OECD members Sub-SaharanAfrica
Female
Male

Fig 2: Labour force participation by gender, MENA countries, mid 2000s
0
10
20
30
40
50
60
70
80
90
100
Female (% population 15+)
Male (% of population 15+)
Women entering the labour force • Are increasingly well educated- as elsewhere, but more
so; extent of change in MENA is remarkable.• Tertiary education: in many countries, more F>M
graduates among working age adults. Variations: Egypt and Morocco, lower, nearer parity in Lebanon, WBGS, Jordan; very high in Algeria, GCC (Qatar (400%) (world no 1, but small total enrollment).
• M>F study engineering, but not all sciences. • Women with tertiary are twice+ as likely to participate
as women with secondary education (Egypt, Iraq, Jordan, Morocco, Tunisia)
• FLF mostly skewed towards younger ages (Fig 3a,3b)
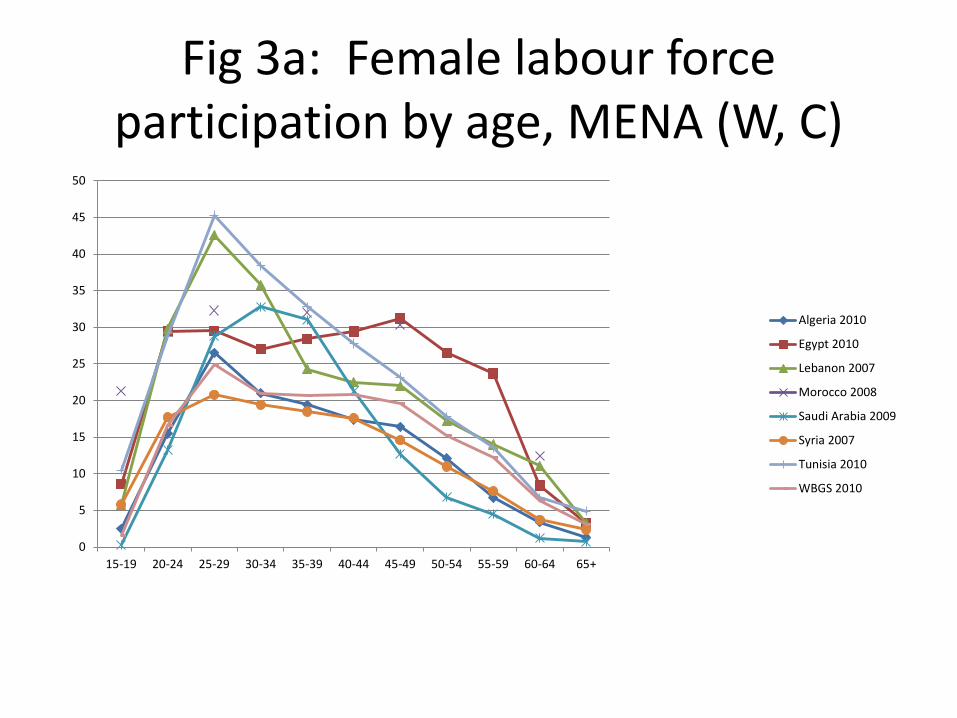
Fig 3a: Female labour force participation by age, MENA (W, C)
0
5
10
15
20
25
30
35
40
45
50
15-19 20-24 25-29 30-34 35-39 40-44 45-49 50-54 55-59 60-64 65+
Algeria 2010
Egypt 2010
Lebanon 2007
Morocco 2008
Saudi Arabia 2009
Syria 2007
Tunisia 2010
WBGS 2010
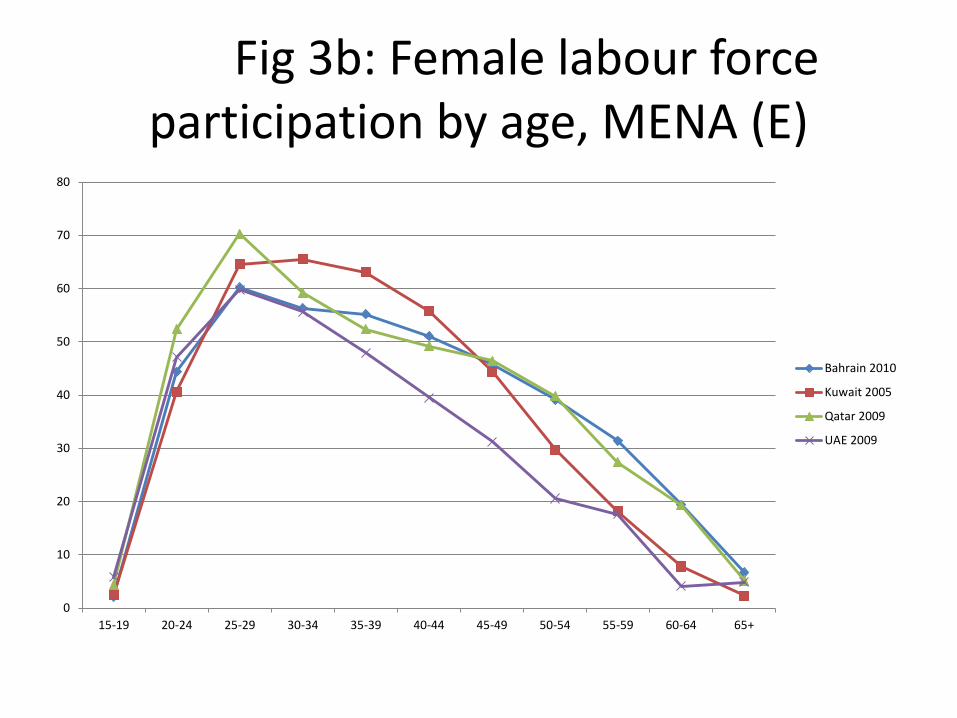
Fig 3b: Female labour force participation by age, MENA (E)
0
10
20
30
40
50
60
70
80
15-19 20-24 25-29 30-34 35-39 40-44 45-49 50-54 55-59 60-64 65+
Bahrain 2010
Kuwait 2005
Qatar 2009
UAE 2009
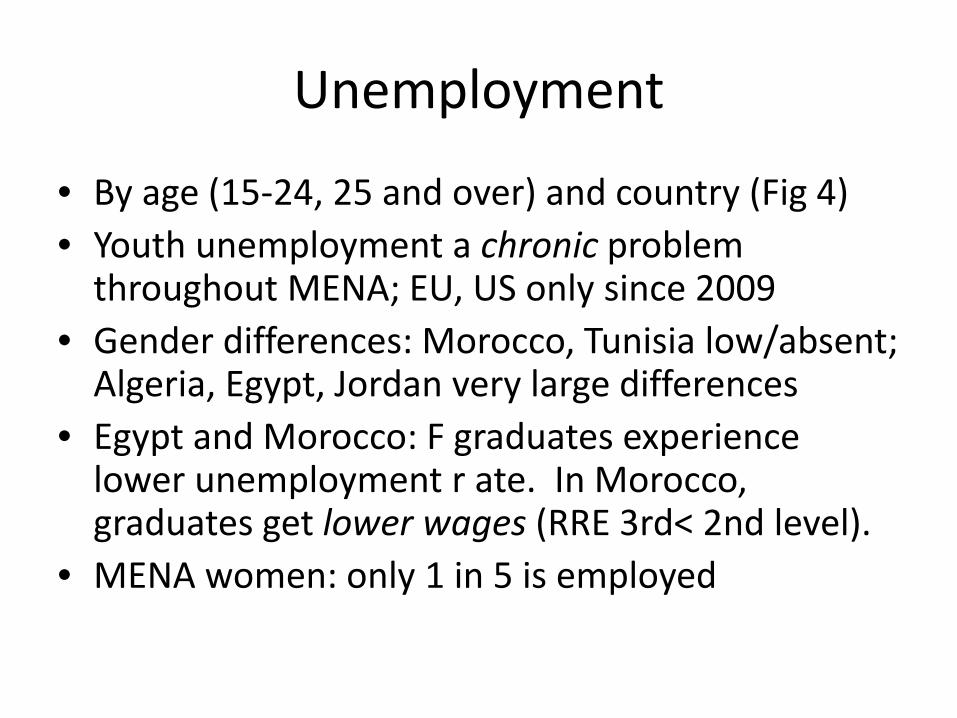
Unemployment
• By age (15-24, 25 and over) and country (Fig 4) • Youth unemployment a chronic problem
throughout MENA; EU, US only since 2009 • Gender differences: Morocco, Tunisia low/absent;
Algeria, Egypt, Jordan very large differences• Egypt and Morocco: F graduates experience
lower unemployment r ate. In Morocco, graduates get lower wages (RRE 3rd< 2nd level).
• MENA women: only 1 in 5 is employed
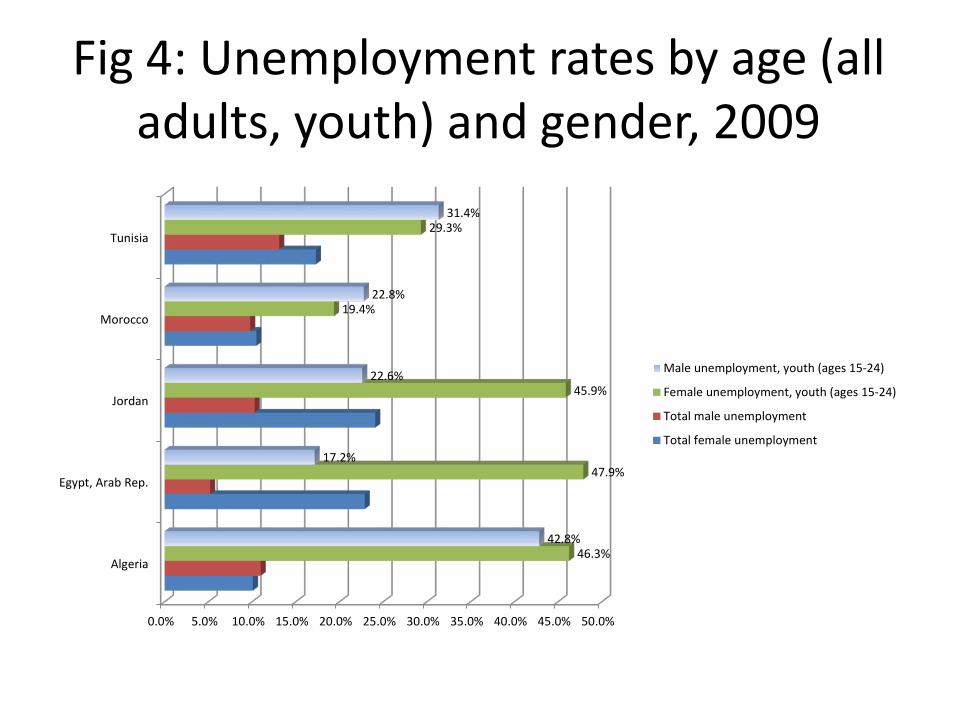
Fig 4: Unemployment rates by age (all adults, youth) and gender, 2009
0.0% 5.0% 10.0% 15.0% 20.0% 25.0% 30.0% 35.0% 40.0% 45.0% 50.0%
Algeria
Egypt, Arab Rep.
Jordan
Morocco
Tunisia
46.3%
47.9%
45.9%
19.4%
29.3%
42.8%
17.2%
22.6%
22.8%
31.4%
Male unemployment, youth (ages 15-24)
Female unemployment, youth (ages 15-24)
Total male unemployment
Total female unemployment
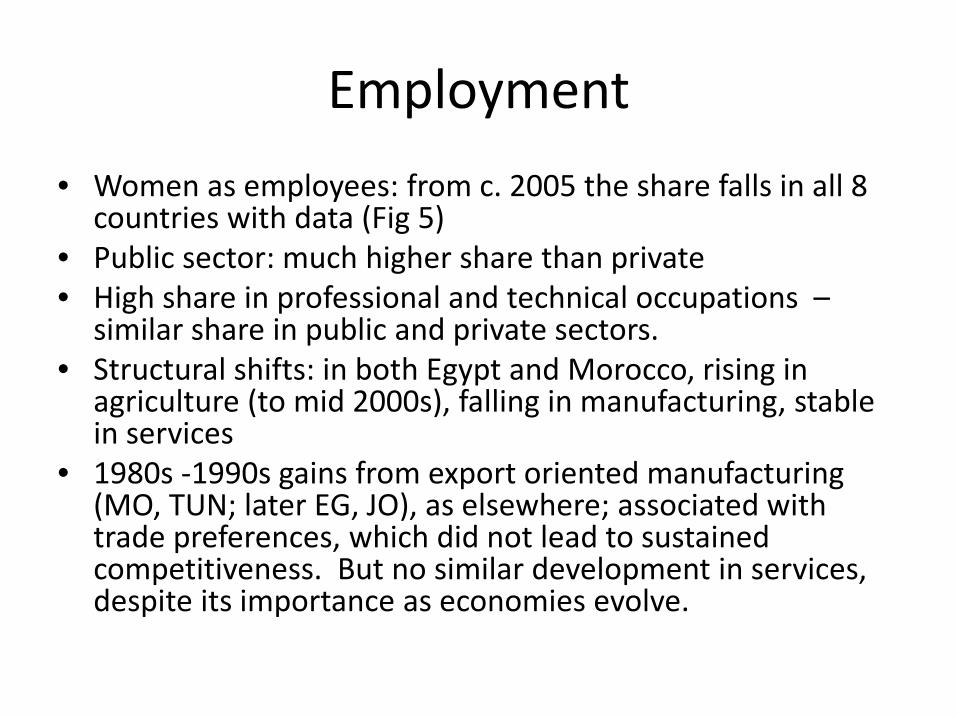
Employment • Women as employees: from c. 2005 the share falls in all 8
countries with data (Fig 5) • Public sector: much higher share than private• High share in professional and technical occupations –
similar share in public and private sectors. • Structural shifts: in both Egypt and Morocco, rising in
agriculture (to mid 2000s), falling in manufacturing, stable in services
• 1980s -1990s gains from export oriented manufacturing (MO, TUN; later EG, JO), as elsewhere; associated with trade preferences, which did not lead to sustained competitiveness. But no similar development in services, despite its importance as economies evolve.
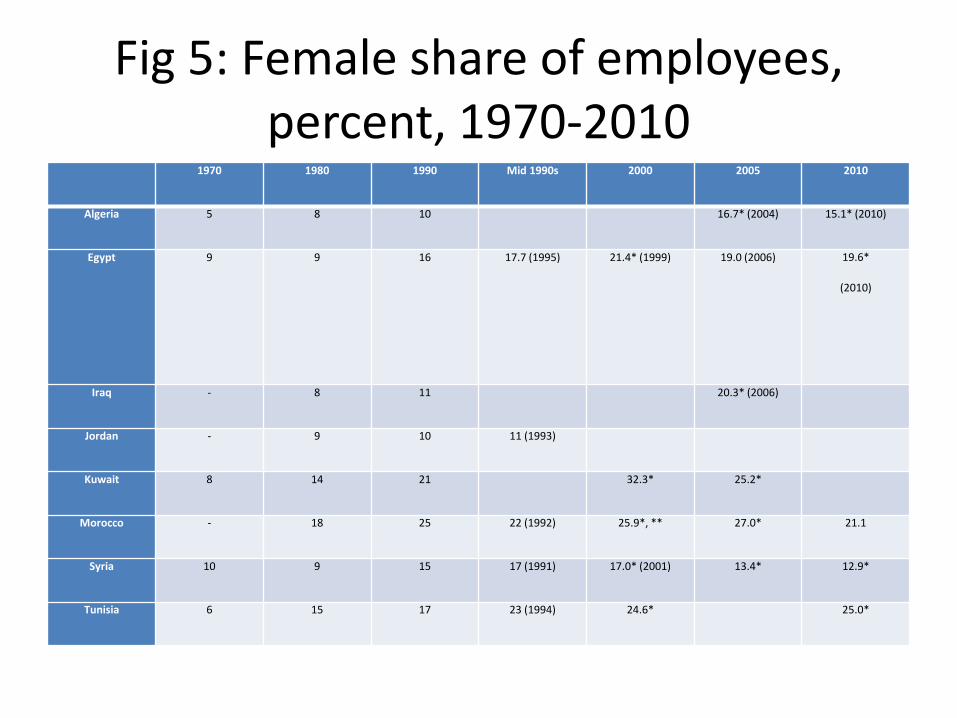
Fig 5: Female share of employees, percent, 1970-2010
1970 1980 1990 Mid 1990s 2000 2005 2010
Algeria 5 8 10 16.7* (2004) 15.1* (2010)
Egypt 9 9 16 17.7 (1995) 21.4* (1999) 19.0 (2006) 19.6*
(2010)
Iraq - 8 11 20.3* (2006)
Jordan - 9 10 11 (1993)
Kuwait 8 14 21 32.3* 25.2*
Morocco - 18 25 22 (1992) 25.9*, ** 27.0* 21.1
Syria 10 9 15 17 (1991) 17.0* (2001) 13.4* 12.9*
Tunisia 6 15 17 23 (1994) 24.6* 25.0*

Employment continued
• Demand side issues under-researched• Marital (civil) status of F employees: fall off in
FLFP suggests withdrawal from LF on marriage. In Morocco, the proportion of married women in formal organisations in the private sector is tiny; no other data.
• Leads into the next topic: entrepreneurship –a form of employment, but also more. LF data not good, other sources.
Gender and entrepreneurship
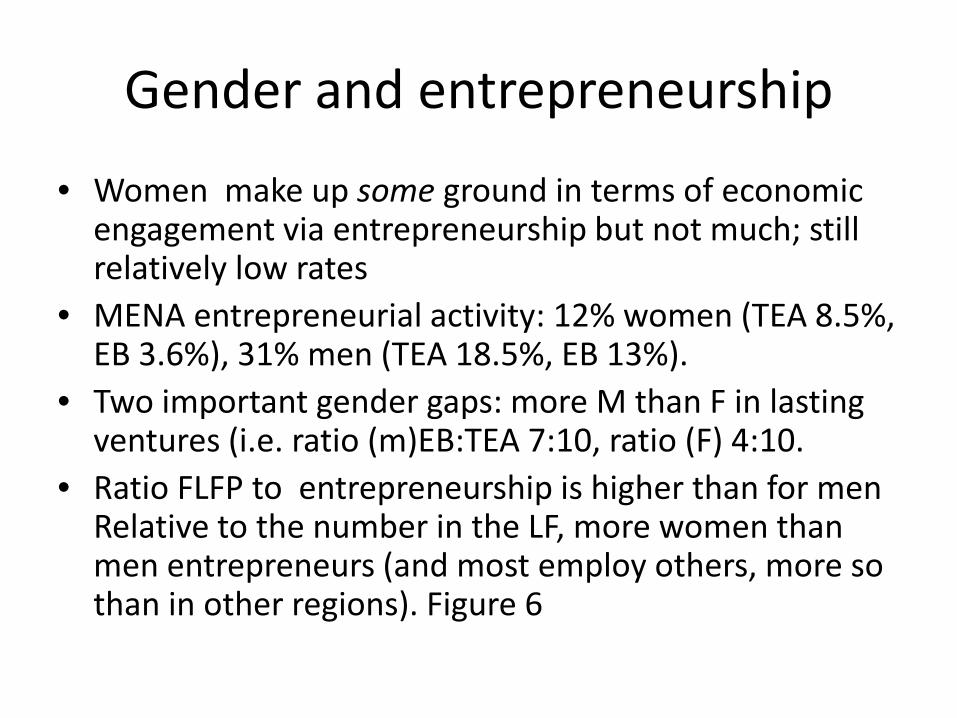
• Women make up some ground in terms of economic engagement via entrepreneurship but not much; still relatively low rates
• MENA entrepreneurial activity: 12% women (TEA 8.5%, EB 3.6%), 31% men (TEA 18.5%, EB 13%).
• Two important gender gaps: more M than F in lasting ventures (i.e. ratio (m)EB:TEA 7:10, ratio (F) 4:10.
• Ratio FLFP to entrepreneurship is higher than for men Relative to the number in the LF, more women than men entrepreneurs (and most employ others, more so than in other regions). Figure 6
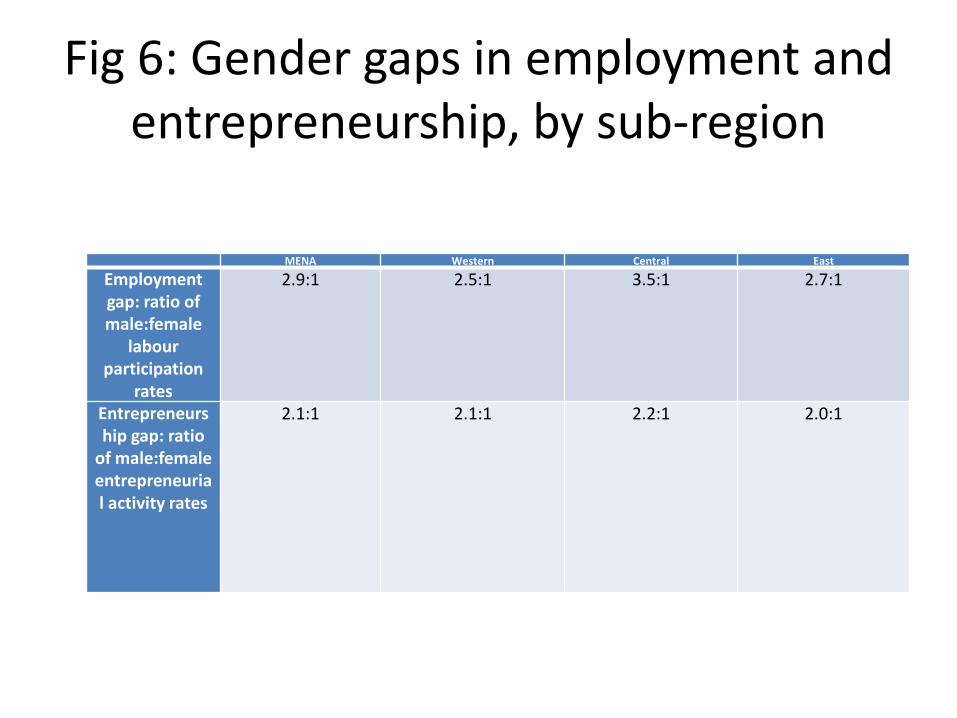
Fig 6: Gender gaps in employment and entrepreneurship, by sub-region
MENA Western Central East
Employment gap: ratio of male:female
labour participation
rates
2.9:1 2.5:1 3.5:1 2.7:1
Entrepreneurship gap: ratio
of male:femaleentrepreneurial activity rates
2.1:1 2.1:1 2.2:1 2.0:1
Gender and entrepreneurship (cont.) big country variations
• Maghreb (W) generally has higher entrepreneurship levels (M and F) (Fig 7)
• Morocco and Lebanon have highest general levels, especially of established businesses -
• as well as the highest rate of women’s entrepreneurial activity
• notably low levels of EB operation among women in Jordan, WBGS, Syria, Yemen.
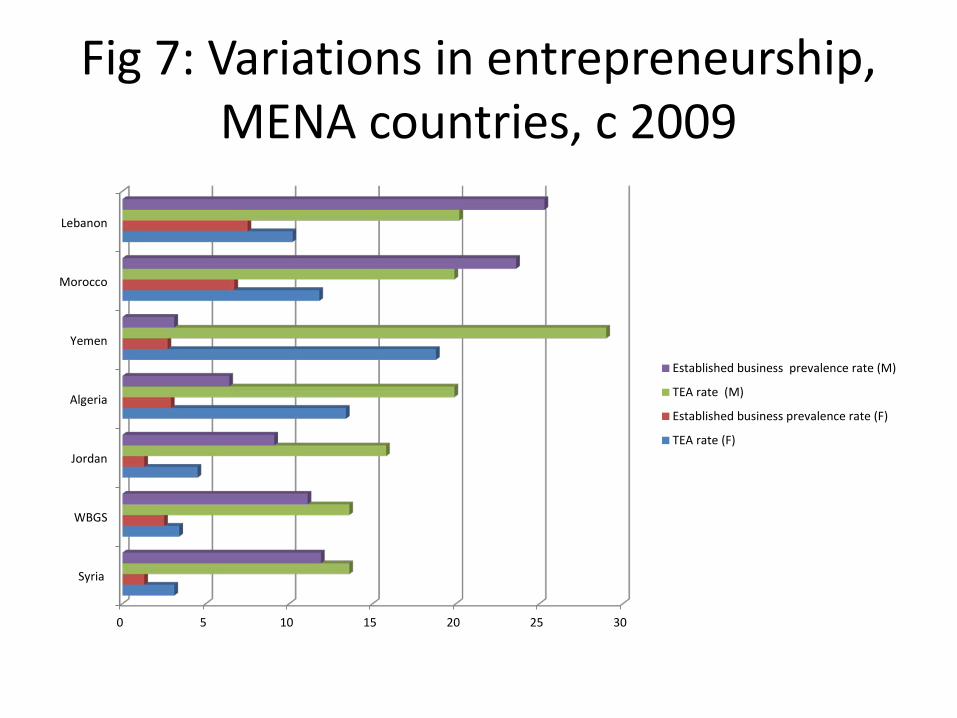
Fig 7: Variations in entrepreneurship, MENA countries, c 2009
0 5 10 15 20 25 30
Syria
WBGS
Jordan
Algeria
Yemen
Morocco
Lebanon
Established business prevalence rate (M)
TEA rate (M)
Established business prevalence rate (F)
TEA rate (F)
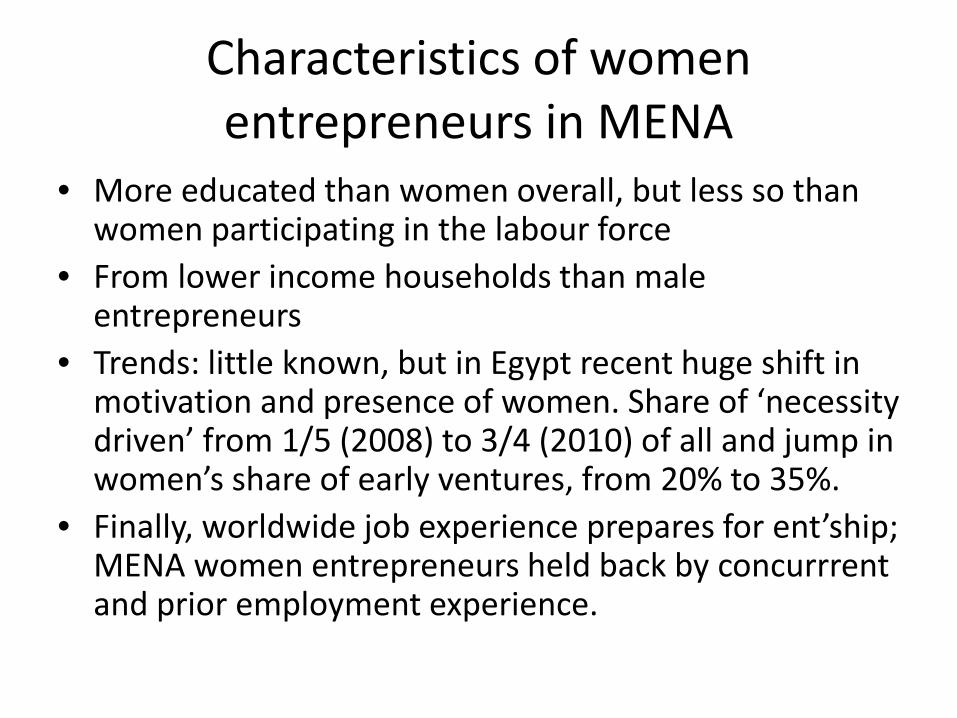
Characteristics of women entrepreneurs in MENA
• More educated than women overall, but less so than women participating in the labour force
• From lower income households than male entrepreneurs
• Trends: little known, but in Egypt recent huge shift in motivation and presence of women. Share of ‘necessity driven’ from 1/5 (2008) to 3/4 (2010) of all and jump in women’s share of early ventures, from 20% to 35%.
• Finally, worldwide job experience prepares for ent’ship; MENA women entrepreneurs held back by concurrrentand prior employment experience.
Business
• No reliable data on F owned businesses (‘formal’ – with 5+ employees) (source: WBES lax definitions) shows; gender characteristics of businesses unknown for same reason
• GEM EB data more interesting, giving information on size of entrepreneurial ventures by gender (Figure 8)
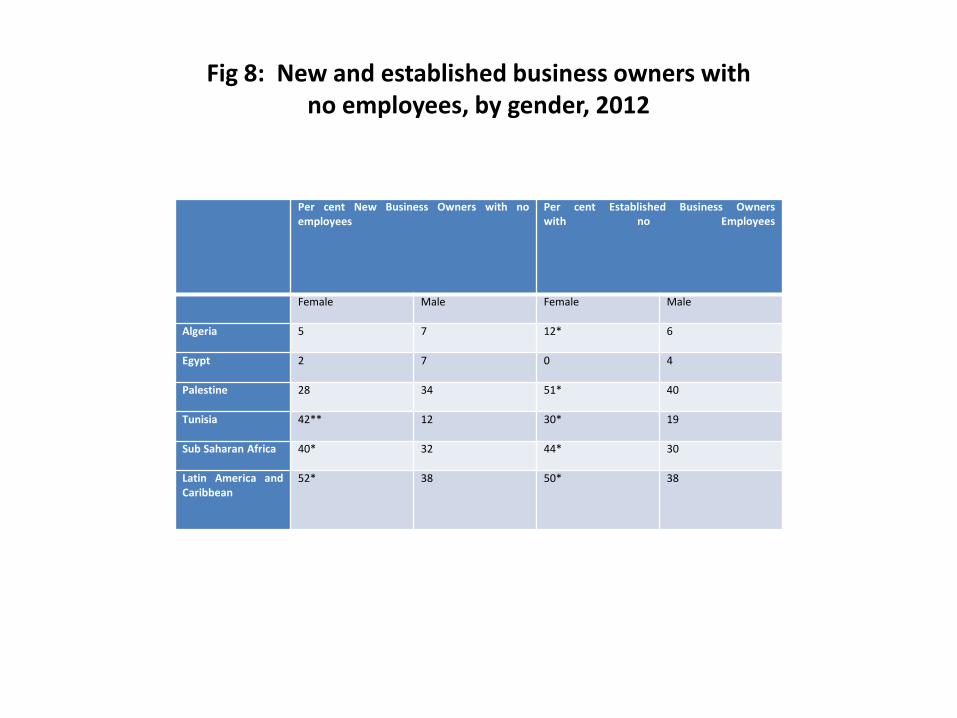
Fig 8: New and established business owners with no employees, by gender, 2012
Per cent New Business Owners with noemployees
Per cent Established Business Ownerswith no Employees
Female Male Female Male
Algeria 5 7 12* 6
Egypt 2 7 0 4
Palestine 28 34 51* 40
Tunisia 42** 12 30* 19
Sub Saharan Africa 40* 32 44* 30
Latin America andCaribbean
52* 38 50* 38
Thank you!
• Most of this material is from an OECD report, in draft, at: http://www.oecd.org/mena/investment/Statistical%20Portrait.pdf
• Special thanks to Ragui Assaad, Hala Hattaband Mona Said - though not implicated
• Comments, suggestions, more information and ideas please to Susan Joekes([email protected])
Top Related