


Languages
Pages
Legal

Atmos. Chem. Phys., 10, 5641–5662, 2010www.atmos-chem-phys.net/10/5641/2010/doi:10.5194/acp-10-5641-2010© Author(s) 2010. CC Attribution 3.0 License.
AtmosphericChemistry
and Physics
Spatial distribution and interannual variation of surface PM 10
concentrations over eighty-six Chinese cities
W. J. Qu1,2, R. Arimoto3,*, X. Y. Zhang2, C. H. Zhao1, Y. Q. Wang2, L. F. Sheng1, and G. Fu1
1Physical Oceanography Laboratory, Ocean-Atmosphere Interaction and Climate Laboratory, Department of MarineMeteorology, College of Physical and Environmental Oceanography, Ocean University of China, 238 Songling Rd., LaoshanDistrict, Qingdao 266100, China2Key Laboratory of Atmospheric Chemistry, Centre for Atmosphere Watch and Services (CAWAS), Chinese Academy ofMetrological Sciences, China Meteorological Administration, 46 Zhong-Guan-Cun S. Ave., Beijing 100081, China3Carlsbad Environmental Monitoring and Research Center, New Mexico State University, Carlsbad, New Mexico, USA* retired
Received: 5 September 2009 – Published in Atmos. Chem. Phys. Discuss.: 2 November 2009Revised: 21 May 2010 – Accepted: 18 June 2010 – Published: 29 June 2010
Abstract. The spatial distribution of the aerosols over 86Chinese cities was reconstructed from air pollution index(API) records for summer 2000 to winter 2006. PM10 (par-ticulate matter≤10 µm) mass concentrations were calculatedfor days when PM10 was the principal pollutant, these ac-counted for 91.6% of the total 150 428 recorded days. The 83cities in mid-eastern China (100◦ E to 130◦ E) were separatedinto three latitudinal zones using natural landscape featuresas boundaries. Areas with high PM10 level in northern China(127 to 192 µg m−3) included Urumchi, Lanzhou-Xining,Weinan-Xi’an, Taiyuan-Datong-Yangquan-Changzhi,Pingdingshan-Kaifeng, Beijing-Tianjin-Shijiazhuang, Jinan,and Shenyang-Anshan-Fushun; in the middle zone, highPM10 (119–147 µg m−3) occurred at Chongqing-Chengdu-Luzhou, Changsha-Wuhan, and Nanjing-Hangzhou; inthe southern zone, only four cities (Qujing, Guiyang,Guangzhou and Shaoguan) showed PM10 concentration>80 µg m−3. The median PM10 concentration decreasedfrom 108 µg m−3 for the northern cities to 95 µg m−3 and55 µg m−3 for the middle and southern zones, respectively.PM10 concentration and the APIs both exhibited wintertimemaxima, summertime minima, and the second highest valuesin spring. PM10 showed evidence for a decreasing trendfor the northern cities while in the other zones urban PM10levels fluctuated, but showed no obvious change over time.The spatial distribution of PM10 was compared with theemissions, and the relationship between the surface PM10concentration and the aerosol optical depth (AOD) was alsodiscussed.
Correspondence to:W. J. Qu([email protected])
1 Introduction
The atmospheric aerosol plays an important role in visibilityimpairment (Watson, 2002), and studies of potential aerosoleffects on climate have become of increasing interest follow-ing the pioneering work of Twomey (1977) and Charlsonet al. (1992). Concerns over adverse influences of particu-late matter (PM) on human health (Pope et al., 1995; Tie etal., 2009b) have added to the scientific and public interest inaerosol particles (hereinafter, simply aerosols).
Defining a representative aerosol distribution is essentialfor understanding the aerosols’ effects on climate, especiallyover regional scales. However, this is challenging becausethe atmospheric aerosol shows marked spatial and temporalvariations owing to the relatively short residence times of theparticles and the heterogeneity of their sources (Kaufman etal., 2002). Aerosol distributions over the continent are gen-erally regional because of the diversity in emissions (espe-cially anthropogenic sources), unevenness in population den-sity, and variations in terrain, which can concentrate air pol-lutants or enhance their dispersion. In this context, gradientsin aerosol concentrations obviously exist, and these result indifferences in the aerosols’ effects. For example, data froman aircraft study over the Los Angeles Basin revealed hor-izontal gradients in aerosol concentrations that could resultin variability of more than 50% within a 5×5 km computa-tional grid cell (Collins et al., 2000). Related studies overthe tropical Indian Ocean indicated that gradients in aerosolscould lead to an inter-hemispheric difference in the solarheating (Rajeev and Ramanathan, 2001). Along these samelines, a gradient in the aerosol optical depth (AOD) couldlead to difference in the reduction of the noontime solar fluxfrom as much as−38 W m−2 in the Arabian Sea to as little
Published by Copernicus Publications on behalf of the European Geosciences Union.
5642 W. J. Qu et al.: Chinese urban PM10 – spatial distribution and interannual variation
as−2 W m−2 south of the Intertropical Convergence Zone,thus producing a strong north to south gradient in the cli-mate forcing (Meywerk and Ramanathan, 1999). Recent re-search has confirmed a strong latitudinal gradient in the to-tal aerosol and black carbon (BC) over the Bay of Bengalwith both decreasing rapidly from north to south (Nair et al.,2008). In addition to these latitudinal aerosol gradients, astrong west-to-east gradient of BC has also been observedduring research cruises along latitudes of 30◦ N and 35◦ N inthe central Pacific Ocean; this was attributed to outflow fromAsia (Kaneyasu and Murayama, 2000).
As for the health impacts of air pollution, the sources ofair pollutants are mostly restricted to the earth’s surface; themain exception to this is aircraft emission in the upper tro-posphere (Highwood and Kinnersley, 2006). Meanwhile, ap-proximately 47% of the global population lives and works inurban areas, which are the most polluted parts of the planet.Investigations of surface air quality over urban areas andstrategies for its improvement are therefore compelling.
China, a developing country with the world’s largest popu-lation, has undergone rapid economic growth since economicreforms began in 1978. Along with urbanization and indus-trialization has come an increase in energy consumption, andthis has brought with it growing concerns over air pollution.Investigations of the spatial distribution and interannual vari-ations in the atmospheric aerosol and air pollutants are nec-essary to understand the aerosol’s potential effects on atmo-spheric chemical process and climate, these are also essentialfor the development and implementation of effective air pol-lution control strategies.
There have been numerous ground-based studies of theaerosol in China, including measurements of the physicaland/or chemical properties at remote sites (Tang et al., 1999;Li et al., 2000; Qu et al., 2008), regionally representative ru-ral sites (Xu et al., 2002; Wang et al., 2004a; Zhang et al.,2005) and urban sites in large and mega cities (Fang et al.,1999; Davis and Guo, 2000; He et al., 2001; Zhang et al.,2002; Cao et al., 2003; Ye et al., 2003; Ta et al., 2004; Duanet al., 2005, 2006; Wu et al., 2005; Zheng et al., 2005; Fenget al., 2006; Li et al., 2006, 2008; Meng et al., 2007; Chu etal., 2008; Deng et al., 2008a, 2008b). However, even takentogether, the existing studies do not provide a systematic pic-ture of the spatial distribution of the aerosol across China.This is in part because of the limited and discontinuous cov-erage of most observations and also because of difficultiesin inter-comparing results among research groups who usedifferent sampling instruments and analytical methods. As aresult, there is limited information on the spatial distributionof the surface aerosol across the country.
On the other hand, information on the spatial distribu-tion of aerosol over China has been obtained from radia-tion/optical measurement networks and satellite observations(Luo et al., 2000, 2001; Li et al., 2003; Wang et al., 2008).However, the columnar AOD or aerosol optical thickness(AOT) derived from these types of observations is influenced
by many factors including the vertical structure and height ofthe atmospheric mixing layer; therefore, the characteristicsand variations of the AOD/AOT will differ from those of thesurface aerosol as will be discussed in Sect. 3.7 below.
Chan and Yao (2008) and Fang et al (2009) have reviewedthe air pollution situations and air quality management prac-tices in Chinese mega cities. Another review (Shao et al.,2006) indicated high levels of airborne PM in megacitiessuch as Beijing, Shanghai, and Guangzhou as well as re-gional aerosol pollution in the vast region extending fromthe North China Plain (NCP) to the Yangtze River Delta re-gion (YRD) and the heavily urbanized Pearl River Delta re-gion (PRD). Tie et al. (2006a) characterized air pollution inEastern China and the Eastern US to assess the differencesbetween photochemical conditions in these two regions. Tieand Cao (2009a) discussed several crucial issues regardingaerosol pollution in the highly populated regions over China.A recent study (Song et al., 2009) characterized spatial andseasonal variations of PM10 concentrations (for 47 ground-based air quality monitoring sites) and the Moderate Resolu-tion Imaging Spectroradiometer (MODIS) AOD over Chinaduring the period 2003–2005, but interannual variations werenot considered.
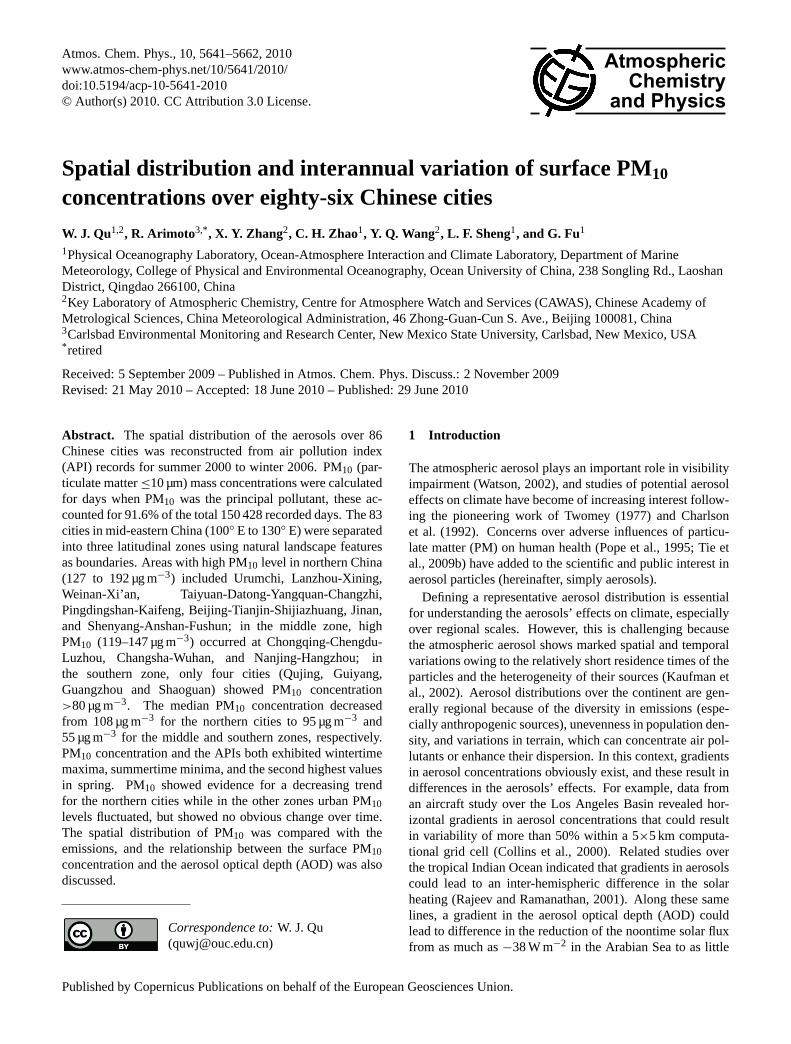
As inhalable particulate pollutant, PM10 (PM with diame-ters≤10 µm) is of primary concern for most Chinese cities,and PM10 is often reported as the principal pollutant (abbre-viation asPprin hereinafter, see below for definition) for ur-ban areas that are monitored by the Environmental ProtectionAgency of China (EPA-China). In this paper we make use of137845 daily air pollution index (API) records for eighty-sixmajor cities (Fig. 1, Table 1) to estimate the concentrationsof PM10 over urban areas in China. The results are then usedto study the spatial variability of PM10 and to evaluate itsseasonal and interannual variations.
The paper is organized as follows. In Section 2 we givean overview of methods and data. Section 3.1 presents oc-currences of the air quality categories for the cities. Sea-sonal variations of the APIs and PM10 are presented in Sec-tion 3.2, and the influence of Asian dust on the springtimeAPIs is presented in Section 3.3. Section 3.4 and 3.5 de-scribe spatial distribution of urban PM10 concentration ver-sus emissions and precipitation as well as the broad patternof latitudinal and longitudinal gradients in PM10 level for thecities; Section 3.6 presents interannual variation trends in ur-ban PM10 for northern, middle and southern China. Section3.7 presents comparison of PM10 variations with AOD/AOTresults, and the factors that influence the relationships be-tween PM10 and AOD/AOT are also discussed. Section 4finally gives conclusions.
Atmos. Chem. Phys., 10, 5641–5662, 2010 www.atmos-chem-phys.net/10/5641/2010/
W. J. Qu et al.: Chinese urban PM10 – spatial distribution and interannual variation 5643
Table 1. Locations, groups and air pollution index (API) data available period of the eighty-six cities in China.
Group (Representative area) City Latitude, Longitude API data perioda
G-1 Xining (XN) 36.62◦ N, 101.82◦ E A(Qinghai, Shizuishan (SZS) 39.02◦ N, 106.22◦ E CGansu and Yinchuan (YC) 38.47◦ N, 106.22◦ E ANingxia Province) Lanzhou (LaZ) 36.05◦ N, 103.83◦ E A
G-2 Baoji (BaJ) 34.35◦ N, 107.15◦ E C(Shaanxi Province) Xi’an (XA) 34.25◦ N, 108.92◦ E A
Weinan (WN) 34.30◦ N, 109.30◦ E C
G-3 Hohehot (HHT) 40.80◦ N, 111.63◦ E A(Inner Mongolian Chifeng (CF) 42.17◦ N, 118.58◦ E Cand Shanxi Datong (DT) 40.12◦ N, 113.22◦ E CProvince) Taiyuan (TY) 37.85◦ N, 112.55◦ E A
Yangquan (YQ) 37.51◦ N, 113.34◦ E CChangzhi (CZ) 36.08◦ N, 113.22◦ E C
G-4 Qiqihar (QHR) 47.37◦ N, 123.92◦ E C(Heilongjiang Harbin (HRB) 45.75◦ N, 126.63◦ E Aand Jilin Province) Mudanjiang (MDJ) 44.58◦ N, 129.60◦ E C
Changchun (CC) 43.92◦ N, 125.30◦ E A
G-5 Fushun (FS) 41.51◦ N, 123.54◦ E C(Liaoning Shenyang (SY) 41.80◦ N, 123.38◦ E AProvince) Anshan (AS) 41.06◦ N, 123.00◦ E C
G-6 Beijing (BeJ) 39.90◦ N, 116.47◦ E A(Beijing, Tianjin, Tianjin (TJ) 39.17◦ N, 117.17◦ E AHebei Province and Dalian City) Shijiazhuang (SJZ) 38.05◦ N, 114.43◦ E A
Qinhuangdao (QHD) 39.90◦ N, 119.62◦ E BDalian (DL) 38.90◦ N, 121.63◦ E B
G-7 Yantai (YT) 37.55◦ N, 121.33◦ E A(Shandong Qingdao (QD) 36.07◦ N, 120.32◦ E AProvince and Rizhao (RZ) 35.23◦ N, 119.32◦ E CLianyungang City) Lianyungang (LYG) 34.59◦ N, 119.16◦ E B
Weifang (WF) 36.43◦ N, 119.06◦ E CZibo (ZB) 36.48◦ N, 118.03◦ E CJinan (JNa) 36.67◦ N, 117.03◦ E ATai’an (TA) 36.11◦ N, 117.08◦ E CZaozhuang (ZZh) 34.52◦ N, 117.33◦ E CJining (JNi) 35.23◦ N, 116.33◦ E C
G-8 Kaifeng (KF) 34.87◦ N, 114.38◦ E C(Henan Province) Zhengzhou (ZhZ) 34.73◦ N, 113.70◦ E A
Pingdingshan (PDS) 33.44◦ N, 113.17◦ E C
a Here API data available period was denoted by A: from June 2000 to February 2007, B: from June 2001 to February 2007, C: from June2004 to February 2007, and D: from January 2006 to February 2007.
www.atmos-chem-phys.net/10/5641/2010/ Atmos. Chem. Phys., 10, 5641–5662, 2010
5644 W. J. Qu et al.: Chinese urban PM10 – spatial distribution and interannual variation
Table 1. Continued.
Group (Representative area) City Latitude, Longitude API data perioda
G-9 Hefei (HF) 31.85◦ N, 117.27◦ E A(Shanghai, Wuhu (WHu) 31.35◦ N, 118.33◦ E CAnhui, Nanjing (NJ) 32.05◦ N, 118.77◦ E AJiangsu, Yangzhou (YZ) 32.23◦ N, 119.26◦ E Cand Zhejiang Province) Zhenjiang (ZheJ) 32.11◦ N, 119.27◦ E C
Nantong (NT) 32.01◦ N, 120.51◦ E ASuzhou (SZ) 31.33◦ N, 120.65◦ E AShanghai (SH) 31.20◦ N, 121.43◦ E AHuzhou (HuZ) 30.52◦ N, 120.06◦ E CHangzhou (HaZ) 30.25◦ N, 120.17◦ E AShaoxing (SX) 30.00◦ N, 120.34◦ E CNingbo (NB) 29.88◦ N, 121.57◦ E B
G-10 Jiujiang (JJ) 29.72◦ N, 115.98◦ E C(Jiangxi, Hubei Nanchang (NCha) 28.68◦ N, 115.88◦ E Aand Hunan Wuhan (WHa) 30.62◦ N, 114.33◦ E AProvince) Jingzhou (JZ) 30.33◦ N, 112.18◦ E C
Changsha (CS) 28.20◦ N, 112.92◦ E AChangde (ChaD) 29.00◦ N, 111.65◦ E CZhangjiajie (ZJJ) 29.08◦ N, 110.29◦ E C
Nanchong (NCho) 30.49◦ N, 106.04◦ E DChongqing (CQ) 29.55◦ N, 106.55◦ E A
G-11 Luzhou (LuZ) 28.90◦ N, 105.45◦ E C(Chongqing and Zigong (ZG) 29.23◦ N, 104.46◦ E DSichuan Province) Chengdu (CheD) 30.65◦ N, 104.07◦ E A
Deyang (DY) 31.09◦ N, 104.22◦ E CMianyang (MY) 31.30◦ N, 104.42◦ E C
G-12 Qujing (QJ) 25.30◦ N, 103.48◦ E C(Yunnan Province) Kunming (KM) 25.05◦ N, 102.70◦ E A
Yuxi (YX) 24.22◦ N, 102.32◦ E C
G-13 Guiyang (GY) 26.57◦ N, 106.72◦ E A(Guangxi, Guilin (GL) 25.30◦ N, 110.17◦ E BGuizhou, Liuzhou (LiZ) 24.33◦ N, 109.32◦ E CHainan Province Nanning (NN) 22.78◦ N, 108.35◦ E Aand Beihai (BH) 21.28◦ N, 109.07◦ E BZhanjiang City) Zhanjiang (ZhaJ) 21.11◦ N, 110.24◦ E A
Haikou (HK) 20.05◦ N, 110.17◦ E A
G-14 Shaoguan (SG) 24.80◦ N, 113.55◦ E C(Guangdong, Fujian Province Guangzhou (GZ) 23.17◦ N, 113.30◦ E Aand Wenzhou Ciy) Zhuhai (ZH) 22.17◦ N, 113.34◦ E A
Shenzhen (ShZ) 22.33◦ N, 114.07◦ E AShantou (ST) 23.35◦ N, 116.67◦ E AXiamen (XM) 24.43◦ N, 118.07◦ E AQuanzhou (QZ) 24.90◦ N, 118.62◦ E CFuzhou (FZ) 26.03◦ N, 119.32◦ E AWenzhou (WZ) 28.00◦ N, 120.63◦ E A
Kelamayi (KLY) 45.36◦ N, 84.51◦ E CUrumchi (UMQ) 43.77◦ N, 87.60◦ E ALhasa (LS) 29.65◦ N, 91.03◦ E A
a Here API data available period was denoted by A: from June 2000 to February 2007, B: from June 2001 to February 2007, C: from June2004 to February 2007, and D: from January 2006 to February 2007.
Atmos. Chem. Phys., 10, 5641–5662, 2010 www.atmos-chem-phys.net/10/5641/2010/
W. J. Qu et al.: Chinese urban PM10 – spatial distribution and interannual variation 5645
Table 2. Air quality classifications corresponding to the air pollution indexes (APIs), air quality management recommendations, and pollutantconcentrations in China.
Air pollution index (API) Air quality classification Air quality management recommendation Corresponding daily average pollutant concentration, µg m−3
PM10 SO2 NO2API≤50 I Clean No action is needed. PM10≤50 SO2≤50 NO2≤8050<API≤100 II Good No action is needed. 50<PM10≤150 50<SO2≤150 80<NO2≤120100<API≤150 III1 Low-level Persons should be 150<PM10≤250 150<SO2≤475 120<NO2≤190150<API≤200 III2 pollution careful in outdoor activities. 250<PM10≤350 475<SO2≤800 190<NO2≤280200<API≤250 IV1 Mid-level Persons with existing 350<PM10≤385 800<SO2≤1200 280<NO2≤422.5
pollution heart or respiratoryillnesses are advised toreduce physical exertionand outdoor activities.
250<API≤300 IV2 385<PM10≤420 1200<SO2≤1600 422.5<NO2≤565300<API≤500 V High-level Air pollution is severe; 420<PM10≤600 1600<SO2≤2600 565<NO2≤940
pollution The general public is advisedto reduce physical exertionand outdoor activities.
Fig. 1. 48
1
#S
#S#S
#S
#S #S#S
#S
#S
#S
#S#S
#S
#S
#S
#S#S
#S#S
#S
#S
#S
#S
#S
#S
#S
#S
#S
#S
#S#S#S#S
#S
#S#S#S
#S
#S#S
#S#S#S #S
#S #S
#S#S#S #S#S
#S
#S#S
#S
#S#S
#S
#S#S
#S
#S#S#S
#S#S
#S
#S
#S
#S
#S
#S #S
#S
#S
#S
#S #S
#S
#S#S
#S
#S
#S
#S
#S
XNYC
CF
DT
TY
YQCZ
CC
AS
TJ
RZ
WFZBTA
HF
JJ
JZ
CS
CQZG
MY
QJKM
YX
GYGL
NN
BH
HK
SGGZ ST
XMQZ
FZ
WZ
LS
SZS
LaZ
BaJ
HHT
QHR
HRBMDJ
BeJ
SJZ
QHD
LYG
JNa
ZZh
JNiZhZ
PDS
WHuWha
ZJJ
LuZ
LiZ
KLY
UMQ
NCha
NChoCheD
# FS#
SY
# QD
#
DY
#
ZhaJ
# SH#
HuZ
#
DL
#
ShZZH
#
ChaD #
NB
#
HaZ#
SX
#
NJ# NT
SZ#
ZheJ#YZ
#
KF
#
YT
#
WN#
XA
G-8
G-7
G-1
G-2
G-3
G-4
G-5 G-6
G-10G-11
G-12G-13
G-14
G-9
100°E 120°E 140°E80°E
20°N
30°N
40°N
50°N
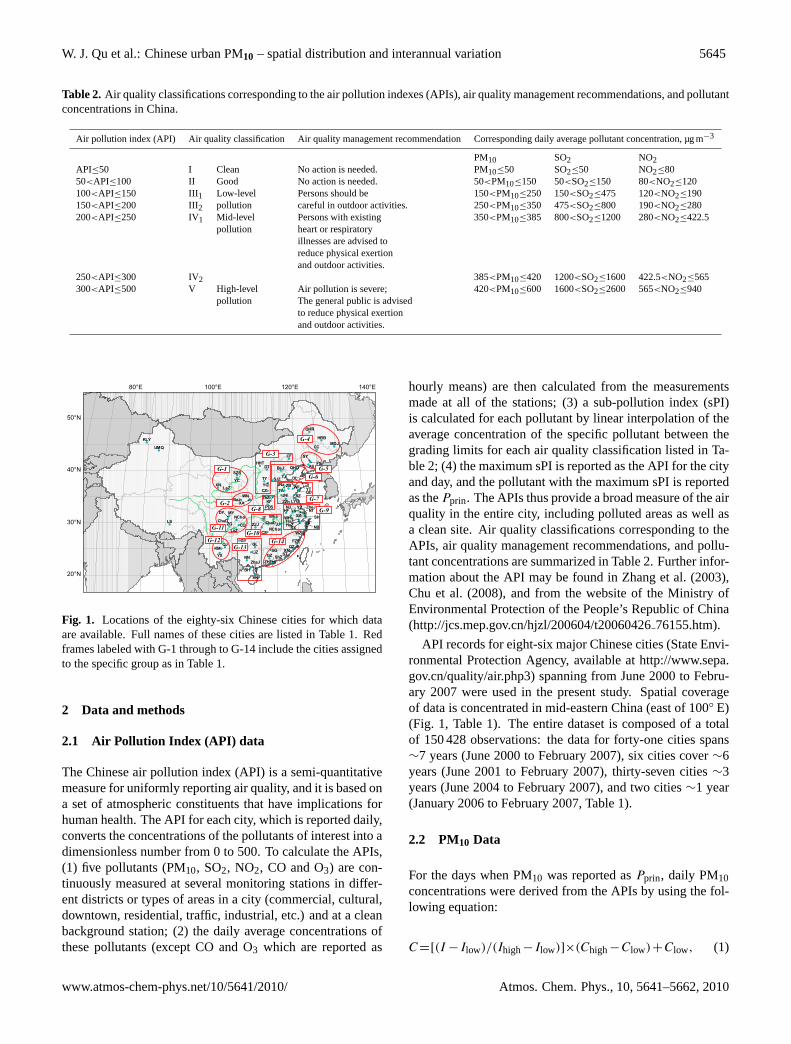
Fig. 1. Locations of the eighty-six Chinese cities for which dataare available. Full names of these cities are listed in Table 1. Redframes labeled with G-1 through to G-14 include the cities assignedto the specific group as in Table 1.
2 Data and methods
2.1 Air Pollution Index (API) data
The Chinese air pollution index (API) is a semi-quantitativemeasure for uniformly reporting air quality, and it is based ona set of atmospheric constituents that have implications forhuman health. The API for each city, which is reported daily,converts the concentrations of the pollutants of interest into adimensionless number from 0 to 500. To calculate the APIs,(1) five pollutants (PM10, SO2, NO2, CO and O3) are con-tinuously measured at several monitoring stations in differ-ent districts or types of areas in a city (commercial, cultural,downtown, residential, traffic, industrial, etc.) and at a cleanbackground station; (2) the daily average concentrations ofthese pollutants (except CO and O3 which are reported as
hourly means) are then calculated from the measurementsmade at all of the stations; (3) a sub-pollution index (sPI)is calculated for each pollutant by linear interpolation of theaverage concentration of the specific pollutant between thegrading limits for each air quality classification listed in Ta-ble 2; (4) the maximum sPI is reported as the API for the cityand day, and the pollutant with the maximum sPI is reportedas thePprin. The APIs thus provide a broad measure of the airquality in the entire city, including polluted areas as well asa clean site. Air quality classifications corresponding to theAPIs, air quality management recommendations, and pollu-tant concentrations are summarized in Table 2. Further infor-mation about the API may be found in Zhang et al. (2003),Chu et al. (2008), and from the website of the Ministry ofEnvironmental Protection of the People’s Republic of China(http://jcs.mep.gov.cn/hjzl/200604/t2006042676155.htm).
API records for eight-six major Chinese cities (State Envi-ronmental Protection Agency, available athttp://www.sepa.gov.cn/quality/air.php3) spanning from June 2000 to Febru-ary 2007 were used in the present study. Spatial coverageof data is concentrated in mid-eastern China (east of 100◦ E)(Fig. 1, Table 1). The entire dataset is composed of a totalof 150 428 observations: the data for forty-one cities spans∼7 years (June 2000 to February 2007), six cities cover∼6years (June 2001 to February 2007), thirty-seven cities∼3years (June 2004 to February 2007), and two cities∼1 year(January 2006 to February 2007, Table 1).
2.2 PM10 Data
For the days when PM10 was reported asPprin, daily PM10concentrations were derived from the APIs by using the fol-lowing equation:
C=[(I −Ilow)/(Ihigh−Ilow)]×(Chigh−Clow)+Clow, (1)
www.atmos-chem-phys.net/10/5641/2010/ Atmos. Chem. Phys., 10, 5641–5662, 2010
5646 W. J. Qu et al.: Chinese urban PM10 – spatial distribution and interannual variation
whereC is the concentration of PM10, I is the API reported.Ilow and Ihigh represent API grading limits that are lowerand larger thanI , respectively;Chigh and Clow denote thePM10 concentrations corresponding toIhigh and Ilow (Ta-ble 2), respectively. The method for calculating PM10 con-centrations from APIs has been described in detail by Zhanget al. (2003). A total of 137 845 PM10 concentrations (ondays when PM10 wasPprin or no Pprin was reported) werecalculated using this approach, and this accounts for 91.6%of the API records. The other 8.1% and 0.3% of the APIrecords correspond to days when SO2 or NO2 was reportedasPprin. Characteristics of the deduced PM10 concentrationsare the main focus of this paper, and the days when the ox-ides of sulfur or nitrogen were thePprin are not consideredfurther.
In China, PM10 concentrations are most often measuredwith the use of Tapered Element Oscillating Microbalanceanalyzers (TEOMs, model 1400a, Rupprecht & Patashnick,USA) deployed at the stations by the EPA-China environ-ment monitoring system. The uncertainty of the daily PM10measurement is typically less than 1% (Xia et al., 2006).However, for some cities and stations,β ray particulate mon-itors (model BAM-1020, Met One, USA) were used to mon-itor PM10. The principles of the operation of the TEOM ana-lyzers andβ ray particulate monitors as well as their fieldapplications are summarized elsewhere (Bari et al., 2003;http://www.metone.com/documents/BAM-10206-08.pdf).
It is worth noting that for the days when PM10 wasPprinand the API was reported as 500, the PM10 mass loadings ac-tually could have exceeded the upper limit for the air qualityclassification of “high-level pollution” (600 µg m−3). Suchhigh paticulate loading can occur during severe dust stormsin some northern cities. However, in this study, we set allof the API records of 500 to PM10 loadings of 600 µg m−3.This approximation does introduce some uncertainty in theanalysis, but the instances when this happened were infre-quent. For the full dataset, only twenty-five cities had maxi-mum API records of API = 500. Furthermore, only four citiesrecorded more than ten days when API = 500; these wereLanzhou (47 days), Urumchi (36 days), Xining (24 days) andBeijing (12 days), and the days when API = 500 accountedfor small percentages, about 1.9%, 1.5%, 0.98% and 0.49%,of the days with API records (2451 days). Taken together,the other twenty-one cities had 57 records with a maximumAPI (API = 500). Therefore, the impact of this uncertaintyshould be quite limited.
Another consideration is that noPprin was reported on dayswhen the API was less than 50 (the air quality classified as“clean”). In this regard, an inspection and comparison of thedaily sPI records for PM10, SO2 and NO2 in selected citieshas shown that when noPprin was reported, PM10 most of-ten had the highest sPI, and therefore the APIs were mostoften a reflection of the PM10 loadings. Accordingly, for thedays when noPprin reported, we assumed that PM10 was thePprin that day and deduced PM10 concentration according to
Eq. (1). This is another source of uncertainty, but again theimpact of this assumption is likely to be small.
As the data quality (the validity of this PM10 data set) is ofthe foremost concern, a comparison was conducted betweenthis study and related previous work. The specific concernhere is that the use of TEOM–based analyzers (which arecommonly used in the EPA-China’s air quality monitoringnetwork) can result in underestimation of the aerosol massbecause the elevated temperatures of the TEOMs (50◦C)can cause the loss of some material via volatilization. King(2000) has reported that the results obtained with the TEOM–based analyzers are similar to the results of other instruments,but the TEOM results tend to be lower by about 30% be-cause of the volatilization effect. Sciare et al. (2007) hasindicated that the mass contributions from semi-volatile ma-terial (SVM) and liquid water in Beijing aerosols can causelarge errors in TEOM results. These authors showed lossesof SVM as high as 140 µg m−3 during high relative humidity(RH, >60%) periods in summer 2004.
It is worth noting that the error of TEOM measurements(heating at 50◦C) due to volatilization of SVM is systematicin the sense that it is always negative. This potential artifactin PM mass measurements could therefore result in a system-atic underestimation of PM10. On the other hand, literaturereported PM10 mass concentrations based on filter samplingand gravimetry are subject to both positive and negative arti-facts. That is, reactive gases can accumulate on the filters, butthere also can be losses of SVM – such as nitrate and someorganic material – via volatilization (Turpin et al., 2000).
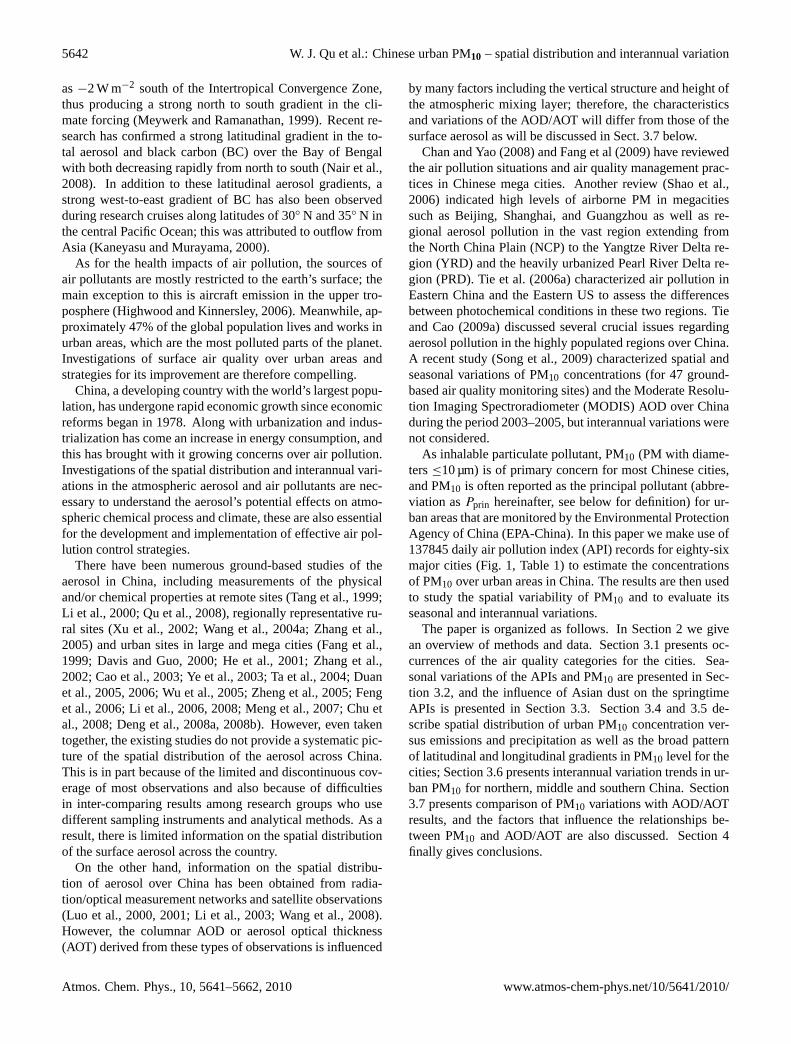
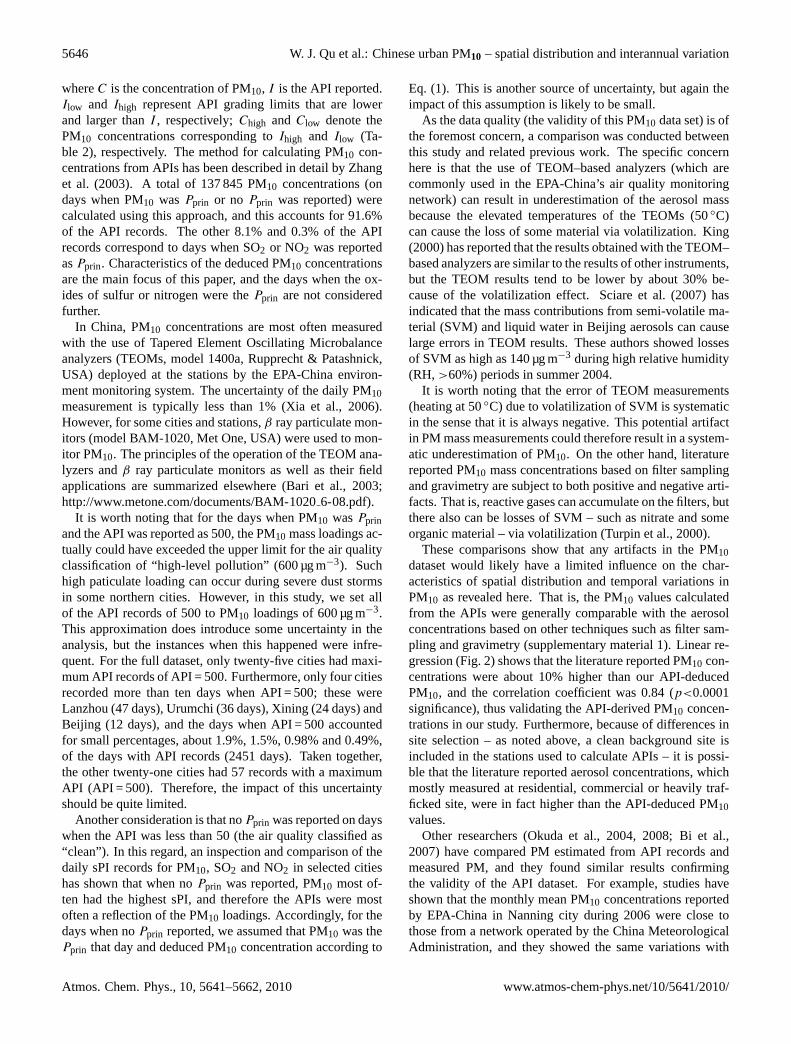
These comparisons show that any artifacts in the PM10dataset would likely have a limited influence on the char-acteristics of spatial distribution and temporal variations inPM10 as revealed here. That is, the PM10 values calculatedfrom the APIs were generally comparable with the aerosolconcentrations based on other techniques such as filter sam-pling and gravimetry (supplementary material 1). Linear re-gression (Fig. 2) shows that the literature reported PM10 con-centrations were about 10% higher than our API-deducedPM10, and the correlation coefficient was 0.84 (p<0.0001significance), thus validating the API-derived PM10 concen-trations in our study. Furthermore, because of differences insite selection – as noted above, a clean background site isincluded in the stations used to calculate APIs – it is possi-ble that the literature reported aerosol concentrations, whichmostly measured at residential, commercial or heavily traf-ficked site, were in fact higher than the API-deduced PM10values.
Other researchers (Okuda et al., 2004, 2008; Bi et al.,2007) have compared PM estimated from API records andmeasured PM, and they found similar results confirmingthe validity of the API dataset. For example, studies haveshown that the monthly mean PM10 concentrations reportedby EPA-China in Nanning city during 2006 were close tothose from a network operated by the China MeteorologicalAdministration, and they showed the same variations with
Atmos. Chem. Phys., 10, 5641–5662, 2010 www.atmos-chem-phys.net/10/5641/2010/
W. J. Qu et al.: Chinese urban PM10 – spatial distribution and interannual variation 5647Fig. 2. 49
1
0 100 200 300 400 5000
100
200
300
400
500
L
ite
ratu
re P
M1
0 c
on
ce
ntr
ati
on
(g
/m3)
API deduced PM10
concentration (g/m3)
y = 1.10 x, r = 0.84,P < 0.0001, n = 68
Fig. 2. Linear correlation between the API-deduced PM10 concen-trations and the literature reported PM10 concentrations. The dataused in this analysis are adapted from those shown in the Supple-mentary material 1 – Validation of the API deduced PM10 data.
time (Mo et al., 2008). These comparisons all attest to thevalidity of the API-based PM10 data used in our study.
2.3 Grouping the cities according to APIs
A fuzzy clustering procedure was used to determine the sim-ilarities between the APIs of the cities (supplementary ma-terial 2). In addition, the relationships between among theAPIs and the geographical locations of these cities weretaken into account in the grouping procedure. For example,the cities in a specific topographical basin were mostly as-signed to a same group; thus, Huhehot and Datong which areboth located on the northeastern margin of the Great Bend ofthe Yellow River were assigned to group G-3. On the otherhand, cities located on different sides of a mountain wereassigned to different groups, e.g. Shijiazhuang and Taiyuanwhich are located on the eastern and the western sides of theTaihang Mountains are assigned to groups G-6 and G-3, re-spectively. Meanwhile, cities in the same administrative pre-fecture (province) and those adjacent geographically were inmost cases assigned to the same group for the convenienceof discussion.
Through these procedures, eighty-three cities in mid-eastern China (longitude 100◦ E to 130◦ E) are divided intofourteen groups (Fig. 1, Table 1). These groups generallycorrespond to provincial regions. Three cities, Kelamayi(KLY), Urumchi (UMQ) and Lhasa (LS) located in west-ern China were not included in these groups. To better un-derstand spatial patterns in the air quality categories, thefourteen groups of the cities (Fig. 1, Table 1) were furtherpartitioned into northern, middle and southern zones, withthe Qinlin Mountain – the Huaihe River and the Yunnan-Guizhou Plateau – the Jiangnan Hill – the Wuyi Mountain
as boundaries between zones (marked with black dash lines,Fig. 3).
The northern zone (north of 33◦N, including thirty-eightcities, i.e. G-1 to G-8) extended westward to the northeast-ern margin of the Tibetan Plateau, northward to the Chi-nese boundary with Mongolia and Russia, eastward to theJapan Sea, the Bohai sea and the Yellow sea. The middlezone (between 28◦ N to 33◦ N, including twenty-six cities,i.e. G-9 to G-11) extended westward to the eastern marginof the Tibetan Plateau, eastward to the Yellow sea and theEast China Sea. While the southern zone (south of 28◦ N, in-cluding nineteen cities, i.e. G-12 to G-14) extended westwardto the southeastern margin of the Tibetan Plateau, eastwardto the East China Sea and Taiwan Island, and southward tothe South China Sea. The northern and middle zones actu-ally contain two basins oriented east/west while the southernzone is mainly a hilly area near the South China Sea and theEast China Sea.
3 Results and discussion
An inspection of the Chinese API records suggests that PM10pollution is likely a greater concern than SO2 and NO2 in ma-jor cities because PM10 is the most commonPprin (Table 3).One can see that for the northern and middle zones of thecountry, PM10 wasPprin on more than 80% of the days; whilefor the southern zone, about half of the days had PM10 asPprin (and∼40% of the days with noPprin reported). The per-centages of days with SO2 asPprin ranged from 6.6% to 9.3%for the three latitudinal zones. In comparison, the numbers ofdays with NO2 asPprin were quite small but with relativelylarger proportions for the southern zone (0.87%) comparedwith the northern and the southern zones (0.11% and 0.12%,respectively). This pattern in NO2 asPprin is probably dueto more emissions from motor vehicle and more favorableconditions for the photochemical production of NO2 in thesouth.
3.1 Occurrences of the air quality categories
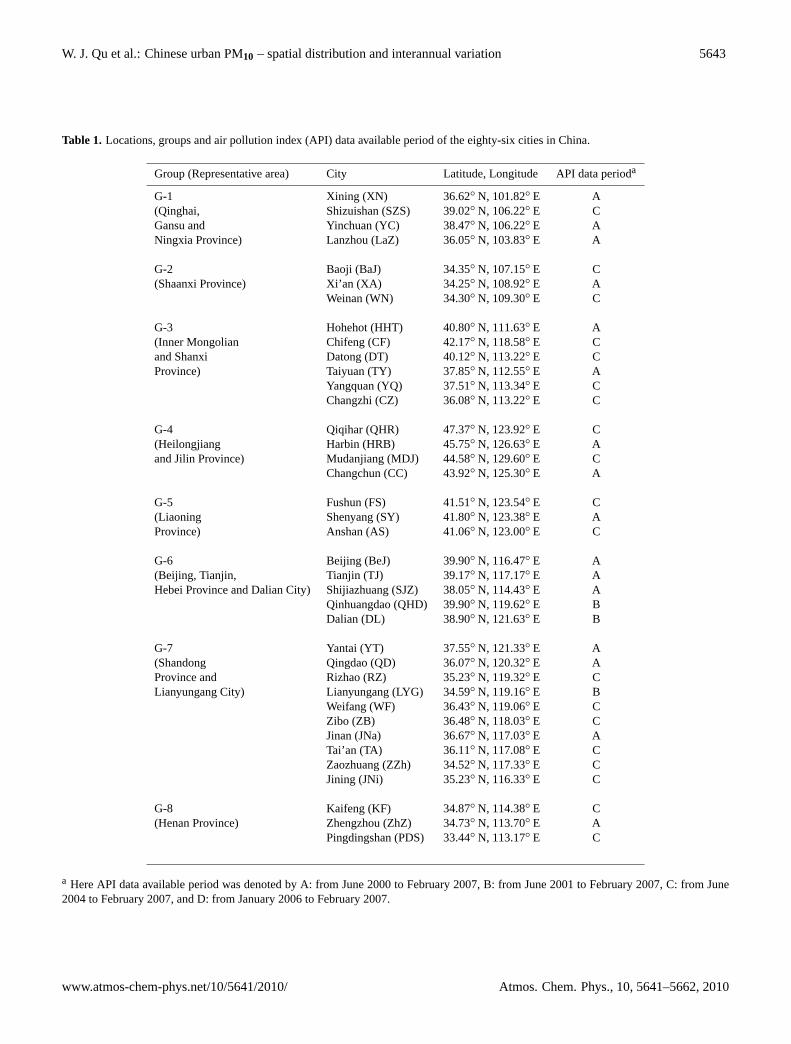
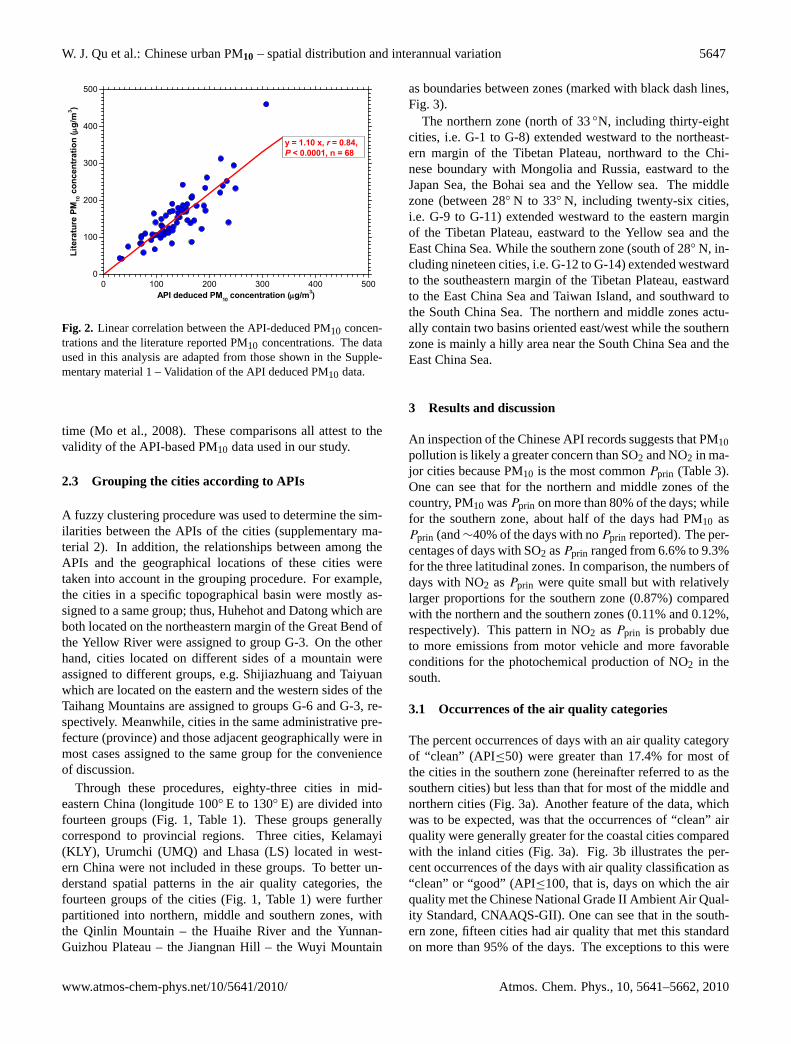
The percent occurrences of days with an air quality categoryof “clean” (API≤50) were greater than 17.4% for most ofthe cities in the southern zone (hereinafter referred to as thesouthern cities) but less than that for most of the middle andnorthern cities (Fig. 3a). Another feature of the data, whichwas to be expected, was that the occurrences of “clean” airquality were generally greater for the coastal cities comparedwith the inland cities (Fig. 3a). Fig. 3b illustrates the per-cent occurrences of the days with air quality classification as“clean” or “good” (API≤100, that is, days on which the airquality met the Chinese National Grade II Ambient Air Qual-ity Standard, CNAAQS-GII). One can see that in the south-ern zone, fifteen cities had air quality that met this standardon more than 95% of the days. The exceptions to this were
www.atmos-chem-phys.net/10/5641/2010/ Atmos. Chem. Phys., 10, 5641–5662, 2010
5648 W. J. Qu et al.: Chinese urban PM10 – spatial distribution and interannual variationFig. 3. 50
#S
#S#S
#S
#S #S#S
#S
#S
#S
#S #S
#S
#S
#S
#S#S
#S#S#S
#S#S
#S
#S#S
#S
#S#S#S
#S#S#S#S
#S#S#S#S
#S
#S#S#S#S#S #S
#S#S#S#S#S #S#S
#S
#S#S
#S
#S#S
#S#S
#S#S
#S#S#S
#S#S#S
#S
#S#S
#S
#S#S#S
#S
#S#S#S
#S#S#S#S
#S
#S#S
#S
100°E 120°E 140°E80°E
20°N
30°N
40°N
50°N
(a)
Air quality“clean” (API≤50) occurrence probability (%)
29.4-5517.4-29.48.6-17.41-8.6
55-88.6
#S
#S#S
#S
#S #S#S
#S
#S
#S
#S #S
#S
#S
#S#S
#S
#S#S#S#S#S
#S
#S#S#S
#S#S#S
#S#S#S#S#S
#S#S#S#S
#S#S#S#S#S #S
#S#S#S#S#S#S#S
#S
#S#S
#S#S#S
#S#S
#S#S
#S#S#S
#S#S#S
#S#S
#S
#S#S#S#S
#S
#S#S#S
#S#S#S#S
#S
#S#S
#S
100°E 120°E 140°E 80°E
20°N
30°N
40°N
50°N
(b)
Air quality“clean or good”(API≤100) occurrence probability (%)
87.2-95 76.6-87.2 63.1-76.6 50.3-63.1
95-100
#S
#S#S
#S#S #S#S
#S#S
#S
#S#S#S
#S
#S#S
#S
#S#S#S#S#S
#S
#S
#S
#S
#S#S#S
#S#S#S#S
#S#S#S#S
#S#S
#S#S#S#S #S
#S#S#S#S#S #S#S
#S
#S#S
#S#S#S
#S
#S#S#S
#S#S#S
#S#S#S
#S
#S
#S
#S
#S #S
#S
#S
#S#S #S
#S
#S#S
#S
#S
#S
#S
#S
100°E 120°E 140°E80°E
20°N
30°N
40°N
50°N
(c)
Air quality“low-level pollution” (100<API≤200) occurrence probability (%)
20.3-31.210.6-20.34.3-10.60-4.3
31.2-43.1
0
#S
#S#S
#S#S #S#S
#S
#S
#S
#S#S#S
#S
#S#S
#S
#S#S#S#S#S
#S
#S
#S
#S
#S#S#S
#S#S#S#S
#S#S#S#S
#S#S
#S#S#S#S #S
#S#S#S#S#S #S#S
#S
#S#S
#S#S#S
#S
#S#S
#S
#S#S#S
#S#S#S
#S
#S
#S
#S
#S #S
#S
#S
#S
#S #S
#S
#S#S
#S
#S
#S
#S
#S
100°E 120°E 140°E 80°E
20°N
30°N
40°N
50°N
(d)
Air quality“mid- orhigh-level pollution” (API>200) occurrence probability (%)
2-6 0.8-2 0.25-0.8 0-0.25
6-10.8
0
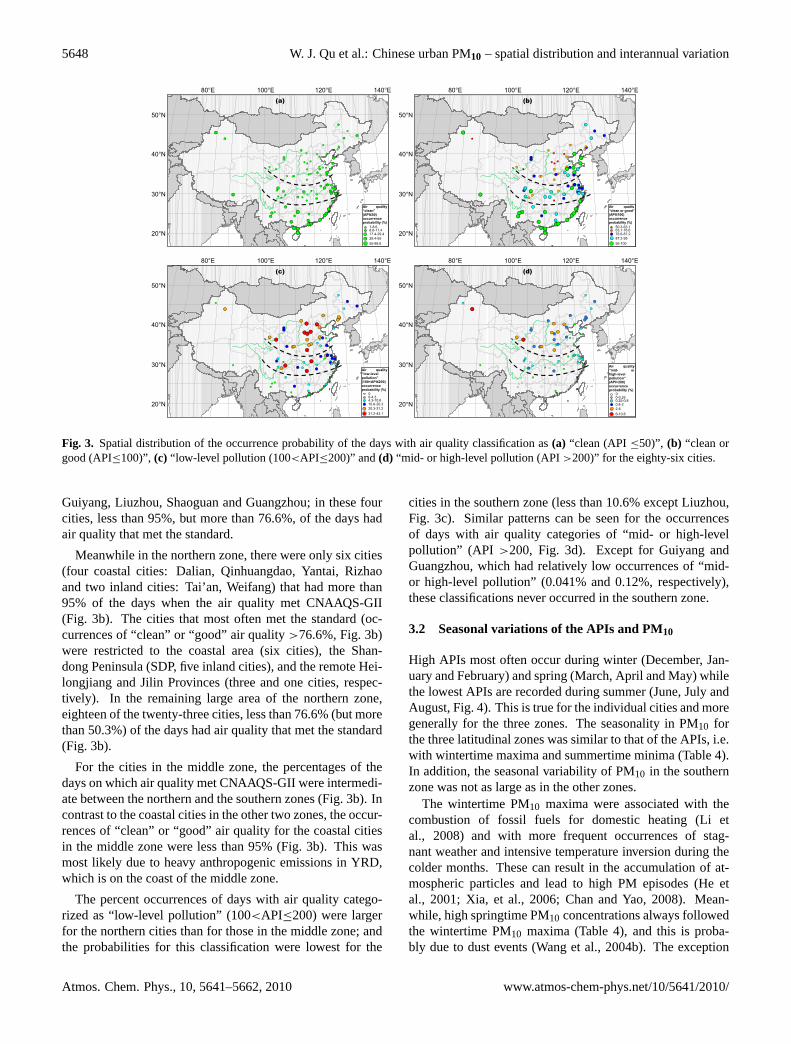
Fig. 3. Spatial distribution of the occurrence probability of the days with air quality classification as(a) “clean (API≤50)”, (b) “clean orgood (API≤100)”, (c) “low-level pollution (100<API≤200)” and(d) “mid- or high-level pollution (API>200)” for the eighty-six cities.
Guiyang, Liuzhou, Shaoguan and Guangzhou; in these fourcities, less than 95%, but more than 76.6%, of the days hadair quality that met the standard.
Meanwhile in the northern zone, there were only six cities(four coastal cities: Dalian, Qinhuangdao, Yantai, Rizhaoand two inland cities: Tai’an, Weifang) that had more than95% of the days when the air quality met CNAAQS-GII(Fig. 3b). The cities that most often met the standard (oc-currences of “clean” or “good” air quality>76.6%, Fig. 3b)were restricted to the coastal area (six cities), the Shan-dong Peninsula (SDP, five inland cities), and the remote Hei-longjiang and Jilin Provinces (three and one cities, respec-tively). In the remaining large area of the northern zone,eighteen of the twenty-three cities, less than 76.6% (but morethan 50.3%) of the days had air quality that met the standard(Fig. 3b).
For the cities in the middle zone, the percentages of thedays on which air quality met CNAAQS-GII were intermedi-ate between the northern and the southern zones (Fig. 3b). Incontrast to the coastal cities in the other two zones, the occur-rences of “clean” or “good” air quality for the coastal citiesin the middle zone were less than 95% (Fig. 3b). This wasmost likely due to heavy anthropogenic emissions in YRD,which is on the coast of the middle zone.
The percent occurrences of days with air quality catego-rized as “low-level pollution” (100<API≤200) were largerfor the northern cities than for those in the middle zone; andthe probabilities for this classification were lowest for the
cities in the southern zone (less than 10.6% except Liuzhou,Fig. 3c). Similar patterns can be seen for the occurrencesof days with air quality categories of “mid- or high-levelpollution” (API >200, Fig. 3d). Except for Guiyang andGuangzhou, which had relatively low occurrences of “mid-or high-level pollution” (0.041% and 0.12%, respectively),these classifications never occurred in the southern zone.
3.2 Seasonal variations of the APIs and PM10
High APIs most often occur during winter (December, Jan-uary and February) and spring (March, April and May) whilethe lowest APIs are recorded during summer (June, July andAugust, Fig. 4). This is true for the individual cities and moregenerally for the three zones. The seasonality in PM10 forthe three latitudinal zones was similar to that of the APIs, i.e.with wintertime maxima and summertime minima (Table 4).In addition, the seasonal variability of PM10 in the southernzone was not as large as in the other zones.
The wintertime PM10 maxima were associated with thecombustion of fossil fuels for domestic heating (Li etal., 2008) and with more frequent occurrences of stag-nant weather and intensive temperature inversion during thecolder months. These can result in the accumulation of at-mospheric particles and lead to high PM episodes (He etal., 2001; Xia, et al., 2006; Chan and Yao, 2008). Mean-while, high springtime PM10 concentrations always followedthe wintertime PM10 maxima (Table 4), and this is proba-bly due to dust events (Wang et al., 2004b). The exception
Atmos. Chem. Phys., 10, 5641–5662, 2010 www.atmos-chem-phys.net/10/5641/2010/
W. J. Qu et al.: Chinese urban PM10 – spatial distribution and interannual variation 5649
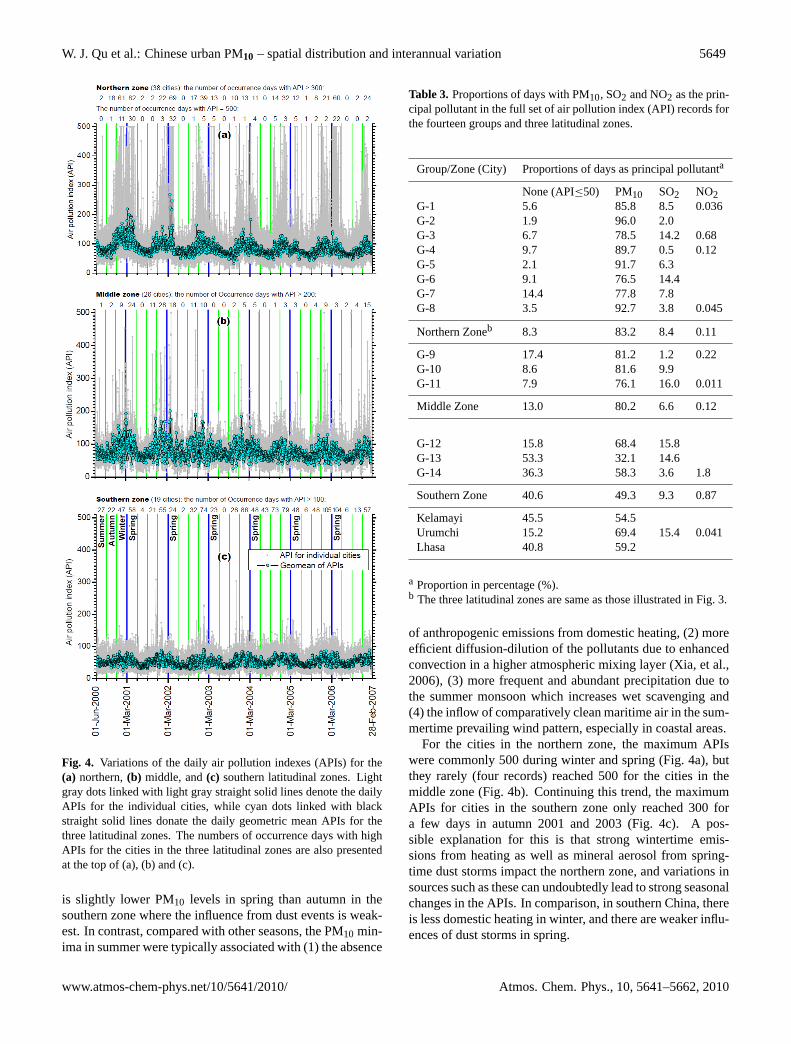
Fig. 4. Variations of the daily air pollution indexes (APIs) for the(a) northern,(b) middle, and(c) southern latitudinal zones. Lightgray dots linked with light gray straight solid lines denote the dailyAPIs for the individual cities, while cyan dots linked with blackstraight solid lines donate the daily geometric mean APIs for thethree latitudinal zones. The numbers of occurrence days with highAPIs for the cities in the three latitudinal zones are also presentedat the top of (a), (b) and (c).
is slightly lower PM10 levels in spring than autumn in thesouthern zone where the influence from dust events is weak-est. In contrast, compared with other seasons, the PM10 min-ima in summer were typically associated with (1) the absence
Table 3. Proportions of days with PM10, SO2 and NO2 as the prin-cipal pollutant in the full set of air pollution index (API) records forthe fourteen groups and three latitudinal zones.
Group/Zone (City) Proportions of days as principal pollutanta
None (API≤50) PM10 SO2 NO2G-1 5.6 85.8 8.5 0.036G-2 1.9 96.0 2.0G-3 6.7 78.5 14.2 0.68G-4 9.7 89.7 0.5 0.12G-5 2.1 91.7 6.3G-6 9.1 76.5 14.4G-7 14.4 77.8 7.8G-8 3.5 92.7 3.8 0.045
Northern Zoneb 8.3 83.2 8.4 0.11
G-9 17.4 81.2 1.2 0.22G-10 8.6 81.6 9.9G-11 7.9 76.1 16.0 0.011
Middle Zone 13.0 80.2 6.6 0.12
G-12 15.8 68.4 15.8G-13 53.3 32.1 14.6G-14 36.3 58.3 3.6 1.8
Southern Zone 40.6 49.3 9.3 0.87
Kelamayi 45.5 54.5Urumchi 15.2 69.4 15.4 0.041Lhasa 40.8 59.2
a Proportion in percentage (%).b The three latitudinal zones are same as those illustrated in Fig. 3.
of anthropogenic emissions from domestic heating, (2) moreefficient diffusion-dilution of the pollutants due to enhancedconvection in a higher atmospheric mixing layer (Xia, et al.,2006), (3) more frequent and abundant precipitation due tothe summer monsoon which increases wet scavenging and(4) the inflow of comparatively clean maritime air in the sum-mertime prevailing wind pattern, especially in coastal areas.
For the cities in the northern zone, the maximum APIswere commonly 500 during winter and spring (Fig. 4a), butthey rarely (four records) reached 500 for the cities in themiddle zone (Fig. 4b). Continuing this trend, the maximumAPIs for cities in the southern zone only reached 300 fora few days in autumn 2001 and 2003 (Fig. 4c). A pos-sible explanation for this is that strong wintertime emis-sions from heating as well as mineral aerosol from spring-time dust storms impact the northern zone, and variations insources such as these can undoubtedly lead to strong seasonalchanges in the APIs. In comparison, in southern China, thereis less domestic heating in winter, and there are weaker influ-ences of dust storms in spring.
www.atmos-chem-phys.net/10/5641/2010/ Atmos. Chem. Phys., 10, 5641–5662, 2010
5650 W. J. Qu et al.: Chinese urban PM10 – spatial distribution and interannual variation
Table 4. Seasonal arithmetic mean PM10 concentrations for the fourteen groups and three latitudinal zones.
Arithmetic mean± Standard deviationa (nb)Group/Zone (City) Whole study period Spring Summer Autumn Winter
G-1 139.3±75.3 (2451) 164.8±98.6 (552) 94.5±28.4 (640) 119.0±48.7 (637) 183.4±73.8 (622)G-2 143.3±63.5 (2451) 142.9±69.4 (552) 113.6±36.0 (640) 136.4±56.5 (637) 181.1±68.3 (622)G-3 146.7±73.2 (2430) 149.2±80.5 (551) 111.1±38.9 (640) 136.7±61.8 (635) 192.5±80.7 (604)G-4 104.4±47.5 (2451) 108.5±53.7 (552) 74.7±20.2 (640) 95.5±33.2 (637) 140.3±50.1 (622)G-5 144.7±66.2 (2425) 157.6±76.1 (552) 113.5±35.0 (640) 127.3±47.4 (626) 183.7±74.9 (607)G-6 125.1±62.9 (2414) 140.4±70.3 (551) 98.5±34.4 (640) 116.0±56.3 (636) 149.4±72.6 (587)G-7 96.6±39.1 (2444) 109.6±45.8 (552) 76.3±21.9 (640) 88.8±30.9 (637) 114.3±41.8 (615)G-8 124.8±55.6 (2432) 132.0±55.3 (551) 101.8±34.3 (639) 123.1±57.1 (636) 144.3±63.1 (606)
Northern Zonec 117.9±41.0 (2451) 127.9±44.4 (552) 90.3±17.9 (640) 107.9±32.8 (637) 147.8±39.9 (622)
G-9 98.9±47.6 (2451) 110.4±51.1 (552) 78.0±28.4 (640) 99.3±46.7 (637) 109.9±53.6 (622)G-10 116.6±55.1 (2449) 118.4±50.5 (552) 86.6±29.9 (640) 123.4±53.2 (637) 139.1±66.5 (620)G-11 118.0±46.8 (2451) 128.0±48.9 (552) 98.3±33.7 (640) 107.9±41.4 (637) 139.7±50.3 (622)
Middle Zone 104.1±43.0 (2451) 112.8±42.9 (552) 81.5±22.7 (640) 104.3±41.0 (637) 119.5±50.7 (622)
G-12 74.9±28.1 (2106) 81.4±29.2 (498) 61.5±21.4 (520) 73.6±27.3 (581) 83.7±28.6 (506)G-13 49.9±14.5 (2451) 48.8±12.7 (552) 40.9±10.5 (640) 53.9±14.0 (637) 55.9±15.4 (622)G-14 63.4±24.0 (2451) 66.5±24.0 (552) 47.5±13.0 (640) 66.7±22.0 (637) 73.4±26.8 (622)
Southern Zone 58.2±17.7 (2451) 59.8±16.6 (552) 45.4±9.5 (640) 61.6±16.3 (637) 66.5±19.4 (622)
Kelamayi 57.5±39.9 (990) 53.5±25.0 (183) 57.8±17.5 (273) 68.7±64.9 (273) 48.4±25.8 (261)Urumchi 156.2±134.5 (2073) 123.9±102.1 (428) 73.9±40.9 (640) 141.8±101.8 (575) 329.9±137.8 (430)Lhasa 64.7±37.1 (2451) 78.4±36.2 (552) 41.5±19.6 (640) 59.5±28.7 (637) 81.9±44.6 (622)
a Concentrations in micrograms per cubic meter calculated from daily geometric mean PM10 for the group/zone.b Here n stands for the number of daily geometric mean PM10 concentrations for the group/zone.cThe three latitudinal zones are same as those illustrated in Fig. 3.
Changes in types of pollutants emitted over decadal time-scales could impact the seasonality of air pollution. For ex-ample, Guinot et al. (2007) found that the winter “heatingseason” pollution appears to be of lesser importance in Bei-jing than previously, whereas automobile traffic is likely todominate downtown anthropogenic emissions in the future.In addition, problems associated with photochemical pro-cesses and the formation of fine secondary particles also tendto occur in Beijing summer when temperatures and relativehumidities are high (Song et al., 2002). However, the air pol-lution situations are complicated as they vary largely betweendifferent cities.
Accompanied with the implementation of the air qual-ity improvement measures (such as substituting natural gasfor coal, controlling emissions from coal combustion—improving combustion technology and gas desulfurizationtechnology, etc.) in China, a dramatic increase in the numberof motor vehicles has occurred at the same time. More strin-gent standards (such as the Euro-III standards since 2006 inBeijing and the Euro-II standards since 2003 in Shanghai)were also adopted to reduce vehicular emissions of air pollu-tants (Chan and Yao, 2008). In their review, Chan and Yao
(2008) indicated that due to effective control measures, NO2and CO concentrations have not increased in China’s megacities (including Beijing, Shanghai as well as Guangzhou,Shenzhen and Hong Kong in PRD) although the number ofvehicles has increased by about 10% per year; SO2 emissionswere successfully controlled in Beijing, but not in Shanghaior the PRD; meanwhile, PM pollution is still severe and isthe major air pollution problem in the mega cities.
3.3 Influence of Asian Dust on the APIs during Spring
The number of springtime occurrences of the maximum API(= 500) for the northern cities was about 30 for 2001 and2002; this decreased to about 5 for 2003 through 2005, butincreased steeply again to 22 in spring 2006 (top of Fig. 4a).Note that the occurrences as tabulated here reflect the totalnumber of days with API = 500 for all cities in the northernzone, that is, if the API records reached 500 for more thanone (e.g.n) city on a given day, the number of occurrenceswas tabulated asn for that day. The trend in the numbers ofthe days with API>300 for the northern cities during springwere similar to the occurrences of the API maxima, from 82and 69 in 2001 and 2002, respectively, to about 12 for 2003
Atmos. Chem. Phys., 10, 5641–5662, 2010 www.atmos-chem-phys.net/10/5641/2010/
W. J. Qu et al.: Chinese urban PM10 – spatial distribution and interannual variation 5651
through 2005, then increasing again to 60 in spring 2006 (topof Fig. 4a).
The high APIs for the northern cities co-varied with theoccurrences of dust events, and this reflects the fact that thespringtime air quality in northern China can be degraded byAsian dust storms. The dust data used for this comparisonare the frequencies of springtime dust storms in northernChina that were extracted from satellite images by Zhang etal. (2008). Their study showed that there were 11, 8, 2, 3,3 and 10 dust events in sequence from 2001 to 2006; andthis measure of dust storm activity matches the interannualtrend in the occurrence of the maximum APIs for the north-ern cities during spring (top of Fig. 4a). Li et al. (2007) alsoreported similar trends in the frequencies of springtime dustevents in Shijiazhuang city (2, 0, 1, 2 and 3, respectively for2002 to 2006). A similar pattern in dust event frequenciesalso has been reported for Xi’an (Ning et al., 2005). Moreto the point, Wang et al. (2006) showed that dust events con-tributed to variations in PM10 over fourteen northern cities inChina.
3.4 Spatial distribution of PM10 versus emissions andprecipitation
3.4.1 Spatial distribution of PM10
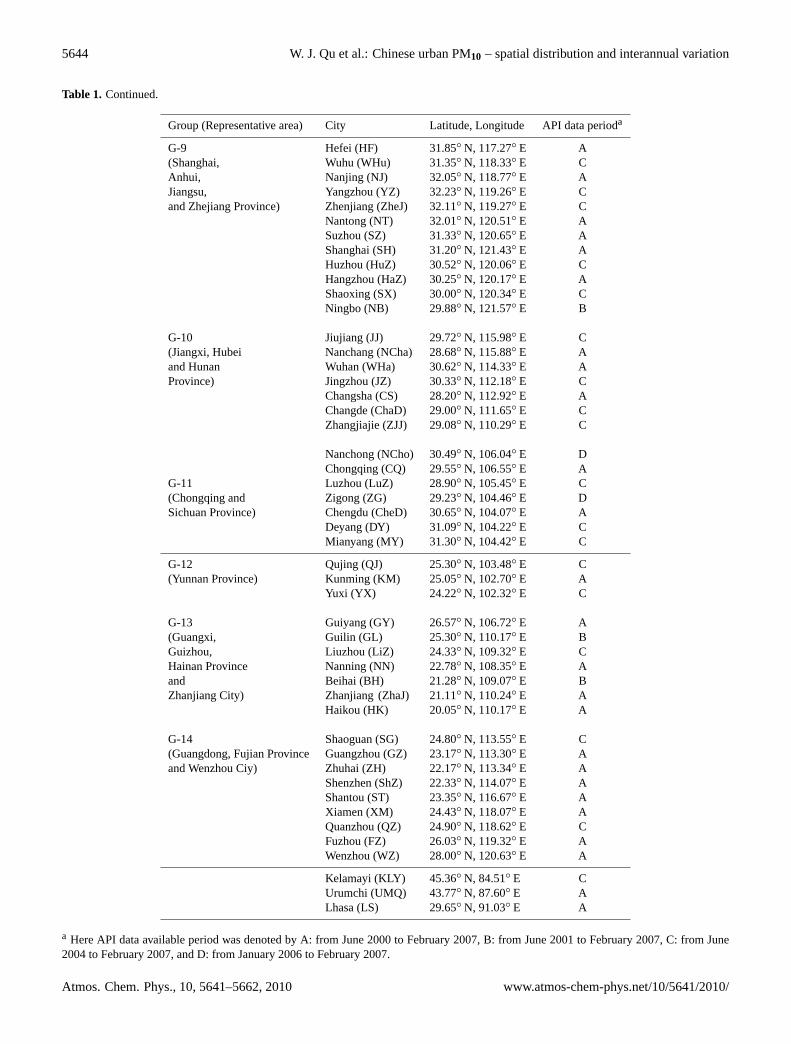
Figure 5a illustrates the spatial distribution of PM10 for theeighty-six individual cities. High PM10 (presented as thearithmetic mean in µg m−3) regions in northern China (127to 192) include Urumchi (156) on the southern margin of theJunggar Basin; Lanzhou (192) and Xining (138) on the north-eastern side of the Qinghai-Tibetan Plateau; Weinan (152)and Xi’an (144) in the Guanzhong Basin; Taiyuan (179), Da-tong (162), Yangquan (153) and Changzhi (132) in ShanxiProvince in the basins to the west of the Taihang Mountains;Pingdingshan (156, a city with heavy coal industries) andKaifeng (133) in Henan Province on the western margin ofNCP; Beijing (159), Tianjin (140) and Shijiazhuang (168) inthe northern part of NCP; Jinan (135) in the eastern part ofNCP; and Shenyang (145), Anshan (132) and Fushun (127)in the southeastern part of the Northeast China Plain.
In the middle zone, the high PM10 (arithmetic meanin µg m−3) areas (119 to 147 µg m−3) were Chongqing (142),Chengdu (120) and Luzhou (132) in the Sichuan Basin(SCB), Changsha (147) and Wuhan (135) in central China,Nanjing (125) and Hangzhou (119) in YRD.
The PM10 levels in the cities in the southern zone weregenerally lower than those in the northern zone and the mid-dle zone, and there were no areas with arithmetic mean PM10concentration>109 µg m−3 (Fig. 5a). However, the arith-metic mean PM10 concentrations (in µg m−3) exceeded 80in four cities: Qujing (91), Guiyang (80.1), Guangzhou (85)and Shaoguan (87), and these were much higher than the to-tal average PM10 level of 58 µg m−3 for the southern zone.
In general, the PM10 hotspots were in cities with densepopulations and intensive industrial activities. Moreover,cities located within geographical basins tended to havehigher PM10 loadings than those outside the basins. Rel-atively high PM10 concentrations were documented in ar-eas such as central-eastern China, NCP, SCB, YRD (Nan-jing and Hangzhou), and PRD (Guangzhou and Shaoguan,PM10 concentration>80 µg m−3, Fig. 5a). These regionsalso have been identified as high AOD/AOT areas by the ra-diation/optical measurements and satellite observations (Luoet al., 2000, 2001; Li et al., 2003; Wang et al., 2008). At thesame time, one should note that during a pollution episode,the aerosol spatial distribution could be quite different fromthe average conditions as illustrated in Fig. 5a. More in-formation about the relationships between PM10 and opticalmeasurements can be found in Sect. 3.7 below.
The spatial distribution of PM10 concentration is not pre-sented here as an interpolated contour plot because thedataset is biased toward sites that are generally the most pol-luted “points” on a regional scale. That is, the cities typicallyare high-value centers in the field of PM10, with low-valueareas interspersed between these high PM10 loci. Althoughthese results do not represent the full spatial distribution ofthe aerosol as evident in satellite observations, they do pro-vide important insights into the spatial distributions of theaerosol and the problems of air pollution based on indepen-dent measurements of PM in surface air.
Table 4 tabulates the arithmetic mean PM10 concentrationsfor the fourteen groups described in Section 2.3 above. Notethese values tend to be less than the individual PM10 levelsin mega cities because some cleaner small and satellite citiesare included in the groups. From Table 4 one can see thatin the northern zone, G-4 (Heilongjiang and Jilin Provinces)and G-7 (SDP) exhibited lower PM10 levels compared withother groups during spring, summer and autumn; while dur-ing winter, G-1 (Qinghai, Gansu and Ningxia Provinces),G-2 (Shaanxi Province), G-3 (Inner Mongolian and ShanxiProvinces) and G-5 (Liaoning Province) had higher PM10levels than other groups. For the three groups in the mid-dle zone, G-9 (YRD) showed the lowest PM10 concentrationin all four seasons. In the southern zone, PM10 levels werecomparable for the three groups. For a more detailed descrip-tion of the seasonal patterns of PM10 spatial distribution, seesupplementary material 3.
Although the spatial distribution of PM10 is complex, anoverall north to south decrease in our API-derived PM10 datafor the Chinese cities is distinct and can be seen in Fig. 5a;this will be discussed in detail in Sect. 3.5.
3.4.2 Comparison of PM10 with emissions andprecipitation
Accurate emissions data are scarce for China, and researchin this area is complicated by differences in the combus-tion technologies used throughout the country and the limited
www.atmos-chem-phys.net/10/5641/2010/ Atmos. Chem. Phys., 10, 5641–5662, 2010
5652 W. J. Qu et al.: Chinese urban PM10 – spatial distribution and interannual variation
Fig. 5. 52
100°E 120°E 140°E80°E
20°N
30°N
40°N
50°N
#S
#S#S
#S#S#S#S
#S#S
#S#S#S#S
#S
#S#S#S
#S#S#S#S#S
#S#S
#S
#S
#S#S
#S
#S#S#S#S#S
#S#S#S#S
#S#S#S#S#S#S#S#S#S#S#S #S#S#S
#S#S
#S#S#S
#S
#S#S#S#S#S#S
#S#S#S
#S#S
#S
#S
#S #S
#S
#S
#S#S #S
#S
#S#S#S
#S
#S
#S
#S PM10 concentration(μg m-3)
65-87 36-65
147-193
128-147
109-128
87-109
(a)
(b)
Fig. 5. continued 53
(c)
100°E 120°E 140°E80°E
20°N
30°N
40°N
50°N
##
#
#### ##
### #
## #
## ###
###
#
# #
# ## ###
#
### ##
#
## # #
# ## ####
Precipitation
(mm)
2000-2100
1700-2000
1400-1700
1200-1400
1000-1200
800-1000
700-800
600-700
500-600
450-500
400-450
350-400
300-350
250-300
200-2500
(d)
Fig. 5. continued 53
(c)
100°E 120°E 140°E80°E
20°N
30°N
40°N
50°N
##
#
#### ##
### #
## #
## ###
###
#
# #
# ## ###
#
### ##
#
## # #
# ## ####
Precipitation
(mm)
2000-2100
1700-2000
1400-1700
1200-1400
1000-1200
800-1000
700-800
600-700
500-600
450-500
400-450
350-400
300-350
250-300
200-2500
(d)
Fig. 5. continued 54
(e)
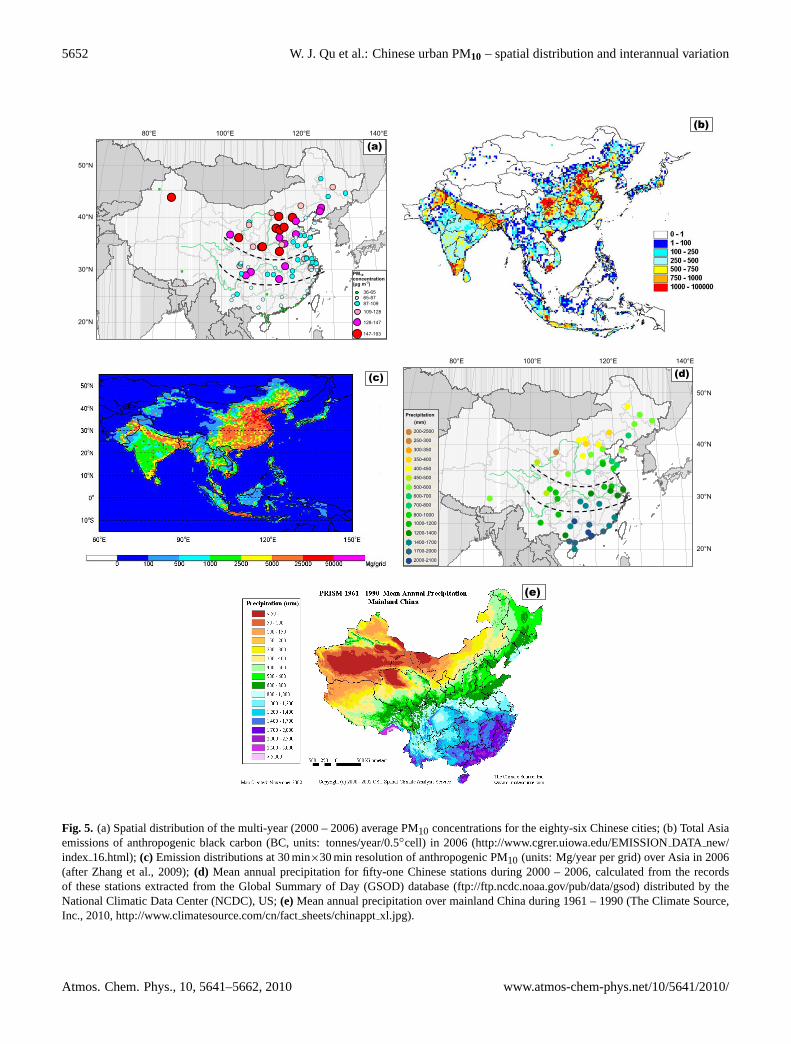
Fig. 5. (a) Spatial distribution of the multi-year (2000 – 2006) average PM10 concentrations for the eighty-six Chinese cities; (b) Total Asiaemissions of anthropogenic black carbon (BC, units: tonnes/year/0.5◦cell) in 2006 (http://www.cgrer.uiowa.edu/EMISSIONDATA new/index 16.html); (c) Emission distributions at 30 min×30 min resolution of anthropogenic PM10 (units: Mg/year per grid) over Asia in 2006(after Zhang et al., 2009);(d) Mean annual precipitation for fifty-one Chinese stations during 2000 – 2006, calculated from the recordsof these stations extracted from the Global Summary of Day (GSOD) database (ftp://ftp.ncdc.noaa.gov/pub/data/gsod) distributed by theNational Climatic Data Center (NCDC), US;(e) Mean annual precipitation over mainland China during 1961 – 1990 (The Climate Source,Inc., 2010,http://www.climatesource.com/cn/factsheets/chinapptxl.jpg).
Atmos. Chem. Phys., 10, 5641–5662, 2010 www.atmos-chem-phys.net/10/5641/2010/
W. J. Qu et al.: Chinese urban PM10 – spatial distribution and interannual variation 5653
availability of information regarding energy consumption,industrial output, etc. An inventory of anthropogenic air pol-lutant emissions in Asia was developed for the year 2006 forthe INTEX-B project (the Intercontinental Chemical Trans-port Experiment-Phase B, Zhang et al., 2009). We comparethe PM10 distributions we derived with the emissions of bothBC and PM10 from this inventory. Note BC and PM10 distri-butions from this inventory show similar patterns with resultsfrom other reseach on the anthropogenic nitric oxide (NO)emissions (see Fig. 7 in Tie et al., 2006b), indicating they arerepresentative of emissions from anthropogenic activities.
PM10 loadings in mid-eastern China (Fig. 5a) were gen-erally similar to the emission patterns of anthropogenic BC(Fig. 5b). Cities with high PM10 (>109 µg m−3, indicatedby pink-magenta-red symbols with concentrations from lowto high, Fig 5a) coincided with the areas with strong BCemissions (>500 tonnes/year/0.5◦cell, filled with yellow-orange-red with emissions from less to large, Fig. 5b) suchas the Beijing-Tianjin municipalities and southern HebeiProvince, mid-eastern Henan Province, and western-centralLiaoning Province in northern China. The high PM10 area ofChongqing-Chengdu-Luzhou (Fig. 5a) coincided with the in-tensive BC emission areas of SCB and northwestern GuizhouProvince (Fig. 5b), while the high PM10 area of Wuhan-Changsha (Fig. 5a) coincided with the intensive BC emissionareas of mid-eastern Hubei Province and mid-eastern HunanProvince (Fig. 5b).
In Shanxi Province, on the other hand, the high PM10 load-ings for Taiyuan-Datong-Yangquan-Changzhi (ranging from132 to 179 µg m−3, Fig. 5a) were seemingly at odds with thegenerally moderate BC emissions in that province (Fig. 5b).However, point sources of BC (>500 tonnes/year/0.5◦cell,filled with yellow, orange or red) as shown in Fig. 5b co-incided quite well with the locations of those four cities inFig. 5a. The same was true for Weinan, Xi’an and Baoji inShaanxi Province, for Lanzhou in Gansu Province, for Xin-ing in Qinghai Province, and for Urumchi in the XinjiangUyghur Autonomous Region.
In contrast, the distributions of PM10 concentration(Fig. 5a) along the east coast of China apparently do notfollow BC emissions (Fig. 5b). For example, although BCemissions in SDP and YRD are high (Fig. 5b), the averagePM10 concentrations for the cities in SDP during 2000 to2006 were not particularly high, less than 109 µg m−3 exceptfor Jinan (135 µg m−3, Fig. 5a). PM10 concentrations for thecities in YRD also were<109 µg m−3 except for Nanjing(125 µg m−3) and Hangzhou (119 µg m−3, Fig. 5a). Possi-ble reasons for the decoupling of PM10 and emissions alongthe Chinese coast are discussed below.
Emissions of anthropogenic PM10 (Fig. 5c) were generallysimilar to those of BC (Fig. 5b), but the high PM10 emissionareas are widespread, in contrast to the distributions of strongBC emissions—mostly concentrated in relatively limited re-gions. Similar to the relationship between the BC emis-sions and derived PM10 described above, the cities with high
PM10 loadings (>109 µg m−3, Fig 5a) coincided with the ar-eas with strong PM10 emissions (>5000 Mg/year per grid,filled with orange-red-magenta with emissions from less tolarge, Fig. 5c). This was true for the Beijing-Tianjin mu-nicipalities, Hebei-Shanxi-Henan provinces, Hubei-Hunanprovinces, and SCB-Guizhou Province.
Along the Chinese coast, including SDP, YRD and PRD,the relatively low PM10 loadings (Fig. 5a) were in contrastto the strong PM10 emissions there (Fig. 5c). For example,except for Tianjin, the cities along the coast including thosearound the Bohai Bay and SDP, in YRD and PRD all showedPM10 concentrations less than 109 µg m−3 (Fig. 5a). Thus,the intensive PM10 emissions in coastal regions bordering theBohai Sea, the Yellow Sea, the East China Sea, and the SouthChina Sea (Fig. 5c) evidently do not result in especially highPM10 loadings.
The discrepancy between the concentrations and emis-sions of PM10 along the coast can be explained by dilution ofthe pollutants by clean marine air and by wet scavenging ofthe PM by the more abundant precipitation there. With ref-erence to the latter, an examination of the mean annual pre-cipitaiton for fifty-one Chinese stations from 2000 to 2006(Fig. 5d) shows that precipitation at the coastal sites is gener-ally larger than those for the inland sites at the same latitude.Long-term averaged annual precipitations (1961 to 1990) forthe areas along the Chinese coast were also larger than thosefor the inland regions at the same latitude (Fig. 5e). Thesefindings support the idea that more PM is scavenged fromthe atmosphere by precipitation in coastal regions.
Moreover, as RH and liquid water content are related tothe levels of SVM and nitrate in aerosols, they are believedto play a major role in the gas-particle partitioning of semi-volatile species; volatilization loss of these SVM can resultin underestimation of PM mass by the TEOM measurementheating at 50◦C (Sciare et al., 2007). Therefore, the PM10concentrations calculated from APIs may be more stronglyaffected by this artifact in the costal areas where RH is gen-erally higher compared with inland sites. This may cause ar-tificially lower PM10 concentrations within our dataset alongthe coast.
In summary, except for the coastal areas, the distribution ofPM10 concentration was generally consistent with the anthro-pogenic emissions of BC and PM10 over China. Additionalinformation about anthropogenic emissions over China withrespect to monthly and seasonal variations can be found insupplementary material 4—Monthly mean tropospheric NO2over Southeast Asia during October 2004 to February 2007extracted from OMI (the Ozone Monitoring Instrument) ver-sion 1.0 (website,http://www.temis.nl/airpollution/no2col/no2regioomimonthcol3.php) (Boersma, et al., 2007).
3.5 Latitudinal and longitudinal gradients of PM 10
The PM10 concentrations for the northern zone generallywere slightly higher than or comparable with those in the
www.atmos-chem-phys.net/10/5641/2010/ Atmos. Chem. Phys., 10, 5641–5662, 2010
5654 W. J. Qu et al.: Chinese urban PM10 – spatial distribution and interannual variationFig. 6. 55
Northern Zone Middle Zone Southern Zone0
50
100
150
200
250
300
350
400
54.5
94.5
Median:108.0
PM
10 c
once
ntra
tion
(g
/m3 )
Whole study period
Northern Zone Middle Zone Southern Zone0
50
100
150
200
250
300
350
400Spring
PM
10 c
once
ntra
tion
(g
/m3)
Median:117.9
107.3
56.3
Northern Zone Middle Zone Southern Zone0
50
100
150
200
250
300
350
400Summer
PM
10 c
once
ntra
tion
(g
/m3)
Median:87.9
76.4
43.5
Northern Zone Middle Zone Southern Zone0
50
100
150
200
250
300
350
400Autumn
PM
10 c
onc
entr
atio
n (
g/m
3)
Median:102.5 95.9
59.6
Northern Zone Middle Zone Southern Zone0
50
100
150
200
250
300
350
400Winter
PM
10 c
onc
entr
atio
n (
g/m
3)
Median:147.8
114.5
65.4
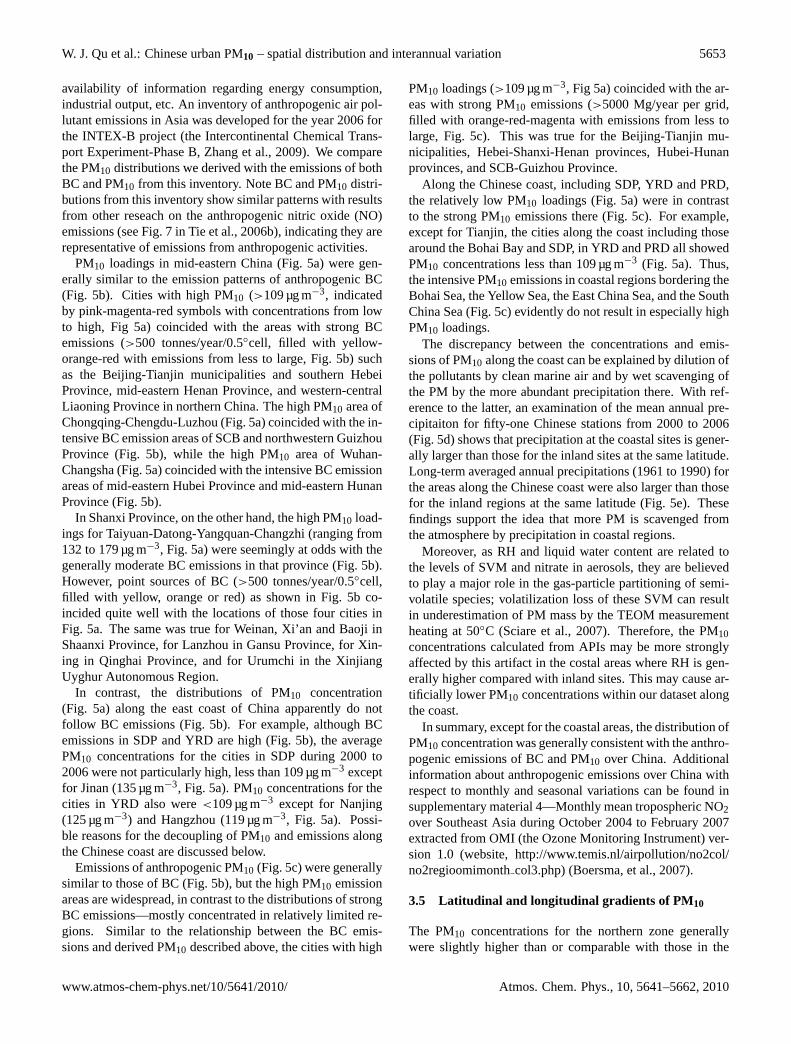
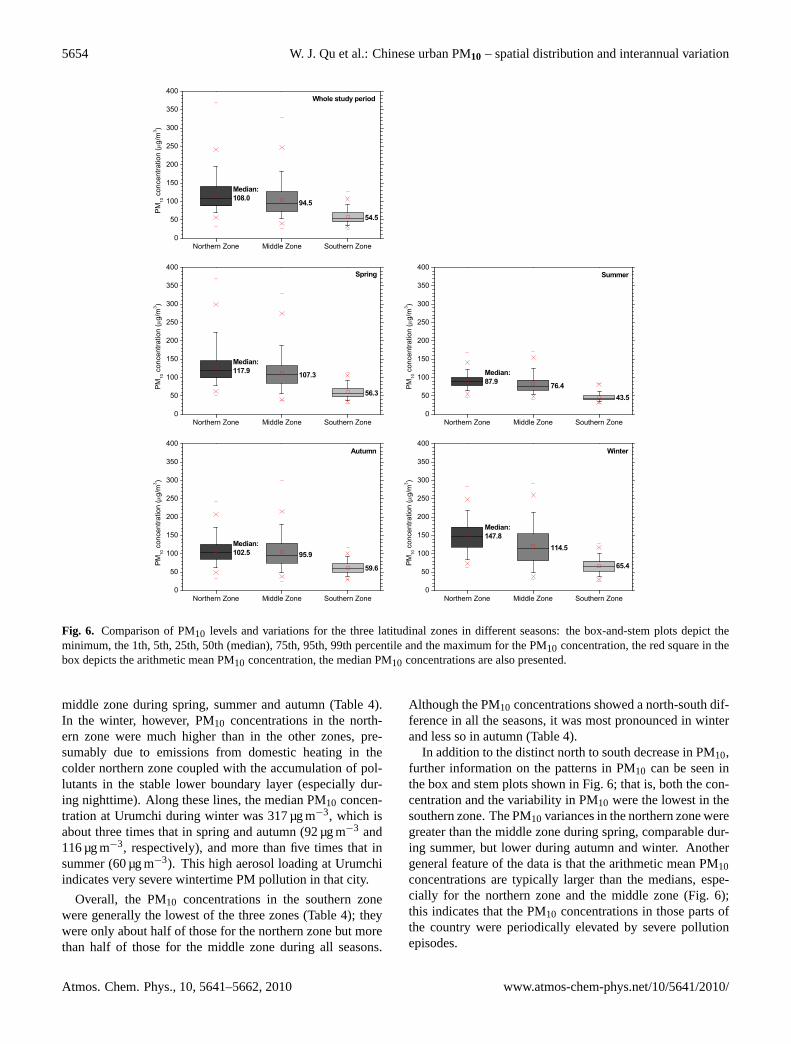
Fig. 6. Comparison of PM10 levels and variations for the three latitudinal zones in different seasons: the box-and-stem plots depict theminimum, the 1th, 5th, 25th, 50th (median), 75th, 95th, 99th percentile and the maximum for the PM10 concentration, the red square in thebox depicts the arithmetic mean PM10 concentration, the median PM10 concentrations are also presented.
middle zone during spring, summer and autumn (Table 4).In the winter, however, PM10 concentrations in the north-ern zone were much higher than in the other zones, pre-sumably due to emissions from domestic heating in thecolder northern zone coupled with the accumulation of pol-lutants in the stable lower boundary layer (especially dur-ing nighttime). Along these lines, the median PM10 concen-tration at Urumchi during winter was 317 µg m−3, which isabout three times that in spring and autumn (92 µg m−3 and116 µg m−3, respectively), and more than five times that insummer (60 µg m−3). This high aerosol loading at Urumchiindicates very severe wintertime PM pollution in that city.
Overall, the PM10 concentrations in the southern zonewere generally the lowest of the three zones (Table 4); theywere only about half of those for the northern zone but morethan half of those for the middle zone during all seasons.
Although the PM10 concentrations showed a north-south dif-ference in all the seasons, it was most pronounced in winterand less so in autumn (Table 4).
In addition to the distinct north to south decrease in PM10,further information on the patterns in PM10 can be seen inthe box and stem plots shown in Fig. 6; that is, both the con-centration and the variability in PM10 were the lowest in thesouthern zone. The PM10 variances in the northern zone weregreater than the middle zone during spring, comparable dur-ing summer, but lower during autumn and winter. Anothergeneral feature of the data is that the arithmetic mean PM10concentrations are typically larger than the medians, espe-cially for the northern zone and the middle zone (Fig. 6);this indicates that the PM10 concentrations in those parts ofthe country were periodically elevated by severe pollutionepisodes.
Atmos. Chem. Phys., 10, 5641–5662, 2010 www.atmos-chem-phys.net/10/5641/2010/
W. J. Qu et al.: Chinese urban PM10 – spatial distribution and interannual variation 5655
Possible reasons for the relationship between latitude andPM10 loading include (1) greater emissions from domesticheating during winter in the north (see supplementary mate-rial 4), (2) stronger impacts from dust storms during springfor the cities in northern China, and (3) more efficient dilu-tion of pollutants by the influx of clean maritime air and moreefficient wet scavenging of PM by precipitation in southernChina (Fig. 5d and e). In summary, the patterns in PM10 re-flect the combined impacts of emissions, transport, dilutionand removal on aerosol loadings over a broad region.
In addition to the latitudinal gradient, a distinct longitu-dinal aerosol gradient is evident in the northern zone wherePM10 concentrations decreased from west to east (supple-mentary material 5). Weaker influences from desert dust aswell as more efficient dilution with relatively clean marine airlikely contribute to the low PM10 levels in the eastern citiesin northern China. A strong west-to-east gradient of BC be-tween 30◦ N and 35◦ N also has been observed over the cen-tral Pacific Ocean (Kaneyasu and Murayama, 2000). On theother hand, for the cities in the middle and southern zones,PM10 concentrations also generally exhibited a decreasingtrend from west to east, but the longitudinal differences inthose cases were smaller and insignificant.
The latitudinal and longitudinal gradients in PM10 con-centration as depicted here only show broad patterns in theurban aerosol over China; the spatial distribution of the at-mospheric aerosol (as described in Sect. 3.4) is undoubtedlymore complicated.
3.6 Temporal trends in urban PM10
3.6.1 Interannual variations
There were changes in the number of cities included in thedataset over the course of the study (Table 1), and to circum-vent any biases from this, only the cities with full records(sixteen, eleven, and twelve cities in the northern, middle andsouthern zone, respectively) were considered in the follow-ing assessment of temporal trends in PM10 (Fig. 7). A com-parison between the entire dataset (all eighty-three cities inthe three latitudinal zones) and the subset (thirty-nine citieswith full records) shows similar patterns in PM10 variations,but the arithmetic means (or medians) of the subset were gen-erally higher.
We used the median values to assess interannual variationsin the PM10 concentrations for the three latitudinal zones for2000 to 2006 (Fig. 7). This was done to reduce the influenceof the rare exceptionally high values on the results. As notedabove, whenever the reported API was 500, the PM10 con-centration was arbitrarily set to 600. This would have intro-duced some additional complications into the assessment ifit had been based on the arithmetic or geometric mean PM10concentration, but it does not influence the assessments oftrends based on the median PM10 concentrations as presentedhere.
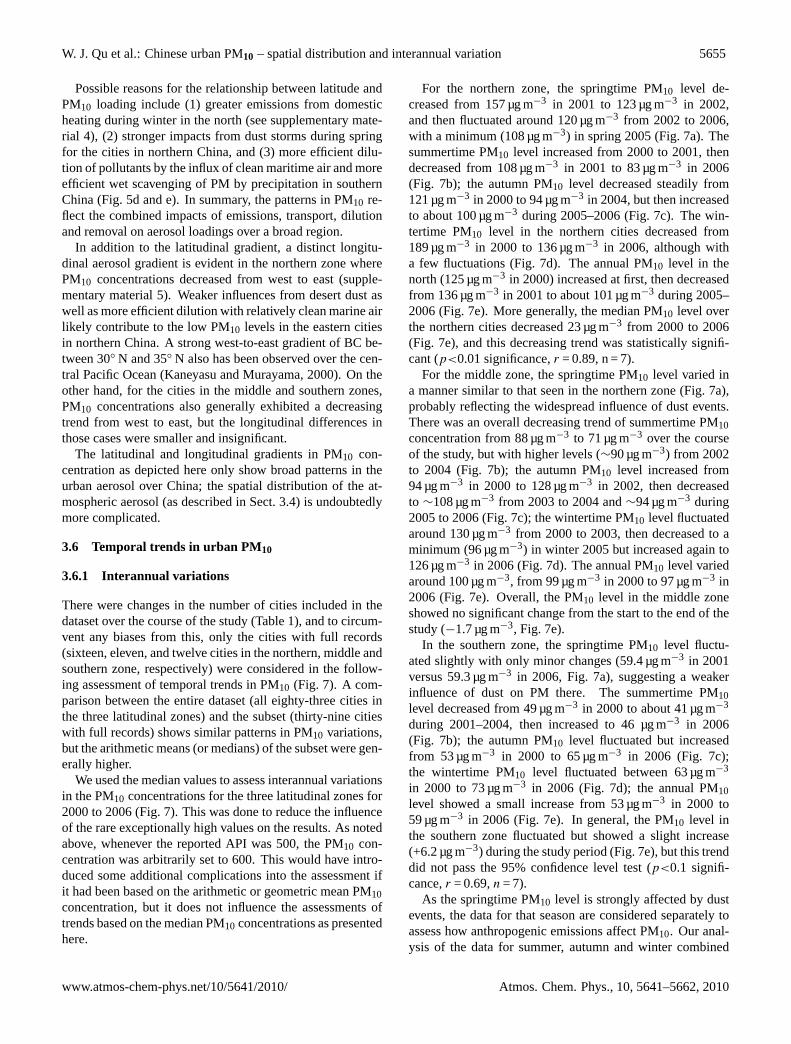
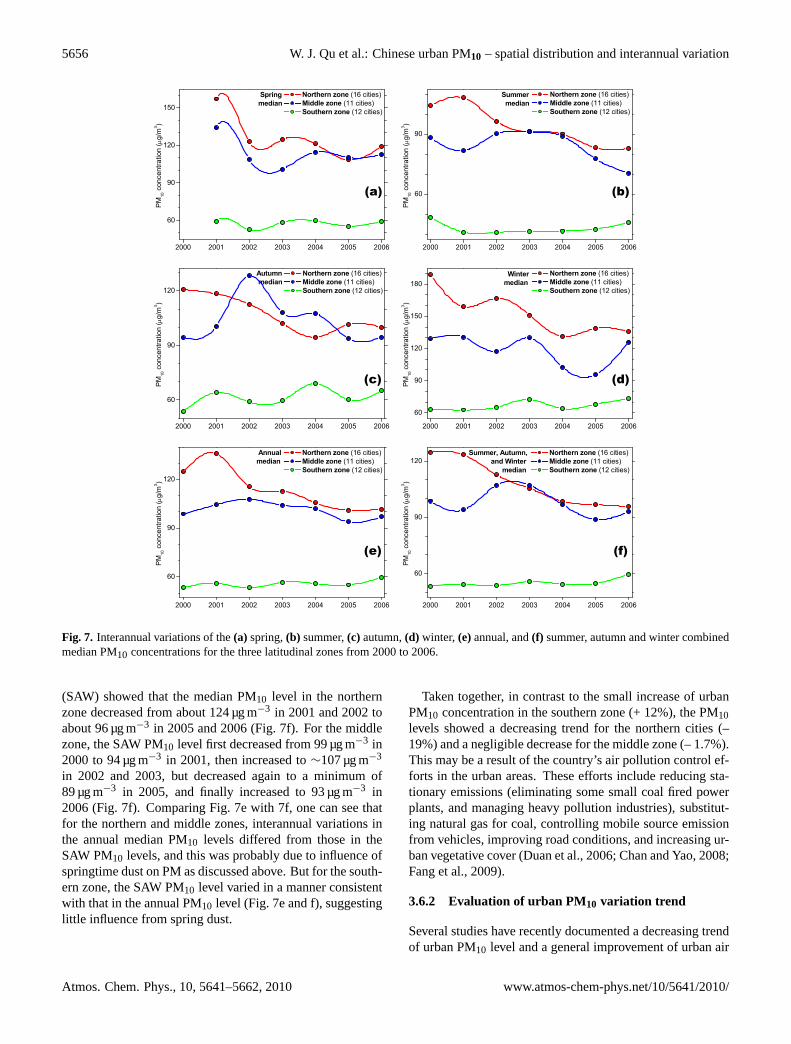
For the northern zone, the springtime PM10 level de-creased from 157 µg m−3 in 2001 to 123 µg m−3 in 2002,and then fluctuated around 120 µg m−3 from 2002 to 2006,with a minimum (108 µg m−3) in spring 2005 (Fig. 7a). Thesummertime PM10 level increased from 2000 to 2001, thendecreased from 108 µg m−3 in 2001 to 83 µg m−3 in 2006(Fig. 7b); the autumn PM10 level decreased steadily from121 µg m−3 in 2000 to 94 µg m−3 in 2004, but then increasedto about 100 µg m−3 during 2005–2006 (Fig. 7c). The win-tertime PM10 level in the northern cities decreased from189 µg m−3 in 2000 to 136 µg m−3 in 2006, although witha few fluctuations (Fig. 7d). The annual PM10 level in thenorth (125 µg m−3 in 2000) increased at first, then decreasedfrom 136 µg m−3 in 2001 to about 101 µg m−3 during 2005–2006 (Fig. 7e). More generally, the median PM10 level overthe northern cities decreased 23 µg m−3 from 2000 to 2006(Fig. 7e), and this decreasing trend was statistically signifi-cant (p<0.01 significance,r = 0.89, n = 7).
For the middle zone, the springtime PM10 level varied ina manner similar to that seen in the northern zone (Fig. 7a),probably reflecting the widespread influence of dust events.There was an overall decreasing trend of summertime PM10concentration from 88 µg m−3 to 71 µg m−3 over the courseof the study, but with higher levels (∼90 µg m−3) from 2002to 2004 (Fig. 7b); the autumn PM10 level increased from94 µg m−3 in 2000 to 128 µg m−3 in 2002, then decreasedto ∼108 µg m−3 from 2003 to 2004 and∼94 µg m−3 during2005 to 2006 (Fig. 7c); the wintertime PM10 level fluctuatedaround 130 µg m−3 from 2000 to 2003, then decreased to aminimum (96 µg m−3) in winter 2005 but increased again to126 µg m−3 in 2006 (Fig. 7d). The annual PM10 level variedaround 100 µg m−3, from 99 µg m−3 in 2000 to 97 µg m−3 in2006 (Fig. 7e). Overall, the PM10 level in the middle zoneshowed no significant change from the start to the end of thestudy (−1.7 µg m−3, Fig. 7e).
In the southern zone, the springtime PM10 level fluctu-ated slightly with only minor changes (59.4 µg m−3 in 2001versus 59.3 µg m−3 in 2006, Fig. 7a), suggesting a weakerinfluence of dust on PM there. The summertime PM10level decreased from 49 µg m−3 in 2000 to about 41 µg m−3
during 2001–2004, then increased to 46 µg m−3 in 2006(Fig. 7b); the autumn PM10 level fluctuated but increasedfrom 53 µg m−3 in 2000 to 65 µg m−3 in 2006 (Fig. 7c);the wintertime PM10 level fluctuated between 63 µg m−3
in 2000 to 73 µg m−3 in 2006 (Fig. 7d); the annual PM10level showed a small increase from 53 µg m−3 in 2000 to59 µg m−3 in 2006 (Fig. 7e). In general, the PM10 level inthe southern zone fluctuated but showed a slight increase(+6.2 µg m−3) during the study period (Fig. 7e), but this trenddid not pass the 95% confidence level test (p<0.1 signifi-cance,r = 0.69,n = 7).
As the springtime PM10 level is strongly affected by dustevents, the data for that season are considered separately toassess how anthropogenic emissions affect PM10. Our anal-ysis of the data for summer, autumn and winter combined
www.atmos-chem-phys.net/10/5641/2010/ Atmos. Chem. Phys., 10, 5641–5662, 2010
5656 W. J. Qu et al.: Chinese urban PM10 – spatial distribution and interannual variationFig. 7. 56
2000 2001 2002 2003 2004 2005 2006
60
90
120
150
Springmedian
PM
10 c
once
ntra
tion
(g/
m3)
Northern zone (16 cities) Middle zone (11 cities) Southern zone (12 cities)
2000 2001 2002 2003 2004 2005 2006
60
90
Summer median
Northern zone (16 cities) Middle zone (11 cities) Southern zone (12 cities)
PM
10 c
once
ntra
tion
(g/
m3)
2000 2001 2002 2003 2004 2005 2006
60
90
120
Autumn median
PM
10 c
once
ntra
tion
(g/
m3)
Northern zone (16 cities) Middle zone (11 cities) Southern zone (12 cities)
2000 2001 2002 2003 2004 2005 2006
60
90
120
150
180 Wintermedian
PM
10 c
once
ntra
tion
(g/
m3)
Northern zone (16 cities) Middle zone (11 cities) Southern zone (12 cities)
2000 2001 2002 2003 2004 2005 2006
60
90
120
Annualmedian
PM
10 c
onc
entr
atio
n (
g/m
3 )
Northern zone (16 cities) Middle zone (11 cities) Southern zone (12 cities)
2000 2001 2002 2003 2004 2005 2006
60
90
120Summer, Autumn, and Winter median
PM
10 c
onc
entr
atio
n (
g/m
3 )
Northern zone (16 cities) Middle zone (11 cities) Southern zone (12 cities)
(a) (b)
(c) (d)
(e) (f)
Fig. 7. Interannual variations of the(a) spring,(b) summer,(c) autumn,(d) winter,(e)annual, and(f) summer, autumn and winter combinedmedian PM10 concentrations for the three latitudinal zones from 2000 to 2006.
(SAW) showed that the median PM10 level in the northernzone decreased from about 124 µg m−3 in 2001 and 2002 toabout 96 µg m−3 in 2005 and 2006 (Fig. 7f). For the middlezone, the SAW PM10 level first decreased from 99 µg m−3 in2000 to 94 µg m−3 in 2001, then increased to∼107 µg m−3
in 2002 and 2003, but decreased again to a minimum of89 µg m−3 in 2005, and finally increased to 93 µg m−3 in2006 (Fig. 7f). Comparing Fig. 7e with 7f, one can see thatfor the northern and middle zones, interannual variations inthe annual median PM10 levels differed from those in theSAW PM10 levels, and this was probably due to influence ofspringtime dust on PM as discussed above. But for the south-ern zone, the SAW PM10 level varied in a manner consistentwith that in the annual PM10 level (Fig. 7e and f), suggestinglittle influence from spring dust.
Taken together, in contrast to the small increase of urbanPM10 concentration in the southern zone (+ 12%), the PM10levels showed a decreasing trend for the northern cities (–19%) and a negligible decrease for the middle zone (– 1.7%).This may be a result of the country’s air pollution control ef-forts in the urban areas. These efforts include reducing sta-tionary emissions (eliminating some small coal fired powerplants, and managing heavy pollution industries), substitut-ing natural gas for coal, controlling mobile source emissionfrom vehicles, improving road conditions, and increasing ur-ban vegetative cover (Duan et al., 2006; Chan and Yao, 2008;Fang et al., 2009).
3.6.2 Evaluation of urban PM10 variation trend
Several studies have recently documented a decreasing trendof urban PM10 level and a general improvement of urban air
Atmos. Chem. Phys., 10, 5641–5662, 2010 www.atmos-chem-phys.net/10/5641/2010/

W. J. Qu et al.: Chinese urban PM10 – spatial distribution and interannual variation 5657
quality in northern and middle China. For example, Chanand Yao (2008) indicated that the annual median PM10 con-centration in Beijing decreased from 180 µg m−3 in 1999 to142 µg m−3 in 2005. A study in Lanzhou showed that theconcentrations of magnetic minerals in the wintertime ur-ban dustfall samples (collected during 1997–2005) have de-creased, indicating an improvement of the winter air quality(Xia et al., 2008). Zhang et al. (2006) also reported that theair quality in Shenyang improved year-by-year from 1995to 2004. In addition, PM10 concentration in Nanchong de-creased dramatically from 146 µg m−3 in January 2002–May2003 (Wen et al., 2004) to 74.6 µg m−3 in January 2006–February 2007. Shi et al. (2008) concluded that the air qual-ity has improved in Shanghai, Nanjing, Hangzhou and Hefeifrom 2002 to 2005. Moreover, an analysis of data from morethan 300 major cities in China indicated that the percentageof cities with PM10 concentrations less than 100 µg m−3 in-creased from 36.8% in 2002 to 62.8% in 2006, and the citieswith PM10 concentrations greater than 150 µg m−3 decreasedfrom 29.8% to 5.3% (Yao et al., 2009).
It is worth noting that the variation trends in PM10 concen-tration presented here for the three latitude zones in Chinareflect changes in aerosol loadings in major cities, but theyare not necessarily representative of the variations in aerosolconcentrations over less populated regions.
We note that coal product usage in China increased from∼1320 million tons in 2000 to∼2392 million tons in 2006,and petroleum product usage increased steadily from∼224million tons in 2000 to∼349 million tons in 2006 (source:National Bureau of Statistics China,http://www.stats.gov.cn/tjsj/ndsj/2007/indexch.htm; Fang et al., 2009). On the otherhand, technological improvements have been implementedin China, which lead to decrease of the average emissionfactors of SO2, NOχ and PM2.5 for coal-fired power plantsfrom 2000 to 2006, especially those for PM2.5; meanwhile,the average emission factors of NOχ , CO and VOC (volatileorganic compounds) for gasoline vehicles also decreased sig-nificantly from 2000 to 2006 (Zhang et al., 2009). Note emis-sion factor is a representative value that attempts to relate thequantity of a pollutant released to the atmosphere with an ac-tivity associated with the release of that pollutant, which isusually expressed as the weight of pollutant divided by a unitweight, volume, distance, or duration of the activity emittingthe pollutant (e.g., kilograms of particulate emitted per mega-gram of coal burned,http://www.epa.gov/ttnchie1/ap42/).
However, according to Streets et al. (2003) and Zhanget al. (2009), except for a decreasing trend in OC (organiccarbon) (3.4 Tg→3.2 Tg), China’s anthropogenic emissions,including SO2 (20.4 Tg→31.0 Tg), CO (116 Tg→166.9 Tg)and NMVOC (nonmethane volatile organic compounds,17.4 Tg→23.2 Tg) increased by about 50% from 2000 to2006, while those for NOχ (11.4 Tg→20.8 Tg) and BC(1.05 Tg→1.8 Tg) increased by about 100%. Zhang etal. (2009) estimated 2006 and 2001 emissions for China us-ing a same methodology, and they found that all species show
an increasing trend during 2001 to 2006: 36% increase forSO2, 55% for NOχ , 18% for CO, 29% for VOC, 13% forPM10, and 14% for PM2.5, BC, and OC.
How can the decreasing trend in PM10 level from 2000to 2006 be reconciled with the increases in fossil fuel us-age (such as coal and petroleum) and anthropogenic emis-sions for the country? The most likely explanation is that in-creasingly stringent emission control standards and air qual-ity management strategies for major cities have led to local-ized improvements of air quality.
Another possibility is that the sources for the pollutionemissions have become more widely dispersed. Along theselines are the effects of growing urbanization. According toChan and Yao (2008), from 1980 to 2005, the urban popula-tion in China increased from 19.6 to 40.5%; the number ofcities increased to over 660, and more than 170 cities hadover 1 million permanent residents in 2004 (National Bu-reau of Statistics China, 2005a, 2006a). Meanwhile, megacities (conventionally defined as cities with populations over10 000 000) emerged in the 1990s in China and city clus-ters developed in the proximity of the mega cities (NationalBureau of Statistics China, 2005b, 2006b). The economicexpansion, especially in rural and under-developed areas ofChina, has affected the geographical distributions of pol-lution emissions. This can be seen from the changes inthe sources for major air pollutants, including SO2, NOx,NMVOC and BC from 2000 to 2006 (see supplementary ma-terial 6; Streets et al., 2003; Zhang et al., 2009).
More generally, aerosol loadings vary due to interactionsamong many processes including emissions (anthropogenicemission and natural dust production), transport (as well asconvection influenced dispersion and dilution), photochem-ical transformation (new particle speciation and productionof secondary aerosols), and deposition (dry and wet), withmeteorology playing an overarching role. The causes for thevariations in aerosol loadings in China are undoubtedly com-plicated, and results suggesting improvements in air qualityin major cities in northern China, while encouraging, shouldbe assessed cautiously; further study is obviously necessaryon this issue.
3.7 Comparison of PM10 variations with AOD/AOTresults
3.7.1 Comparison of PM10 with AOD/AOT
As described in Sect. 3.4.1, areas found to have rela-tively high PM10 concentrations such as central-easternChina, NCP, SCB, YRD and PRD (Fig. 5a) also were highAOD/AOT areas as identified by the radiation/optical mea-surements and satellite observations (Luo et al., 2000, 2001;Li et al., 2003; Wang et al., 2008). Using the AOT data fromtwo AERONET sites (Beijing and Guangzhou, data availablefrom the AERONET web site,http://aeronet.gsfc.nasa.gov/),we conducted a preliminary comparison of the daily AOT
www.atmos-chem-phys.net/10/5641/2010/ Atmos. Chem. Phys., 10, 5641–5662, 2010
5658 W. J. Qu et al.: Chinese urban PM10 – spatial distribution and interannual variation
at 440 nm with surface PM10 concentration (supplemen-tary material 7). Our comparisons are limited to these twocities because of the limited overlap of the API PM10 andAERONET AOT dataset.
The AOTs at 440 nm generally showed good correla-tions with the surface PM10 concentrations at Beijing andGuangzhou. Another important feature of the Beijing data isthat the correlation between the AOT at 440 nm and the PM10concentration in summer (r = 0.63) is higher than in the otherseasons (r = 0.34, 0.58 and 0.50 in spring, autumn and winter,respectively). Xia et al. (2006) presented a detailed compar-ison between AERONET AOT at 440 nm and PM10 concen-tration in Beijing that covered a period of 33 months. Theirstudy also found a higher correlation coefficient in summer(r = 0.77) compared with the other seasons (r = 0.37, 0.70,and 0.61 in spring, autumn and winter, respectively). Theyargued that the higher correlation between AOT and PM10in summer indicated that the aerosols are well mixed, andsurface measurements then are a good indicator of column-integrated values. These authors attributed the differencesin seasonal and diurnal variations between AOT and surfacePM10 to the variation of atmospheric mixing layer height.
Song et al. (2009) compared three years of MODIS AOD(at 550 nm) with spatial and seasonal variations of PM10 con-centration for forty-seven sites; they found variability in therelationships between AOD and surface PM10 as well as re-gional differences in their seasonality over China. The cor-relation coefficients they calculated between PM10 and AODwere +0.6 or higher in the southeastern coast but−0.6 orlower in the north-central region; and this regional discrep-ancy was largely attributed to the difference in the size distri-butions of aerosols. We discuss in more detail several factorsthat could cause differences between the surface PM10 con-centration and the AOD/AOT in supplementary material 8.
In summary, the results above indicate that AOD/AOT andthe surface PM10 measurements provide related but differentinformation on atmospheric particulates. A myriad of fac-tors cause both PM and AOD vary in complex ways. Con-ditions in the atmospheric boundary layer (convection andmixing layer height), aerosol size distributions and chemicalcomposition, source regions and transport patterns, and wetscavenging all could result in differences between AOD/AOTand surface aerosol concentration. Further studies to assessthe causes of long-term changes in surface PM and AOD aswell as the relationships between them appear warranted.
3.7.2 Trends in PM10 and AOD
We note that the decreasing trend of PM10 level in northernChina presented here appears to be different from the trendin visibility over a much longer period (1973–2007, Wang etal., 2009). For the same period as this study (2000 to 2006),Wang et al. found an increase in the AOD in what the au-thors referred to as the “Asia (south)” region (which includesChina, see Fig. 1 in Wang et al., 2009). This is in contrast
to the decreasing trend we found for urban PM10 in northernChina.
What could be the cause of this inconsistency? In fact,the “Asia (south)” region in the Wang et al. study includesnot only China but also several other countries in southernAsia (Fig. S7 in the supporting online material of Wang et al.,2009,http://www.sciencemag.org/cgi/content/full/323/5920/1468/DC1). It is well known that some of these countries,such as India (Venkataraman et al., 2002), Pakistan (Smithet al., 1996), Bangladesh (Salam et al., 2003) and Viet-nam (Deng et al., 2008b), experience severe air pollution.Indeed, the AODs (0.55 µm) derived from visibility mea-surements at meteorological stations during 2000–2007 weremuch higher over the southern Asia countries (especially In-dia and Bangladesh) than over China (Fig. S1 in the sup-porting online material of Wang et al., 2009,http://www.sciencemag.org/cgi/content/full/323/5920/1468/DC1). If themore heavily polluted areas of south Asia were to be ex-cluded from the “Asia (south)” region in this analysis, theAOD tendency might well be different. Moreover, emissions(including intensive biomass burning emission) originatingin southern Asia also are sources for air pollutants that can betransported across national borders into southwestern Chinaand PRD (Deng et al., 2008b).
On the other hand, as mentioned in Sect. 3.6.2, the PM10trends presented here reflect changes in aerosol loadings inmajor cities as they were based on APIs of eighty-six majorChinese cities, while the visibility data used in the Wang etal. (2009) study were available for about six hundred sitesin mainland China, which were more representative of thevariation in air pollution at regional scales. Therefore, theresults of these two studies did not necessarily match eachother.
More to the point, as discussed above, numerous fac-tors can lead to differences between surface PM10 andAOD/AOT. Along these lines, Li et al. (2005) reported thatthe seasonality of AOD over Urumchi did not precisely fol-low the monthly variations in common pollutants such asPM10, SO2 and NO2. The difference in trends betweenAOD/AOT and surface PM10 could be explained by changesin the emissions of anthropogenic fine particles that havehigh extinction efficiencies but contribute little to the PM10mass. For example, Zhang et al. (2004) found that thePM2.5/PM10 ratio ranged between 0.5–0.7 with an average0.6 for six cities (Guangzhou, Wuhan, Lanzhou, Chongqing,Qingdao, Beijing) and the PRD in China. High PM2.5/PM10ratios (e.g., larger than 0.6) are generally ascribed to sec-ondary particulate formation; low ratios can be caused byfugitive dusts or dust delivered by long-distance transport(Chan and Yao, 2008).
Various studies also have shown conflicting patterns inAOD. For example, estimates of AOD based on emissionsled Streets et al. (2006) to conclude that AOD over China de-creased from 1995–1996 (∼0.305) to 2000 (0.29); and thiswas consistent with variation of surface shortwave irradiance
Atmos. Chem. Phys., 10, 5641–5662, 2010 www.atmos-chem-phys.net/10/5641/2010/
W. J. Qu et al.: Chinese urban PM10 – spatial distribution and interannual variation 5659
measurements at fifty-two weather stations and with the risetrend in mean surface temperatures in China starting in themid-1990s. However, Xia et al. (2007) reported that AODat 550 nm over Beijing increased from about 0.28 in 1980to about 0.68 in 2005. Using monthly AOD (500 nm) datafrom the Total Ozone Mapping Spectrometer (TOMS), Xieand Xia (2008) documented an increasing tendency of AODin north China from 1997 to 2001, especially for the springAOD in northeast China. These different results suggestedthat further investigation on AOD variation trend over Chinaas well as its relationship with surface pollutants such asPM10 is needed.
4 Conclusions
A comprehensive analysis of aerosol impacts on climate re-quires detailed information on chemical composition and op-tical properties of the aerosol as a function of particle sizealong with a full set of meteorological measurements. Un-fortunately, data of this nature are only available from a fewscattered sites and then for limited times over China. Fur-ther analysis of the spatial and temporal distribution of theaerosol levels and compositions is obviously necessary to as-sess its potential effects on climate as well as other effectssuch as adverse health and visibility impairment. Moreover,information on how the chemical components of the aerosolvary between different locations (e.g. coast and inland) alsowill be useful.
Most of EPA-China’s air quality monitoring stations arelocated in densely populated urban areas in middle-easternChina, and this makes them suitable for addressing concernsover the health effects of air pollution. However, to study thebroader impacts of air pollution, such as climate effects, aswell as to evaluate transboundary transport, more monitoringneeds to be conducted at rural or remote sites, especially inwestern China and along the country’s borders. In addition,studies of specific types of air pollutants with the potentialto influence climate, such as black carbon, sulfate and dustaerosol should be included in the monitoring programs.
Another broad objective for studies involving aerosol par-ticles and their impacts is to link PM loadings to sources.Our studies have shown that spatial distribution of the urbanPM10 follows the anthropogenic emissions of BC and PM10over much of China but not along the Chinese coast; this sug-gests that pollutants are diluted by the influx of clean marineair and removed by scavenging of the particles due to moreabundant precipitation there.
With further reference to air quality, our data indicate thatthe urban PM10 level in the southern zone may have in-creased (+12%) from 2000 to 2006, suggesting that addi-tional attention should be paid to the control of atmosphericparticulate pollution in southern China. As the secondaryaerosol is a major contributor to PM in the southern cities
(Ye et al., 2003), controlling emissions of precursor gasesmay be helpful in improving the air quality in that region.
Decreasing trends in PM10 level from 2000 to 2006 sug-gest improvements in the air quality of major cities in north-ern China. However, a comparison of the anthropogenicemissions over China between year 2000 and year 2006shows that the sources for the pollution emissions have be-come more widely dispersed (see supplementary material 6;Streets et al., 2003; Zhang et al., 2009). The geographicaldistributions of pollution emissions have been affected by theeconomic expansion into rural and under-developed areas ofChina. In addition to stringent controls on large emissionsources in urban areas, adequate attention also should be paidto the newer sources in rural and under-developed areas.
The frequencies of Asian dust events mirrored the APImaxima for the northern cities, and this indicates that dustcan contribute to the degradation of springtime air quality innorthern China. Along the same lines, Li et al. (2007) ob-served important influences of dust events on spring air qual-ity in Shijiazhuang city from 2002 to 2006. In that study, allof the springtime days with mid-level or more serious pol-lution were concurrent with or followed days of dust-events.Wang et al. (2004b) also reported a significant contributionof Asian dust to PM10 pollution at Beijing during the spring-time. This is significant because desert dust production willbe difficult if not impossible to control, and some allowancesfor naturally-occurring PM may be appropriate for air qualitystandards.
Although the PM10 dataset as used in this study is not suf-ficient for an in-depth analysis of aerosol impacts on climate,the results do provide insights into the spatial distributionsand temporal variability of the atmospheric aerosol, espe-cially those areas most strongly affected by particulate pol-lution. Undoubtedly, comparison of infromation on PM ob-tained using different methods can improve our understand-ing of the spatio-temporal patterns of the aerosol as well asthe potential for climate and other effects. In addition, re-sults of this study will contribute to a better understandingof air pollution in the major urban areas of China, informa-tion of this type should be useful for the development andimplementation of effective air-pollution control strategies.
Supplementary material related to this article is availableonline at:http://www.atmos-chem-phys.net/10/5641/2010/acp-10-5641-2010-supplement.pdf.
Acknowledgements.We are grateful to the anonymous ref-erees for their constructive suggestions and comments.The daily API records for 86 Chinese cities are obtainedfrom State Environmental Protection Agency of China(http://www.sepa.gov.cn/quality/air.php3). This research wassupported by National Basic Research Program of China (GrantNo. 2006CB403701, 2006CB403702), the Chinese Ministry of
www.atmos-chem-phys.net/10/5641/2010/ Atmos. Chem. Phys., 10, 5641–5662, 2010
5660 W. J. Qu et al.: Chinese urban PM10 – spatial distribution and interannual variation
Education’s 111 Project (B07036) and by the National ScienceFoundation of the United States (ATM 0404944).
Edited by: C. K. Chan
References
Bari, A., Ferraro, V., Wilson, L. R., Luttinger, D., and Husain, L.:Measurements of gaseous HONO, HNO3, SO2, HCl, NH3, par-ticulate sulfate and PM2.5 in New York, NY, Atmos. Environ.,37(20), 2825–2835, 2003.
Bi, X. H., Feng, Y. C., Wu, J. H., Wang, Y. Q., and Zhu, T.: Sourceapportionment of PM10 in six cities of northern China, Atmos.Environ., 41, 903–912, 2007.
Boersma, K. F., Eskes, H. J., Veefkind, J. P., Brinksma, E. J., vander A, R. J., Sneep, M., van den Oord, G. H. J., Levelt, P. F.,Stammes, P., Gleason, J. F., and Bucsela, E. J.: Near-real timeretrieval of tropospheric NO2 from OMI, Atmos. Chem. Phys.,7, 2103–2118, doi:10.5194/acp-7-2103-2007, 2007.
Cao, J. J., Lee, S. C., Ho, K. F., Zhang, X. Y., Zou, S. C., Fung, K.,Chow, J. C., and Watson, J. G.: Characteristics of carbonaceousaerosol in Pearl River Delta Region, China during 2001 winterperiod, Atmos. Environ., 37, 1451–1460, 2003.
Chan, C. K. and Yao, X. H.: Air pollution in mega cities in China,Atmos. Environ., 42, 1–42, 2008.
Charlson, R. J., Schwartz, S. E., Hales, J. M., Cess, R. D., Coakley,J. A. J., Hansen, J. E., and Hofmann, D. J.: Climate forcing byanthropogenic aerosols, Science, 255, 423–430, 1992.
Chu, P. C., Chen, Y. C., Lu, S. H., Li, Z. C., and Lu, Y. Q.: Partic-ulate air pollution in Lanzhou China, Environ. Int., 34, 698–713,2008.
Collins, D. R., Jonsson, H. H., Liao, H., Flagan, R. C., Seinfeld, J.H., Noone, K. J., and Hering, S. V.: Airborne analysis of the LosAngeles aerosol, Atmos. Environ., 34, 4155–4173, 2000.
Davis, B. L. and Guo, J. X.: Airborne particulate study in five citiesof China, Atmos. Enviro., 34, 2703–2711, 2000.
Deng, X. J., Tie, X. X., Wu, D., Zhou, X. J., Bi, X. Y., Tan, H.B., Li, F., and Jiang, C. L.: Long-term trend of visibility and itscharacterizations in the Pearl River Delta (PRD) region, China,Atmos. Environ., 42, 1424–1435, 2008a.
Deng, X. J., Tie, X. X., Zhou, X. J., Wu, D., Zhong, L. J., Tan, H. B.,Li, F., Huang, X. Y., Bi, X. Y., and Deng, T.: Effects of SoutheastAsia biomass burning on aerosols and ozone concentrations overthe Pearl River Delta (PRD) region, Atmos. Environ., 42, 8493–8501, 2008b.
Duan, F. K., He, K. B., Ma, Y. L., Jia, Y. T., Yang, F. M., Lei,Y., Tanaka, S., and Okuta, T.: Characteristics of carbonaceousaerosols in Beijing, China, Chemosphere, 60, 355–364, 2005.
Duan, F. K., He, K. B., Ma, Y. L., Yang, F. M., Yu, X. C., Cadle,S. H., Chan, T., and Mulawa, P. A.: Concentration and chemicalcharacteristics of PM2.5 in Beijing, China: 2001–2002, Sci. TotalEnviron., 355, 264–275, 2006.
Fang, M., Zheng, M., Wang, F., Chim, K. S., and Kot, S. C.: Thelong-range transport of aerosols from northern China to HongKong a multi-technique study, Atmos. Environ., 33, 1803–1817,1999.
Fang, M., Chan, C. K., and Yao, X. H.: Managing air quality in arapidly developing nation: China, Atmos. Environ., 43, 79–86,2009.
Feng, J. L., Hu, M., Chan, C. K., Lau, P. S., Fang, M., He, L. Y., andTang, X. Y.: A comparative study of the organic matter in PM2.5from three Chinese megacities in three different climatic zones,Atmos. Environ., 40, 3983–3994, 2006.
Guinot, B., Cachier, H., Sciare, J., Tong, Y., Xin, W., and Jianhua,Y.: Beijing aerosol: Atmospheric interactions and new trends, J.Geophys. Res., 112, D14314, doi:10.1029/2006JD008195, 2007.
He, K. B., Yang, F. M., Ma, Y. L., Zhang, Q., Yao, X. H., Chan, C.K., Cadle, S., Chan, T., and Mulawa, P.: The characteristics ofPM2.5 in Beijing, China, Atmos. Environ., 35, 4959–4970, 2001.
Highwood, E. J. and Kinnersley, R. P.: When smoke gets in oureyes: The multiple impacts of atmospheric black carbon on cli-mate, air quality and health, Environ. Int., 32, 560–566, 2006.
Kaneyasu, N. and Murayama, S.: High concentrations of black car-bon over middle latitudes in the North Pacific Ocean, J. Geophys.Res., 105(D15), 19881–19890, 2000.
Kaufman, Y. J., Tanre, D., and Boucher, O.: A satellite view ofaerosols in the climate system, Nature, 419, 215–223, 2002.
King, A. M.: New directions: TEOMs and the volatility of UKnon-urban PM10: a regulatory dilemma?, Atmos. Environ., 34,3210–3212, 2000.
Li, S. -M., Tang, J., Xue, H., and Toom-Sauntry, D.: Size distribu-tion and estimated optical properties of carbonate, water solubleorganic carbon, and sulfate in aerosols at a remote high altitudesite in western China, Geophys. Res. Lett., 27(8), 1107–1110,2000.
Li, C. C., Mao, J. T., Lau, K. A., Chen, J. C., Yuan, Z. B., Liu, X.Y., Zhu, A. H., and Liu, G. Q.: Characteristics of distribution andseasonal variation of aerosol optical depth in eastern China withMODIS products, Chinese Sci. Bull., 48(22), 2488–2495, 2003.
Li, X., Chen, Y. H., Hu, X. Q., Ren, Y. Y., and Wei, W. S.: Analy-sis of atmospheric aerosol optical properties over Urumqi, ChinaEnvironmental Science, 25(supp.), (in Chinese with English ab-stract), 22–25, 2005.
Li, Y., Zhang, X. Y., Gong, S. L., Che, H. Z., Wang, D., Qu, W.J., and Sun, J. Y.: Comparison of EC and BC and evaluation ofdust aerosol contribution to light absorpition in Xi’An, China,Environ. Monit. Assess., 120, 301–312, 2006.
Li, G. C., Wang, J. G., and Lian, Z. L.: Relationship between atmo-spheric pollution and sandy weather in Shijiazhuang, (in Chinesewith English abstract), J. Meteorol. Environ., 23(2), 1–5, 2007.
Li, J., Zhuang, G. S., Huang, K., Lin, Y. F., Xu, C., and Yu, S. L.:Characteristics and sources of air-borne particulate in Urumqi,China, the upstream area of Asia dust, Atmos. Environ., 42, 776–787, 2008.
Luo, Y. F., Lu, D. R., He, Q., Li, W. L., and Zhou, X. J.: Character-istics of atmospheric aerosol optical depth variation over Chinain recent 30 years, Chinese Sci. Bull., 45(14), 1328–1333, 2000.
Luo, Y., Lu, D., Zhou, X., Li, W., and He, Q.: Characteristics of thespatial distribution and yearly variation of aerosol optical depthover China in last 30 years, J. Geophys. Res., 106(D13), 14501–14513, 2001.
Meng, Z. Y., Jiang, X. M., Yan, P., Lin, W. L., Zhang, H. D., andWang, Y.: Characteristics and sources of PM2.5 and carbona-ceous species during winter in Taiyuan, China, Atmos. Environ.,41, 6901–6908, 2007.
Met One Instruments Inc: BAM-1020 continuous particulate mon-itor: http://www.metone.com/documents/BAM-10206-08.pdf,last access: 28 August 2009.
Atmos. Chem. Phys., 10, 5641–5662, 2010 www.atmos-chem-phys.net/10/5641/2010/
W. J. Qu et al.: Chinese urban PM10 – spatial distribution and interannual variation 5661
Meywerk, J. and Ramanathan, V.: Observations of the spectralclear-sky aerosol forcing over the tropical Indian Ocean, J. Geo-phys. Res., 104(D20), 24359–24370, 1999.
Mo, Y. C., Zheng, F. Q., and Liao, G. L.: Correlation analysisof PM10 concentration and meteorological condition in Nan-ning, (in Chinese with English abstract), J. Meteorol. Res. Appl.,29(1), 55–56, 2008.
Nair, V. S., Babu, S. S., and Moorthy, K. K.: Aerosol characteristicsin the marine atmospheric boundary layer over the Bay of Bengaland Arabian Sea during ICARB: Spatial distribution and latitu-dinal and longitudinal gradients, J. Geophys. Res., 113, D15208,doi:10.1029/2008JD009823, 2008.
National Bureau of Statistics of China: China Statistical Yearbook2005, China Statistics Press, Beijing, China, 2005a.
National Bureau of Statistics of China: Urban Statistical Yearbookof China 2005, China Statistics Press, Beijing, China, 2005b.
National Bureau of Statistics of China: China Statistical Yearbook2006, China Statistics Press, Beijing, China, 2006a.
National Bureau of Statistics of China: Urban Statistical Yearbookof China 2006, China Statistics Press, Beijing, China, 2006b.
National Bureau of Statistics China:http://www.stats.gov.cn/tjsj/ndsj/2007/indexch.htm, access: 28 April 2010.
Ning, H. W., Wang, S. G., and Du, J. W.: Characteristics of sand-dust events and their influence on air quality of Xi’an city, (inChinese with English abstract), J. Desert Res., 25(6), 886–890,2005.
Okuda, T., Kato, J., Mori, J., Tenmoku, M., Suda, Y., Tanaka, S.,He, K. B., Ma, Y. L., Yang, F. M., Yu, X. C., Duan, F. K.,and Lei, Y.: Daily concentrations of trace metals in aerosols inBeijing, China, determined by using inductively coupled plasmamass spectrometry equipped with laser ablation analysis, andsource identification of aerosols, Sci. Total Environ., 330, 145–158, 2004.
Okuda, T., Katsuno, M., Naoi, D., Nakao, S., Tanaka, S., He, K. B.,Ma, Y. L., Lei, Y., and Jia, Y. T.: Trends in hazardous trace metalconcentrations in aerosols collected in Beijing, China from 2001to 2006, Chemosphere, 72, 917–924, 2008.
Pope, C. A., Dockery, D. W., and Schwartz, J.: Review of epidemi-ological evidence of health effects of particulate air pollution,Inhal. Toxicol., 7, 1–18, 1995.
Qu, W. J., Zhang, X. Y., Arimoto, R., Wang, D., Wang, Y. Q.,Yan, L. W., and Li Y.: Chemical composition of the backgroundaerosol at two sites in southwestern and northwestern China: po-tential influences of regional transport, Tellus, 60B, 657–673,2008.
Rajeev, K. and Ramanathan, V.: Direct observations of clear-skyaerosol radiative forcing from space during the Indian Ocean Ex-periment, J. Geophys. Res., 106(D15), 17221–17235, 2001.
Salam, A., Bauer, H., Kassin, K., Ullah, S. M., and Puxbaum,H.: Aerosol chemical characteristics of a mega-city in South-east Asia (Dhaka-Bangladesh), Atmos. Environ., 37, 2517–2528,2003.
Sciare, J., Cachier, H., Sarda-Esteve, R., Yu, T., and Wang, X.:Semi-volatile aerosols in Beijing (R.P. China): Characterizationand influence on various PM2.5 measurements, J. Geophys. Res.,112, D18202, doi:10.1029/2006JD007448, 2007.
Shao, M., Tang, X. Y., Zhang, Y. H., and Li, W. J.: City clustersin China: air and surface water pollution, Front. Ecol. Environ.,4(7), 353–361, 2006.
Shi, C. E., Zhai, W. Q., Yang, J., Wang, S., and Yao, K. Y.: Char-acteristics of PM10 pollution at four provincial cities in YangtzeRiver Delta district, (in Chinese with English abstract), PlateauMeteorol., 27(2), 408–414, 2008.
Smith, D. J. T., Harrision, R. M., Luhana, L., Casimiro, A. P., Cas-tro, L. M., Tariq, M. N., Hayat, S., and Quraishi, T.: Concentra-tions of particulate airborne polycyclic aromatic hydrocarbonsand metals collected in Lahore, Pakistan, Atmos. Environ., 30,4031–4040, 1996.
Song, Y., Tang, X. Y., Zhang, Y. H., Hu, M., Fang, C., Zen, L.M., and Wang W.: Effects on fine particles by the continuedhigh temperature weather in Beijing, (in Chinese with Englishabstract), Environ. Science, 23(4), 33–36, 2002.
Song, C. -K., Ho, C. -H., Park, R. J., Choi, Y. -S., Kim, J., Gong,D. Y., and Lee, Y. -B.: Spatial and seasonal variations of sur-face PM10 concentration and MODIS aerosol optical depth overChina, Asia-Pacific Journal of Atmospheric Sciences, 45(1), 33–43, 2009.
Streets, D. G., Bond, T. C., Carmichael, G. R., Fernandes, S. D., Fu,Q., He, D., Klimont, Z., Nelson, S. M., Tsai, N. Y., Wang, M.Q., Woo, J. -H., and Yarber, K. F.: An inventory of gaseous andprimary aerosol emissions in Asia in the year 2000, J. Geophys.Res., 108(D21), 8809, doi:10.1029/2002JD003093, 2003.
Streets, D. G., Yu, C., Wu, Y., Chin, M., Zhao, Z. C., Hayasaka,T., and Shi, G. Y.: Did Aerosols over China peak in the1990s?, discussion paper of Global Environment and Energy inthe 21st Century: available online at:http://www.gee-21.org/publications/Aerosols-over-China.pdf, 2006.
Ta, W. Q., Wang, T., Xiao, H. L., Zhu, X. Y., and Xiao, Z.: Gaseousand particulate air pollution in the Lanzhou Valley, China, Sci.Total Environ., 320, 163–176, 2004.
Tang, J., Wen, Y. P., Zhou, L. X., Qi, D. L., Zheng, M., Trivett, N.,and Wallgren, E.: Observational study of black carbon in cleanair area of western China, (in Chinese with English abstract), Q.J. Appl. Meteorol., 10(2), 160–170, 1999.
The Climate Source, Inc.: PRISM 1961–1990 mean annual precip-itation mainland China,http://www.climatesource.com/cn/factsheets/chinapptxl.jpg, last access: 19 April 2010.
Tie, X. X., Brasseur, G. P., Zhao, C. S., Granier, C., Massie, S.,Qin, Y., Wang, P. C., Wang, G. L., Yang, P. C., and Richter,A.: Chemical characterization of air pollution in Eastern Chinaand the Eastern United States, Atmos. Environ., 40, 2607–2625,2006a.
Tie, X. X., Li, G. H., Ying, Z. M, Guenther, A., and Madronich, S.:Biogenic emissions of isoprenoids and NO in China and compar-ison to anthropogenic emissions, Sci. Total Environ., 371, 238–251, 2006b.
Tie, X. X., and Cao, J. J.: Aerosol pollution in China: Present andfuture impact on environment, Particuology, 7, 426–431, 2009a.
Tie, X. X., Wu, D., and Brasseur, G.: Lung cancer mortality andexposure to atmospheric aerosol particles in Guangzhou, China,Atmos. Environ., 43, 2375–2377, 2009b.
Turpin, B. J., Saxena, P., and Andrews, E.: Measuring and sim-ulating particulate organics in the atmosphere: problems andprospects, Atmos. Environ., 34, 2983–3013, 2000.
Twomey, S.: The influence of pollution on the short-wave albedo ofclouds, J. Atmos. Sci., 34, 1149–1152, 1977.
Venkataraman, C., Reddy, C. K., Josson, S., and Reddy, M. S.:Aerosol size and chemical characteristics at Mumbai, India, dur-
www.atmos-chem-phys.net/10/5641/2010/ Atmos. Chem. Phys., 10, 5641–5662, 2010
5662 W. J. Qu et al.: Chinese urban PM10 – spatial distribution and interannual variation
ing the INDOEX-IFP (1999), Atmos. Environ., 36, 1979–1991,2002.
Wang, T., Wong, C. H., Cheung, T. F., Blake, D. R., Arimoto,R., Baumann, K., Tang, J., Ding, G. A., Yu, X. M., Li, Y. S.,Streets, D. G., and Simpson, I. J.: Relationships of trace gasesand aerosols and the emission characteristics at Lin’an, a ruralsite in eastern China, during spring 2001, J. Geophys. Res., 109,D19S05, doi:10.1029/2003JD004119, 2004a.
Wang, Y. Q., Zhang, X. Y., Arimoto, R., Cao, J. J., and Shen, Z.X.: The transport pathways and sources of PM10 pollution inBeijing during spring 2001, 2002 and 2003, Geophys. Res. Lett.,31, L14110, doi:10.1029/2004GL019732, 2004b.
Wang, S. G., Wei, Y., and Shang, K. Z.: The impacts of differentkinds of dust events on PM10 pollution in northern China, At-mos. Environ., 40, 7975–7982, 2006.
Wang, Y., Xin, J., Li, Z., Wang, S., Wang, P., Hao, W. M., Nordgren,B. L., Chen, H., Wang, L., and Sun, Y.: Seasonal variations inaerosol optical properties over China, Atmos. Chem. Phys. Dis-cuss., 8, 8431–8453, 2008,
Wang, K. C., Dickinson, R. E., and Liang, S. L.: Clear sky visibilityhas decreased over Land globally from 1973 to 2007, Science,323, 1468–1470, 2009.
Watson, J.: Visibility: Science and regulation, J. Air Waste Manage.Assoc., 52, 628–713, 2002.
Wen, X. H., He, P., Li, C. Z., and Luo, X. Y.: Pollution level ofthe airborne particulate matter (PM10) in Nanchong City, (inChinese with English abstract), Sichuan Environ., 23(2), 72–74,2004.
Wu, D., Tie, X. X., Li, C. C., Ying, Z. M., Lau, A. K., Huang, J.,Deng, X. J., and Bi, X. Y.: An extremely low visibility eventover the Guangzhou region: A case study, Atmos. Environ., 39,6568–6577, 2005.
Xia, X. A., Chen, H. B., Wang, P. C., Zhang, W. X., Goloub, P.,Chatenet, B., Eck, T. F., and Holben, B. N.: Variation of column-integrated aerosol properties in a Chinese urban region, J. Geo-phys. Res., 111, D05204, doi:10.1029/2005JD006203, 2006.
Xia, X., Chen, H., Goloub, P., Zhang, W., Chatenet, B., and WangP.: A compilation of aerosol optical properties and calculation ofdirect radiative forcing over an urban region in northern China, J.Geophys. Res., 112, D12203, doi:10.1029/2006JD008119, 2007.
Xia, D. S., Chen, F. H., Bloemendal, J., Liu, X. M., Yu, Y., andYang, L. P.: Magnetic properties of urban dustfall in Lanzhou,China, and its environmental implications, Atmos. Environ., 42,2198–2207, 2008.
Xie, J. X. and Xia, X. A.: Long-term trend in aerosol optical depthfrom 1980 to 2001 in north China, Particuology, 6, 106–111,2008.
Xu, J., Bergin, M. H., Yu, X., Liu, G., Zhao, J., Carrico, C. M., andBaumann, K.: Measurement of aerosol chemical, physical andradiative properties in the Yangtze delta region of China, Atmos.Environ., 36, 161–173, 2002.
Yao, Q., Li, S. Q., Xu, H. W., Zhuo, J. K., and Song, Q.: Studies onformation and control of combustion particulate matter in China:A review, Energy, 34(9), 1296–1309, 2009.
Ye, B. M., Ji, X. L., Yang, H. Z., Yao, X. H., Chan, C. K., Cadle,S. H., Chan, T., and Mulawa, P. A.: Concentration and chemicalcomposition of PM2.5 in Shanghai for a 1-year period, Atmos.Environ., 37(4), 499–510, 2003.
Zhang, X. Y., Cao, J. J., Li, L. M., Arimoto, R., Cheng, Y., Hue-bert, B., and Wang, D.: Characterization of atmospheric aerosolover XiAn in the South Margin of the Loess Plateau, China, At-mos.Environ., 36, 4189–4199, 2002.
Zhang, X. Y., Gong, S. L., Shen, Z. X., Mei, F. M., Xi,X. X., Liu, L. C., Zhou, Z. J., Wang, D., Wang, Y. Q.,and Cheng, Y.: Characterization of soil dust aerosol inChina and its transport/distribution during 2001 ACE-Asia:1. Network observations, J. Geophys. Res., 108(D9), 4261,doi:10.1029/2002JD002632, 2003.
Zhang, Y. H., Zhu, X. L., Slanina, S., Shao, M., Zeng, L. M., Hu,M., Bergin, M., and Salmon, L.: Aerosol pollution in some Chi-nese cities (IUPAC Technical Report), Pure Appl. Chem., 76(6),1227–1239, 2004.
Zhang, X. Y., Wang, Y. Q., Wang, D., Gong, S. L., Arimoto, R.,Mao, L. J., and Li, J.: Characterization and sources of regional-scale transported carbonaceous and dust aerosols from differentpathways in coastal and sandy land areas of China, J. Geophys.Res., 110, D15301, doi:10.1029/2004JD005457, 2005.
Zhang, X. M., Chai, F. H., Wang, S. L., Hu, B. Q., Li, K., and Luo,L. B.: Characteristics of air pollution in Shenyang city, China,(in Chinese with English abstract) China Environ. Sci., 26(6),650–652, 2006.
Zhang, B. L., Tsunekawa, A., and Tsubo, M.: Contributions ofsandy lands and stony deserts to long-distance dust emission inChina and Mongolia during 2000–2006, Global Planet. Change,60, 487–504, 2008.
Zhang, Q., Streets, D. G., Carmichael, G. R., He, K. B., Huo,H., Kannari, A., Klimont, Z., Park, I. S., Reddy, S., Fu, J.S., Chen, D., Duan, L., Lei, Y., Wang, L. T., and Yao, Z.L.: Asian emissions in 2006 for the NASA INTEX-B mission,Atmos. Chem. Phys., 9, 5131–5153, 2009, http://www.atmos-chem-phys.net/9/5131/2009/.
Zheng, M., Salmon, L. G., Schauer, J. J., Zeng, L. M., Kiang, C. S.,Zhang, Y. H., and Cass, G. R.: Seasonal trends in PM2.5 sourcecontributions in Beijing, China, Atmos. Environ., 39(22), 3967–3976, 2005.
Atmos. Chem. Phys., 10, 5641–5662, 2010 www.atmos-chem-phys.net/10/5641/2010/
Top Related