


Languages
Pages
Legal


South Washington Watershed District Parameters Analyzed
Water Quality Data
Parameter Abbreviation Units
Total Suspended Solids TSS mg/L
Volatile Suspended Solids VSS mg/L
Total Kjeldahl Nitrogen TKN mg/L
Total Phosphorus TP mg/L
Nitrite as Nitrogen Nitrite mg/L
Nitrate as Nitrogen Nitrate mg/L
Nitrate-Nitrite as Nitrogen NOx mg/L
Ammonia NH3 mg/L
Fecal Coliform Fecal Colonies/100 mL
Chemical Oxygen Demand COD mg/L
Copper Cu mg/L
Nickel Ni mg/L
Lead Pb mg/L
Zinc Zn mg/L
Cadmium Cd mg/L
Chromium Cr mg/L
Chloride Cl mg/L
Hardness Hardness mg/L as CaCO3
Orthophosphorus Ortho P mg/L
Turbidity Turbidity NTU
Alkalinity Alk mg/L Note: Data values reported by the Washington Conservation District as “less than” a unit were presented as the unit value. Example: < 0.0001 mg/L was presented as 0.0001 mg/L .
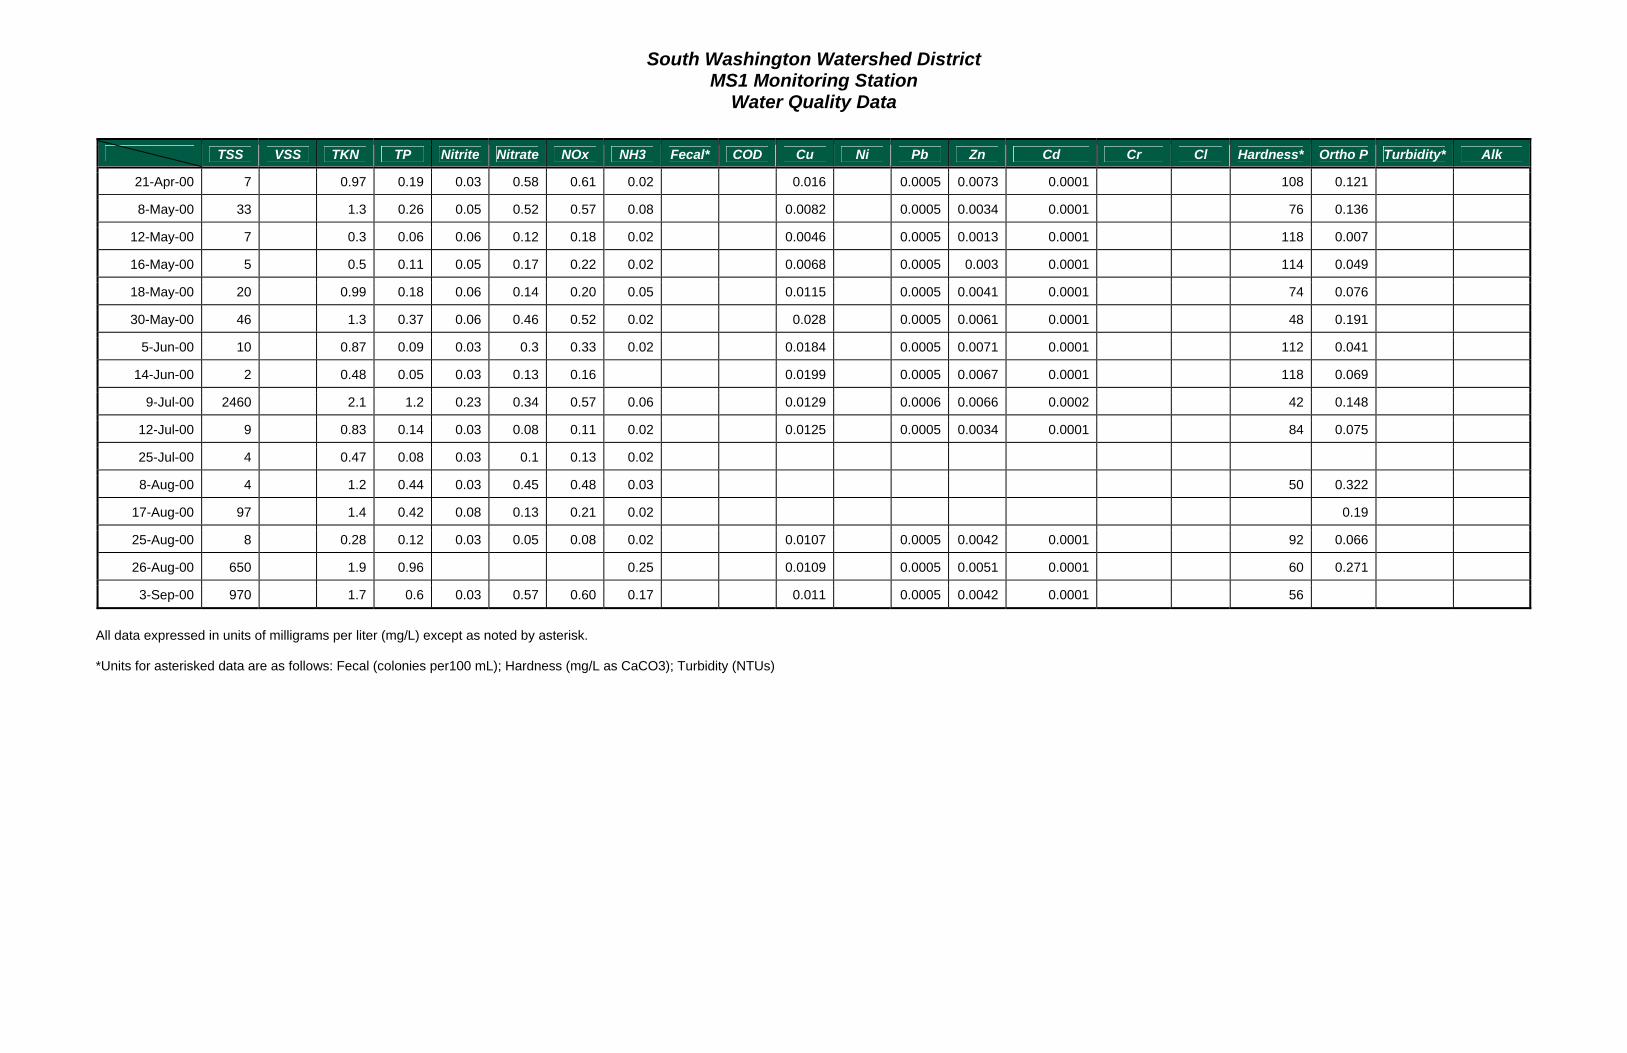
South Washington Watershed District MS1 Monitoring Station
Water Quality Data
TSS VSS TKN TP Nitrite Nitrate NOx NH3 Fecal* COD Cu Ni Pb Zn Cd Cr Cl Hardness* Ortho P Turbidity* Alk
21-Apr-00 7 0.97 0.19 0.03 0.58 0.61 0.02 0.016 0.0005 0.0073 0.0001 108 0.121
8-May-00 33 1.3 0.26 0.05 0.52 0.57 0.08 0.0082 0.0005 0.0034 0.0001 76 0.136
12-May-00 7 0.3 0.06 0.06 0.12 0.18 0.02 0.0046 0.0005 0.0013 0.0001 118 0.007
16-May-00 5 0.5 0.11 0.05 0.17 0.22 0.02 0.0068 0.0005 0.003 0.0001 114 0.049
18-May-00 20 0.99 0.18 0.06 0.14 0.20 0.05 0.0115 0.0005 0.0041 0.0001 74 0.076
30-May-00 46 1.3 0.37 0.06 0.46 0.52 0.02 0.028 0.0005 0.0061 0.0001 48 0.191
5-Jun-00 10 0.87 0.09 0.03 0.3 0.33 0.02 0.0184 0.0005 0.0071 0.0001 112 0.041
14-Jun-00 2 0.48 0.05 0.03 0.13 0.16 0.0199 0.0005 0.0067 0.0001 118 0.069
9-Jul-00 2460 2.1 1.2 0.23 0.34 0.57 0.06 0.0129 0.0006 0.0066 0.0002 42 0.148
12-Jul-00 9 0.83 0.14 0.03 0.08 0.11 0.02 0.0125 0.0005 0.0034 0.0001 84 0.075
25-Jul-00 4 0.47 0.08 0.03 0.1 0.13 0.02
8-Aug-00 4 1.2 0.44 0.03 0.45 0.48 0.03 50 0.322
17-Aug-00 97 1.4 0.42 0.08 0.13 0.21 0.02 0.19
25-Aug-00 8 0.28 0.12 0.03 0.05 0.08 0.02 0.0107 0.0005 0.0042 0.0001 92 0.066
26-Aug-00 650 1.9 0.96 0.25 0.0109 0.0005 0.0051 0.0001 60 0.271
3-Sep-00 970 1.7 0.6 0.03 0.57 0.60 0.17 0.011 0.0005 0.0042 0.0001 56
All data expressed in units of milligrams per liter (mg/L) except as noted by asterisk. *Units for asterisked data are as follows: Fecal (colonies per100 mL); Hardness (mg/L as CaCO3); Turbidity (NTUs)

South Washington Watershed District MS1 Monitoring Station
Water Quality Data
TSS VSS TKN TP Nitrite Nitrate NOx NH3 Fecal* COD Cu Ni Pb Zn Cd Cr Cl Hardness* Ortho P Turbidity* Alk
21-Mar-01 13 0.85 0.46 0.03 0.33 0.36 0.1 0.0096 0.002 0.0027 0.0178 0.0001 0.0026 30 0.343
29-Mar-01 83 2 0.6 0.14 0.58 0.72 0.53 0.0142 0.0073 0.0055 0.045 0.0002 0.007 46 0.341 81
3-Apr-01 36 1.7 0.22 0.03 0.3 0.33 0.69 0.0044 0.0025 0.001 0.0088 0.0001 0.0012
3-Apr -01
4-Apr-01 23 1.1 0.29 0.03 0.23 0.26 0.7 38
12-Apr-01 21 1 0.15 0.03 0.28 0.31 0.19 14 0.0023 0.0016 0.0005 0.0059 0.0001 0.0005 0.073 14
23-Apr-01 48 1.1 0.14 0.0029 0.0022 0.0009 0.0073 0.0006 0.0013 84 0.024
30-Apr-01 3 0.43 0.02 0.03 0.05 0.08 0.02 10 0.0024 0.0016 0.0005 0.0044 0.0002 0.0005 84
4-May-01 2 0.44 0.04 0.03 0.11 0.14 0.02 8 0.007 0.0026 0.0005 0.0052 0.0002 0.0005 94
6-May-01 606 2.3 1.1 0.06 0.25 0.31 0.02 196 0.0266 0.0174 0.0224 0.071 0.0008 0.0184 62
22-May-01 88 0.85 0.19 0.03 0.16 0.19 0.02
22-May-01 27 1.4 0.22 0.03 0.14 0.17 0.02 0.0084 0.0036 0.0015 0.0152 0.0002 0.0026 112 0.066
6-Jun-01 16 0.59 0.07 0.03 0.1 0.13 0.02 0.002 0.0022 0.0005 0.0058 0.0001 0.0005 102 0.041
11-Jun-01 1440 5.2 2.4 0.17 0.86 1.03 0.17 0.06 0.044 0.067 0.156 0.001 0.045 68 0.131
14-Jun-01 86 1.5 0.28 0.03 0.65 0.68 0.09 0.0076 0.0045 0.0037 0.0169 0.0009 0.0039 78
19-Jun-01 8 0.75 0.11 0.03 0.12 0.15 0.04 0.0029 0.002 0.0005 0.0034 0.0005 0.0007 98
29-Jun-01 2 0.3 0.1 0.03 0.05 0.08 0.05 0.0026 0.0027 0.0005 0.0036 0.0001 0.0006 94 0.069
18-Jul-01 15 2.4 0.35 0.1 0.23 0.33 0.41 0.0096 0.0049 0.0008 0.0103 0.0001 0.0018 92 0.241
1-Aug-01 50 1.1 0.21 0.03 0.12 0.15 0.02 0.0076 0.0039 0.0027 0.0145 0.0001 0.0033 62
18-Aug-01 1.5 0.59 0.04 0.24 0.28 0.03 46 0.0167 0.0068 0.0068 0.036 0.0006 0.0069 54 36
All data expressed in units of milligrams per liter (mg/L) except as noted by asterisk. *Units for asterisked data are as follows: Fecal (colonies per100 mL); Hardness (mg/L as CaCO3); Turbidity (NTUs)

South Washington Watershed District MS1 Monitoring Station
Water Quality Data
TSS VSS TKN TP Nitrite Nitrate NOx NH3 Fecal* COD Cu Ni Pb Zn Cd Cr Cl Hardness* Ortho P Turbidity* Alk
13-Mar-02 226 2 0.614 0.08 0.83 0.91 0.22 66 0.0111 0.0047 0.0253 0.0001
28-Mar-02 153 1.8 0.476 0.05 0.32 0.37 0.29 61 0.0087 0.003 0.023 0.0001
8-Apr-02 5 2 0.69 0.098 0.03 0.25 0.28 0.02 23 0.0035 0.0001 0.0062 0.0001
11-Apr-02 320 30 2.7 0.733 0.07 0.37 0.44 0.08 87 0.0186 0.0094 0.043 0.0001
18-Apr-02 28 4 0.51 0.087 0.03 0.05 0.08 0.02 25 0.003 0.0006 0.005 0.0001
10-May-02 34 4 0.36 0.166 0.03 0.05 0.08 0.02 24 0.0045 0.0008 0.01 0.0003
3-Jun-02 796 60 2.9 1.29 0.25 0.58 0.83 0.08 111 0.03 0.0167 0.061 0.0003
6-Jun-02 342 34 1.7 0.472 0.06 0.12 0.18 0.04 82 0.0143 0.0071 0.028 0.0003
8-Jun-02 572 52 2.3 0.766 0.06 0.4 0.46 0.16 75 0.0192 0.0125 0.042 0.0003
11-Jun-02 560 60 2.6 1.09 0.08 0.71 0.79 0.1 114 0.022 0.0146 0.049 0.0005
21-Jun-02 1720 190 6.6 1.94 0.17 0.52 0.69 0.14 125 0.051 0.05 0.133 0.0019
9-Jul-02 930
10-Jul-02 1020 100 1.7 0.755 0.14 0.52 0.66 0.02 87 0.0217 0.0152 0.049 0.0003
4-Aug-02 600 48 1.1 1.07 0.09 0.31 0.40 0.1 101 0.0229 0.0156 0.051 0.0005
14-Aug -02 22
8-Oct-02 9 4 0.68 0.108 0.03 0.57 0.60 0.05 27 0.0017 0.0004 0.0056 0.00001
10-Oct-02 19 4 0.87 0.173 0.03 0.13 0.16 0.1 23 0.0034 0.0008 0.0076 0.00001
14-Oct-02 450
25-Oct-02 2 2 0.28 0.041 0.03 0.09 0.12 0.02 19 0.0018 0.0001 0.0065 0.0001
30-Oct-02 480
14-Nov -02 4
All data expressed in units of milligrams per liter (mg/L) except as noted by asterisk. *Units for asterisked data are as follows: Fecal (colonies per100 mL); Hardness (mg/L as CaCO3); Turbidity (NTUs)

South Washington Watershed District MS1 Monitoring Station
Water Quality Data
TSS VSS TKN TP Nitrite Nitrate NOx NH3 Fecal* COD Cu Ni Pb Zn Cd Cr Cl Hardness* Ortho P Turbidity* Alk
17-Mar-03 18 8 3.7 0.642 0.11 1.43 1.54 0.85 82 0.0096 0.0046 0.0007 0.0139 0.00006 0.0023 162
31-Mar-03 6 3 0.74 0.096 0.03 0.05 0.08 0.02 28 0.0021 0.0016 0.0001 0.0033 0.00004 0.0003 89
16-Apr-03 174 26 1.8 0.516 0.03 0.4 0.43 0.13 62 0.0111 0.0071 0.0054 0.03 0.0001 0.0089 67
4-May-03 225 24 1.7 0.556 0.03 0.34 0.37 0.04 77 0.0146 0.008 0.0067 0.044 0.0013 0.0098 22
9-May-03 462 54 1.8 0.597 0.03 0.23 0.26 0.11 55 0.013 0.0095 0.0076 0.036 0.0001 0.0101 26
14-May-03 771 40 1.7 0.396 0.03 0.14 0.17 0.02 58 0.0101 0.0074 0.0061 0.032 0.0018 0.007 42
25-Jun-03 1320 152 3.1 1.28 0.06 0.37 0.43 0.13 160 0.029 0.024 0.0221 0.097 0.0004 0.0234 7
3-Jul-03 393 33 2 0.74 0.14 0.48 0.62 0.23 63 0.0126 0.0092 0.006 0.04 0.0015 0.0085 21
15-Jul-03 636 84 1.2 0.558 0.08 0.24 0.32 0.08 95 0.0156 0.0138 0.0122 0.051 0.0004 0.015 12
22-Jul-03 83
20-Aug-03 14 6 1.2 0.165 0.06 0.45 0.51 0.02 62 0.0077 0.0024 0.0005 0.0156 0.00006 0.0022 11
11-Sep-03 156 32 2.2 0.419 0.03 0.05 0.08 0.3 151 0.0143 0.0064 0.0038 0.067 0.0002 0.0073 7
11-Sep-03 54 11 1.4 0.4 0.08 0.38 0.46 0.21 54 0.0071 0.0032 0.0018 0.021 0.0001 0.0042 5
12-Sep-03 968 66 1.5 0.64 0.09 0.46 0.55 0.16 64 0.0138 0.0082 0.0053 0.039 0.0002 0.0097 6
18-Sep-03 107 20 1.3 0.379 0.05 0.35 0.40 0.07 53 0.0092 0.0057 0.0035 0.028 0.0002 0.0057 8
All data expressed in units of milligrams per liter (mg/L) except as noted by asterisk. *Units for asterisked data are as follows: Fecal (colonies per100 mL); Hardness (mg/L as CaCO3); Turbidity (NTUs)

South Washington Watershed District MS1 Monitoring Station
Water Quality Data
TSS VSS TKN TP Nitrite Nitrate NOx NH3 Fecal* COD Cu Ni Pb Zn Cd Cr Cl Hardness* Ortho P Turbidity* Alk
1-Mar-04 40 8 1.9 0.626 0.05 0.76 0.81 0.44 63 0.0096 0.0033 0.0019 0.027 0.00007 0.0031 95
11-Mar-04 33 10 2.5 0.293 0.15 4.12 4.27 0.26 76 0.0068 0.0056 0.0006 0.0101 0.00005 0.0014 40
19-Apr-04 392 64 3.5 0.822 0.1 0.78 0.88 0.56 112 0.0198 0.0089 0.008 0.075 0.0009 0.0099 39
21-Apr-04 28 7 1.3 0.249 0.06 0.33 0.39 0.24 39 0.0231 0.0035 0.0022 0.023 0.0003 0.0053 56
25-Apr-04 60 10 1 0.256 0.06 0.17 0.23 0.13 38 0.0089 0.0038 0.0026 0.025 0.0001 0.0043 35
9-May-04 958 130 4.5 1.05 0.1 0.64 0.74 0.56 161 0.026 0.0166 0.0159 0.121 0.0003 0.0178 22
13-May-04 138 20 1.8 0.4 0.07 0.21 0.28 0.21 63 0.0131 0.007 0.0049 0.04 0.0002 0.0085 18
17-May-04 106 15 1.4 0.376 0.03 0.25 0.28 0.19 51 0.0098 0.0051 0.0035 0.028 0.0001 0.0052 26
23-May-04 50 11 1.8 0.255 0.03 0.16 0.19 0.1 53 0.0081 0.0036 0.0017 0.0193 0.0001 0.0037 36
27-May-04 151 19 1.3 0.293 0.03 0.2 0.23 0.13 58 0.0123 0.0067 0.0035 0.026 0.0002 0.0066 41
29-May-04 212 28 1.2 0.436 0.03 0.14 0.17 0.1 62 0.0155 0.0098 0.0055 0.032 0.0003 0.0102 38
30-May-04 288 32 1.4 0.428 0.03 0.17 0.20 0.06 70 0.0182 0.011 0.0062 0.034 0.0007 0.0106 49
6-Jun-04 264 29 1.4 0.316 0.03 0.18 0.21 0.05 86 0.0124 0.0089 0.0054 0.028 0.0012 0.0089 51
9-Jun-04 576 60 1.7 0.573 0.05 0.21 0.26 0.06 67 0.0189 0.0144 0.0088 0.039 0.0003 0.0143 33
8-Jun-04 300
11-Jun-04 1040 84 0.03 0.27 0.30 0.09 84 0.0222 0.0182 0.0136 0.05 0.0008 0.017 42
11-Jul-04 173 33 1.9 0.921 0.07 0.41 0.48 0.02 108 0.028 0.0204 0.0157 0.064 0.0005 0.0192 13
16-Aug-04 1 0.133 0.03 0.11 0.14 0.02 71 5
15-Sep-04 275 21 1.4 0.453 0.04 0.19 0.23 0.05 60 0.0127 0.0135 0.0059 0.059 0.0017 0.0082 9
28-Oct-04 335 50 1.8 0.641 0.04 0.64 0.68 0.22 83 0.0174 0.0133 0.0105 0.047 0.0016 0.0131 9
1-Mar-04 40 8 1.9 0.626 0.05 0.76 0.81 0.44 63 0.0096 0.0033 0.0019 0.027 0.00007 0.0031 95
All data expressed in units of milligrams per liter (mg/L) except as noted by asterisk. *Units for asterisked data are as follows: Fecal (colonies per100 mL); Hardness (mg/L as CaCO3); Turbidity (NTUs)

South Washington Watershed District MS2 Monitoring Station
Water Quality Data
TSS VSS TKN TP Nitrite Nitrate NOx NH3 Fecal* COD Cu Ni Pb Zn Cd Cr Cl Hardness* Ortho P Turbidity* Alk
8-May-00 23 1.9 0.2 0.04 0.08 0.12 0.18 0.0051 0.0005 0.0015 0.0001 118 0.041
16-May-00 10 1.5 0.12 0.07 0.16 0.23 0.55 0.0055 0.0005 0.0009 0.0001 110 0.021
18-May-00 21 1.4 0.12 0.08 0.17 0.25 0.53 0.0068 0.0005 0.0011 0.0001 92 0.021
30-May-00 18 1.6 0.14 0.03 0.07 0.10 0.06 0.0217 0.0005 0.0024 0.0001 76 0.006
1-Jun-00 24 1.4 0.14 0.03 0.37 0.40 0.13 0.0133 0.0005 0.0026 0.0001 74 0.015
5-Jun-00 13 1.3 0.08 0.04 0.36 0.40 0.06 0.0135 0.0005 0.0047 0.0001 60 0.007
14-Jun-00 14 1.2 0.08 0.03 0.05 0.08 0.02 0.028 0.0005 0.0073 0.0001 68 0.012
10-Jul-00 19 1.7 0.17 0.03 0.05 0.08 0.02 0.0099 0.0005 0.0012 0.0003 52 0.02
25-Jul-00 24 2.1 0.2 0.03 0.05 0.08 0.02 0.0041 0.0005 0.0021 0.0001 82 0.02
8-Aug-00 18 2.2 0.19 0.03 0.05 0.08 0.02 94 0.008
17-Aug-00 19 2.2 0.24 0.03 0.07 0.10 0.12 0.01
25-Aug-00 18 1.8 0.15 0.03 0.05 0.08 0.02 0.008 0.0005 0.0048 0.0001 104 0.01
26-Aug-00 57 2.1 0.38 0.05 0.12 0.17 0.3 0.0151 0.0005 0.011 0.0001 82 0.109
29-Aug-00 1.2 0.17 0.42 0.29 0.71 0.02 0.0118 0.0005 0.054 0.0001 58
6-Sep-00 13 1.6 0.13 0.03 0.09 0.12 0.03 0.0071 0.0005 0.0041 0.0001 54 0.022
18-Sep-00 13 0.5 0.05 0.03 0.1 0.13 0.03 0.0081 0.0005 0.0127 0.0001 180 0.019
3-Oct-00 19 1.8 0.15 0.03 0.05 0.08 0.02 0.007 0.0005 0.0027 0.0002 148 0.008
All data expressed in units of milligrams per liter (mg/L) except as noted by asterisk. *Units for asterisked data are as follows: Fecal (colonies per100 mL); Hardness (mg/L as CaCO3); Turbidity (NTUs)

South Washington Watershed District MS2 Monitoring Station
Water Quality Data
TSS VSS TKN TP Nitrite Nitrate NOx NH3 Fecal* COD Cu Ni Pb Zn Cd Cr Cl Hardness* Ortho P Turbidity* Alk
23-Mar-01 13 3.3 0.44 0.03 0.37 0.40 1.53 0.007 0.0024 0.0006 0.0087 0.0001 0.0007 118 0.102
29-Mar-01 9 2.6 0.42 0.03 0.64 0.67 1.07 6 0.0073 0.0021 0.0005 0.0087 0.0001 0.0006 112 0.198
4-Apr-01 8 2.4 0.22 0.03 0.34 0.37 0.75 32
12-Apr-01 8 1.3 0.16 0.03 0.5 0.53 0.22 19 0.004 0.0019 0.0005 0.005 0.0001 0.0005 0.046 8
23-Apr-01 16 1.3 0.1 0.003 0.0014 0.0005 0.0036 0.0001 0.0005 54 0.023
29-Apr-01 8 1.4 8.4 0.03 0.08 0.11 0.08 36 0.0123 0.0014 0.0005 0.0047 0.0005 0.0005
4-May-01 1.5 0.17 29 0.0059 0.0024 0.0012 0.0096 0.0011 0.0011
22-May-01 8 0.99 0.07 0.03 0.25 0.28 0.06 0.006
24-May-01 42 1.2 0.13 0.03 0.29 0.32 0.11 0.0042 0.0025 0.001 0.0166 0.0007 0.0012 120
6-Jun-01 1470 1.2 0.05 0.03 0.13 0.16 0.02 0.0024 0.0017 0.0005 0.002 0.0007 0.0005 110 0.005
13-Jun-01 29 1.1 0.13 0.03 0.33 0.36 0.05 0.0058 0.0019 0.0006 0.0069 0.0016 0.001 84 0.005
29-Jun-01 8 0.81 0.1 0.03 0.07 0.10 0.02 0.0025 0.0014 0.0005 0.0045 0.0001 0.0005 112 0.005
16-Jul-01 10 0.93 0.07 0.03 0.05 0.08 0.02 0.002 0.0021 0.0005 0.0009 0.0001 0.0005 206 0.012 193
2-Aug-01 39 2 0.2 0.03 0.06 0.09 0.02 0.006 0.0026 0.0007 0.0074 0.0025 0.0006 152
14-Aug-01 34 1.4 0.16 0.03 0.05 0.08 0.02 47 0.003 0.0027 0.0005 0.0037 0.0003 0.0005 204 0.005
20-Sep-01 37 2.4 0.22 0.03 0.38 0.41 0.02 55 0.0033 0.0022 0.0005 0.0044 0.0008 0.0005 208
24-Sep-01 35 2 0.21 0.03 0.32 0.35 0.11 45 0.0053 0.0023 0.0007 0.0076 0.0011 0.0005 178
All data expressed in units of milligrams per liter (mg/L) except as noted by asterisk. *Units for asterisked data are as follows: Fecal (colonies per100 mL); Hardness (mg/L as CaCO3); Turbidity (NTUs)

South Washington Watershed District MS2 Monitoring Station
Water Quality Data
TSS VSS TKN TP Nitrite Nitrate NOx NH3 Fecal* COD Cu Ni Pb Zn Cd Cr Cl Hardness* Ortho P Turbidity* Alk
14-Mar-02 14 2 0.36 0.03 0.23 0.26 0.16 45 0.007 0
1-Apr-02 8 7 1.5 0.15 0.03 0.05 0.08 0.02 29 0.003 0.0005
8-Apr-02 6 8 1.2 0.11 0.03 0.05 0.08 0.02 32 0.003 0.0005
11-Apr-02 14 5 1.3 0.11 0.03 0.19 0.22 0.02 29 0.004 0.0005
18-Apr-02 18 5 1 0.13 0.03 0.05 0.08 0.02 30 0.006 0.0005
22-Apr-02 14 8 1.6 0.14 0.03 0.07 0.10 0.03 32 0.002 0
7-May-02 10 9 0.8 0.17 0.03 0.05 0.08 0.04 34 0.002 0.0005
10-May-02 1.3 0.13 0.03 0.1 0.13 0.11 34 0.008 0
12-Jun-02 14 8 1.3 0.11 0.03 0.05 0.08 0.02 47 0.006 0
17-Jun-02 16 8 1.2 0.11 0.03 0.06 0.09 0.06 32 0.004 0.0002
22-Jun-02 15 15 1.4 0.14 0.3 0.3 0.60 0.22 52 0.005 0
9-Jul-02 6 0.04 0.1 0.14 77 29
29-Jul-02 20 14 1.3 0.2 0.03 0.05 0.08 0.02 55 0.002 0.0002
5-Aug-02 20 8 1.8 0.2 0.03 0.65 0.68 0.02 40 0.003 0
14-Aug -02 170
15-Aug-02 21 2 0.18 0.03 0.002 0
8-Oct-02 14 14 1.5 0.15 0.03 0.05 0.08 0.09 46 0.002 0
10-Oct-02 11 1.2 0.14 0.12 0.002 0
14-Oct-02 6 0.03 0.13 0.16 39 30
25-Oct-02 9 6 1 0.08 0.03 0.5 0.53 0.02 29 0.002 0
30-Oct -02 8
14-Nov -02 6
All data expressed in units of milligrams per liter (mg/L) except as noted by asterisk. *Units for asterisked data are as follows: Fecal (colonies per100 mL); Hardness (mg/L as CaCO3); Turbidity (NTUs)

South Washington Watershed District MS2 Monitoring Station
Water Quality Data
TSS VSS TKN TP Nitrite Nitrate NOx NH3 Fecal* COD Cu Ni Pb Zn Cd Cr Cl Hardness* Ortho P Turbidity* Alk
17-Mar-03 10 7 3 0.73 0.03 0.69 0.72 0.9 61 0.0066 0.0015 0.0003 0.0083 0.00004 0.001 92
31-Mar-03 8 6 1.5 0.13 0.03 0.44 0.47 0.33 32 0.0028 0.0021 0.0001 0.0037 0.00004 0.0003 61
17-Apr-03 15 9 1.4 0.106 0.03 0.05 0.08 0.15 36 0.0099 0.0021 0.0004 0.0049 0.0002 0.0004 66
7-May-03 11 7 1.3 0.139 0.03 0.05 0.08 0.06 46 0.0069 0.0018 0.0004 0.0174 0.0021 0.0006 44
10-May-03 12 8 1.8 0.177 0.03 0.1 0.13 0.33 28 0.0143 0.0015 0.0005 0.0062 0.0003 0.0005 36
15-May-03 13 12 1.6 0.133 0.03 0.05 0.08 0.07 67 0.0024 0.0013 0.0001 0.0029 0.00004 0.0002 49
25-Jun-03 27 14 2 0.205 0.03 0.1 0.13 0.17 46 0.011 0.0018 0.0007 0.0046 0.0002 0.0002 27
22-Jul-03 10
31-Aug-03 21 16 2 0.13 0.03 0.05 0.08 0.07 48 0.0031 0.0018 0.0002 0.003 0.0005 0.0004 39
11-Aug-03 26 13 1.7 0.086 0.03 0.05 0.08 0.14 31 0.0022 0.002 0.0002 0.0028 0.0002 0.0003 36
28-Aug-03 38 18 2.3 0.17 0.03 0.05 0.08 0.02 50 0.0019 0.0018 0.0005 0.0042 0.0002 0.0005 36
9-Sep-03 28 12 1.9 0.154 0.03 0.07 0.10 0.31 42 0.0021 0.002 0.0007 0.0029 0.00009 0.0004 36
13-Sep-03 21 9 1.9 0.17 0.07 0.07 0.14 0.46 39 0.0018 0.0019 0.0006 0.0035 0.00008 0.0007 35
11-Sep -03 43
20-Sep-03 35 16 2.2 0.231 0.16 0.15 0.31 0.18 44 0.0022 0.0026 0.001 0.0059 0.0001 0.0006 34
13-Oct-03 60 20 2.5 0.273 0.07 1.07 1.14 0.39 55 0.0027 0.0026 0.0016 0.0068 0.00006 0.0005 33
All data expressed in units of milligrams per liter (mg/L) except as noted by asterisk. *Units for asterisked data are as follows: Fecal (colonies per100 mL); Hardness (mg/L as CaCO3); Turbidity (NTUs)

South Washington Watershed District MS2 Monitoring Station
Water Quality Data
TSS VSS TKN TP Nitrite Nitrate NOx NH3 Fecal* COD Cu Ni Pb Zn Cd Cr Cl Hardness* Ortho P Turbidity* Alk
11-Mar-04 6 4 2.7 0.335 0.04 0.35 0.39 0.87 58 0.0048 0.0018 0.0004 0.0091 0.00004 0.0009 93
17-May-04 2 1 1.1 0.076 0.03 0.3 0.33 0.26 22 0.0022 0.002 0.00008 0.0047 0.00004 0.0003 65
27-May-04 6 4 1.1 0.04 0.03 0.08 0.11 0.12 37 0.0021 0.0019 0.0002 0.0038 0.00004 0.0002 59
7-Jun-04 6 3 1.2 0.051 0.03 0.05 0.08 0.04 35 0.0024 0.0018 0.0002 0.0027 0.00004 0.0005 63
8-Jun -04 4
9-Jun-04 9 5 1.2 0.089 0.03 0.1 0.13 0.1 36 0.0028 0.0017 0.0003 0.0032 0.00004 0.0007 58
6-Jul-04 33 15 3.4 0.311 0.03 0.4 0.43 0.15 43 0.0024 0.0027 0.0005 0.0042 0.00004 0.0005 61
12-Jul-04 111 40 0.83 0.076 0.03 0.29 0.32 0.02 28 0.0015 0.002 0.0001 0.0019 0.00004 0.0002 54
15-Jul -04 6
27-Jul-04 37 24 1.8 0.242 0.03 0.39 0.42 0.04 44 0.0114 0.0019 0.0006 0.0048 0.00004 0.0003 52
7-Sep-04 12 8 1.1 0.086 0.03 0.05 0.08 0.06 37 0.0017 0.0016 0.0002 0.0022 0.00004 0.0002 37
16-Sep-04 11 7 1.3 0.156 0.03 0.06 0.09 0.1 32 0.0019 0.0017 0.0003 0.0037 0.00004 0.0004 22
27-Sep -04 6
All data expressed in units of milligrams per liter (mg/L) except as noted by asterisk. *Units for asterisked data are as follows: Fecal (colonies per100 mL); Hardness (mg/L as CaCO3); Turbidity (NTUs)

South Washington Watershed District 100th Street Monitoring Station
Water Quality Data
TSS VSS TKN TP Nitrite Nitrate NOx NH3 Fecal* COD Cu Ni Pb Zn Cd Cr Cl Hardness* Ortho P Turbidity* Alk
16-Apr-02 9 8 2.2 0.11 0.03 0.06 0.09 0.02 0.003 0.0025 0.0003 0.0044 0.0001 0.0001
18-Apr-02 10 4 1.1 0.09 0.03 0.1 0.13 0.11 0.0013 0.0016 0.0001 0.0021 0.0001 0.0002
22-Apr-02 2 5 0.62 0.06 0.1 1.14 1.24 0.88 0.0032 0.0028 0.00005 0.0028 0.0001 0.0005
26-Apr-02 4 7 0.74 0.07 0.07 0.75 0.82 0.15 0.004 0.0025 0.0005 0.0032 0.0001 0.0005
14-May-02 11 2 1 0.11 0.03 0.4 0.43 0.15 0.0012 0.0021 5 0.0019 0.0001 0.0005
5-Jun-02 38 2 2.1 0.15 0.03 0.09 0.12 0.04 0.0023 0.0023 0.0005 0.0023 0.0001 0.0005
8-Jun-02 27 5 1.1 0.09 0.03 0.05 0.08 0.11 0.0025 0.0026 0.0005 0.0037 0.0001 0.0005
21-Jun-02 22 16 1 0.12 0.03 0.05 0.08 0.09 0.0033 0.0032 0.0012 0.0093 0.0001 0.0005
9-Jul-02 6 0.03 0.09 0.12 0.09 90 0.0022 0.0022 0.0005 0.0072 0.0001 0.0004
25-Jul-02 5 7 0.29 0.09 0.03 0.15 0.18 0.13 0.0031 0.0023 0.0009 0.006 0.0001 0.0012
3-Aug-02 24 6 0.68 0.14 0.03 0.23 0.26 0.23 0.0022 0.0019 0.0005 0.0055 0.0001 0.0005
14-Aug-02 5 0.04 0.97 1.01 0.05 420 0.0024 0.002 0.0003 0.0045 0.0001 0.0006
16-Aug-02 8 7 0.62 0.06 0.03 0.88 0.91 0.02 0.0025 0.0026 0.0006 0.0071 0.0001 0.001
17-Aug-02 11 1 0.1
6-Sep-02 10 0.7 0.06
4-Oct-02 18 4 0.77 0.11 0.04 0.65 0.69 0.02 0.002 0.002 0.0002 0.0033 0.0001 0.0002
10-Oct-02 3 0.65 0.08
14-Oct-02 2 0.06 0.77 0.83 0.08 59 0.0025 0.0018 0.0002 0.004 0.0001 0.0003
25-Oct-02 2 2 0.18 0.03 0.05 1.54 1.59 0.02 0.0018 0.0024 0.0001 0.0027 0.0001 0.0002
30-Oct-02 26
14-Nov -02 1
All data expressed in units of milligrams per liter (mg/L) except as noted by asterisk. *Units for asterisked data are as follows: Fecal (colonies per100 mL); Hardness (mg/L as CaCO3); Turbidity (NTUs)

South Washington Watershed District 100th Street Monitoring Station
Water Quality Data
TSS VSS TKN TP Nitrite Nitrate NOx NH3 Fecal* COD Cu Ni Pb Zn Cd Cr Cl Hardness* Ortho P Turbidity* Alk
22-Jan-03 4 2 0.31 0.042 0.03 2.3 2.33 0.06 15 0.0016 0.0026 0.00007 0.0025 0.00004 0.0003 95
18-Feb-03 4 2 0.31 0.097 0.04 2.03 2.07 0.14 9 0.0009 0.0016 0.00007 0.0016 0.00004 0.0002 81
17-Mar-03 14 9 4.1 0.816 0.06 0.98 1.04 1.27 88 0.0088 0.0027 0.0007 0.021 0.00008 0.0014 158
31-Mar-03 11 5 1 0.147 0.04 1.15 1.19 0.11 22 0.0021 0.0025 0.0004 0.0047 0.00004 0.0004 123
16-Apr-03 29 13 1.5 0.162 0.03 1.03 1.06 0.15 26 0.0035 0.003 0.0008 0.0094 0.0004 0.0008 134 183
10-May-03 7 3 0.53 0.122 0.03 0.54 0.57 0.05 18 0.0031 0.0013 0.0006 0.0064 0.0001 0.001 34
11-May-03 12 6 0.71 0.105 0.04 0.51 0.55 0.08 22 0.0046 0.0016 0.0008 0.0085 0.0001 0.001 30
15-May-03 5 3 1.1 0.068 0.03 0.28 0.31 0.17 24 0.0027 0.0019 0.0002 0.0043 0.00004 0.0002 75
25-Jun-03 14 8 0.7 0.109 0.03 0.38 0.41 0.26 22 0.0038 0.0012 0.0014 0.0092 0.00009 0.0007 3
5-Jul-03 7 8 1.5 0.157 0.03 0.06 0.09 0.34 34 0.0033 0.0016 0.0003 0.0045 0.0002 0.0005 37
All data expressed in units of milligrams per liter (mg/L) except as noted by asterisk. *Units for asterisked data are as follows: Fecal (colonies per100 mL); Hardness (mg/L as CaCO3); Turbidity (NTUs)

South Washington Watershed District 100th Street Monitoring Station
Water Quality Data
TSS VSS TKN TP Nitrite Nitrate NOx NH3 Fecal* COD Cu Ni Pb Zn Cd Cr Cl Hardness* Ortho P Turbidity* Alk
14-May-04 1.5 0.151 0.03 0.05 0.08 0.02 33 0.0067 0.0044 0.0001 0.0072 0.0004 0.0002 65
17-May-04 2 2 0.87 0.06 0.03 0.05 0.08 0.03 26 0.0046 0.0039 0.00009 0.0048 0.0001 0.0002 79
31-May-04 2 1 0.41 0.077 0.03 0.19 0.22 0.02 16 0.0052 0.0019 0.0001 0.005 0.0001 0.0003 62
8-Jun -04 27
10-Jun-04 3 2 0.56 0.037 0.03 0.06 0.09 0.05 21 0.0028 0.0019 0.0002 0.0037 0.0001 0.0006 57
11-Jun-04 0.49 0.045 0.04 0.2 0.24 0.05 20 0.0026 0.0016 0.0005 0.0047 0.001 0.0006 32
27-Jun-04 18 8 0.87 0.146 0.03 0.13 0.16 0.08 22 0.0029 0.0024 0.0001 0.005 0.0001 0.0002 61
15-Jul-04 250
15-Sep-04 8 5 0.6 0.053 0.04 0.36 0.40 0.02 22 0.003 0.0022 0.0004 0.0097 0.0028 0.0007 22
All data expressed in units of milligrams per liter (mg/L) except as noted by asterisk. *Units for asterisked data are as follows: Fecal (colonies per100 mL); Hardness (mg/L as CaCO3); Turbidity (NTUs)

South Washington Watershed District Powers Inlet Monitoring Station
Water Quality Data
TSS VSS TKN TP Nitrite Nitrate NOx NH3 Fecal* COD Cu Ni Pb Zn Cd Cr Cl Hardness* Ortho P Turbidity* Alk
21-Mar-01 105 0.36 80
4-Apr-01 82 0.96 0.42 0.03 0.2 0.23 0.07 22
12-Apr-01 14 1.2 0.17
23-Apr-01 17 1.1 0.1
4-May-01 2 0.45 0.02
21-May-01 10 0.3 0.06
23-May-01 6 0.55 0.09
6-Jun-01 4 0.31 0.03 0.03 0.05 0.08 0.02 0.0022 0.0028 0.0005 0.0044 0.0001 0.0005 134 0.009
11-Jun-01 200 1.6 0.38
14-Jun-01 32 0.68 0.16
18-Jun-01 173 1.2 0.36
19-Jun-01 11 0.84 0.09
29-Jun-01 2 0.01
16-Jul-01 15 0.06
16-Jul -01
18-Jul-01 84 0.24
1-Aug-01 69 1.6 0.22
14-Aug-01 8 0.29 0.03
18-Aug-01 73 1.2 0.3
29-Aug-01 14 0.42 0.07
20-Sep-01 35 0.34 0.15
All data expressed in units of milligrams per liter (mg/L) except as noted by asterisk. *Units for asterisked data are as follows: Fecal (colonies per100 mL); Hardness (mg/L as CaCO3); Turbidity (NTUs)

South Washington Watershed District Powers Inlet Monitoring Station
Water Quality Data
TSS VSS TKN TP Nitrite Nitrate NOx NH3 Fecal* COD Cu Ni Pb Zn Cd Cr Cl Hardness* Ortho P Turbidity* Alk
13-Mar-02 18 5 2.2 0.339 0.03 0.05 0.08 0.26 24 0.0097 0.0022 0.0008 0.014 0.0001 0
1-Apr-02 756 34 1.5 1.45 0.03 0.72 0.75 0.02 50 0.0135 0.0106 0.0053 0.354 0.0001 0.01
8-Apr-02 11 10 0.96 0.146 0.03 0.11 0.14 0.02 36 0.005 0.002 0.001 0.0074 0.0001 0.0005
11-Apr-02 81 10 3 0.373 0.03 0.14 0.17 0.07 33 0.0089 0.0029 0.0011 0.013 0.0001 0
18-Apr-02 13 8 0.8 0.08 0.03 0.14 0.17 0.02 30 0.0047 0.002 0.0005 0.0071 0.0001 0
6-May-02 63 35 1.3 0.153 0.03 0.15 0.18 0.18 74 0.008 0.0038 0.0014 0.0125 0.0001 0
8-May-02 409 21 1.4 0.413 0.03 0.44 0.47 0.19 62 0.0116 0.0069 0.0045 0.022 0.0001 0.01
14-May-02 17 0.42 0.162 0.03 0.26 0.29 0.02 40 0.0037 0.002 0.001 0.0045 0.0001 0
3-Jun-02 62 103 1.5 0.155 0.03 0.16 0.19 0.02 43 0.0053 0.0026 0.001 0.0079 0.0001 0
4-Jun-02 44 26 1.6 0.279 0.05 0.23 0.28 0.16 68 0.0055 0.0027 0.0008 0.0084 0.0001 0
8-Jun-02 46 6 0.96 0.137 0.03 0.05 0.08 0.12 22 0.0038 0.0025 0.0006 0.007 0.0001 0
11-Jun-02 196 4 2.5 0.44 0.03 0.08 0.11 0.29 34 0.0143 0.0062 0.0034 0.026 0.0004 0.01
25-Jun-02 7 10 0.97 0.158 0.03 0.11 0.14 0.14 36 0.002 0.0022 0.0002 0.0034 0.0001 0.0004
9-Jul-02 2 0.03 0.08 0.11 1000 30
10-Jul-02 215 1.8 0.356 0.13 0.0068 0.0041 0.0018 0.0144 0.0003 0
21-Aug-02 14 8 1.6 0.26 0.03 0.14 0.17 0.06 44 0.0033 0.0017 0.0002 0.004 0.0001 0
10-Oct-02 2 0.78 0.092 0.03 0.0026 0.0017 0.0001 0.0038 0.0001 0
14-Oct-02 2 0.03 0.08 0.11 70 22
25-Oct-02 17 3 0.18 0.093 0.03 0.05 0.08 0.02 10 0.002 0.0041 0.0001 0.0044 0.0001 0
30-Oct-02 30
14-Nov-02 60
All data expressed in units of milligrams per liter (mg/L) except as noted by asterisk. *Units for asterisked data are as follows: Fecal (colonies per100 mL); Hardness (mg/L as CaCO3); Turbidity (NTUs)

South Washington Watershed District Powers Inlet Monitoring Station
Water Quality Data
TSS VSS TKN TP Nitrite Nitrate NOx NH3 Fecal* COD Cu Ni Pb Zn Cd Cr Cl Hardness* Ortho P Turbidity* Alk
19-May-04 1910 240 13 12.7 0.27 0.05 0.32 0.18 463 0.147 0.133 0.167 0.321 0.0018 0.136 545
27-May-04 2360 240 4.8 3.31 0.08 0.16 0.24 0.02 214 0.053 0.05 0.047 0.141 0.0009 0.051 4
30-May-04 1590 150 4.9 2.5 0.06 0.1 0.16 0.38 153 0.0031 0.0277 0.0273 0.075 0.0005 0.0293 5
5-Jun-04 4220 280 3.9 2.08 0.09 0.07 0.16 0.03 122 0.047 0.041 0.045 0.108 0.0005 0.044 5
9-Jun-04 1040 115 2 1.31 0.03 0.21 0.24 0.02 98 0.021 0.0184 0.0164 0.049 0.0002 0.0204 7
12-Jun-04 2620 210 3.8 3.52 0.04 0.17 0.21 0.05 180 0.04 0.04 0.045 0.103 0.0008 0.042 10
6-Sep-04 4120 330 5.5 3.98 0.04 0.05 0.09 0.02 286 0.078 0.057 0.06 0.156 0.001 0.06 7
15-Sep-04 336 36 1.8 0.833 0.03 0.07 0.10 0.02 80 0.0148 0.0102 0.0086 0.031 0.0005 0.0109 10
All data expressed in units of milligrams per liter (mg/L) except as noted by asterisk. *Units for asterisked data are as follows: Fecal (colonies per100 mL); Hardness (mg/L as CaCO3); Turbidity (NTUs)
Top Related