


Languages
Pages
Legal


November 2017
PREPARED FOR
PREPARED BY
Sockeye Market Analysis

Table of Contents
Executive Summary ....................................................................................................................... 1 Glossary of Terms and Abbreviations ......................................................................................... 2 Introduction and Data Sources .................................................................................................... 3 2017 Bristol Bay Season Summary .............................................................................................. 5 Global Supply Analysis ................................................................................................................. 7
Sockeye Supply ............................................................................................................................................................ 7 Farmed Salmon Supply ............................................................................................................................................. 9
Sockeye Market Analysis ............................................................................................................ 11 Key Product Forms and Markets for Bristol Bay Sockeye ........................................................................... 11 Sockeye Market Outlook ........................................................................................................................................ 12 Wholesale Market Analysis for Key Sockeye Products ................................................................................ 12
Frozen H&G Sockeye ................................................................................................................................................................. 13 Canned Sockeye ........................................................................................................................................................................... 15 Sockeye Fillets ............................................................................................................................................................................... 18 Sockeye Roe .................................................................................................................................................................................. 20
Farmed Salmon Market Conditions .................................................................................................................... 21 Russian Sockeye ......................................................................................................................................................... 23
Salmon Market News & Implications ....................................................................................... 24 The Story of Sockeye Market Diversification ........................................................................... 26 Impact of U.S. Dollar on Bristol Bay Sockeye ........................................................................... 32 Bristol Bay Sockeye Resource Value .......................................................................................... 34 Difference in Ex-Vessel Value and Price by Region ................................................................. 37 Bristol Bay Salmon Driftnet Permit Market Value ................................................................... 40 Appendices................................................................................................................................... 41
Acknowledgements
The study team would like to express its appreciation to members of the industry and government agencies
that provided valuable information and insight for this project, especially Elizabeth Nudelman (Alaska
Department of Revenue) and Jennifer Shriver (Alaska Department of Fish and Game).
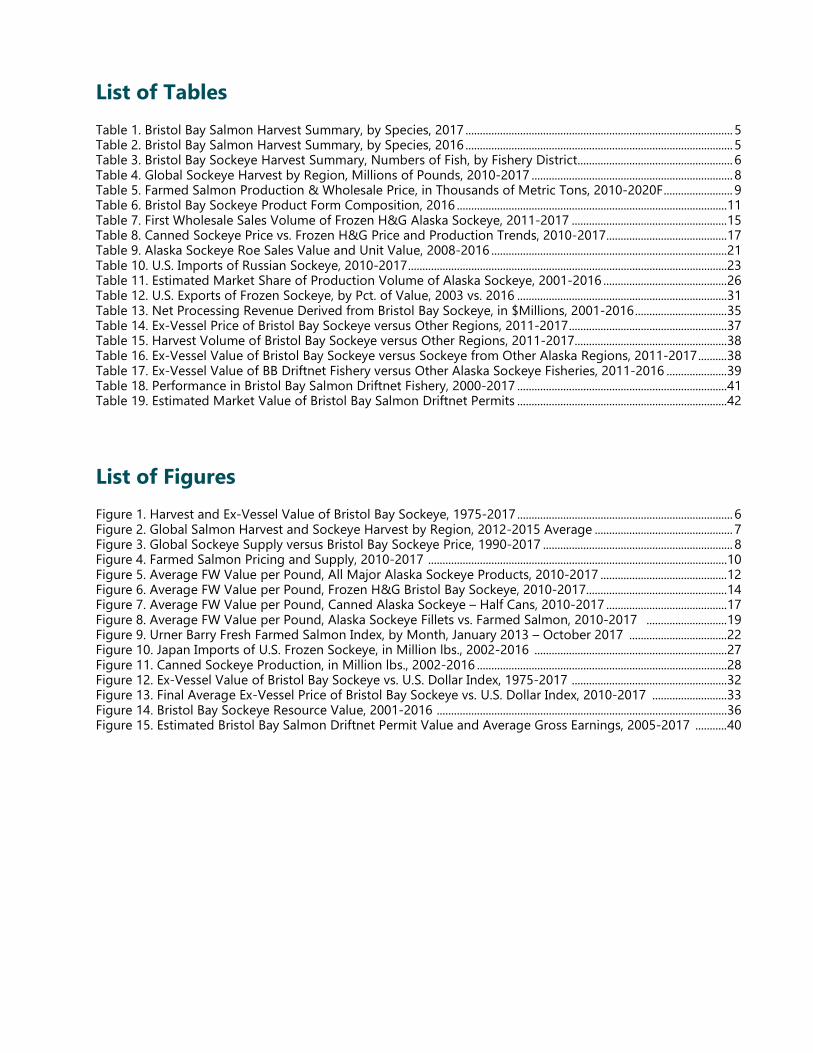
List of Tables
Table 1. Bristol Bay Salmon Harvest Summary, by Species, 2017 ............................................................................................. 5 Table 2. Bristol Bay Salmon Harvest Summary, by Species, 2016 ............................................................................................. 5 Table 3. Bristol Bay Sockeye Harvest Summary, Numbers of Fish, by Fishery District...................................................... 6 Table 4. Global Sockeye Harvest by Region, Millions of Pounds, 2010-2017 ...................................................................... 8 Table 5. Farmed Salmon Production & Wholesale Price, in Thousands of Metric Tons, 2010-2020F ........................ 9 Table 6. Bristol Bay Sockeye Product Form Composition, 2016 .............................................................................................. 11 Table 7. First Wholesale Sales Volume of Frozen H&G Alaska Sockeye, 2011-2017 ...................................................... 15 Table 8. Canned Sockeye Price vs. Frozen H&G Price and Production Trends, 2010-2017 .......................................... 17 Table 9. Alaska Sockeye Roe Sales Value and Unit Value, 2008-2016 .................................................................................. 21 Table 10. U.S. Imports of Russian Sockeye, 2010-2017 ............................................................................................................... 23 Table 11. Estimated Market Share of Production Volume of Alaska Sockeye, 2001-2016 ........................................... 26 Table 12. U.S. Exports of Frozen Sockeye, by Pct. of Value, 2003 vs. 2016 ......................................................................... 31 Table 13. Net Processing Revenue Derived from Bristol Bay Sockeye, in $Millions, 2001-2016 ................................ 35 Table 14. Ex-Vessel Price of Bristol Bay Sockeye versus Other Regions, 2011-2017 ....................................................... 37 Table 15. Harvest Volume of Bristol Bay Sockeye versus Other Regions, 2011-2017..................................................... 38 Table 16. Ex-Vessel Value of Bristol Bay Sockeye versus Sockeye from Other Alaska Regions, 2011-2017 .......... 38 Table 17. Ex-Vessel Value of BB Driftnet Fishery versus Other Alaska Sockeye Fisheries, 2011-2016 ..................... 39 Table 18. Performance in Bristol Bay Salmon Driftnet Fishery, 2000-2017 ......................................................................... 41 Table 19. Estimated Market Value of Bristol Bay Salmon Driftnet Permits ......................................................................... 42
List of Figures
Figure 1. Harvest and Ex-Vessel Value of Bristol Bay Sockeye, 1975-2017 ........................................................................... 6 Figure 2. Global Salmon Harvest and Sockeye Harvest by Region, 2012-2015 Average ................................................ 7 Figure 3. Global Sockeye Supply versus Bristol Bay Sockeye Price, 1990-2017 .................................................................. 8 Figure 4. Farmed Salmon Pricing and Supply, 2010-2017 ........................................................................................................ 10 Figure 5. Average FW Value per Pound, All Major Alaska Sockeye Products, 2010-2017 ............................................ 12 Figure 6. Average FW Value per Pound, Frozen H&G Bristol Bay Sockeye, 2010-2017................................................. 14 Figure 7. Average FW Value per Pound, Canned Alaska Sockeye – Half Cans, 2010-2017 .......................................... 17 Figure 8. Average FW Value per Pound, Alaska Sockeye Fillets vs. Farmed Salmon, 2010-2017 ............................ 19 Figure 9. Urner Barry Fresh Farmed Salmon Index, by Month, January 2013 – October 2017 .................................. 22 Figure 10. Japan Imports of U.S. Frozen Sockeye, in Million lbs., 2002-2016 ................................................................... 27 Figure 11. Canned Sockeye Production, in Million lbs., 2002-2016 ....................................................................................... 28 Figure 12. Ex-Vessel Value of Bristol Bay Sockeye vs. U.S. Dollar Index, 1975-2017 ...................................................... 32 Figure 13. Final Average Ex-Vessel Price of Bristol Bay Sockeye vs. U.S. Dollar Index, 2010-2017 .......................... 33 Figure 14. Bristol Bay Sockeye Resource Value, 2001-2016 ..................................................................................................... 36 Figure 15. Estimated Bristol Bay Salmon Driftnet Permit Value and Average Gross Earnings, 2005-2017 ........... 40

Sockeye Market Report – Fall 2017 McDowell Group, Inc. Page 1
Executive Summary
Bristol Bay Regional Seafood Development Association (BBRSDA) is tasked with increasing the value of Bristol
Bay sockeye and has contracted with McDowell Group to produce bi-annual sockeye market reports. These
reports analyze market conditions for sockeye products, investigate market issues, examine historical trends,
and discuss impacts on Bristol Bay fishermen. Key findings are listed below:
• The preliminary ex-vessel value of Bristol Bay sockeye increased 37 percent in 2017 to $210 million. Ex-
vessel prices increased 34 percent over the prior year, based on preliminary data, while Bristol Bay
sockeye harvests increased 2 percent.
• Assuming static prices, the value of foregone sockeye harvests in Bristol Bay is estimated at $29 million
in 2017. This equates to approximately $12,120 of foregone harvest value per active permit (drift and
setnet combined). Several river systems exceeded their escapement goals for a variety of reasons.
• Global sockeye harvests declined 5 percent in 2017 (approximately 20 million pounds), based on
preliminary data. Harvests were expected to decline 18 percent in Alaska and Russia, collectively,
heading into the season. After a couple years of below average production growth, farmed salmon
production forecasts are generally being increased.
• First wholesale prices of all major sockeye product forms increased in 2017, indicating strong demand.
However, early sales volumes of frozen H&G sockeye produced during the 2017 season trailed 2016
sales by 31 percent. Selling out frozen inventory ahead of the 2018 season will be critical for pricing
prospects next spring.
• Prices of H&G and fillet products have increased faster than canned forms in recent years, prompting
processors to can less sockeye despite larger harvests. Lower production volume is pushing canned
prices upward; however, this could result in less demand for canned product going forward.
• Frozen fillets and fresh sales have seen growth in recent years. Statewide sockeye fillet production
increased 63 percent between 2013 and 2016, and may have increased even further in 2017. Sales of
fresh H&G sockeye from Bristol Bay jumped 39 percent in 2017 to 3.1 million pounds.
• Alaska sockeye markets have undergone a fascinating transformation over the past 15 years. See “The
Story of Sockeye Market Diversification” chapter on page 26 to learn more.
Outlook for Bristol Bay Sockeye Fishermen
Operating revenue increased substantially for Bristol Bay fishermen in 2017. While future market developments
can never be predicted with total certainty and several factors could negatively affect sockeye value over the
next 18 months, the value outlook is relatively stable. The recent spike in harvest value is not expected to be
followed by a sharp decline, as happened in 2014-2015 (barring a significant reduction in future harvest volume).
Wholesale sockeye prices are much higher than recent years and demand remains relatively strong, and
although competing farmed prices have declined this year most farmed salmon analysts predict prices will
remain relatively steady for at least the next year. Further, net processing revenue has trended up in recent years
and is not expected to face a precipitous decline this year, as was witnessed following the 2014 season.
Sockeye Market Report – Fall 2017 McDowell Group, Inc. Page 2
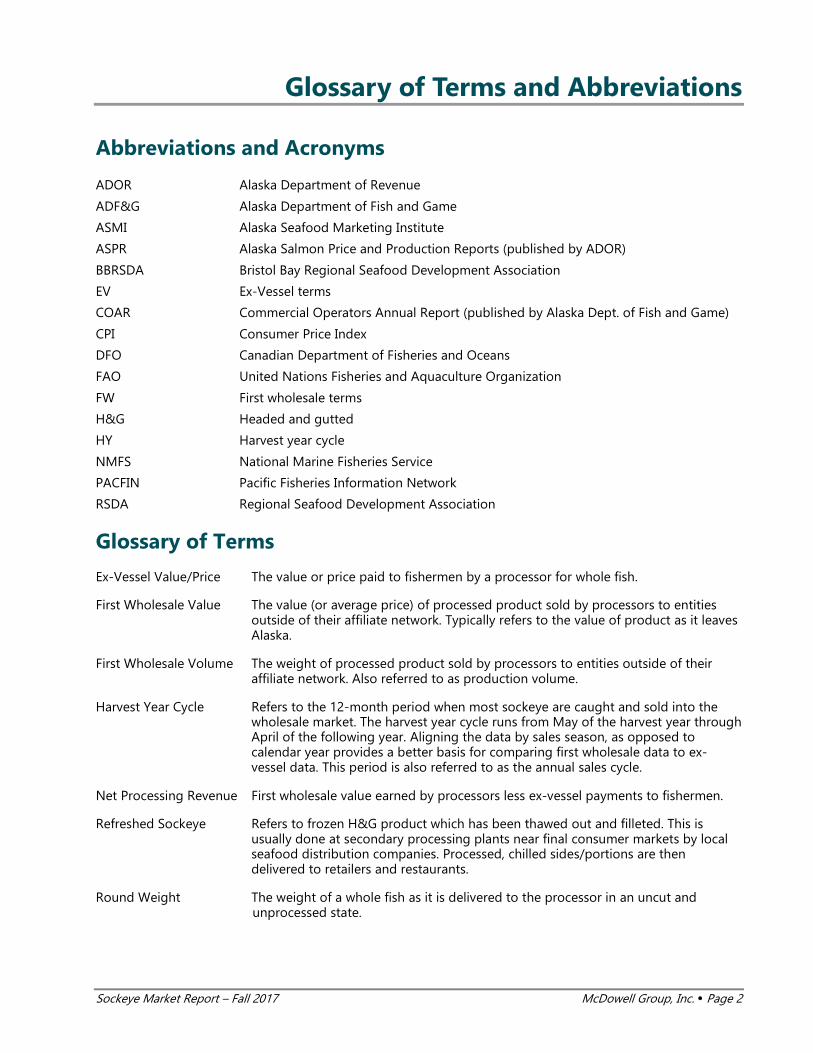
Glossary of Terms and Abbreviations
Abbreviations and Acronyms
ADOR Alaska Department of Revenue
ADF&G Alaska Department of Fish and Game
ASMI Alaska Seafood Marketing Institute
ASPR Alaska Salmon Price and Production Reports (published by ADOR)
BBRSDA Bristol Bay Regional Seafood Development Association
EV Ex-Vessel terms
COAR Commercial Operators Annual Report (published by Alaska Dept. of Fish and Game)
CPI Consumer Price Index
DFO Canadian Department of Fisheries and Oceans
FAO United Nations Fisheries and Aquaculture Organization
FW First wholesale terms
H&G Headed and gutted
HY Harvest year cycle
NMFS National Marine Fisheries Service
PACFIN Pacific Fisheries Information Network
RSDA Regional Seafood Development Association
Glossary of Terms
Ex-Vessel Value/Price The value or price paid to fishermen by a processor for whole fish.
First Wholesale Value The value (or average price) of processed product sold by processors to entities outside of their affiliate network. Typically refers to the value of product as it leaves Alaska.
First Wholesale Volume The weight of processed product sold by processors to entities outside of their affiliate network. Also referred to as production volume.
Harvest Year Cycle Refers to the 12-month period when most sockeye are caught and sold into the wholesale market. The harvest year cycle runs from May of the harvest year through April of the following year. Aligning the data by sales season, as opposed to calendar year provides a better basis for comparing first wholesale data to ex-vessel data. This period is also referred to as the annual sales cycle.
Net Processing Revenue First wholesale value earned by processors less ex-vessel payments to fishermen.
Refreshed Sockeye Refers to frozen H&G product which has been thawed out and filleted. This is usually done at secondary processing plants near final consumer markets by local seafood distribution companies. Processed, chilled sides/portions are then delivered to retailers and restaurants.
Round Weight The weight of a whole fish as it is delivered to the processor in an uncut and unprocessed state.
Sockeye Market Report – Fall 2017 McDowell Group, Inc. Page 3
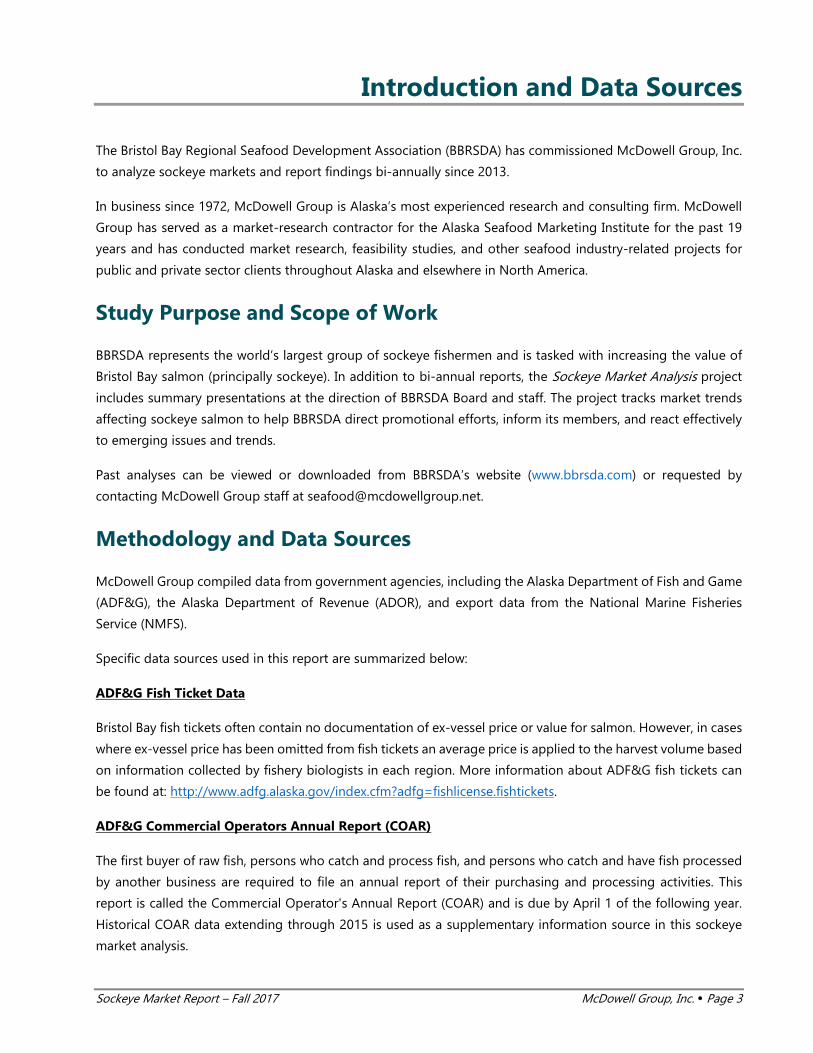
Introduction and Data Sources
The Bristol Bay Regional Seafood Development Association (BBRSDA) has commissioned McDowell Group, Inc.
to analyze sockeye markets and report findings bi-annually since 2013.
In business since 1972, McDowell Group is Alaska’s most experienced research and consulting firm. McDowell
Group has served as a market-research contractor for the Alaska Seafood Marketing Institute for the past 19
years and has conducted market research, feasibility studies, and other seafood industry-related projects for
public and private sector clients throughout Alaska and elsewhere in North America.
Study Purpose and Scope of Work
BBRSDA represents the world’s largest group of sockeye fishermen and is tasked with increasing the value of
Bristol Bay salmon (principally sockeye). In addition to bi-annual reports, the Sockeye Market Analysis project
includes summary presentations at the direction of BBRSDA Board and staff. The project tracks market trends
affecting sockeye salmon to help BBRSDA direct promotional efforts, inform its members, and react effectively
to emerging issues and trends.
Past analyses can be viewed or downloaded from BBRSDA’s website (www.bbrsda.com) or requested by
contacting McDowell Group staff at [email protected].
Methodology and Data Sources
McDowell Group compiled data from government agencies, including the Alaska Department of Fish and Game
(ADF&G), the Alaska Department of Revenue (ADOR), and export data from the National Marine Fisheries
Service (NMFS).
Specific data sources used in this report are summarized below:
ADF&G Fish Ticket Data
Bristol Bay fish tickets often contain no documentation of ex-vessel price or value for salmon. However, in cases
where ex-vessel price has been omitted from fish tickets an average price is applied to the harvest volume based
on information collected by fishery biologists in each region. More information about ADF&G fish tickets can
be found at: http://www.adfg.alaska.gov/index.cfm?adfg=fishlicense.fishtickets.
ADF&G Commercial Operators Annual Report (COAR)
The first buyer of raw fish, persons who catch and process fish, and persons who catch and have fish processed
by another business are required to file an annual report of their purchasing and processing activities. This
report is called the Commercial Operator's Annual Report (COAR) and is due by April 1 of the following year.
Historical COAR data extending through 2015 is used as a supplementary information source in this sockeye
market analysis.

Sockeye Market Report – Fall 2017 McDowell Group, Inc. Page 4
COAR contain data on seafood purchasing, processed production volume, and both ex-vessel and wholesale
values of seafood products. The buying information from COAR is reported by species, area of purchase,
condition of fisheries resources at the time of purchase, type of gear used in the harvest, pounds purchased,
and ex-vessel value. The ex-vessel value in COAR includes any post-season adjustments or bonuses paid after
the fish was purchased. Production information from COAR is reported by species, area of processing, process
type (frozen, canned, smoked, etc.), product type (fillets, surimi, sections, etc.), net weight of the processed
product, and the first wholesale value. More information about COAR data can be found at:
http://www.adfg.alaska.gov/index.cfm?adfg=fishlicense.coar.
ADOR Alaska Salmon Price and Production Reports (ASPR)
The Alaska Salmon Price Report (ASPR) covers first wholesale volume and value - by species and area - for six
key Alaska salmon products. First wholesale is defined as the value and volume at the point when product is
sold to an entity outside of the processor's affiliate network. The data set includes all processors that sold more
than one million pounds of processed salmon products in the previous calendar year, which includes the
majority of Alaska’s wholesale production of salmon products. The ASPR is a major data source for salmon
market analysis. ASPR reports are available on the ADOR website at:
http://www.tax.alaska.gov/programs/programs/reports/index.aspx?60624
Data from these sources have been structured to provide information applicable to Bristol Bay sockeye to the
fullest extent possible. Where the timing of data releases by the agencies causes gaps, McDowell Group has
developed estimates based on historical ratios and other relationships.
Limitations of Data and Analysis
Commercial fishing is a heavily regulated business and government agencies collect data on a wide range of
variables, from harvest to price to participation. As wild fish move closer to the consumer, publicly available
data diminishes. For instance, there is no readily accessible public data on the average retail price of canned
salmon or the amount of sockeye fillets sold by individual retailers. This data gap has been addressed, to the
extent practical, by purchasing point-of-sale information and interviewing sockeye buyers. McDowell Group
also maintains subscriptions to most major trade press outlets and uses trade-press data to supplement the
public information and provide additional context.
Legal Disclaimer
The views expressed herein do not necessarily represent those of the Bristol Bay Regional Seafood Development
Association.
Sockeye Market Report – Fall 2017 McDowell Group, Inc. Page 5
2017 Bristol Bay Season Summary
This section relies on preliminary data to summarize the 2017 Bristol Bay salmon season.
KEY FINDINGS:
• The 2017 Bristol Bay sockeye harvest was the second-largest of the past 20 years and produced the
largest total ex-vessel value since the mid-1990s after adjusting for inflation.
• As good as the 2017 season was, it could have been even better. Harvest limits resulted in over-
escapement for several river systems and an opportunity cost to Bristol Bay salmon fishermen of an
estimated $29.2 million.
The tables below summarize Bristol Bay salmon harvests over the past two seasons. While the total harvest
volumes are similar, ex-vessel value increased 37 percent in 2017, based on preliminary data, due to higher
sockeye prices. The total inshore sockeye run of 56.5 million fish was the second-largest of the past 20 years
(1997-2016) and 62 percent above the average run for the same period. The ex-vessel value was nearly twice
the (nominal) average season over the past twenty years, and returned the highest preliminary ex-vessel value
since 1996 (adjusted for inflation).
Table 1. Bristol Bay Salmon Harvest Summary, by Species, 2017
Species Preliminary Price/lb.
Preliminary Value
Avg. Fish Weight (lbs.)
Number of Fish Harvested
Harvest Weight (lbs.)
Sockeye $1.02 $209,898,218 5.5 37,682,774 205,782,567
Chum $0.30 $3,417,535 6.4 1,779,888 11,391,783
Coho $0.65 $988,376 6.3 239,980 1,520,578
Chinook $0.72 $312,499 11.2 38,835 434,027
Pinks $0.16 $22,176 3.9 35,352 138,602
Total - $214,638,805 - 39,776,829 219,267,557
Notes: Preliminary prices represent base ex-vessel prices, not including supplemental payments (e.g. quality bonuses, etc.). Source: ADF&G.
Table 2. Bristol Bay Salmon Harvest Summary, by Species, 2016
Species Preliminary Price/lb.
Preliminary Value
Avg. Fish Weight (lbs.)
Number of Fish Harvested
Harvest Weight (lbs.)
Sockeye $0.76 $153,204,040 5.4 37,330,419 201,584,263
Chum $0.32 $2,001,302 6.0 1,042,345 6,254,070
Coho $0.49 $259,722 5.8 91,387 530,045
Chinook $0.67 $249,419 12.6 29,545 372,267
Pinks $0.15 $451,054 4.0 751,756 3,007,024
Total - $156,165,537 - 39,245,452 211,747,669
Notes: Preliminary prices represent base ex-vessel prices, not including supplemental payments (e.g. quality bonuses, etc.). Source: ADF&G.
Table 3 presents 2017 harvest and escapement data by district. The 2017 Bristol Bay inshore sockeye run was
43 percent above the preseason forecast. The 2017 harvest for all river systems met or exceeded their
Sockeye Market Report – Fall 2017 McDowell Group, Inc. Page 6
escapement goals. The Egegik, Nushagak, Wood, and Igushik rivers exceeded the upper end of their escapement
goals in 2017.
Table 3. Bristol Bay Sockeye Harvest Summary, Numbers of Fish, by Fishery District
District Run Forecast
Actual Run
2017 Harvest
1997-2016 Avg. Harvest
Escapement Goals
2017 Escapement
Naknek-Kvichak 15,480,000 15,217,467 8,112,267 7,631,212 3.1-12.3M 7,105,200
Egegik 10,260,000 14,466,239 11,865,257 6,466,235 800K - 2.0M 2,600,982
Ugashik 5,260,000 6,663,484 5,447,038 2,606,071 500K -1.4M 1,186,446
Nushagak 8,300,000 19,457,962 11,752,310 5,934,608 1.2 – 3.1M 7,705,652
Togiak 630,000 696,000 505,902 539,111 120 - 270K 190,098
Total 39,390,000 56,471,152 37,682,774 23,177,237 5.8 – 19.1 M 18,788,378
Source: ADF&G.
Fishery managers try to coordinate openings to keep escapement within a defined range or minimum threshold
for each river system in the region, but overescapement can occur for numerous reasons. During periods of
heavy fishing, processing capacity can struggle to keep up with harvest volume forcing processors put fishermen
on limits. Overescapement and harvest limits represent an opportunity cost/loss to commercial fishermen.
The 2017 Bristol Bay salmon season was an excellent year for fishermen, but it could have been even better. The
combined overescapement of the Egegik, Nushagak, Wood, and Igushik rivers was 5.2 million sockeye in 2017.
At 5.5 pounds per fish and a preliminary ex-vessel price of $1.02 per pound, this overescapment represents
$29.2 million of foregone harvest value this past season. Assuming a similar number of permits participated in
the fishery in 2017 compared to the prior year, that is the equivalent of $12,120 of foregone harvest value per
active permit (drift and setnet combined).
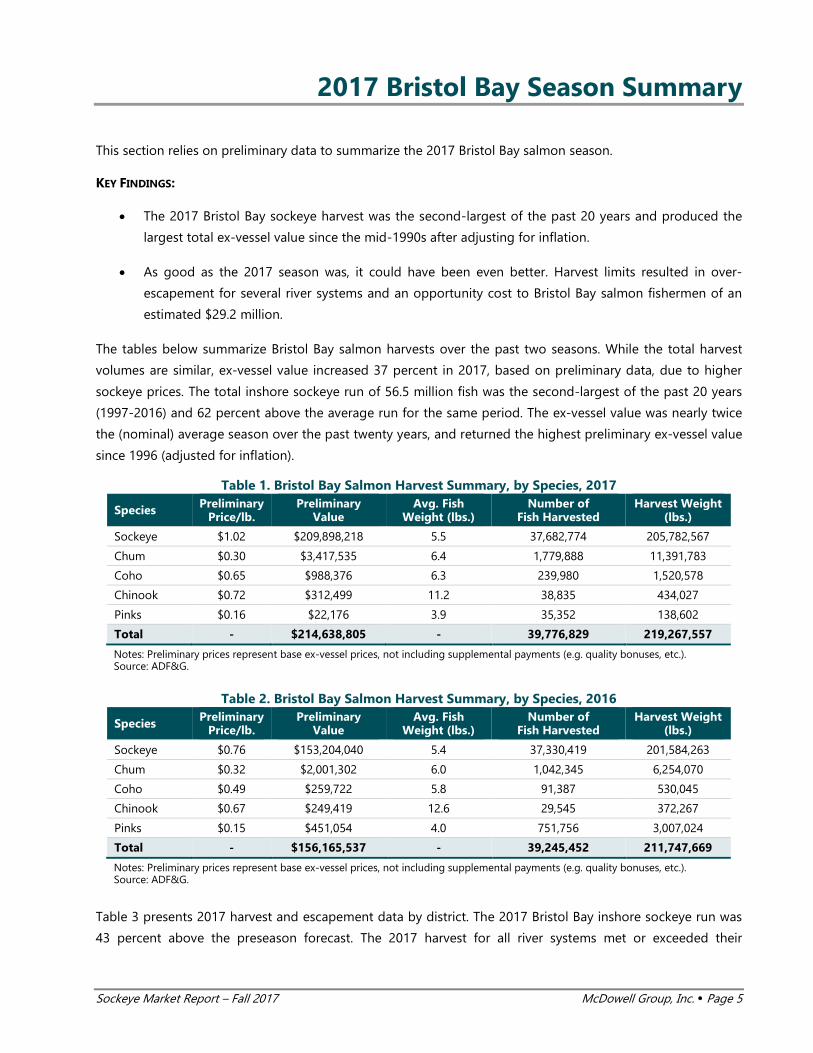
Figure 1. Harvest and Ex-Vessel Value of Bristol Bay Sockeye, 1975-2017
Note: Ex-vessel value adjusted for inflation, final value for 2017 is estimated and subject to change as data becomes available. Source: ADF&G, compiled by McDowell Group.
$0
$50
$100
$150
$200
$250
$300
$350
$400
$450
$500
0
5
10
15
20
25
30
35
40
45
50
1975
1980
1985
1990
1995
2000
2005
2010
2015
2017
Val
ue
($M
illio
ns)
Har
vest
(M
illio
ns
Fish
)
Harvest (Millions Fish) Ex-Vessel Value ($Millions)
Sockeye Market Report – Fall 2017 McDowell Group, Inc. Page 7
Global Supply Analysis
Global harvests of sockeye and other competing salmon species have a significant impact on first wholesale
prices and future ex-vessel prices for Bristol Bay sockeye. This chapter examines recent supply trends.
KEY FINDINGS
• Sockeye harvests declined by 5 percent in 2017, or approximately 20 million pounds, based on
preliminary harvest estimates. Sockeye harvests in Alaska and Russia were projected to decline a
combined 18 percent (71 million pounds) in 2017, compared to 2016.
• Sockeye harvests pale in comparison to farmed salmon production. After years of production growth,
farmed salmon supply declined 10 percent in 2016 and is expected to remain below 2015 levels for
several years. However, several farmed salmon analysts have increased production forecasts.
Sockeye Supply
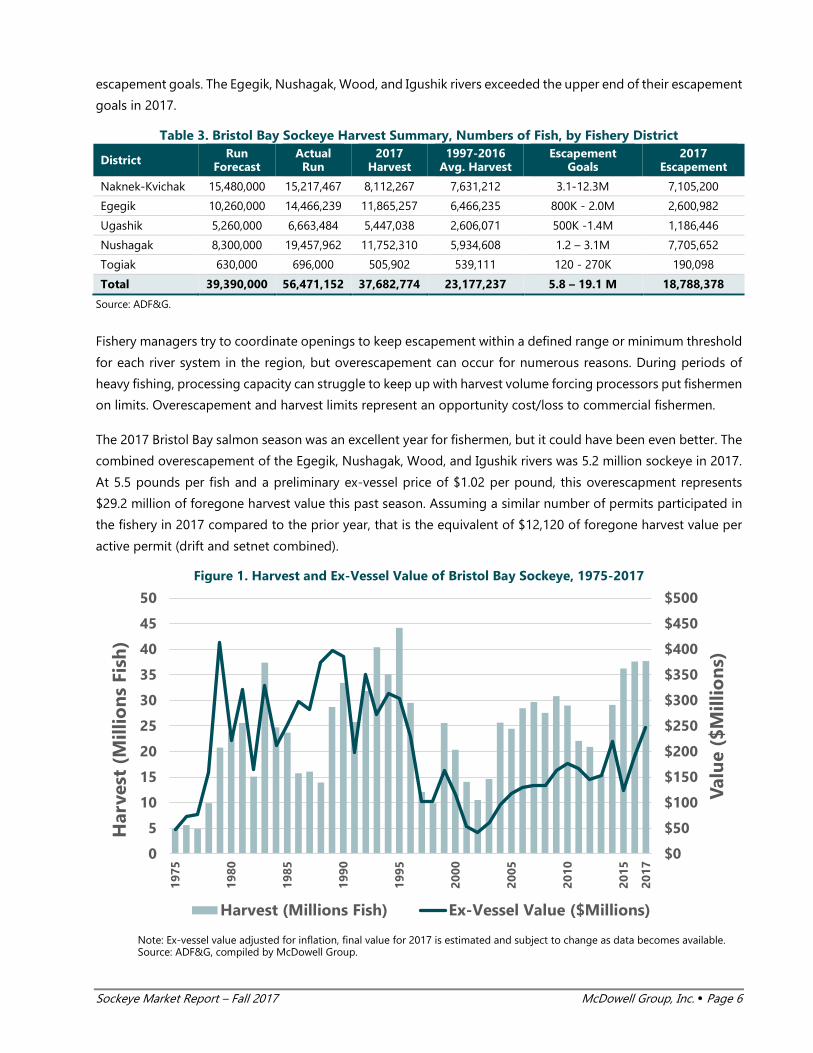
Compared to global salmon production, sockeye are relatively rare creatures. Like other wild salmon species,
sockeye harvests fluctuate but generally comprise 4 to 7 percent of global salmon production and 10 to 30
percent of wild salmon harvests. Between 2012 and 2015, sockeye accounted for 5 percent of the world’s salmon
harvest by volume, 17 percent of the world’s wild salmon harvest, and 38 percent of the world’s wild sockeye
harvest.
Figure 2. Global Salmon Harvest and Sockeye Harvest by Region, 2012-2015 Average
Source: ADF&G, FAO, and PACFIN.
Bristol Bay accounted for over half (54 percent) of the world’s commercial sockeye harvest in 2017, based on
preliminary harvest estimates. Over the past 25 years, the Bay produced 44 percent of the world’s sockeye
harvest. Russia is the next largest sockeye producer. All other regions in Alaska combined generally produce
Global Salmon Harvest Wild Sockeye Harvest
Farmed Salmon
71%
Other Wild Salmon
24%
Sockeye5%
Bristol Bay38%
Other AK25%
Russia31%
Canada4%
Others2%

Sockeye Market Report – Fall 2017 McDowell Group, Inc. Page 8
less sockeye than Bristol Bay, but still account for more than a quarter of global production. Canada and Japan
are the only other notable sockeye producers. Canada's harvests tend to jump to the 20 to 50 million pound
range once every five years, with the last large harvest occurring in 2014. The next large Canadian sockeye
harvest is expected to take place in 2018.
Global sockeye harvests fell to 305 million pounds in 2013, the lowest figure since 2003. Harvests increased 78
million pounds in the following year posting the largest production figure since the mid-1990s. The sudden shift
in supply during 2014, in addition to a strengthening dollar and other factors, led to much lower sockeye prices
in 2015.
Global sockeye supply declined 5 percent in 2017, based on preliminary harvest estimates. The Bristol Bay
harvest increased (in terms of pounds caught), but other areas had smaller harvests. This is a positive
development for Bristol Bay sockeye producers.
Table 4. Global Sockeye Harvest by Region, Millions of Pounds, 2010-2017 Country/Area 2010 2011 2012 2013 2014 2015 2016 2017P
Alaska Total 243 249 214 178 245 280 286 289
Bristol Bay 170 135 119 92 161 185 202 206
Other AK Areas 73 114 95 86 85 96 85 83
Other U.S. Areas 11.6 1.8 0.9 0.2 4.3 0.5 0.1 0.1
Russia 80 90 112 122 104 113 110 93
Canada 44 7 5 1 52 6 4 0.4
Japan 6 4 5 5 6 6 2 N/A
Total 384 351 335 305 411 405 403 382
Bristol Bay Pct. 44% 38% 36% 30% 39% 46% 50% 54%
BBay Sockeye Base Price/lb. $0.95 $1.00 $1.00 $1.50 $1.20 $0.50 $0.76 $1.02
Notes: 2017 figures are preliminary. Base prices do not include supplemental payments (e.g. bonuses, etc.). Source: ADF&G, PACFIN, FAO, DFO, Russia FFA, and McDowell Group estimates.
Figure 3. Global Sockeye Supply versus Bristol Bay Sockeye Price, 1990-2017
*Historical prices are adjusted for inflation and are shown in 2016 dollars. Final 2017 price is estimated. Note: 2017 supply figures are preliminary estimates. Source: ADF&G (COAR) and McDowell Group estimates.
$0.00
$0.50
$1.00
$1.50
$2.00
$2.50
$3.00
0
100
200
300
400
500
600
1990
1991
1992
1993
1994
1995
1996
1997
1998
1999
2000
2001
2002
2003
2004
2005
2006
2007
2008
2009
2010
2011
2012
2013
2014
2015
2016
2017
Fin
al B
B S
ock
eye
Pri
ce/l
b.*
Sock
eye
Sup
ply
(M
illio
ns
lbs.
)
Supply Bay Sockeye Price (Inflation-Adj.)
Sockeye Market Report – Fall 2017 McDowell Group, Inc. Page 9
Farmed Salmon Supply
Although a growing number of consumers differentiate between farmed and wild salmon, the price and
availability of farmed Atlantic and coho salmon still have a meaningful impact on values for sockeye and other
wild salmon species in North American and European markets.
Farmed salmon industry analysts began predicting slower supply growth rates last year but those supply
forecasts have been increased in recent months. Atlantic salmon production tends to grow around 5 percent
per year (2005-2016), but the last few years have been tumultuous for farmed salmon producers. Sea lice and
an algal bloom have negatively impacted production. Though forecasters predict growth will return to the 5 to
8 percent range in coming years, this production growth is not assured. According to Marine Harvest, the world’s
largest salmon farming company, the farmed salmon industry has reached a production level where biological
boundaries are being pushed.
Farmed coho production also declined sharply from 2014 through 2016. Chile produces the vast majority of
farmed coho salmon. Most of it is sold to Japan, where it directly competes with Alaska sockeye.
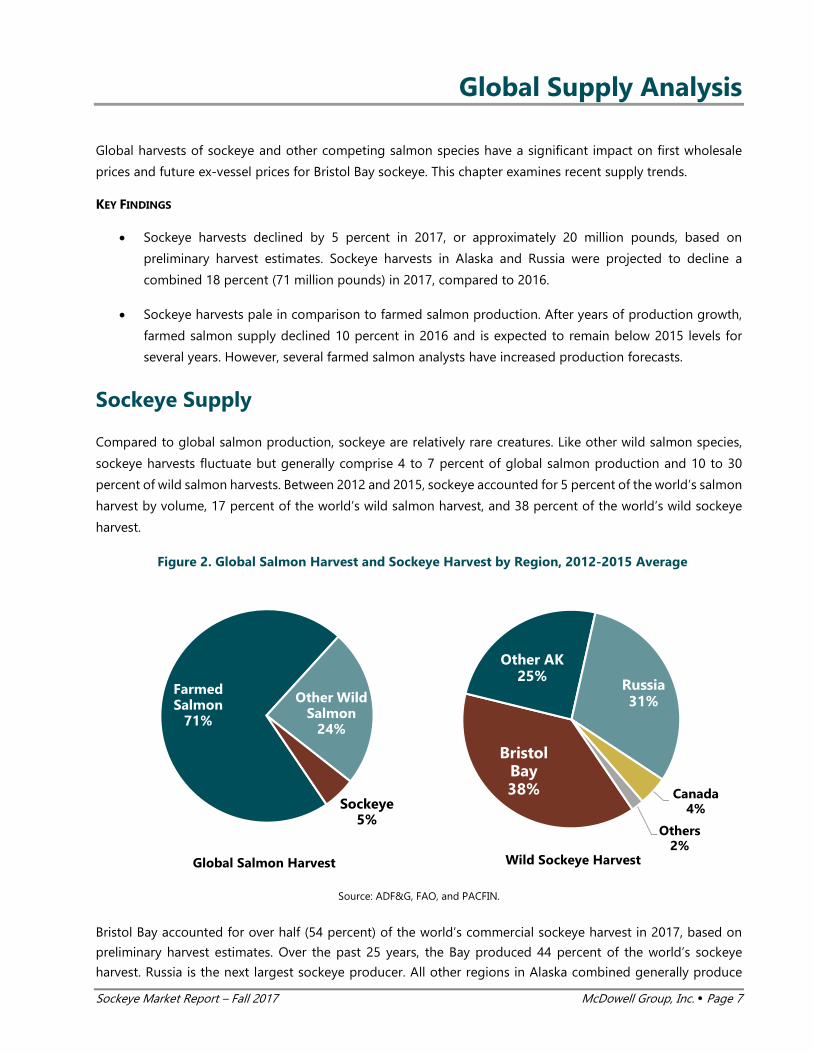
Table 5. Farmed Salmon Production & Wholesale Price, in Thousands of Metric Tons, 2010-2020F
Year Atlantic Salmon
Farmed Coho
UB Atlantic Salmon Index Price/lb.
2010 1,437 138 $4.26
2011 1,735 160 $5.01
2012 2,074 172 $4.08
2013 2,094 157 $4.28
2014 2,348 172 $4.95
2015 2,382 141 $3.78
2016P 2,141 125 $4.34
2017F 2,258 130 $5.25*
2018F 2,438 N/A -
2019F 2,579 N/A -
2020F 2,704 N/A -
*Average index price through 10/9/17. Note: The UB Atlantic Salmon Index represents a weighted-average proxy of wholesale prices on fresh farmed salmon fillets sold in the U.S. Source: FAO, Groundfish Forum (Atlantic/Coho production in 2016-2017), Bank Nordea (Atlantic production 2018F-2020F), and Urner Barry (Salmon index).
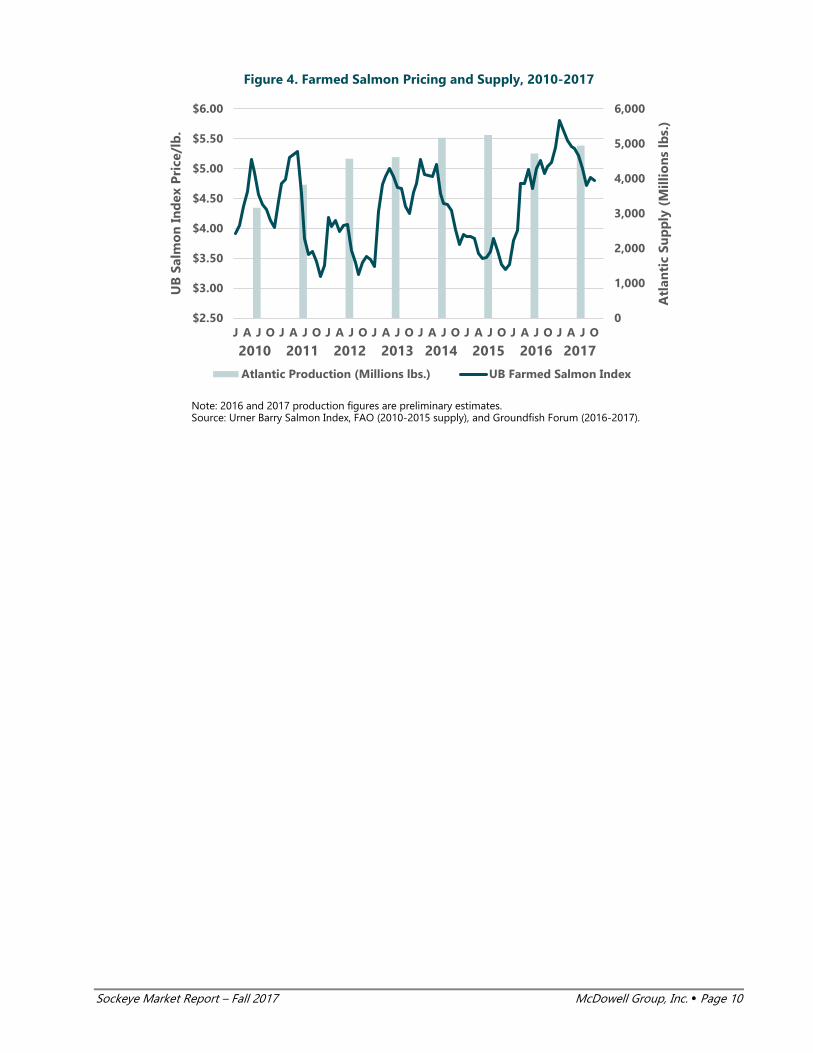
Atlantic salmon production declined 10 percent in 2016 due to an algal bloom that killed more than 100,000
metric tons of salmon in Chile, and sea lice issues in Norway. As a result, the average wholesale price of fresh
farmed salmon in the U.S. is up 39 percent since 2015. These shifts in price clearly show that demand has
outgrown supply in recent years.
However, farmed salmon prices have retreated in recent months – down 17 percent, or roughly $1.00/lb., since
peaking in January 2017. As with any commodity, higher prices diminish demand. It is likely that farmed prices
could continue to be volatile in coming years as the supply chain responds to lower supply growth and buyers
attempt to contain costs. Currency fluctuations or additional supply shocks could also have a significant impact
on farmed salmon prices, as has been the case since 2015.
Sockeye Market Report – Fall 2017 McDowell Group, Inc. Page 10
Figure 4. Farmed Salmon Pricing and Supply, 2010-2017
Note: 2016 and 2017 production figures are preliminary estimates. Source: Urner Barry Salmon Index, FAO (2010-2015 supply), and Groundfish Forum (2016-2017).
0
1,000
2,000
3,000
4,000
5,000
6,000
$2.50
$3.00
$3.50
$4.00
$4.50
$5.00
$5.50
$6.00
J A J O J A J O J A J O J A J O J A J O J A J O J A J O J A J O
Atl
anti
c Su
pp
ly (
Mill
ion
s lb
s.)
UB
Sal
mo
n I
nd
ex P
rice
/lb
.
Atlantic Production (Millions lbs.) UB Farmed Salmon Index
2010 2011 2012 2013 2014 2015 2016 2017

Sockeye Market Report – Fall 2017 McDowell Group, Inc. Page 11
Sockeye Market Analysis
Wholesale prices have a direct impact on future ex-vessel prices. This section examines trends in the wholesale
market for major sockeye products as well as competing salmon products.
KEY FINDINGS:
• Demand for Alaska sockeye products is strong, reflected by higher prices for all major product forms
• Wholesale sales volumes of H&G sockeye in July and August 2017 were well below the prior year
• Wholesale prices of frozen H&G sockeye during the second trimester of 2017 were up 23 percent,
compared to the previous year
• Prices of H&G and fillet products have increased faster than canned product, leading processors to
prioritize H&G and fillet production
• Farmed salmon prices are down 17 percent since beginning of year and down 5 percent since this time
last year
Key Product Forms and Markets for Bristol Bay Sockeye
Frozen H&G accounted for 58 percent of production volume and 49 percent of first wholesale value in 2016.
Fillets had the next highest total value, comprising 24 percent of the value and 15 percent of production volume.
Canned product accounted for 16 percent of volume and value. By comparison, cans accounted for 43 percent
of first wholesale value and fillet production was virtually non-existent in 2000.
Fresh H&G accounted for 4 percent of value in 2016. Fresh production in Bristol Bay is up nearly 400 percent
since 2014 (through 2016). Larger harvests have resulted in more product available for fresh markets, but most
of the growth has been due to processors prioritizing fresh shipments to meet demand from customers. Fresh
sockeye production in Bristol Bay has varied since the early 2000s, trending up and down at times. Only time
will tell if the recent uptick can be sustained.
Table 6. Bristol Bay Sockeye Product Form Composition, 2016 Product Form Pct. Volume Pct. Value Major Markets
Frozen H&G 58% 49% U.S., Japan, Europe, Canada
Fillets* 15% 24% U.S., Canada
Canned 16% 16% U.K., Canada, U.S., Australia
Roe 4% 6% Japan
Fresh H&G 4% 4% U.S.
Other & Ancillary Products 4% 1% U.S.
*Virtually all fillets are frozen. Note: Percentages may differ slightly from other figures quoted in this report due to different underlying data sources. Source: ADF&G (COAR).
Sockeye Market Report – Fall 2017 McDowell Group, Inc. Page 12
Roe and other products accounted for 7 percent of Bristol Bay sockeye’s first wholesale value in 2016. Most of
that is comprised of frozen and sujiko-style roe products. Other salmon species accounted for 3 percent of the
salmon fishery’s overall first wholesale value in 2016.
For a more detailed analysis of product/market composition and the entire Bristol Bay sockeye supply chain,
please see the Spring 2015 Sockeye Market Report.
Sockeye Market Outlook
Ex-vessel and first wholesale prices for all major sockeye products have increased in 2017. Demand is high after
several years of lower sockeye prices and an increase in marketing efforts. Retail prices of sockeye products will
likely climb in 2017 and early 2018. Price expectations for 2018 are uncertain at this point. Sales volumes in
coming months and future supply expectations will be key variables in shaping sockeye prices next year.
Wholesale Market Analysis for Key Sockeye Products
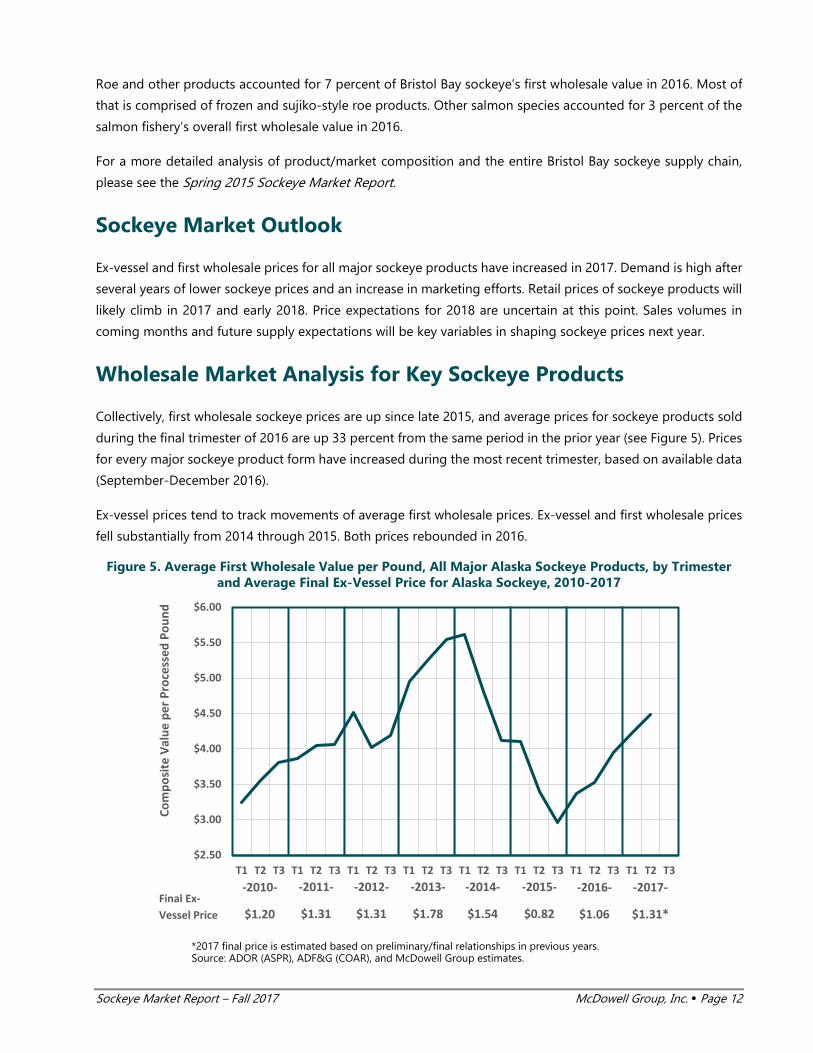
Collectively, first wholesale sockeye prices are up since late 2015, and average prices for sockeye products sold
during the final trimester of 2016 are up 33 percent from the same period in the prior year (see Figure 5). Prices
for every major sockeye product form have increased during the most recent trimester, based on available data
(September-December 2016).
Ex-vessel prices tend to track movements of average first wholesale prices. Ex-vessel and first wholesale prices
fell substantially from 2014 through 2015. Both prices rebounded in 2016.
Figure 5. Average First Wholesale Value per Pound, All Major Alaska Sockeye Products, by Trimester and Average Final Ex-Vessel Price for Alaska Sockeye, 2010-2017
*2017 final price is estimated based on preliminary/final relationships in previous years. Source: ADOR (ASPR), ADF&G (COAR), and McDowell Group estimates.
$2.50
$3.00
$3.50
$4.00
$4.50
$5.00
$5.50
$6.00
T1 T2 T3 T1 T2 T3 T1 T2 T3 T1 T2 T3 T1 T2 T3 T1 T2 T3 T1 T2 T3 T1 T2 T3
Com
posi
te V
alue
per
Pro
cess
ed P
ound
-2010-
$1.20Final Ex-Vessel Price
-2011-
$1.31
-2012-
$1.31
-2013-
$1.78
-2014-
$1.54
-2015-
$0.82
-2016-
$1.06
-2017-
$1.31*
Sockeye Market Report – Fall 2017 McDowell Group, Inc. Page 13
Market conditions for major product forms are summarized in following sections.
Note: Charts in the following section represent unit values per processed pound. Unit values are equal to the
first wholesale revenue divided by the number of pounds sold for each product form. This average price (i.e.
unit value) is not a perfect proxy for product form prices because sizing and other specifications can change
from year to year. For example, smaller frozen sockeye sell for a discount to medium and larger sized product.
Therefore, an increase in the number of small sockeye (as there was during 2014, 2015, and 2016) can drag
down average price for frozen H&G sockeye – even if prices for each size did not change. Regardless of this
technicality, unit values are an important measure of value over time because they track how much revenue is
being generated from each pound of sockeye production. As such, they are a better indicator for value trends
than prices for individual sizes.
Frozen H&G Sockeye
KEY MARKETS: U.S., JAPAN, AND EUROPE ESTIMATED PCT. OF BRISTOL BAY SOCKEYE FIRST WHOLESALE VALUE (2016): 49 PERCENT
Key market developments for frozen sockeye are as follows:
• Frozen H&G sockeye prices eclipsed $3.50/lb. in August 2017, their highest point since early 2014.
• Sales of frozen H&G sockeye have turned over slower during the first few months of the sales season
compared to prior years
• Sales of fresh H&G sockeye from Bristol Bay increased 39 percent in 2017 to 3.1 million pounds
Frozen sockeye prices increased sharply from early 2013 through early 2014, due to smaller harvests and a weak
U.S. dollar. Harvest volumes increased significantly in 2014 and 2015 and the percentage of smaller sockeye
increased as well. This coincided with an extraordinary shift in exchange rates that led to a stronger U.S. dollar.
These events resulted in a 49 percent decline for frozen H&G sockeye prices from early 2014 through 2015.
Prices of frozen H&G sockeye from Bristol Bay have rebounded significantly since 2015. Prices slightly exceeded
$3.50/lb. in August 2017, the most recent month with available price data. Prices in the second 2017 trimester
(May-August) averaged $3.46/lb., a 23 percent increase over the prior year. However, this year exports of frozen
H&G sockeye to Japan are running 26 percent behind 2016. These exports tend to be smaller fish, sold at lower
prices. Therefore, it would not be surprising to see average prices possibly decline in the final 2017 trimester.
For all the volatility of the past four years, the average price of Bristol Bay frozen H&G sockeye from 2009
through August 2017 was nearly identical to the average price from 2009 through 2012, approximately $3.05/lb.
after adjusting for inflation. During the 2009-2012 four-year period, prices fell outside the $2.70-$3.25/lb. range
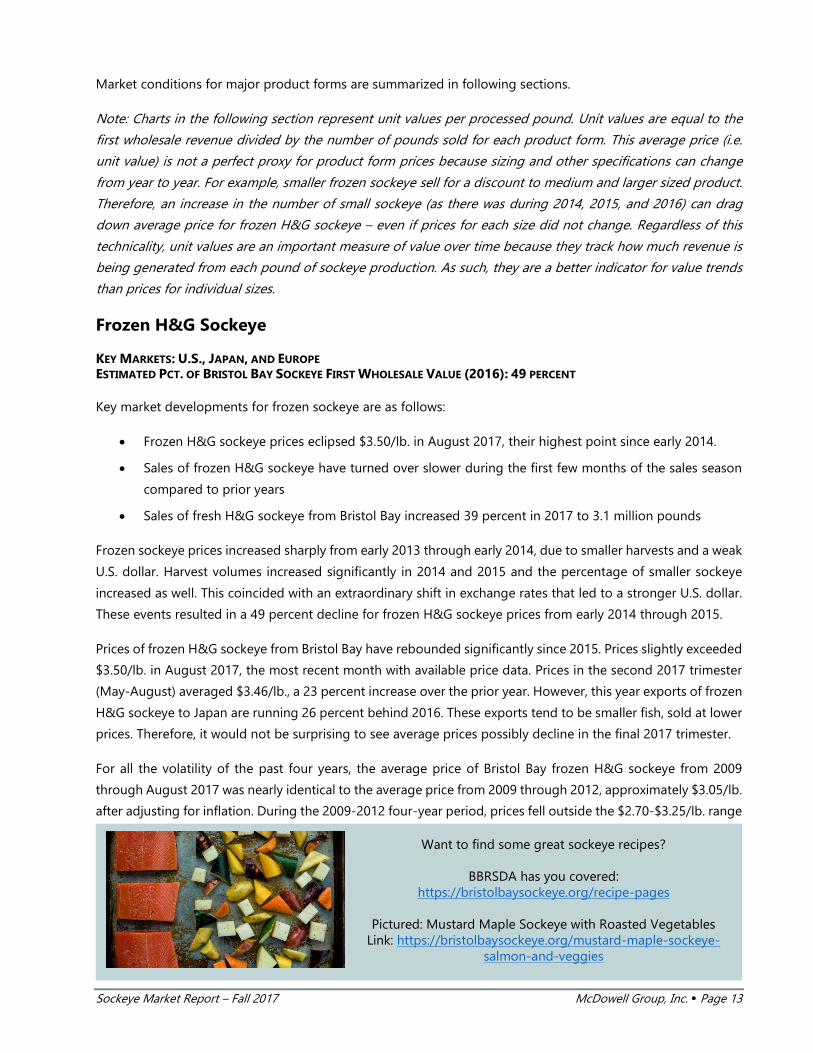
Want to find some great sockeye recipes?
BBRSDA has you covered: https://bristolbaysockeye.org/recipe-pages
Pictured: Mustard Maple Sockeye with Roasted Vegetables
Link: https://bristolbaysockeye.org/mustard-maple-sockeye-salmon-and-veggies
Sockeye Market Report – Fall 2017 McDowell Group, Inc. Page 14
in just one trimester. Prices fell outside that range eight times from 2013 through mid-2017. Whether this means
the fishery is headed for lower prices at some point in the future remains to be seen, as many variables affect
pricing from year to year.
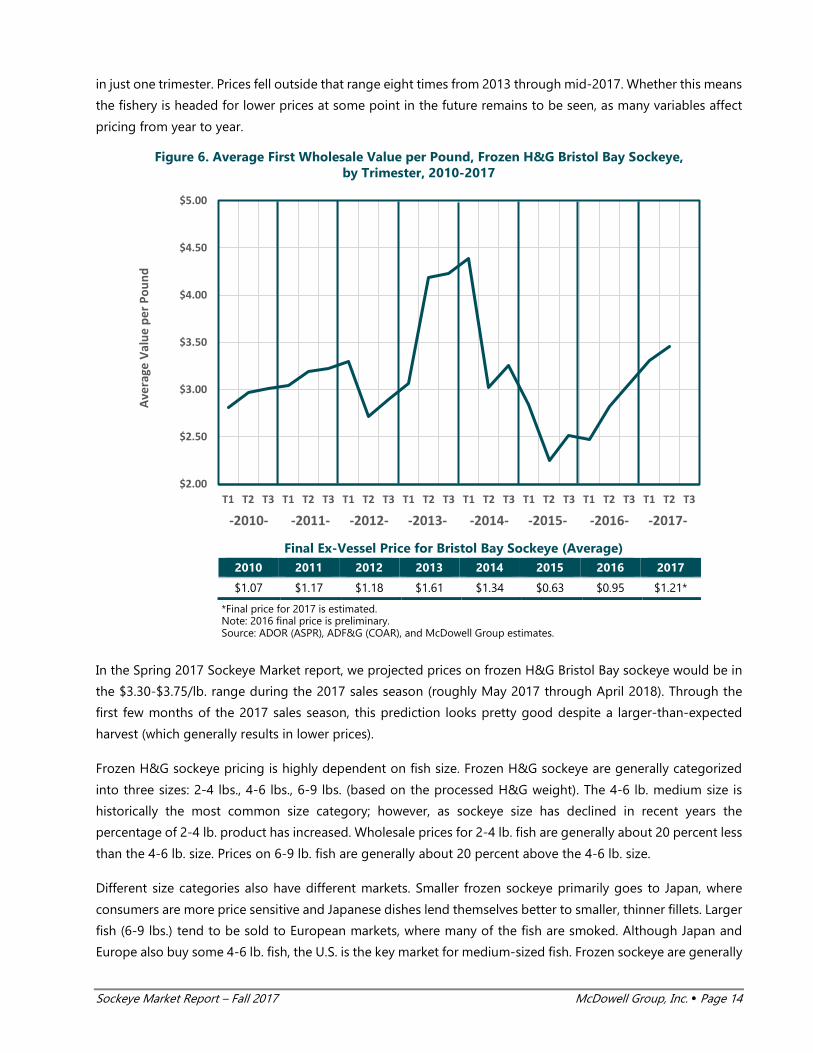
Figure 6. Average First Wholesale Value per Pound, Frozen H&G Bristol Bay Sockeye, by Trimester, 2010-2017
Final Ex-Vessel Price for Bristol Bay Sockeye (Average)
2010 2011 2012 2013 2014 2015 2016 2017
$1.07 $1.17 $1.18 $1.61 $1.34 $0.63 $0.95 $1.21*
*Final price for 2017 is estimated. Note: 2016 final price is preliminary. Source: ADOR (ASPR), ADF&G (COAR), and McDowell Group estimates.
In the Spring 2017 Sockeye Market report, we projected prices on frozen H&G Bristol Bay sockeye would be in
the $3.30-$3.75/lb. range during the 2017 sales season (roughly May 2017 through April 2018). Through the
first few months of the 2017 sales season, this prediction looks pretty good despite a larger-than-expected
harvest (which generally results in lower prices).
Frozen H&G sockeye pricing is highly dependent on fish size. Frozen H&G sockeye are generally categorized
into three sizes: 2-4 lbs., 4-6 lbs., 6-9 lbs. (based on the processed H&G weight). The 4-6 lb. medium size is
historically the most common size category; however, as sockeye size has declined in recent years the
percentage of 2-4 lb. product has increased. Wholesale prices for 2-4 lb. fish are generally about 20 percent less
than the 4-6 lb. size. Prices on 6-9 lb. fish are generally about 20 percent above the 4-6 lb. size.
Different size categories also have different markets. Smaller frozen sockeye primarily goes to Japan, where
consumers are more price sensitive and Japanese dishes lend themselves better to smaller, thinner fillets. Larger
fish (6-9 lbs.) tend to be sold to European markets, where many of the fish are smoked. Although Japan and
Europe also buy some 4-6 lb. fish, the U.S. is the key market for medium-sized fish. Frozen sockeye are generally
$2.00
$2.50
$3.00
$3.50
$4.00
$4.50
$5.00
T1 T2 T3 T1 T2 T3 T1 T2 T3 T1 T2 T3 T1 T2 T3 T1 T2 T3 T1 T2 T3 T1 T2 T3
Aver
age
Valu
e pe
r Pou
nd
-2010- -2011- -2012- -2013- -2014- -2015- -2016- -2017-
Sockeye Market Report – Fall 2017 McDowell Group, Inc. Page 15
sold to retailers and wholesale distributors who thaw out the product and sell fillets to consumers, grocery
stores, and restaurants.
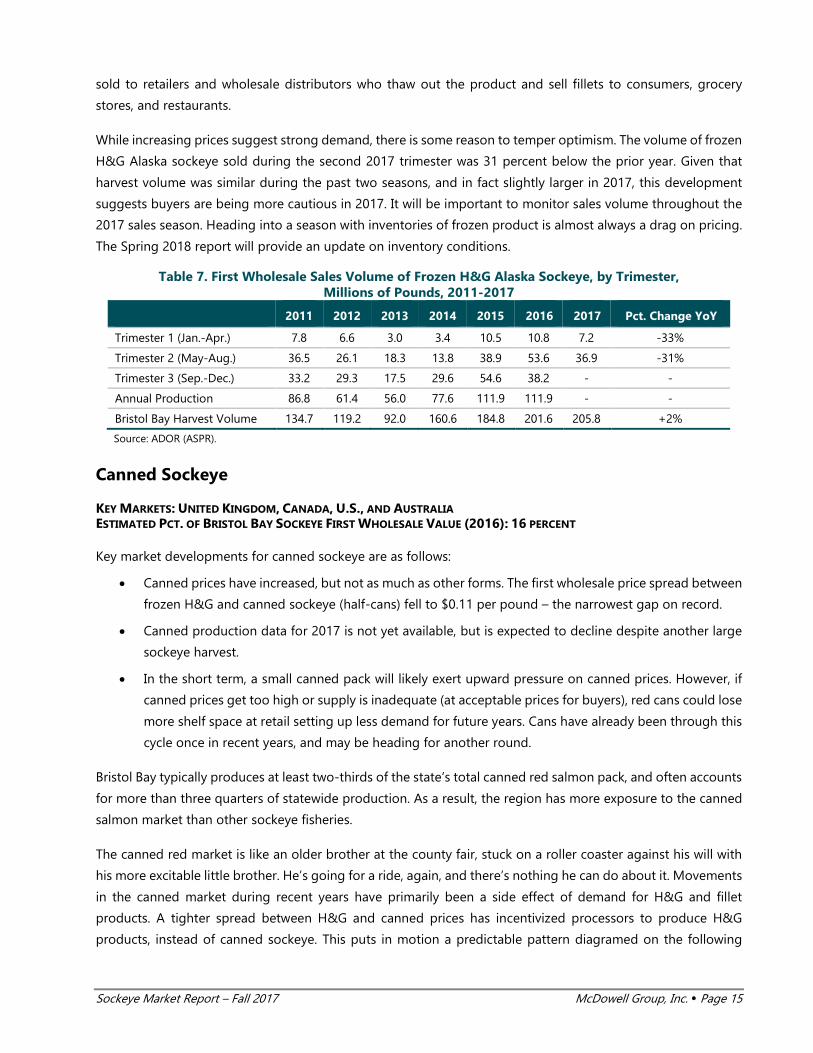
While increasing prices suggest strong demand, there is some reason to temper optimism. The volume of frozen
H&G Alaska sockeye sold during the second 2017 trimester was 31 percent below the prior year. Given that
harvest volume was similar during the past two seasons, and in fact slightly larger in 2017, this development
suggests buyers are being more cautious in 2017. It will be important to monitor sales volume throughout the
2017 sales season. Heading into a season with inventories of frozen product is almost always a drag on pricing.
The Spring 2018 report will provide an update on inventory conditions.
Table 7. First Wholesale Sales Volume of Frozen H&G Alaska Sockeye, by Trimester, Millions of Pounds, 2011-2017
2011 2012 2013 2014 2015 2016 2017 Pct. Change YoY
Trimester 1 (Jan.-Apr.) 7.8 6.6 3.0 3.4 10.5 10.8 7.2 -33%
Trimester 2 (May-Aug.) 36.5 26.1 18.3 13.8 38.9 53.6 36.9 -31%
Trimester 3 (Sep.-Dec.) 33.2 29.3 17.5 29.6 54.6 38.2 - -
Annual Production 86.8 61.4 56.0 77.6 111.9 111.9 - -
Bristol Bay Harvest Volume 134.7 119.2 92.0 160.6 184.8 201.6 205.8 +2%
Source: ADOR (ASPR).
Canned Sockeye
KEY MARKETS: UNITED KINGDOM, CANADA, U.S., AND AUSTRALIA ESTIMATED PCT. OF BRISTOL BAY SOCKEYE FIRST WHOLESALE VALUE (2016): 16 PERCENT
Key market developments for canned sockeye are as follows:
• Canned prices have increased, but not as much as other forms. The first wholesale price spread between
frozen H&G and canned sockeye (half-cans) fell to $0.11 per pound – the narrowest gap on record.
• Canned production data for 2017 is not yet available, but is expected to decline despite another large
sockeye harvest.
• In the short term, a small canned pack will likely exert upward pressure on canned prices. However, if
canned prices get too high or supply is inadequate (at acceptable prices for buyers), red cans could lose
more shelf space at retail setting up less demand for future years. Cans have already been through this
cycle once in recent years, and may be heading for another round.
Bristol Bay typically produces at least two-thirds of the state’s total canned red salmon pack, and often accounts
for more than three quarters of statewide production. As a result, the region has more exposure to the canned
salmon market than other sockeye fisheries.
The canned red market is like an older brother at the county fair, stuck on a roller coaster against his will with
his more excitable little brother. He’s going for a ride, again, and there’s nothing he can do about it. Movements
in the canned market during recent years have primarily been a side effect of demand for H&G and fillet
products. A tighter spread between H&G and canned prices has incentivized processors to produce H&G
products, instead of canned sockeye. This puts in motion a predictable pattern diagramed on the following
Sockeye Market Report – Fall 2017 McDowell Group, Inc. Page 16
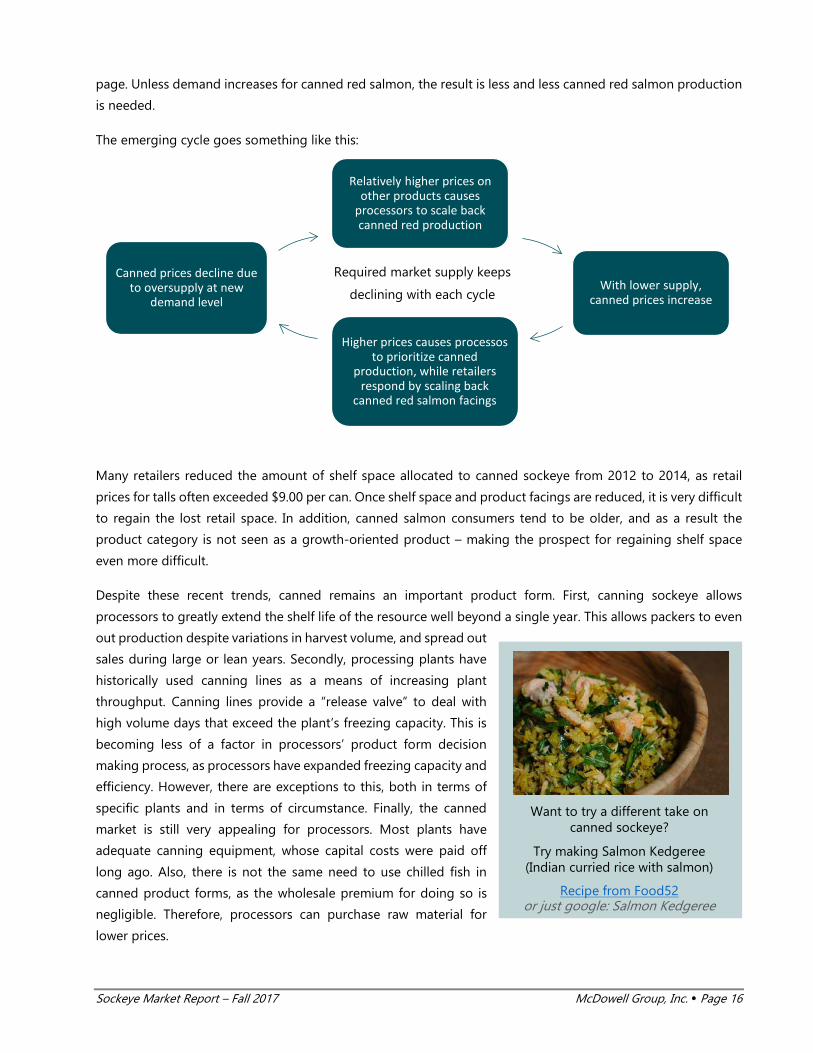
page. Unless demand increases for canned red salmon, the result is less and less canned red salmon production
is needed.
The emerging cycle goes something like this:
Many retailers reduced the amount of shelf space allocated to canned sockeye from 2012 to 2014, as retail
prices for talls often exceeded $9.00 per can. Once shelf space and product facings are reduced, it is very difficult
to regain the lost retail space. In addition, canned salmon consumers tend to be older, and as a result the
product category is not seen as a growth-oriented product – making the prospect for regaining shelf space
even more difficult.
Despite these recent trends, canned remains an important product form. First, canning sockeye allows
processors to greatly extend the shelf life of the resource well beyond a single year. This allows packers to even
out production despite variations in harvest volume, and spread out
sales during large or lean years. Secondly, processing plants have
historically used canning lines as a means of increasing plant
throughput. Canning lines provide a “release valve” to deal with
high volume days that exceed the plant’s freezing capacity. This is
becoming less of a factor in processors’ product form decision
making process, as processors have expanded freezing capacity and
efficiency. However, there are exceptions to this, both in terms of
specific plants and in terms of circumstance. Finally, the canned
market is still very appealing for processors. Most plants have
adequate canning equipment, whose capital costs were paid off
long ago. Also, there is not the same need to use chilled fish in
canned product forms, as the wholesale premium for doing so is
negligible. Therefore, processors can purchase raw material for
lower prices.
Want to try a different take on canned sockeye?
Try making Salmon Kedgeree (Indian curried rice with salmon)
Recipe from Food52 or just google: Salmon Kedgeree
Relatively higher prices on other products causes
processors to scale back canned red production
With lower supply, canned prices increase
Higher prices causes processos to prioritize canned
production, while retailers respond by scaling back
canned red salmon facings
Canned prices decline due to oversupply at new
demand level
Required market supply keeps
declining with each cycle

Sockeye Market Report – Fall 2017 McDowell Group, Inc. Page 17
Canned prices trended up in 2016 after two years of lower canned production volumes (despite larger harvests).
Canned prices have slowly increased in 2017 and are near early-2011 levels. Production data for the 2017 season
will not be available for several months; however, based on anecdotal reports production is expected to be
relatively low. This could result in a tighter canned salmon market this year and add to the amount of H&G and
fillet product which must be sold ahead of next season.
Figure 7. Average First Wholesale Value per Pound, Canned Alaska Sockeye – Half Cans, by Trimester, 2010-2017
Source: ADOR (ASPR).
Table 8. Canned Sockeye Price vs. Frozen H&G Price and Production Trends, 2010-2017
Year 2nd Trimester Frozen H&G
Sockeye Price/lb.
2nd Trimester Canned Half
Sockeye Price/lb.
Price Spread
AK Canned Production
(Millions lbs.)
AK Sockeye Harvest
(Millions lbs.)
Canned to Harvest
Volume Pct.*
2010 $2.99 $3.10 $0.12 31.7 242.6 13%
2011 $3.17 $3.83 $0.66 31.4 248.7 13%
2012 $2.81 $4.73 $1.93 41.2 213.8 19%
2013 $4.12 $4.89 $0.77 29.2 177.7 16%
2014 $3.14 $5.14 $2.00 44.5 245.4 18%
2015 $2.23 $3.63 $1.40 33.2 280.4 12%
2016 $2.82 $3.11 $0.28 29.1 286.2 10%
2017 $3.46 $3.57 $0.11 N/A 288.8 N/A
*Canned production volume divided by Alaska sockeye harvest volume. Note: 2017 harvest data is preliminary. Source: ADOR (ASPR) & ADF&G.
Changes in the canned market have implications for Bristol Bay fishermen. Declining production and emphasis
on canning lowers demand for unchilled fish. This transformation is well underway, as several processors no
longer buy unchilled fish in the Bay or have announced plans to require chilling in future years.
$2.00
$2.50
$3.00
$3.50
$4.00
$4.50
$5.00
$5.50
$6.00
T1 T2 T3 T1 T2 T3 T1 T2 T3 T1 T2 T3 T1 T2 T3 T1 T2 T3 T1 T2 T3 T1 T2 T3
Aver
age
Valu
e pe
r Pou
nd
-2010- -2011- -2012- -2013- -2014- -2015- -2016- -2017-
Sockeye Market Report – Fall 2017 McDowell Group, Inc. Page 18
Sockeye Fillets
KEY MARKETS: U.S. AND CANADA ESTIMATED PCT. OF BRISTOL BAY SOCKEYE FIRST WHOLESALE VALUE (2016): 24 PERCENT (FRESH & FROZEN)
Factors influencing sales volume and pricing for frozen Alaska sockeye fillets:
• Fillet market follows trends in the frozen H&G market, which are often used to produce refreshed fillets
• Frozen fillet prices during the second trimester of 2017 are up 8 percent compared to the same period
in the prior year
• Alaska processors packed more frozen sockeye fillets in 2016 than ever before and may have produced
even more in 2017
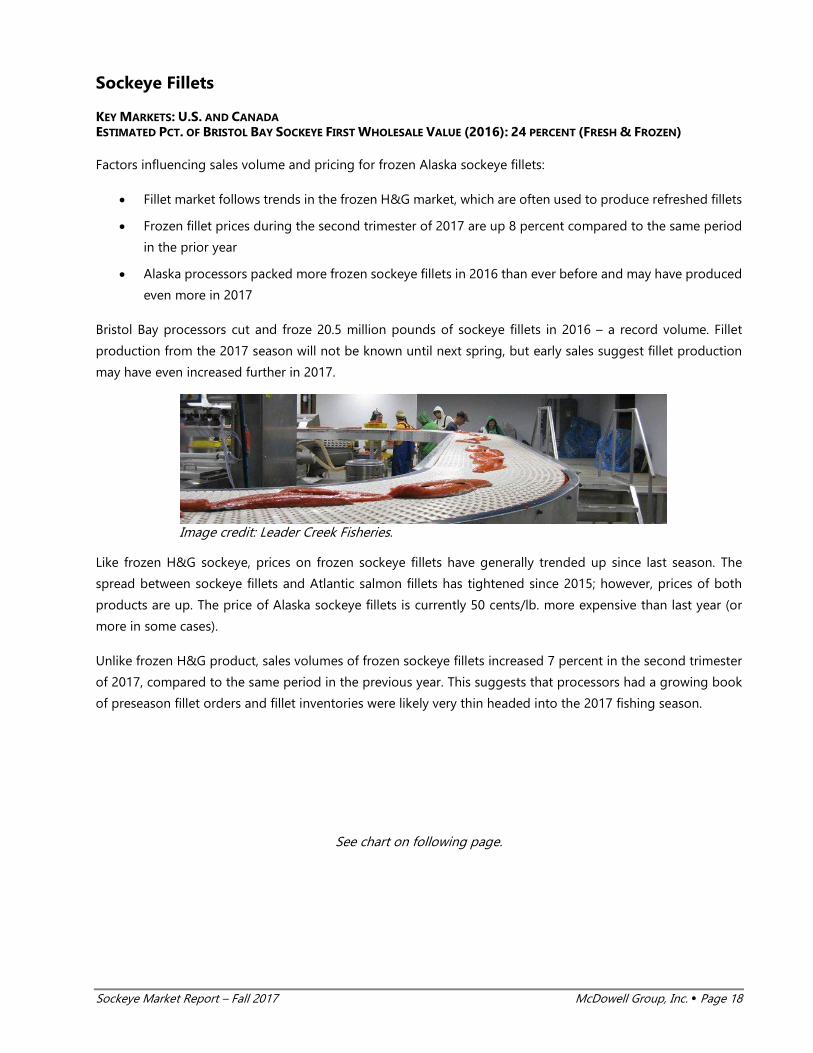
Bristol Bay processors cut and froze 20.5 million pounds of sockeye fillets in 2016 – a record volume. Fillet
production from the 2017 season will not be known until next spring, but early sales suggest fillet production
may have even increased further in 2017.
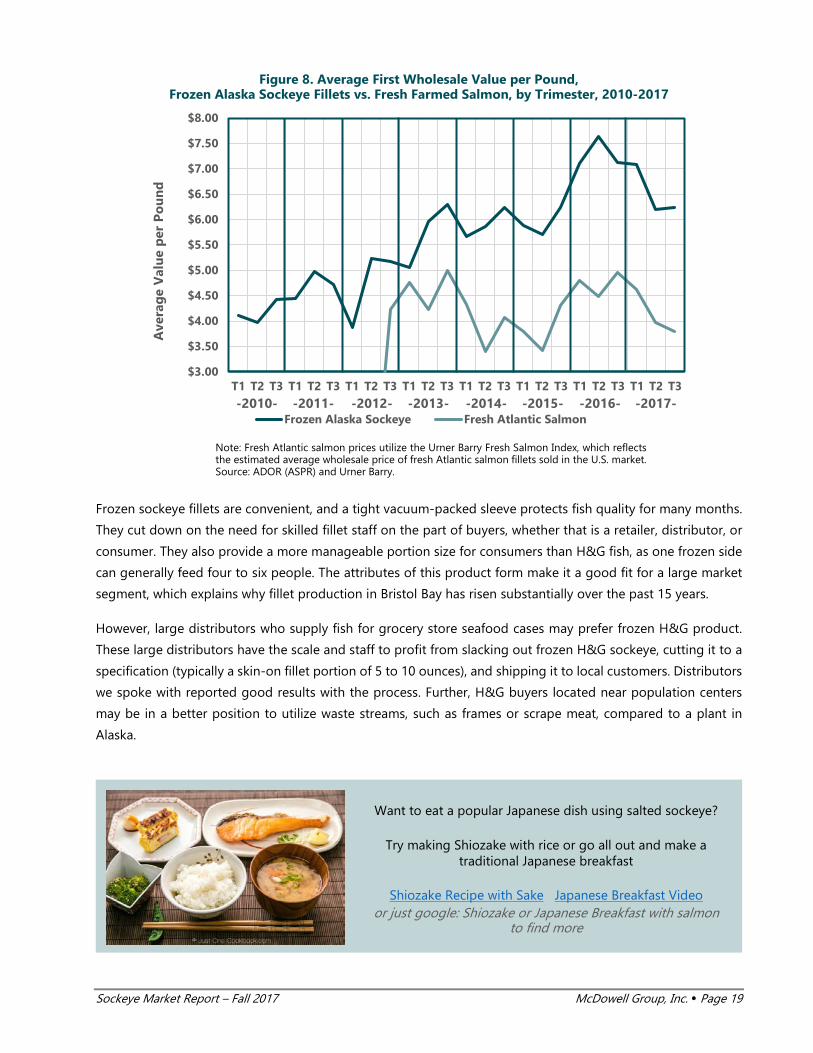
Like frozen H&G sockeye, prices on frozen sockeye fillets have generally trended up since last season. The
spread between sockeye fillets and Atlantic salmon fillets has tightened since 2015; however, prices of both
products are up. The price of Alaska sockeye fillets is currently 50 cents/lb. more expensive than last year (or
more in some cases).
Unlike frozen H&G product, sales volumes of frozen sockeye fillets increased 7 percent in the second trimester
of 2017, compared to the same period in the previous year. This suggests that processors had a growing book
of preseason fillet orders and fillet inventories were likely very thin headed into the 2017 fishing season.
See chart on following page.
Image credit: Leader Creek Fisheries.
Sockeye Market Report – Fall 2017 McDowell Group, Inc. Page 19
Figure 8. Average First Wholesale Value per Pound, Frozen Alaska Sockeye Fillets vs. Fresh Farmed Salmon, by Trimester, 2010-2017
Note: Fresh Atlantic salmon prices utilize the Urner Barry Fresh Salmon Index, which reflects the estimated average wholesale price of fresh Atlantic salmon fillets sold in the U.S. market. Source: ADOR (ASPR) and Urner Barry.
Frozen sockeye fillets are convenient, and a tight vacuum-packed sleeve protects fish quality for many months.
They cut down on the need for skilled fillet staff on the part of buyers, whether that is a retailer, distributor, or
consumer. They also provide a more manageable portion size for consumers than H&G fish, as one frozen side
can generally feed four to six people. The attributes of this product form make it a good fit for a large market
segment, which explains why fillet production in Bristol Bay has risen substantially over the past 15 years.
However, large distributors who supply fish for grocery store seafood cases may prefer frozen H&G product.
These large distributors have the scale and staff to profit from slacking out frozen H&G sockeye, cutting it to a
specification (typically a skin-on fillet portion of 5 to 10 ounces), and shipping it to local customers. Distributors
we spoke with reported good results with the process. Further, H&G buyers located near population centers
may be in a better position to utilize waste streams, such as frames or scrape meat, compared to a plant in
Alaska.
$3.00
$3.50
$4.00
$4.50
$5.00
$5.50
$6.00
$6.50
$7.00
$7.50
$8.00
T1 T2 T3 T1 T2 T3 T1 T2 T3 T1 T2 T3 T1 T2 T3 T1 T2 T3 T1 T2 T3 T1 T2 T3
Ave
rag
e V
alu
e p
er P
ou
nd
Frozen Alaska Sockeye Fresh Atlantic Salmon-2010- -2011- -2012- -2013- -2014- -2015- -2016- -2017-
Want to eat a popular Japanese dish using salted sockeye?
Try making Shiozake with rice or go all out and make a traditional Japanese breakfast
Shiozake Recipe with Sake Japanese Breakfast Video or just google: Shiozake or Japanese Breakfast with salmon
to find more
Sockeye Market Report – Fall 2017 McDowell Group, Inc. Page 20
Sockeye Roe
KEY MARKET: JAPAN ESTIMATED PCT. OF BRISTOL BAY SOCKEYE FIRST WHOLESALE VALUE (2016): 6 PERCENT
Factors influencing sales volume and pricing for frozen Alaska sockeye roe:
• Salmon roe prices have increased in 2017 due to smaller global harvests of pink and chum in recent
years
• The value of Bristol Bay sockeye roe has increased since 2015, due to higher prices and larger harvests
Roe typically accounts for 5 to 6 percent of sockeye’s total first wholesale revenue. Although roe is a small part
of the sockeye’s total first wholesale value, roe prices can have a significant impact on processors’ profitability
and the willingness to pay higher ex-vessel prices. For example, one round pound of Alaska sockeye produced
about 20 cents of roe value in 2013 when prices were near peak levels. Roe generated only about 9 cents per
round sockeye pound in 2015, as roe prices were 49 percent lower than 2013. Roe prices have a greater impact
on pink and chum salmon, where the value of roe comprises a higher percentage of total wholesale value. Lower
roe prices were the primary reason Alaska pink salmon prices declined sharply between 2013 and 2015.
Table 9 on the following page provides first wholesale information about Alaska sockeye roe sales
corresponding with harvest years (not necessarily calendar year sales). However, most of Alaska’s sockeye roe
is exported to Japan soon after the harvest season.
Alaska sockeye roe prices are affected by many factors, but the yen/USD exchange rate and production volume
usually have the largest impact on first wholesale prices. Roe prices tend to be higher when the Japanese yen is
strong and lower if the yen is weak, as the product is more expensive from the buyer’s perspective in the latter
situation. Despite the impact of exchange rates, harvest volume is
often the biggest driver for roe pricing. Alaska sockeye roe sales
tend to produce consistent sales revenue each year, often between
$30 and $35 million.
Sockeye roe revenue increased 50 percent in 2016, compared to the
prior year, and the average price was up 33 percent. However, 2015
was a poor year for sockeye roe, both in terms of total value and
average prices (see Table 9).
Figures pertaining to sockeye roe produced and sold from the 2017
season will not be known until next spring; however, the statewide
harvest was similar and early prices were on the order of $6.00/lb.
Seven million pounds of sockeye roe production at $6.00/lb. could
create an additional $5 million in revenue for Alaska sockeye
processors, or about 1.7 cents per round pound of sockeye caught
in 2017.
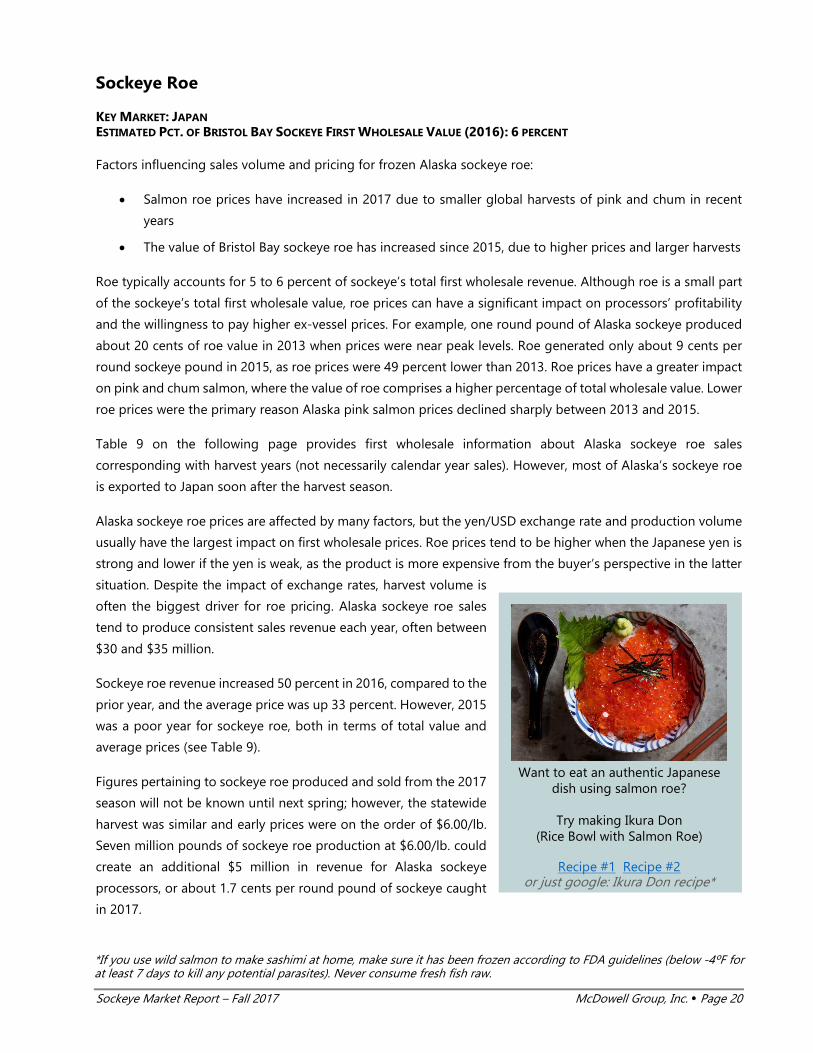
Want to eat an authentic Japanese dish using salmon roe?
Try making Ikura Don
(Rice Bowl with Salmon Roe)
Recipe #1 Recipe #2 or just google: Ikura Don recipe*
*If you use wild salmon to make sashimi at home, make sure it has been frozen according to FDA guidelines (below -4ºF for at least 7 days to kill any potential parasites). Never consume fresh fish raw.

Sockeye Market Report – Fall 2017 McDowell Group, Inc. Page 21
Table 9. Alaska Sockeye Roe Sales Value and Unit Value, 2008-2016 Harvest
Year Sales Volume (Millions lbs.)
Sales Value ($Millions)
Pct. of Total Sales Value
Average First Wholesale Value/lb.
August Yen/USD Exchange Rate
2008 4.4 $29.8 6.5% $6.72 109.4
2009 5.9 29.9 5.5% 5.06 95.0
2010 5.8 29.7 5.0% 5.11 85.6
2011 5.8 34.4 5.1% 5.89 77.1 (strong yen)
2012* 4.8 34.7 5.6% 7.19 78.7
2013 4.6 35.0 6.1% 7.53 97.9
2014 5.4 33.0 5.8% 6.07 102.9
2015* 6.4 24.6 3.8% 3.81 123.3 (weak yen)
2016* 7.3 37.1 5.3% 5.08 101.3
*Sales data only includes product sold between May and December, sales made between January and April of the sales cycle were withheld for confidentiality reasons but were likely relatively minor compared to first two trimesters in the sales cycle. Source: ADOR (ASPR) and OANDA.com, compiled by McDowell Group.
Roe data shown in the table above includes all roe product types, consisting primarily of sujiko (frozen, salted
salmon roe skeins) and green roe (frozen, unsalted salmon roe skeins). Sujiko takes longer for processors to
produce, since it must be salted according to exact specifications. As a result of the additional processing, sujiko
is more valuable than green roe, selling for a premium of 50 to 60 percent per pound in most years.
Farmed Salmon Market Conditions
Factors influencing pricing for farmed salmon products:
• Less farmed salmon production due to Chilean algal bloom in early 2016 and sea lice problems have
led to higher price environment in past two years
• Farmed production expected to grow slowly for several years, but higher prices could lead to larger-
than-expected production growth (as has happened in the past)
• Lice, disease, antibiotics/pesticide limiting factors for production growth and are increasing production
costs
• Consumer demand has likely eroded somewhat due to high salmon prices, farmed salmon prices are
down 17 percent since beginning of year and down 5 percent since this time last year
Although many consumers differentiate between wild and farmed salmon, many major buyers still react to
pricing differences. As farmed salmon production dwarfs the supply of wild salmon, farmed product creates a
natural baseline for wild salmon prices. In the U.S. and Japan, sockeye prices generally slot in above farmed
salmon prices. This generally leads to greater interest in sockeye when farmed salmon prices increase.
Farmed salmon prices have risen dramatically over the past two years, according to the Urner Barry Fresh Farmed
Salmon Index (see Figure 9). However, prices are down substantially since early 2017. The index represents a
trade-weighted proxy for the wholesale price of fresh farmed salmon fillets sold in the U.S. market.
Sockeye Market Report – Fall 2017 McDowell Group, Inc. Page 22
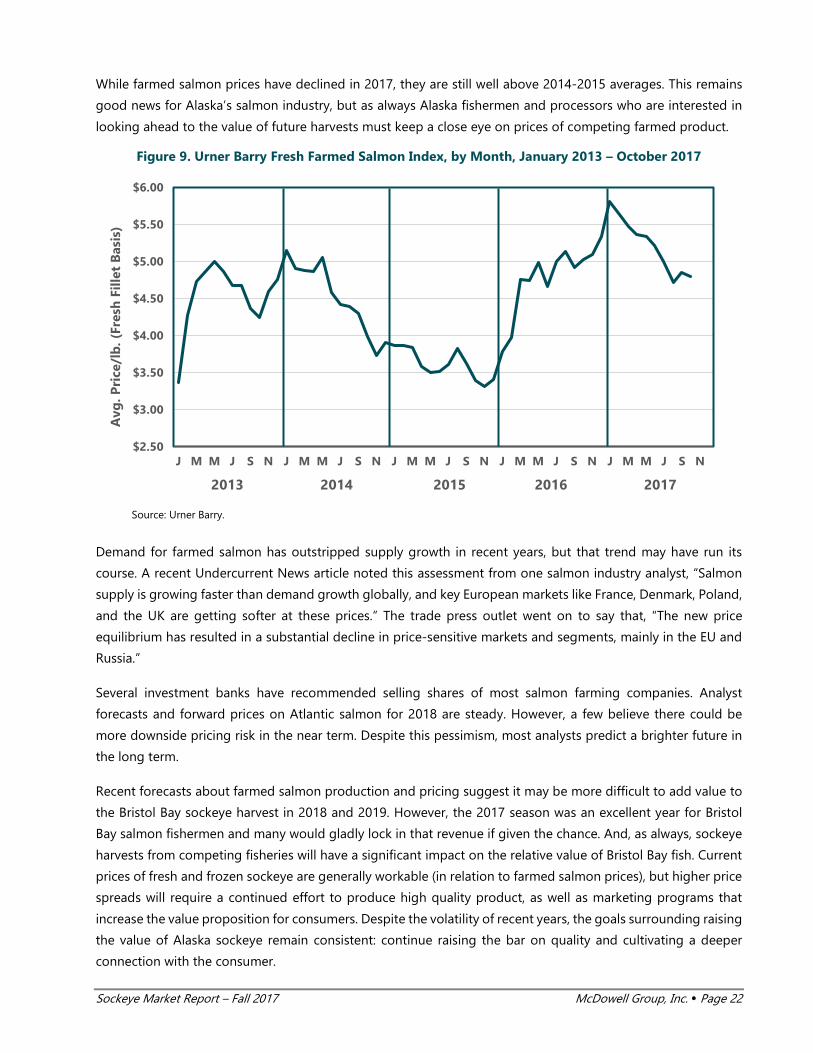
While farmed salmon prices have declined in 2017, they are still well above 2014-2015 averages. This remains
good news for Alaska’s salmon industry, but as always Alaska fishermen and processors who are interested in
looking ahead to the value of future harvests must keep a close eye on prices of competing farmed product.
Figure 9. Urner Barry Fresh Farmed Salmon Index, by Month, January 2013 – October 2017
Source: Urner Barry.
Demand for farmed salmon has outstripped supply growth in recent years, but that trend may have run its
course. A recent Undercurrent News article noted this assessment from one salmon industry analyst, “Salmon
supply is growing faster than demand growth globally, and key European markets like France, Denmark, Poland,
and the UK are getting softer at these prices.” The trade press outlet went on to say that, “The new price
equilibrium has resulted in a substantial decline in price-sensitive markets and segments, mainly in the EU and
Russia.”
Several investment banks have recommended selling shares of most salmon farming companies. Analyst
forecasts and forward prices on Atlantic salmon for 2018 are steady. However, a few believe there could be
more downside pricing risk in the near term. Despite this pessimism, most analysts predict a brighter future in
the long term.
Recent forecasts about farmed salmon production and pricing suggest it may be more difficult to add value to
the Bristol Bay sockeye harvest in 2018 and 2019. However, the 2017 season was an excellent year for Bristol
Bay salmon fishermen and many would gladly lock in that revenue if given the chance. And, as always, sockeye
harvests from competing fisheries will have a significant impact on the relative value of Bristol Bay fish. Current
prices of fresh and frozen sockeye are generally workable (in relation to farmed salmon prices), but higher price
spreads will require a continued effort to produce high quality product, as well as marketing programs that
increase the value proposition for consumers. Despite the volatility of recent years, the goals surrounding raising
the value of Alaska sockeye remain consistent: continue raising the bar on quality and cultivating a deeper
connection with the consumer.
$2.50
$3.00
$3.50
$4.00
$4.50
$5.00
$5.50
$6.00
J M M J S N J M M J S N J M M J S N J M M J S N J M M J S N
Avg
. Pri
ce/l
b. (
Fres
h F
illet
Bas
is)
2013 2014 2015 2016 2017

Sockeye Market Report – Fall 2017 McDowell Group, Inc. Page 23
Russian Sockeye
U.S. imports of Russian sockeye tend to spike when Alaska sockeye prices rise and 2017 is revisiting that pattern.
Historically, the volume of Russian sockeye imported into the U.S. is relatively small. However, when Alaska
sockeye harvests were poor in 2013, the U.S. imported 8.0 million pounds of Russian sockeye. That volume
declined in 2014 and 2015 as Alaska sockeye harvests increased and prices declined.
Last year, imports of Russian sockeye spiked to 3.6 million pounds despite a large harvest in Alaska, suggesting
that some buyers are at least experimenting with selling Russian sockeye in the U.S. Imports of Russian sockeye
are up 213 percent in 2017 through August, year-on-year. Not surprisingly, the average import price of Russian
sockeye has also increased (see Table 10).
Table 10. U.S. Imports of Russian Sockeye, 2010-2017
Year Volume (000s lbs.)
Value ($000s)
Alaska Sockeye Harvest (Millions lbs.)
Avg. Alaska Sockeye Frozen H&G Price/lb.
2010 130 $466 243 $2.98
2011 23 $77 249 $3.19
2012 294 $1,053 214 $2.93
2013 7,954 $29,589 178 $4.03
2014 1,906 $7,001 245 $3.19
2015 1,018 $3,147 280 $2.38
2016 3,646 $11,710 286 $2.87
JAN-AUG 2016 705 $2,185 286 $2.75
JAN-AUG 2017 2,207 $7,392 289 $3.44
Errata Note: Data in this section published in previous reports mistakenly quoted import volume in kilos, as opposed to pounds. Source: NMFS Trade Data.
Although Russian waters produce the same salmon species as those caught in Alaska, the primary harvest
method is very different. Russian salmon producers typically use fish traps located near the mouths of rivers.
Trap sites are leased by salmon processors, who employ laborers to harvest, transport, and process salmon. Due
to the differences in harvest gear, Russian salmon companies are capable of producing high quality sockeye.
However, interviews with buyers report that historically Russian sockeye quality varies widely from company to
company.
Developing a broader U.S. market for Alaska sockeye is an important goal for the Alaska seafood industry;
however, it could also provide an opportunity for buyers to substitute Alaska product with Russian salmon.
Branding and marketing efforts undertaken by BBRSDA, ASMI, and the Copper River/Prince William Sound RSDA
are critical to creating consumer loyalty for Alaska salmon products. Since affluent consumers primarily base
their seafood purchases on quality and taste, it is also important that Bristol Bay sockeye products offer
comparable or superior quality.

Sockeye Market Report – Fall 2017 McDowell Group, Inc. Page 24
Salmon Market News & Implications
Large Scale Mining in Bristol Bay
In May 2017, the Environmental Protection Agency (EPA) settled a lawsuit with the Pebble Limited Partnership,
allowing the permitting process for the proposed Pebble Mine to continue. More recently, details have emerged
about a May meeting between EPA administrator Scott Pruitt and Pebble Limited Partnership executives. Shortly
after the meeting, EPA leadership directed staff to withdraw protections for the area from certain mining
activities. If finalized, the agency’s reversal of actions taken by the previous administration would allow Pebble
to apply for a mining permit, but does not guarantee that those plans would be approved.
A 90-day public comment period closed on October 17, 2017. Pebble leadership has expressed plans to file
mining permit applications for a scaled-down operation in December 2017. Link.
The Pebble Mine is an extremely contentious issue. Fishermen are worried that such a mine could jeopardize
the natural productivity and purity of the Bristol Bay watershed. Large buyers have expressed concern that a
mine could tarnish the fishery’s reputation and affect consumer demand for Bristol Bay salmon.
Amazon’s Whole Foods Purchase a Sign of Grocery Store Evolution
Amazon bought Whole Foods, a high-end grocery chain with 430 stores, for $13.3 billion in June. Interestingly,
the increase in Amazon’s stock market valuation after the announcement paid for the purchase in a single day.
Amazon’s digital reach is impressive, as an estimated two-thirds of U.S. households subscribe to its Prime
membership program. The move is consistent with an emerging theme in retail where retail websites are
merging with the services of brick-and-mortar stores in an effort to gain, or retain, market share. Tracking
customer orders and habits via website purchases provides far greater accuracy for retailers in answering the
all-important question of what do people want to buy? Link.
This transformation is well under way in China. ASMI has had good success with e-commerce promotions in
China, selling over $1 million worth of product for a “Single’s Day” promotion. Executive Director Alexa
Tonkovich recently told Intrafish, “Traditional channels are blurring. It’s the people at the intersection of physical
and virtual worlds who will thrive. If not, you will become obsolete.”
In an effort to stay ahead of competition, existing grocery stores are increasingly offering delivery services and
digital ordering platforms to customers. Consumers are gaining power to shape the food supply chain from
“you’ll eat what is provided” to “order anything you like.” Changing the point of purchase from store to the
home brings about opportunity and challenges. The impacts may take longer for perishable products like
seafood, but the paradigm shift undertaken by Amazon and others could revolutionize the business of retail
seafood. Successful marketing efforts will need to thrive within this evolving food delivery system.
Farmed Salmon Escape
In August, a net pen containing 305,000 Atlantic salmon broke apart in Washington state. Salmon farming
company Cooke Aquaculture says it is unsure exactly how many salmon escaped. Local tribal organizations,
Sockeye Market Report – Fall 2017 McDowell Group, Inc. Page 25
fishermen, and environmental groups worry the escaped fish could spread disease and parasites. In response,
Washington governor Jay Inslee has instituted a moratorium on permits for salmon net pens. Link.
GMO Food Research Advances, Producers Contemplate Messaging
Chinese scientists have achieved a breakthrough with a genetic modification to pork resulting in low-fat pigs.
The experiment marks a significant advance in genetic modification, successfully applying a new gene-editing
tool known as CRISPR that makes changing DNA code easier and more precise. While this recent advance was
achieved differently than techniques used by AquaBounty to create a genetically modified salmon, the benefits
for producers in each case are substantial. GMO salmon are generally faster growing and likely consume less
feed, major cost issues for farmed salmon producers. Link.
Consumer perception of genetically modified (GMO) foods remains mostly negative in the U.S. and Europe.
Some experts doubt GMO pig products would ever be approved in the U.S., but that notion might not be too
farfetched. FDA regulators approved GMO salmon in 2015. Thus far, consumers have not widely accepted GMO
food products, at least knowingly. GMO grains are commonplace, often used in animal feeds and as ingredients
in human foods. The implications for Alaska seafood producers are unclear, but it is possible that GMO foods
may eventually gain wider acceptance as the benefits of such modifications become greater.
Alaska Ballot Measure Regarding Fish Habitat Restored
Anchorage Superior Court Judge Mark Rindner overruled Lt. Governor Byron Mallott, finding that the Stand for
Salmon group could move ahead on a ballot initiative aimed at creating a new multi-tiered system of permits
for development projects affecting fish habitat. The matter ended up in court after Lt. Governor Mallott rejected
the proposed ballot initiative. If the court’s decision stands, initiative backers will need to get 32,000 signatures
before the new law can go before voters in 2018. (Seafood News, subscription required).
Upstart Bay Processing Operation Becomes a Cautionary Tale
The 180’ F/V Akutan went to Bristol Bay this summer to process sockeye for a group of roughly 15 drift boat
fishermen, primarily members of an Old Believer community in Homer. The story of the vessel, its crew, and
those involved was well documented in an August article written by KDLG’s Dave Bendinger. While the story is
too long to fully recount here, the results underscore the risk associated with processing in the fishery. Poor
planning and a series of unfortunate events led to production of just 160,000 lbs., an unpaid crew, bankruptcy
for the processing company, and repossession of the vessel. The Homer fishermen who hired the processing
company, essentially lost an entire season. More recently, news outlets have reported that all the vessel’s 2017
product had to be disposed of due to product being saturated with diesel fuel, making it unfit for human or
animal consumption. Link.
The idea of bypassing Alaska processors and selling products directly to other markets is an alluring idea for
many fishermen. However, with greater potential revenue comes greater risk. Silver Bay fishermen have
successfully established a new vertically-integrated, fisherman-owned company, but for each success there are
many ventures that either fail outright or return too little in exchange for the investment of time and money.
Sockeye Market Report – Fall 2017 McDowell Group, Inc. Page 26
The Story of Sockeye Market Diversification
The diversification of sockeye markets is a fascinating story. Most changes of any sort are reactionary in nature.
The sockeye industry is no different. With increasing competition from less expensive farmed coho salmon in
Japan and the canned product losing demand due to changing tastes, a reaction would be necessary if the
industry was ever going to flourish again. However, change does not come with a guarantee. Through a lot of
careful planning, hard work, and large investments, the effort has been successful.
This section summarizes changes to Alaska sockeye markets over the past 15 years. A much longer version could
be written about the important contributions of the people and companies who have revolutionized the Alaska
sockeye industry.
Once Upon a Time: Frozen to Japan or Packed in a Can
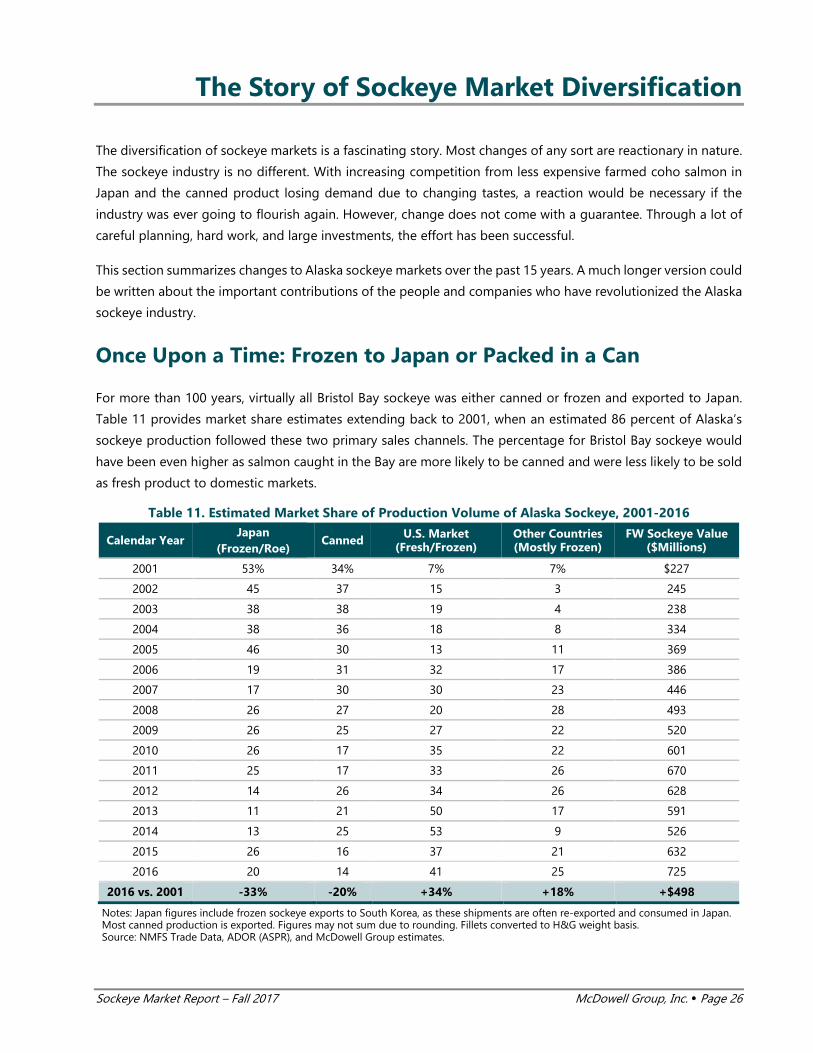
For more than 100 years, virtually all Bristol Bay sockeye was either canned or frozen and exported to Japan.
Table 11 provides market share estimates extending back to 2001, when an estimated 86 percent of Alaska’s
sockeye production followed these two primary sales channels. The percentage for Bristol Bay sockeye would
have been even higher as salmon caught in the Bay are more likely to be canned and were less likely to be sold
as fresh product to domestic markets.
Table 11. Estimated Market Share of Production Volume of Alaska Sockeye, 2001-2016
Calendar Year Japan
(Frozen/Roe) Canned U.S. Market
(Fresh/Frozen) Other Countries (Mostly Frozen)
FW Sockeye Value ($Millions)
2001 53% 34% 7% 7% $227
2002 45 37 15 3 245
2003 38 38 19 4 238
2004 38 36 18 8 334
2005 46 30 13 11 369
2006 19 31 32 17 386
2007 17 30 30 23 446
2008 26 27 20 28 493
2009 26 25 27 22 520
2010 26 17 35 22 601
2011 25 17 33 26 670
2012 14 26 34 26 628
2013 11 21 50 17 591
2014 13 25 53 9 526
2015 26 16 37 21 632
2016 20 14 41 25 725
2016 vs. 2001 -33% -20% +34% +18% +$498
Notes: Japan figures include frozen sockeye exports to South Korea, as these shipments are often re-exported and consumed in Japan. Most canned production is exported. Figures may not sum due to rounding. Fillets converted to H&G weight basis. Source: NMFS Trade Data, ADOR (ASPR), and McDowell Group estimates.

Sockeye Market Report – Fall 2017 McDowell Group, Inc. Page 27
A tremendous shift has occurred over the past two decades, as cans and Japan have lost their place as the only
major sockeye sales channels. In 2016, it is estimated that only 34 percent of Alaska sockeye production went
to Japanese or canned markets. The U.S. is now the largest market for Alaska sockeye by a wide margin.
Prior to the mid-2000s, sockeye products were relatively limited too. Canned sockeye had bones and skin. There
was very little filleted product. Heads and guts were discharged as ground waste. Processors are now
experimenting with more canned specifications, fillet production has increased dramatically, and waste streams
are slowly being utilized in ancillary products (such as salmon oil or pet food ingredients).
Declining Exports to Japan
Japan routinely imported 50 to 70 million pounds of frozen H&G sockeye from the U.S. until 2006. However,
the volume has diminished substantially since then. Japanese imports fell all the way to 8 million pounds in
2014, but rebounded in 2015 and 2016 largely due to sales of smaller fish to
Japan (see Figure 10). Japanese imports of frozen U.S. sockeye are down 36
percent in 2017 through August compared to same period in previous year.
Kirimi-style cuts (pictured) of lightly salted salmon are a staple in Japanese
cuisine. Sockeye has been somewhat supplanted by farmed Chilean coho in
Japan; however, overall seafood consumption has also been contracting for
more than a decade compounding the declining sockeye trade.
Figure 10. Japan Imports of U.S. Frozen Sockeye, in Million lbs., 2002-2016
Note: Includes direct U.S. exports and those sold to Japanese buyers after being stored in other countries. Source: Global Trade Atlas.
Pulling Sockeye out of the Can
As other markets and product forms became more popular, raw material had to come from somewhere. What
wasn’t taken out of the Japan trade, was generally pulled from the canned format.
0
10
20
30
40
50
60
70
80
2002
2003
2004
2005
2006
2007
2008
2009
2010
2011
2012
2013
2014
2015
2016
Mill
ion
s lb
s.
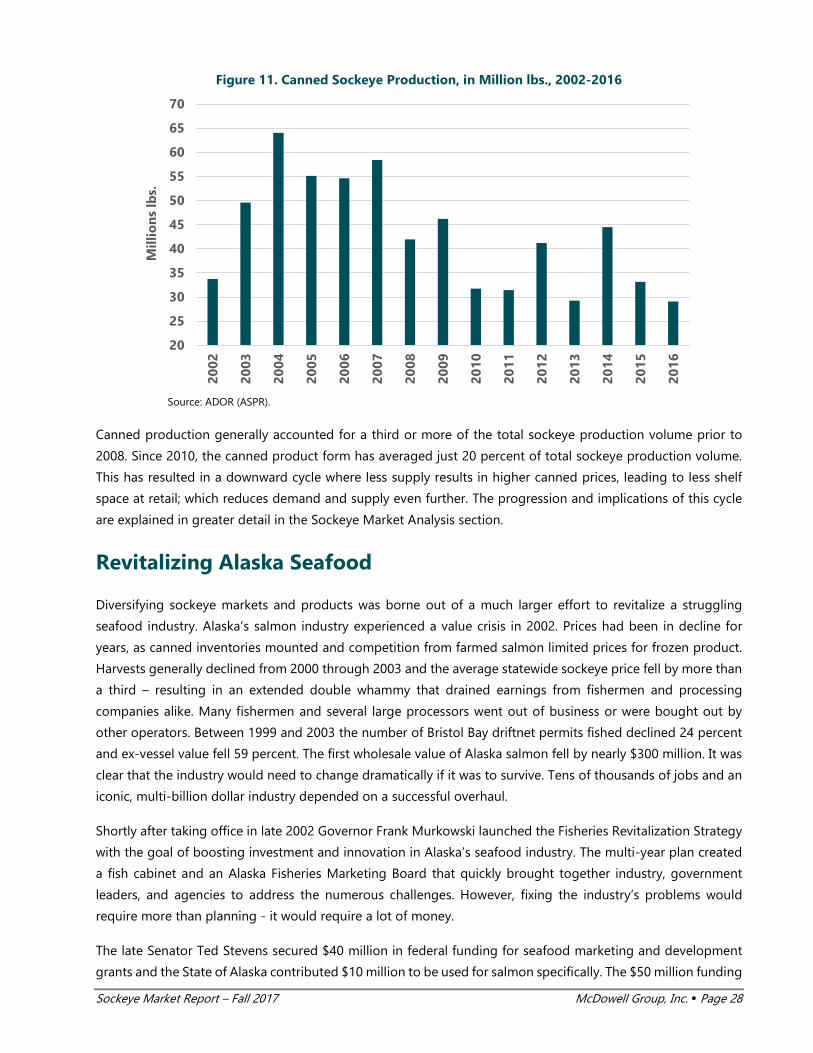
Sockeye Market Report – Fall 2017 McDowell Group, Inc. Page 28
Figure 11. Canned Sockeye Production, in Million lbs., 2002-2016
Source: ADOR (ASPR).
Canned production generally accounted for a third or more of the total sockeye production volume prior to
2008. Since 2010, the canned product form has averaged just 20 percent of total sockeye production volume.
This has resulted in a downward cycle where less supply results in higher canned prices, leading to less shelf
space at retail; which reduces demand and supply even further. The progression and implications of this cycle
are explained in greater detail in the Sockeye Market Analysis section.
Revitalizing Alaska Seafood
Diversifying sockeye markets and products was borne out of a much larger effort to revitalize a struggling
seafood industry. Alaska’s salmon industry experienced a value crisis in 2002. Prices had been in decline for
years, as canned inventories mounted and competition from farmed salmon limited prices for frozen product.
Harvests generally declined from 2000 through 2003 and the average statewide sockeye price fell by more than
a third – resulting in an extended double whammy that drained earnings from fishermen and processing
companies alike. Many fishermen and several large processors went out of business or were bought out by
other operators. Between 1999 and 2003 the number of Bristol Bay driftnet permits fished declined 24 percent
and ex-vessel value fell 59 percent. The first wholesale value of Alaska salmon fell by nearly $300 million. It was
clear that the industry would need to change dramatically if it was to survive. Tens of thousands of jobs and an
iconic, multi-billion dollar industry depended on a successful overhaul.
Shortly after taking office in late 2002 Governor Frank Murkowski launched the Fisheries Revitalization Strategy
with the goal of boosting investment and innovation in Alaska’s seafood industry. The multi-year plan created
a fish cabinet and an Alaska Fisheries Marketing Board that quickly brought together industry, government
leaders, and agencies to address the numerous challenges. However, fixing the industry’s problems would
require more than planning - it would require a lot of money.
The late Senator Ted Stevens secured $40 million in federal funding for seafood marketing and development
grants and the State of Alaska contributed $10 million to be used for salmon specifically. The $50 million funding
20
25
30
35
40
45
50
55
60
65
70
2002
2003
2004
2005
2006
2007
2008
2009
2010
2011
2012
2013
2014
2015
2016
Mill
ion
s lb
s.

Sockeye Market Report – Fall 2017 McDowell Group, Inc. Page 29
package was administered through a competitive grant program that supported marketing and development
projects for several years. Government officials wanted to ensure the funds would be used to maximum effect.
So, grants to private companies and fishermen required matching funds, greatly leveraging the original $50
million and requiring recipients to have “skin in the game.” The amount of public and private investment in
program projects totaled $116 million.
An influx of grant funding allowed fishermen to perform quality upgrades on vessels. Communities made
infrastructure improvements. Processors invested in equipment to produce new product forms, such as vacuum-
packed sockeye fillets. Direct marketers, processors, and the Alaska Seafood Marketing Institute received funds
to market seafood products to new customers, all in an effort to raise the value and public profile of Alaska’s
seafood resource.
Overall, the effort was very successful. Between 2003 and 2016, the first wholesale value of Alaska salmon has
increased by an average of $39 million per year (above 2003 levels, adjusted for inflation). The growth in value
of all Alaska seafood products has averaged $67 million per year. Bristol Bay salmon fishermen have benefitted
tremendously from the projects completed as part of the program, averaging $10 million in growth above 2003
levels (adjusted for inflation).
Of course, not all the additional value can be attributed to the revitalization grant program. Resource value
benefitted from several trends since 2003:
• A significantly weaker U.S. dollar (2003-2011), providing more favorable market conditions for Alaska
seafood
• Larger harvests of sockeye, cod, crab, and sole, although halibut harvests declined significantly since
2013
• Shift in consumer preference towards attributes associated with Alaska seafood
• Ongoing marketing activities of ASMI and RSDAs.
In addition, the industry has continued to invest significantly since the program ended in 2007. Acknowledging
the contributions of the Strategy in no way detracts from the valuable marketing/development work done prior
to 2003, during the grant period, or after. All of these efforts have collectively had a hand in raising the value of
Alaska seafood.
However, public and private sector leaders involved in the Fisheries Revitalization Strategy deserve much credit
for providing an influx of funding, creating an effective framework to deploy investment, and executing a vision
at a critical point in time.
Growing a U.S. Market for Alaska Sockeye
The share of Alaska sockeye products sold into the U.S. has nearly tripled since 2002. In value terms, the growth
has likely been even greater. Several trends converged to make this the success story it is today. First, Alaska
sockeye fishermen greatly improved fish quality by chilling their harvest. Secondly, salmon consumption was on
the rise in the U.S., largely due to increasing volumes of imported farmed salmon, but eventually many
consumers began looking for a premium, wild product from sustainable fisheries. Some were turned off by
antibiotic use in salmon farms, some objected to the use of dyes to add color to flesh, and many simply found

Sockeye Market Report – Fall 2017 McDowell Group, Inc. Page 30
they preferred the taste of wild fish. Ironically, the thing that nearly ended the Alaska salmon industry has
created a much larger niche for premium salmon products and helped pave the way for its revival.
During the mid-2000s, some Alaska sockeye processors found they could achieve higher returns by selling
frozen fillets (often vacuum-packed) to U.S. grocers or distributors. Production of Alaska sockeye fillets
quadrupled between 2005 and 2010 and the U.S. market share of sockeye products nearly doubled. Frozen
(filleted) sides have proven to be a good product for retailers and restaurants alike. They are easy to portion
and do not require retail/restaurant staff to hand fillet expensive fish where mistakes or lost yield can quickly
eat into margins. Frozen sides and portions are also convenient for consumers. Prior to 2002, Alaska processors
packed less than 2 million pounds of sockeye fillets, but now processors put up 20 to 30 million pounds per
year. Approximately a quarter of these fillets are exported, but the vast majority are sold to U.S. customers.
In more recent years, there has been a growing trend towards refreshing frozen H&G sockeye. This has increased
the available supply of sockeye products to U.S. buyers. Refresh programs, as they are called, generally work
like this:
• Local seafood distributors buy frozen H&G sockeye from Alaska processors
• Distributors thaw out frozen H&G salmon and then hand fillet them in small batches depending upon
how much their customers order
• Chilled fillets are sent as sides or portions to local restaurants and grocery stores where they are sold
from seafood cases or refrigerated bunkers
Many distributors and retailers report good success using
refreshed sockeye. Quality is generally very good, assuming the
fish were chilled after harvest and graded properly. The cost of
filleting slacked out H&G fish in the lower 48 can be less
expensive than purchasing fillet products, and most distributors
have processing staff who are skilled filleters. Plus, distributors
can sell belly trimmings and frames, or further process them
into additional products, such as scape meat.
Going forward, U.S. buyers will have the added benefit of
marketing a branded Bristol Bay sockeye product. BBRSDA has
created a compelling brand image and sales assets designed to
build value in the minds of consumers.
The popularity of Alaska sockeye among U.S. buyers has grown substantially over the past decade. U.S.
consumers can now buy high-quality sockeye virtually year-round in most major grocery stores, from the “fresh”
case or the freezer aisle. This transformation was the result of vision, execution, and investment on the part of
fishermen, processors, and government. The past, current, and future returns of these efforts is significant.
Growing Other Alaska Sockeye Markets
Alaska sockeye producers have found new markets for frozen products outside of the U.S. as well. Exports of
frozen sockeye to countries other than Japan or South Korea increased from $9 million in 2003 to $125 million

Sockeye Market Report – Fall 2017 McDowell Group, Inc. Page 31
in 2016.1 Twenty years ago, if sockeye wasn’t canned the vast majority was exported directly to Japan. Now, the
situation is much different, and the resource value is more resilient as a result.
Japan is still the largest export market for frozen sockeye by a wide margin; however, the route some of that
product takes has changed. Over 40 percent of Japan’s purchases of frozen sockeye now come from South
Korean cold storage facilities, which reportedly have lower storage costs than North American or Japanese
facilities. Product stored in ports like Busan, South Korea, create additional access to global markets. Buyers
from all over, including Japan, can bid for product stored in North America or Asia, depending on which trade
route works best for them.
Sockeye producers also have a much larger roster of buyers to do business with around the globe. As with any
commodity, generally the more buyers the better. Instead of being locked in to the Japanese market, sockeye
processors have access to buyers in Canada, Europe, and high-end niche markets elsewhere. These other
markets went from buying 9 percent of the U.S. frozen sockeye pack in 2003, to purchasing 58 percent of it in
2016 (see Table 12).
Today, Germany, China, France, the Netherlands, and Poland all import substantial volumes of Alaska sockeye.
European buyers bought $54 million of frozen sockeye in 2016, while Chinese buyers directly imported $22
million of frozen sockeye. Many European sales are made to smoked fish processors; whereas Chinese buyers
typically fillet sockeye for U.S. and European customers. As a result of this diversification, made possible through
an increase in fish quality, Alaska sockeye has a growing footprint in Europe. This is an exciting development.
Similar to the situation in the U.S. market where sockeye found appeal with farmed salmon consumers, Europe
is easily the largest salmon consuming region in the world. Growing the niche for smoked and refreshed sockeye
products in Europe is an important part of growing the resource value.
Table 12. U.S. Exports of Frozen Sockeye, by Pct. of Value, 2003 vs. 2016
Export Destination 2003 2016
Japan & South Korea 90% 43%
Canada 5% 17%
Other Countries 4% 41%
Total Export Value ($Millions) $95 $220
Note: The majority of sockeye exported to South Korea is likely re-exported to Japan. Figures may not sum. Source: NMFS Trade Data, compiled by McDowell Group.
Smaller niches in vacation destinations and high-income markets are also developing. In 2016, exporters sold
over $3 million of frozen sockeye to buyers in a dozen “high-end” niche countries.2 None of these countries
directly imported any sockeye from the U.S. in 2003. Though a small part of overall sales, these niche markets
are appealing because buyers’ have the ability to pay premium prices for high quality products. Growing supply
to these countries is less likely to require lower prices.
1 It is believed that almost all sockeye exported to South Korea is re-exported to other countries, primarily Japan. 2 The dozen countries are: Hong Kong, Singapore, Dominican Republic, Aruba, Australia, Kuwait, Cayman Islands, Costa Rica, United Arab Emirates, Saint Kitts-Nevis, and Brazil.
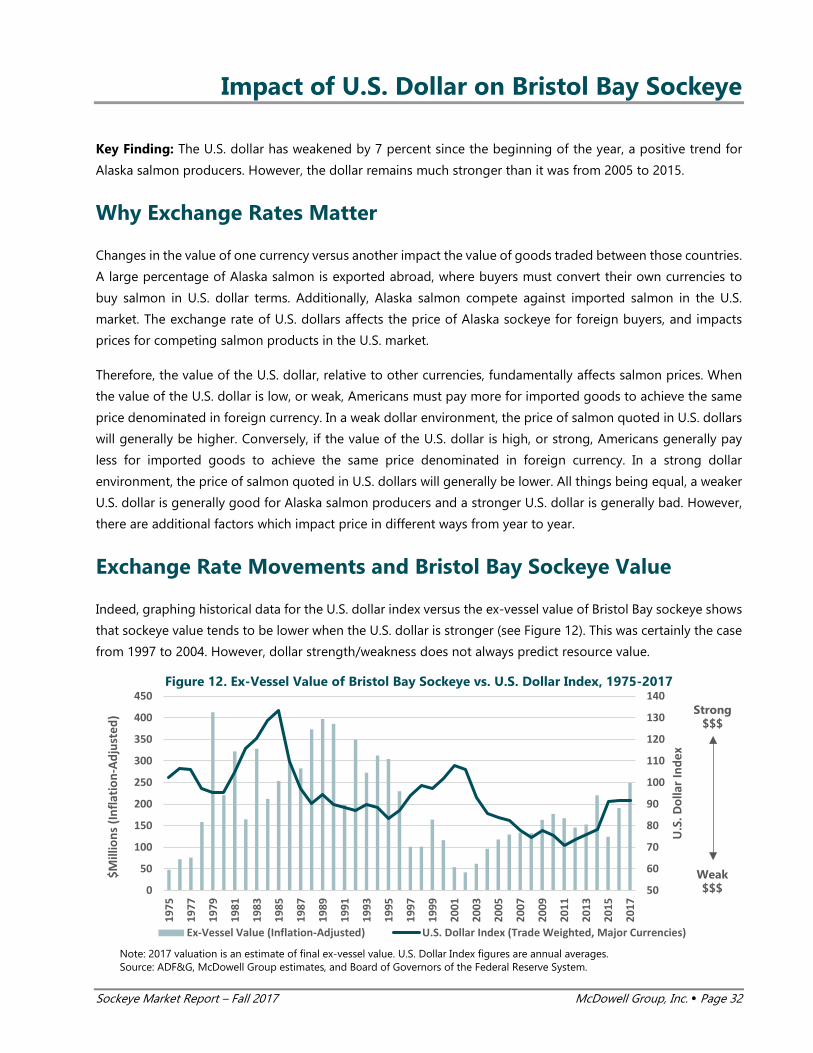
Sockeye Market Report – Fall 2017 McDowell Group, Inc. Page 32
Impact of U.S. Dollar on Bristol Bay Sockeye
Key Finding: The U.S. dollar has weakened by 7 percent since the beginning of the year, a positive trend for
Alaska salmon producers. However, the dollar remains much stronger than it was from 2005 to 2015.
Why Exchange Rates Matter
Changes in the value of one currency versus another impact the value of goods traded between those countries.
A large percentage of Alaska salmon is exported abroad, where buyers must convert their own currencies to
buy salmon in U.S. dollar terms. Additionally, Alaska salmon compete against imported salmon in the U.S.
market. The exchange rate of U.S. dollars affects the price of Alaska sockeye for foreign buyers, and impacts
prices for competing salmon products in the U.S. market.
Therefore, the value of the U.S. dollar, relative to other currencies, fundamentally affects salmon prices. When
the value of the U.S. dollar is low, or weak, Americans must pay more for imported goods to achieve the same
price denominated in foreign currency. In a weak dollar environment, the price of salmon quoted in U.S. dollars
will generally be higher. Conversely, if the value of the U.S. dollar is high, or strong, Americans generally pay
less for imported goods to achieve the same price denominated in foreign currency. In a strong dollar
environment, the price of salmon quoted in U.S. dollars will generally be lower. All things being equal, a weaker
U.S. dollar is generally good for Alaska salmon producers and a stronger U.S. dollar is generally bad. However,
there are additional factors which impact price in different ways from year to year.
Exchange Rate Movements and Bristol Bay Sockeye Value
Indeed, graphing historical data for the U.S. dollar index versus the ex-vessel value of Bristol Bay sockeye shows
that sockeye value tends to be lower when the U.S. dollar is stronger (see Figure 12). This was certainly the case
from 1997 to 2004. However, dollar strength/weakness does not always predict resource value.
Figure 12. Ex-Vessel Value of Bristol Bay Sockeye vs. U.S. Dollar Index, 1975-2017
Note: 2017 valuation is an estimate of final ex-vessel value. U.S. Dollar Index figures are annual averages. Source: ADF&G, McDowell Group estimates, and Board of Governors of the Federal Reserve System.
50
60
70
80
90
100
110
120
130
140
0
50
100
150
200
250
300
350
400
450
1975
1977
1979
1981
1983
1985
1987
1989
1991
1993
1995
1997
1999
2001
2003
2005
2007
2009
2011
2013
2015
2017
U.S
. Dol
lar I
ndex
$Mill
ions
(Inf
latio
n-Ad
just
ed)
Ex-Vessel Value (Inflation-Adjusted) U.S. Dollar Index (Trade Weighted, Major Currencies)
Strong $$$
Weak $$$
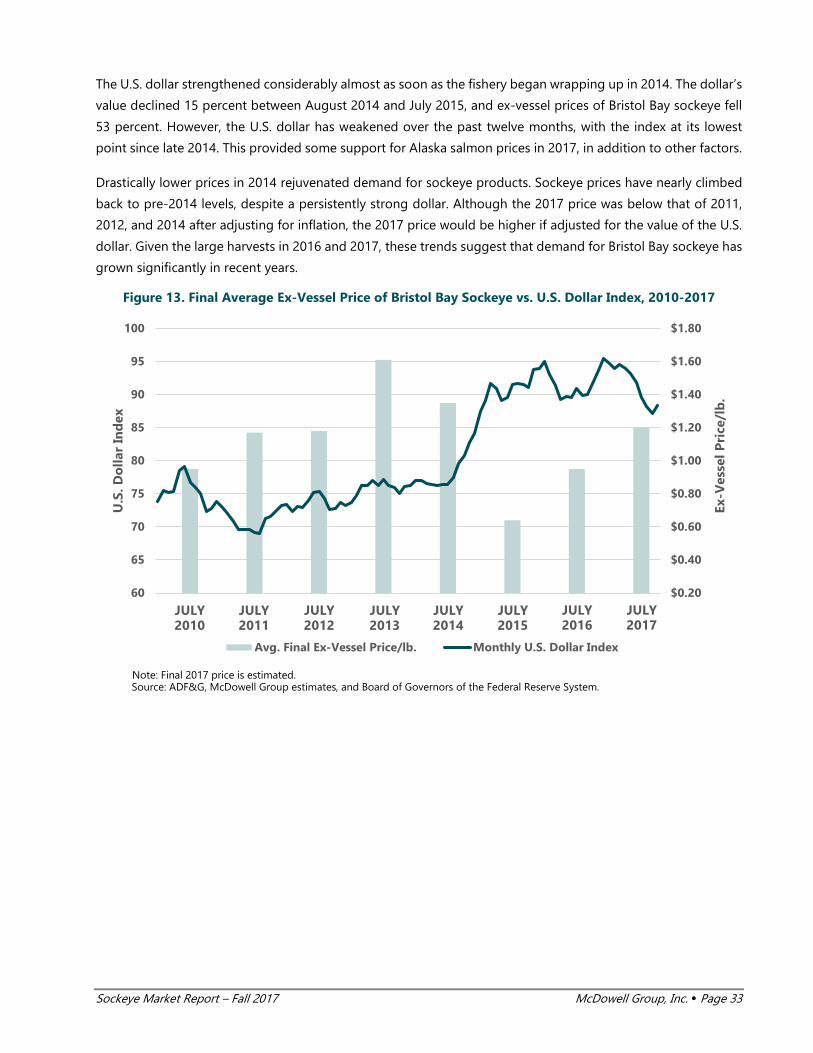
Sockeye Market Report – Fall 2017 McDowell Group, Inc. Page 33
The U.S. dollar strengthened considerably almost as soon as the fishery began wrapping up in 2014. The dollar’s
value declined 15 percent between August 2014 and July 2015, and ex-vessel prices of Bristol Bay sockeye fell
53 percent. However, the U.S. dollar has weakened over the past twelve months, with the index at its lowest
point since late 2014. This provided some support for Alaska salmon prices in 2017, in addition to other factors.
Drastically lower prices in 2014 rejuvenated demand for sockeye products. Sockeye prices have nearly climbed
back to pre-2014 levels, despite a persistently strong dollar. Although the 2017 price was below that of 2011,
2012, and 2014 after adjusting for inflation, the 2017 price would be higher if adjusted for the value of the U.S.
dollar. Given the large harvests in 2016 and 2017, these trends suggest that demand for Bristol Bay sockeye has
grown significantly in recent years.
Figure 13. Final Average Ex-Vessel Price of Bristol Bay Sockeye vs. U.S. Dollar Index, 2010-2017
Note: Final 2017 price is estimated. Source: ADF&G, McDowell Group estimates, and Board of Governors of the Federal Reserve System.
$0.20
$0.40
$0.60
$0.80
$1.00
$1.20
$1.40
$1.60
$1.80
60
65
70
75
80
85
90
95
100
Ex-V
esse
l Pri
ce/l
b.
U.S
. Do
llar
Ind
ex
Avg. Final Ex-Vessel Price/lb. Monthly U.S. Dollar Index
JULY2010
JULY2011
JULY2012
JULY2013
JULY2014
JULY2015
JULY2016
JULY2017
Sockeye Market Report – Fall 2017 McDowell Group, Inc. Page 34
Bristol Bay Sockeye Resource Value
The amount of first wholesale revenue paid to fishermen through ex-vessel prices, as well as the gross marginal
amount retained by processors provide strong clues as to the future direction of ex-vessel prices and/or value.
KEY FINDINGS:
• Net processing revenue (see definition below) was the lowest on record during the 2014 harvest year,
but was the highest on record (since 2001) during the following harvest year. Net processing revenue
declined slightly in 2016, but was still the second-highest figure on record (since 2001). Figures for 2017
will not be available until next June.
• Increases in net processing revenue tends to result in higher future ex-vessel values.
Ex-Vessel and First Wholesale Accounting
Trends in processors’ cash flow have a direct bearing on ex-vessel prices. Cash flows can be tracked by
comparing first wholesale value to the ex-vessel value paid for the fish, in this case Bristol Bay sockeye. Analyzing
processing sector cash flows using ex-vessel and first wholesale data requires a few adjustments and
conventions:
1. In this chapter we focus on a calculated statistic called Net Processing Revenue, which is an
estimate of revenue earned by Bristol Bay processors for selling key sockeye products (H&G,
fillets, canned, and roe) made in the region, less the ex-vessel cost of sockeye (i.e. payments to
fishermen).
2. First wholesale sales are compiled according to a customized “sales cycle” intended to better
imitate the actual wild salmon sales season. Because first wholesale data is generally broken
into trimesters and most commercial salmon fisheries start up in May/June, we treat the period
of May through the following April as one 12-month “sales cycle.” For example, salmon caught
in July 2014 and sold by Alaska processors in February 2015 would be part of the 2014 harvest
year (also referred to as the 2014 sales cycle). Compiling the sales data in this manner, as
opposed to a calendar year basis, allows for a better comparison to ex-vessel figures.
Historical Resource Value: Ex-Vessel vs. First Wholesale
Table 14 (shown on the following page) summarizes historical first wholesale value and ex-vessel value, as well
as net processing revenue over time. Net processing value increased significantly from 2003 through 2011, but
contracted substantially between 2011 and 2014. With low ex-vessel prices paid out in 2015 and a large harvest,
net processing revenue increased sharply during the 2015 sales cycle despite lower wholesale prices. Final
figures used to calculate the 2016 season were not available at the time of publication, but available data
suggests net processing revenue increased slightly during the 2016 sales cycle despite higher ex-vessel prices.

Sockeye Market Report – Fall 2017 McDowell Group, Inc. Page 35
Higher net processing revenues in recent years have translated to an increase in sockeye prices for Bristol Bay
fishermen. Net processing revenue is an important metric for Bristol Bay fishermen. Last year’s processing
margins form the basis for next season’s working capital. Less capital means less ability to bid up the price of
fish. Further, declining net processing revenue indicates a less attractive business line, which typically results in
a lower value being placed on raw materials.
Table 13. Net Processing Revenue Derived from Bristol Bay Sockeye, in $Millions, 2001-2016 Harvest
Year/Cycle First Wholesale
Value Final Ex-Vessel
Value Net Processing Revenue (NPR)
NPR Four Year Avg.
Next Year’s Ex-Vessel Value
2001 $103 $38 $65 - $32
2002 138 32 106 - 47
2003 122 47 75 - 76
2004 178 76 102 87 96
2005 180 96 84 92 110
2006 241 110 131 98 119
2007 268 119 149 116 118
2008 280 118 162 131 142
2009 340 142 198 160 177
2010 383 177 206 179 155
2011 360 155 206 193 140
2012 310 140 171 195 149
2013 291 149 142 181 217
2014 293 217 76 149 121
2015 355 121 233 156 191
2016* 430 191 239 173 248
*2016 and 2017 figures are estimated. Final data was not yet available at time of publication. Note: NPR = Net Processing Revenue (see definition on page 34). Source: ADF&G, ADOR, and McDowell Group estimates.
Processors, like fishermen, understand the inherent variability of a business dependent on wild salmon runs.
Some years can bring windfall profits while others may produce poor returns or even result in operating losses.
The important thing for both sectors is that over time, revenues exceed costs by a higher enough margin to
keep the fishery healthy from a financial perspective. The four-year average net processing revenue on Bristol
Bay sockeye has rebounded strongly since 2014. In fact, recent data suggests the value of the fishery for
fishermen and processors is at its highest point in many years. The efforts of fishermen to improve quality while
maintaining harvest capacity, processors’ investment in market/product development, as well as the work of
marketing organizations like BBRSDA and ASMI have been major factors in the fishery’s resurgence, in addition
to some better fortune with regard to market forces.
Net processing revenue for the 2017 season will not be known until that product has been sold. Typically, that
data becomes available next June. First wholesale prices are up significantly during these early stages of the
(wholesale) sales season, but will have to maintain those levels in order to pay for the increase in ex-vessel
payments to fishermen.
As with all historical analyses, comparing net processing revenues over time does not adjust for the changes in
other operating costs. Investment in new processing plants or product lines are costs that must be paid for
through higher fish values. Likewise, the cost of processing labor is not static. An analysis of labor statistics
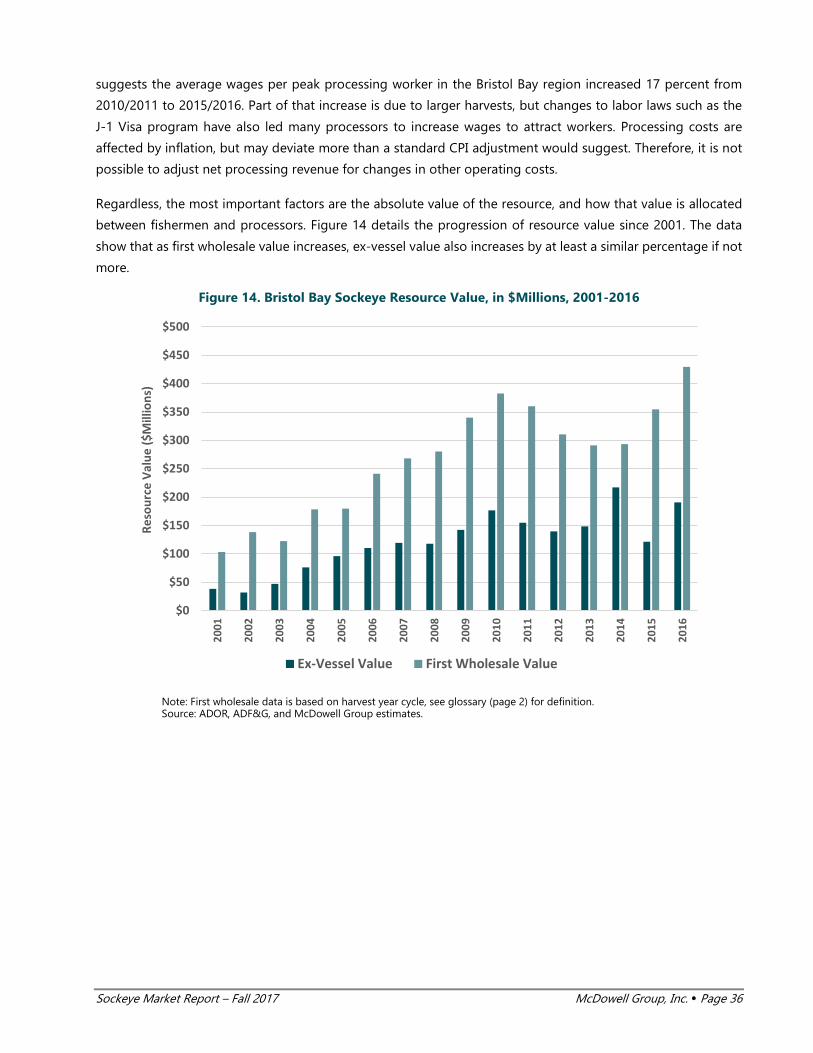
Sockeye Market Report – Fall 2017 McDowell Group, Inc. Page 36
suggests the average wages per peak processing worker in the Bristol Bay region increased 17 percent from
2010/2011 to 2015/2016. Part of that increase is due to larger harvests, but changes to labor laws such as the
J-1 Visa program have also led many processors to increase wages to attract workers. Processing costs are
affected by inflation, but may deviate more than a standard CPI adjustment would suggest. Therefore, it is not
possible to adjust net processing revenue for changes in other operating costs.
Regardless, the most important factors are the absolute value of the resource, and how that value is allocated
between fishermen and processors. Figure 14 details the progression of resource value since 2001. The data
show that as first wholesale value increases, ex-vessel value also increases by at least a similar percentage if not
more.
Figure 14. Bristol Bay Sockeye Resource Value, in $Millions, 2001-2016
Note: First wholesale data is based on harvest year cycle, see glossary (page 2) for definition. Source: ADOR, ADF&G, and McDowell Group estimates.
$0
$50
$100
$150
$200
$250
$300
$350
$400
$450
$500
2001
2002
2003
2004
2005
2006
2007
2008
2009
2010
2011
2012
2013
2014
2015
2016
Reso
urce
Val
ue ($
Mill
ions
)
Ex-Vessel Value First Wholesale Value
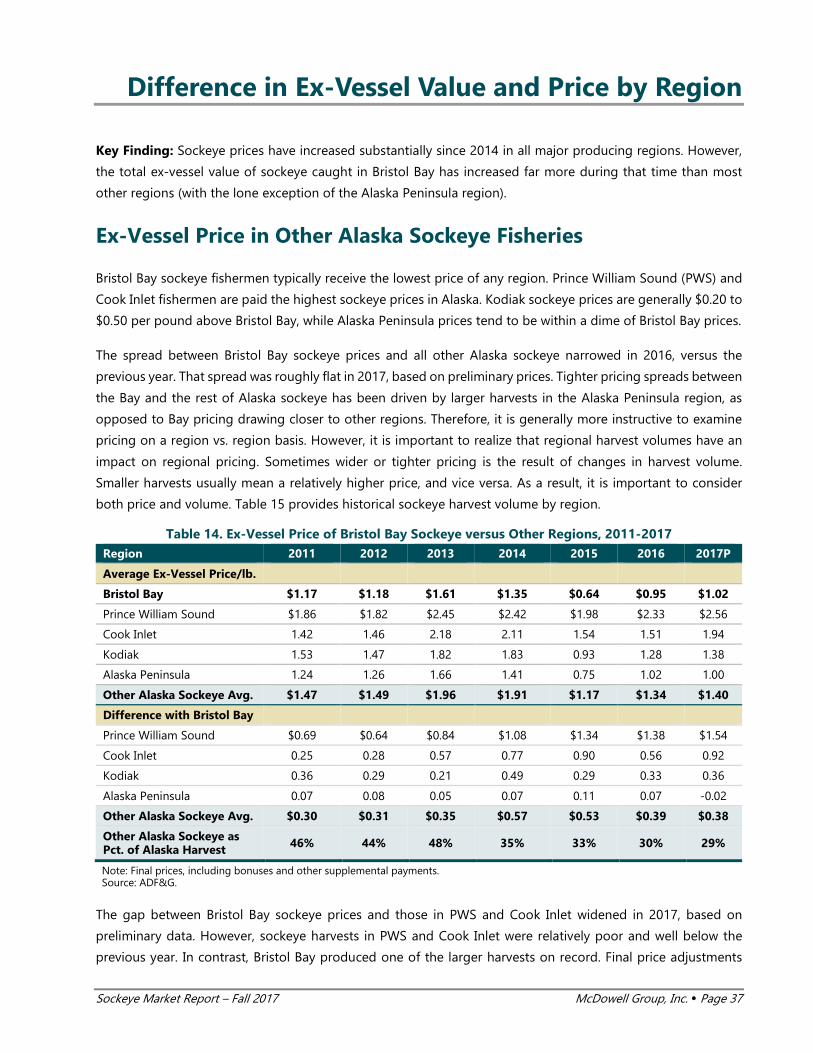
Sockeye Market Report – Fall 2017 McDowell Group, Inc. Page 37
Difference in Ex-Vessel Value and Price by Region
Key Finding: Sockeye prices have increased substantially since 2014 in all major producing regions. However,
the total ex-vessel value of sockeye caught in Bristol Bay has increased far more during that time than most
other regions (with the lone exception of the Alaska Peninsula region).
Ex-Vessel Price in Other Alaska Sockeye Fisheries
Bristol Bay sockeye fishermen typically receive the lowest price of any region. Prince William Sound (PWS) and
Cook Inlet fishermen are paid the highest sockeye prices in Alaska. Kodiak sockeye prices are generally $0.20 to
$0.50 per pound above Bristol Bay, while Alaska Peninsula prices tend to be within a dime of Bristol Bay prices.
The spread between Bristol Bay sockeye prices and all other Alaska sockeye narrowed in 2016, versus the
previous year. That spread was roughly flat in 2017, based on preliminary prices. Tighter pricing spreads between
the Bay and the rest of Alaska sockeye has been driven by larger harvests in the Alaska Peninsula region, as
opposed to Bay pricing drawing closer to other regions. Therefore, it is generally more instructive to examine
pricing on a region vs. region basis. However, it is important to realize that regional harvest volumes have an
impact on regional pricing. Sometimes wider or tighter pricing is the result of changes in harvest volume.
Smaller harvests usually mean a relatively higher price, and vice versa. As a result, it is important to consider
both price and volume. Table 15 provides historical sockeye harvest volume by region.
Table 14. Ex-Vessel Price of Bristol Bay Sockeye versus Other Regions, 2011-2017
Region 2011 2012 2013 2014 2015 2016 2017P
Average Ex-Vessel Price/lb.
Bristol Bay $1.17 $1.18 $1.61 $1.35 $0.64 $0.95 $1.02
Prince William Sound $1.86 $1.82 $2.45 $2.42 $1.98 $2.33 $2.56
Cook Inlet 1.42 1.46 2.18 2.11 1.54 1.51 1.94
Kodiak 1.53 1.47 1.82 1.83 0.93 1.28 1.38
Alaska Peninsula 1.24 1.26 1.66 1.41 0.75 1.02 1.00
Other Alaska Sockeye Avg. $1.47 $1.49 $1.96 $1.91 $1.17 $1.34 $1.40
Difference with Bristol Bay
Prince William Sound $0.69 $0.64 $0.84 $1.08 $1.34 $1.38 $1.54
Cook Inlet 0.25 0.28 0.57 0.77 0.90 0.56 0.92
Kodiak 0.36 0.29 0.21 0.49 0.29 0.33 0.36
Alaska Peninsula 0.07 0.08 0.05 0.07 0.11 0.07 -0.02
Other Alaska Sockeye Avg. $0.30 $0.31 $0.35 $0.57 $0.53 $0.39 $0.38
Other Alaska Sockeye as Pct. of Alaska Harvest 46% 44% 48% 35% 33% 30% 29%
Note: Final prices, including bonuses and other supplemental payments. Source: ADF&G.
The gap between Bristol Bay sockeye prices and those in PWS and Cook Inlet widened in 2017, based on
preliminary data. However, sockeye harvests in PWS and Cook Inlet were relatively poor and well below the
previous year. In contrast, Bristol Bay produced one of the larger harvests on record. Final price adjustments
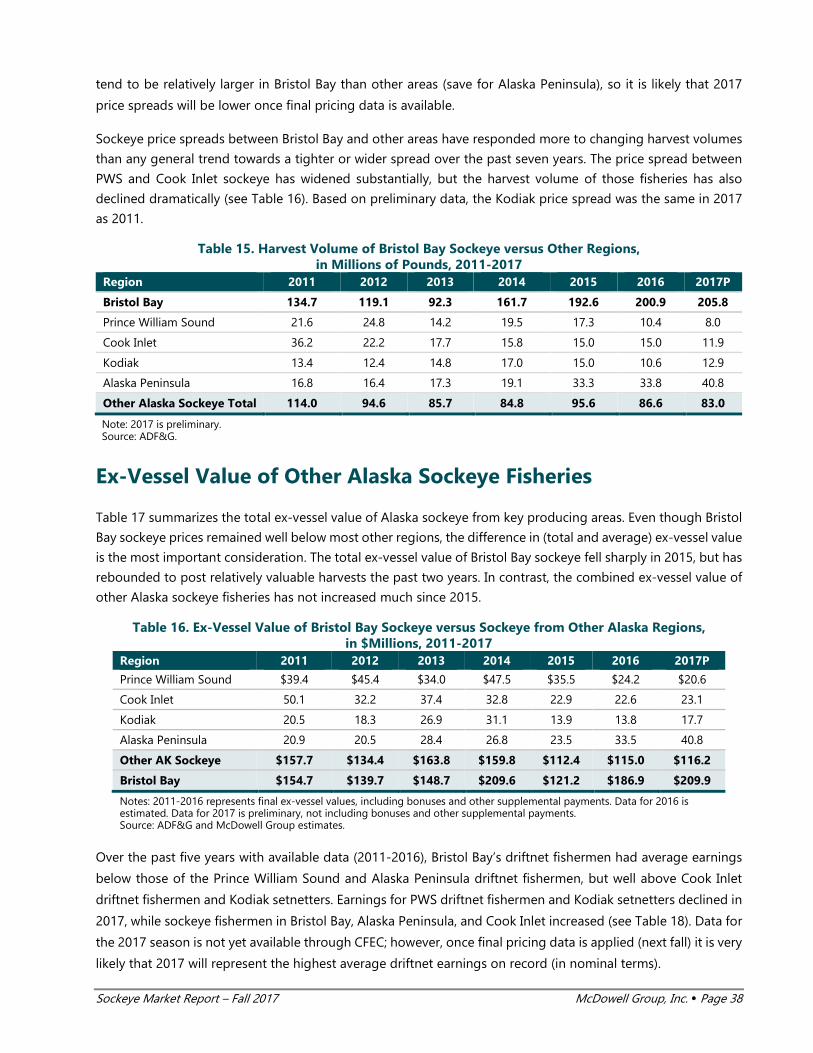
Sockeye Market Report – Fall 2017 McDowell Group, Inc. Page 38
tend to be relatively larger in Bristol Bay than other areas (save for Alaska Peninsula), so it is likely that 2017
price spreads will be lower once final pricing data is available.
Sockeye price spreads between Bristol Bay and other areas have responded more to changing harvest volumes
than any general trend towards a tighter or wider spread over the past seven years. The price spread between
PWS and Cook Inlet sockeye has widened substantially, but the harvest volume of those fisheries has also
declined dramatically (see Table 16). Based on preliminary data, the Kodiak price spread was the same in 2017
as 2011.
Table 15. Harvest Volume of Bristol Bay Sockeye versus Other Regions, in Millions of Pounds, 2011-2017
Region 2011 2012 2013 2014 2015 2016 2017P
Bristol Bay 134.7 119.1 92.3 161.7 192.6 200.9 205.8
Prince William Sound 21.6 24.8 14.2 19.5 17.3 10.4 8.0
Cook Inlet 36.2 22.2 17.7 15.8 15.0 15.0 11.9
Kodiak 13.4 12.4 14.8 17.0 15.0 10.6 12.9
Alaska Peninsula 16.8 16.4 17.3 19.1 33.3 33.8 40.8
Other Alaska Sockeye Total 114.0 94.6 85.7 84.8 95.6 86.6 83.0
Note: 2017 is preliminary. Source: ADF&G.
Ex-Vessel Value of Other Alaska Sockeye Fisheries
Table 17 summarizes the total ex-vessel value of Alaska sockeye from key producing areas. Even though Bristol
Bay sockeye prices remained well below most other regions, the difference in (total and average) ex-vessel value
is the most important consideration. The total ex-vessel value of Bristol Bay sockeye fell sharply in 2015, but has
rebounded to post relatively valuable harvests the past two years. In contrast, the combined ex-vessel value of
other Alaska sockeye fisheries has not increased much since 2015.
Table 16. Ex-Vessel Value of Bristol Bay Sockeye versus Sockeye from Other Alaska Regions, in $Millions, 2011-2017
Region 2011 2012 2013 2014 2015 2016 2017P
Prince William Sound $39.4 $45.4 $34.0 $47.5 $35.5 $24.2 $20.6
Cook Inlet 50.1 32.2 37.4 32.8 22.9 22.6 23.1
Kodiak 20.5 18.3 26.9 31.1 13.9 13.8 17.7
Alaska Peninsula 20.9 20.5 28.4 26.8 23.5 33.5 40.8
Other AK Sockeye $157.7 $134.4 $163.8 $159.8 $112.4 $115.0 $116.2
Bristol Bay $154.7 $139.7 $148.7 $209.6 $121.2 $186.9 $209.9
Notes: 2011-2016 represents final ex-vessel values, including bonuses and other supplemental payments. Data for 2016 is estimated. Data for 2017 is preliminary, not including bonuses and other supplemental payments. Source: ADF&G and McDowell Group estimates.
Over the past five years with available data (2011-2016), Bristol Bay’s driftnet fishermen had average earnings
below those of the Prince William Sound and Alaska Peninsula driftnet fishermen, but well above Cook Inlet
driftnet fishermen and Kodiak setnetters. Earnings for PWS driftnet fishermen and Kodiak setnetters declined in
2017, while sockeye fishermen in Bristol Bay, Alaska Peninsula, and Cook Inlet increased (see Table 18). Data for
the 2017 season is not yet available through CFEC; however, once final pricing data is applied (next fall) it is very
likely that 2017 will represent the highest average driftnet earnings on record (in nominal terms).

Sockeye Market Report – Fall 2017 McDowell Group, Inc. Page 39
Table 17. Ex-Vessel Value of Bristol Bay Driftnet Fishery versus Other Alaska Sockeye Fisheries, Average Gross Earnings per Active Permit, 2011-2016
Region 2011 2012 2013 2014 2015 2016E 2011-2016 Avg.
Pr. William Sound (S03E) $97,774 $115,502 $99,087 $104,137 $72,747 $66,539 $92,631
Cook Inlet (S03H) 65,753 61,586 50,868 44,148 20,158 26,239 44,792
Kodiak (S04K) 32,200 55,591 62,797 61,369 30,862 23,145 44,327
Alaska Peninsula (S03M) 79,766 85,071 109,085 124,388 83,262 108,297 98,312
Bristol Bay Drift (S03T) $86,325 $77,954 $85,687 $118,241 $67,885 $104,000 $86,213
Bristol Bay Setnet (S04T) $31,173 $28,008 $28,210 $44,912 $22,852 $45,200 $31,833
Notes: 2016 figures for non-Bristol Bay fisheries are preliminary (non-Bay figures) and may not include all bonuses. Final 2016 figures for Bristol Bay have been estimated. Source: CFEC and McDowell Group estimates.
See Table 19 in the Appendix (page 41) for an expanded account of historical performance in the Bristol Bay
driftnet fishery, including average gross earnings, active permits, and harvests.
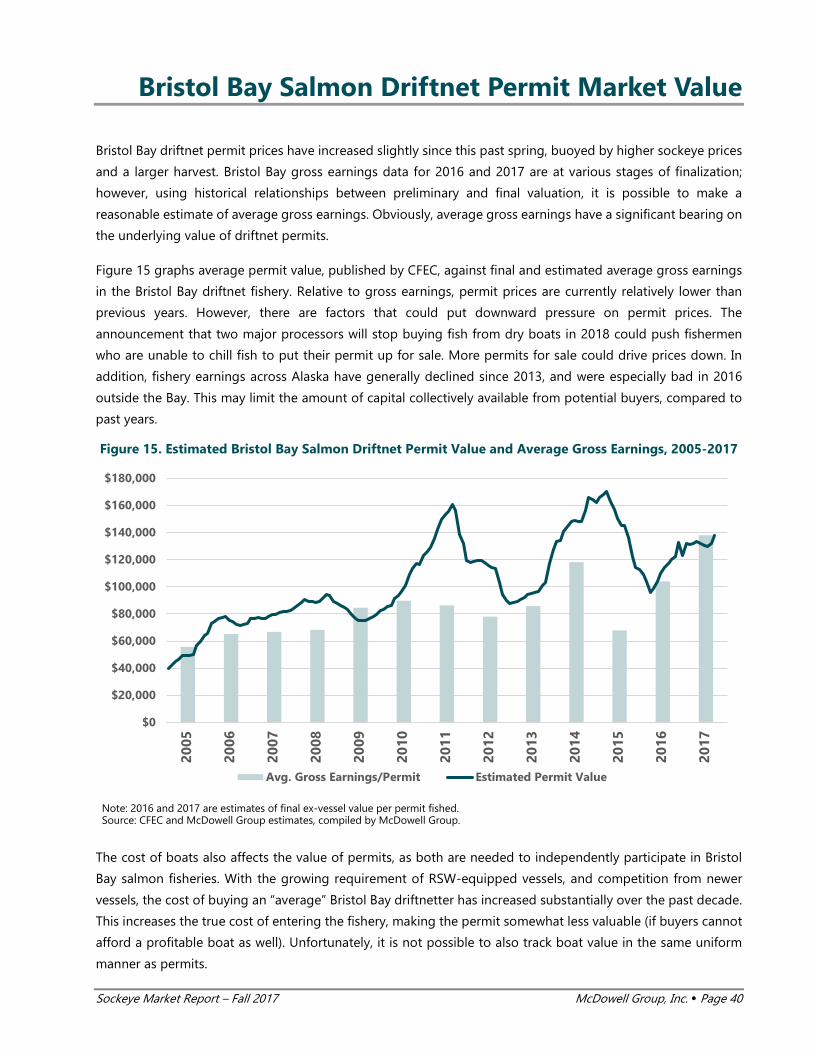
Sockeye Market Report – Fall 2017 McDowell Group, Inc. Page 40
Bristol Bay Salmon Driftnet Permit Market Value
Bristol Bay driftnet permit prices have increased slightly since this past spring, buoyed by higher sockeye prices
and a larger harvest. Bristol Bay gross earnings data for 2016 and 2017 are at various stages of finalization;
however, using historical relationships between preliminary and final valuation, it is possible to make a
reasonable estimate of average gross earnings. Obviously, average gross earnings have a significant bearing on
the underlying value of driftnet permits.
Figure 15 graphs average permit value, published by CFEC, against final and estimated average gross earnings
in the Bristol Bay driftnet fishery. Relative to gross earnings, permit prices are currently relatively lower than
previous years. However, there are factors that could put downward pressure on permit prices. The
announcement that two major processors will stop buying fish from dry boats in 2018 could push fishermen
who are unable to chill fish to put their permit up for sale. More permits for sale could drive prices down. In
addition, fishery earnings across Alaska have generally declined since 2013, and were especially bad in 2016
outside the Bay. This may limit the amount of capital collectively available from potential buyers, compared to
past years.
Figure 15. Estimated Bristol Bay Salmon Driftnet Permit Value and Average Gross Earnings, 2005-2017
Note: 2016 and 2017 are estimates of final ex-vessel value per permit fished. Source: CFEC and McDowell Group estimates, compiled by McDowell Group.
The cost of boats also affects the value of permits, as both are needed to independently participate in Bristol
Bay salmon fisheries. With the growing requirement of RSW-equipped vessels, and competition from newer
vessels, the cost of buying an “average” Bristol Bay driftnetter has increased substantially over the past decade.
This increases the true cost of entering the fishery, making the permit somewhat less valuable (if buyers cannot
afford a profitable boat as well). Unfortunately, it is not possible to also track boat value in the same uniform
manner as permits.
$0
$20,000
$40,000
$60,000
$80,000
$100,000
$120,000
$140,000
$160,000
$180,000
2005
2006
2007
2008
2009
2010
2011
2012
2013
2014
2015
2016
2017
Avg. Gross Earnings/Permit Estimated Permit Value
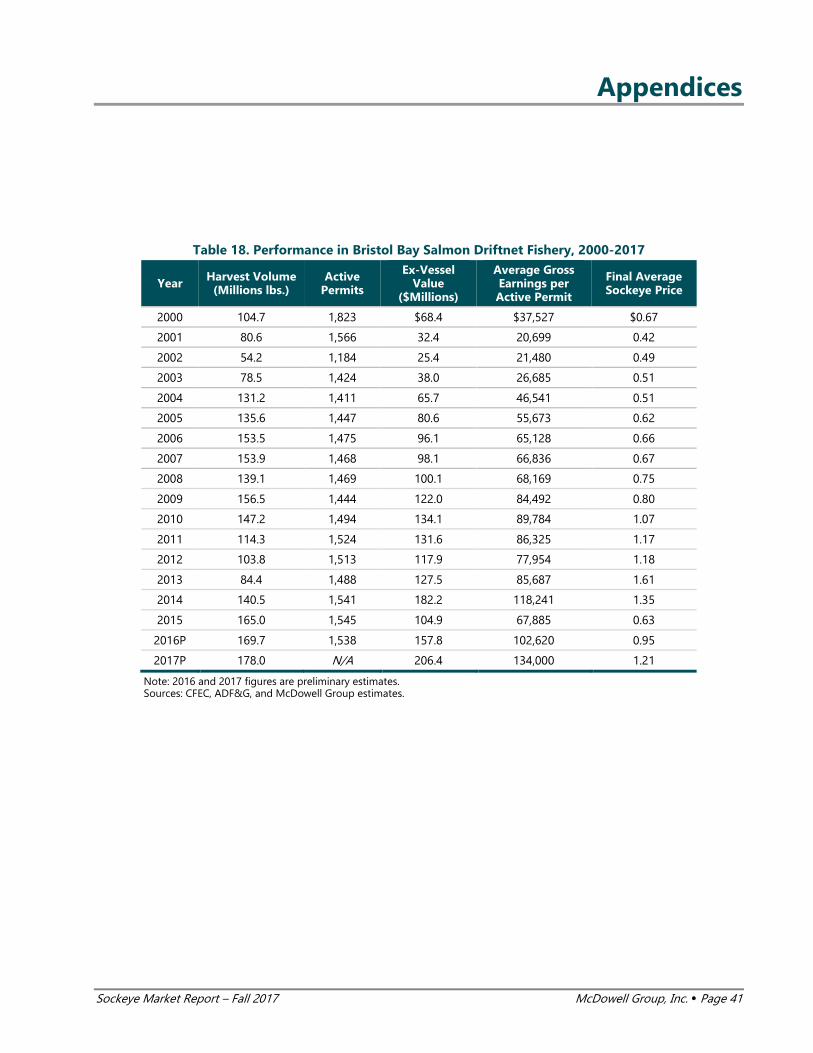
Sockeye Market Report – Fall 2017 McDowell Group, Inc. Page 41
Appendices
Table 18. Performance in Bristol Bay Salmon Driftnet Fishery, 2000-2017
Year Harvest Volume (Millions lbs.)
Active Permits
Ex-Vessel Value
($Millions)
Average Gross Earnings per Active Permit
Final Average Sockeye Price
2000 104.7 1,823 $68.4 $37,527 $0.67
2001 80.6 1,566 32.4 20,699 0.42
2002 54.2 1,184 25.4 21,480 0.49
2003 78.5 1,424 38.0 26,685 0.51
2004 131.2 1,411 65.7 46,541 0.51
2005 135.6 1,447 80.6 55,673 0.62
2006 153.5 1,475 96.1 65,128 0.66
2007 153.9 1,468 98.1 66,836 0.67
2008 139.1 1,469 100.1 68,169 0.75
2009 156.5 1,444 122.0 84,492 0.80
2010 147.2 1,494 134.1 89,784 1.07
2011 114.3 1,524 131.6 86,325 1.17
2012 103.8 1,513 117.9 77,954 1.18
2013 84.4 1,488 127.5 85,687 1.61
2014 140.5 1,541 182.2 118,241 1.35
2015 165.0 1,545 104.9 67,885 0.63
2016P 169.7 1,538 157.8 102,620 0.95
2017P 178.0 N/A 206.4 134,000 1.21
Note: 2016 and 2017 figures are preliminary estimates. Sources: CFEC, ADF&G, and McDowell Group estimates.

Sockeye Market Report – Fall 2017 McDowell Group, Inc. Page 42
Table 19. Estimated Market Value of Bristol Bay Salmon Driftnet Permits Month & Year Estimated Market Value
September 2014 $156,400
October 2014 165,500
November 2014 164,200
December 2014 162,400
January 2015 166,100
February 2015 168,100
March 2015 169,900
April 2015 163,000
May 2015 156,800
June 2015 150,500
July 2015 145,000
August 2015 145,100
September 2015 136,300
October 2015 122,000
November 2015 114,600
December 2015 112,500
January 2016 109,000
February 2016 104,200
March 2016 96,100
April 2016 98,800
May 2016 103,600
June 2016 110,000
July 2016 113,900
August 2016 117,100
September 2016 120,200
October 2016 122,400
November 2016 123,000
December 2016 132,200
January 2017 130,900
February 2017 131,100
March 2017 131,700
April 2017 133,700
May 2017 131,600
June 2017 130,600
July 2017 129,500
August 2017 131,500
September 2017 138,100
Note: Permit values based on value of permits sold during listed month and prior two months. Source: CFEC.
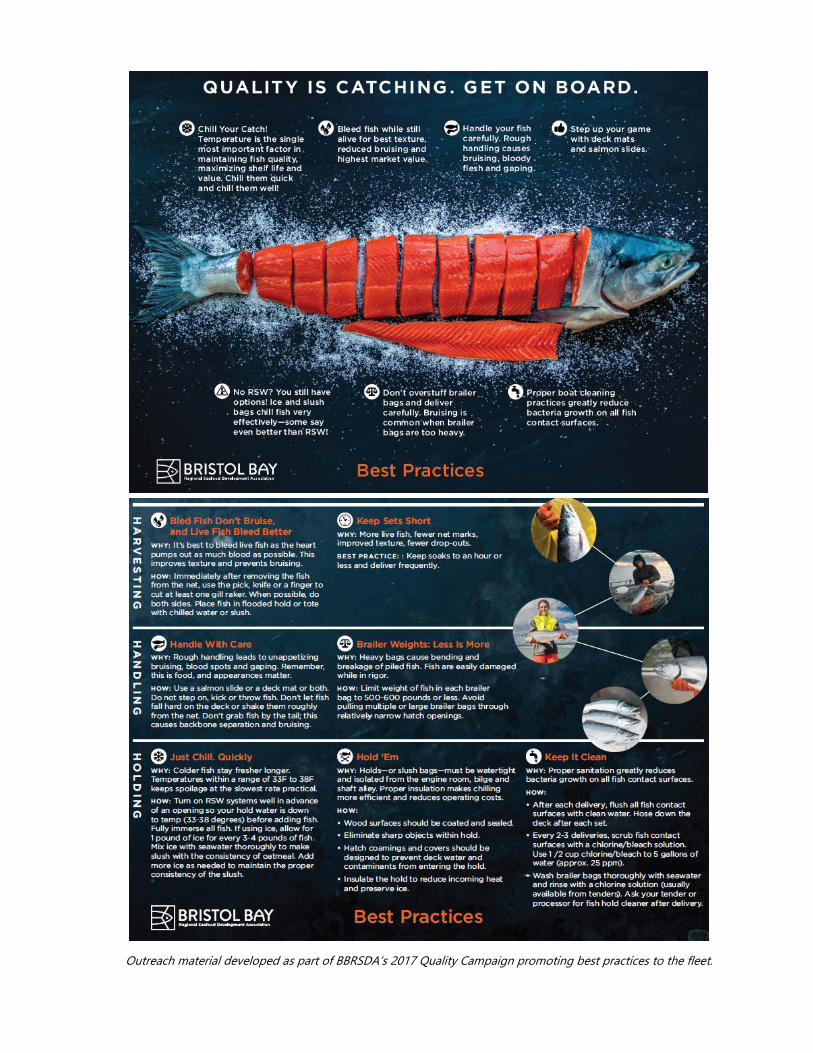
Outreach material developed as part of BBRSDA’s 2017 Quality Campaign promoting best practices to the fleet.
Top Related