


Languages
Pages
Legal


UNLV Theses, Dissertations, Professional Papers, and Capstones
5-1-2014
Smart Data Collection Using Mobile Devices To Improve Smart Data Collection Using Mobile Devices To Improve
Transportation Systems Transportation Systems
Tharindu Dasun Abeygunawardana University of Nevada, Las Vegas
Follow this and additional works at: https://digitalscholarship.unlv.edu/thesesdissertations
Part of the Computer Sciences Commons, Transportation Commons, and the Urban Studies and
Planning Commons
Repository Citation Repository Citation Abeygunawardana, Tharindu Dasun, "Smart Data Collection Using Mobile Devices To Improve Transportation Systems" (2014). UNLV Theses, Dissertations, Professional Papers, and Capstones. 2052. http://dx.doi.org/10.34917/5836071
This Thesis is protected by copyright and/or related rights. It has been brought to you by Digital Scholarship@UNLV with permission from the rights-holder(s). You are free to use this Thesis in any way that is permitted by the copyright and related rights legislation that applies to your use. For other uses you need to obtain permission from the rights-holder(s) directly, unless additional rights are indicated by a Creative Commons license in the record and/or on the work itself. This Thesis has been accepted for inclusion in UNLV Theses, Dissertations, Professional Papers, and Capstones by an authorized administrator of Digital Scholarship@UNLV. For more information, please contact [email protected].

SMART DATA COLLECTION USING MOBILE DEVICES TO IMPROVE
TRANSPORTATION SYSTEMS
by
Tharindu D. Abeygunawardana
Bachelor of Science (B.Sc.)
University of Nevada, Las Vegas
2010
A thesis submitted in partial fulfillment of
the requirements for the
Master of Science – Computer Science
Department of Computer Science
Howard R. Hughes College of Engineering
The Graduate College
University of Nevada, Las Vegas
May 2014

c� Tharindu D. Abeygunawardana, 2014
All Rights Reserved
�
7+(�*5$'8$7(�&2//(*(
:H�UHFRPPHQG�WKH�WKHVLV�SUHSDUHG�XQGHU�RXU�VXSHUYLVLRQ�E\�
7KDULQGX�'��$EH\JXQDZDUGDQD
HQWLWOHG�
6PDUW�'DWD�&ROOHFWLRQ�8VLQJ�0RELOH�'HYLFHV�WR�,PSURYH�7UDQVSRUWDWLRQ�6\VWHPV
LV�DSSURYHG�LQ�SDUWLDO�IXOILOOPHQW�RI�WKH�UHTXLUHPHQWV�IRU�WKH�GHJUHH�RI
0DVWHU�RI�6FLHQFH�LQ�&RPSXWHU�6FLHQFH'HSDUWPHQW�RI�&RPSXWHU�6FLHQFH
.D]HP�7DJKYD��3K�'���&RPPLWWHH�&KDLU
-RKQ�0LQRU��3K�'���&RPPLWWHH�0HPEHU
-DQ�3HGHUVHQ��3K�'���&RPPLWWHH�0HPEHU
(PPD�(��5HJHQWRYD��3K�'���*UDGXDWH�&ROOHJH�5HSUHVHQWDWLYH
.DWKU\Q�+DXVEHFN�.RUJDQ��3K�'���,QWHULP�'HDQ�RI�WKH�*UDGXDWH�&ROOHJH
0D\�����
LL

Abstract
Travel time is a matter that a↵ects most of us, especially those that live in highly congested cities.
Ideally, we want to reduce travel time as much as possible, thereby freeing up more of our time
and enabling a higher quality of life. Data collection of transportation metrics helps us get a
clearer picture of the transportation system, and helps us make smarter choices when it comes
to improving the existing system. The rapid emergence of interconnected mobile devices carried
along by travelers opens up many possibilities for gathering data as they travel, and also to serve
them relevant data so that they can make smarter choices when it comes to their traveling. It is
estimated that the market share of smartphones would continue to grow for the foreseeable future,
making it a rich source for data collection at large scale. Therefore, with the goal of minimizing
travel time in mind, we explore various means of making use of these mobile devices to collect
data and ultimately improve transportation systems. In particular, we report on the evolution of
data collection in the area of transportation research, report on novel case studies in this area, and
report in depth on one implementation of a smart data collection application.
iii

Acknowledgements
I would like to thank Dr. Taghva for his guidance, patience, and support throughout the project.
Dr. Taghva gave me the basis to start working on the application that is discussed in this paper,
and was helpful in working through the challenges in the project. I would also like to thank my
father for showing me the value of education, discipline, and humility. I would like to thank my
mother for her continued support and encouragement to complete my studies. Finally, I would
like to thank many friends that listened to what I was working on, gave back encouragement and
ideas, and helped me proofread the paper.
Tharindu D. Abeygunawardana
University of Nevada, Las Vegas
May 2014
iv

Table of Contents
Abstract iii
Acknowledgements iv
Table of Contents v
List of Tables vii
List of Figures viii
Chapter 1 Introduction 1
Chapter 2 Background 3
2.1 Smart Data Collection . . . . . . . . . . . . . . . . . . . . . . . . . . . . . . . . . . 3
2.2 Manual Data Collection Strategies . . . . . . . . . . . . . . . . . . . . . . . . . . . 5
2.3 Tra�c Monitoring using Cell Tower Information . . . . . . . . . . . . . . . . . . . 8
2.4 DOT Implementations . . . . . . . . . . . . . . . . . . . . . . . . . . . . . . . . . . 9
Chapter 3 Case Studies 11
3.1 Mobile Millennium & Mobile Century Field Experiment . . . . . . . . . . . . . . . 11
3.2 Google Maps Tra�c Estimates . . . . . . . . . . . . . . . . . . . . . . . . . . . . . 13
3.3 Nericell . . . . . . . . . . . . . . . . . . . . . . . . . . . . . . . . . . . . . . . . . . 14
3.4 ParkSense . . . . . . . . . . . . . . . . . . . . . . . . . . . . . . . . . . . . . . . . . 16
3.5 Predicting Bus Arrival Time . . . . . . . . . . . . . . . . . . . . . . . . . . . . . . . 18
Chapter 4 NDOT Smart Data Collection Application 21
4.1 Design & Implementation . . . . . . . . . . . . . . . . . . . . . . . . . . . . . . . . 22
4.1.1 Application Architecture Overview . . . . . . . . . . . . . . . . . . . . . . . 23
4.1.2 Tools and Technologies . . . . . . . . . . . . . . . . . . . . . . . . . . . . . 24
4.1.3 Client Side Mobile Application . . . . . . . . . . . . . . . . . . . . . . . . . 25
4.1.4 Server Side Web Service . . . . . . . . . . . . . . . . . . . . . . . . . . . . . 27
v

4.1.5 Live Incident Reports Map . . . . . . . . . . . . . . . . . . . . . . . . . . . 33
4.2 Test Setup . . . . . . . . . . . . . . . . . . . . . . . . . . . . . . . . . . . . . . . . . 35
4.3 Test Results . . . . . . . . . . . . . . . . . . . . . . . . . . . . . . . . . . . . . . . . 36
4.4 Analysis . . . . . . . . . . . . . . . . . . . . . . . . . . . . . . . . . . . . . . . . . . 37
4.5 Future Works . . . . . . . . . . . . . . . . . . . . . . . . . . . . . . . . . . . . . . . 38
Chapter 5 Conclusion 40
Appendix A NDOT Application Screenshots 42
Appendix B NDOT Application Source Code 46
Bibliography 47
Vita 50
vi

List of Tables
4.1 Test results for incident involving two actors. . . . . . . . . . . . . . . . . . . . . . . . 36
4.2 Test results for incident involving three actors. . . . . . . . . . . . . . . . . . . . . . . 36
4.3 Test results for incident involving one actor. . . . . . . . . . . . . . . . . . . . . . . . . 36
vii

List of Figures
2.1 Inductive Loop Detector. . . . . . . . . . . . . . . . . . . . . . . . . . . . . . . . . . . 6
3.1 Google Maps Tra�c Estimates. . . . . . . . . . . . . . . . . . . . . . . . . . . . . . . . 14
4.1 SR1 Form, Report of Tra�c Accident. . . . . . . . . . . . . . . . . . . . . . . . . . . . 22
4.2 Architectural overview of the application. . . . . . . . . . . . . . . . . . . . . . . . . . 23
4.3 Location View Markup. . . . . . . . . . . . . . . . . . . . . . . . . . . . . . . . . . . . 25
4.4 Code snippet to open a new view. . . . . . . . . . . . . . . . . . . . . . . . . . . . . . 26
4.5 Client side mobile application sequence diagram. . . . . . . . . . . . . . . . . . . . . . 27
4.6 Server side web service sequence diagram. . . . . . . . . . . . . . . . . . . . . . . . . . 28
4.7 Sr1ClientFormData model object. . . . . . . . . . . . . . . . . . . . . . . . . . . . . . 28
4.8 NV Driver License barcode encoding. . . . . . . . . . . . . . . . . . . . . . . . . . . . . 30
4.9 Unit test to test form gets processed correctly for a valid request. . . . . . . . . . . . . 31
4.10 Live incident reports map on a mobile phone. . . . . . . . . . . . . . . . . . . . . . . . 33
4.11 Code snippet showing server calling JavaScript client method. . . . . . . . . . . . . . . 34
4.12 Chart showing data entry method vs completion time. Data from table 4.1. . . . . . 37
4.13 Chart showing average completion time for each of the data entry methods as a per-
centage. Data from table 4.2. . . . . . . . . . . . . . . . . . . . . . . . . . . . . . . . . 38
A.1 Home screen of the app, start point for the SR1 form. . . . . . . . . . . . . . . . . . . 42
A.2 Location screen where the user inputs location of the incident. . . . . . . . . . . . . . 43
A.3 Actors screen showing all of the actors involved in the tra�c incident. . . . . . . . . . 43
A.4 Actor detail screen where the user inputs details of the actor. . . . . . . . . . . . . . . 44
A.5 User can manually input details of the actor as well. . . . . . . . . . . . . . . . . . . . 44
A.6 History screen showing a summary of previously submitted form data. . . . . . . . . . 45
A.7 History detail screen showing the full form data. . . . . . . . . . . . . . . . . . . . . . 45
viii

Chapter 1
Introduction
The prevalence of smart mobile devices among motorists opens up possibilities for improving trans-
portation systems. These mobile devices are equipped with many instruments for data gathering,
some of which include the GPS chip, proximity sensor, ambient light sensor, accelerometer, mag-
netometer, and gyroscope [1]. Some areas for improvement we consider in this paper include using
the phone directly as a data input device instead of using paper forms, using real time data from
the phone’s GPS to monitor tra�c instead of expensive sensors installed on roadways, and usage
of smartphone sensors to get a more realistic and accurate picture of the transportation system.
The approach taken in this study was to research and report on case studies involving the usage of
smartphone sensor data to improve transportation systems, and then describe one implementation
of a smart data collection application.
This area of research is interesting because smartphone usage is increasing, the cost of data
connection is decreasing, the speed of data connection is increasing, and roadway congestion con-
tinues to be a major problem in highly populated areas. Even a small improvement in travel time
can have a huge impact on the overall transportation system, and can bring big savings in resources
for the entire population. It is relatively expensive to install physical devices on roadways, while
smartphone data can reduce the costs and also give more accurate predictions. Furthermore, the
usage of smartphone data to replace already existing roadside sensors can reduce maintenance
costs for the governing authorities in the long run. Additionally the increase in the amount of
sensor data available increases the demand for smarter ways of collecting the data and processing
it for useful purposes. There are still too many cases where pen and paper are used as the means
of data gathering, when it is much more e�cient to make use of mobile devices.
In chapter two we give a summary of previous work in the literature, and explore the sub-
ject of smart data collection as it pertains to transportation research. We briefly explore various
means of smart data collection methods that have been used in the past, including the usage
1

of radio frequency identification transponders, automatic license plate recognition systems, GPS
and/or Automatic Vehicle Location technology built into existing fleets of vehicles, GPS enabled
smartphone, and wireless sensor nodes. Manual data collection strategies that were used for many
decades in the past are also discussed to compare and contrast with the newer methods that
are being implemented. Tra�c monitoring using existing cell tower information is also consid-
ered because of its potential to be used for tra�c monitoring even without smartphones with
data connections. Finally, we report on various projects that were already implemented by state
transportation departments to make use of smartphones to improve transportation systems.
In chapter three we report a bit more in depth on five very impressive case studies in the use of
smartphones to improve transportation systems. ParkSense is an application that uses a novel Wi-
Fi signature matching technique to automatically detect when a user has vacated a parking spot.
Nericell is an application that makes use of many sensors in the phone to detect road conditions.
For instance, the accelerometer was used to detect braking, potholes, and bumps on the road,
while the microphone was used to detect honking. Mobile Millennium was a large scale joint e↵ort
by organizations from the public sector, private sector, and academia to create a system that
could use GPS traces from smartphones to give real time tra�c predictions. Much like the Mobile
Millennium project, Google tra�c estimates also make use of GPS data sent from users of their
mobile mapping applications to output real time tra�c estimates. Finally, we consider a novel
approach to predicting bus arrival times using data collected by on-board passenger smartphones.
In chapter four we discuss the implementation of a smart data collection application. The
purpose of this application was to facilitate the collection of data at tra�c incident situations by
making use of smartphones. It was expected that the implemented smart data collection application
would reduce the time taken for data collection, and increase the accuracy of the data collected.
Several experiments were conducted to help test this hypothesis. We report on the test results
from the experiments and the analysis of the results. Also discussed in this chapter is the technical
design and implementation details of the application. Finally, we report on the limitations and
problems with this solution, and consider means of overcoming the limitations and improving the
prototype so that it is reliable enough for real world use.
2

Chapter 2
Background
In this chapter, the topic of smart data collection with respect to transportation systems is defined
and explored. Manual data collection strategies are also discussed to compare and contrast with
the newer means of data collection. Previous studies and projects in this field are referenced
throughout for further research.
2.1 Smart Data Collection
In this paper, we consider that smart data collection with respect to transportation systems is to
use automated systems to collect, process, and report data. Furthermore, this paper is focused on
the usage of smartphones as the means for the data collection. This is in contrast to data collection
by means of human involvement and manual calculations.
One of the smart data collection methods in transportation systems involve using radio-
frequency identification (RFID) transponders to track travel time. Examples of such systems
include Fastrak in California and the EZ-Pass on the East Coast [2]. The system works by using
readers installed on the roadside, and when the vehicle containing the transponder crosses that
location the time is recorded. Therefore, the travel time and speed between two readers can be
measured. However, there are many disadvantages to this method, one being the high cost involved
in installing the reader, leading to poor coverage. In one study, it was estimated that the capital
cost for one detector site is between $18,000 to $38,000, and the capital cost for the operation
center between $37,000 and $86,000 [2]. Second disadvantage is that only travel time between two
locations can be obtained, even then the instantaneous velocity between the two locations cannot
be obtained. The advantage in this method is that it is a very reliable and straight-forward method
for calculating travel time and speed, and if a city already has detector sites installed for tolling
purposes, then this method is cost e�cient.
Another smart data collection method in transportation systems is the use of license plate
3

recognition (LPR) systems, where cameras deployed along the roadway use image processing tech-
niques to match up vehicles as they cross over sensors. An example of such a system is the Oregon
Department of Transportation’s (ODOT) Frontier Project [3]. In that project, the ODOT de-
ployed the video processing system with license plate recognition software on a 25 mile section
of rural highway in Oregon. A total of six license plate recognition cameras were deployed, three
in each direction, resulting in long segments between the cameras. Consequently the travel time
predictions given by the system could be very inaccurate for vehicles just entering the segment.
They compared the travel times predicted by their system to actual probe vehicles equipped with
GPS devices and found that the results were not statistically di↵erent. However, they further rec-
ommended that the system be tested in more congested tra�c conditions [3]. The disadvantages
in this system are similar to that of RFID systems. It is costly to cover a wide range. And since
travel time can only be calculated as a vehicle crosses the end goal, the conditions in the middle
of the segment cannot be accurately predicted.
Usage of Global Positioning System (GPS) devices on vehicles can be used for smart data
collection purposes. Fleets of vehicles that are already equipped with GPS or Automatic Vehicle
Location (AVL) technology such as FedEx, UPS Trucks, taxis, buses, or patrol vehicles can be used
as probes to gather travel time data. This a smart data collection method because the primary
goal of such fleets of vehicles was not to gather tra�c data, and the process of collecting the data
is automatic. In one previous study, the researchers studied using Freeway Service Patrol (FSP)
vehicles in Los Angeles County as probe vehicles. The FSP vehicles were equipped with a Mobile
Data Terminal (MDT), which gets polled by the AVL system [4]. The goal was to determine how
the data from these vehicles can actually be used for estimating tra�c conditions, how to use the
data to augment existing loop detector data, and determine infrastructural requirements that are
necessary to make things possible. The study concluded that it was di�cult or impossible to use
FSP vehicles to infer ambient speed. There was a significant di↵erence between FSP vehicle speeds
and floating car speeds, and the di↵erences in speed did not appear to be systematic [4].
Usage of GPS enabled smartphones is now one of the most promising methods of sensing tra�c
conditions. We look at several case studies that use this method later on in the paper. In addition
to speed and travel time information, other quantities like instantaneous velocity, acceleration,
and direction of travel can also be inferred [5]. The prevalence of smartphones enables a wide
area of coverage of the transportation network, and this method is foreseeable to be used at a
global scale. The main drawbacks to this method are the increased energy consumption of the
handset, and the privacy concerns of the individual sending the data. These drawbacks can be
achieved with di↵erent sampling strategies, several of which were explored in the mobile century
field experiment [5].
Wireless sensor nodes installed on road sides are another means of smart data collection. In
4

particular, the SFPark project uses wireless sensor nodes installed into asphalt at parking spots in
order to detect whether the parking spot is occupied or not [6]. Commercial vendors like Streetline
uses similar technology to show parking availability in more than 20 cities [7]. However, the
downside to these technologies is that its high cost makes it unlikely to be deployed at a large
scale. The SFPark program proposed to cover 25% of the parking spots in San Francisco at an
initial cost of $19.8 million [6]. The ParkNet project [8], proposed to install a GPS receiver and
a passenger-side-facing ultrasonic range finder on probe vehicles to detect vacant parking spots.
After conducting a trial run on 500 San Francisco taxicabs, they found that the system would
provide adequate coverage and cost savings by a factor of 10-15 compared to the SFPark project.
On the other hand, pay-by-phone parking applications, like ParkMobile [9] and PaybyPhone [10],
are gaining traction and widespread usage in many cities. These applications have some relevant
data on the usage of parking spots, but the data is not complete. There were studies that looked
to combine data from these pay-by-phone parking applications and sensor data from smartphones
to get a more accurate picture of parking availability.
Lastly, using data from automated spot speed collection devices to extrapolate tra�c speeds
and travel times could be considered another form of smart data collection. The most widely used
spot speed detection device is the inductance loop detector [11]. The inductance loop detector
system, figure 2.1 from [12], consists of wire loops wound in a shallow slot sawed in pavement, a
lead-in cable from the curbside pull box to the intersection controller cabinet, and an electronics
unit housed in a nearby controller cabinet [13]. It works by detecting a decrease in the inductance
of the loop as a vehicle passes over or stops within the detection area [13]. The most accurate
method for calculating the speed with loop detectors is to use two loop detectors in series, known
as a “speed trap.” The accuracy of this method depends on the length of the trap. According to a
study, done by the Texas Transportation Institute, the optimal length for the speed trap was 9m
(30ft) [14]. Furthermore, they found that the average error of the speed estimate was about 1.5mph
for an optimal speed trap . There are numerous other devices that are capable of collecting spot
speeds including piezoelectric sensors, infrared sensors, magnetic sensors, video tracking systems,
doppler microwave, passive acoustic sensors, and pulse ultrasonic detectors [15].
2.2 Manual Data Collection Strategies
The most basic approach used in the past was to use test vehicles in which a passenger on board
would manually record elapsed time at predefined checkpoints. The Highway Congestion Monitor-
ing Program (HICOMP), which was carried out by the California Department of Transportation
is an example of this technique [16]. The driver would vary his driving style to match either the
average car, the maximum car (traveling at speed limit unless impeded by tra�c), or floating car
5

Figure 2.1: Inductive Loop Detector.
(driver attempts to pass as many cars as cars that passed the test vehicle). The floating car method
is the most commonly used style, and the checkpoints at which data is gathered are usually spread
over 0.25 to 0.5 miles [11].
In the test vehicle method, it is important to calculate the sample size n of test vehicles needed
to get an acceptable estimate. Equation 2.1 is the standard sample size equation, where t is the
t-statistic for the specific confidence level, s is the standard deviation of travel time, and ✏ is
the maximum specified allowable error which is a percentage value in the range of 10-15 percent.
Equations 2.2 and 2.3 show the coe�cient of variation and relative allowable error respectively
where x is the mean travel time. The relative allowable error is expressed as a percentage, usually
in the range of 5-10 percent [11]. Equation 2.4 can be used if the sample size is 30 or more, and
here the z value is from the normal distribution table. After the sample size is determined, it is
important to distribute the sample runs evenly throughout the time interval [11].
Sample Size, n =
✓t ⇤ s✏
◆2
(2.1)
Coe�cient of Variation, c.v. =s
x
(2.2)
Relative Error, e =✏
x
(2.3)
Sample Size, n =⇣z ⇤ c.v.
e
⌘2(2.4)
Other statistics of interest include average travel time (equation 2.5), and average speed (equa-
tion 2.6). In these equations, n is the total number of travel times reported, and d is the vehicle
6

distance traveled.
Average Travel T ime, t =
Pn
i=1 ti
n
(2.5)
Space�Mean Speed, v
SMS
=distance traveled
avg. travel time
=n ⇤ dP
t
i
(2.6)
Furthermore, standard deviation (equation 2.7) of travel time is of interest because it provides
information about the variability of tra�c conditions.
standard deviation, s =
sPn
i=1(ti � t)2
n� 1(2.7)
The equipment used in this method of data collection typically include pen, paper, audio
recorder, portable computer, stopwatch, clipboard, data sheets, and data collection software. How-
ever, over the years there have been improvements. Distance measuring instruments (DMI) can be
used to determine travel distances. Original DMI units, in the area of transportation research, used
magnetic wheel sensors to measure revolutions. However, these instruments were not very reliable
because it had to be calibrated often, and sometimes the wheel sensors would fall o↵ or unbalance
the wheel. DMI technology was improved such that it would sense pulses from the transmission
and record the information directly using a portable laptop. The received pulse information could
be translated into distance and speed measurements. GPS devices have also been used to calculate
travel times. The GPS, which is connected to a portable computer, is used to collect latitude and
longitude data and then determine speed and distance [11].
The advantage in the manual method of data collection is that it requires no special equipment,
and it does not require a high skill level. However, there are a lot of disadvantages. There is the
labor requirement of the driver and the observer. It has a low level of detail because the data
collection is done by humans on few sample runs. Human involvement also means there is greater
room for error in collecting the data. There are also the costs involved in the test vehicle, data
entry personnel, and supervisory personnel.
Usage of aerial surveys is also a manual data collection method that has been used to measure
tra�c flow. Tra�c densities can be estimated from consecutive aerial photographs taken as a plane
flies along a corridor. Vehicles in the consecutive images can be counted, and since the distance
between the images is known, the corresponding tra�c density can be estimated. There is the
potential to automate some parts of this method. For instance, satellite imagery could be obtained,
and image processing techniques could be used to gather tra�c density information. Furthermore,
advanced image processing techniques could match or track a vehicle through consecutive images
and provide travel time estimates. In this regard, researchers at Georgia Institute of Technology
7

have been testing and studying the usage of drones to monitor tra�c conditions, and to provide
live video and sound from scenes [17].
2.3 Tra�c Monitoring using Cell Tower Information
It is worth noting that, even before the prevalence of sensor enabled smartphones, there have been
several studies that were conducted to use cell tower information to identify the location of the
handset [18], and thereby using the location changes of the handset to estimate tra�c conditions.
The studies conducted show that cell tower based location tracking is possible with GSM, CDMA,
3G, and even Analog based mobile phones. The wider the bandwidth, the more conducive it is to
calculate the location. And since the trend in telephone standards from analog to GSM/CDMA
to 3G has been to widen the bandwidth, this method of calculating position remains promising
into the future [19].
The advantage of this method is that more of the population can participate in sharing tra�c
related data because this method does not require a smartphone. It makes use of the existing
infrastructure of the cellular telephone systems, and does not require extra infrastructural costs.
In urban areas with high tra�c there tends to be more cell towers, enabling a more accurate location
estimate. Furthermore, this method is also a lot more power e�cient than GPS based tracking
methods. The major disadvantage of this technique is that it is not very accurate at locating the
device, and hence makes it di�cult to estimate speed of the motorist. In particular, instantaneous
velocity at a specific point in time is very di�cult to capture. However, it may be possible to
estimate instantaneous velocity using Doppler measurements on CDMA based phones [5].
Cell tower based tra�c monitoring is largely made possible thanks to Federal Communications
Commission’s E-911 (Phase II) mandate, which requires that wireless service providers must pro-
vide the location of the incoming wireless call to the Public Safety Answering Points (PSAPs) [20].
The accuracy of the reported location needs to be within 50 to 300 meters. For network-based
location tracking it requires an accuracy of 100 meters for 67% of the calls, and 300 meters for
95% of the calls. For handset-based location tracking it requires 50 meters for 67% of calls, and
150 meters for 95% of calls. The E-911 mandate, which was established in 1996, required that
all wireless licensees, broadband Personal Communications Services (PCS) licensees, and certain
Specialized Mobile Radio (SMR) licensees meet this requirement by October 1, 2001 [19].
There are three main methods that can be used to derive position in a cellular system; they
are signal profiling, angle-of-arrival, and timing measurements. Signal profiling matches the profile
of the received signal to a database of measured signals to get an estimate of the location. The
angle-of-arrival method calculates the angle of the received signal from the mobile device to two
or more cell towers. The resulting intersection of these angles pinpoints the location of the device.
8

The timing measurement uses the time-of-arrival of received signals to calculate the distance. The
arrival time is proportional to the travel distance of the signal. By taking timing measurements
from two or more base stations it is possible to pinpoint the location. It is possible to combine
the timing measurement technique with the angle-of-arrival technique, and derive position from a
single base station [19].
The positioning techniques discussed above can be used along with self-positioning (handset
based positioning) or remote-positioning (network based positioning). In the former, it is the
responsibility of the handset to calculate the location based on reception signals from base stations.
In the latter, it is the responsibility of the system to work in a co-operative manner to calculate
the location of the device. The advantage of self-positioning is that it preserves privacy of the
user. The main advantage of remote-positioning is that locations can be calculated on most types
of existing phones, and the users would not need to upgrade their phone. One disadvantage of
self-positioning is that it is not practical to use the signal profiling method because the device
would need to carry along a large database that needs to be continuously updated. For both of
these methods to be used for travel time estimation, there needs to be a Location Service Center
to continuously gather the resulting location information from either the network or the device,
and process it to calculate travel time [19].
2.4 DOT Implementations
The Tennessee Department of Transportation (TDOT) has implemented an intelligent transporta-
tion system called SmartWay. The system is composed of many components, including roadway
tra�c sensors, camera video surveillance, dynamic message signs, freeway service patrol vehicles,
transportation management centers, and various means of distributing information back to mo-
torists. They recently released the TDOT SmartWay mobile application for iOS and Android.
This application allows customers to monitor tra�c conditions, view live camera feeds, receive
incident notifications, and even receive Amber Alerts. The system costs about $1.3 million to
maintain annually [21].
The Federal Railroad Administration (FRA) launched an application to provide safety infor-
mation on the nation’s highway-rail grade crossings. The goal of this application was to increase
awareness of railway crossings around an individual in order to improve safety. The application
also allows users to report information about grade crossings back to the FRA [22].
The Iowa Department of Transportation has implemented an application called “Iowa 511” to
provide real-time tra�c information to motorists. The application shows current tra�c speeds in
a zoom-able and scrollable map. Furthermore, users can look at live camera feeds, get updates
on road work, and read text from electronic roadway signs. The 511 information is also made
9

available via a mobile website, a full desktop based website, telephone, social media websites, and
XML feeds [23]. The Virginia Department of Transportation, Utah Department of Transportation,
and North Dakota Department of Transportation also have a similar application to disseminate
511 information to motorists [24, 25, 26].
The Colorado Department of Transportation (CDOT) has launched real-time notifications of
road conditions to users of its CDOT Mobile application. In order to not overburden the users
with irrelevant notifications, the system will only generate notifications for major accidents, road
closures, and other incidents that have significant impact on travel time. Also the notifications
are sent only at peak travel times. The goal of providing real-time notifications is to give busy
motorists, that would otherwise not check tra�c alerts, relevant information regarding tra�c
conditions so they could pick an optimal route to their destination [27].
The United States Department of Transportation’s Intelligent Transportation Systems Joint
Program o�ce has initiatives focused on intelligent vehicles and intelligent infrastructure to cre-
ate intelligent transportation systems. The Real-Time Data Capture and Management program is
aimed at capturing data from connected vehicles, mobile devices, tra�c management centers, auto-
mated vehicle location systems, toll facilities, parking facilities, and transit stations. Furthermore,
this program explores means of distributing the collected data in real-time to relevant parties, and
archiving the data for future analysis [28]. The data that is collected also enables the creation
of mobile applications, which is the goal of their Dynamic Mobility Applications program. The
Applications for the Environment: Real-Time Information Synthesis (AERIS) program is aimed
more specifically at creating applications that facilitate “green” transportation choices by travelers
and operators. The AERIS program explores five di↵erent application bundles: Eco-Signal Oper-
ations, Eco-Lanes, Low Emissions Zones, Eco-Traveler Information, and Eco-Integrated Corridor
Management. Applications under the Eco-Traveler Information bundle help travelers pick the
most eco-friendly route (minimizing fuel consumption), get fueling information, search for parking
places, and get real-time driving advice in order to drive in a more fuel e�cient manner [29].
10

Chapter 3
Case Studies
In this chapter, we report on five interesting case studies that showcase the usage of smartphone
data to improve transportation systems. These projects come from a variety of sources, and give
a good indication of the widespread research and development in this field.
3.1 Mobile Millennium & Mobile Century Field Experiment
Mobile Millennium project was one of the earliest broad scale projects aimed at making use of
data collected from GPS sensors in cellular devices to monitor real time tra�c conditions, and
relay that data back to consumers. The project came about through close collaboration between
partners in the public sector, private sector, and academia. In particular the partners involved
were Nokia Research Center (NRC), California Center for Innovative Transportation (CCIT), and
University of California at Berkeley. The project ran through a period of one year in the bay area,
launching on November 10th, 2008, and ending on November 10th, 2009. During that time period,
they had a mobile application that was available for consumers to participate in the program. It
was one of the first consumer tra�c estimation applications in the market, with more than 2000
registered users. The Mobile Millennium tra�c monitoring system continues to be operational, and
broadcasts highway and arterial tra�c information in real-time using data gathered from various
feeds. The Mobile Millennium project was an extension of an earlier project called the mobile
century field experiment, which was also conducted by researchers at University of California at
Berkeley [30].
The mobile century field experiment, which preceded the mobile millennium project, was used
to determine the feasibility of leveraging existing GPS devices and communication network to
create a tra�c monitoring system. The system was composed of four layers: the GPS-enabled
smartphones, the cellular network, data aggregation and tra�c estimation servers, and information
consumers. The experimenters utilized 100 vehicles equipped with Nokia N95 phones driving 10
11

mile loops for eight hours across a stretch of freeway near Union City in the San Francisco Bay
Area. This section of highway was ideal for the experiment because it experienced both free-flow
and congestion throughout the day, which allows the system to be tested under a variety of tra�c
conditions. Previous studies have shown that no more than 5% penetration of probe vehicles
are necessary to get an accurate estimate of travel time. Given that about 6000 vehicles cross
that section of freeway per hour and there are 100 test vehicles, the required cycle time was 20
minutes [5].
One of the areas the mobile century project explored was that of a sampling strategy with
respect to GPS data. They identified two types of sampling strategies, temporal sampling and
spatial sampling. Temporal sampling is where the vehicles report their information at time interval
T irregardless of their positions. And spatial sampling is where the vehicles report their information
as they cross a spatially defined boundary. The former is more challenging because it presents a
heavier communication load on the back end servers, and it does not preserve the privacy of the
transmitting party. They chose the later approach, and devised Virtual Trip Lines (VTLs) as a
means of achieving spatial sampling [5].
The application was designed to send travel time data from the phone to their servers as the
motorist crossed one of the designated VTLs. Virtual trip lines are geographic markers across
a roadway where each line is identified by two GPS locations. These VTLs are downloaded by
the application for nearby locations, and stored locally on the device. The advantage in using
VTLs is that it protects the privacy of the individuals sending the GPS data. It achieves this
because the data points being sent are identified by the ID of the VTL, and not by the mobile
device that generated the update. All data packets sent from a mobile device must contain mobile
device identification information for billing purposes by the network provider. The mobile century
system removes this information by first passing the requests through an ID proxy server, which
authenticates each client and then removes the ID information [5].
The data being sent from the smartphones includes position, speed, direction of travel, and
optionally travel time between two consecutive trip lines. This data gets aggregated by virtual
trip lines, and gets fed into algorithms which run on tra�c estimation servers at Berkeley. Since
the tra�c density cannot be extrapolated from the incoming data stream from smartphones, they
were not able to use Lighthill-Whitman-Richards (LWR) partial di↵erential equation (PDE) that
is typically used in tra�c theory. Instead, they came up with a new partial di↵erential equation,
based on the original LWR PDE, that is designed to take in velocity measurements as input. The
resulting model was discretized using Godunov scheme so that the Ensemble Kalman Filtering
(EnKF) approach could be used to estimate the velocity field in the highway [31]. Kalman Filtering
(KF) and Particle Filtering (PF) are techniques that are used often for tra�c state estimation,
but the advantage of the method proposed in this project is that it combines the best of the two
12

approaches [31]. The resulting tra�c estimates with the highest confidence gets pushed to the
tra�c report server, which is the endpoint for information consumers [5].
The experimental results were very encouraging, and the speed estimates closely matched the
511.org displays which combines data from loop detectors, FasTrak-equipped vehicles, and speed
radars. Since the smartphones logged location data every T seconds as well, they were able to
reconstruct VTLs at any point in the route. Specifically, they recreated VTLs at the 17 loop
detector sites, and compared the velocity estimates between the two methods. Their finding was
that the results matched very closely, showing that cell phone data was an adequate replacement
for loop detector data. The ground truth velocity was calculated by using high definition video
cameras and license plate recognition. The results showed that the VTL based data estimates were
actually closer to the ground truth than the loop detector data. Another finding from this study
was that a penetration rate of about 2-3% among the driving population would be su�cient to
provide accurate measure of tra�c flow [5]. This encouraging finding was one of the reasons the
mobile millennium project came about.
3.2 Google Maps Tra�c Estimates
The tra�c estimates shown on Google maps 3.1 is a good example of collecting data from mobile
devices to improve transportation e�ciency. It uses crowd sourcing to gather data, sent from a
multitude of mobile devices, to give an estimation of real time tra�c conditions. Green indicates
low congestion, yellow indicates medium congestion, and red indicates high levels of congestion [32].
The data comes in from Google Maps applications for mobile devices, if the device is GPS enabled.
The data is collected continuously as the vehicle is in motion, and this stream of data is then
aggregated to get an estimate of how fast the vehicle is moving. The data being reported from
vehicular tra�c is further aggregated to smooth out anomalies and outliers in the data. For
example, a postman stopping more often than the average driver would be removed from the
dataset [33].
Google has taken steps to ensure that data collected from the users does not compromise their
privacy. First of all, the data being sent is anonymous, and thus cannot be used to pinpoint
a specific person. When a variety of data is being reported, they combine the data to make it
di�cult to tell one device from another [33]. They also delete the start and end points from
the route data being reported so that it is not possible to tell the complete route taken by the
anonymous person. If the users are still wary of their privacy being compromised, they can opt-out
of the data collection.
This system already has provided many benefits to users, and it also has tremendous potential
for future improvements. One of the biggest benefits to the end user is being able to reduce time
13

taken to travel from point A to point B by avoiding roads that are congested. The mapping
application allows the user to pick among several routes along with the estimated time it would
take for the route. The user can also zoom-in on the map to see the colored tra�c indicators
overlaid on the roads. An area for improvement is if the application is able to divert tra�c to
alternate routes based on real time tra�c estimates [33]. This would have a positive impact on
the whole transportation grid. Another area for improvement would be giving an estimate on how
long it would take the congestion to clear up; that way people could choose to delay their trip
instead of waiting in tra�c.
Figure 3.1: Google Maps Tra�c Estimates.
3.3 Nericell
The Nericell project was aimed at monitoring road and tra�c conditions using smartphones, with
an emphasis on developing world environments where road conditions are more complex. In con-
trast to the Mobile Millennium project and Google Maps Tra�c Estimates, this project uses sensors
besides the GPS sensor. In particular, the accelerometer and microphone were used to infer road
conditions and noisiness of tra�c respectively. Additionally, it was also designed to sense bumps
on the road, braking, and honking in order to infer tra�c conditions [34].
The microphone was used as a sensor in this case to detect honking. They were careful not to
transmit any audio to the server. Instead, they processed the audio samples to detect honks on
the phone, and sent the processed information to the server. Simply detecting spikes in the audio
samples was not su�cient to detect honks because honk sounds tend to be muted inside an enclosed
14

vehicle, and also loud sounds could be mistaken to be a honk. Therefore, they opted for a heuristic-
based approach. They were able to detect spikes in the energy level in the frequency domain of
the audio sample. If the spike was between 5 and 10 times the mean, then they considered it a
honk. According to their calculations this detection scheme was very energy e�cient, only taking
58 ms of CPU time to detect honks in 1 second of audio [34].
The accelerometer was used as a bump detector. The challenge here was that the impact of the
bump varied depending on the speed at which the vehicle was traveling. To mitigate this challenge,
the researchers devised two separate detectors - one to be used at low speeds (< 25 kmph), and
one to be used at high speeds (�25 kmph). The bump detector for low speeds looks for a sustained
dip vertically, reaching below a threshold T and lasting for at least 20 ms. The bump detector for
high speeds looks for a steep rebounding spike vertically, as a result of the vehicle’s tire hitting the
bottom of the pothole. The false positive rate for both detectors was very low (< 10%); however
the false negative rate for both detectors was high (20-30%) [34].
For brake detection, the researchers had the option of either using the GPS or the accelerometer
for sensing. They opted to use the accelerometer because it consumes less power than the GPS.
Also it is more challenging to detect brakes using the GPS at low speeds due to its localization
error of 3-6 meters. If we assume the vehicle is traveling along the x-axis, then braking would
make the accelerometer experience a force pushing it forward causing it to have a surge in the x-
direction(ax
). Hence, to detect a brake, they computed the mean of ax
over a period of N seconds.
If the mean exceeds a threshold T then it is considered a brake. To measure the accuracy of this
detection method they needed to establish ground truth. And for that purpose they used GPS
based brake detection. They computed the instantaneous speed, and if the vehicle experienced a
deceleration of at least 1m/s
2 sustained over at least 4 seconds then it was considered a brake.
The results showed that the false negatives were low at 4-11%, while the false positives rates were
quite high at 15-31% [34].
As the program detects various roadside conditions, it is important to mark the location where
the conditions were detected. They considered GPS, WiFi, and GSM based techniques based
on previous studies in outdoor localization. But GPS and WiFi options were discarded because
they consume a lot of energy, and therefore it would be an impediment for user adoption of
the application. They applied RSSI-based localization algorithms on GSM data as described in
previous studies, but due to the high density of cell towers in Bangalore these algorithms were not
very reliable. Instead, they used the simple approach of strongest signal based localization. This
approach relies on a database of strongest signal tower IDs at a given latitude and longitude. The
phone’s position could then be located via this database given the current strongest signal tower
ID. The results from experimenting with this localization method showed that the median error
for distance was 117 meters, and the median error for speed was 3.4 kmph [34].
15

3.4 ParkSense
ParkSense is a project aimed at using smartphone based sensors to detect if a driver has vacated a
parking spot. Furthermore, the researchers wanted to keep the power consumption of the smart-
phone as low as possible in order to make the final solution more viable for real-world use [35].
This study is di↵erent from previous work in the field in many ways. Google OpenSpot is an
application that attempt to find vacated parking spots by using crowd sourcing [36]. It lets the
vacating driver manually submit that he or she is vacating a parking spot, thereby the querying
users can see the vacated spot on a map. However, in practice very few users have been reporting
vacated spots because there is no incentive to do so. Therefore, the application has rarely had up
to date information for querying users. As discussed briefly in the smart data collection section 2.1,
there are many projects aimed at using wireless sensor nodes to detect parking availability in real
time. However, ParkSense does not rely on installation of additional sensors. It merely piggy backs
on smartphone sensors that people are already carrying around.
Instead of creating a whole system from scratch, ParkSense seeks to augment existing pay-
by-phone applications by providing real-time parking availability data. Since these pay-by-phone
applications require the user to pay for the spot upon parking, otherwise the user would risk a
parking ticket, it was possible to detect when a driver has parked at a spot. But these application
were not able to accurately determine when a parking spot was vacated because in most cases the
spot was vacated before the time has expired. Therefore the main objective for the ParkSense
project was to detect when the user has vacated the spot. Furthermore, the detection process
should be automated such that it requires no involvement from the user other than the initial
installation of software on their smartphone [35].
They considered the many sensors available on the phone as possibilities with the goal of picking
a sensor that minimizes power consumption while still being adequate enough to detect whether a
parking spot has been vacated. They first considered the GPS sensor, which is one of the highest
power consuming sensors on the phone. It is possible to detect when the driver has returned to
the parking spot by continuously tracking the GPS location, and the subsequent rapid change in
GPS location would indicate the user is driving away. But in addition to the power consumption
worries, this sensor choice would not be very accurate in cases where the user parks the car and
moves indoors quickly. The second sensing option would be to use a network based location API. In
this method, the phone would scan the surrounding for Wi-Fi access point SSIDs, which gets sent
over the network and looked up against a database to get the location information. However, this
method only o↵ers very coarse grained location tracking, and is limited by the existing database
of SSIDs. The third option they considered was doing a passive scan for surrounding Wi-Fi access
points to get a relative location estimate, and this option was selected because it was su�cient
16

to meet the requirements and it was the most energy e�cient. Furthermore, the accelerometer
readings from the phone could have been used to detect whether the user is walking or driving,
and then trigger the more energy expensive Wi-Fi based sensing as necessary [35].
The design of ParkSense uses Wi-Fi access point sensing to detect when a user has vacated
a parking spot. After the user has paid for the parking spot using an existing pay-by-phone
smartphone application, ParkSense captures the signature of the current location via a set of
surrounding wireless access point SSIDs. This signature can be represented as follows, where sp
(i)
is the SSID and w
p
(i) is the reception ratio for access point i, and n is the total number of access
points observed.
S
p
= {sp
(1), sp
(2), ...sp
(n)} and
W
p
= {wp
(1), wp
(2), ...wp
(n)}
This signature does not get converted to GPS based location coordinates. But it is su�cient
to meet the requirements of ParkSense, which is to detect when a user has returned to the parking
space and detect when the user has vacated the parking space. As the user moves away from the
vehicle, ParkSense continues to gather these signatures at regular intervals.
In order to detect the user has returned to the vehicle, ParkSense attempts to match the
periodically generated signature against the starting signature (from the parked location). One
of the di�culties they ran into in this process was that the wireless environment is continuously
changing, even if the person and the mobile device is stationary. To get around this issue, they
decided to use a set of normalized reception ratios Wp
as follows, where w
p
(i) = w
p
(i)/P
n
i
w
p
(i)
W
p
= {wp
(1), wp
(2), ..., wp
(n)} (3.1)
The following equations were used to define matching between the original signature Sp
and W
p
against the continuously generated signatures St
and W
t
. Equation 3.2 was referred to as weighted,
where 0 M 1 and l = |Sp
\ S
t
|. Equation 3.3 was referred to as the weighted di↵erence
because this function penalizes access points for di↵erences between the originally observed and
the currently observed values. Equation 3.4 does not take into account reception ratio at all, rather
it calculates the percentage of original access points being observed.
M =lX
i=1
w
p
(i) for s
p
(i) 2 S
p
\ S
t
(3.2)
M =lX
i=1
w
p
(i)(1� |wp
(i)� w
t
(i)|) (3.3)
M =|S
t
\ S
p
||S
p
| (3.4)
17
In order to test whether the user has begun to drive away from the parking spot, they computed
Jaccard similarity, equation 3.5, between successive signatures at regular intervals. The Jaccard
similarity of two sets S and T is the ratio of the size of the intersection of S and T to the size of
their union [37]. In this case the Jaccard similarity is the ratio of the number of access points in
common between the two signatures to the total number of access points in the two signatures.
As the vehicle increases in speed the Jaccard similarity is smaller.
J =|S
t
\ S
t�1||S
t
[ S
t�1|(3.5)
The results from experimentation were encouraging, but there are some scenarios in which this
system is not e↵ective. If the user parks the car and then drives away in a friend’s car close by,
then ParkSense will falsely detect a vacant spot. And if the person paying for the parking is not
the person that unparks the car, then ParkSense could not detect the unparking event.
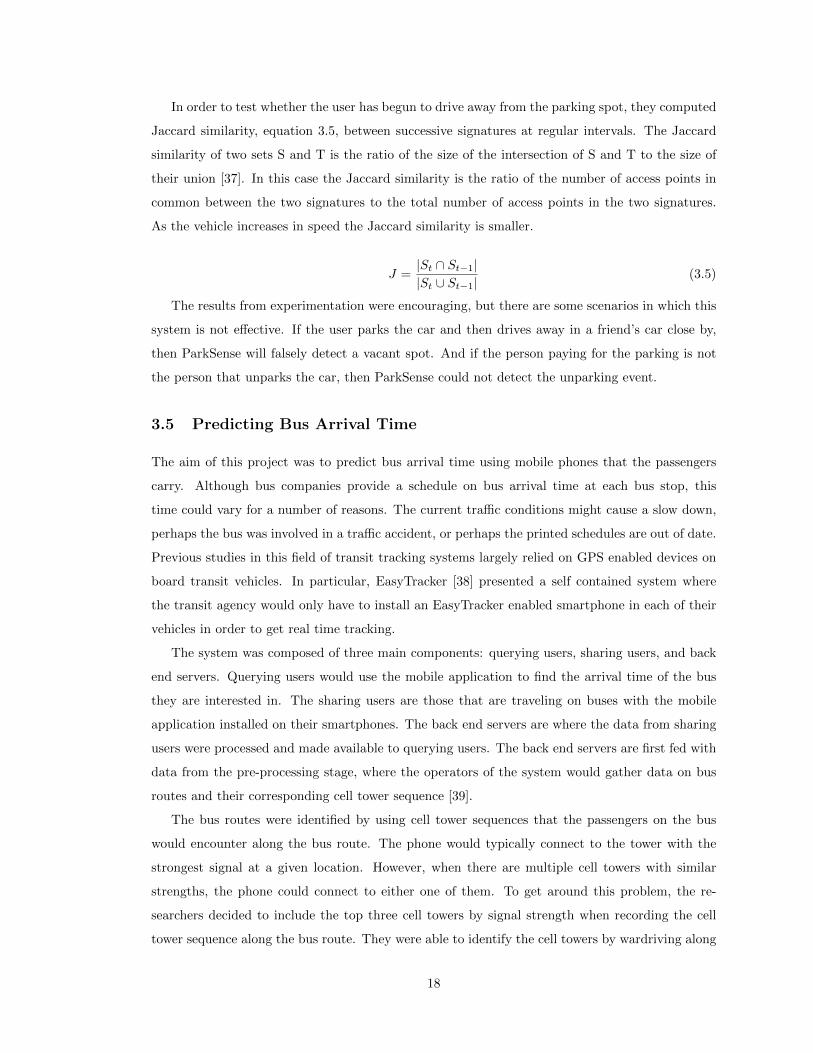
3.5 Predicting Bus Arrival Time
The aim of this project was to predict bus arrival time using mobile phones that the passengers
carry. Although bus companies provide a schedule on bus arrival time at each bus stop, this
time could vary for a number of reasons. The current tra�c conditions might cause a slow down,
perhaps the bus was involved in a tra�c accident, or perhaps the printed schedules are out of date.
Previous studies in this field of transit tracking systems largely relied on GPS enabled devices on
board transit vehicles. In particular, EasyTracker [38] presented a self contained system where
the transit agency would only have to install an EasyTracker enabled smartphone in each of their
vehicles in order to get real time tracking.
The system was composed of three main components: querying users, sharing users, and back
end servers. Querying users would use the mobile application to find the arrival time of the bus
they are interested in. The sharing users are those that are traveling on buses with the mobile
application installed on their smartphones. The back end servers are where the data from sharing
users were processed and made available to querying users. The back end servers are first fed with
data from the pre-processing stage, where the operators of the system would gather data on bus
routes and their corresponding cell tower sequence [39].
The bus routes were identified by using cell tower sequences that the passengers on the bus
would encounter along the bus route. The phone would typically connect to the tower with the
strongest signal at a given location. However, when there are multiple cell towers with similar
strengths, the phone could connect to either one of them. To get around this problem, the re-
searchers decided to include the top three cell towers by signal strength when recording the cell
tower sequence along the bus route. They were able to identify the cell towers by wardriving along
18

the bus route, and taking note of the cell tower IDs [39]. It may be possible to automate this
process, whereby the driver would click the begin button at the start of the route to signal the
application to start recording the cell tower IDs along the route and report back to the back end
servers. This could be part of an initialization process a bus driver would have to complete to get
that bus route into the system.
In order to make use of data sent from sharing users, it was necessary to first detect whether the
sharing user is actually on a bus. There were previous studies that researched context awareness
and transportation mode detection using mobile sensors. In [40], the authors were able to combine
wireless on-body sensors with the additional sensors and computational power of smartphones to
come up with a system that was able to classify a variety of postures and activities. However,
those approaches were not applicable in this case to distinguish a user on a bus. The approach
taken in this study was to use the microphone on the smartphone to sample the beeping sound
given o↵ by card readers deployed on buses to collect transit fees. Through experimentation it
was found that a sampling rate of 8KHz was su�cient to detect the beep signal in the 1KHz and
3KHz frequency bands [39].
The cell tower ID based detection alone was not su�cient to distinguish between buses vs. rapid
trains because the train routes have segments that overlap with bus routes. To further distinguish
between these two modes of transportation the researchers made use of the accelerometer readings.
The readings were evidence to the fact that rapid trains move at relatively stable speeds compared
to buses which experience frequent acceleration and deceleration. They took measurements from
the accelerometer at 12.5 second intervals, calculated the variance in acceleration during that
window, and used a threshold to distinguish between the two modes of transportation (bus vs.
rapid train) [39].
The researchers used a modified version of the Smith-Waterman algorithm, which is a dynamic
programming algorithm for sequence matching [41], to match cell tower sequences coming from
sharing users to the cell tower triplet sequences stored in the database. The matching process
begins only if the sequence of cell tower IDs reported by the user exceeds a threshold value greater
than seven. The reason being that since many of the bus routes overlap, a minimum of seven
cell tower IDs are necessary to reliably distinguish between the di↵erent bus routes. Once the
algorithm is triggered, it returns back a score for each of the routes in the database, and the route
with the highest score is selected. If the highest score is less than a threshold value then the
prediction is postponed as well [39].
Sometimes, the cell tower ID sequences sent by sharing users are not long enough to meet the
minimum threshold of seven IDs. In that case, to still make use of that sequence, the back end
server needed to concatenate sequences from sharing users until the sequence is su�ciently long.
To accomplish that, the sharing users were made to send the time interval between audio beeps of
19

the card readers. The back end server would then be able to group incoming data by beep interval,
and cell tower IDs. Thereby it was able to concatenate sequences until a su�ciently long sequence
was formed [39].
The arrival time prediction is quite straight forward because they simply summed up the
dwelling time in each of the segments, using historical data, from the current position to the
queried bus stop. If dwelling time in cell i is Ti
, 1 i n, and the bus’s current cell number is k,
and the queried bus stop’s cell number is q, then the arrival time can be estimated by Equation
3.6.
T =q�1X
i=k
T
i
� t
k
+ t
q
(3.6)
There are some areas for improvement in the system to make it more reliable. One problem is
that since the cell tower ID sequence has to be su�ciently long, it is not possible to get predictions
for the first few bus stops. The system might have to resort to using historical data for those
bus stops. Overlapped routes remain a challenge especially in downtown areas where several bus
routes share significant overlapped segments [39].
20

Chapter 4
NDOT Smart Data Collection
Application
The Nevada Department of Transportation (NDOT) is mandated to collect crash incidents data
and report them to the federal government. This entails data collection using paper forms, and
thereafter data entry into computer systems. Unfortunately, it is a very time consuming process
and introduces errors in both the data collection and data entry. The form that is necessary to
be filed for each accident is the SR1 form, and it is shown in 4.1. It lists the location information
where the accident took place, and the parties that were involved in the accident. If more than
two parties were involved, additional forms would need to be attached. There are three form fields
for location information, and 27 form fields per each party involved in the accident. The o�cer
on duty would be tasked with filling out this form at the time of the accident, and then upon
return to the o�ce it would have to be entered into an electronic system for storage and reporting
purposes.
Therefore, we looked into creating an application that can reduce errors in data collection, and
reduce the time taken for data collection. The final implementation involved creating a mobile
application, taking advantage of sensors and input devices built into the phone, to reduce data
entry but still derive all the data needed for the form.
The three location related form fields were extracted by using reverse geo-location. Out of the
27 form fields per party, 10 fields each were driver and owner information. This information was
extracted by decoding the barcode found on the back side of Nevada driver licenses; details on this
process is discussed later. Six of the fields were vehicle information, and four out of six of these
fields (Year, Make, Body Type, VIN) were extracted by looking up information from an external
API by using the Vehicle Identification Number (VIN). The license plate number and state could
possibly have been extracted by using OCR on the license plate image, but in this case the user
21

Figure 4.1: SR1 Form, Report of Tra�c Accident.
was given text fields to type in that information.
4.1 Design & Implementation
After reviewing the requirements set forth by the NDOT, we considered multiple design possibilities
to meet the requirements. It was understood that creating and deploying a production ready system
was beyond the scope of the project considering resource constraints, and what was necessary was
the creation of a prototype that demonstrated the viability of such a system.
The first idea was to create a Ruby on Rails based web application with a SQL based database
back end to lookup driver information. One of the challenges we ran into with that idea was in
gathering sample data and accurate database schema that we could use in our prototype applica-
tion. It was possible to generate garbage data and make up a convenient database schema, but that
would also lose any value in the created prototype because we would not be addressing any real
world di�culties in managing data from possibly complex and secure data sources. We considered
Ruby on Rails because it is open source, and it is based on MVC architecture. However, we did
not have much prior experience with that technology, and with the tight deadlines it could have
been a problem to complete in time. The biggest drawback with this fully web based design was
that we would not have fine grained control over the size and quality of the images that would
get captured from the camera and sent to the server. Furthermore, we couldn’t use the camera to
detect barcodes from the video feed because at the moment, web applications can not have control
over device components.
The second design idea was to focus the prototype fully on extracting the license plate number
22

through OCR, and using that to lookup form information by querying a back end database. There
were numerous challenges with that idea, and would have been quite complex to implement reliably.
The challenges were that each state has di↵erent plate designs, getting a high quality picture that
will yield accurate OCR results, and again the di�culty in gathering accurate data and schema.
Furthermore, even though it would be an interesting research experiment to implement that idea,
in reality it is not too di�cult to type in six or seven characters of the license plate. And also
considering that there are many license plate recognition systems available in the market, we would
be re-inventing the wheel in a sense. Therefore, we abandoned this approach, and considered it a
distant possibility if we had time left over after creating a basic prototype.
Finally, we decided to implement a system composed of a mobile application, back end web
service, and a live incident reporting map. The mobile application would be the interface o�cers
would use to collect data and transmit that data to the service. The service would parse out the
incoming data, validate the data, and store that data in a database for retrieval and reporting
purposes. The live incident reporting map is a tool for information consumers. The details of this
system is presented in the sections below.
4.1.1 Application Architecture Overview
The application consists of three main components: an iPhone application, a Representational
State Transfer (REST) based web service, and a live incident reporting map.
Figure 4.2: Architectural overview of the application.
The client side application was used to gather location data (Street, City, and County), driver
licenses of parties, Vehicle Identification Numbers (VINs) of the vehicles, and license plate number
& state of the respective vehicles. This data was serialized to JSON format, and in particular the
image files were compressed, and the byte data was converted to a Base 64 Encoded string to be
23

conformant with the JSON standard. The payload size of the message was directly proportional
to the number of parties involved because more parties involved means more driver license images
would need to be sent to the server.
The server side REST web service consumed the JSON payload from the incoming HTTP re-
quest, and converted it to a C# object through model-binding built-into the ASP.NET framework.
This object was then used to validate form input, and to extract all the information needed to
build the SR1 Form object. The resulting SR1 form object was stored directly in the MongoDB
database.
The live incident reporting map made use of Google Maps API to render the map, and Mi-
crosoft’s ASP.NET SignalR library to add real-time web functionality. This would be a tool
travelers can use to lookup ongoing tra�c incidents.
4.1.2 Tools and Technologies
Git was used as the source control tool for this project. One of the main reasons for this choice was
the availability of free code hosting platforms for Git, which reduced the need for us to spend time
setting up a system that would allow collaboration. Both the iOS application and the back end
web application source code were hosted on public repositories on github.com, which is a site that
hosts git repositories, in order to collaborate with others that might be interested in contributing
to this project. Github has many tools like issue tracking, code review, and wiki pages to help
manage the project but those features were not used in this project.
Development on this project was done on an Apple computer because of the need for Mac OS in
order to compile iOS applications. And a Windows 8 virtual machine was used to do development
on the C# based web service. Visual Studio was the main tool used to develop, compile, and
deploy the back end application. On the client side, the Appcelerator Titanium platform was used
to create the application. Titanium Studio was the tool used to develop, compile, and deploy the
iOS application. It is a free tool available for download from Appcelerator.
The iOS application was deployed and tested on an iPhone 5. The simulator was used during
the development phase, and finally it was deployed on the phone for testing. TestFlight application
was used to distribute the application to parties that were interested in trying out the application on
their own phone. TestFlight is a free platform used to distribute beta and internal iOS applications,
but it is not an alternative to the Apple AppStore [42]. Fiddler, which is an application that lets
users send and analyze HTTP requests and responses, was used to test the web service with sample
requests and payloads [43].
24

4.1.3 Client Side Mobile Application
The client side iOS application was built using Appcelerator Titanium mobile development plat-
form. The main design pattern used to organize the code was the Model-View-Controller (MVC)
pattern using the Alloy framework. Business logic code for the application was separated out from
the user interface specific code, and into self-contained exportable CommonJS modules.
MVC is a common architectural pattern used to organize user interface code. When considering
a given use case, models are the objects being operated on for that use case. For this application, the
main model object was the form object, which contains all the data the client application collects
to complete the SR1 form. The controllers contain code that processes the requests coming in from
the user by way of user interface controls. An example of a controller used in this application was
the location controller. It contained code to access the geo-location features of the device to get
the location of the accident, and it also contained code to set the model state if the user manually
changed the location information. The views contain code that renders user interface controls, and
populating those controls with data if a corresponding model object is provided. An example of
a view from the application was the location view (Figure 4.3). It contained controls to show a
map to the user, collect location data from the user, and navigate back and forth between other
views in the application. If the form model object already contained location information, that
information was used to pre-populate values for the controls in the view.
<Alloy><Window c l a s s=” conta ine r ” id=’ winLocation ’ t i t l e=”Locat ion ”>
<Scro l lV iew layout=” v e r t i c a l ”><View id=”mapview” ns=”Ti .Map” width=”320dp”
he ight=”260dp” top=”0dp”onComplete=” setRegion ” animate=” true ”
r eg i onF i t=” true ” userLocat ion=” true ”mapType=”Ti .Map.STANDARDTYPE” >
</View><Label c l a s s=’ lb lAddres s ’ t ex t=” St r e e t ”></Label><TextFie ld id=’ t x tS t r e e t ’></TextFie ld><Label c l a s s=’ lb lAddres s ’ t ex t=”City”></Label><TextFie ld id=’ txtCity ’></TextFie ld><Label c l a s s=’ lb lAddres s ’ t ex t=”County”></Label><TextFie ld id=’ txtCounty ’></TextFie ld><Label id=’ btnNext ’ onCl ick=”btnNext onClick ”
text=”Next >>”></Label><Label he ight=’ 20dp ’></Label></ Scro l lV iew>
</Window></Al loy>
Figure 4.3: Location View Markup.
Among the many benefits of the separation of responsibilities into modules were code reusability,
testability, and reduced application startup time. Modular code allows us to reuse the functionality
that is encapsulated in the modules throughout di↵erent use-cases of this particular application and
also in other applications if we wish to do so. In particular, should we decide to extend our mobile
25

application to support other platforms (Android, Blackberry, or Tizen), we can create platform
specific user-interfaces but still utilize the same modules. This re-use of code is the very strength
of the Titanium platform because as more and more mobile devices and platforms enter the market
it becomes increasingly strenuous and costly to develop and maintain platform specific application
code. Since most applications have the same use-cases regardless of the platform, it becomes a
necessity to ensure that the core business logic is mirrored across the di↵erent platforms. Testing of
the business logic code becomes much easier because that code is separated out from the harder to
test user-interface specific code. The user-interface specific code, having been separated out from
the business logic, becomes less of a necessity to test because we can assume it is the obligation of
the framework developer (Appcelerator Titanium) or the user interface controls developer (third
party developer, or platform sdk provider) to test that code. An example of user-interface specific
code is shown in Figure 4.4. It instantiates the backing controller for the view, and uses that to
open the view. Since there is no application specific logic in there we can assume that it should
work as specified by the framework developer. The modules were loaded just-in-time as requests
come in through the controllers, thereby removing the need to load extraneous code at application
startup, which in turn reduced the time for application’s initial startup. And once a user closed a
view that used a module, that module was unloaded to preserve memory.
var l o c a t i o nCon t r o l l e r = Alloy . c r e a t eCon t r o l l e r ( ’ Location ’ ) ;$ . tabMain . open ( l o c a t i o nCon t r o l l e r . getView ( ) ) ;
Figure 4.4: Code snippet to open a new view.
Some modules were obtained through Appcelerator Open Mobile Marketplace, some were open
source JavaScript modules obtained through Github, and others were application specific code
that were refactored into modules. Appcelerator Open Mobile Marketplace is an exchange for
application component producers and consumers. It includes both free and paid app modules,
templates, design elements, and cloud extensions [44]. The RedLaser Barcode Scanner module
was one that was downloaded through Appcelerator Open Mobile Marketplace. It is a module
that is provided free of charge by Appcelerator, but it does have limited use restrictions for the
free version. As of this writing, the limit was 25 scans per device and application combination.
However, this was su�cient for proof of concept and testing purposes. Moment.js was an open
source JavaScript library that was obtained through Github. It provides functionality as far as
parsing, manipulating, and formatting dates [45]. In this application it was used to format the
dates to a more readable format. ServiceAgent.js is a module that was created specifically for this
application to encapsulate the logic in communicating with the web service, and to provide the
business logic code an interface to access the web service.
26

Figure 4.5: Client side mobile application sequence diagram.
4.1.4 Server Side Web Service
The server side RESTful web service was built using Microsoft ASP.NET Web API platform. This
web service was used to accept data sent from client applications in JSON format, and using that
information to generate the complete SR1 form for storage and post processing.
The Web API based service uses REST principles when processing the requests. The re-
quests come in the form of a URI, a verb (GET, PUT, POST, DELETE), and a set of HTTP
headers. The endpoint URI identifies the resource being operated on. In the NDOT appli-
cation the endpoint URI was http://ndot.azurewebsites.net/api/sr1form, in which case
http://ndot.azurewebsites.net/api/ is the base URI and /sr1form is the resource being oper-
ated on. GET requests were used to read previously submitted forms that were stored in MongoDB.
HTTP basic authentication was used to prevent unauthorized access to the data. This authenti-
cation scheme simply sends the username and password, base 64 encoded, in the Authorization
HTTP header. It has to be used along with SSL enabled to prevent others from decoding the
username and password. POST requests were used to send form data from the iOS client appli-
cation to the service. The service was stateless, meaning that the server does not store context in
between requests and that all the data needed to process the request is being sent by the client on
each request. HTTP status codes were used in responses back to the caller to indicate the result of
processing the request. For example, if the client did not send required information to the service,
27

Figure 4.6: Server side web service sequence diagram.
the service would respond with a status code of 412 Precondition Failed. If the server successfully
processed a POST request to the sr1form endpoint, a 201 Created status code was sent.
public c lass Sr1ClientFormData{
public string St r e e t { get ; s e t ; }public string City { get ; s e t ; }public string County { get ; s e t ; }public List<ClientActor> Actors { get ; s e t ; }
}
Figure 4.7: Sr1ClientFormData model object.
The model object accepted by the server side application is shown in Figure 4.7. It contains
the geographical data where the car accident took place, and a list of actors (parties that were
involved in the accident). The service was able to deserialize the incoming JSON to the above
model object using the technique of model-binding built into Web API. The web service first goes
through a process known as content negotiation, where it looks at the incoming HTTP request
and determines how best to parse that information. If the request explicitly contains a Content-
Type header, and specifies an acceptable media type, then the server tries to make use of that
information provided that a corresponding MediaTypeFormatter is available. If no content-type
was provided by the client, then the server looks at the request body and attempts to pick a
suitable MediaTypeFormatter to parse the content. By default, the service is able to parse data
28

coming in as JSON, XML, or URL-encoded form data and build an object, but it is also possible
to define custom media type formats and custom model binding logic. For the default JSON model
binding to work, the keys of JSON fields must match the field names of the C# object.
Once the service has a Sr1ClientFormData object to work with, it goes through that object
and builds a corresponding Sr1FormData object which contains all the information needed for
the form. It loops through the list of ClientActor objects of the incoming object, and looks up
additional information as necessary to build the list of Actor objects of the Sr1FormData object.
Vehicle information was looked up using the Edmunds Vehicle API. Edmunds Vehicle API is
provided free for developers, but it is necessary to register with them in order to get an API key
for development. This API is also rate limited to two requests per second and 5,000 requests per
day, but for our demo purposes this was not an issue. Request was made to their API with the
VIN number provided from the client, along with the API key, and format equal to JSON. The
resulting JSON was parsed to get the vehicle’s make, model, and year.
Driver information was looked up by decoding the driver license barcode image sent by the
client. The image comes into the service as a base 64 encoded string, therefore it was first base
64 decoded, and the resulting byte array was converted to an Image object. This image was then
passed to the barcode reader module provided by the ZXing.net barcode reading library. The
search was scoped by specifying that the expected format is PDF 417. ZXing is an open source
library that is able to process images containing barcodes and decode the text that the barcode
represents. It currently supports virtually all major barcode formats including CODE 39 which was
used for decoding the VIN barcode, and PDF 417 which was used for decoding the driver license
barcode image. This project also provides implementations for all major programming languages.
For this application, the .NET port of the project was used. It was provided as a NuGet package,
therefore including it in the application was easy.
Once the driver license barcode image was decoded by the ZXing library, the text contained in
the barcode was obtained. However, the text requires further decoding as it was in a format de-
signed by American Association of Motor Vehicle Administrators (AAMVA) [46]. Figure 4.8 shows
an example of the text returned from the ZXing library. Here the card holder’s real information
was changed for confidentiality but the format is preserved.
The data elements are in separate lines beginning with an element ID. The AAMVA specifica-
tion gives further detail as far as how each data element is formatted. The parsing was done by
splitting the string by the end-of-line delimiter to get a list of strings. And then the element IDs
were searched to get the field information. For example, the element ID DBB corresponds to Date
of Birth of the card holder. Sometime a single element contains multiple data fields, in which case
additional parsing steps were required.
One of the big obstacles in creating this application was that the driver license barcode image
29

@ANSI 636049030002DL00410264ZN03050088DLDCACDCBADCDNONEDBA03282016DCSJONESDCTMIKE DDBD03102012DBB03281988DBC1DAYBLKDAU068 in
DAG331 MAIN STDAILAS VEGASDAJNVDAK891296069DAQ1402041243DCF000122820260394621628DCGUSADCHNONEDAHDAZBLACKDCE3DCK0009682849901DCUZNZNANZNB10102008ZNC5’ 08 ’ ’ZND150ZNENCDLZNFNCDLZNGNZNH00096828499ZNI00000003399
Figure 4.8: NV Driver License barcode encoding.
has to be within +/- 5 degree skew. In practical use, this was very di�cult to achieve. After many
trials and errors it was possible to get a few images that were capable of being decoded. It was
necessary to use a stand to hold up the phone, and line up the driver license against an edge to
get images that would decode successfully. Furthermore, on the back of the Nevada driver license,
there are two barcodes, and the image submitted to be processed should be cropped to only include
the 2D PDF-417 barcode so that the ZXing library can successfully decode the barcode. The built
in editing functionality provided by the Apple SDK was su�cient to crop the image. Additionally
the camera needs to be well focused on the barcode to avoid blurry images, which also causes the
decoding to fail.
Unit tests were written to ensure that certain functionality work as expected. A unit test was
written to ensure that a sample Nevada driver license barcode could be parsed to extract driver
information. A unit test was written to ensure that for a known VIN, the Edmunds API returned
correct data. Unit tests were written to verify the incoming form had required data: city, street,
county, and at least one actor. The web service endpoint as a whole was tested against mock HTTP
requests to verify that the response was acceptable. This was achieved by setting up context for the
request, mocking the dependencies required by the controller, getting the response, and asserting
that the status code was as we expected. An example of such a test is shown in Figure 4.9, and it
checks that an acceptable client request succeeds and returns a 201 Created status code.
30

[Test
Meth
od]
public
void
Giv
enValidClientData
GeneratesValidSr1Form
()
{//
Arrange
var
confi
g=
new
HttpConfiguratio
n();
var
request
=new
HttpRequestM
essage(Htt
pM
eth
od.Post,
”http:/
/lo
calh
ost/api/
sr1fo
rm
”);
var
route
=confi
g.Routes.M
apHttpRoute
(”Defa
ult
Api”
,”api/
{controll
er}/
{id
}”);
var
routeData
=new
Htt
pRoute
Data
(route,
new
HttpRouteValu
eDic
tio
nary
{{
”controll
er”,
”sr1fo
rm
”}
});
var
mockRepo
=new
Mock
<IReposit
ory<Sr1
Form
Data
>>()
;mockRepo.Setup(c
=>
c.A
dd(It.Is
Any<Sr1
Form
Data
>())).Callback<Sr1
Form
Data
>(c
=>
c.Id
=”123”);
var
mockEdmundsA
pi=
new
Mock
<IE
dmundsA
piA
gent>
();
mockEdmundsA
pi.Setup(c
=>
c.GetV
inData
(It.Is
Any<string
>())).Returns(n
ew
Vin
ApiD
ata
{Year
=”2003”,
Make
=”Nis
san”,
BodyType
=”Car”
});
var
controll
er
=new
Sr1Form
Controller(
logger,
mockRepo.Obje
ct,
mockEdmundsA
pi.Obje
ct);
controll
er.ControllerContext
=new
HttpControllerContext(config
,routeData,
request);
controll
er.Request
=request;
controll
er.Request.Propertie
s[HttpPropertyKeys.HttpConfiguratio
nKey]
=confi
g;
controll
er.Request.Propertie
s[HttpPropertyKeys.Htt
pRoute
Data
Key]
=routeData;
//
Act
var
result
=controll
er.Post(GetValidSr1ClientForm
Data());
//
Assert
Assert.AreEqual(
HttpStatusCode.Created
,result
.StatusCode);
}
Figure 4.9: Unit test to test form gets processed correctly for a valid request.
31

The service was deployed on Microsoft’s Azure cloud platform. Azure o↵ers developers a plat-
form to deploy their application infrastructure on Microsoft’s globally distributed data centers.
The platform supports numerous programming languages, and provides access to Microsoft devel-
oped services and third party services to help developers get their applications done faster and in
a more scalable way [47]. Azure also has good integration with source control systems like Git and
Team Foundation Server, and o↵ers the ability to rollback to previous versions. The deployment
to Azure was done from Visual Studio through the Web Deploy utility. The site to host the ap-
plication was first created through the Azure management portal, then the publish profile for the
corresponding site was imported to Visual Studio to provide the integration between the Azure
account and the Visual Studio solution. Once the integration is established, the publish wizard in
Visual Studio guides the user through the deployment steps. Azure’s a pay-as-you go model allows
for flexibility and cost savings because the amount charged is proportional to the resource usage
of the service. Due to the free credits o↵ered by Microsoft, and the low usage of this service, there
were no costs associated with it.
The MongoDB database, used for storing the form data, was hosted on Azure through the
third party service provider MongoLab. They o↵er a shared plan that is free to use for testing
purposes and includes half a GB of storage. Therefore, it was used for this application and was
quite su�cient. MongoDB was a natural fit for storing the form data because each form could be
stored as a single document in MongoDB without needing to define a complex database schema.
In particular the model object that was used in the application code could be serialized and
stored directly without needing to map the model properties to specific tables and columns. Data
access layer code was minimal in this case because the MongoDB C# driver, and the generic
IRepsitory interface were adequate at interacting with the database. Querying form data is also
simplified because the data does not have to be reassembled by joining across relational tables. The
MongoDB C# driver is able to take C# Language Integrated Query (LINQ) code and convert that
to matching MongoDB queries. Therefore there was no need to write MongoDB specific queries
within the application code to retrieve data from MongoDB.
32

4.1.5 Live Incident Reports Map
A live incident reporting map interface, Figure 4.10, was created for travelers and back o�ce
personnel to get real time updates on incidents as they happen. This interface is accessible at http:
//ndot.azurewebsites.net/, and it shows incidents reported from the client mobile application
and basic information about each incident when the user clicks on the marker.
Figure 4.10: Live incident reports map on a mobile phone.
Google Maps JavaScript API was used to map the incident locations on a map. The Google
Maps JavaScript API is free for limited usage, but it does require the developer to obtain an API
key [48]. The API itself is very simple and straightforward to use, and there are good examples
and documentation on it. The basic use case of it requires a HTML div element to render the map,
a reference to their cloud hosted JavaScript source, and initialization of a map object in JavaScript
at a specified latitude, longitude and zoom level. In addition to the basic map, this application
made use of markers and info windows to display incident information. Markers identify a location
on a map given a latitude, longitude and a reference to the map JavaScript object. It was also
possible to add an animation to the marker when it first gets added to the map. The info window
33

feature allows the user to see more detail when its corresponding marker is clicked. In this case
info windows were used to show the street, date, and actor count of the incident.
Real time updates were made possible using Microsoft’s ASP.NET SignalR library. SignalR
makes it really easy for .NET developers to add real-time functionality to ASP.NET based web
applications. Instead of the client having to poll the server for updates using AJAX requests, the
server is able to push data to the connected clients right away. SignalR abstracts away the various
means of achieving bi-directional communication between the client and the server (websockets,
long-polling, server sent events, forever frame), and gives the developer a high level API for doing
Remote Procedure Calls (RPC) from the server to the client [49]. The server can do the RPC calls
on either a single-recipient, on a group, or on all clients. For this application, a broadcast style
call to all the connected clients was used because all the users are allowed to see all the incidents.
A “hub” was defined in the server side code as that is the high level abstraction SignalR uses to
manage the communication between the client and the server. After the original form data was
processed and stored in MongoDB, the server could notify the client of the new incident by using
code shown in Figure 4.11.
var hubContext =GlobalHost . ConnectionManager . GetHubContext<IncidentsHub >() ;
hubContext . C l i en t s . Al l . addNewMarkerToPage ( form . Latitude , form . Longitude, form . Street , form . CreatedDate . ToString ( ) , form . Actors . Count ) ;
Figure 4.11: Code snippet showing server calling JavaScript client method.
34

4.2 Test Setup
The application was put through a series of testing scenarios to see how it compares against the
paper form entry. The main goal of this experimentation was to test the speed of completing the
form, comparing the mobile application to the paper form. The independent variable in these cases
was the method of input (mobile application or paper form). The dependent variable was the time
to completion measured in seconds. Three separate trial runs were conducted, each involving one,
two, and three actors respectively. Many variables were kept constant throughout the trial runs
including location of incident, actor’s driver licenses, and actor’s vehicle identification numbers.
The mobile device was connected to a local wireless endpoint with 3 Mbps download speed, and 768
Kbps upload speed to communicate with the web service hosted on Azure. All the data needed to
complete the form was available before beginning to complete the form. The vehicle identification
number barcodes for three vehicles were printed out ahead of time, rather than scanning it from
the vehicles.
The main di�culty in running the experimentation was the di�culty in capturing the driver
license barcode su�ciently enough for the decoding software to work properly, but also not to let
the file size be too large as to slow down the process. And another di�culty was the requirement
that the barcode has to be almost perfectly horizontal. The AAMVA North American Standard
for driver licenses specify that the skew shall not be more than +/- 5 degrees [46]. To get around
these limitations various methods were tested. One was to use a barcode scanning module that
was marketed as being able to read the PDF417 symbol right from the camera feed. This would
have meant that we could transfer the text that was encoded in the barcode instead of the actual
image to the server. However, in practice that module did not work. Second, an overlay view
with a rectangle image capture area was put on top of the camera view with the aim that it
would allow the user to capture a more horizontal image. However, in practice this still produced
a lot of unusable image captures. Finally it was decided to use a stand to line up the barcode
horizontally, test that those images were usable by the barcode decoder, and use those images for
the experiment.
Ideally we should have been able to run the experiments on real world scenarios, and by the
actual end users. However, it was not possible for this prototype application for a number of
reasons. First, as mentioned earlier the di�culty in capturing a processable driver license barcode
would have been very frustrating in real use. Second, since the form data is hosted on a third
party server beyond the control of NDOT, there would have been privacy concerns in using the
application. Third, there would have been di�culty in distributing the application because of
the need to have the application approved through Apple and published on the Apple App Store.
Lastly, there was a limitation on the RedLaser module usage, which is limited to non-commercial
35

use.
4.3 Test Results
In the first test scenario, Table 4.1, the incident involved two actors, which is expected to be the
most common usage of the application. The owner of the vehicle was selected to be same as the
driver, which removed the need for ten fields. The actor type “Driver” was selected for both actors.
Table 4.1: Test results for incident involving two actors.Method Trial 1(s) Trial 2(s) Trial 3(s) Average(s)
Paper Form 315 258 230 267Mobile App 110 122 98 110Paper Form + Electronic Data Entry 456 380 343 393
The following experiment, Table 4.2, was similar to the previous experiment, with the goal here
being to see the impact of an additional actor on the form completion time. The additional actor
was also “Driver” type, and the owner was selected to be the same as driver.
Table 4.2: Test results for incident involving three actors.Method Trial 1(s) Trial 2(s) Trial 3(s) Average(s)
Paper Form 425 361 342 376Mobile App 164 139 131 144Paper Form + Electronic Data Entry 509 404 390 434
For this last experiment, Table 4.3, the goal was to see how manual data entry on a mobile device
faired against filling out the paper form. The mobile device still picked up location information
using the geolocation features, therefore it was not necessary to fill out three of the fields (Street,
City, County). The geolocation picked up the correct location on all three trials, therefore it was
not necessary to make corrections to those fields. There were a total of twelve fields to be filled
out in this case. In the mobile application, the data was entered manually rather than using the
driver license barcode to extract the data.
Table 4.3: Test results for incident involving one actor.Method Trial 1(s) Trial 2(s) Trial 3(s) Average(s)
Paper Form 68 57 76 67Mobile App - Manual Data Entry 62 71 62 65Paper Form + Electronic Data Entry 108 88 105 100
36

4.4 Analysis
In Figure 4.12 we see a visualization of the experiment involving two actors. Across all the trials,
we see that the mobile application was faster at filling out the form than the paper form, and
the paper form with electronic data entry. By looking at the average time, the paper form took
2.43x longer to complete than the mobile application form, and the paper form with electronic
data entry took 3.57x longer to complete. The experimental data supports the hypothesis that the
mobile application would be faster at completing the form. Interestingly, we see that with both
the paper form and paper form with electronic data entry that the time to complete got reduced
with each new trial. One possible reason for this is that the experimenter got more familiar with
the data after completing each trial, and that reduced the number of times he needed to check
back with the data source to do the data entry. On the other hand, the completion time for the
mobile application was very stable across the three trials.
Figure 4.12: Chart showing data entry method vs completion time. Data from table 4.1.
The pie chart on Figure 4.13 is a visualization of the average completion time for the experiment
involving three actors. There we get a sense of how much more e�cient the mobile application
is compared to the other two methods. The paper form took 2.61x longer to complete, and the
paper form with electronic data entry took 3.01x longer to complete. Compared to the previous
experiment involving two actors, the paper form took 40% longer to complete, while the mobile
application took 31.5% longer to complete. This is close to the expected value, since the number
of actors increased by 50%, but the mobile application’s performance was outstanding per each
37

additional actor.
Figure 4.13: Chart showing average completion time for each of the data entry methods as apercentage. Data from table 4.2.
The results from the third experiment in table 4.3 shows that the time to form completion is
about equal between the mobile application and the paper form. This suggests that even in the
worst case, where no data extraction from barcode data is done, the mobile application is worth
considering. However, the advantage in the mobile application comes when compared to the paper
form with electronic data entry because the mobile application can electronically post the resulting
form data instantly. In fact the mobile application was 65% faster compared to paper form with
electronic data entry.
4.5 Future Works
It would have been possible to extract the license plate information using OCR on the license plate
image. There is an open source OCR library, tesseract-ocr, that could have been used for this
purpose [50]. It was originally developed at HP Labs between 1985 and 1995, and was one of the
top three OCR engines in the 1995 UNLV accuracy test. Since then the project was taken over
by Google and has been improved. One challenge here would be in honing in on the plate number
and state specifically when there are many stickers and fonts on the license plate. Also capturing a
good image in unfavorable weather conditions, lighting conditions, and angles would make it quite
a challenge.
Furthermore, the application could be further developed to integrate with existing IT systems
at the NDOT. O�cers could log into the application using their existing network credentials, and
38

the application could then file the form directly to NDOT’s database systems using the logged in
identity. The license plate’s state could also have been looked up based on license plate number
if the application had access to that information from NDOT or the state Department of Motor
Vehicles (DMV). And also driver and owner information could have been filled in by searching for
the specific record against a database instead of extracting that information from the driver license
barcode.
The accuracy of the driver license barcode capture needs to be dramatically improved if this
application is to be used in practice. Perhaps a stand could be developed to place the driver
license and the phone at a good distance and angle so that the barcode image can be captured
more reliably. Another solution would be to move the decoding logic from the server side to the
phone itself, and use a more reliable commercially available PDF-417 decoding library.
In practice, poor network connectivity would also be a barrier to adoption for the application.
The application could be enhanced to support local storage such that if there is no network
connection, the data would be stored to the local SQLLite database on the device, and then upload
the data once a connection is re-established. Storing the data locally first before transmitting to
the server has the added benefit of being more reliable in that it can keep retrying if there were
errors during transmission.
39

Chapter 5
Conclusion
In this paper, we explored many di↵erent ways of using mobile devices to collect transportation
data, and using that data to ultimately improve transportation scenarios. The rapid increase in
smartphone usage by travelers means that it is becoming a viable and exciting source for data
collection at a global scale in a cost e↵ective way. Even regular phones have become a good
source for travel time data collection due to new legislation and infrastructure changes that makes
it possible to locate phones very accurately. This is an exciting and growing area as we see
organizations from the public sector, private sector, and academia are contributing to research
and development of novel techniques and products. As smartphones continue to drop in price,
increase in the number of sensors, and also become more accurate in their sensing capabilities, we
can expect to see more interesting projects and innovative solutions.
The GPS sensor on the smartphone along with network communication capabilities of the phone
have been the focal point around much of the research and innovation. The Mobile Millennium
project and Google Tra�c Estimates both use these sensors and capabilities to full e↵ect by
collecting the GPS data, processing it through online algorithms, and presenting the resulting
tra�c estimates back to the users. Even though these innovations stand to give consumers great
benefit, there are privacy concerns for the users willing to share the data. Some of these concerns
are alleviated by removing user identification information from incoming requests, and also by
using spatial sampling techniques. We also saw some case studies making use of the accelerometer,
microphone, and Wi-Fi sensor on the smartphone. These sensors consume much less power than
the GPS sensor, making them more desirable because reduced battery life drainage means more
users would be willing to participate in collecting and sharing the data. It was also possible to use
these low power sensors to trigger the high power GPS sensor, which would save power compared
to using the GPS sensor exclusively.
We reported on some novel case studies involving the use of smartphones to detect road condi-
40

tions, and provide valuable data to end users. Nericell, ParkSense, and bus arrival time prediction
projects were all conceived and implemented in academia. These projects show great promise in
real world use, but we see that they have to move beyond academia and integrate with existing
or new commercial products to be viable for continued use by the users. The Mobile Millennium
project for example was one of the first major projects that explored the use of smartphone GPS
data to estimate tra�c conditions, but eventually the stakeholders were not able to maintain it for
long term without revenue from the product. The same technology integrated with Google Maps
to provide tra�c estimates continues to be of great service to end users and available for continued
use. The ParkSense application could be integrated with existing pay-by-phone providers to locate
available parking spots, thereby providing convenience to end users, increasing revenue for the
pay-by-phone provider, and also increasing revenue for the parking space owners.
Lastly we reported on our implementation of a smart data collection application for the purpose
of collecting data at accident scenes. An iPhone application was developed using Appcelerator
Titanium mobile development platform which would extract data from various sources and submit
to a web service. The web service, which was developed using Microsoft’s ASP.NET Web API
platform, accepted the data from mobile clients, extrapolated data through decoding driver license
barcodes and looking up vehicle information through an external API, and finally produced the
necessary form. The form was saved in a MongoDB collection for this prototype application, but
it is feasible to electronically submit the form to appropriate authorities. The goal in creating this
application was to reduce the time taken to complete the form while also simplifying the process
and getting more accurate data. The experiments done in comparing the mobile application to the
paper form showed that the mobile application was indeed much faster than the paper form. The
whole process was also simplified because we cut down on the steps needed to convert the paper
form to electronic format. The reliability of the data collected could not be verified because we
were not able to compare the application against the existing method side-by-side in real world
use. Even though the experimental results were promising, there are a lot of obstacles to overcome
in order to make this prototype project viable for practical use.
41

Appendix A
NDOT Application Screenshots
Figure A.1: Home screen of the app, start point for the SR1 form.
42

Figure A.2: Location screen where the user inputs location of the incident.
Figure A.3: Actors screen showing all of the actors involved in the tra�c incident.
43

Figure A.4: Actor detail screen where the user inputs details of the actor.
Figure A.5: User can manually input details of the actor as well.
44

Figure A.6: History screen showing a summary of previously submitted form data.
Figure A.7: History detail screen showing the full form data.
45

Appendix B
NDOT Application Source Code
The source code for the iOS application is available for download at https://github.com/simplecoder/
ndot-client and it requires Titanium Studio to develop, compile, and deploy. During develop-
ment, Titanium SDK 3.1.3.GA and iOS 7.0 SDK was used build the project. It may or may not
be compatible with future SDK versions.
The source code for the web service is available for download at https://github.com/simplecoder/
ndot-service and it requires Visual Studio in order to develop, compile, and deploy. In particular,
Visual Studio 2012 was used along with .NET 4.5 and IIS Express during development.
46

Bibliography
[1] Apple. iPhone 5s Specs. http://www.apple.com/iphone-5s/specs/.
[2] John Wright and Joy Dahlgren. Using Vehicles Equipped with Toll Tags as Probes for Pro-viding Travel Times. April 2001.
[3] Robert L. Bertini, Matthew Lasky, and Christopher Monsere. Frontier Project Evaluation ofVideo Recognition Travel Time System. July 2004.
[4] James E. Moore, Seongkil Cho, Arup Basu, and Daniel B. Mezger. Use of Los Angeles FreewayService Patrol Vehicles as Probe Vehicles. February 2001.
[5] Juan C. Herrera, Daniel B. Work, Ryan Herring, Xuegang J. Ban, and Alexandre M. Bayen.Evaluation of Tra�c Data Obtained via GPS-Enabled Mobile Phones: the Mobile CenturyField Experiment. UC Berkeley Center for Future Urban Transport: A Volvo Center ofExcellence, August 2009.
[6] Sfpark. http://sfpark.org/.
[7] Emma Beck. Smartphone apps put parking spots at your fingertips. http://www.usatoday.com/story/news/nation/2013/03/03/mobile-parking-application/1946323/, March2013.
[8] Suhas Mathur, Tong Jin, Nikhil Kasturirangan, Janani Chandrashekharan, Wenzhi Xue,Marco Gruteser, and Wade Trappe. ParkNet: Drive-by Sensing of Road-Side Parking Statis-tics. 2010.
[9] Pay by Phone Parking from ParkMobile in the UK. http://www.parkmobile.co.uk/.
[10] PayByPhone. https://paybyphone.co.uk/.
[11] Shawn M. Turner, William L. Eisele, Robert J. Benz, and Douglas J. Holdener. Travel TimeData Collection Handbook. U.S. Department of Transportation, March 1998.
[12] Louis G. Neudor↵, Je↵rey E. Randall, Robert Reiss, and Robert Gordon. Freeway Manage-ment and Operations Handbook. 2003.
[13] Lawrence A. Klein, Milton K. Mills, and David R.P. Gibson. Tra�c Detector Handbook:Third Edition—Volume I. October 2006.
[14] Donald L. Woods, Brian P. Cronin, and Robert A. Hamm. Speed Measurement with Induc-tance Loop Speed Traps. August 1994.
[15] A.P. Gribbon. Field Test of Nonintrusive Tra�c Detection Technologies. Mathematical andComputer Modelling, 27:349–352, 1998.
47

[16] Highway Congestion Monitoring Program. http://www.dot.ca.gov/hq/traffops/
sysmgtpl/HICOMP/index.htm.
[17] Tra�c surveillance drone to be tested. Aviation Week and Space Technology, 146:68, 1997.
[18] C. R. Drane. Positioning and GSM. Report for British Telecom, 1993.
[19] Jean-Luc Ygnace, Chris Drane, Y.B. Yim, and Renaud de Lacvivier. Travel Time Estimationon the San Francisco Bay Area Network Using Cellular Phones as Probes. 2000.
[20] 911 Wireless Services. http://www.fcc.gov/guides/wireless-911-services.
[21] Tennessee Department of Transportation. TDOT SmartWay. http://www.tdot.state.tn.us/tdotsmartway/faq.htm.
[22] Kevin F. Thompson. Federal Railroad Administration Launches New Smartphone Appto Raise Awareness of Highway-Rail Grade Crossings. http://www.fra.dot.gov/eLib/
details/L04641.
[23] Iowa Department of Transportation. Iowa’s 511 websites and apps. http://www.iowadot.
gov/511/index.html.
[24] Virginia Department of Transportation. Free Virginia 511 Tools. http://www.virginiadot.org/travel/511.asp.
[25] Utah Department of Transportation. UDOT Tra�c Smartphone Application. http://www.
udot.utah.gov/main/f?p=100:pg:0:::1:T,V:1673,57449, November 2011.
[26] North Dakota Department of Transportation. North Dakota Travel Information - Images,Text and Maps. http://www.dot.nd.gov/travel-info-v2/travel-info-mobile.htm.
[27] Colorado Department of Transportation. CDOT Mobile Smartphone Application LaunchesReal-Time Notifications in Time for Labor Day Weekend. Technical report, August 2013.
[28] RITA - Intelligent Transportation Systems - Real-Time Data Capture. http://www.its.dot.gov/data_capture/data_capture.htm, December 2013.
[29] AERIS Operational Scenarios and Applications. http://www.its.dot.gov/aeris/pdf/
AERIS_Operational_Scenarios011014.pdf, January 2014.
[30] Berkely University of California. Mobile Millenium, December 2013.
[31] Daniel B. Work, Olli-Pekka Tossavainen, Sebastien Blandin, Alexandre M. Bayen, TochukwuIwuchukwu, and Kenneth Tracton. An Ensemble Kalman Filtering Approach to HighwayTra�c Estimation Using GPS Enabled Mobile Devices. Proceedings of the 47th IEEE Con-ference on Decision and Control, 2008.
[32] Dave Baarth. The bright side of sitting in tra�c: Crowdsourcing road congestion data.
[33] Susan Matthews. How Google Tracks Tra�c. Technical report, July 2013.
[34] Prashanth Mohan, Venkata N. Padmanabhan, and Ramachandran Ramjee. Nericell: RichMonitoring of Road and Tra�c Conditions using Mobile Smartphones. 2008.
[35] Sarfraz Nawaz, Christos Efstratiou, and Cecilia Mascolo. ParkSense: A Smartphone BasedSensing System For On-Street Parking. 2013.
48

[36] Ian Sherwin. Google open spot: A useful application that no one uses. Technical report, May2011.
[37] Anand Rajaraman, Jure Leskovec, and Je↵rey D. Ullman. Mining of Massive Datasets. Cam-bridge University Press, 2010.
[38] James Biagioni Tomas Gerlich, Timothy Merrifield, and Jakob Eriksson. EasyTracker: Auto-matic Transit Tracking, Mapping, and ArrivalTime Prediction Using Smartphones. 2011.
[39] Pengfei Zhou, Yuanqing Zheng, and Mo Li. How Long to Wait?: Predicting Bus Arrival Timewith Mobile Phone based Participatory Sensing. 2012.
[40] Matthew Keally, Gang Zhou, Guoliang Xing, Jianxin Wu, and Andrew Pyles. PBN: TowardsPractical Activity Recognition Using Smartphone-Based Body Sensor Networks. 2011.
[41] Smith-Waterman Algorithm. http://www-cs-faculty.stanford.edu/~eroberts/
courses/soco/projects/computers-and-the-hgp/smith_waterman.html.
[42] TestFlight FAQ. http://help.testflightapp.com/customer/portal/articles/
402851-testflight-faq, December 2012.
[43] The free web debugging proxy for any browser, system or platform. http://fiddler2.com/.
[44] Sarah Perez. Appcelerator Launches Open Mobile Marketplace, An App Store For AppComponents. Technical report, September 2011.
[45] Moment.js. http://momentjs.com.
[46] AAMVA Driver Standing Committee. Personal Identification — AAMVA North AmericanStandard — DL/ID Card Design. Technical report, American Association of Motor VehicleAdministrators, June 2012.
[47] Windows Azure - Solutions. http://www.windowsazure.com/en-us/solutions/.
[48] Google Maps JavaScript API v3. https://developers.google.com/maps/documentation/javascript/tutorial.
[49] Patrick Fletcher. Introduction to SignalR. http://www.asp.net/signalr/overview/
signalr-20/getting-started-with-signalr-20/introduction-to-signalr.
[50] tesseract-ocr - An OCR Engine that was developed at HP Labs between 1985 and 1995... andnow at Google. https://code.google.com/p/tesseract-ocr/.
49
Vita
Graduate College
University of Nevada, Las Vegas
Tharindu D. Abeygunawardana
Degrees:
Bachelor of Science in Computer Science 2010
University of Nevada Las Vegas
Thesis Title: Smart Data Collection Using Mobile Devices to Improve Transportation Systems
Thesis Examination Committee:
Chairperson, Dr. Kazem Taghva
Committee Member, Dr. John Minor
Committee Member, Dr. Matt Pedersen
Committee Member, Dr. Emma E. Regentova
50
Top Related