


Languages
Pages
Legal


Introduction
The invention and commercialization of electro-spray ionization (ESI) was revolutionary whenapplied to the field of organic analytical chem-istry. For the first time, chemically and thermallyfragile molecules (proteins, drugs, environmentalcompounds, to name a few classes) could easilyand reliably be analyzed in high sensitivity byLC/MS techniques. ESI is used today in thousandsof laboratories around the world for routine highsensitivity analysis of these and other analytes. As a testimony to the utility of this technique, itsinventor, Professor John Fenn, was one of therecipients of the Nobel Prize in chemistry in 2002.
As remarkable as the technique of ESI is, it doesnot ionize all organic compounds of interest thatmay be eluted from an HPLC. It has been estimatedthat about 80% of all analytes respond by ESI,leaving a significant fraction as undetectable. Thislimitation was noticed early in the development ofESI, and other ionization techniques were devel-oped almost simultaneously to fill this need. The technique of atmospheric pressure chemicalionization (APCI) and the related atmospheric
Simultaneous Electrospray andAtmospheric Pressure Chemical Ionization: The Science Behind theAgilent Multimode Ion Source
Technical Overview
Steven M. Fischer and Patrick D. PerkinsAgilent Technologies
pressure photoionization (APPI) are the best-known alternatives.
Further study of ESI and APCI pointed up funda-mental differences between them.[1–3] The sprayconditions and voltage conditions for optimal ESIoperation are very different than for optimal APCIoperation. In optimized ESI, ion formation occursin the following sequence:
1. A surface charge is induced on the emergingliquid by imposition of an external electricalfield
2. The charged liquid is converted to a spray ofdroplets
3. The droplets shrink due to solvent evapora-tion, which increases the surface charge density
4. Droplets undergo fission as a consequence ofthe high surface field strength
5. When a droplet is small enough, ions are ejectedfrom the droplet due to the high field strengthat the surface of the droplet

Simultaneous Electrospray and Atmospheric Pressure ChemicalIonization: The Science Behind the Agilent Multimode Ion Source
2
Agilent Technologies
Under optimal APCI conditions, ion formationoccurs as follows:
1. A spray of droplets is formed
2. The spray is dried completely creating a mix-ture of solvent molecules and analyte mole-cules in the gas phase
3. The solvent molecules and analyte moleculespass through a corona discharge
4. The corona discharge ionizes the solvent mole-cules, creating solvent ions
5. The solvent ions transfer charge to the analytemolecules, creating analyte ions
From the above lists, it should be apparent thatthe spray formation and timing of ion generationare different in ESI and APCI. As a result of thesedifferences, all MS manufacturers have developeddedicated optimized ion sources for each tech-nique. Users who want to analyze a sample usingboth techniques generally must run the analysisusing one source first, and if there is no response,run the sample on the instrument using the othersource. This significantly decreases the number ofsamples per day that may be analyzed on a giveninstrument.
In response to this diminished throughput causedby the fundamental differences between ESI andAPCI, novel ion sources have been developed tocombine the two ionization techniques into onesource.[4,5] The differences in performance of thesecombination (also known as “dual-mode” or “multimode”) sources may be traced to how theyaddress the incompatibilities between ESI andAPCI. Do they perform the ionization in the sameregion of space, or do they separate the ionizationregions and attempt to optimize the performanceof each? And if the ionization regions are sepa-rate, how is the sample delivered to the tworegions and how is the separation maintained?This document describes the features of theAgilent multimode ionization source and how itaddresses these incompatibilities, permitting high-flow, high-sensitivity ESI and APCI to be per-formed independently or simultaneously on asingle injection of a sample.
Experimental
All experiments were performed using an Agilent1100 Series LC system comprised of a binarypump, autosampler, thermostatted column com-partment; and an Agilent 1100 Series LC/MSD SL(G1956D) quadrupole mass spectrometer. TheLC/MSD was equipped with a multimode source,dedicated ESI source, or dedicated APCI source asneeded. The sources for the LC/MSD are all inter-changeable. The multimode source is currentlysupported on G1946 LC/MSD instruments, modelsB, C, and D, and on all G1956 LC/MSD instru-ments, models A and B. However, some of thesemodels need both hardware and software upgradesto be able to control the multimode source; seeyour Agilent representative for details.
The LC/MS conditions for the analysis of the sam-ples in this note vary with sample type; therefore,they are stated in the sidebars in the appropriatesection.
Results and Discussion
The Agilent multimode source is a compact ionsource that fits on the left side of the LC/MSDquadrupole mass spectrometer. Some distinguish-ing features of the source are highlighted (Figure 1).
Concepts behind simultaneous (mixed mode) ESIand APCI operation
A functional view of this source is given in Fig-ure 2. The top part of the source is the “ESI zone”where the conditions exist for optimal electro-spray ion formation. The bottom part of thesource contains the “APCI zone” where optimalconditions exist for this ionization process. Someof the functional elements of this source are alsoshown and are discussed in detail below.

3
Simultaneous Electrospray and Atmospheric Pressure ChemicalIonization: The Science Behind the Agilent Multimode Ion Source
Agilent Technologies
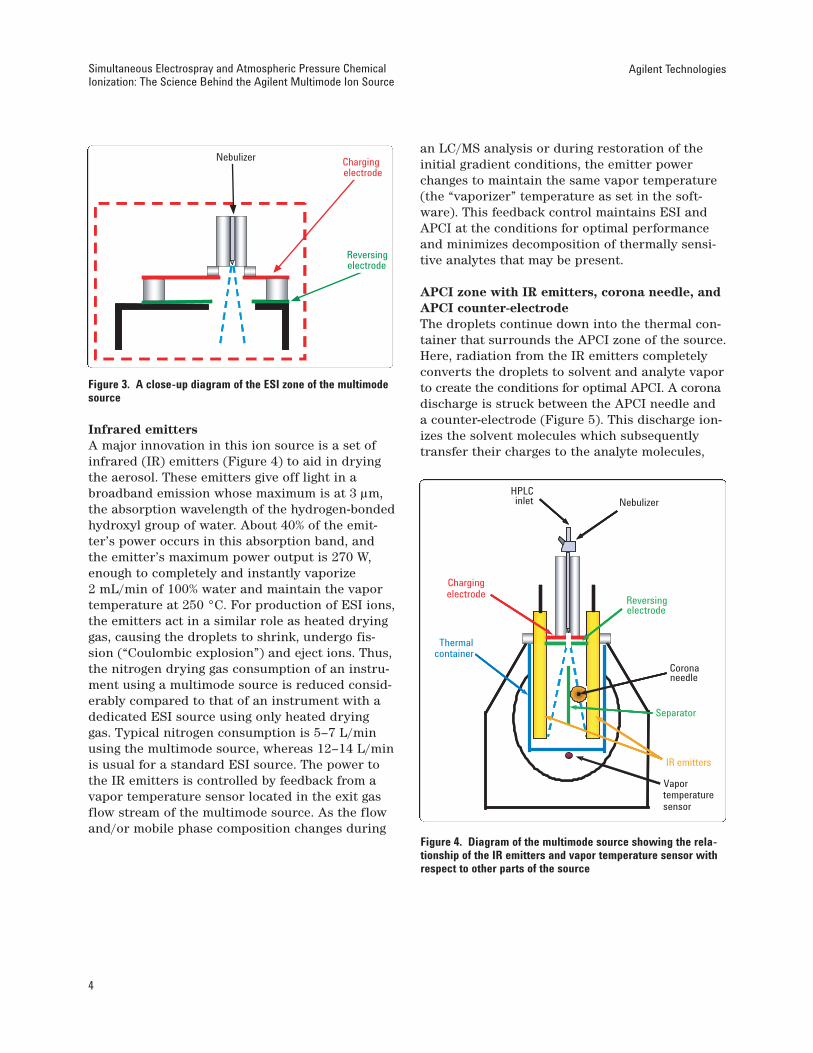
ESI zone with nebulizer, charging electrode,and reversing electrodeThis source uses the same patented orthogonalESI geometry with a grounded nebulizer as isfound on Agilent’s dedicated ESI source. Thisdesign has proven to be extremely robust, direct-ing the vast majority of solvent and spent dropletsto waste while selectively diverting the ions to thecapillary entrance of the mass spectrometer. Thegrounded nebulizer permits the mass spectrome-ter to be interfaced directly to other devices, e.g.,capillary electrophoresis instruments, withoutfear of electrical interactions or special isolationprecautions. The elements in the nebulizer arecarefully optimized to provide the proper dropletsize and size distribution for maximum produc-tion of ions. The charging electrode in the ESIzone (Figure 3) induces the surface charge on theliquid to start the ion formation, and ESI ions aregenerated here. The nebulizing gas flow pushesthe droplets and ESI ions past the reversing elec-trode towards the APCI zone below.
APCI corona needle
Nebulizer
Sensor for vapor temperature Field-shaping electrodes
IRemitters
APCI counterelectrode
Figure 1. (left) The Agilent multimode ion source mounted on the MSD quadrupole mass spectrometer. (right) Source opened toshow a few of the inner parts.
Capillary
HPLC Nebulizer
Drying gas
Corona needle
Thermalcontainer
Chargingelectrode
Reversing electrode
Sensor for vapor temperature
APCI counterelectrode
inlet
ESI Zone
APCI Zone
IR emitters
Figure 2. An overview diagram of the multimode source
4
Agilent Technologies
Infrared emittersA major innovation in this ion source is a set ofinfrared (IR) emitters (Figure 4) to aid in dryingthe aerosol. These emitters give off light in abroadband emission whose maximum is at 3 µm,the absorption wavelength of the hydrogen-bondedhydroxyl group of water. About 40% of the emit-ter’s power occurs in this absorption band, andthe emitter’s maximum power output is 270 W,enough to completely and instantly vaporize 2 mL/min of 100% water and maintain the vaportemperature at 250 °C. For production of ESI ions,the emitters act in a similar role as heated dryinggas, causing the droplets to shrink, undergo fis-sion (“Coulombic explosion”) and eject ions. Thus,the nitrogen drying gas consumption of an instru-ment using a multimode source is reduced consid-erably compared to that of an instrument with adedicated ESI source using only heated dryinggas. Typical nitrogen consumption is 5–7 L/minusing the multimode source, whereas 12–14 L/minis usual for a standard ESI source. The power tothe IR emitters is controlled by feedback from avapor temperature sensor located in the exit gasflow stream of the multimode source. As the flowand/or mobile phase composition changes during
an LC/MS analysis or during restoration of theinitial gradient conditions, the emitter powerchanges to maintain the same vapor temperature(the “vaporizer” temperature as set in the soft-ware). This feedback control maintains ESI andAPCI at the conditions for optimal performanceand minimizes decomposition of thermally sensi-tive analytes that may be present.
APCI zone with IR emitters, corona needle, andAPCI counter-electrodeThe droplets continue down into the thermal con-tainer that surrounds the APCI zone of the source.Here, radiation from the IR emitters completelyconverts the droplets to solvent and analyte vaporto create the conditions for optimal APCI. A coronadischarge is struck between the APCI needle anda counter-electrode (Figure 5). This discharge ion-izes the solvent molecules which subsequentlytransfer their charges to the analyte molecules,
Simultaneous Electrospray and Atmospheric Pressure ChemicalIonization: The Science Behind the Agilent Multimode Ion Source
IR emitters
Nebulizer
Corona
sensor
HPLC inlet
needle
Chargingelectrode
Reversing electrode
Thermal container
Separator
Vaportemperature
Figure 4. Diagram of the multimode source showing the rela-tionship of the IR emitters and vapor temperature sensor withrespect to other parts of the source
Charging electrode
Reversing electrode
Nebulizer
Figure 3. A close-up diagram of the ESI zone of the multimodesource

5
Agilent Technologies Simultaneous Electrospray and Atmospheric Pressure ChemicalIonization: The Science Behind the Agilent Multimode Ion Source
producing ions. A separator in the middle of thesource screens most of the ESI ions from reactionwith the corona discharge present in the APCIzone. The ESI ion stream on one side of the sepa-rator and the APCI ion stream from the other sidecombine below the separator and are guided simul-taneously into the capillary entrance of the MSD.
Simultaneous (mixed mode) ESI and APCI
From the above discussion, it may be seen that thedesign of the multimode source solves the prob-lems of maintaining separate (but connected) ESIand APCI regions in a simple yet elegant fashion.The liquid from a single nebulizer is first chargedand converted to an aerosol in the presence of anelectrical field, the conditions for optimal ESI ionformation. Then, the residual droplets and ESIions are pushed past the reversing electrode intothe heated region on their way to the APCI zone.
The reversing electrode is the electrical boundarybetween the ESI and APCI zones, and without itions would tend to migrate back toward the charg-ing electrode instead of forward toward the massspectrometer entrance. In the thermal containerspace between the ESI and APCI zones, the IRemitters convert the residual droplets to vaporwhile having no effect on any ESI ions that may be present. Once the vapor reaches the APCI zone,the conditions exist for optimal APCI ion forma-tion. Thus, simultaneous efficient production ofESI and APCI ions is a function of the overalldesign of the source and the interaction of itsunique parts.
If desired, the multimode source also functionswell in ESI-only or APCI-only modes. To performonly ESI, the APCI corona needle voltage is turnedoff while leaving the ESI charging electrode volt-age on, and only ESI ions are produced. To per-form only APCI, the ESI charging electrode isturned off while leaving the APCI corona needlevoltage on, and only APCI ions are produced. Thesevoltages are under data system control, and thusthe instrument may be switched between ESI,APCI, and mixed mode operation manually with aclick of the mouse, automatically during an analy-sis, or automatically during a sequence.
Coronaneedle
Counterelectrode pin
Figure 5. A close-up diagram of the APCI zone of the multi-mode source

6
Agilent Technologies
Proof of concept: ESI-only, APCI-only and simulta-neous (mixed mode) ESI and APCI
The proof of concept for simultaneous ESI andAPCI operation is shown in Figure 6. A mixture of bovine insulin and indole was infused into themultimode source mounted on the LC/MSDquadrupole system. Bovine insulin, like all pro-teins possessing multiple basic sites, yields a char-acteristic multiple-ion spectrum in positive ESImode; it has no response in APCI mode. Indole,being a small molecule with a weakly basic site,protonates poorly under ESI conditions butresponds well in positive APCI mode. When a mix-ture of the two was analyzed using the multimodesource, bovine insulin had a strong response inESI-only mode, whereas indole had a very weakresponse. The opposite was true in APCI-onlymode, with indole having a strong response. Bothcompounds responded well when the simultane-ous ionization mode was enabled. This and othertests indicate that the multimode source producesESI and APCI spectra similar to those of the dedi-cated sources and that the two ionization modesmay be switched off, on, or combined for simulta-neous ionization.
Simultaneous Electrospray and Atmospheric Pressure ChemicalIonization: The Science Behind the Agilent Multimode Ion Source
118.1
m/z0 1000 2000
Max: 90624
Indole
1434.3 1912.0
m/z0 1000 2000
Max: 103701
118.1 2867.9
1434.3
m/z0 1000 2000
Max: 771491912.1
118.1
2867.8
InsulinIndole
Insulin
MM
MM-APCI
MM-Mixed
-ESI
Indole 1147.7
1147.6
Figure 6. Proof of concept of simultaneous (mixed mode) ESIand APCI using a mixture of indole (50 pmol/µL) and bovineinsulin (9 pmol/µL). (top) Source in ESI-only mode, exhibitinga response from insulin with a weak response from indole.(middle) Source in APCI-only mode, with only indole showinga response. (bottom) Source in mixed mode, with both indoleand insulin showing strong responses.
LC ConditionsColumn: None (infusion)
0.1% acetic acidFlow rate: 0.1 mL/min
MS ConditionsSource: Multimode, positive ESI-only,
APCI-only, or mixed modeDrying gas flow: 5 L/minNebulizer: 40 psigDrying gas temp: 350 °CVaporizer temp: 200 °CCapillary voltage: 2500 VCorona current: 2 µAPeakwidth: 0.2 minTime filter: OnScan: 100–3000 m/zFragmentor: 150 VStepsize: 0.1 m/z
7
Agilent Technologies Simultaneous Electrospray and Atmospheric Pressure ChemicalIonization: The Science Behind the Agilent Multimode Ion Source
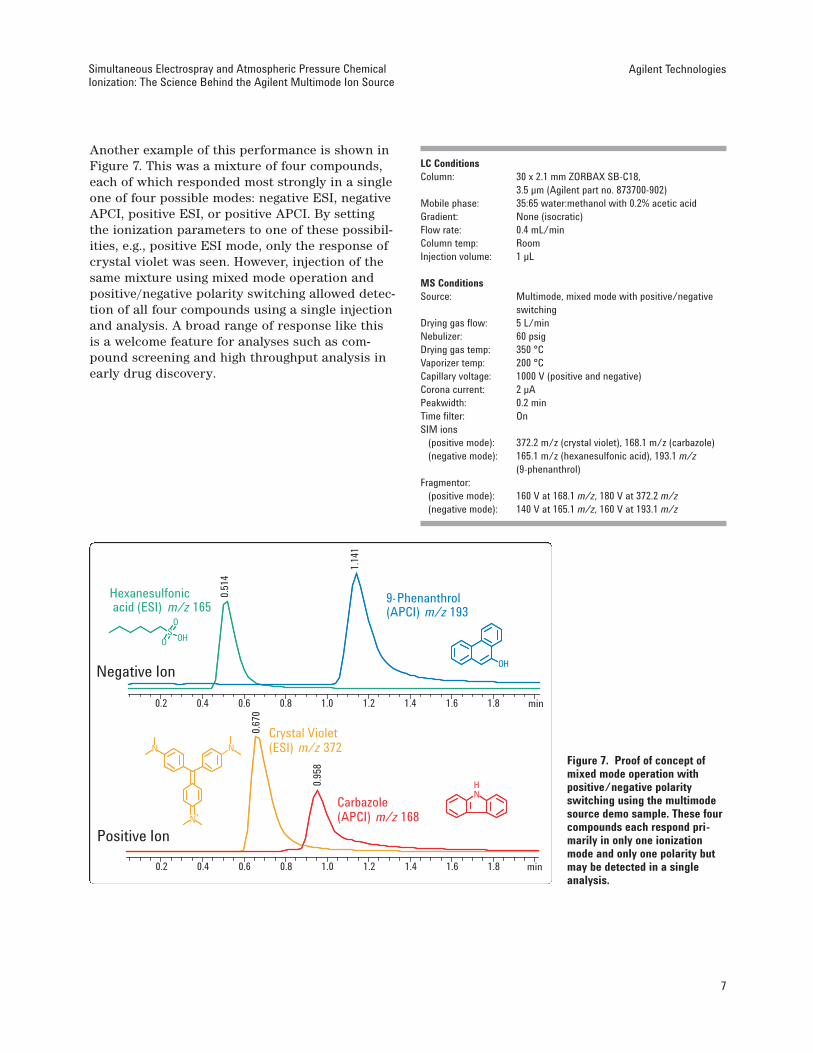
Another example of this performance is shown inFigure 7. This was a mixture of four compounds,each of which responded most strongly in a singleone of four possible modes: negative ESI, negativeAPCI, positive ESI, or positive APCI. By settingthe ionization parameters to one of these possibil-ities, e.g., positive ESI mode, only the response ofcrystal violet was seen. However, injection of thesame mixture using mixed mode operation andpositive/negative polarity switching allowed detec-tion of all four compounds using a single injectionand analysis. A broad range of response like thisis a welcome feature for analyses such as com-pound screening and high throughput analysis inearly drug discovery.
LC ConditionsColumn: 30 x 2.1 mm ZORBAX SB-C18,
3.5 µm (Agilent part no. 873700-902)Mobile phase: 35:65 water:methanol with 0.2% acetic acidGradient: None (isocratic)Flow rate: 0.4 mL/minColumn temp: RoomInjection volume: 1 µL
MS ConditionsSource: Multimode, mixed mode with positive/negative
switchingDrying gas flow: 5 L/minNebulizer: 60 psigDrying gas temp: 350 °CVaporizer temp: 200 °CCapillary voltage: 1000 V (positive and negative) Corona current: 2 µAPeakwidth: 0.2 minTime filter: OnSIM ions
(positive mode): 372.2 m/z (crystal violet), 168.1 m/z (carbazole)(negative mode): 165.1 m/z (hexanesulfonic acid), 193.1 m/z
(9-phenanthrol)Fragmentor:
(positive mode): 160 V at 168.1 m/z, 180 V at 372.2 m/z(negative mode): 140 V at 165.1 m/z, 160 V at 193.1 m/z
min0.2 0.4 0.6 0.8 1.0 1.2 1.4 1.6 1.8
0.51
4
1.14
1
min0.2 0.4 0.6 0.8 1.0 1.2 1.4 1.6 1.8
0.67
0
0.95
8
Negative Ion
Hexanesulfonicacid (ESI) m/z 165
9-Phenanthrol(APCI) m/z 193
SO
O OH
OH
Positive Ion
Crystal Violet(ESI) m/z 372
Carbazole(APCI) m/z 168
NH
N+
NN
Figure 7. Proof of concept ofmixed mode operation with positive/negative polarityswitching using the multimodesource demo sample. These fourcompounds each respond pri-marily in only one ionizationmode and only one polarity butmay be detected in a singleanalysis.
8
Agilent Technologies
Infrared emitters provide conditions for optimalAPCI
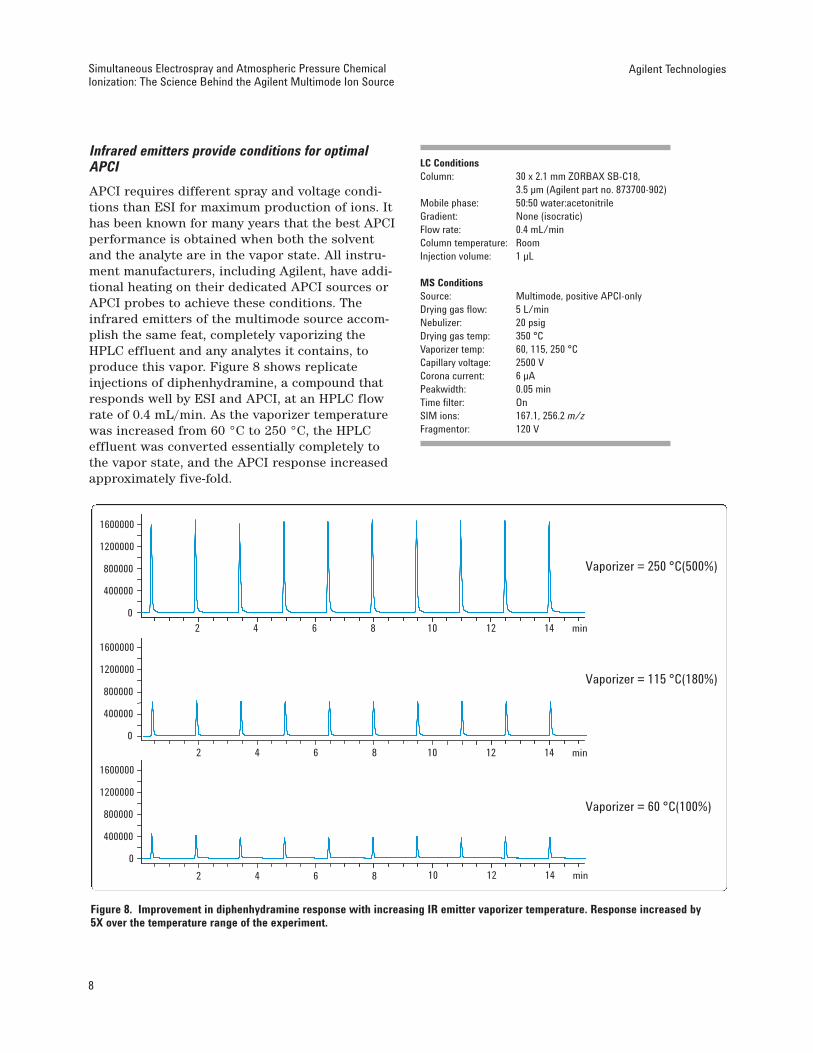
APCI requires different spray and voltage condi-tions than ESI for maximum production of ions. Ithas been known for many years that the best APCIperformance is obtained when both the solventand the analyte are in the vapor state. All instru-ment manufacturers, including Agilent, have addi-tional heating on their dedicated APCI sources orAPCI probes to achieve these conditions. Theinfrared emitters of the multimode source accom-plish the same feat, completely vaporizing theHPLC effluent and any analytes it contains, toproduce this vapor. Figure 8 shows replicate injections of diphenhydramine, a compound thatresponds well by ESI and APCI, at an HPLC flowrate of 0.4 mL/min. As the vaporizer temperaturewas increased from 60 °C to 250 °C, the HPLCeffluent was converted essentially completely tothe vapor state, and the APCI response increasedapproximately five-fold.
LC ConditionsColumn: 30 x 2.1 mm ZORBAX SB-C18,
3.5 µm (Agilent part no. 873700-902)Mobile phase: 50:50 water:acetonitrileGradient: None (isocratic)Flow rate: 0.4 mL/minColumn temperature: RoomInjection volume: 1 µL
MS ConditionsSource: Multimode, positive APCI-onlyDrying gas flow: 5 L/minNebulizer: 20 psigDrying gas temp: 350 °CVaporizer temp: 60, 115, 250 °CCapillary voltage: 2500 VCorona current: 6 µAPeakwidth: 0.05 minTime filter: OnSIM ions: 167.1, 256.2 m/zFragmentor: 120 V
Simultaneous Electrospray and Atmospheric Pressure ChemicalIonization: The Science Behind the Agilent Multimode Ion Source
Vaporizer = 250 °C(500%)
Vaporizer = 115 °C(180%)
Vaporizer = 60 °C(100%)
min2 4 6 8 10 12 14
0
400000
800000
1200000
1600000
min2 4 6 8 10 12 14
0
400000
800000
1200000
1600000
min2 4 6 8 10 12 14
0
400000
800000
1200000
1600000
Figure 8. Improvement in diphenhydramine response with increasing IR emitter vaporizer temperature. Response increased by 5X over the temperature range of the experiment.
9
Agilent Technologies Simultaneous Electrospray and Atmospheric Pressure ChemicalIonization: The Science Behind the Agilent Multimode Ion Source
A more dramatic illustration of this effect isshown in Figure 9. The compound here is reser-pine, also a compound that responds well by bothESI and APCI and is generally used to test thesensitivity of LC/MS systems. Reserpine has alower vapor pressure than diphenhydramine whencompared at the same temperature, so greatervaporizer temperatures are needed to convert theanalyte into the gas phase. The experiment con-sisted of performing five consecutive injections of reserpine, 10 pg each, increasing the vaporizertemperature by 25 °C, performing another fiveinjections, and so forth up to the temperaturelimit. Then the vaporizer was allowed to cool to its starting temperature while injections of reser-pine were continued. The flow rate and mobilephase during this experiment was 1.0 mL/min of75:25 methanol:water with 5 mM ammonium for-mate, typical for APCI, which performs better athigher flow rates.
The signal response for reserpine increasedalmost 17 times as the vaporizer temperature wasincreased. Furthermore, the response of the emit-ters was quite rapid. The command to raise thetemperature occurred simultaneously with aninjection. In the 20 seconds that elapsed while theanalyte traversed the tubing and column from theALS to the ion source, the gas temperature essen-tially reached and stabilized at the new value, 25 °C higher. The source also cooled reasonablyrapidly, dropping from 250 °C to 125 °C in aboutthree minutes. A final point of this figure is thatthe increased signal also resulted in better repro-ducibility of the measured response. Data obtainedat the lowest vaporizer temperature, 125 °C, had a higher %RSD value of 13% (four replicates) com-pared to the data taken at higher temperatures.
LC ConditionsColumn: 30 x 2.1 mm ZORBAX SB-C18,
3.5 µm (Agilent part no. 873700-902)Mobile phase: 25:75 water:methanol with 5 mM ammonium
formateGradient: None (isocratic)Flow rate: 1.0 mL/minColumn temperature: RoomInjection volume: 1 µL, 5 injections at each vaporizer temperature
MS ConditionsSource: Multimode, APCI-onlyDrying gas flow: 5 L/minNebulizer: 20 psigDrying gas temp: 350 °CVaporizer temp: 125—250 °C in 25 °C stepsCapillary voltage: –3000 VCorona current: 6 µAPeakwidth: 0.1 minTime filter: OnSIM ion: 609.3 m/zFragmentor: 200 V

10
Agilent Technologies
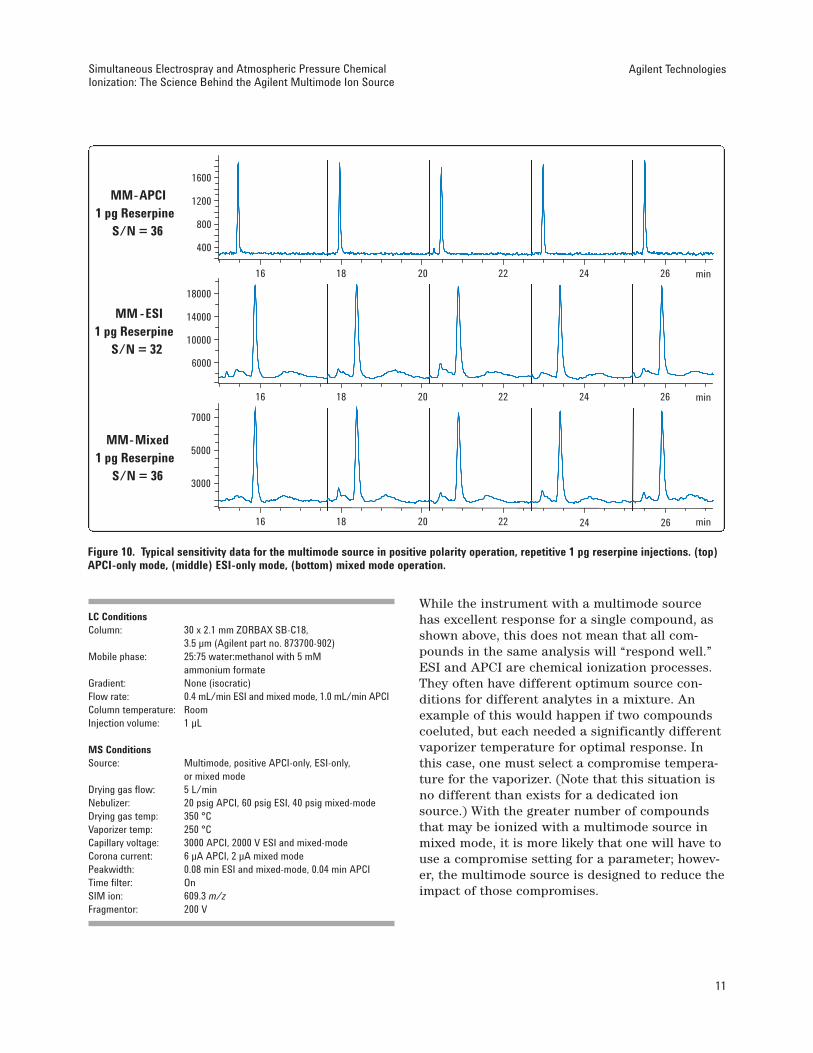
Good sensitivity in ESI, APCI, and mixed mode
The multimode source can achieve detection limitsin the low picogram range in all modes of opera-tion. Shown in Figure 10 are replicate injections of the compound reserpine. As is noted on the leftside of the figure, the measured sensitivity was 36 in positive APCI mode (top), 32 in positive ESImode (middle), and 36 in positive mixed mode(bottom). The source produced comparable signal/noise values for this compound in all modes,suggesting that mixed mode operation achieved
essentially the same sensitivity as obtained in adedicated mode. Furthermore, these sensitivityvalues were similar to a dedicated ESI or dedi-cated APCI ion source on the same instrument(data not shown; current sensitivity specificationsfor this instrument are 20:1 signal/noise witheither a dedicated ESI or dedicated APCI source).There is typically no compromise in sensitivity forthe analysis of a single compound analyzed underthe same conditions.
Simultaneous Electrospray and Atmospheric Pressure ChemicalIonization: The Science Behind the Agilent Multimode Ion Source
min10 20 30 40 50
500
1000
1500
2000
2500
3000
3500
Vaporizer temperature
250 °C
225 °C
200 °C
175 °C
150 °C
125 °C
Relativepeak area
16.8
15.1
12.7
8.3
3.7
1.0
Rel. std dev.4 replicates
2.0%
1.7%
2.1%
2.9%
1.5%
13.4%
75:25 MeOH:water, 5 mM ammonium formate1 mL/min
Figure 9. Improvement in response of repetitive 10 pg reserpine injections with increasing IR emitter vaporizer temperature.Response increased by 16.8X over the temperature range of the experiment. The data also shows the rapid controlled response ofthe IR emitters to a 25 °C step change in the setpoint.
11
While the instrument with a multimode sourcehas excellent response for a single compound, asshown above, this does not mean that all com-pounds in the same analysis will “respond well.”ESI and APCI are chemical ionization processes.They often have different optimum source con-ditions for different analytes in a mixture. Anexample of this would happen if two compoundscoeluted, but each needed a significantly differentvaporizer temperature for optimal response. Inthis case, one must select a compromise tempera-ture for the vaporizer. (Note that this situation isno different than exists for a dedicated ionsource.) With the greater number of compoundsthat may be ionized with a multimode source inmixed mode, it is more likely that one will have touse a compromise setting for a parameter; howev-er, the multimode source is designed to reduce theimpact of those compromises.
Agilent Technologies Simultaneous Electrospray and Atmospheric Pressure ChemicalIonization: The Science Behind the Agilent Multimode Ion Source
MM -ESI 1 pg Reserpine
S/N = 32
MM-APCI1 pg Reserpine
S/N = 36
MM-Mixed 1 pg Reserpine
S/N = 36
min16 18 20 22 24 26
400
800
1200
1600
6000
10000
14000
18000
24 26
3000
5000
7000
min16 18 20 22 24 26
min16 18 20 22
Figure 10. Typical sensitivity data for the multimode source in positive polarity operation, repetitive 1 pg reserpine injections. (top)APCI-only mode, (middle) ESI-only mode, (bottom) mixed mode operation.
LC ConditionsColumn: 30 x 2.1 mm ZORBAX SB-C18,
3.5 µm (Agilent part no. 873700-902)Mobile phase: 25:75 water:methanol with 5 mM
ammonium formateGradient: None (isocratic)Flow rate: 0.4 mL/min ESI and mixed mode, 1.0 mL/min APCIColumn temperature: RoomInjection volume: 1 µL
MS ConditionsSource: Multimode, positive APCI-only, ESI-only,
or mixed modeDrying gas flow: 5 L/minNebulizer: 20 psig APCI, 60 psig ESI, 40 psig mixed-modeDrying gas temp: 350 °CVaporizer temp: 250 °CCapillary voltage: 3000 APCI, 2000 V ESI and mixed-modeCorona current: 6 µA APCI, 2 µA mixed modePeakwidth: 0.08 min ESI and mixed-mode, 0.04 min APCITime filter: OnSIM ion: 609.3 m/zFragmentor: 200 V
12
Agilent Technologies
Analysis of thermally labile compounds: IR emittersand temperature feedback
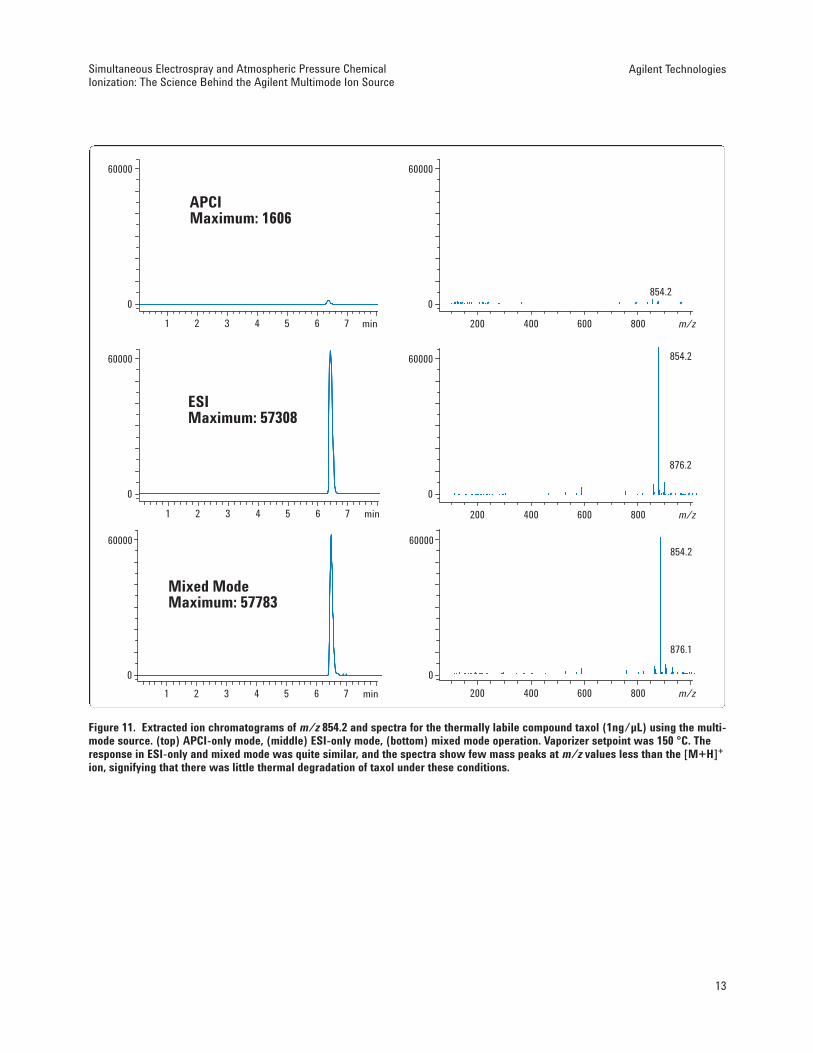
ESI is renowned for its ability to ionize thermallylabile substances such as proteins and drugs,which in part gives rise to its great utility. As statedpreviously, the multimode source uses IR emittersto aid in drying the droplets during the ESIprocess. A natural concern is that the emittersmay introduce enough heat, or introduce heat inan uncontrolled fashion, and promote the thermaldegradation of these compounds under ESI condi-tions. Shown in Figure 11 is the analysis of thechemotherapy agent, taxol, a compound thatdegrades if exposed to too high a temperature.Using a vaporizer temperature of 150 °C, taxolhad essentially no response in APCI mode (top). It was analyzed successfully by positive ESI-onlymode or positive mixed mode (middle and bot-tom). Only minor peaks appeared in the massspectra other than the protonated molecular ion,attesting to the lack of degradation products. Thegentleness of the heating by the IR emitters isattributable to the vapor temperature sensor andfeedback control which enable accurate, rapid andprecise adjustment of the vapor temperature atthe setpoint. Another example of the analysis of athermally labile compound was presented previ-ously in Figure 6, the spectrum of bovine insulin.
Higher HPLC flow rates: IR emitters and tempera-ture feedback
Typical analytical HPLC flow rates are in therealm of 0.25–0.4 mL/min using 2.1 mm columns.However, high throughput analysis is generallyperformed on 4.6 mm ID columns, injecting sev-eral hundred samples per day into an LC/MS, withcolumn flow rates between 1–2 mL/min. A dedi-cated ESI source normally has poor sensitivity atthese higher flow rates and is operated with apostcolumn split, diverting the majority of the
split flow to waste. This works but is inconvenientand needs additional parts in the system. Further-more, operation in APCI mode becomes moreattractive at higher flow rates as the analyte sig-nal generally increases at higher flows.
As mentioned previously, the IR emitters emitenough power to vaporize HPLC effluents at up to 2 mL/min flow rate. The data in Figure 9 wasobtained at 1 mL/min flow rate and illustratesthat the feedback control is rapid enough to tracka step change in temperature or mobile phasecomposition, coming to a steady state in a matterof 20–30 seconds. Data shown in Figures 12 and13 were obtained at even higher flow rates, 1.5 mL/min.
Simultaneous Electrospray and Atmospheric Pressure ChemicalIonization: The Science Behind the Agilent Multimode Ion Source
LC ConditionsColumn: 50 x 2.1 mm ZORBAX SB-C8,
5 µm (Agilent part no. 860975-906)Mobile phase: A = water with 0.05% formic acid
B = acetonitrileGradient: 10% B at 0 min
95% B at 7 minStop run at 8 min
Flow rate: 0.4 mL/minColumn temperature: 30 °CInjection volume: 1 µL
MS ConditionsSource: Multimode, APCI-only, ESI-only
or mixed modeDrying gas flow: 5 L/minNebulizer: 20 psig APCI, 60 psig ESI, 40 psig mixed-mode Drying gas temp: 200 °CVaporizer temp: 150 °CCapillary voltage: 2000 VCorona current: 6 µA APCI, 2 µA mixed-modePeakwidth: 0.1 minTime filter: OnScan: 100 –1000 m/zFragmentor: 150 VStepsize: 0.1 m/z
13
Agilent Technologies Simultaneous Electrospray and Atmospheric Pressure ChemicalIonization: The Science Behind the Agilent Multimode Ion Source
m/z200 400 600 800
854.2
854.2
876.2
854.2
876.1
min1 2 3 4 5 6 7
APCIMaximum: 1606
0
60000
Mixed ModeMaximum: 57783
0
60000
ESIMaximum: 57308
m/z200 400 600 800
m/z200 400 600 800
min1 2 3 4 5 6 7
min1 2 3 4 5 6 7
0
60000
0
60000
0
60000
0
60000
Figure 11. Extracted ion chromatograms of m/z 854.2 and spectra for the thermally labile compound taxol (1ng/µL) using the multi-mode source. (top) APCI-only mode, (middle) ESI-only mode, (bottom) mixed mode operation. Vaporizer setpoint was 150 °C. Theresponse in ESI-only and mixed mode was quite similar, and the spectra show few mass peaks at m/z values less than the [M+H]+
ion, signifying that there was little thermal degradation of taxol under these conditions.
14
Agilent Technologies
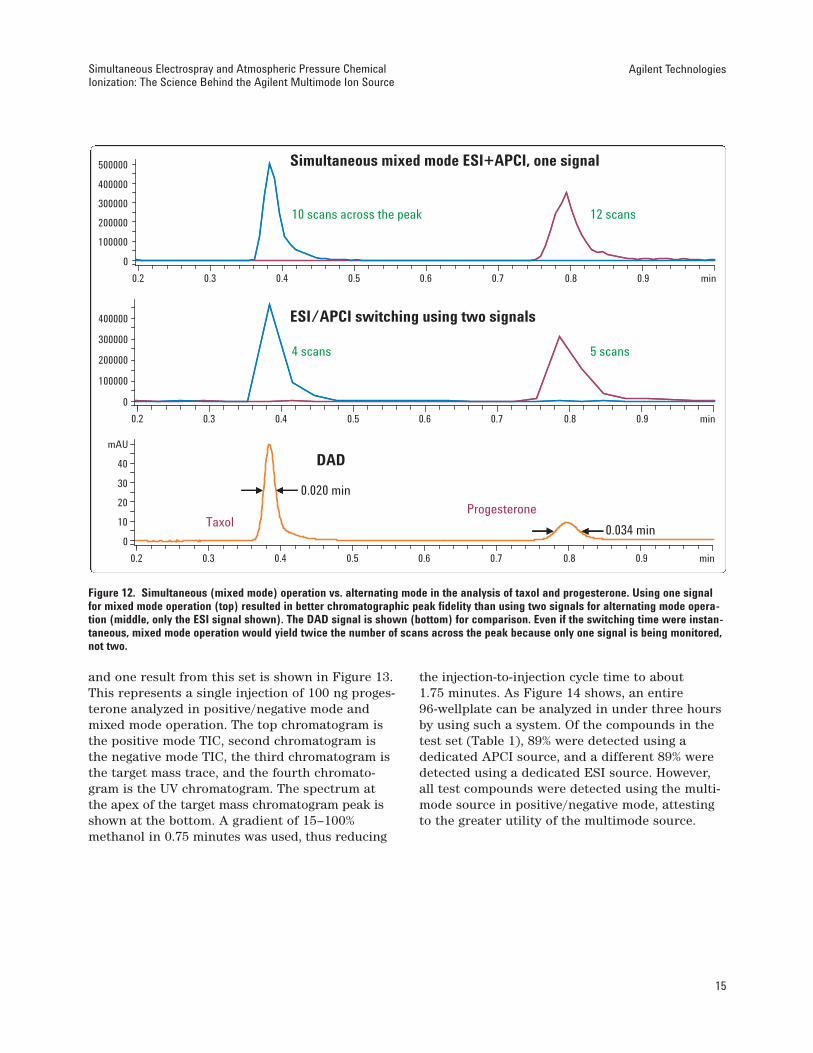
Higher HPLC flow rates: Mixed mode operationyields better data for fast-eluting chromatographicpeaks
It is possible to analyze samples either by mixedmode ESI and APCI or by alternating between thetwo ionization techniques on a scan-to-scan basis.When acquiring data, the instrument uses eitherone signal for mixed mode or two signals for alter-nating operation. There is a difference in the dataquality between the two operational modes whichbecomes apparent when analyzing the narrowerchromatographic peaks obtained during fast chro-matography (Figure 12). Two compounds, taxoland progesterone, were analyzed using isocraticconditions in positive mixed mode (one signal, top trace) and in alternating ESI and APCI modes(two signals, the ESI signal is the middle trace).All other parameters: mass range, a/d samplingrate, etc. were held constant. (The signal from theUV detector is shown in the bottom trace for com-parison.) The effect on the data is obvious, asabout two times more scans across the peak wereobtained when using mixed mode than when alter-nating modes. The reduction in chromatographicpeak fidelity was caused by the fact that theinstrument was monitoring two signals instead of one. Looking at it another way, in alternatingmode operation, the instrument was not acquiringESI data half of the time and was not acquiringAPCI data during the other half of the time. But inmixed mode operation, the instrument was acquir-ing ESI data and APCI data all of the time. Note,the time it takes to switch between ESI and APCIis only a minor contributor to the differencesobserved. If the switching time were instanta-neous, the instrument would still acquire twice asmany scans across the peak in mixed mode opera-tion. Therefore, mixed mode is in general thepreferred mode of operation.
Putting it all together: applications examples
High throughput analysisHigh throughput analysis benefits from all thefeatures of the multimode source: good ESI sensi-tivity, good APCI sensitivity, ability to handlehigher HPLC flow rates, better chromatographicperformance with mixed mode operation andhigher HPLC flow rates, and better productivity in mixed mode operation. Faster injection-to-injection cycle time is obtained by combiningthese features with optimized HPLC techniques:short columns with 1.8 micron particle size,higher HPLC flow rates, minimized delay volume,overlapped injections, and alternating columnregeneration.[6] A test set composed of pharma-ceuticals and their intermediates was analyzed,
Simultaneous Electrospray and Atmospheric Pressure ChemicalIonization: The Science Behind the Agilent Multimode Ion Source
LC ConditionsColumn: 15mm x 4.6 mm ZORBAX RRHT SB-C18,
1.8 µm (Agilent part no. 821975-902)Mobile phase: A = water with 0.2% acetic acid
B = acetonitrile with 0.2% acetic acidGradient: None (isocratic), 45% A, 55% BFlow rate: 1.5 mL/minColumn temperature: 40 °CInjection volume: 1 µLDiode-array detector: Signal 240, 10 nm; reference 340. 20 nm
MS ConditionsSource: Multimode, positive mixed mode
or alternating ESI and APCIDrying gas flow: 7 L/minNebulizer: 60 psigDrying gas temp: 200 °CVaporizer temp: 175 °CCapillary voltage: 1500 VCorona current: 2 µAPeakwidth: 0.04 minTime filter: OffScan: 200–900 m/zFragmentor: 120 VStepsize: 0.1 m/z
15
and one result from this set is shown in Figure 13.This represents a single injection of 100 ng proges-terone analyzed in positive/negative mode andmixed mode operation. The top chromatogram isthe positive mode TIC, second chromatogram isthe negative mode TIC, the third chromatogram isthe target mass trace, and the fourth chromato-gram is the UV chromatogram. The spectrum atthe apex of the target mass chromatogram peak isshown at the bottom. A gradient of 15–100%methanol in 0.75 minutes was used, thus reducing
the injection-to-injection cycle time to about 1.75 minutes. As Figure 14 shows, an entire 96-wellplate can be analyzed in under three hoursby using such a system. Of the compounds in thetest set (Table 1), 89% were detected using adedicated APCI source, and a different 89% weredetected using a dedicated ESI source. However,all test compounds were detected using the multi-mode source in positive/negative mode, attestingto the greater utility of the multimode source.
Agilent Technologies Simultaneous Electrospray and Atmospheric Pressure ChemicalIonization: The Science Behind the Agilent Multimode Ion Source
0
10
20
30
40
0.2
min0.2 0.3 0.4 0.5 0.6 0.7 0.8 0.9
0
100000
200000
300000
400000
500000
0.020 min
0.034 min
mAU
0
100000
200000
300000
400000
4 scans
12 scans10 scans across the peak
5 scans
Simultaneous mixed mode ESI+APCI, one signal
ESI/APCI switching using two signals
DAD
TaxolProgesterone
min0.3 0.4 0.5 0.6 0.7 0.8 0.9
min0.2 0.3 0.4 0.5 0.6 0.7 0.8 0.9
Figure 12. Simultaneous (mixed mode) operation vs. alternating mode in the analysis of taxol and progesterone. Using one signalfor mixed mode operation (top) resulted in better chromatographic peak fidelity than using two signals for alternating mode opera-tion (middle, only the ESI signal shown). The DAD signal is shown (bottom) for comparison. Even if the switching time were instan-taneous, mixed mode operation would yield twice the number of scans across the peak because only one signal is being monitored,not two.

16
Agilent Technologies
LC ConditionsColumns: Two alternating 15 x 4.6 mm ZORBAX RRHT
SB-C18, 1.8 µm (Agilent part no. 821975-902)Binary pump mobile A = water with 0.2% acetic acidphase: B = methanol with 0.2% acetic acidGradient: 15% B at 0 min
100% B at 0.75 min100% B at 1.00 min15% B at 1.01 minStop run at 1.50 min
Binary pump flow rate: 1.5 mL/minColumn temperature: 40 °CIsocratic regeneration pump mobile phase: 85:15 water:methanol with 0.2% acetic acidIsocratic pump flow rate: 1.5 mL/minInjection volume: 1 µL, overlapped injection and minimized
delay volumeDiode-array detector: Signal 250 nm, 10 nm; reference off
Simultaneous Electrospray and Atmospheric Pressure ChemicalIonization: The Science Behind the Agilent Multimode Ion Source
Figure 13. High throughput analysis of progesterone (100 ng on column). (top trace) positive mode TIC, (second from toptrace) negative mode TIC, (third from top trace) positive mode target ion m/z 315.2, (fourth from top trace) DAD signal,(bottom) spectrum from peak apex of target mass trace.
MS ConditionsSource: Multimode, mixed mode with positive/
negative switchingDrying gas flow: 5 L/minNebulizer: 40 psigDrying gas temperature: 350 °CVaporizer temperature: 200 °CCapillary voltage: 1500 V (positive and negative)Corona current: 4 µA (positive and negative)Peakwidth: 0.07 minTime filter: OffFast scan mode: EnabledScan: 100–1150 m/zFragmentor: 120 V (positive and negative)Stepsize: 0.3 m/z

17
Agilent Technologies Simultaneous Electrospray and Atmospheric Pressure ChemicalIonization: The Science Behind the Agilent Multimode Ion Source
Compound Positive Negative Positive Negative Positive NegativeAcetazolamide – D – D – DButyl 4-aminobenzoate D – D – D –Cortisone D D D – D DGemfibrozil – D – D – DHexahydro-...-dione D – D – D –Hydroflumethiazide – D – D – DIndole D – – – D –Iodipamide – – – D D DLabetalol D D D D D DLidocaine D – D – D –Morin D D D D D DPaclitaxel – – D – D –Phenylbutazone D D D D D DProcainamide D – D – D –Progesterone D – D – D –Sulfamethoxazole D D D D D DTolazamide D D D D D DUracil – D – – – D
Detected by polarity 67% 56% 67% 50% 78% 61%
APCI Source ESI Source Multimode Source
Detected by source 89% 89% 100%D = compound detected
Sample Throughput, 96-Well Plate
0 1 2 3 4 5 6 7 8 9 10 11 12
add alternating columnregeneration
add overlapped injection,minimize delay volume
with 1.8µm column
Time (hours)
multimode source dedicated ESI and APCI sources
Figure 14. Improvement in sam-ple throughput by combininganalysis techniques and hard-ware. An entire 96-well plate canbe analyzed in under three hoursby combining all improvements.
Table 1. Summary of responses for pharmaceutical compounds and intermediates analyzedusing various ion sources: (left two columns) analysis using a dedicated APCI source, (middletwo columns) using a dedicated ESI source, (right two columns) using a multimode source inmixed mode. The multimode source detected all compounds in the test suite, whereas the ded-icated sources did not.
*Hexahydro-…dione = Hexahydro-2,6-
bis(2,2,6,6-tetramethyl-4-piperidinyl)-
1H,4H,5H,8H-2,3a,4a,6,7a,8a-hexaaza-
cyclopenta[def]fluorene-4,8-dione
18
Agilent Technologies
LC ConditionsColumn: 30 x 2.1 mm ZORBAX SB-C18,
3.5 µm (Agilent part no. 873700-902)Mobile phase: A = water with 0.2% acetic acid
B = methanol with 0.2% acetic acidGradient: 10% B at 0 min
10% B at 0.5 min100% B at 9 minStop run at 12 min
Flow rate: 0.4 mL/minColumn temperature: 40 °CInjection volume: 1 µL
MS ConditionsSource: Positive/negative switching multimode,
mixed modeDrying gas flow: 5 L/minNebulizer: 40 psigDrying gas temp: 350 °CVaporizer temp: 200 °CCapillary voltage: 1500 V (positive and negative)Corona current: 4 µA (positive and negative)Peakwidth: 0.12 minTime filter: OnScan: 165–600 m/zFragmentor: 130 V (positive and negative)Stepsize: 0.1 m/z
Simultaneous Electrospray and Atmospheric Pressure ChemicalIonization: The Science Behind the Agilent Multimode Ion Source
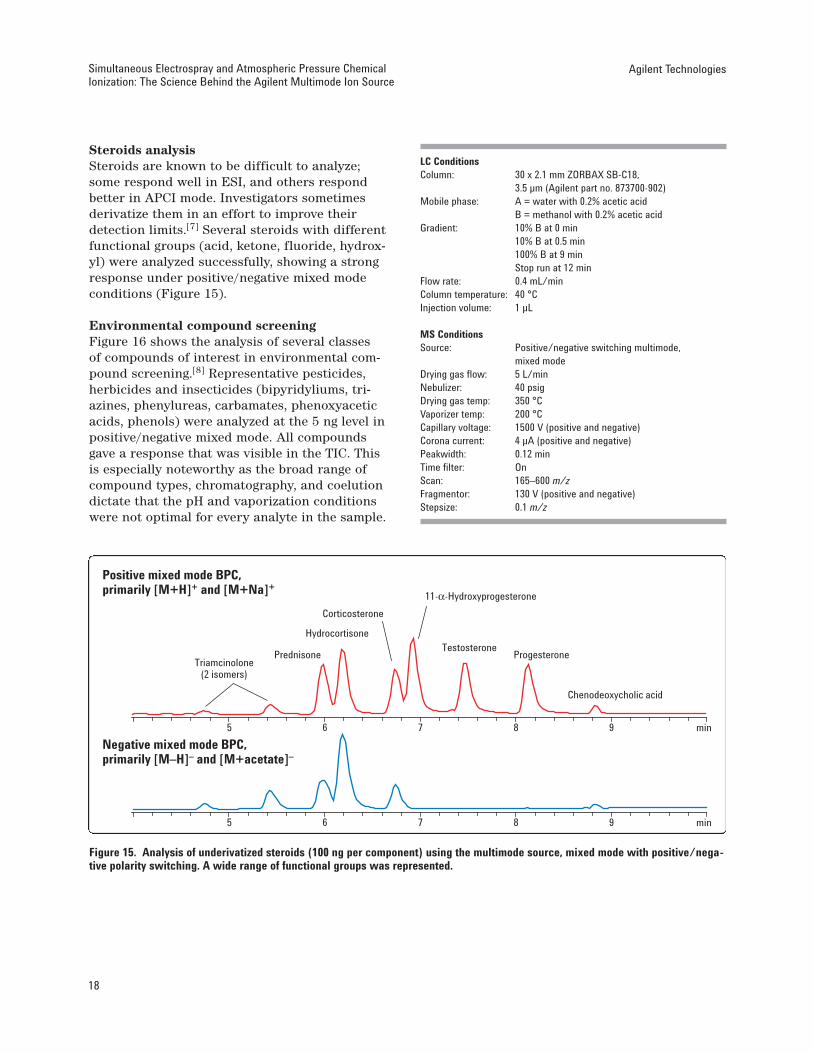
Steroids analysisSteroids are known to be difficult to analyze;some respond well in ESI, and others respondbetter in APCI mode. Investigators sometimesderivatize them in an effort to improve theirdetection limits.[7] Several steroids with differentfunctional groups (acid, ketone, fluoride, hydrox-yl) were analyzed successfully, showing a strongresponse under positive/negative mixed modeconditions (Figure 15).
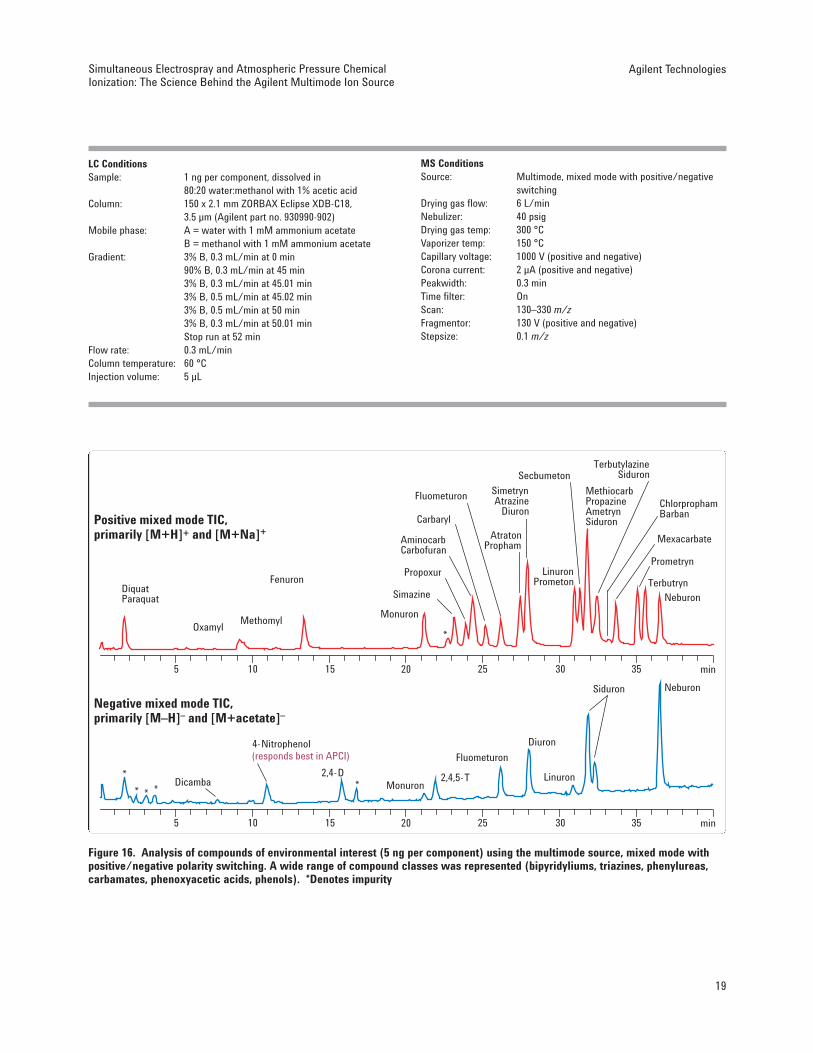
Environmental compound screeningFigure 16 shows the analysis of several classes of compounds of interest in environmental com-pound screening.[8] Representative pesticides,herbicides and insecticides (bipyridyliums, tri-azines, phenylureas, carbamates, phenoxyaceticacids, phenols) were analyzed at the 5 ng level inpositive/negative mixed mode. All compoundsgave a response that was visible in the TIC. Thisis especially noteworthy as the broad range ofcompound types, chromatography, and coelutiondictate that the pH and vaporization conditionswere not optimal for every analyte in the sample.
min5 6 7 8 9
Chenodeoxycholic acid
Corticosterone
11-α-Hydroxyprogesterone
Hydrocortisone
Prednisone ProgesteroneTestosterone
Triamcinolone(2 isomers)
Positive mixed mode BPC,primarily [M+H]+ and [M+Na]+
Negative mixed mode BPC,primarily [M–H]– and [M+acetate]–
min5 6 7 8 9
Figure 15. Analysis of underivatized steroids (100 ng per component) using the multimode source, mixed mode with positive/nega-tive polarity switching. A wide range of functional groups was represented.
19
LC ConditionsSample: 1 ng per component, dissolved in
80:20 water:methanol with 1% acetic acidColumn: 150 x 2.1 mm ZORBAX Eclipse XDB-C18,
3.5 µm (Agilent part no. 930990-902)Mobile phase: A = water with 1 mM ammonium acetate
B = methanol with 1 mM ammonium acetateGradient: 3% B, 0.3 mL/min at 0 min
90% B, 0.3 mL/min at 45 min3% B, 0.3 mL/min at 45.01 min3% B, 0.5 mL/min at 45.02 min3% B, 0.5 mL/min at 50 min3% B, 0.3 mL/min at 50.01 minStop run at 52 min
Flow rate: 0.3 mL/minColumn temperature: 60 °CInjection volume: 5 µL
Agilent Technologies Simultaneous Electrospray and Atmospheric Pressure ChemicalIonization: The Science Behind the Agilent Multimode Ion Source
Positive mixed mode TIC,primarily [M+H]+ and [M+Na]+
min5 10 15 20 25 30 35
DiquatParaquat
(responds best in APCI)
OxamylMethomyl
Fenuron
Monuron
*
Simazine
Propoxur
AtratonPropham
Fluometuron
Carbaryl
AminocarbCarbofuran
TerbutylazineSiduron
Methiocarb PropazineAmetrynSiduron
Secbumeton
LinuronPrometon
SimetrynAtrazine
Diuron
Prometryn
TerbutrynNeburon
ChlorprophamBarban
Mexacarbate
Negative mixed mode TIC,primarily [M–H]– and [M+acetate]–
4-Nitrophenol
Dicamba2,4-D
Monuron2,4,5-T
** * **
Fluometuron
Diuron
Linuron
NeburonSiduron
min5 10 15 20 25 30 35
MS ConditionsSource: Multimode, mixed mode with positive/negative
switchingDrying gas flow: 6 L/minNebulizer: 40 psigDrying gas temp: 300 °CVaporizer temp: 150 °CCapillary voltage: 1000 V (positive and negative)Corona current: 2 µA (positive and negative)Peakwidth: 0.3 minTime filter: OnScan: 130–330 m/zFragmentor: 130 V (positive and negative)Stepsize: 0.1 m/z
Figure 16. Analysis of compounds of environmental interest (5 ng per component) using the multimode source, mixed mode withpositive/negative polarity switching. A wide range of compound classes was represented (bipyridyliums, triazines, phenylureas,carbamates, phenoxyacetic acids, phenols). *Denotes impurity

Conclusions
The Agilent multimode source contains severalnovel design elements which are patented or inthe process of being patented.[9] These elementsand the method of their use allow the multimodesource to perform ESI, APCI or simultaneous ESIand APCI at higher HPLC flow rates with compa-rable sensitivity to dedicated ion sources. Switch-ing between modes is as simple as clicking themouse or may be programmed automatically.Mixed mode operation permits higher quality datato be obtained on narrow chromatographic peaks,such as those found in high throughput analysis.Nitrogen gas consumption is reduced significantlyusing this source rather than a dedicated ESIsource. The ultimate benefits of the source areincreased sample throughput, better scheduling of samples, better use of instrument time, loweroperating costs, and less time spent reanalyzingsamples.
References
1. Cody, R.B. Electrospray Ionization Mass Spec-trometry: History, Theory, and Instrumenta-tion. In Practical Spectroscopy Series, Volume32, Applied Electrospray Mass Spectrometry,Pramanik, B.N.; Ganguly, A.K.; Gross, M.L.,Eds.; Marcel Dekker, Inc.: New York, NY, 2002;chapter 1.
2. Gaskell, S.J. Electrospray: Principles and Prac-tice. J. Mass Spectrom. 1997, 32, 677–688.
3. Niessen, W.M.A.; Tinke, A.P. Liquid chromatog-raphy-mass spectrometry general principlesand instrumentation. J. Chrom. A 1995, 703,37–57.
4. Siegel, M.M.; Tabei, K; Lambert, F.; Candela, L.;Zoltan, B. J. Am. Soc. Mass Spectrom. 1998, 9,1196–1203.
5. Gallagher, R.T.; Balogh, M.P.; Davey, P.; Jack-son, M.R.; Sinclair, I.; Southern, L.J. Combinedelectrospray ionization-atmospheric pressurechemical ionization source for use in high-throughput LC-MS applications. Anal. Chem.2003, 75, 973–977.
6. Huber, U. High throughput HPLC—Alternatingcolumn regeneration with the Agilent 1100Series valve solutions. Agilent Technologiesapplication note 2002, publication number5988-7831EN.
7. Higashi, T.; Shimada, K. Derivatization of neu-tral steroids to enhance their detection charac-teristics in liquid chromatography—mass spec-trometry. Anal. Bioanal. Chem. 2004, 378,875–882.
8. Thurman, E.M.; Ferrer, I.; Barcelo, D. Choosingbetween Atmospheric Pressure Chemical Ion-ization and Electrospray Ionization Interfacesfor the HPLC/MS Analysis of Pesticides. Anal.Chem. 2001, 73, 5441–5449.
9. US patent 6,646,257; others pending.
Authors
Steven M. Fischer is a senior research chemistand Patrick D. Perkins is a senior applicationschemist at Agilent Technologies, Inc. in SantaClara, California U.S.A.
www.agilent.com/chem
© Agilent Technologies, Inc. 2005
Information, descriptions and specifications in this publication aresubject to change without notice. Agilent Technologies shall not be liablefor errors contained herein or for incidental or consequential damages inconnection with the furnishing, performance or use of this material.
Printed in the U.S.A. April 21, 20055989-2935EN
Agilent Technologies Simultaneous Electrospray and Atmospheric Pressure ChemicalIonization: The Science Behind the Agilent Multimode Ion Source
Top Related