


Languages
Pages
Legal


International Journal of Economics and Finance; Vol. 11, No. 1; 2019
ISSN 1916-971X E-ISSN 1916-9728
Published by Canadian Center of Science and Education
151
Should Investors on Equity Markets Be Superstitious? (Example of 7
World Stock Indexes Components)
Krzysztof Borowski1
1 Warsaw School of Economics, Warsaw, Poland
Correspondence: Krzysztof Borowski, Warsaw School of Economics, Warsaw 02-513, ul. Madalinskiego 6/8,
Poland. Tel: 48-510-275-217. E-mail: [email protected]
Received: October 9, 2018 Accepted: December 21, 2018 Online Published: December 27, 2018
doi:10.5539/ijef.v11n1p151 URL: https://doi.org/10.5539/ijef.v11n1p151
Abstract
The problem of efficiency of financial markets, especially the weekend effect has always fascinated scholars and
practitioners due to its relationship with the financial market efficiency. The issue is significant from the point of
view of assessing the portfolio management effectiveness and behavioral finance. This paper tests the hypothesis
of the unfortunate dates effect upon 7 equity indexes components (CAC40, DAX, DJIA, FTSE30, FTSE
MIBTEL, NIKKEI225 and SENSEX), i.e. 419 companies. For all these equities the following rates of return
were analyzed: Close-close, Overnight, Open-open, Open-close. As unfortunate days, the sessions falling on the
following dates were selected: 13th
and 4th
day of the month, Friday the 13th
and Tuesday the 13th
. The research
proved the presence of all kinds of the “unfortunate dates” effects on analyzed markets. The effects were
registered for all analyzed rates of return. The most dominating “unfortunate dates effects” resulted to be
Tuesday the 13th
, proceeding the 4th
day of the month effect. This is the first analysis of the presence of the
“unfortunate dates effect”, in which other than Close-close returns were examined and fulfils the research gap.
Keywords: market efficiency, calendar anomalies, Friday the 13th
, Tuesday the 13th
, unfortunate dates effect
1. Introduction
Efficient market hypothesis (EMH), introduced by Fama (Fama, 1970) belongs to the most important paradigms
of the traditional financial theories. According to this hypothesis, efficient market is defined as a market with a
large numbers of rational individuals, maximizing their profit and actively competing with each other
undertaking the attempt to predict future market values of specific securities, and where all relevant information
is freely available to investors (Latif et al., 2011). The presence of calendar anomalies has been presented
extensively for the last three decades in financial markets. The most common ones are the day-of-the-week effect,
monthly effect, weekend effect, holiday effects, within-the-month effect, turn-of-the month effect (Agrawal,
Tandon, 1994; Boudreaux, 1995; Smirlock & Starks, 1986; Aggarval & Rivoli, 1989; Barone, 1990; Kato et al.,
1990; Gu, 2003; Schwert, 2002; Sutheebanjard & Premchaiswadi, 2010).
Another issue related to the financial market efficiency is the behavior of investors during the days considered by
them to be unlucky. In Western Europe, every 13th
day of the month, especially the 13th
day of the month when
falling on a Friday is to be believed unlucky. In turn, in Spanish-speaking countries (e.g. Spain, Uruguay,
Argentina, Chile, Peru, Venezuela and Colombia), it is assumed that the date of bringing bad luck is Tuesday the
13th
, what is expressed in the following Spanish proverb: trece martes ni te cases, ni te embarques (Tuesday the
13th
, don‟t get married and don‟t travel). On the other hand, in China, an unlucky date is every fourth day of the
month. Many Chinese people believe the number 4 is to be unlucky whilst considering the number 8 is a lucky
one (Agarwal et al., 2014). In some Chinese dialects, the number 8 is pronounced like the word “prosperity”,
while the number 4 similar to the word “death”. Apparently the Chinese vary in their definition of which
numbers are lucky. Shum et al. (2012) defined both 6 and 8 as lucky, while Hirshleifer et al. (2018) considered 6,
8 and 9 to be lucky.
Statistically important difference between daily average rates of return registered on the stock market considered
by investors as an unlucky date and daily average rates of return calculated for the others days of the month can
be called “the unfortunate dates effect”. The number of papers dedicated to “the unfortunate dates effect” in
scientific literature is rather low.

ijef.ccsenet.org International Journal of Economics and Finance Vol. 11, No. 1; 2019
152
The aim of this paper is to examine the prevalence of “the unfortunate dates effect” on the markets of 7 world
equity index components. The paper is divided into five parts. The first four parts analyze of “the unfortunate
dates effect” that apply to the returns calculated on the basis of the following prices: (1) last session close –
previous session close (close-close), (2) last session open - previous session close (overnight), (3) last session
open – previous session open (open-open) and (4) last session close – last session open (open-close). All
calculations will be carried out for the following two populations: (1) the 13th day of the month rates of return vs
rates of return for all other sessions, (2) Friday the 13th
rates of return vs rates of return for all other sessions, (3)
Tuesday the 13th
rates of return vs rates of return for all other sessions and (4) the 4th day of month rates of return
vs rates of return for all other sessions. In the fifth part of the paper the one-session rates of return for Friday the
13th
session will be compared with the one-session rates of return for all other Fridays. In turn, in the second part
of the fifth part of the paper the similar analysis for rates of return for Tuesday the 13th
and all other Tuesdays
will be conducted. Previous researches focused on the calculation of rates of return only for the following
scheme: Friday the 13th
close – others Fridays‟ close. The author is not aware of the papers analyzing the
Friday the 13th
effect with the use of rates of return different to the close-close scheme. This article attempts to
fill this gap, as well as expand research for Tuesday the 13th
and for the sessions falling on the 4th
day of the
month.
2. Literature Review
Belief in the ill-fortune that supposedly accompanies the of 13th as well as the date of Friday the 13
th is widespread
across the Western world and has ancient and somewhat uncertain origins (Boyle et al., 2004). Both the number 13
and Friday are characterized by long and separate histories associated with “bad luck”. It is believed that these two
were combined in order to create an unfortunate date at the beginning of the 20th Century (Chaundler, 1970). In the
literature there are a lot of explanations for these two lines of superstitions: Christ was crucified on Friday, and the
number of people seated at the table for the Last Supper was 13. Even in developed countries, people are prone to
superstitions such as daily newspapers publishing horoscopes to guide their readers. Nowadays many buildings skip
the thirteenth floor, streets lack the number 13th and hospitals in many countries decline to label their operating
theatres with that number (Hira et al., 1998; Reilly & Stevenson, 2000; Boyle et al., 2004; USA, Today, 2007;
Kramer & Block, 2008). Of more interest is the fact that admittance to hospitals seems to cluster around unlucky
days, as reported by Blacher (1983) and Scanon et al. (1993). Fudenberg and Levine (2006) state that superstitious
beliefs can persist if the probability of being exposed as untrue is sufficiently low. If there is always any chance of a
bad outcome when following superstition and some chance of a good outcome when not following superstition, any
person might not realize that the belief is untrue, and, persists in the superstition (Agarval et al., 2014). Jiang et al.
(2009) found that Asians exposed to lucky numbers, give higher estimates of winning a lottery and are more willing
to participate in a lottery or a risky promotional game, and express greater willingness to make risky financial
investments. Chong and Du (2009) estimated the value of superstition: a lucky (unlucky) number can bring good
(bad) luck, and the value of superstitions can be economically significant. Psychology and anthropology researchers
suggest that people rely on superstition as a way to cope with misfortune and uncertainty, and to rationalize a
complex world (Vyse, 1997; Tsang, 2004; Lepori, 2009; Liu, 2013, Zhang et al., 2014, Robiyanto & Puryandani,
2015, Robiyanto et al., 2015).
Scanlon et al. (1993) founded that the number of traffic accident in UK is higher on Friday the 13th, in spite of the
smaller number on cars being on the roads. Kolb and Rodriguez (1987), in one of the first studies linking
superstition with the stock market, proved that in the period of 1962-1985, the average Friday 13th rates of return
of CRSP Index are significantly lower than the average rates of return for all other Fridays. Later papers of Dyl and
Maberly (1988), Agrawal and Tandon (1994), Coutts (1999), Lucey (2000) and Lucey (2001) conceded the reverse
pattern: average returns on Fridays the 13th were higher than those on regular Fridays. Dyl and Maberly (1988)
proved that in the analyzed time horizon of 1940-1987, in five out of the six analyzed periods, Friday the 13th rates
of return turned out to be positive and higher compared to other Fridays and the only period when the Friday the
13th rates of return were in red compared to other Fridays rates of return, fell during the 1970s. The similar
conclusion was reached in the research of Agrawal and Tandon (1994) as well as of Mills and Coutts (1995).
Chamberlain et al. (1991) examining behavior of rates of return falling on Friday the 13th during the period of
1930-1985 found no stronger evidence of lower mean returns for Fridays falling on the 13th.
Fortin et al. (2014) investigated the effect of superstition on the prices of single-family homes in Great Vancouver
in Canada. In neighborhoods with relatively more Chinese residents and in repeated transaction, the sales of prices
of houses with street address numbers ending in “4” were 2.2% lower, while those ending in “8” were 2.5% higher
than other houses. According to Agarwal et al. (2014), on a per square meter basis, units with numbers ending in “4”
were discounted by 1.1%, units on floor with numbers ending in “4” were discounted by 0.5%, while units with
ijef.ccsenet.org International Journal of Economics and Finance Vol. 11, No. 1; 2019
153
numbers ending in “8” commanded a 0.9% premium. There are also reports of a link between the superstition
beliefs of certain time periods and the demographics of two nations: Japanese (Kaku, 1972; Kaku & Matsumoto,
1975; Kaku, 1975) and Koreans (Kim, 1979). Ng et al. (2010) studying the auction prices between 1997 and 2009
proved that the prices of license numbers including the lucky number 8 were systematically higher while prices of
license numbers with the unlucky number “4”, were lower. Besides the premium for “8” could also be interpreted
as conspicuous spending to signal wealth or status (Feltovith et al., 2012).
Boyle et al. (2004), analyzing daily returns of the index NZSE40, the value-weighted capital index of the 40 largest
securities by market capitalization on the New Zealand Stock Exchange in the period 01.01.1967-30.11.2001
proved that the average rates of return for the Fridays the 13th
were not statistically different form the rates of return
for regular Fridays. The name of “the Friday the Thirteenth effect”, introduced by Kolb and Rodriguez (Kolb &
Rodriguez, 1987) has been regularly used by different researchers (Chamberlain et al., 1991; Coutts, 1999; Patel
2009; Botha, 2013; Auer & Rottmann, 2013). Coutts (1999) examining the Friday the 13th effect in the UK with the
use of FTSE index in the period of 59 years, proved that in most cases the rates of return registered for Friday the
13th were positive and higher compared to other Fridays rates of return, but statistical significance was not observed.
Patel (2009), analyzing the period of 58 years for NASDAQ and S&P 500 index, discovered that in four out of the
seven periods rates of return for Friday the 13th were positive and higher than the rates of return calculated for other
Fridays.
Brown et al. (2002) and Brown and Mitchell (2008) discovered that the daily opening and closing prices tend to
cluster at the number “8” in Asian Pacific and Chinese Stock markets. Hirshleifer et al. (2018) found that the
superstition affected the pricing of initial public offerings in China in the period of 1991-2005. On Shanghai and
Shenzhen stock exchanges, listed companies are identified by a numerical code, which is the equivalent of the US
ticker. Consistent with superstition, newly listed equities with lucky listing codes (that included at least one lucky
digit and no unlucky digit) initially traded at a premium dissipated within three years. Botha (2013) analyzed the
Friday the 13th effect for samples from stock exchanges in Kenya, Morocco, Nigeria, South Africa and Tunisia.
Auer and Rottmann (2013) investigating the presence of Friday the 13th effect for seven emerging markets in Asia
(India, Indonesia, Malaysia, Philippines, South Korea, Taiwan and Thailand) during the period of July 1996-August
2013, proved that the effect was registered on the Stock Exchange in Phillipines. They also found that the Friday
the 13th effect had a significant influence on the stock market volatility in Indonesia and the Philippines. Chung and
Darrat (2014) examined the potential effect of superstitious beliefs on stock trading in four Asian-Pacific countries
with deep Chinese cultural heritage (China, Hong Kong, Singapore, and Taiwan). The regression results from daily
data over 2 January 1991 to 30 December 2011 suggest that unlucky days (particularly day 4 and Friday the 13th)
generally exhibit higher stock returns. Kalayaan (2016) found out that the mean returns for Friday the 13th were
inferior than that of other Fridays or other days and that the Friday the 13th effect was evident during the period of
June 1992 to May 2015 for the PSEI index.
Pinto (2015) by analyzing the rates of return (in the period of 1949-2001) noticed them falling on the fourth day of
the month on the Tokyo Stock Exchange (TSE) and proved that the effect of bad luck numbers started to lose its
power in the middle of 1980s. This can be explained by the increasing internationalization of equity investors in
Japan. More foreigners, less prone to be influenced by Japanese folk beliefs, trading the TSE , diluted the strength
of the Fourth Day effect. Haggard (2015) examining the stock returns impact of days with lucky numbers on
Chinese equity market, demonstrated a lucky number date trading strategy for the Shenzhen market. Suganda et al.
(2018) studying the influence of the scared days between daily cycles in Georgian calendar and Javanese calendar
on the basis of rates of return of Jakarta Composite Index in the period of January 2009 – June 2016, found that
investment decision were sill influenced by superstition, leading to behavior biases. Bhattacharya et al. (2017)
proved on the example of Taiwan Futures Exchange that the individual investors, but not institutional investors,
submitted disproportionately more limit orders at”8” than at “4”. This imbalance, defined as superstitions index for
each investors seed to be positively correlated with trading losses. Superstitious investors lose more money because
of their bad market timing and stale orders.
Taking into consideration the fact that some traders try to avoid making investments during unlucky days, it seems
reasonable to study the returns during trading days before and after Friday the 13th (Peltomaki & Peni, 2010;
Peltomaki & Vahamaa, 2014). Stefanescu and Dumitriu (2018) on the basis of the daily rates of return for three
American stock indexes: S&P 500, FJIA and NASDAQ, found no evidence for the traditional form of the Friday
the 13th effect, but thy concluded that the returns during two trading days before Friday the 13
th tended to be higher
than the average returns, while the returns during one or two trading days after, resulted to be lower than the
average.

ijef.ccsenet.org International Journal of Economics and Finance Vol. 11, No. 1; 2019
154
3. Methodology
The research is divided into five parts. The calculation were proceeded concerning constituents of the following
world stock indexes (in brackets the number of the analyzed companies): CAC40 (39), DAX (30), DJIA (30),
FTSE30 (30), FTSE MIBTEL (37), NIKKEI225 (223) and SENSEX (30), e.g. for 419 equities. In case of the
indexes CAC40 and NIKKEI225 indexes, one and two of their components, respectively were removed due to the
short listing period. The list of analyzed companies and the first dated included in the analysis are presented in the
Table A1 and Table A2 (Appendix).The last session considered in the process of calculating rates of return was
30.06.2018.
In case of two populations, the null hypothesis H0 and alternative hypothesis H1 regarding equality of rates of return
in two populations, can be formulated as follows:
𝐻0: 𝐸(𝑟1̅) = 𝐸(𝑟2̅)
𝐻1: 𝐸(𝑟1̅) ≠ 𝐸(𝑟2̅) (1)
where:
𝑟 ̅ –average rate of return in the first population,
𝑟 ̅ –average rate of return in the second population.
On the basis of two independent populations of rate of returns, which sizes are equal n1 and n2, respectively, the
hypotheses H0 and H1 should be tested with the use of statistics z (Defusco et al., 2001, p. 335):
z =r1̅̅ ̅−r2̅̅ ̅
√(S12
n1+S22
n2)
(2)
where:
- variance of rates of return in the first population,
- variance of rates of return in the second population,
n1 - number of observations in the first population,
n2 - number of observations in the second population.
In case when the population variances are unknown and cannot be assumed that they are equal, the number of
degrees of freedom will be expressed according to the following formula (Defusco et al., 2001, p. 335):
𝑑𝑓 =(𝑆12
𝑛1+𝑆22
𝑛2)
2
(𝑆12 𝑛1⁄ )
2
𝑛1+(𝑆22 𝑛2⁄ )
2
𝑛2
(3)
In the following part of the analysis, parametric tests of Kruskal-Wallis will be implemented. The Kruskal-Wallis
test statistics is given by (Vargha & Delaney, 1998):
𝐻 =
𝑁(𝑁+ )∑ 𝑛𝑖�̅�𝑖
𝑖=𝑔𝑖= − 3(𝑁 + 1) (4)
where:
N – total number of observations across all groups,
�̅�𝑖 =∑ 𝑛 1
– average rank of all observations in group i,
𝑛𝑖 – number of observation in group i,
𝑟𝑖 – the rank (among all observations) of observation j from group i,
In all analyzed cases, the p-values will be calculated. If the p-value is less or equal to 0.05, then the hypothesis H0 is
rejected in favor of the hypothesis H1. Otherwise, there is no reason to reject hypothesis H0. i {\displaystyle i}
For each of the analyzed indexes the following rates of return will be calculated:
1) Close – Close: − 1
1 (last session close versus previous session close),
2) Overnight: − 1
1 (last session open versus previous session close),

ijef.ccsenet.org International Journal of Economics and Finance Vol. 11, No. 1; 2019
155
3) Open - Open: − 1
1 (last session open versus previous session open),
4) Open – Close: −
(last session close versus last session open),
where:
Ct – closing price in the period t,
Ct-1 – closing price in the period t-1,
Ot – open price in the period t,
Ot-1 – open price in the period t-1,
The daily rates of return were calculated for all companies included in the analyzed indices. Then the tests for
equality of two average rates of return in two populations were exemplified in the following cases:
1) The first population: 13th
day of the month, the second population: all remaining sessions,
2) The first population: Friday the 13th
day of the month, the second population: all remaining sessions,
3) The first population: Tuesday the 13th
day of the month, the second population: all remaining sessions,
4) The first population: 4th
day of the month, the second population: all remaining sessions,
5) The first population: Friday the 13th
day of the month, the second population: all remaining Fridays. In the
second part of the fifth part, the test for equality of two average rates of return were computed under the
assumption that the first group of data consists of rates of return for sessions falling on Tuesday the 13th
and the
second group is composed of rates of return for all remaining Tuesdays. In this part only close-close rates of
return were taken into consideration.
4. Analysis of Results
4.1 CAC40 Index
The results of testing a zero hypothesis with the use of average rates of returns for two different populations permit
to draw the following conclusions:
4.1.1 Z-Statistics
The null hypothesis regarding equality of two average rates of return was rejected for the following equities
(p-value shown in parenthesis):
a) 13th
, Close-close: Air Liquide (0.0474) and Sanofi (0.0064),
b) 13th
, Open-open: Arcelormittal (0.0127),
a) 13th , Open-close: EDF (0.0437), Sanofi (0.0335),
b) Friday the 13th, Close-close: EDF (0.0417),
c) Friday the 13th, Open-open: Airbus (0.0068),
d) Friday the 13th, Open-close: EDF (0.0167),
e) Tuesday the 13th, Close-close: Orange (0.0337), Renault (0.0089), Sanofi (0.0412), Technip (0.0485)
f) Tuesday the 13th, Open-close: Danone (0.0273), Michelin (0.0488), Orange (0.0300), Peugeot (0.0287) and
Renault (0.0010),
g) 4th, Close-close: Veolia Environment (0.0101),
h) 4th, Open-close: Carrefour (0.0273), Veolia Environment (0.0107),
i) Friday the 13th vs Fridays, Close-lose: EDF (0.0048),
j) Tuesday the 13th vs Tuesdays, Close-Close: Michelin (0.0227), Orange (0.0336), Peugeot (0.0095), Renault
(0.0004) and Schneider Electric (0.0293).
The results of calculating p values for returns of the CAC40 components with the use of the Z statistic test are
presented as an example in the Table A3 (Appendix). For the Kruskal-Wallis test, as well as for other index
components, the calculation were proceeded in the same way.

ijef.ccsenet.org International Journal of Economics and Finance Vol. 11, No. 1; 2019
156
4.1.2 Kruskal-Wallis Test
The null hypothesis regarding equality of two average rates of return was rejected for the following equities
(p-value shown in parenthesis):
a) 13th, Close-close: LVHM (0.0363), Solvey (0.0450),
b) 13th, Overnight: Bouygues (0.0295),
c) 13th, Open-open: Arcelormittal (0.0200), Nokia Oyj (0.0421), Safran (0.0247),
d) Friday the 13th, Close-close: Sanofi (0.0075),
e) Friday the 13th, Open-open: Arcellormittal (0.0200), Nokia Oyj (0.0421), Safran (0.0247),
f) Tuesday the 13th, Close-close: Orange (0.0127), Renault (0.0028), Sanofi (0.0179),
g) Tuesday the 13th, Open-close: Orange (0.0330), Peugot (0.0467), Renault (0.0109),
h) 4th, Close-close: Cap Gemini (0.0073), LVHM (0.0499), Peugeot (0.0468), Veolia Environment (0.0102),
i) 4th, Open-close: Cap Gemini (0.0315), Veolia Environment (0.0190),
j) Friday the 13th vs Fridays, Close-close: EDF (0.0262),
k) Tuesday the 13th vs Tuesdays, Close-close: Orange (0.0475), Peugeot (0.0190), Renault (0.0048), Schneider
Electric (0.0212).
In all other cases, there was no reason to reject the null hypothesis in favor of the alternative hypothesis.
4.1.3 Confirmation of the Results Obtained with Z-Statistics by the Kruskal-Wallis Test
The null hypothesis was rejected using of two tests (the Z statistics and Kruskal-Wallis) for the following
companies:
a) EDF: Friday the 13th vs Fridays, Close-close,
b) Orange: Tuesday the 13th, Close-close and Open-close, Tuesday the 13
th vs Tuesdays, Close-close,
c) Peugeot: Tuesday the 13th, Open-close and Tuesday the 13
th vs Tuesdays, Close-close,
d) Renault: Tuesday the 13th, Close-close and Open-close, Tuesday the 13
th, Close-close,
e) Sanofi: Tuesday the 13th, Close-close,
f) Schneider Electric: Tuesday the 13th vs Tuesdays, Close-close,
g) Veoila Environement: 4th Close-close and Open-close.
For many analyzed companies the results obtained with the Z statistics were not confirmed by the Kruskal-Wallis
test. Thus, in case of the French stock index, the effect of Tuesday the 13th was the strongest and was mainly
observed for the Close-close and Open-close rates of return. This is a result that deserves attention, especially since
the perception of the Tuesday the 13th as a unfortunate date is a characteristic for Spain and Hispanic countries. On
the French market one could rather expect the dominance of the effect of the Friday the 13th than Tuesday the 13
th.
4.2 DAX Index
The results of testing a zero hypothesis with the use of average rates of returns for two different populations permit
to draw the following conclusions:
4.2.1 Z-Statistics
The null hypothesis regarding equality of two average rates of return was rejected for the following equities
(p-value shown in parenthesis):
a) 13th, Overnight: Infineon Tech (0.0488), Muench Rueckvers (0.0230),
b) Friday the 13th, Close-close: Continental (0.0281), Deutsche Boerse (0.0000), Vonovia (0.0217),
c) Friday the 13th, Overnight: Deutsche Boerse (0.0053),
d) Friday the 13th, Open-open: Deutsche Boerse (0.0000), Siemens (0.0351),
e) Friday the 13th, Open-close: Continental (0.0450), Deutsche Boerse (0.0024), Vonovia (0,0240),
f) Tuesday the 13th, Close-close: Daimler (0.0493), Heilderbergcement (0.0209), Infineon Tech (0.0456),
Muench Rueckvers (0.0372),
g) Tuesday the 13th, Open-close: Frasen Med. (0.0463), Heilderbergcement (0.0196),

ijef.ccsenet.org International Journal of Economics and Finance Vol. 11, No. 1; 2019
157
h) 4th, Close-close: Fresenius (0.0134), Prosieben Sat (0.0335),
i) 4th, Overnight: Continental (0.0287),
j) 4th, Open-open: Continental (0.0084),
k) 4th, Open-close: Continental (0.0084),
l) Friday the 13th vs Fridays: Continental (0.0414), Vonovia (0.0345),
m) Tuesday the 13th vs Tuesdays: Heilderbergcement (0.0135).
4.2.2 Kruskal-Wallis Test
The null hypothesis regarding equality of two average rates of return was rejected for the following equities
(p-value shown in parenthesis):
a) 13th, Close-close: Bay Motoren (0.0450), Thyssen Krupp (0.0182),
b) 13th , Open-open: BASF (0.0468), Daimler (0.0278), Deutsche Bank (0.0142), Siemens (0.0170),
c) 13th, Open-close: Bay Motoren (0.0398),
d) Friday the 13th, Overnight: EON (0.0118),
e) Tuesday the 13th, Close-close: Comerzbank (0.0231), Daimler (0.0239), Frasen Med (0.0477),
Heilderbergcement (0.0030), Muench Rueckvers (0.0075), SAP (0.0365),
f) Tuesday the13th, Open-open: Lined (0.0349),
g) Tuesday the13th, Open-close: Heilderbergcement (0.0330),
h) 4th, Close-close: Fresenius (0.0132),
i) 4th, Open-open: Continental (0.0030),
j) 4th, Open-close: Fresenius (0.0015),
k) Tuesday the13th vs Tuesdays: Heilderbergcement (0.0214).
In all other cases, there was no reason to reject the null hypothesis in favor of the alternative hypothesis.
4.2.3 Confirmation of the Results Obtained with Z-Statistics by the Kruskal-Wallis Test
The null hypothesis was rejected with the use of two tests (the Z statistics and Kruskal-Wallis) for the following
companies:
a) Continental: 4th, Open-open,
b) Dimler: Tuesday the 13th, Close-close,
c) Fresenius: 4th, Close-close and Open-close,
d) Heilderbergcement: Tuesday the 13th, Close-close and Open-close, 13
th Tuesday vs Tuesdays, Close-close,
e) Muench Rueckvers: Tuesday the 13th, Close-close.
The strongest effect on the German stock exchange was Tuesday the 13th, which preceded the effect of the 4
th day
of the month. The first effect was registered mainly for the rates of return: Close-close. On the German market, as
in case of France, more expected was the dominance of the Friday the 13th effect, which was not recorded. The
effect of the 4th day of the month is expected mainly in Asian markets.
4.3 DJIA Index
The results of testing a zero hypothesis with the use of average rates of returns for two different populations permit
to draw the following conclusions:
4.3.1 Z-Statistics
The null hypothesis regarding equality of two average rates of return was rejected for the following equities
(p-value shown in parenthesis):
a) 13th, Close-close: Apple (0.0106), Boeing (0.0411),
b) 13th, Overnight: Apple (0.0063), Caterpillar (0.0282),
c) 13th Open-open: Home Depot (0.0140),
d) 13th, Open-Close: Boeing (0.0202), Home Depot (0.0381),

ijef.ccsenet.org International Journal of Economics and Finance Vol. 11, No. 1; 2019
158
e) Friday the 13th, Overnight: 3M (0.0494), Boeing (0.0240), JP Morgan (0.0237),
f) Friday the 13th, Open-open: Johnson & Johnson (0.0040), Pfizer (0.0216),
g) Tuesday the 13th, Close-close: Apple (0.0489),
h) Tuesday the 13th, Overnight: Chevron (0.0407),
i) Tuesday the 13th, Open-open: Caterpillar (0.0195),
j) Tuesday the 13th, Open-close: 3M (0.0419), Du Point (0.0410), Home Depot (0.0142), Wall-Mart (0.0244),
k) 4th, Close-close: General-Electric (0.0174), IBM (0.0381), McDonalds (0.0480),
l) 4th, Open-open: Procter & Gamble (0.0311), United Health (0.0064), United Technologies (0.0297),
m) 4th, Open-close: General Electric (0.0379),
n) Tuesday the 13th vs Tuesdays, Close-close: Home Depot (0.0099).
4.3.2 Kruskal-Wallis Test
The null hypothesis regarding equality of two average rates of return was rejected for the following equities
(p-value shown in parenthesis):
a) 13th, Close-close: 3M (0.0104), Chevron (0.0445),
b) 13th, Overnight: 3M (0.0334), Boeing (0.0341), JP Morgan (0.0146), Verizon (0.0341),
c) 13th, Open-open: Johnson & Johnson (0.0066), Pfizer (0.0352),
d) 13th, Open-close: 3M (0.0379),
e) Friday the 13th, Close-close: Apple (0.0287), Chevron (0.0140), Coca-Cola (0.0447),
f) Friday the 13th, Overnight: Apple (0.0088),
g) Friday the 13th, Open-open: Nike (0.0020),
h) Friday the 13th, Open-close: Chevron (0.0056),
i) Tuesday the 13th, Close-close: Apple (0.0333), Coca-Cola (0.0069),
j) Tuesday the 13th, Overnight: Chevron (0.0231),
k) Tuesday the 13th, Open-open: Caterpillar (0.0420),
l) Tuesday the 13th, Open-close: Coca-Cola (0.0307), Home Depot (0.0241), Wall-Mart (0.0405),
m) 4th, Close-close: Chevron (0.0315), General Electric (0.0381),
n) 4th, Overnight: Home Depot (0.0030), Nike (0.0449), United Health (0.0210),
o) 4th, Open-open: Microsoft (0.0188), Procter & Gamble (0.0211), United Health (0.0094), United Technologies
(0.0176),
p) 4th, Open-close: JP Morgan (0.0411),
q) Friday the 13th vs Fridays, Close-close: 3M (0.0442),
r) Tuesday the 13th vs Tuesdays: Coca-Cola (0.0282), Home Depot (0.0310).
4.3.3 Confirmation of the Results Obtained with Z-Statistics by the Kruskal-Wallis Test
In all other cases, there was no reason to reject the null hypothesis in favor of the alternative hypothesis.
The null hypothesis was rejected with the use of two tests (the Z statistics and Kruskal-Wallis) for the following
companies:
a) Apple: Tuesday the 13th, Close-close,
b) Caterpillar: Tuesday the 13th, Overnight,
c) Chevron: Tuesday the 13th, Overnight,
d) General Electric: 4th, Close-close,
e) Home Depot: Tuesday the 13th , Open-close and Tuesday the 13
th vs Tuesdays, Close-close,
f) Procter & Gamble: 4th, Open-open,
g) United Health: 4th, Open-open,

ijef.ccsenet.org International Journal of Economics and Finance Vol. 11, No. 1; 2019
159
h) United Technologies: 4th, Open-open,
i) Wall-Mart: Tuesday the 13th , Open-close.
On the American market, the two dominant effects were observed: Tuesday the 13th as well as the 4
th day of the
month. The first of them is associated mainly with Spanish and Latin culture, and the second with Asian. There was
no Friday the 13th effect, characteristic mainly for the European cultural circle. Tuesday the 13
th effect was
registered mainly for Overnight and Close-close rates of return and the 4th day of the month effect for Open-open
rates of return.
4.4 FTSE30
The results of testing a zero hypothesis with the use of average rates of returns for two different populations permit
to draw the following conclusions:
4.4.1 Z-Statistics
The null hypothesis regarding equality of two average rates of return was rejected for the following equities
(p-value shown in parenthesis):
a) 13th, Close-close: GlaxoSmithKline (0.0461),
b) 13th, Overnight: GKN (0.0449), Reckit Benckiser (0.0433),
c) 13th, Open-open: Reckit Benckiser (0.0261),
d) 13th, Open-close: 3I (0.0222), BAE System (0.0044),
e) Friday the 13th, Close-close: Burberry (0.0286), Experian (0.0259),
f) Friday the 13th, Overnight: Land Sec. (0.0307), Lloyds Banking (0.0358), Smith (0.0243), Unilever (0.0206),
g) Friday the 13th, Open-open: BP (0.0272), Diageo (0.0031), Unilever (0.0489),
h) Friday the 13th, Open-close: British American Tobacco (0.0142),
i) Tuesday the 13th, Close-close: 3I (0.0088), BAE System (0.0221), Glaxo Smith Kline (0.0456), Land Sec
(0.0113), Prudential (0.0286), Tate and Lyle (0.0025), Wolseley (0.0222),
j) Tuesday the 13th, Overnight: RSA Insurance (0.0440),
k) Tuesday the 13th, Open-open: Marks & Spencer (0.0419),
l) Tuesday the 13th, Open-close: 3I (0.0424), BAE System (0.0003), Experian (0.0060), Glaxo Smith Kline
(0.0405), Vodafone (0.0447), Wolseley (0.0219),
m) 4th, Close-close: INTL Consolidated Airlines (0.0481), Reckit Benckiser (0.0179),
n) 4th, Overnight: BT Group (0.0209), Man Group (0.0207), Vodafone (0.0339),
o) 4th, Open-open: Associated British Food (0.0185), Man Group (0.0220), Tate and Lyle (0.0304),
p) 4th, Open-close: Reckit Benckiser (0.0280),
q) Friday the 13th vs Fridays, Close-close: British American Tobacco (0.0160),
r) Tuesday the 13th vs Tuesdays, Close-close: 3I (0.0162), BAE System (0.0004), Experian (0.0035), Prudential
(0.0319), Royal Bank of Scotland (0.0411), Vodafone (0.0443), Wolseley (0.0170).
4.4.2 Kruskal-Wallis Test
The null hypothesis regarding equality of two average rates of return was rejected for the following equities
(p-value shown in parenthesis):
a) 13th, Close-close: British American Tobacco (0.0374), Burberry (0.0365), Experian (0.0368),
b) 13th, Overnight: Tesco (0.0416), Unilever (0.0332),
c) 13th, Open-open: BP (0.0349), Diageo (0.0026), Experian (0.0395), Tesco (0.0189), Unilever (0.0308),
d) 13th, Open-close: Associated British Food (0.0492), British American Tobacco (0.0099),
e) Friday the 13th, Close-close: Glaxo Smith Kline (0.0238),
f) Friday the 13th, Overnight: Diageo (0.0281), Reckit Benckier (0.0291),
g) Friday the 13th, Open-close: 3I (0.0254), BAE System (0.0096),
h) Tuesday the 13th, Close-close: 3I (0.0211), Glaxo Smith Kline (0.0225), Land Sec. (0.0421), Prudential

ijef.ccsenet.org International Journal of Economics and Finance Vol. 11, No. 1; 2019
160
(0.0456), RSA Insurance (0.0429), Tate and Lyle (0.0098), Wolseley (0.0036),
i) Tuesday the 13th, Open-open: Marks & Spencer (0.0442),
j) Tuesday the 13th, Open-close: BAE System (0.0009), Experian (0.0136), Glaxo Smith Kline (0.0241), Royal
Bank Scotland (0.0352), Wolseley (0.0125),
k) 4th, Overnight: Lloyds Banking (0.0446), Man Group (0.0467),
l) 4th, Open-open: Associated British Food (0.0268), Tate and Lyle (0.0249),
m) Friday the 13th vs Fridays, Close-close: British American Tobacco (0.0129),
n) Tuesday the 13th vs Tuesdays, Close-close: BAE System (0.0010), Experian (0.0087), Glaxo Smith Kline
(0.0334), Lloyds Banking (0.0249), Royal Bank of Scotland (0.0113), Wolseley (0.0081).
In all other cases, there was no reason to reject the null hypothesis in favor of the alternative hypothesis.
4.4.3 Confirmation of the Results Obtained with Z-Statistics by the Kruskal-Wallis Test
The null hypothesis was rejected with the use of two tests (the Z statistics and Kruskal-Wallis) for the following
companies:
a) 3I: Tuesday the 13th, Close-close,
b) Associated British Food: 4th, Open-open,
c) BAE System: Tuesday the 13th, Open-close and Tuesday the 13
th vs. Tuesdays, Close-close
d) British American Tobacco: Friday the 13th vs Fridays, Close-close,
e) Experian: Tuesday the 13th, Open-close and Tuesday the 13
th vs Tuesdays, Close-close,
f) Glaxo Smith Kline: Tuesday the 13th, Close-close and Open-close,
g) Land Sec.: Tuesday the 13th, Close-close,
h) Man Group: 4th, Overnight,
i) Marks and Spencer: Tuesday the 13th, Open-open,
j) Prudential: Tuesday the 13th, Close-close,
k) Royal bank of Scotland: Tuesday the 13th vs Tuesdays, Close-close,
l) Tate and Lyle: Tuesday the 13th, Close-close, 4
th, Open-open,
m) Wolseley: Tuesday the 13th, Close-close, Open-close and Tuesday the 13
th vs Tuesdays, Close-close.
On the British market, just like on the American market, the following effects dominated: Tuesday the 13th as well
as the 4th day of the month. The first one was observed most frequently for Clos-close and Open-open rates of
return and the second for Open-open returns. The Friday the 13th effect occurred but sporadically.
4.5 FTSE MIBTEL
The results of testing a zero hypothesis with the use of average rates of returns for two different populations permit
to draw the following conclusions:
4.5.1 Z-Statistics
The null hypothesis regarding equality of two average rates of return was rejected for the following equities
(p-value shown in parenthesis):
a) 13th, Open-open: FIAT (0.0373),
b) 13th, Open-open: Intesa San Paolo (0.0070), Unicredit (0.0466),
c) 13th, Open-close: Brembo (0.0310),
d) Friday the 13th, Open-open: Ferrari (0.0036),
e) Friday the 13th, Open-close: CHN Industrial (0.0005), FIAT (0.0094), Telecom Italia (0.0158),
f) Tuesday the 13th, Close-close: Buzzi Unicem (0.0131), FIAT (0.0184),
g) Tuesday the 13th, Overnight: Buzzi Unicem (0.0233), Tenaris (0.0151),
h) Tuesday the 13th, Open-close: FIAT (0.0319), Recordati (0.0256), Salvatore Ferragamo (0.0069),
i) 4th, Close-close: Luxottica (0.0383),

ijef.ccsenet.org International Journal of Economics and Finance Vol. 11, No. 1; 2019
161
j) 4th, Overnight: ENI (0.0223), Terna Rete (0.0145), Unione di Banche (0.0418),
k) 4th, Open-open: CHN Industrial (0.0091),
l) 4th, Open-close: Brembo (0.0253), Luxottica (0.0159), SNAM (0.0306), Terna Rete (0.0074),
m) Friday the 13th vs Fridays, Close-close: CHN Industrial (0.0028), FIAT (0.0076), Telecom Italia (0.0128),
n) Tuesday the 13th vs Tuesdays, Close-close: FIAT (0.0491), Recordati (0.0243), Salvatore Ferragamo (0.0087),
Terna Rete (0.0320),
4.5.2 Kruskal-Wallis Test
The null hypothesis regarding equality of two average rates of return was rejected for the following equities
(p-value shown in parenthesis):
a) 13th, Open-close: FIAT (0.0130), Telecom Italia (0.0390)
b) Friday the 13th, Close-close: FIAT (0.0415),
c) Friday the 13th, Overnight: Intesa San Paolo (0.0200), Salvatore Ferragamo (0.0347),
d) Friday the 13th, Open-open: Brembo (0.0466), SNAM (0.0316),
e) Friday the 13th, Open-close: FIAT (0.0443),
f) Tuesday the 13th, Close-close: Buzzi Unicem (0.0373), ENI (0.0399), FIAT (0.0224),
g) Tuesday the 13th, Overnight: Azymut (0.0480), Buzzi Unicem (0.0109), Tenaris (0.0114),
h) Tuesday the 13th, Open-open: Luxottica (0.0086),
i) Tuesday the 13th, Open-close: Recordati (0.0418),
j) 4th, Close-close: Brembo (0.0295),
k) 4th, Overnight: A2A (0.0116), BPER Banca (0.0270),
l) 4th, Open-open: CHN Industrial (0.0361),
m) 4th, Open-close: Banco Popolare (0.0485), Brembo (0.0324), Davide Campari (0.0349), Luxottica (0.0292),
SNAM (0.0330), Tenaris (0.0195), Terna Rete (0.0043),
n) Friday the 13th vs Fridays, Close-close: FIAT (0.0171), Telecom Italia (0.0470),
o) Tuesday the 13th vs Tuesdays, Close-close: Recordati (0.0413).
In all other cases, there was no reason to reject the null hypothesis in favor of the alternative hypothesis.
4.5.3 Confirmation of the Results Obtained with Z-Statistics by the Kruskal-Wallis Test
The null hypothesis was rejected with the use of two tests (the Z statistics and Kruskal-Wallis) for the following
companies:
a) Brembo: 4th, Open-close,
b) Buzzi Unicem: Tuesday the 13th, Close-close, Overnight,
c) CHN Industrial: 4th, Open-open,
d) FIAT: Friday the 13th, Open-close, Tuesday the 13
th, Close-close, Friday the 13
th vs Fridays, Close-close,
e) Luxottica: 4th, Open-close,
f) Recordati: Tuesday the 13th, Open-close, Tuesday the 13
th vs Tuesdays, Close-close,
g) SNAM: 4th, Open-close,
h) Telecom Italia, Friday the 13th vs Fridays, Close-close,
i) Tenaris: Tuesday the 13th, Overnight,
j) Terna Rete: 4th, Open-close.
On the Italian market the two most dominant effects were: 4th day of the month as well as Tuesday the 13
th. The
first one was registered mainly for Open-close rates of return, and the second for Close-close returns. Friday the
13th effect occurred but sporadically.
4.6 NIKKEI
The results of testing a zero hypothesis with the use of average rates of returns for two different populations permit

ijef.ccsenet.org International Journal of Economics and Finance Vol. 11, No. 1; 2019
162
to draw the following conclusions:
4.6.1 Z-Statistics
The null hypothesis regarding equality of two average rates of return was rejected for the following equities
(p-value shown in parenthesis):
a) 13th, Close-close: Dainpn Sumi (0.0491), East Japan (0.0318), Fujitsu (0.0126), Kyocera (0.0053), Mitsumi
Electr. (0.0484), NEC (0.0250), NTT Data (0.0144), Odakyu Elec. (0.0284), Resona Holdings (0.0213), Sharp
(0.0271), Sotbank (0.0057), Taisei (0.0031), Takara (0.0304), TGK Insulators (0.0168), Toyota (0.0326),
Trend Micro (0.0045), Yaskawa (0.0265),
b) 13th, Overnight: Ana Holdings (0.0324), Astellas Pharmas (0.0392), Dainpn Sumi (0.0094), East Japan
(0.0361), Hitach Const (0.0187), Kaima (0.0285), Kansai Elec. (0.0350), KDDI (0.0287), Softbank (0.0174),
Trend Micro (0.0080), Yahoo Japan (0.0220),
c) 13th, Open-open: Astallas Pharmas (0.0071), Daikin Ind. (0.0200), Hitach Const. (0.0202), OJI Holdings
(0.0351), Softbank (0.0391), Tokyo Ele. PWR (0.0139), Trend Micro (0.0031), Yahoo Yapan (0.0013),
Yokogawa (0.0386),
d) 13th, Open-close: Citizen Watch (0.0236), Fujitsu (0.0187), Kyocera (0.0181), NH Foods (0.0418), NTT Data
(0.0348), Odaky Elec. (0.0088), Oki Elec. (0.0284), Resona Holdings (0.0299), Sharp (0.0163), Taisei
(0.03030), TGK Insulators (0.0223), Yamato Holdings (0.0310), Yaskawa (0.0422),
e) Friday the 13th, Close-close: Astellas Pharmas (0.0105), Da Nip (0.0050), Daikin Ind. (0.0123), Daiwa
Securities (0.0261), East Japan (0.0197), Fujitsu (0.0127), Heiwa R. (0.0292), Hitachi Const. (0.0471), Hitachi
Zosen (0.0437), Kaima (0.0248), Kyocer (0.0320), Marui Group (0.0430), Meidensha (0.0164), NEC (0.0369),
Nissan (0.0263), Nisshin Steel (0.0331), NTT Data (0.0008), NTT Docomo (0.0370), Osaka Gas (0.0423),
Resona Holdings (0.0076), Sharp (0.0115), Softbank (0.0186), Suzuki (0.0382), Taiser (0.0150), Takara
(0.0384), Toho SVC (0.0032), Toho Zinc (0.0081), Tokai Carbon (0.0232), Tokyo Dome (0.0044), Toto
(0.0077), Trend Micro (0.0438),
f) Friday the 13th, Overnight: Ana Holdings (0.0352), Astellas Pharmas (0.0259), East Japan (0.0026), Mitsui
(0.0389), Mitsumi Electr. (0.0490), Nippon Paper (0.0025), Nissan (0.0478), Toshiba (0.0439),
g) Friday the 13th, Open-open: Daikin Ind. (0.0053), Dainpn Sumi (0.0270),
h) Friday the 13th, Open-close: AEON (0.0209), Citizen Watch (0.0363), Comsys (0.0494), Daikin Ind. (0.0017),
Heiwa R. (0.0277), Hitachi (0.0481), Hitachi Zosen (0.0056), Honda (0.0278), JTEKT (0.0448), Kyocera
(0.0266), Meidensha (0.0099), Mitshubishi (0.0115), Mitshubishi Est (0.0324), Mitsui Eng. (0.0301), Nippon
Paper (0.0034), Nippon Sheet GLS (0.0254), Nissan (0.0145), Nisshin Steel (0.0336), NTT Data (0.0024),
NTT Docomo (0.0264), Resona Holdings (0.0280), Sharp (0.0001), Softbank (0.0007), Sumitomo Elec.
(0.0214), Taiheyo Cement (0.0186), Taisei (0.0041), Takara (0.0075), TGK Insulators (0.0198), Toho SVC
(0.0345), Toho Zinc (0.0418), Tokyo Dome (0.0060), Toto (0.0162), Toyota Tsusho (0.0207),
i) Tuesday the 13th, Close-close: Canon (0.0382), Credit Saison (0.0071), Daikin Ind. (0.0038), Dainpn Sumi
(0,0210), Fujitsu (0.0054), JGC (0.0034), KDDI (0.0379), Kyocera (0.0061), Nitto Denko (0.0448), Nissan
(0.0045), NTT (0.0239), NTT Data (0.0369), Odakyu Elec. (0.0476), OJI Holdings (0.0058), Secom (0,0011),
Softbank (0.0239), Takeda (0.0009), TGK Insulators (0.0262), Tokuyama (0.0093), Tokyo Electron (0.0208),
Tokyo Marine (0.0462), Tokyo Seikan (0.0219), Trend Micro (0.0355),
j) Tuesday the 13th, Overnight: Ajinomoto (0.0254), Chubu Ele. (0.0331), Dainpn Suma (0.0206), Fujitsu
(0.0393), Furukawa Elek. (0.0251), Inpex (0.0111), JGC (0.0071), Kaima (0.0259), Kansai Elec. (0.0026),
Kuraray (0.0213), Nikkon (0.0387), Nippon Soda (0.0182), Nomura Holdigns (0.0016), Showa Denko
(0.0321), Sky Perfect (0.0357), Takeda (0.0000), Trend Micro (0.0034),
k) Tuesday the 13th, Open-open: Bridgestone (0.0232), Denso (0.0327), Durukawa (0.0350), Fuji Film (0.0020),
JGC (0.0457), Kansai Elec. (0.0463), Kyowa (0.0031), Meidensha (0.0451), Mitsubishi Elec. (0.0492), Mitsui
(0.0365), Nikkon (0.0232), OJI Holdings (0.0085), Resona Holdings (0.0164), Shinsei Bank (0.0065), Sky
Perfect (0.0009), Sumitomo Elec. (0.0328), Sumitomo Osaka (0.0065), Tokai Carbon (0.0235), Tokyo Ele.
PWR (0.0050), Toshiba (0.0196), Toto (0.0239), Trend Micro (0.0456),
l) Tuesday the 13th, Open-Close: Ashi Group (0.0051), Credit Saison (0.0028), Fujitsu (0.0439), Kyocera
(0.0187), Mitsumi Ele. (0.0333), NH Foods (0.0270), Nitto Denko (0.0494), Screen Holdings (0.0337), Secom
(0.0004), Toho SVC (0.0408), Tokuyama (0.0150), Toyo Seikan (0.0161), Trend Micro (0.0134),

ijef.ccsenet.org International Journal of Economics and Finance Vol. 11, No. 1; 2019
163
m) 4th, Close-close: Astellas Pharmas (0.0435), Honda (0.0333), Konami (0.0100), Meiji Holdings (0.0225), NEC
(0.0488), Sekisui (0.0183), Taisei (0.0048), Tokyo Marine (0.0176),
n) 4th, Overnight: Astellas Pharmas (0.0050), Canon (0.0193), Daichi Sankuyo (0.0498), Honda (0.0426), Inpex
(0.0272), Konami (0.0040), Mineb Mitsumi (0.0380), Mitsui (0.0477), Sekisui (0.0038), Seven & I (0.0366),
Shinsei Bank (0.0429), Sumitomo (0.0216), T&D Holdings (0.0221),
o) 4th, Open-open: Astellas Pharmas (0.0428), Inpex (0.0071), Mitsub Logistic (0.0437), Nippon Paper (0.0168),
NTN (0.0128), Sekisui (0.0141), Seven & I (0.0150), Shimizu (0.0416), Takashimaya (0.0471), Yamato
Holdings (0.0073),
p) 4th, Open-close: Hitachi Const. (0.0186), KDDI (0.0252), Taisei (0.0174), Toyobo (0.0457),
q) Friday the 13th vs Fridays: AEON (0.0173), Citizen Watch (0.0450), Comsys (0.0347), Daikin Ind. (0.0026),
Daiwa Sec. (0.0280), Dowa Holdings (0.0489), Fujitsu (0.0150), Fukuoka Fin. (0.0224), Heiwa R. (0.0286),
Hitachi Zosen (0.0070), Honda (0.0190), JFE Holdings (0.0436), JTEKT (0.0306), Kyocera (0.0309), Matsui
Sec. (0.0400), Mazda (0.0073), Meidensha (0.0042), Mitsubishi (0.0086), Mitsubishi Est. (0.0369), Mitsui
Eng. (0.0259), Nippon Sheet GLS (0.0139), Nisshin Steel (0.0389), NTT Data (0.0012), NTT Docomo
(0.00186), OKI Elec. (0.0383), Resona Holdings (0.0141), Sharp (0.0002), Softbank (0.0006), Sumco
(0.0395), Sumitomo (0.0162), Sumitomo Elec. (0.0324), Taiheyo Cement (0.0130), Taisei (0.0028), Takara
(0.0087), TGK Insulators (0.0098), Tokyo Dome (0.0044), Tokyo Marine (0.0456), Toto (0.0228), Toyota
Tsusho (0.0153), Trend Micro (0.0345),
r) Tuesday the 13th vs Tuesdays: Ashi Group (0.0033), Credit Saison (0.0074), Kyocera (0.0444), NH Foods
(0.0296), Secom (0.0013), Teijin (0.0384), Tokuyama (0.0468), Toyo Seikan (0.0437),
4.6.2 Kruskal-Wallis Test
The null hypothesis regarding equality of two average rates of return was rejected for the following equities
(p-value shown in parenthesis):
a) 13th, Close-close: Astellas Pharmas (0.0061), Da Nip (0.0087), East Japan (0.0092), Fujitsu (0.0375), Heiwa R.
(0.0280), Kaima (0.0203), Marui Group (0.0253), Mitsui Fudosan (0.0334), Mnisshin (0.0365), NTT Data
(0,0052), NTT Docomo (0.0042), Resona Holdings (0.0198), Softbank (0.0415), Suzuki (0.0341), Taisei
(0.0231), Takara (0.0297), Toho SVC (0.0367), Tokai Carbon (0.0474), Tokyo Dome (0.0136), Toshiba
(0.0420), Toto (0.0182), Trend Micro (0.0368),
b) 13th, Overnight: East Japan (0.0073), Mitsui (0.0125),
c) 13th, Open-open: Daikin Ind. (0.0164),
d) 13th, Open-close: Citizen Watch (0.0175), Daikin Ind. (0.0197), Dowa Holdings (0.0390), Heiwa R. (0.0405),
Hitachi Zosen (0.0115), Kyocera (0.0223), Meidensha (0.0293), Mitsubishi (0.0405), Mitsubishi Est. (0.0426),
Mitsui Fudosan (0.0084), Nippon Sheet GLS (0.0211), NTT Data (0,0030), NTT Docomo (0.0041), Resona
Holdings (0.0095), Sharp (0.0001), Softbank (0.0023), Suzuki (0.0292), Taiheyo Cement (0.0278), Taisei
(0.0017), Takara (0.0181), Tokyo Dome (0.0150), Toto (0.0108), Toyo Seikan (0.0184), Toyota Tsusho
(0.0370), Trend Micro (0.0145),
e) Friday the 13th, Close-close: Central Japan (0.0317), Dainpn Sumi (0.0394), East Japan (0.0239), Fujitsu
(0.0369), NTT Data (0.0152), Odakyu Elec. (0.0230), Sharp (0.0371), Softbank (0.0232), Taisei (0.0134),
Trend Micro (0.0078),
f) Friday the 13th, Overnight: Astellas Pharmas (0.0310), Daipn Sumi (0.0387), East Japan (0.0321), Hitachi
Const. (0.0223), Kansai Elec. (0.0373), Taisei (0.0480), Tokuyama (0.0192), Trend Micro (0.0324),
g) Friday the 13th, Open-open: Astellas Pharmas (0.0054), Daikin Ind. (0.0457), Hitachi Const. (0.0416), Meijin
Holdings (0.0219), OJI Holdings (0.0139), Softbank (0.0245), Tokyo Ele. PWWR (0.0204), Tokyo Gas
(0.0215), Trend Micro (0.0124), Yahoo Japan (0.0112),
h) Friday the 13th, Open-close: Citizen Watch (0.0368), Odakyu Elec. (0.0083), Oki Elec. (0.0469), Sharp
(0.0153), Taisei (0.0381), Yamato Holdings (0.0485),
i) Tuesday the 13th, Close-close: Credit Saison (0.0241), Daikin Ind. (0.0227), Dainpn Sumi (0.0255), Fujitsu
(0.0136), JGC (0.0197), Kyocera (0.0044), NTT Data (0.0338), Odakyu Elec. (0.0255), Oki Elec. (0.0495),
OJI Holdings (0.0315), Pioneer (0.0197), Showa Denko (0.0308), Softbank (0.0331), Takeda (0.0039), Toho
SVC (0.0218), Tokuyama (0.0105), Toyo Seikan (0.0397), Trend Micro (0.0467), Yamaha (0.0479),
j) Tuesday the 13th, Overnight: Ajinomoto (0.0276), Dainpn Sumi (0.0330), Inpex (0.0314), JGC (0.0245),

ijef.ccsenet.org International Journal of Economics and Finance Vol. 11, No. 1; 2019
164
Kansai Elec. (0.0055), Mitsubishi (0.0392), Nippon Soda (0.0267), Nomura Holdings (0.0038), Takeda
(0.0003), Trend Micro (0.0123),
k) Tuesday the 13th, Open-open: Astellas Pharmas (0.0434), Bridgestone (0.0490), Chlyoda (0.0365), Durukawa
(0.0381), Fuji Film (0.0027), Komatsu (0.0380), Kyowa (0.0024), Meidensha (0.0367), Mitsubishi Elec.
(0.0459), Mitsui Ord (0.0297), Nikkon (0.0291), Nomura Holdings (0.0256), OJI Holdings (0.0174), Shinsei
Bank (0.0450), Showa Denko (0.0184), Sky Perfect (0.0049), Sumitomo Elec. (0.0385), Sumitomo Osaka
(0.0247), Tokuyama (0.0024), Tokyo Ele. PWR (0.0094), Tosoh (0.0227),
l) Tuesday the 13th, Open-close: Ashi Group (0.0132), Credit Saison (0.0112), Daikin Ind. (0.0219), Kyocera
(0.0313), NH Foods (0.0379), Nichirei (0.0380), Screen Holdings (0.0478), Secom (0.0006), Tokuyama
(0.0423), Toyo Seikan (0.0134),
m) 4th, Close-close: Astellas Pharmas (0.0413), Fuji Heavy Ind. (0.0436), Honda (0.0333), Konami (0.0136),
NEC (0.0386), Nippon Light Metal (0.0160), Taisei (0.0165), Tokyo Marine (0.0463),
n) 4th, Overnight: Astellas Pharmas (0.0196), Konami (0.0115), Mitsubishi Motor (0.0350), Sapporo Holdings
(0.0404), Sekisui (0.0092), Seven & I (0.0490),
o) 4th, Open-open: Cobe Steel (0.0351), Eisai (0.0453), Inpex (0.0133), Mitsub Logistic (0.0180), Mitsubishi
Elec. (0.0245), Mitsubishi Motor (0.0170), Mitsui Fudosan (0.0320), Nippon Paper (0.0355), NSK (0.0136),
NTN (0.0053), Obayashi (0.0278), Sekisui (0.0062), Seven & I (0.0193), Shimizu (0.0130), Takashimaya
(0.0261), Tobu RW (0.0453), Tokyo Fudosan (0.0155), Tokyo Ord. (0.0453), Yamato Holdings (0.0042),
p) 4th, Open-close: Htiachi Const. (0.0177), Kyocera (0.0465), Meiji Holdings (0.0427), Nippon Light Metal
(0.0261), Taisei (0.0411),
q) Friday the 13th vs Fridays: Citizen Watch (0.0246), Comsys (0.0460), Daikin Ind. (0.0294), Dowa Holdings
(0.0242), Fujitsu (0.0361), Heiwa R. (0.0496), Hitachi Zosen (0.0177), JTEKT (0.0413), Keio Ord. (0.0498),
Kyocera (0.0332), Mazda (0.0358), Meidensha (0.0136), Mitsubishi (0.0308), Mitsui Fudosan (0.0145),
Nippon Sheet GLS (0.0125), NTT Data (0.0017), NTT Docomo (0.0033), Resona Holdings (0.0057), Sharp
(0.0001), Softbank (0.0022), Suzuki (0.0265), Taiheyo Cement (0.0207), Taisei (0.0013), Takara (0.0213),
TGK Insulators (0.0362), Tokyo Dome (0.0113), Toto (0.0152), Tokyo Seikan (0.0072), Toyota Tsusho
(0.0323), Trend Micro (0.0348),
r) Tuesday the 13th vs Tuesdays: Ashi Group (0.0114), Credit Saison (0.0216), Daikin Ind. (0.0436), NH Foods
(0.0443), Nichirei (0.0395), Secom (0.0025), Sumitomo Osaka (0.0482), Tokyo Seikan (0.0435).
In all other cases, there was no reason to reject the null hypothesis in favor of the alternative hypothesis.
4.6.3 Confirmation of the Results Obtained with Z-Statistics by the Kruskal-Wallis Test
The null hypothesis was rejected with the use of two tests (the Z statistics and Kruskal-Wallis) for the following
companies:
a) 13th, Close-close: East Japan, Fujitsu, NTT Data, Resna Holdings, Sharp, Soft Bank, Taisei, Takara
b) 13th, Overnight: East Japan,
c) 13th, Open-open: Daikin Ind.,
d) 13th, Open-close: Citizen Watch, Kyocera, NTT Data, Resona Holdings, Sharp, Taisei,
e) Friday the 13th , Close-close: East Japan, Fujitsu, NTT Data, Sharp, Softbank, Taisei, Terend Micro,
f) Friday the 13th , Overnight: Astellas Pharmas, East Japan,
g) Friday the 13th , Open-open: Daikin Ind.,
h) Friday the 13th , Open-close: Citizen Watch, Sharp, Taisei,
i) Tuesday the 13th, Close-close: Advantest, Credit Saison, Daikin Ind., Dainpn Sumi, Fujitsu, JGC, Kyocera,
NTT Data, Odakyu Elec., OJI Holdings, Secom, Softbank, Takeda, Tokuyama, Toyo Seikan,
j) Tuesday the 13th, Overnight: Ajinomoto, Dainpn Sumi, JGC, Kansai Elec., Nippon Soda, Nomura Holdings,
OJI Holdings, Takeda,
k) Tuesday the 13th, Open-open: Bridgestone, Durukawa, Fuji Film, Kyowa, Meidensha, Mitsubishi Elec.,
Nikkon, OJI Holdings, Shinsei Bank, Sky Perfect, Sumitomo Elec., Sumitomo Osaka, Tokyo Ele PWR,
l) Tuesday the 13th, Open-close: Ashi Group, Credit Saison, Kyocera, NH Foods, Screen Holdings, Secom,
Tokuyama, Toyo Seikan,

ijef.ccsenet.org International Journal of Economics and Finance Vol. 11, No. 1; 2019
165
m) 4th, Close-close: Astellas Pharmas, Honda, Konami, NEC, Taisei, Tokyo Marine,
n) 4th, Overnight: Astellas Pharmas, Konami, Sekisui, Seven & I,
o) 4th, Open-open: Inpex, Mitsub Logistic, Nippon Paper, NTN, Sekisui, Seven & I, Shimizu, Takashimaya,
Yamato Holdings,
p) 4th, Open-close: Hitachi Const., Taisei,
q) Friday the 13th vs Fridays: Citizen Watch, Comsys, Daikin Ind., Dowa Holdings, Fujitsu, Heiwa R., Hitachi
Zosen, JTEKT, Kyocera, Mazda, Meidensha, Mitsubishi, Nippon Sheet GLS, NTT Data, NTT Docomo,
Resona Holdings, Sharp, Softbank, Taiheyo Cement, Taisei, Takara, TGK Insulators, Tokyo Dome, Toto,
Toyota Tsusho,
r) Tuesday the 13th vs Tuesdays: Ashi Group, Credit Saison, NH Foods, Secom, Toyo Seikan.
On the Japanese stock market the appearance of all types of effects was observed, both those related to the number
13 and the number 4. Most often, the effects occurred for the following returns: Close-close (13th day of the month,
Friday the 13th and Tuesday the 13
th), Open-open (Tuesday the 13
th and 4
th day of the month) and Open-close (13
th
day of the month).
4.7 SENSEX
The results of testing a zero hypothesis with the use of average rates of returns for two different populations permit
to draw the following conclusions:
4.7.1 Z-Statistics
The null hypothesis regarding equality of two average rates of return was rejected for the following equities
(p-value shown in parenthesis):
a) 13th, Open-open: Bharat Airtel (0.0291),
b) Friday the 13th, Close-close: Bharat Heavy (0.0114), Gail India (0.0012), Infosys (0.0140), Vedanta (0.0136),
Wipro (0.0224),
c) Friday the 13th, Overnight: Bajaj Auto (0.0008),
d) Friday the 13th, Open-close: Asian paints (0.0303), Bharat Heavy (0.0165), Hindalco India (0.0193), Icici
Bank (0.0071), Infosys (0.0132), Tata Consultancy (0.0050), Vedanta (0.0472), Wipro (0.0133),
e) Tuesday the 13th, Close-close: Housing Development (0.0437), Icici Bank (0.0206), Mahindra & Mahindra
(0.0479), NTPC (0.0234),
f) Tuesday the 13th, Open-open: Gail India (0.0375),
g) Tuesday the 13th, Open-close: Icici Bank (0.0121), NTPC (0.0076),
h) 4th, Close-close: State Bank of India (0.0125),
i) 4th, Open-open: Asian Paints (0.0236), Bharat Heavy (0.0004),
j) 4th, Open-close: State Bank of India (0.0296), Tata Steel (0.0300),
k) Friday the 13th vs Fridays: Asian Paints (0.0473), Bharat Heavy (0.0184), Hindlaco India (0.0134), Icici Bank
(0.0120), Infosys (0.0101), Tata Consultancy (0.0072), Vedanta (0.0475), Wipro (0.0187),
l) Tuesday the 13th vs Tuesdays: Icici Bank (0.0064), Mahindra & Mahindra (0.0283), NTPC (0.0054),
4.7.2 Kruskal-Wallis Test
The null hypothesis regarding equality of two average rates of return was rejected for the following equities
(p-value shown in parenthesis):
a) 13th, Close-close: Bharat Heavy (0.0130), Bharti Airtel (0.0342), Gail India (0.0029), Infosys (0.0447), Larsen
& Toubro (0.0391), State Bank of India (0.0459), Vedanta (0.0234),
b) 13th, Overnight: Bajaj Auto (0.0258),
c) 13th , Open-close: Bharat Heavy (0.0204), Bharti Airtel (0.0465), Hindalco India (0.0124), Icici Bank (0.0137),
Infosys (0.0110), State Bank of India (0.0357), Tata Consultancy (0.0341), Wipro (0.0086),
d) Friday the 13th, Open-open: Bharti Airtel (0.0329), Mahindra & Mahindra (0.0427), Tata Steel (0.0284),
e) Tuesday the 13th, Close-close: Icici Bank (0.0084), NTPC (0.0336),
ijef.ccsenet.org International Journal of Economics and Finance Vol. 11, No. 1; 2019
166
f) Tuesday the 13th, Open-close: Icici Bank (0.0037), NTPC (0.0069),
g) 4th, Close-close: State Bank of India (0.0110), Tata Motors (0.0341),
h) 4th. Overnight: Cipla (0.0248), Dr Reddy‟s Laboratories (0.0050), Oil and Natural Gas (0.0100),
i) 4th, Open-open: Asian Paints (0.0066), Bharat Heavy (0.0002), Cipla (0.0014), Maruti Suzuki (0.0183),
j) 4th, Open-close: Hindalco India (0.0336), State Bank of India (0.0221), Tata Steel (0.0321),
k) Friday the 13th vs Fridays, Close-close: Asian Paints (0.0435), Bharat Heavy (0.0257), Hindalco India
(0.0063), Icici Bank (0.0199), Infosys (0.0083), State Bank of India (0.0392), Tata Consultancy (0.0294),
Wipro (0.0130),
l) Tuesday the 13th vs Tuesdays, Close-close: Housing Development (0.0360), Icici Bank (0.0028), NTPC
(0.0052),
In all other cases, there was no reason to reject the null hypothesis in favor of the alternative hypothesis.
4.7.3 Confirmation of the Results Obtained with Z-Statistics by the Kruskal-Wallis Test
The null hypothesis was rejected with the use of two tests (the Z statistics and Kruskal-Wallis) for the following
companies:
a) Asian Paints: 4th, Open-open, Friday the 13
th vs Fridays, Close-close,
b) Bharat Heavy: 4th, Open-open, Friday the 13
th vs Fridays, Close-close,
c) Hindalco India: Friday the 13th
vs Fridays, Close-close,
d) Icici Bank: Tuesday the 13th, Close-close, Open-close, Friday the 13
th vs Fridays, Close-close, Tuesday the
13th vs Tuesdays, Close-close,
e) Infosys: Friday the 13th vs Fridays, Close-close,
f) NTPC: Tuesday the 13th, Close-close, Open-close, Tuesday the 13
th vs Tuesdays, Close-close,
g) State Bank of India: 4th, Close-close, Open-close,
h) Tata Consultancy: Friday the 13th vs Fridays, Close-close,
i) Tata Steel: 4th, Open-close,
j) Wipro: Friday the 13th
vs Fridays, Close-close.
On the Indian stock market, just like on Japanese market, were registered all types of effects, related to the number
13 (Friday the 13th and Tuesday the 13
th) and the number 4. The only exception is the effect of the 13
th day of the
month that was not present. The observed effects most often occurred for the following returns: Close-close (Friday
the 13th and Tuesday the 13
th), Open-open and Open-close (in both cases: 4
th day of the month).
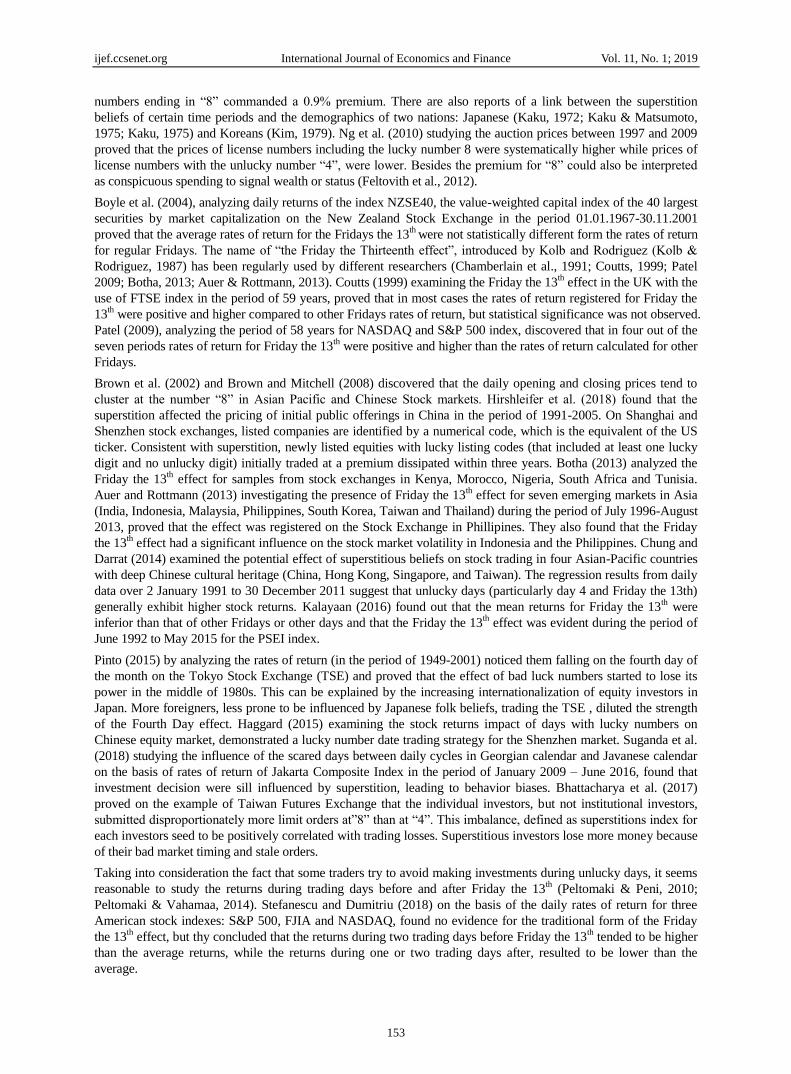
5. Conclusions
The aim of this study was to determine the prevalence of the calendar effect in case of “the unfortunate dates effect”,
on the example of 7 world equity indexes components. Analysis of the effects of seasonality included an
examination of the rates of return calculated for four approaches:
a) Close – close
b) Overnight
c) Open - open
d) Open – close
In all these cases the statistical equality of one-session rates of return for two population were calculated for:
a) Sessions falling on the 13th day of the month vs all other sessions (first part),
b) Sessions falling on Friday the 13th vs all other sessions (second part),
c) Sessions falling on Tuesday the 13th vs all other sessions (third part),
d) Sessions falling on the 4th day of month vs all other sessions (fourth part),
In the fifth part the statistical equality of one-session rates of return for the population of Friday the 13th and the
population of other Fridays were compared. The following part of the fifth part of the paper consists of the analysis
of equality of rates of return for the sessions falling on Tuesday the 13th vs rates of return calculated for all
remaining Tuesdays. This is the first study known to the author that takes into account other rates of return than
ijef.ccsenet.org International Journal of Economics and Finance Vol. 11, No. 1; 2019
167
Close-close.
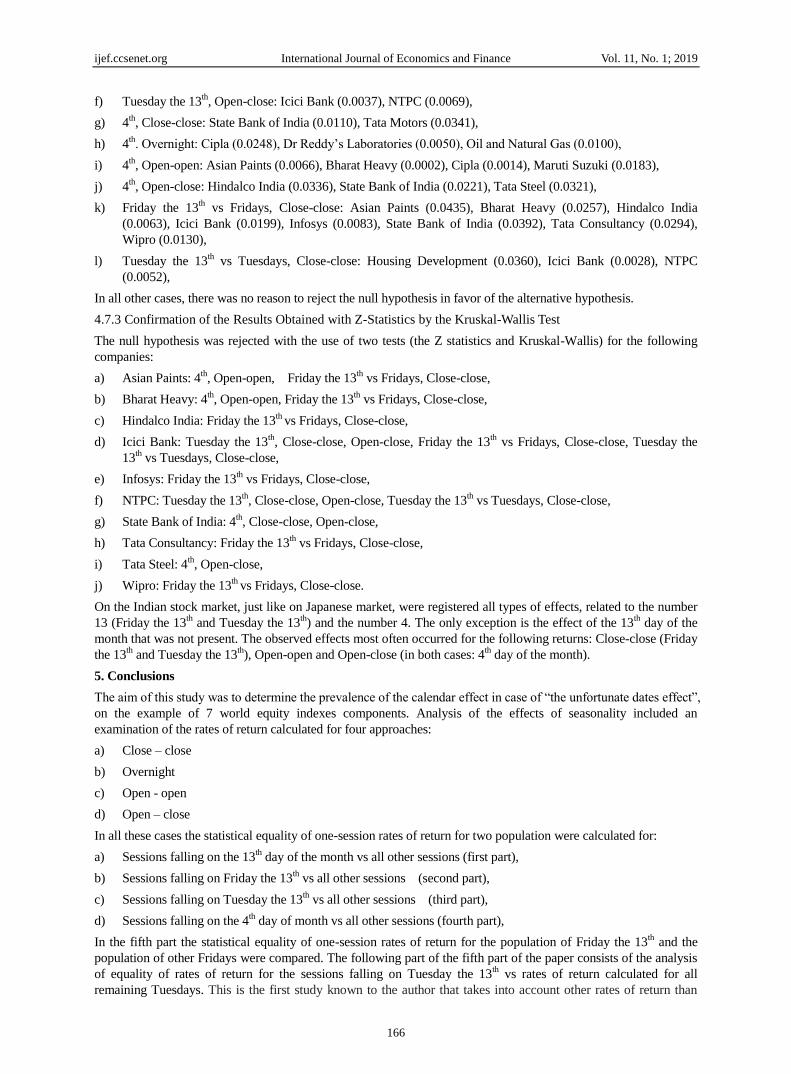
Calculations proceeded in this paper indicate the presence of “the unfortunate days effect” – the results are
presented in Table 1, Table 2 and Table 3. The frequency of cases when p values were lower than 0.05 for Z
statistics as well as for Kruskal-Wallis tests, was the highest for Tuesday the 13th (Close-close), followed by
Tuesday the 13th (Open-close), 4
th (Open-open), except CAC40 index and Friday the 13
th vs Fridays (Close-close),
except DAX and DJIA indexes – see Figure 1. In case of the Nikkei index “the unfortunate days effect” was
registered also for the following returns: 13th day of the month (Open-close and Close-close) as well as for Tuesday
the 13th (Overnight and Open-open).
Table 1. Number of “the unfortunate day effects”, calculated for the analyzed equity indexes components with the
use of two statistical tests: Z statistics test and Kruskal-Wallis test (in brackets)
Index 13th day of the month Friday the 13th Tuesday the 13th 4th day of the month Friday the
13th vs
Tuesday
the 13th vs
Index C-C OV O-O O-C C-C OV O-O O-C C-C OV O-O O-C C-C OV O-O O-C C-C C-C
CAC40 2 (2) 0 (1) 1 (3) 2 (0) 1 (1) 0 (0) 1 (3) 1 (0) 4 (3) 0 (0) 0 (0) 5 (3) 1 (4) 0 (0) 0 (0) 2 (2) 1 (1) 5 (4)
DAX 0 (2) 2 (0) 0 (4) 0 (1) 3 (0) 1 (1) 2 (0) 3 (0) 4 (6) 0 (0) 0 (1) 2 (1) 2 (1) 1 (0) 1 (1) 1 (1) 2 (0) 1 (1)
DJIA 2 (2) 2 (4) 1 (2) 2 (1) 0 (3) 3 (1) 2 (1) 0 (1) 1 (2) 1 (1) 1 (1) 4 (3) 3 (2) 0 (3) 3 (4) 1 (1) 0 (1) 1 (2)
FTSE30 1 (3) 2 (2) 1 (5) 2 (2) 2 (1) 4 (2) 3 (0) 1 (2) 7 (7) 1 (0) 1 (1) 6 (5) 2 (0) 3 (2) 3 (2) 1 (0) 1 (1) 7 (6)
FTSE
MIBTEL 1 (0) 2 (0) 1 (0) 0 (2) 0 (1) 0 (2) 1 (2) 3 (1) 2 (3) 2 (3) 0 (1) 3 (1) 1 (1) 3 (2) 1 (1) 4 (7) 3 (2) 4 (1)
NIKKEI 17 (22) 11 (2) 9 (1) 13 (25) 31 (10) 8 (8) 2 (10) 33 (6) 23 (19) 17 (10) 22 (21) 13 (10) 8 (8) 13 (6) 10 (19) 4 (5) 40 (30) 8 (8)
SENSEX 0 (7) 0 (1) 1 (0) 0 (8) 5 (0) 1 (0) 0 (3) 8 (0) 4 (2) 0 (0) 1 (0) 2 (2) 1 (2) 0 (3) 2 (4) 2 (3) 8 (8) 3 (3)
Source: own calculation
Table 2. Number of cases when p values were lower than 0.05 at the same time for two tests: Z statistics and
Kruskal-Wallis
Index 13th day of the
month Friday the 13th Tuesday the 13th 4th day of the month
Friday the
13th vs
Tuesday
the 13th vs
C-C OV O-O O-C C-C OV O-O O-C C-C OV O-O O-C C-C OV O-O O-C C-C C-C
CAC40 0 0 0 0 0 0 0 0 3 0 0 3 1 0 0 1 1 4
DAX 0 0 0 0 0 0 0 0 3 0 0 1 1 0 1 1 0 1
DJIA 0 0 0 0 0 0 0 0 1 1 1 2 1 0 3 0 0 1
FTSE30 0 0 0 0 0 0 0 0 6 0 1 4 0 1 2 0 1 4
FTSE MIBTEL 0 0 0 0 0 0 0 1 2 2 0 1 0 0 1 4 2 1
NIKKEI 8 1 1 6 7 2 1 3 15 9 13 8 6 4 9 2 25 5
SENSEX 0 0 0 0 0 0 0 0 2 0 0 2 1 0 2 2 7 2
Source: own calculation.
Considering the quotient of (1) the number of cases when the null hypothesis was rejected at the same time with the
use of the Kruskal-Wallis test and Z statistic and (2) the number of companies included in the analyzed index, the
percentage ratio of these two variables can be calculated (see Table 3). The highest values of the percentage ration
( 10 ) were recorded for the following indexes (see Figure 5):
a) SENSEX – 23% (Friday the 13th
vs Fridays, C-C)
b) FTSE30 – 20% (Tuesday the 13th
, C-C),
c) FTSE30 – 13.3 % (Tuesday the 13th
vs Tuesdays, C-C),
d) FTSE30 – 13.3 % (Tuesday the 13th
, O-C)
e) NIKKEI225 – 11.21% (Friday the 13th
vs Fridays, C-C)
f) FTSE MIBTEL – 10.81% (4th
, O-C)
g) DJIA – 10% (4th
, O-O).

ijef.ccsenet.org International Journal of Economics and Finance Vol. 11, No. 1; 2019
168
Table 3. Percentage of cases for each of analyzed indexes when p values were lower than 0.05 at the same time for
two kind of tests: Z statistics and Kruskal-Wallis (The results are derived from the Table 2 by dividing the number
form the Table 2 by the umber of the analyzed components of each index)
Index 13th day of the month Friday the 13th Tuesday the 13th 4th day of the month Friday the 13th
vs Fridays
Tuesday the 13th
vs Tuesdays
C-C OV O-O O-C C-C OV O-O O-C C-C OV O-O O-C C-C OV O-O O-C C-C C-C
CAC40 0.00 0.00 0.00 0.00 0.00 0.00 0.00 0.00 7.69 0.00 0.00 7.69 2.56 0.00 0.00 2.56 2.56 10.26
DAX 0.00 0.00 0.00 0.00 0.00 0.00 0.00 0.00 10.00 0.00 0.00 3.33 3.33 0.00 3.33 3.33 0.00 3.33
DJIA 0.00 0.00 0.00 0.00 0.00 0.00 0.00 0.00 3.33 3.33 3.33 6.67 3.33 0.00 10.00 0.00 0.00 3.33
FTSE30 0.00 0.00 0.00 0.00 0.00 0.00 0.00 0.00 20.00 0.00 3.33 13.33 0.00 3.33 6.67 0.00 3.33 13.33
FTSE MIBTEL 0.00 0.00 0.00 0.00 0.00 0.00 0.00 2.70 5.41 5.41 0.00 2.70 0.00 0.00 2.70 10.81 5.41 2.70
NIKKEI 3.59 0.45 0.45 2.69 3.14 0.90 0.45 1.35 6.73 4.04 5.83 3.59 2.69 1.79 4.04 0.90 11.21 2.24
SENSEX 0.00 0.00 0.00 0.00 0.00 0.00 0.00 0.00 6.67 0.00 0.00 6.67 3.33 0.00 6.67 6.67 23.33 6.67
Source: own calculation.
Taking into account results of both tests, i.e. Kruskal-Wallis and Z statistics, the calendar effect regarding rates of
return of the 13th day of the month was observed only on the Japanese market (for all calculated types of rates of
return). Cultural differences between the analyzed markets would suggest the occurrence of the Tuesday the 13th
effect, possibly on European markets, on which the influence of Spanish investors can be noticed. Meanwhile, as a
result of the conducted research, it was proved that this effect occurs on all analyzed markets, including Asian ones.
The same applies to the effect of the 4th day of the month, which should mainly be present in Asian markets.
Meanwhile, it was registered in all analyzed markets. This fact entitles to the thesis about capital mobility in
contemporary financial markets.
The calendar effects of returns calculated for Friday the 13th in relation to other Fridays, were observed on all
exchanges except for German and American, while the calendar effects of Tuesday the 13th in relation to the other
Tuesdays were registered for all analyzed equity exchanges.
Summing up the values in the individual rows of Table 3, another ranking can be created, e.g. ranking of unlucky
number anomalies for all analyzed stock exchanges: DAX (26.67%), CAC40 (33.33%), DJIA (33.33%), FTSE
MIBTEL (37.84%), NIKKEI 225 (56.05%), SENSEX (60.00%) and FTSE30 (63.33%). Contrary to the
expectations, the unlucky day effects were not the most commonly observed on the Asian Stock Exchanges but on
the British Stock Exchange. “The unfortunate dates effect” was the most frequently observed for Tuesday and 13th
and then for the 4th day of the month. Taking into consideration all types of analyzed returns (Close-close,
Open-open, Open-close and Overnight), the most frequent effects were registered for the following returns:
Close-close and for Open-close, with the exception of the 4th day of the month effect, in which the order was
changed.
Figure 1. Frequency of cases when p values were lower than 0.05 at the same time for two kind of tests
Source: own calculation.
Results obtained in the paper regarding the Friday the 13th effect are consistent with those of Kolb and Rodriguez
(1987). Notably the results do not support the outcomes reported by Agrawal and Tandon (1994), Coutts (1999) and
Lucey (2000). Further research on the occurrence of “the unfortunate dates effect” in the financial markets should
ijef.ccsenet.org International Journal of Economics and Finance Vol. 11, No. 1; 2019
169
cover the currency and commodity market. The conducted studies proved the occurrence of “the unlucky day effect”
not only in case of Close-close returns, but also in the remaining three that is Open-close, Open-open and
Overnight.
The main limitation of this research is the range of data gained from the Reuters as well as the unequal intervals of
observations for different equity indexes. The outcome may be regarded as a part of the ongoing discussions on the
hypothesis of financial markets efficiency, which was introduced by Fama (1970). The results of the analysis
entitles to the thesis about capital mobility in contemporary financial markets.
References
Agarwal, S., Jia, H., Haomijg, L., Png, I., & Tien-Foo, S. (2014). Superstition and assets markets: Evidence from
Singapore housing. SSRN Working Paper, 2416832. https://doi.org/10.2139/ssrn.2416832
Aggarval, R., & Rivoli, P. (1989). Seasonal and day-of-the week effects in four emerging stock markets.
Financial Review, 24, 541-550. https://doi.org/10.1111/j.1540-6288.1989.tb00359.x
Agrawal, A., & Tandon, K. (1994). Anomalies or illusions? Evidence from stock markets in eighteen countries.
Journal of International Money and Finance, 13, 83-106. https://doi.org/10.1016/0261-5606(94)90026-4
Auer, B., & Rottman, H. (2014). Is there a Friday the 13th
effect in emerging Asian stock markets?. Journal of
Behavioral and Experimental Finance, 1, 17-26. https://doi.org/10.1016/j.jbef.2014.01.001
Barone, E. (1990). The Italian stock market: Efficiency and calendar anomalies. Journal of Banking and Finance,
14, 493-510. https://doi.org/10.1016/0378-4266(90)90061-6
Bhattacharya, U., Kuo, W., Lin, T., & Zhao, J. (2018). Do superstitious traders lose money? Management
Science, 64(8). https://doi.org/10.1287/mnsc.2016.2701
Blacher, R. (1983). Clusters of disaster: Superstition and the physician. General Hospital Psychiatry, 5(4),
279-284. https://doi.org/10.1016/0163-8343(83)90007-5
Botha, F. (2013). Stock returns and Friday the 13th
effect in five African countries. African Review of Economics
and Finance, 4(2), 247-253.
Boudreaux, D. (1995). The monthly effect in international stock markets: Evidence and implications. Journal of
Financial and Strategic Decisions, 8(1), 15-20.
Boyle, G., Hagan, A., O‟Connor, S., & Whitwell, N. (2014). Emotion, fear and superstition in the New Zealand
stock market. Working Paper New Zealand Institute for the Study of Competition and Regulation Inc.
Brown, P., & Mitchel, J. (2008). Culture and stock price clustering: evidence from the Peoples‟ Republic of
China. Pacific-Basin Finance Journal, 16(1), 95-120. https://doi.org/10.1016/j.pacfin.2007.04.005
Brown, P., Chua, A., & Mitchell, J. (2002). The influence of cultural factors on price clustering: Evidence from
Asia-Pacific stock markets. Pacific-Basin Finance Journal, 10(3), 307-332.
https://doi.org/10.1016/S0927-538X(02)00049-5
Chamberlain, T., Cheung, C., & Kwan, C. (1991). The Friday the Thirteenth effect: Myth or reality. Quarterly
Journal of Business and Economics, 30(2), 111-117.
Chaundler, C. (1970). Every man’s book of superstition. London: A. R. Mowbray and Co.
Chong, T., & Du, X. (2009). The value of superstitions. Journal of Economic Psychology, 31, 293-309.
Chung, R., Darrat, A., & Li, B. (2014). Superstitions and stock trading: Some new evidence. Journal of the Asia
Pacific Economy, 19(4), 527-538. https://doi.org/10.1080/13547860.2014.920589
Coutts, J. (1999). Friday the thirteenth and the Financial Times industrial ordinary shares index 1935-94. Applied
Economics Letters, 6(1), 35-37. https://doi.org/10.1080/135048599353843
Defusco, R., McLeavey, D., Pinto, J., & Runkle, D. (2001). Quantitative methods for investment analysis.
Baltimore: United Book Press.
Dyl, E., & Maberly, E. (1988). The anomaly that isn‟t there: A comment on Friday the Thirteenth. Journal of
Finance, 43(5), 1286-1295. https://doi.org/10.1111/j.1540-6261.1988.tb03971.x
Fama, E. (1970). Efficient capital markets; a review of theory and empirical work. Journal of Finance, 25(2),
383-417. https://doi.org/10.2307/2325486
Feltovich, N., & Harbaugh, R. (2002). Too cool for school. Signaling and countersignaling. RAND Journal of
Economics, 33(4), 630-649. https://doi.org/10.2307/3087478

ijef.ccsenet.org International Journal of Economics and Finance Vol. 11, No. 1; 2019
170
Fortin, N., Hill, A., & Huang J. (2013). Superstition in the housing market. Economic Inquiry, 52(3), 974-985.
https://doi.org/10.1111/ecin.12066
Fudenberg, D., & Levine, D. (2006). Superstition and rational learning. American Economic Review, 96(3),
630-651. https://doi.org/10.1257/aer.96.3.630
Gu, A. (2003). The declining January effect: Evidence from U.S. equity markets. Quarterly Review of Economics
and Finance, 43, 395-404. https://doi.org/10.1016/S1062-9769(02)00160-6
Haggard, K. (2015). Stock returns in Chinese markets and lucky numbered days. Managerial Finance, 41(9),
925-939. https://doi.org/10.1108/MF-09-2014-0260
Hira, K., Fukui, T., Endoh, A., Rahman, M., & Maekawa, M. (1998). Influence of superstition on the date of
hospital discharge and medical cost in Japan, Retrospective and Descriptive Stud., British Medical Journal,
- Clinical Research Edition, 317, 71-74, 1680-1682. https://doi.org/10.1136/bmj.317.7174.1680
Hirshleifer, D., Jian, M., & Zhang, H. (2018). Superstition and financial decision making. Management Science,
64(1), 235-247. https://doi.org/10.1287/mnsc.2016.2584
Jiang, Y., Cho, A., & Adaval, R. (2009). The unique consequences of feeling lucky: Implications for consumer
behavior. Journal of Consume Psychology, 19(2), 171-184. https://doi.org/10.1016/j.jcps.2009.02.010
Kaku, K. (1972). Are physician sympathetic to superstition? A study of Hinoe-Uma. Social Biology, 19, 60-64.
https://doi.org/10.1080/19485565.1972.9987966
Kaku, K. (1975). Increased induced Abortion rate in 1966, an aspect of Japanese folk superstition. Annals of
Human Biology, 2(2), 111-115. https://doi.org/10.1080/03014467500000651
Kaku, K., & Matsumoto, S. (1975). Influence of a folk superstition on fertility of Japanese in California and
Hawaii. American Journal of Public Health, 65, 170-174. https://doi.org/10.2105/AJPH.65.2.170
Kalayaan, C. (2016). Superstition in the Philippine stock market. Review of Integrative Business and Economics
Research, 5(2), 84-96.
Kato, K., Schwarz, S., & Ziemba, W. (1990). Day of the weekend effects in Japanese stocks. Japanese Capital
Markets. New York: Ballinger.
Kim, Y. (1979). Fertility of the Korean population in Japan influenced by a folk superstition in 1966. Journal of
Biosocial Science, 11(4), 457-464. https://doi.org/10.1017/S0021932000012530
Kolb, E., & Rodriguez, R. (1987). Friday the thirteenth: part VII – a note. Journal of Finance, 42(5), 1385-1387.
https://doi.org/10.2307/2328534
Kramer, T., & Block L. (2008). Conscious and non-conscious components of superstitious beliefs in judgment
and decision-making. Journal of Consumer Research, 34(6), 783-793. https://doi.org/10.1086/523288
Latif, M., Arshad, S., Fatima, M., & Rarooq, S. (2011). Market efficiency, market anomalies, causes, Evidences
and some behavioral aspects of market anomalies. Research Journal of Finance and Accounting, 2(9-10),
1-14.
Lepori, G. (2009). Dark omens in the sky: Do superstitious beliefs affect investment decisions? SSRN Working
Paper 1428792, 2009. https://doi.org/10.2139/ssrn.1428792
Liu, W. (2013). Lunar calendar effect: evidence of the Chinese farmer‟s calendar on the equity markets in East
Asia. Journal of the Asia-Pacific Economy, 18(4), 560-577. https://doi.org/10.1080/13547860.2013.803841
Lucey, B. (2000). Friday the 13th
and the philosophical basis of financial economics. Journal of Economics and
Finance, 24(3), 294-301. https://doi.org/10.1007/BF02752610
Lucey, B. (2001). Friday the 13th
: International evidence. Applied Economics Letters, 8(9), 577-579.
https://doi.org/10.1080/13504850010025664
Mills, T., & Coutts, A. (1995). Calendar effects in the London Stock Exchange FT-SE Indices. European Journal
of Finance, 1, 79-93. https://doi.org/10.1080/13518479500000010
Ng, T., Chong, T., & Du, X. (2010). The value of superstitions. Journal of Economic Psychology, 31(3), 293-309.
https://doi.org/10.1016/j.joep.2009.12.002
Patel, J. (2009). Recent evidence on Friday the thirteenth effect in U.S. stock returns. Journal of Business and
Economics Research, 7(3), 55-58. https://doi.org/10.19030/jber.v7i3.2271
Peltomaki, J., & Peni, E. (2010). Friday the thirteenth and the stock market. Manuscript. University of Vaasa.
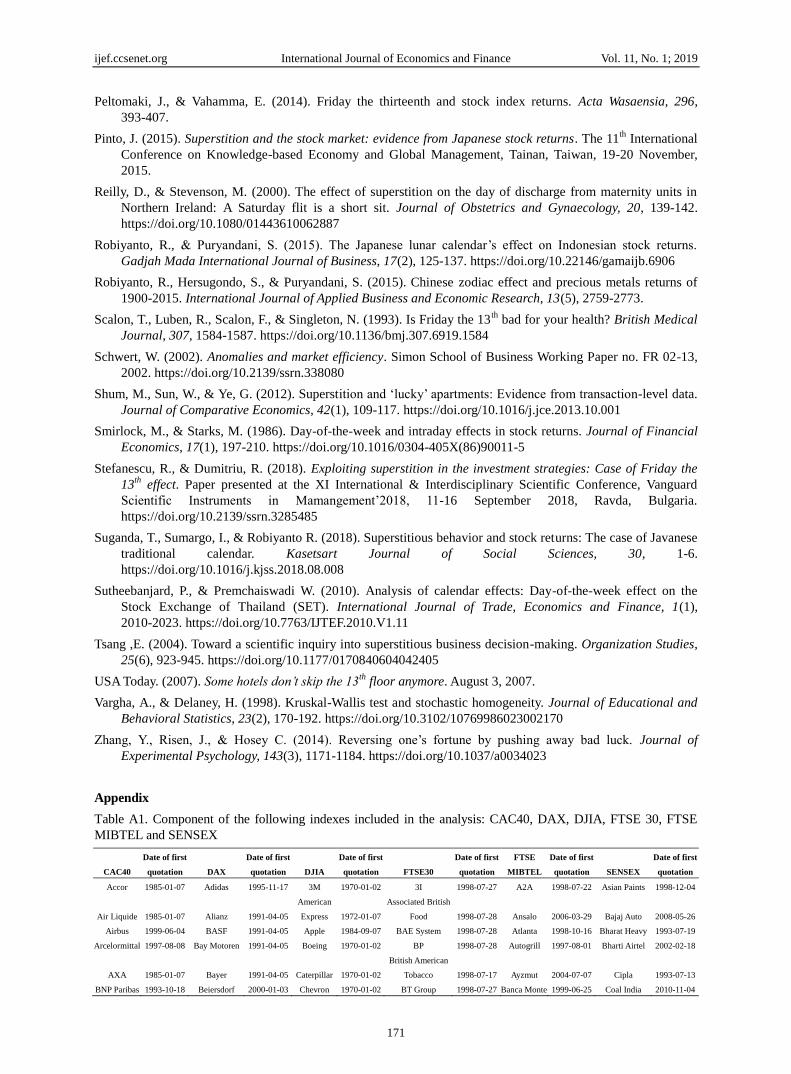
ijef.ccsenet.org International Journal of Economics and Finance Vol. 11, No. 1; 2019
171
Peltomaki, J., & Vahamma, E. (2014). Friday the thirteenth and stock index returns. Acta Wasaensia, 296,
393-407.
Pinto, J. (2015). Superstition and the stock market: evidence from Japanese stock returns. The 11th
International
Conference on Knowledge-based Economy and Global Management, Tainan, Taiwan, 19-20 November,
2015.
Reilly, D., & Stevenson, M. (2000). The effect of superstition on the day of discharge from maternity units in
Northern Ireland: A Saturday flit is a short sit. Journal of Obstetrics and Gynaecology, 20, 139-142.
https://doi.org/10.1080/01443610062887
Robiyanto, R., & Puryandani, S. (2015). The Japanese lunar calendar‟s effect on Indonesian stock returns.
Gadjah Mada International Journal of Business, 17(2), 125-137. https://doi.org/10.22146/gamaijb.6906
Robiyanto, R., Hersugondo, S., & Puryandani, S. (2015). Chinese zodiac effect and precious metals returns of
1900-2015. International Journal of Applied Business and Economic Research, 13(5), 2759-2773.
Scalon, T., Luben, R., Scalon, F., & Singleton, N. (1993). Is Friday the 13th
bad for your health? British Medical
Journal, 307, 1584-1587. https://doi.org/10.1136/bmj.307.6919.1584
Schwert, W. (2002). Anomalies and market efficiency. Simon School of Business Working Paper no. FR 02-13,
2002. https://doi.org/10.2139/ssrn.338080
Shum, M., Sun, W., & Ye, G. (2012). Superstition and „lucky‟ apartments: Evidence from transaction-level data.
Journal of Comparative Economics, 42(1), 109-117. https://doi.org/10.1016/j.jce.2013.10.001
Smirlock, M., & Starks, M. (1986). Day-of-the-week and intraday effects in stock returns. Journal of Financial
Economics, 17(1), 197-210. https://doi.org/10.1016/0304-405X(86)90011-5
Stefanescu, R., & Dumitriu, R. (2018). Exploiting superstition in the investment strategies: Case of Friday the
13th
effect. Paper presented at the XI International & Interdisciplinary Scientific Conference, Vanguard
Scientific Instruments in Mamangement‟2018, 11-16 September 2018, Ravda, Bulgaria.
https://doi.org/10.2139/ssrn.3285485
Suganda, T., Sumargo, I., & Robiyanto R. (2018). Superstitious behavior and stock returns: The case of Javanese
traditional calendar. Kasetsart Journal of Social Sciences, 30, 1-6.
https://doi.org/10.1016/j.kjss.2018.08.008
Sutheebanjard, P., & Premchaiswadi W. (2010). Analysis of calendar effects: Day-of-the-week effect on the
Stock Exchange of Thailand (SET). International Journal of Trade, Economics and Finance, 1(1),
2010-2023. https://doi.org/10.7763/IJTEF.2010.V1.11
Tsang ,E. (2004). Toward a scientific inquiry into superstitious business decision-making. Organization Studies,
25(6), 923-945. https://doi.org/10.1177/0170840604042405
USA Today. (2007). Some hotels don’t skip the 13th
floor anymore. August 3, 2007.
Vargha, A., & Delaney, H. (1998). Kruskal-Wallis test and stochastic homogeneity. Journal of Educational and
Behavioral Statistics, 23(2), 170-192. https://doi.org/10.3102/10769986023002170
Zhang, Y., Risen, J., & Hosey C. (2014). Reversing one‟s fortune by pushing away bad luck. Journal of
Experimental Psychology, 143(3), 1171-1184. https://doi.org/10.1037/a0034023
Appendix
Table A1. Component of the following indexes included in the analysis: CAC40, DAX, DJIA, FTSE 30, FTSE
MIBTEL and SENSEX
CAC40
Date of first
quotation DAX
Date of first
quotation DJIA
Date of first
quotation FTSE30
Date of first
quotation
FTSE
MIBTEL
Date of first
quotation SENSEX
Date of first
quotation
Accor 1985-01-07 Adidas 1995-11-17 3M 1970-01-02 3I 1998-07-27 A2A 1998-07-22 Asian Paints 1998-12-04
Air Liquide 1985-01-07 Alianz 1991-04-05
American
Express 1972-01-07
Associated British
Food 1998-07-28 Ansalo 2006-03-29 Bajaj Auto 2008-05-26
Airbus 1999-06-04 BASF 1991-04-05 Apple 1984-09-07 BAE System 1998-07-28 Atlanta 1998-10-16 Bharat Heavy 1993-07-19
Arcelormittal 1997-08-08 Bay Motoren 1991-04-05 Boeing 1970-01-02 BP 1998-07-28 Autogrill 1997-08-01 Bharti Airtel 2002-02-18
AXA 1985-01-07 Bayer 1991-04-05 Caterpillar 1970-01-02
British American
Tobacco 1998-07-17 Ayzmut 2004-07-07 Cipla 1993-07-13
BNP Paribas 1993-10-18 Beiersdorf 2000-01-03 Chevron 1970-01-02 BT Group 1998-07-27 Banca Monte 1999-06-25 Coal India 2010-11-04
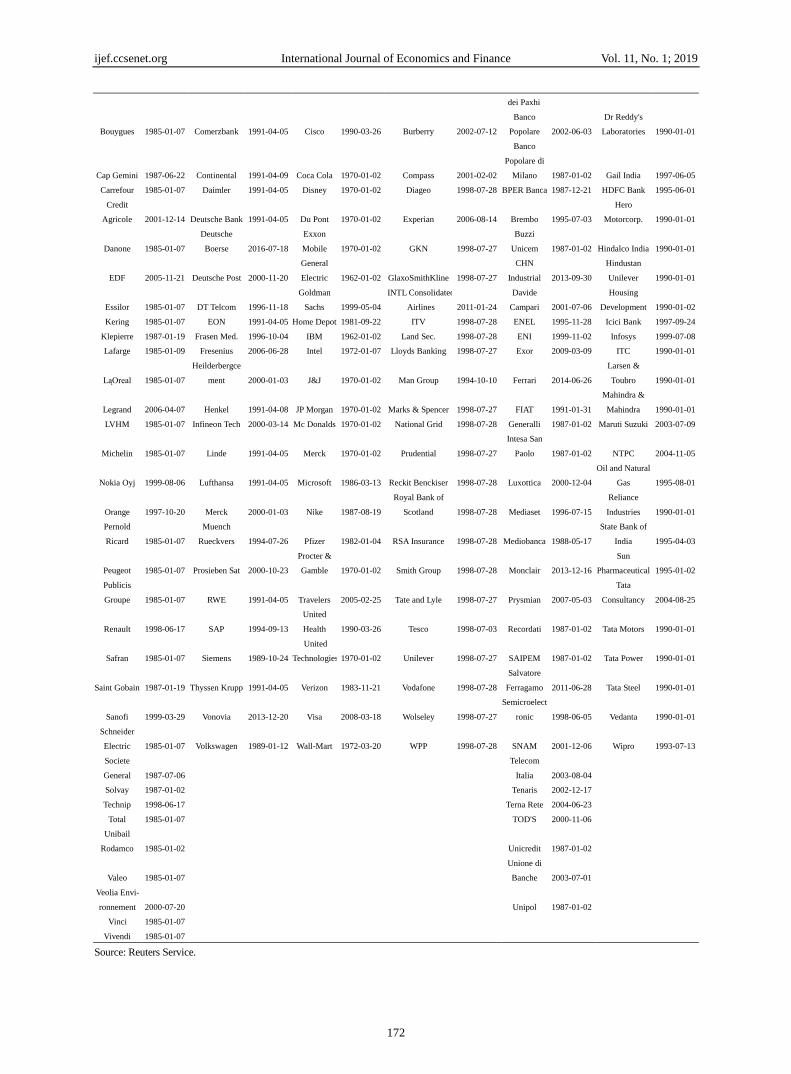
ijef.ccsenet.org International Journal of Economics and Finance Vol. 11, No. 1; 2019
172
dei Paxhi
Bouygues 1985-01-07 Comerzbank 1991-04-05 Cisco 1990-03-26 Burberry 2002-07-12
Banco
Popolare 2002-06-03
Dr Reddy's
Laboratories 1990-01-01
Cap Gemini 1987-06-22 Continental 1991-04-09 Coca Cola 1970-01-02 Compass 2001-02-02
Banco
Popolare di
Milano 1987-01-02 Gail India 1997-06-05
Carrefour 1985-01-07 Daimler 1991-04-05 Disney 1970-01-02 Diageo 1998-07-28 BPER Banca 1987-12-21 HDFC Bank 1995-06-01
Credit
Agricole 2001-12-14 Deutsche Bank 1991-04-05 Du Pont 1970-01-02 Experian 2006-08-14 Brembo 1995-07-03
Hero
Motorcorp. 1990-01-01
Danone 1985-01-07
Deutsche
Boerse 2016-07-18
Exxon
Mobile 1970-01-02 GKN 1998-07-27
Buzzi
Unicem 1987-01-02 Hindalco India 1990-01-01
EDF 2005-11-21 Deutsche Post 2000-11-20
General
Electric 1962-01-02 GlaxoSmithKline 1998-07-27
CHN
Industrial 2013-09-30
Hindustan
Unilever 1990-01-01
Essilor 1985-01-07 DT Telcom 1996-11-18
Goldman
Sachs 1999-05-04
INTL Consolidated
Airlines 2011-01-24
Davide
Campari 2001-07-06
Housing
Development 1990-01-02
Kering 1985-01-07 EON 1991-04-05 Home Depot 1981-09-22 ITV 1998-07-28 ENEL 1995-11-28 Icici Bank 1997-09-24
Klepierre 1987-01-19 Frasen Med. 1996-10-04 IBM 1962-01-02 Land Sec. 1998-07-28 ENI 1999-11-02 Infosys 1999-07-08
Lafarge 1985-01-09 Fresenius 2006-06-28 Intel 1972-01-07 Lloyds Banking 1998-07-27 Exor 2009-03-09 ITC 1990-01-01
LąOreal 1985-01-07
Heilderbergce
ment 2000-01-03 J&J 1970-01-02 Man Group 1994-10-10 Ferrari 2014-06-26
Larsen &
Toubro 1990-01-01
Legrand 2006-04-07 Henkel 1991-04-08 JP Morgan 1970-01-02 Marks & Spencer 1998-07-27 FIAT 1991-01-31
Mahindra &
Mahindra 1990-01-01
LVHM 1985-01-07 Infineon Tech 2000-03-14 Mc Donalds 1970-01-02 National Grid 1998-07-28 Generalli 1987-01-02 Maruti Suzuki 2003-07-09
Michelin 1985-01-07 Linde 1991-04-05 Merck 1970-01-02 Prudential 1998-07-27
Intesa San
Paolo 1987-01-02 NTPC 2004-11-05
Nokia Oyj 1999-08-06 Lufthansa 1991-04-05 Microsoft 1986-03-13 Reckit Benckiser 1998-07-28 Luxottica 2000-12-04
Oil and Natural
Gas 1995-08-01
Orange 1997-10-20 Merck 2000-01-03 Nike 1987-08-19
Royal Bank of
Scotland 1998-07-28 Mediaset 1996-07-15
Reliance
Industries 1990-01-01
Pernold
Ricard 1985-01-07
Muench
Rueckvers 1994-07-26 Pfizer 1982-01-04 RSA Insurance 1998-07-28 Mediobanca 1988-05-17
State Bank of
India 1995-04-03
Peugeot 1985-01-07 Prosieben Sat 2000-10-23
Procter &
Gamble 1970-01-02 Smith Group 1998-07-28 Monclair 2013-12-16
Sun
Pharmaceutical 1995-01-02
Publicis
Groupe 1985-01-07 RWE 1991-04-05 Travelers 2005-02-25 Tate and Lyle 1998-07-27 Prysmian 2007-05-03
Tata
Consultancy 2004-08-25
Renault 1998-06-17 SAP 1994-09-13
United
Health 1990-03-26 Tesco 1998-07-03 Recordati 1987-01-02 Tata Motors 1990-01-01
Safran 1985-01-07 Siemens 1989-10-24
United
Technologies 1970-01-02 Unilever 1998-07-27 SAIPEM 1987-01-02 Tata Power 1990-01-01
Saint Gobain 1987-01-19 Thyssen Krupp 1991-04-05 Verizon 1983-11-21 Vodafone 1998-07-28
Salvatore
Ferragamo 2011-06-28 Tata Steel 1990-01-01
Sanofi 1999-03-29 Vonovia 2013-12-20 Visa 2008-03-18 Wolseley 1998-07-27
Semicroelect
ronic 1998-06-05 Vedanta 1990-01-01
Schneider
Electric 1985-01-07 Volkswagen 1989-01-12 Wall-Mart 1972-03-20 WPP 1998-07-28 SNAM 2001-12-06 Wipro 1993-07-13
Societe
General 1987-07-06
Telecom
Italia 2003-08-04
Solvay 1987-01-02 Tenaris 2002-12-17
Technip 1998-06-17 Terna Rete 2004-06-23
Total 1985-01-07 TOD'S 2000-11-06
Unibail
Rodamco 1985-01-02 Unicredit 1987-01-02
Valeo 1985-01-07
Unione di
Banche 2003-07-01
Veolia Envi-
ronnement 2000-07-20 Unipol 1987-01-02
Vinci 1985-01-07
Vivendi 1985-01-07
Source: Reuters Service.

ijef.ccsenet.org International Journal of Economics and Finance Vol. 11, No. 1; 2019
173
Table A2. Components of the Nikkei 225 index included in the analysis and their first date of quotation
Company Date Company Date Company Date Company Date Company Date Company Date
Advantest 1984-01-04 Fuji Electric 1984-01-04 Kuraray 1984-01-04 Nippon Soda 1984-01-04 Shizuoka Bank 1984-01-04 Tokyo Gas 1984-01-04
AEON 1984-01-04 Fuji Film 1984-01-04 Kyocera 1984-01-04 Nippon Suisan 1984-01-04 Showa Denko 1984-01-04 Tokyo Marine 2002-04-01
Ajinomoto 1984-01-04 Fuji Heavy Ind 1984-01-04 Kyowa 1984-01-04 Nippon Yusen 1984-01-04 Showa Shell 1984-01-04 Tokyo Ord 1984-05-08
Alps Electr 1984-01-04 Fujikura 1984-01-04 Marubem 1984-01-04 Nissan 1984-01-04 Sky Perfect 2007-04-02 Tokyo Tatemono 1984-01-04
Amada 1984-01-04 Fujitsu 1984-01-04 Maruha Nichiro 2014-04-01
Nissen
Chemical 1984-01-04 SMFG 2002-12-02 Toppan Printing 1984-01-04
Ana Holdings 1984-01-04 Fukuoka Fin 2007-04-02 Marui Group 1984-01-04 Nisshin Steel 2012-10-01 Softbank 1994-07-22 Toray Inds 1984-01-04
Aozora Bank 2006-11-14 Furukawa Elec 1984-01-04 Matsui Sec. 2001-08-01 Nisshinbo 1984-01-04 Soijtz 2003-04-01 Toshiba 1984-01-04
Asahi Glass 1984-01-04 GS Yuasa 2004-04-01 Mazda 1984-01-04 Nitto Denko 1984-01-04 Sompo Holdings 2010-04-01 Tosoh 1984-01-04
Asahi Kasei 1984-01-04 Heiwa R 1984-01-04 Meidensha 1984-01-04 Nittobo 1984-01-04 Sony 1984-01-04 Toto 1984-01-04
Ashi Group 1984-01-04 Hino 1984-01-04 Meiji Holdings 2009-04-01
Nomura
Holdings 1984-01-04 Sony Dinancial 2007-10-11 Toyo Seikan 1984-01-04
Astellas
Pharmas 1984-01-04 Hitachi 1984-01-04 Minebe Mitsumi 1984-01-04 NPSTL 1984-01-04 Sumco 2005-11-17 Toyobo 1984-01-04
Bridgestone 1984-01-04 Hitachi Const 1984-01-04 Mitsub Chem 2005-10-03 NSK 1984-01-04 Sumitomo 1984-01-04 Toyota 1984-01-04
Canon 1984-01-04 Hitachi Zosen 1984-01-04 Mitsub Logistic 1984-01-04 NTN 1984-01-04 Sumitomo Chem 1984-01-04 Toyota Tsusho 1984-01-04
Casio Computer 1984-01-04 Hokuetsu Kishu 1984-01-04 Mitsub UFJ 2001-04-02 NTT 1987-02-10 Sumitomo Elec 1984-01-04 Trend Micro 1998-08-18
Central Japan 1997-10-08 Honda 1984-01-04 Mitsubishi 1984-01-04 NTT Data 1995-04-26
Sumitomo
Heavy 1984-01-04 Ube Ind. 1984-01-04
Chiba Bank 1984-01-05 IHI 1984-01-04 Mitsubishi Elec 1984-01-04 NTT Docomo 1998-10-22 Sumitomo M&M 1984-01-04 Unitika 1984-01-04
Chiyoda 1984-01-04 Inpex 2006-04-03 Mitsubishi Est 1984-01-04 Obayashi 1984-01-04
Sumitomo
Mitsui 2002-01-31 West Japan 1996-10-08
Chubu Ele 1984-01-04 Isuzu 1984-01-04 Mitsubishi Heavy 1984-01-04 Odakyu Elec 1984-01-04 Sumitomo Osaka 1984-01-04 Yahoo Japan 1997-11-04
Chugai Pharm 1984-01-04 Itochu 1984-01-04 Mitsubishi Matls 1984-01-04 OJI Holdings 1984-01-04
Sumitomo
Realty 1984-01-04 Yamaha 1984-01-04
Citizen Watch 1984-01-04
J. Front
Retailing 2007-09-03 Mitsubishi Motor 1988-12-05 Oki Elec 1984-01-04 Suzuki 1984-01-05
Yamato
Holdings 1984-01-04
Cobe Steel 1984-01-04 Japan Steel 1984-01-04 Mitsui 1984-01-04 Okuma 1984-01-04 T&D Holdings 2004-04-01 Yaskawa 1984-01-04
Comsys 2003-09-29 Japan Tabacco 1994-10-27 Mitsui Eng 1984-01-04 Olympus 1984-01-04 Taiheyo Cement 1984-01-04 Yokogawa 1984-01-04
Credit Saison 1984-01-04 JFE Holdings 2002-09-26 Mitsui Fudosan 1984-01-04 Osaka Gas 1984-01-04 Taisei 1984-01-04
Yokohama
Rubber 1984-01-04
Da Nip 1984-01-04 JGC 1984-01-04
Mitsui
Min&Smelt 1984-01-04 Pacific metals 1984-01-04 Taiyo Yuden 1984-01-04
Dai Ichi Life 2010-04-01 JTEKT 1984-01-04 Mitsui Ord 1984-01-04 Panasonic 1984-01-04 Takara 1984-01-04
Daichi Sankuyo 2005-09-28 JX Holdings 2010-04-01 Mitsui Osk Lines 1984-01-04 Pioneer 1984-01-04 Takashimaya 1984-01-04
Daikin Ind 1984-01-04 Kaima 1984-01-04 Mitsumi Electr 1984-01-04
Resona
Holdings 2001-12-11 Takeda 1984-01-04
Dainpn Sumi 1984-01-04 Kansai Elec 1984-01-04 Mizuho Financial 2003-03-12 Ricoh 1984-01-04 TDK 1984-01-04
Daiwa House 1984-01-04 Kao 1984-01-04 Mnisshin 1984-01-04
Sapporo
Holdings 1984-01-04 Teijin 1984-01-04
Daiwa
Securities 1984-01-04
Kawasaki
Heavy 1984-01-04
MS&AD
Insurance 2008-04-01
Screen
Holdings 1984-01-04 Terumo 1984-01-04
Denka 1984-01-04
Kawasaki
Kisen 1984-01-04 NEC 1984-01-04 Secom 1984-01-04 TGK Insulators 1984-01-04
Denso 1984-01-04 KDDI 1993-09-03 NH Foods 1984-01-04 Sekisui 1984-01-04 Tobu RW 1984-05-08
Dentsu 2001-11-30 Keio Ord 1984-01-04 Nichirei 1984-01-04 Setan Mitsuko 2008-04-01 Toho SVC 1984-01-04
Dowa Holdings 1984-01-04 Keisei Electic 1984-01-04 Nikkon 1984-01-04 Seven & I 2005-09-01 Toho Zinc 1984-01-04
Durukawa 1984-01-04 Kikkoman 1984-01-04
Nippon Elec
Glass 1984-01-04 Sharp 1984-01-04 Tokai Carbon 1984-01-04
East Japan 1993-10-26 Kirin 1984-01-04 Nippon Express 1984-01-04 Shimizu 1984-01-04 Tokuyama 1984-01-04
Ebara 1984-01-04 Komatsu 1984-01-04 Nippon Kayaku 1984-01-04 Shin Etsu 1984-01-04 Tokyo Dome 1984-01-04
Eisai 1984-01-04 Konami 1988-02-19
Nippon Light
Metal 2012-10-01 Shinsei Bank 2004-02-19 Tokyo Ele PWR 1984-01-04
Fanuc 1984-01-04 Konica Minolta 1984-01-04 Nippon Paper 2013-04-01 Shinseido 1984-01-04 Tokyo Electron 1984-01-04
Fast Retailing 1997-04-02 Kubota 1984-01-04
Nippon Sheet
GLS 1984-01-04 Shiongoi 1984-01-04 Tokyo Fudosan 2013-10-01
Source: Reuters Service.
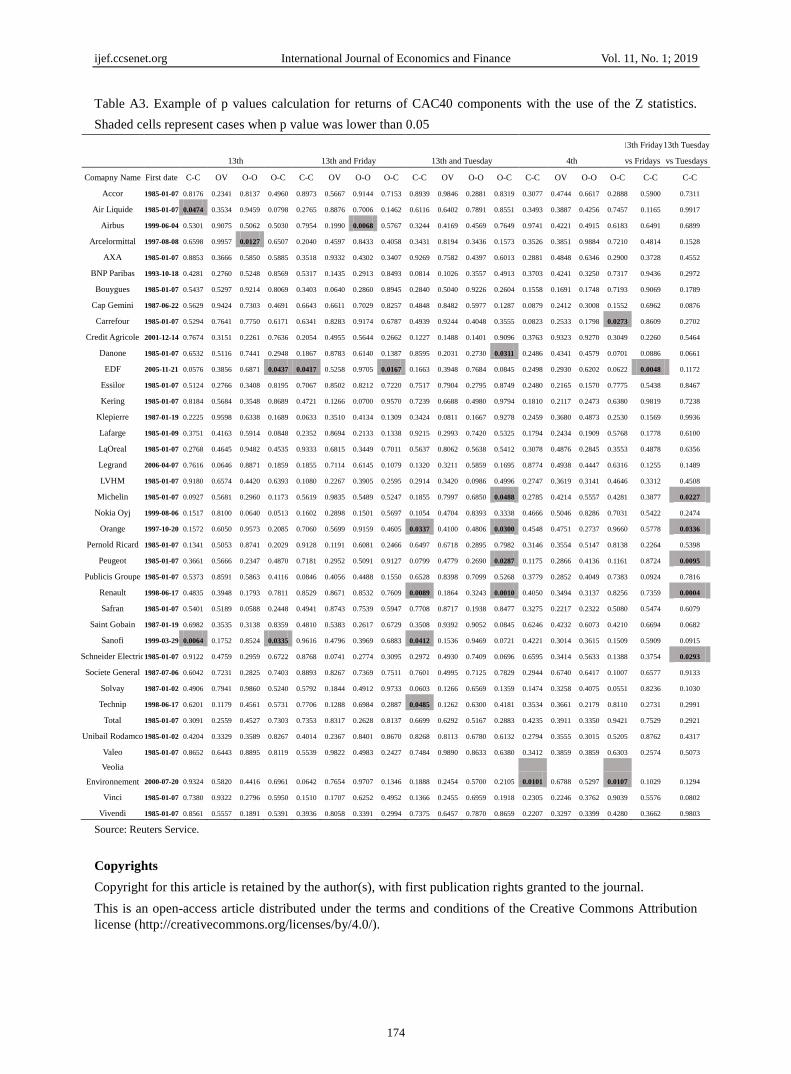
ijef.ccsenet.org International Journal of Economics and Finance Vol. 11, No. 1; 2019
174
Table A3. Example of p values calculation for returns of CAC40 components with the use of the Z statistics.
Shaded cells represent cases when p value was lower than 0.05
13th 13th and Friday 13th and Tuesday 4th
13th Friday
vs Fridays
13th Tuesday
vs Tuesdays
Comapny Name First date C-C OV O-O O-C C-C OV O-O O-C C-C OV O-O O-C C-C OV O-O O-C C-C C-C
Accor 1985-01-07 0.8176 0.2341 0.8137 0.4960 0.8973 0.5667 0.9144 0.7153 0.8939 0.9846 0.2881 0.8319 0.3077 0.4744 0.6617 0.2888 0.5900 0.7311
Air Liquide 1985-01-07 0.0474 0.3534 0.9459 0.0798 0.2765 0.8876 0.7006 0.1462 0.6116 0.6402 0.7891 0.8551 0.3493 0.3887 0.4256 0.7457 0.1165 0.9917
Airbus 1999-06-04 0.5301 0.9075 0.5062 0.5030 0.7954 0.1990 0.0068 0.5767 0.3244 0.4169 0.4569 0.7649 0.9741 0.4221 0.4915 0.6183 0.6491 0.6899
Arcelormittal 1997-08-08 0.6598 0.9957 0.0127 0.6507 0.2040 0.4597 0.8433 0.4058 0.3431 0.8194 0.3436 0.1573 0.3526 0.3851 0.9884 0.7210 0.4814 0.1528
AXA 1985-01-07 0.8853 0.3666 0.5850 0.5885 0.3518 0.9332 0.4302 0.3407 0.9269 0.7582 0.4397 0.6013 0.2881 0.4848 0.6346 0.2900 0.3728 0.4552
BNP Paribas 1993-10-18 0.4281 0.2760 0.5248 0.8569 0.5317 0.1435 0.2913 0.8493 0.0814 0.1026 0.3557 0.4913 0.3703 0.4241 0.3250 0.7317 0.9436 0.2972
Bouygues 1985-01-07 0.5437 0.5297 0.9214 0.8069 0.3403 0.0640 0.2860 0.8945 0.2840 0.5040 0.9226 0.2604 0.1558 0.1691 0.1748 0.7193 0.9069 0.1789
Cap Gemini 1987-06-22 0.5629 0.9424 0.7303 0.4691 0.6643 0.6611 0.7029 0.8257 0.4848 0.8482 0.5977 0.1287 0.0879 0.2412 0.3008 0.1552 0.6962 0.0876
Carrefour 1985-01-07 0.5294 0.7641 0.7750 0.6171 0.6341 0.8283 0.9174 0.6787 0.4939 0.9244 0.4048 0.3555 0.0823 0.2533 0.1798 0.0273 0.8609 0.2702
Credit Agricole 2001-12-14 0.7674 0.3151 0.2261 0.7636 0.2054 0.4955 0.5644 0.2662 0.1227 0.1488 0.1401 0.9096 0.3763 0.9323 0.9270 0.3049 0.2260 0.5464
Danone 1985-01-07 0.6532 0.5116 0.7441 0.2948 0.1867 0.8783 0.6140 0.1387 0.8595 0.2031 0.2730 0.0311 0.2486 0.4341 0.4579 0.0701 0.0886 0.0661
EDF 2005-11-21 0.0576 0.3856 0.6871 0.0437 0.0417 0.5258 0.9705 0.0167 0.1663 0.3948 0.7684 0.0845 0.2498 0.2930 0.6202 0.0622 0.0048 0.1172
Essilor 1985-01-07 0.5124 0.2766 0.3408 0.8195 0.7067 0.8502 0.8212 0.7220 0.7517 0.7904 0.2795 0.8749 0.2480 0.2165 0.1570 0.7775 0.5438 0.8467
Kering 1985-01-07 0.8184 0.5684 0.3548 0.8689 0.4721 0.1266 0.0700 0.9570 0.7239 0.6688 0.4980 0.9794 0.1810 0.2117 0.2473 0.6380 0.9819 0.7238
Klepierre 1987-01-19 0.2225 0.9598 0.6338 0.1689 0.0633 0.3510 0.4134 0.1309 0.3424 0.0811 0.1667 0.9278 0.2459 0.3680 0.4873 0.2530 0.1569 0.9936
Lafarge 1985-01-09 0.3751 0.4163 0.5914 0.0848 0.2352 0.8694 0.2133 0.1338 0.9215 0.2993 0.7420 0.5325 0.1794 0.2434 0.1909 0.5768 0.1778 0.6100
LąOreal 1985-01-07 0.2768 0.4645 0.9482 0.4535 0.9333 0.6815 0.3449 0.7011 0.5637 0.8062 0.5638 0.5412 0.3078 0.4876 0.2845 0.3553 0.4878 0.6356
Legrand 2006-04-07 0.7616 0.0646 0.8871 0.1859 0.1855 0.7114 0.6145 0.1079 0.1320 0.3211 0.5859 0.1695 0.8774 0.4938 0.4447 0.6316 0.1255 0.1489
LVHM 1985-01-07 0.9180 0.6574 0.4420 0.6393 0.1080 0.2267 0.3905 0.2595 0.2914 0.3420 0.0986 0.4996 0.2747 0.3619 0.3141 0.4646 0.3312 0.4508
Michelin 1985-01-07 0.0927 0.5681 0.2960 0.1173 0.5619 0.9835 0.5489 0.5247 0.1855 0.7997 0.6850 0.0488 0.2785 0.4214 0.5557 0.4281 0.3877 0.0227
Nokia Oyj 1999-08-06 0.1517 0.8100 0.0640 0.0513 0.1602 0.2898 0.1501 0.5697 0.1054 0.4704 0.8393 0.3338 0.4666 0.5046 0.8286 0.7031 0.5422 0.2474
Orange 1997-10-20 0.1572 0.6050 0.9573 0.2085 0.7060 0.5699 0.9159 0.4605 0.0337 0.4100 0.4806 0.0300 0.4548 0.4751 0.2737 0.9660 0.5778 0.0336
Pernold Ricard 1985-01-07 0.1341 0.5053 0.8741 0.2029 0.9128 0.1191 0.6081 0.2466 0.6497 0.6718 0.2895 0.7982 0.3146 0.3554 0.5147 0.8138 0.2264 0.5398
Peugeot 1985-01-07 0.3661 0.5666 0.2347 0.4870 0.7181 0.2952 0.5091 0.9127 0.0799 0.4779 0.2690 0.0287 0.1175 0.2866 0.4136 0.1161 0.8724 0.0095
Publicis Groupe 1985-01-07 0.5373 0.8591 0.5863 0.4116 0.0846 0.4056 0.4488 0.1550 0.6528 0.8398 0.7099 0.5268 0.3779 0.2852 0.4049 0.7383 0.0924 0.7816
Renault 1998-06-17 0.4835 0.3948 0.1793 0.7811 0.8529 0.8671 0.8532 0.7609 0.0089 0.1864 0.3243 0.0010 0.4050 0.3494 0.3137 0.8256 0.7359 0.0004
Safran 1985-01-07 0.5401 0.5189 0.0588 0.2448 0.4941 0.8743 0.7539 0.5947 0.7708 0.8717 0.1938 0.8477 0.3275 0.2217 0.2322 0.5080 0.5474 0.6079
Saint Gobain 1987-01-19 0.6982 0.3535 0.3138 0.8359 0.4810 0.5383 0.2617 0.6729 0.3508 0.9392 0.9052 0.0845 0.6246 0.4232 0.6073 0.4210 0.6694 0.0682
Sanofi 1999-03-29 0.0064 0.1752 0.8524 0.0335 0.9616 0.4796 0.3969 0.6883 0.0412 0.1536 0.9469 0.0721 0.4221 0.3014 0.3615 0.1509 0.5909 0.0915
Schneider Electric 1985-01-07 0.9122 0.4759 0.2959 0.6722 0.8768 0.0741 0.2774 0.3095 0.2972 0.4930 0.7409 0.0696 0.6595 0.3414 0.5633 0.1388 0.3754 0.0293
Societe General 1987-07-06 0.6042 0.7231 0.2825 0.7403 0.8893 0.8267 0.7369 0.7511 0.7601 0.4995 0.7125 0.7829 0.2944 0.6740 0.6417 0.1007 0.6577 0.9133
Solvay 1987-01-02 0.4906 0.7941 0.9860 0.5240 0.5792 0.1844 0.4912 0.9733 0.0603 0.1266 0.6569 0.1359 0.1474 0.3258 0.4075 0.0551 0.8236 0.1030
Technip 1998-06-17 0.6201 0.1179 0.4561 0.5731 0.7706 0.1288 0.6984 0.2887 0.0485 0.1262 0.6300 0.4181 0.3534 0.3661 0.2179 0.8110 0.2731 0.2991
Total 1985-01-07 0.3091 0.2559 0.4527 0.7303 0.7353 0.8317 0.2628 0.8137 0.6699 0.6292 0.5167 0.2883 0.4235 0.3911 0.3350 0.9421 0.7529 0.2921
Unibail Rodamco 1985-01-02 0.4204 0.3329 0.3589 0.8267 0.4014 0.2367 0.8401 0.8670 0.8268 0.8113 0.6780 0.6132 0.2794 0.3555 0.3015 0.5205 0.8762 0.4317
Valeo 1985-01-07 0.8652 0.6443 0.8895 0.8119 0.5539 0.9822 0.4983 0.2427 0.7484 0.9890 0.8633 0.6380 0.3412 0.3859 0.3859 0.6303 0.2574 0.5073
Veolia
Environnement 2000-07-20 0.9324 0.5820 0.4416 0.6961 0.0642 0.7654 0.9707 0.1346 0.1888 0.2454 0.5700 0.2105 0.0101 0.6788 0.5297 0.0107 0.1029 0.1294
Vinci 1985-01-07 0.7380 0.9322 0.2796 0.5950 0.1510 0.1707 0.6252 0.4952 0.1366 0.2455 0.6959 0.1918 0.2305 0.2246 0.3762 0.9039 0.5576 0.0802
Vivendi 1985-01-07 0.8561 0.5557 0.1891 0.5391 0.3936 0.8058 0.3391 0.2994 0.7375 0.6457 0.7870 0.8659 0.2207 0.3297 0.3399 0.4280 0.3662 0.9803
Source: Reuters Service.
Copyrights
Copyright for this article is retained by the author(s), with first publication rights granted to the journal.
This is an open-access article distributed under the terms and conditions of the Creative Commons Attribution
license (http://creativecommons.org/licenses/by/4.0/).
Top Related