


Languages
Pages
Legal

Findings and ProgressMilwaukee Mathematics Partnership
Sharing in Leadership for Student Success
DeAnn Huinker & Kevin McLeod, UWMBeth Schefelker, MPS18 April 2008
Milwaukee Mathematics Partnership
National Science Foundation (NSF) Math and Science Partnership (MSP) Program
◦ Comprehensive Projects (12)
◦ Targeted Projects (28)
◦ Institute Projects (12)
◦ Research, Evaluation, & Technical Assistance (25)
Cohort 2, Comprehensive K-12 Mathematics◦ $20 million over 5 years
◦ 2003–2008 (Currently in Year 5)
MSP Projects: Key Features Partnership-driven
Teacher quality, quantity, and diversity
Challenging courses and curricula
Evidence-based design and outcomes
Institutional change and sustainability

Distributed Leadership
Student Learning Continuum
Teacher Learning Continuum
Mathematics Framework

Learning Teams in each school established.
Comprehensive Math Framework (CMF) developed.
Math Teacher Leader (MTL) position begins, joins Learning Team.
Math Teaching Specialist position begins.
Significant increase math achievement fall 2005 to 2006.
Math gap between district and state narrows.
Community plan provides focus & accountability for the next five years.
MPS funds $5 million to expand MTL role.
NSF funds the MMP.
CMF disseminated.
MPS math learning targets developed.
MMP designs model classroom assessments.
Aligns targets to State Assessment Framework.
MMP focuses on formative assessment and descriptive feedback.
Revises math textbook adoption process.
Governor budgets $10 million for MPS math.
MPS budgets $3 million to sustain implementation of the MMP initiatives.
2002 2003 2004 2005 2006 2007 2008 2009
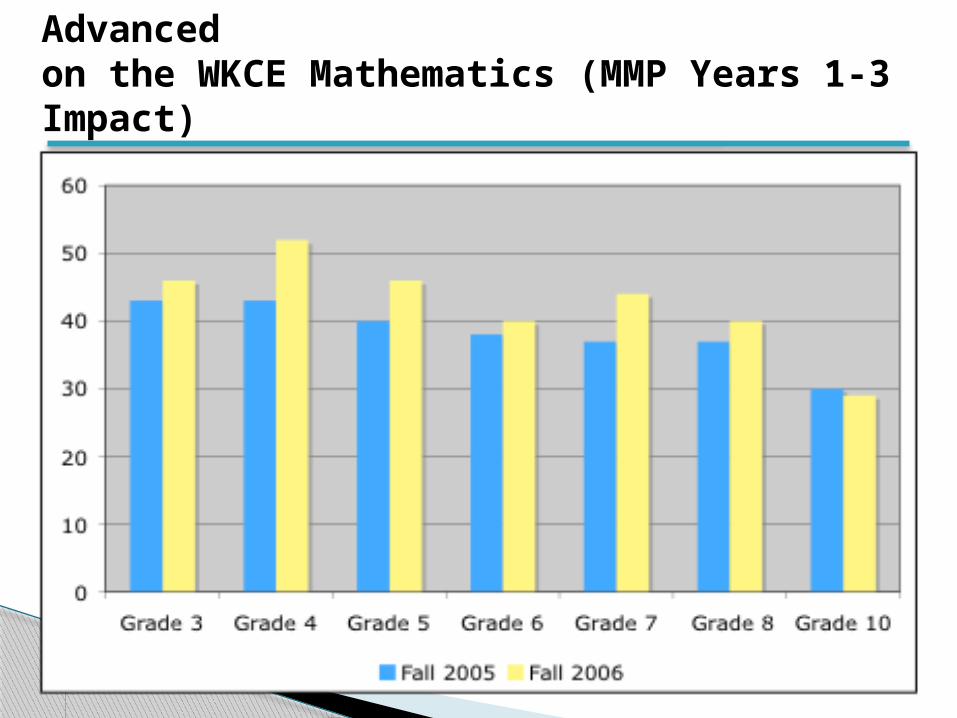
Percent of MPS Students Proficient or Advanced on the WKCE Mathematics (MMP Years 1-3 Impact)


What goes in the box?
5 + 7 = + 8
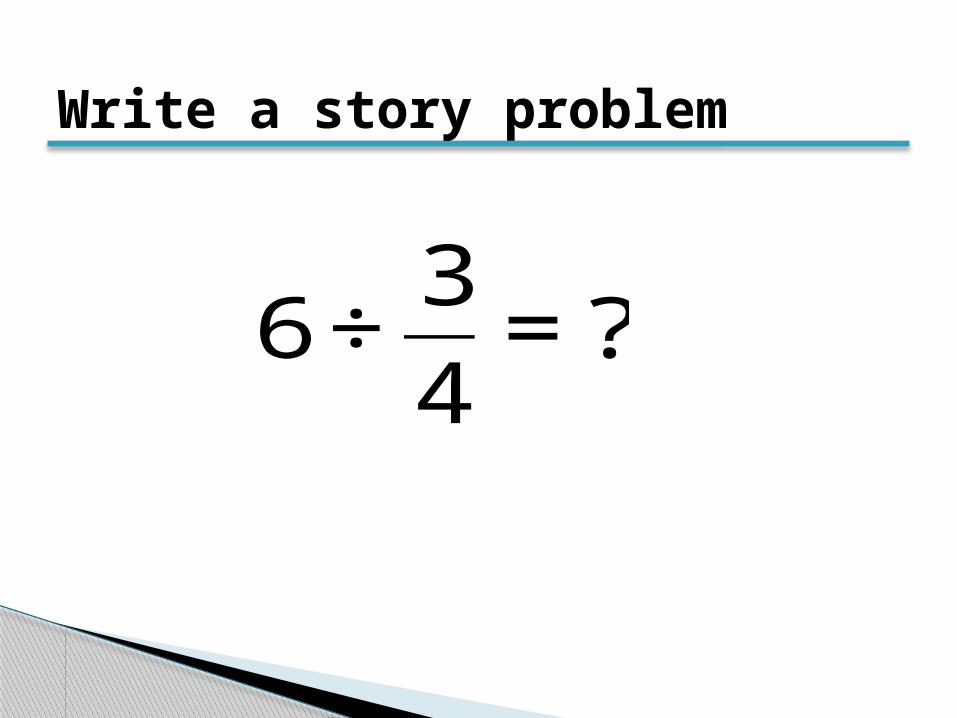
Write a story problem
€
6 ÷3
4= ?
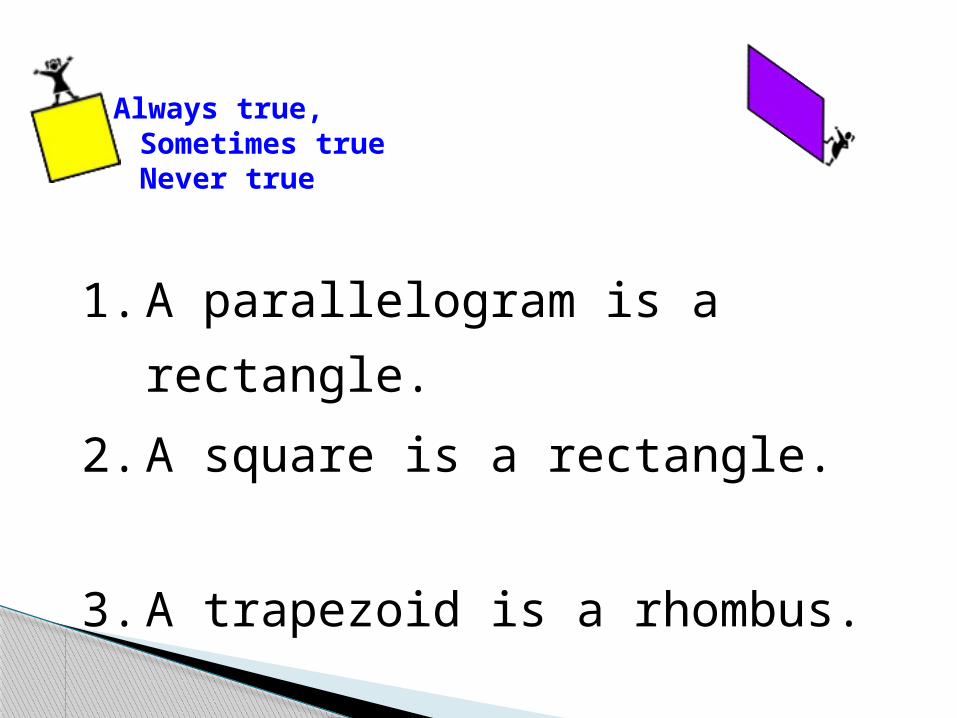
Always true,Sometimes true
Never true
1. A parallelogram is a
rectangle.
2. A square is a rectangle.
3. A trapezoid is a rhombus.

School-basedLearning Team
Other Key
Teachers
Principal
Literacy
Coach
Math Teache
r Leader
Math Teacher Leaders are “key” for focusing their Learning Teams and
schools on mathematics.

Learning Team
Other Key
Teachers
Principal
Literacy Coach
Math Teacher Leader
DistrictMathematics Leadership (MCS, MTS,
TIR)
IHE Faculty Mathematics
& Math
Education
Math Teacher Leader
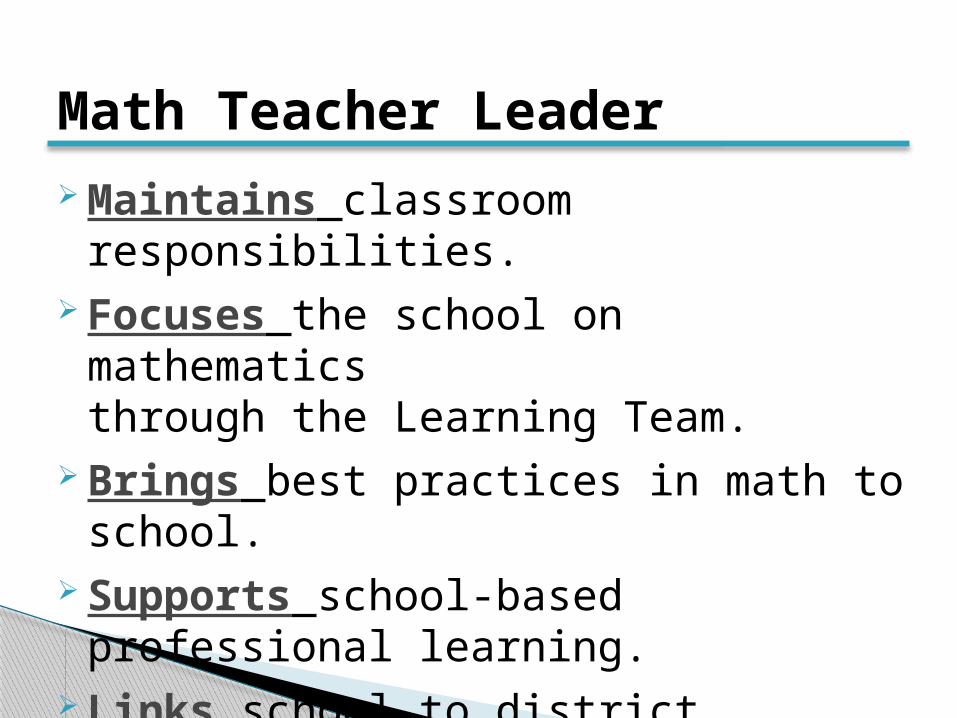
Maintains classroom responsibilities. Focuses the school on mathematics
through the Learning Team. Brings best practices in math to school. Supports school-based professional
learning. Links school to district leadership and
IHE expertise.

Math Teacher Leader Seminars
Monthly strands:
Mathematics content knowledge.
Leadership skills.
District alignment—math framework, learning targets, state standards and descriptors, common classroom assessments, descriptive feedback.
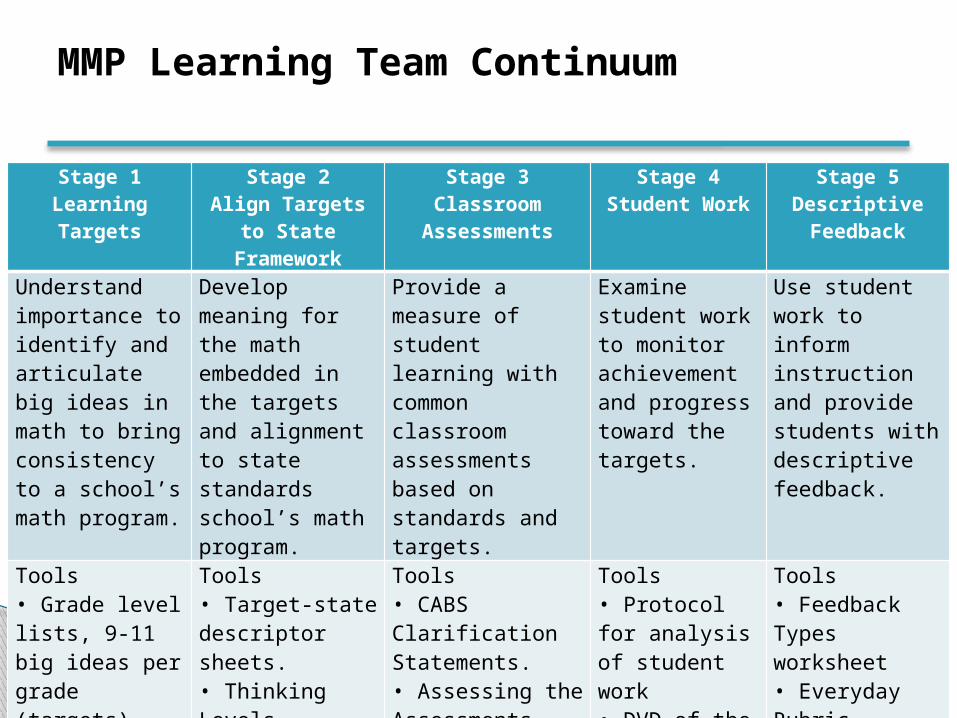
Stage 1Learning Targets
Stage 2Align Targets to State Framework
Stage 3Classroom
Assessments
Stage 4Student Work
Stage 5Descriptive Feedback
Understand importance to identify and articulate big ideas in math to bring consistency to a school’s math program.
Develop meaning for the math embedded in the targets and alignment to state standards school’s math program.
Provide a measure of student learning with common classroom assessments based on standards and targets.
Examine student work to monitor achievement and progress toward the targets.
Use student work to inform instruction and provide students with descriptive feedback.
Tools• Grade level lists, 9-11 big ideas per grade (targets).• Horizontal list of targets by content across grades.
Tools• Target-state descriptor sheets.• Thinking Levels Framework.
Tools• CABS Clarification Statements.• Assessing the Assessments Guide• Model CABS
Tools• Protocol for analysis of student work• DVD of the protocol in use
Tools• Feedback Types worksheet• Everyday Rubric• Student Feedback Summary sheets
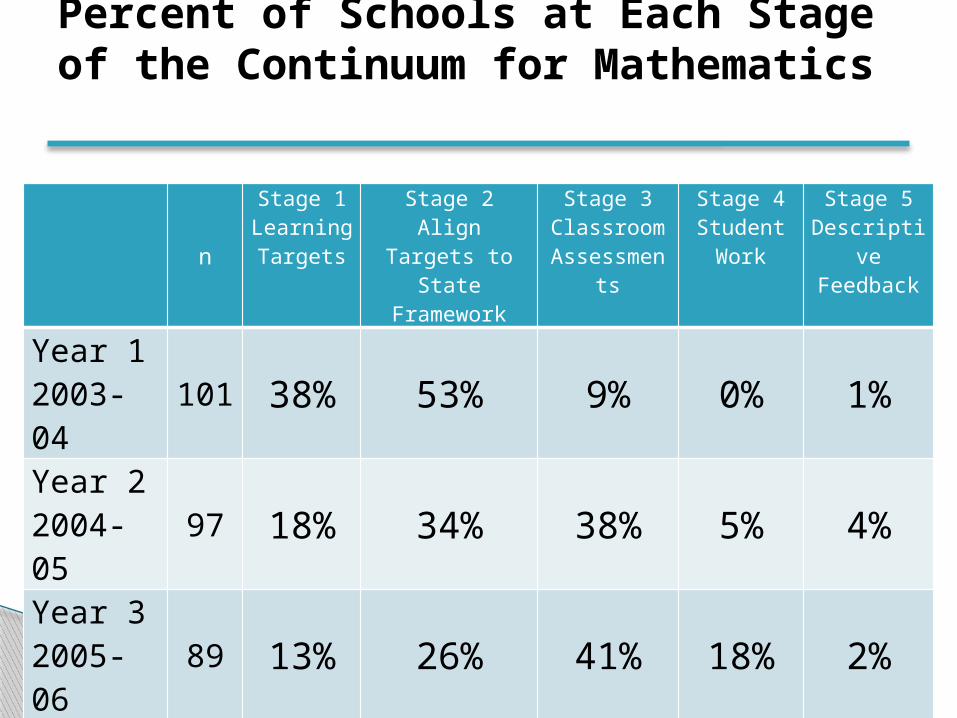
MMP Learning Team Continuum
n
Stage 1Learning Targets
Stage 2Align Targets to
State Framework
Stage 3Classroom
Assessments
Stage 4Student
Work
Stage 5Descriptive Feedback
Year 1 2003-04 101 38% 53% 9% 0% 1%
Year 2 2004-05 97 18% 34% 38% 5% 4%
Year 3 2005-06 89 13% 26% 41% 18% 2%
Year 4 2006-07 89 1% 9% 25% 43% 23%
Percent of Schools at Each Stage of the Continuum for Mathematics
17
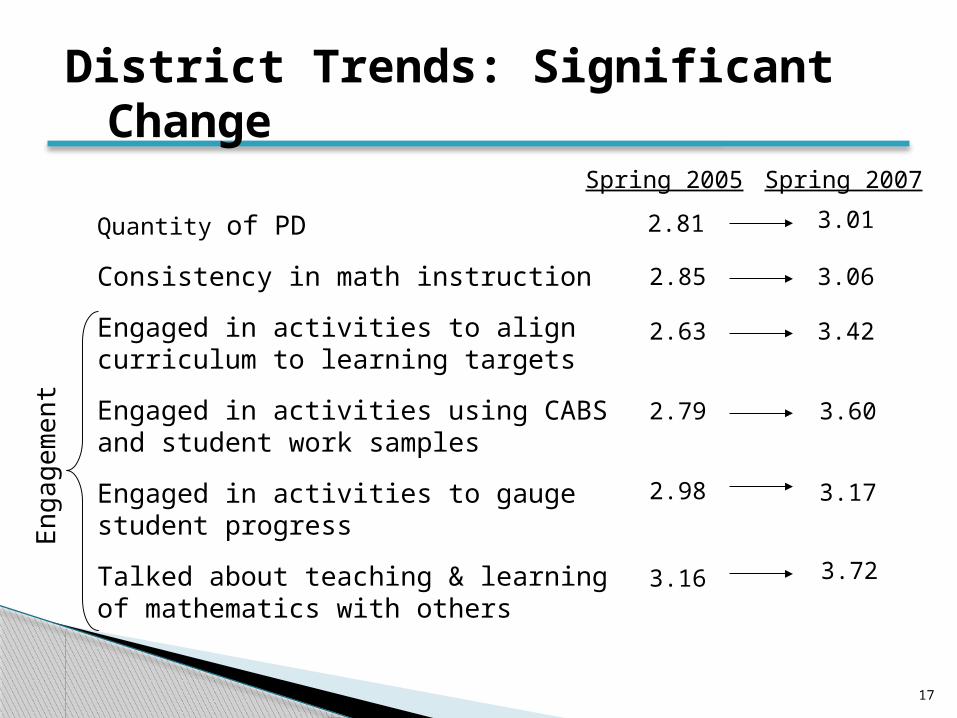
District Trends: Significant Change
Quantity of PD
Consistency in math instruction
Engaged in activities to align curriculum to learning targets
Engaged in activities using CABS and student work samples
Engaged in activities to gauge student progress
Talked about teaching & learning of mathematics with others
2.81 3.01
3.06
3.72
3.42
3.60
3.172.98
2.79
2.63
3.16
2.85
Spring 2005 Spring 2007
En
gag
em
en
t
18
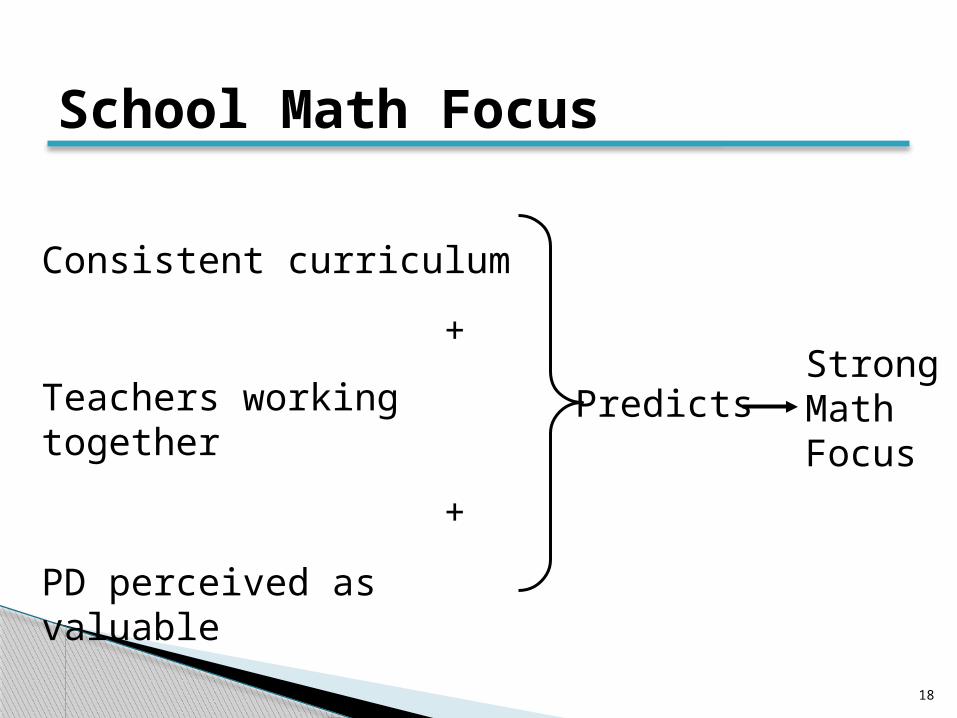
School Math Focus
Consistent curriculum
+
Teachers working together
+
PD perceived as valuable
PredictsStrongMathFocus
19
Student Achievement
Are student achievement gains in mathematics greater in schools that have more fully embraced MMP principles?

20
Analytical Approach: HLM
WKCE Student Achievement Data from 2005+
MMP Online Survey Results from 2006
to explain variability in
WKCE Student Achievement in 2006
(Thus, the impact of Year 3 MMP)
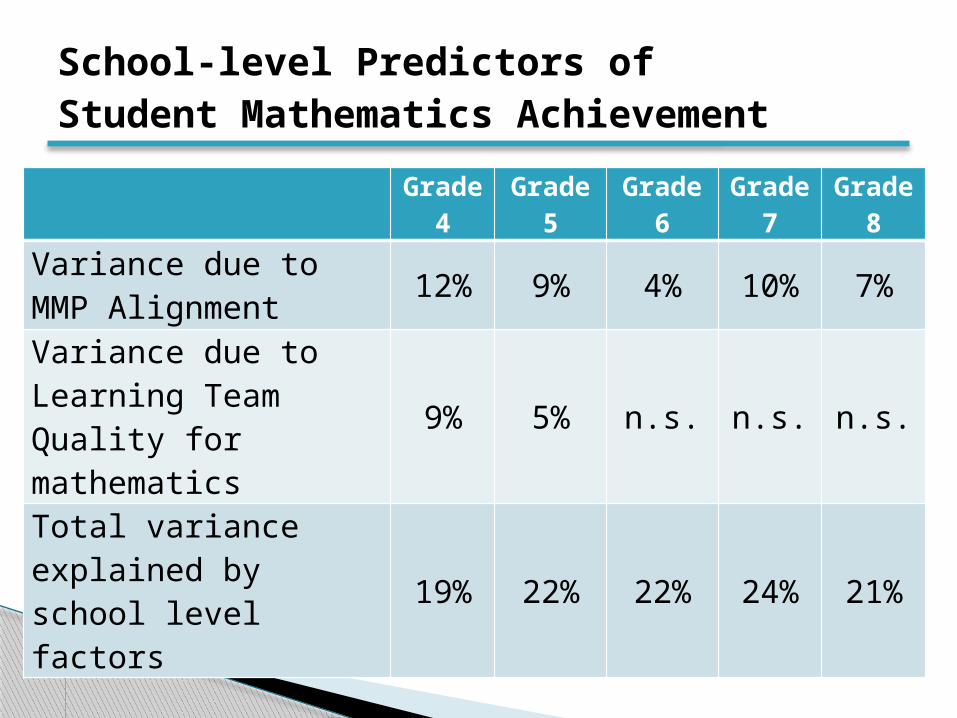
Grade 4
Grade 5
Grade 6
Grade 7
Grade 8
Variance due to MMP Alignment 12% 9% 4% 10% 7%
Variance due to Learning Team Quality for mathematics
9% 5% n.s. n.s. n.s.
Total variance explained by school level factors 19% 22% 22% 24% 21%
School-level Predictors of Student Mathematics Achievement
22
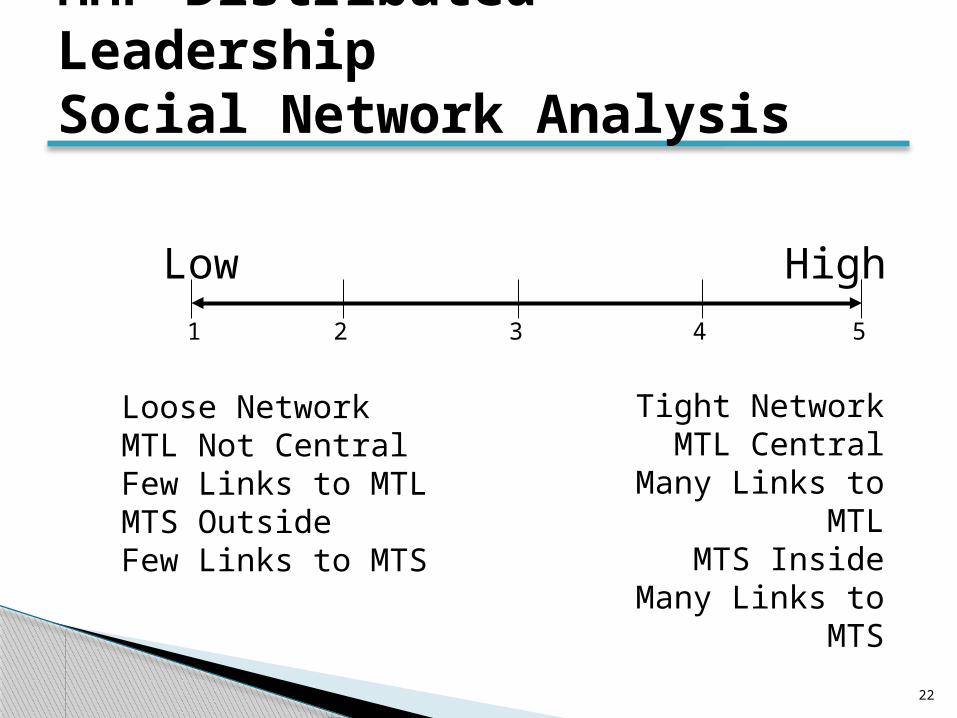
MMP Distributed LeadershipSocial Network Analysis
Low High
Loose NetworkMTL Not CentralFew Links to MTLMTS OutsideFew Links to MTS
Tight NetworkMTL Central
Many Links to MTL
MTS InsideMany Links to
MTS
1 2 3 4 5
23
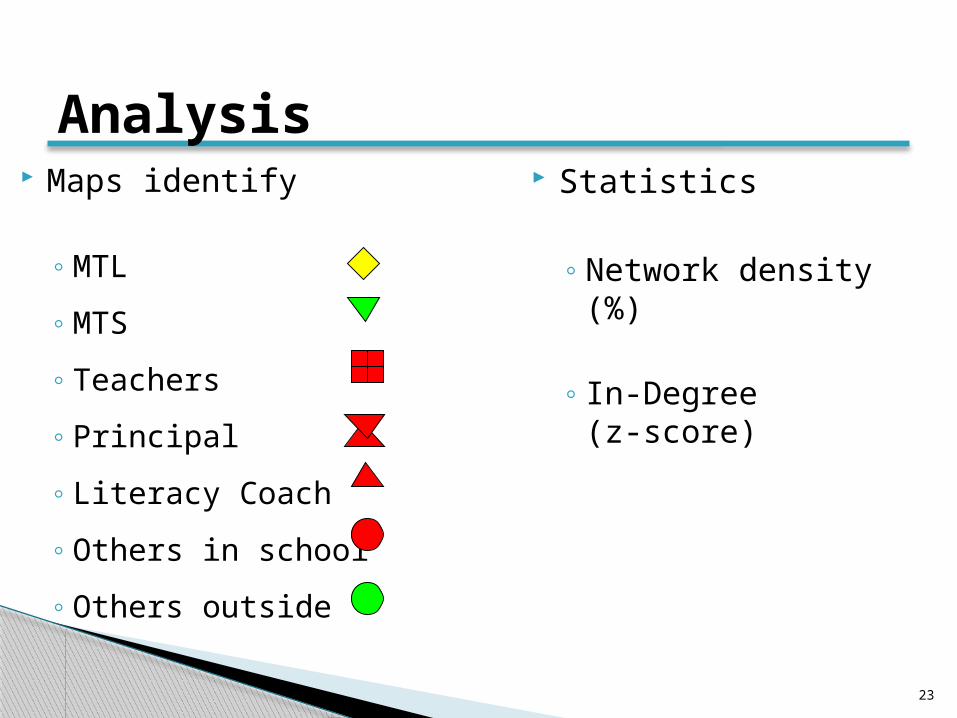
Analysis Maps identify
◦ MTL
◦ MTS
◦ Teachers
◦ Principal
◦ Literacy Coach
◦ Others in school
◦ Others outside
Statistics
◦ Network density (%)
◦ In-Degree(z-score)
24
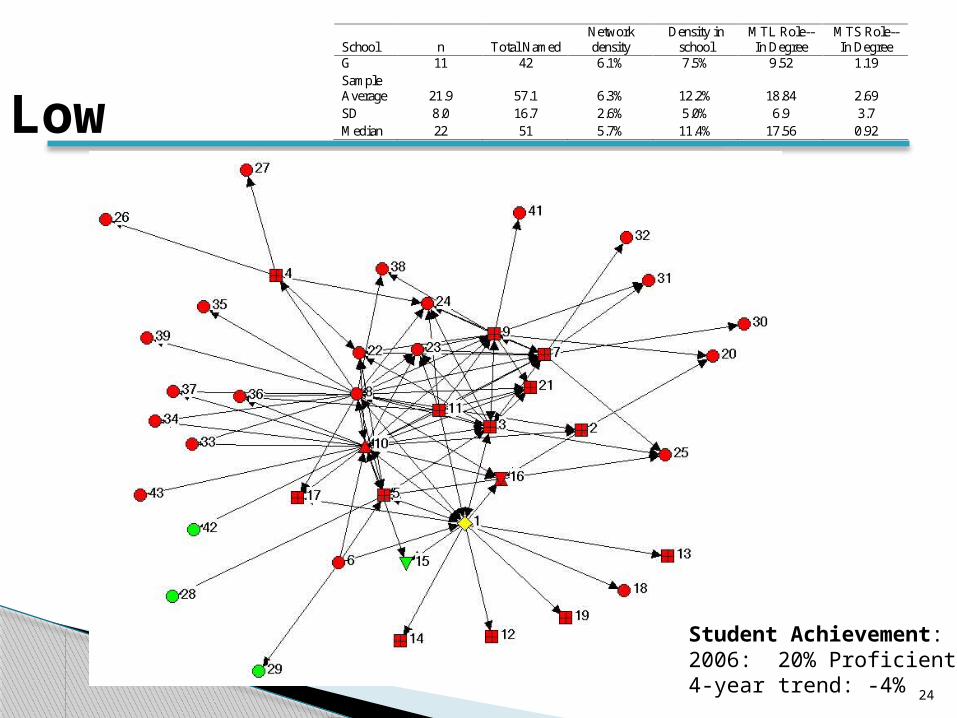
Low
School n Total Named Network density
Density in school
MTL Role--In Degree
MTS Role--In Degree
G 11 42 6.1% 7.5% 9.52 1.19 Sample Average 21.9 57.1 6.3% 12.2% 18.84 2.69 SD 8.0 16.7 2.6% 5.0% 6.9 3.7 Median 22 51 5.7% 11.4% 17.56 0.92
Student Achievement:2006: 20% Proficient4-year trend: -4%
25
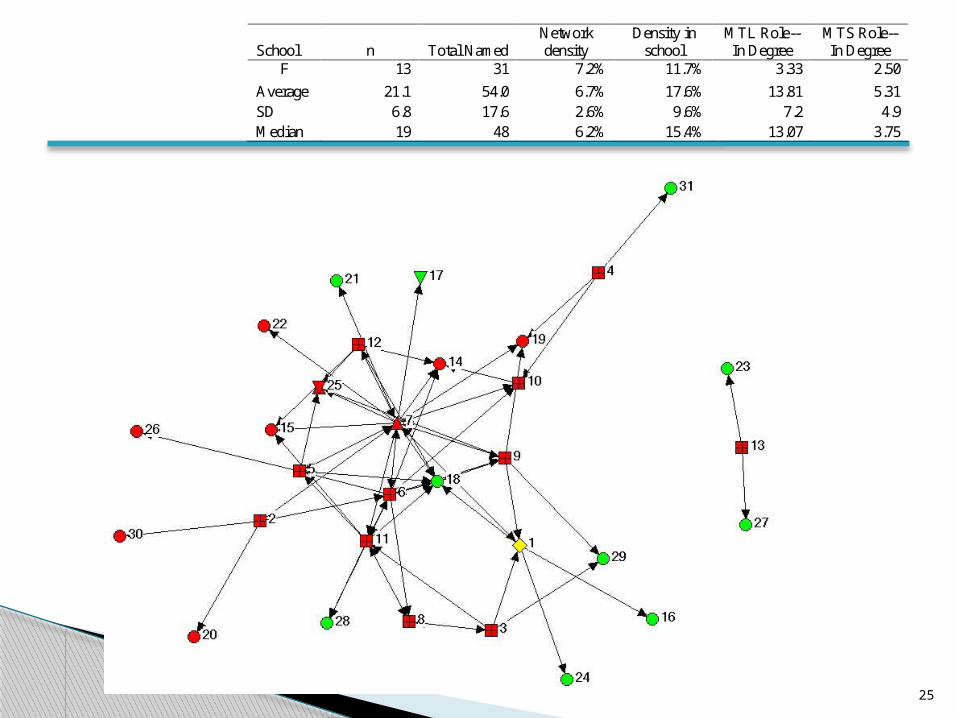
School n Total Named Network density
Density in school
MTL Role--In Degree
MTS Role--In Degree
F 13 31 7.2% 11.7% 3.33 2.50
Average 21.1 54.0 6.7% 17.6% 13.81 5.31 SD 6.8 17.6 2.6% 9.6% 7.2 4.9 Median 19 48 6.2% 15.4% 13.07 3.75
26
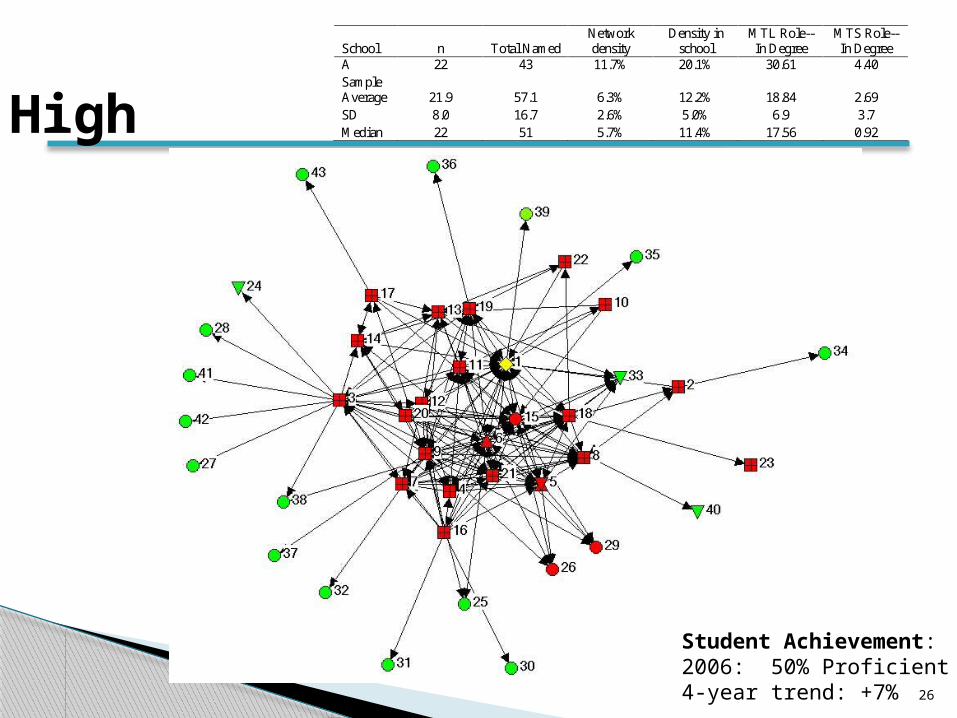
High
School n Total Named Network density
Density in school
MTL Role--In Degree
MTS Role--In Degree
A 22 43 11.7% 20.1% 30.61 4.40 Sample Average 21.9 57.1 6.3% 12.2% 18.84 2.69 SD 8.0 16.7 2.6% 5.0% 6.9 3.7 Median 22 51 5.7% 11.4% 17.56 0.92
Student Achievement:2006: 50% Proficient4-year trend: +7%
27
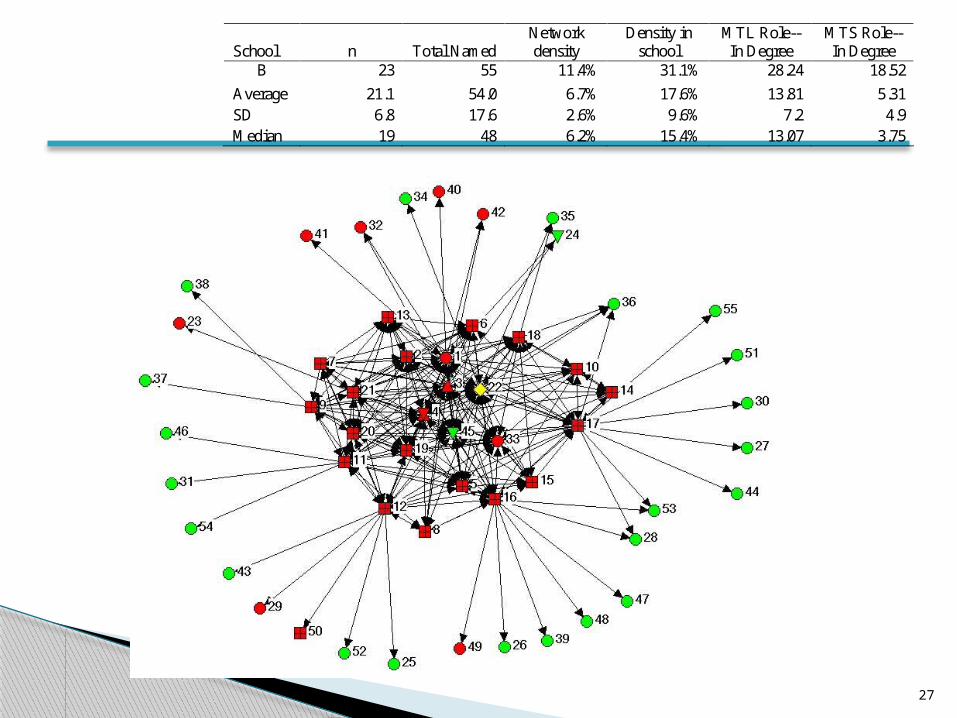
School n Total Named Network density
Density in school
MTL Role--In Degree
MTS Role--In Degree
B 23 55 11.4% 31.1% 28.24 18.52
Average 21.1 54.0 6.7% 17.6% 13.81 5.31 SD 6.8 17.6 2.6% 9.6% 7.2 4.9 Median 19 48 6.2% 15.4% 13.07 3.75
28
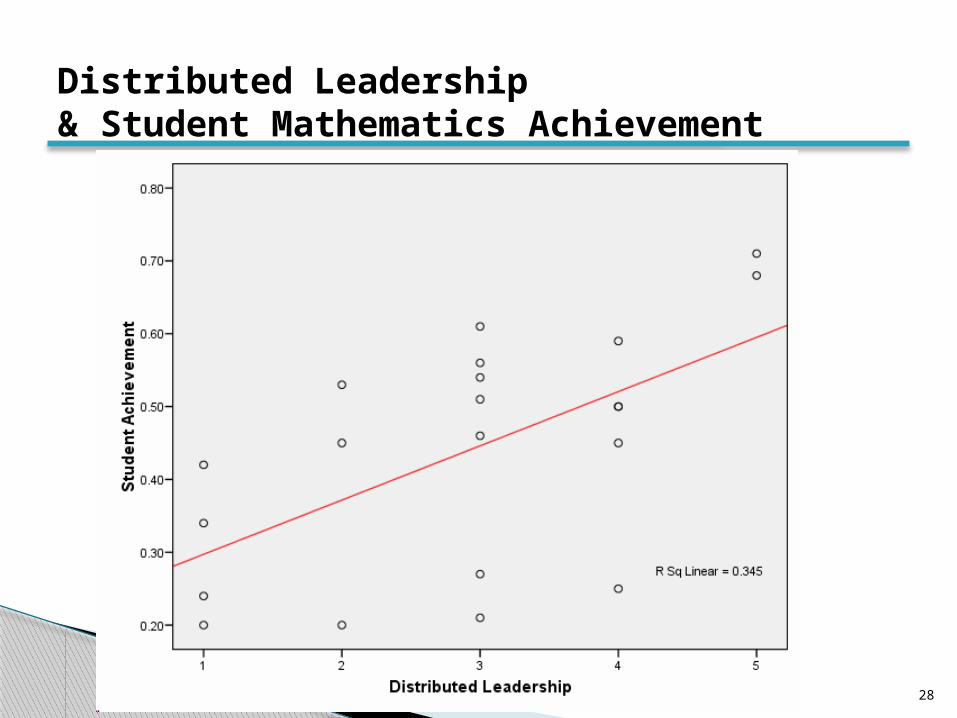
Distributed Leadership & Student Mathematics Achievement
29
Some Conclusions The MTL and MTS network positions are
good indicators of MMP impact within school-based networks.
Distributed leadership really begins to take hold when teacher communication networks are tightly webbed.

Preservice Teacher Math Preparation◦ MATC◦ UWM
Teacher Professional Development◦ UWM-MMP courses & workshops◦ MMP School Action Plans
Assessment Pilots: K-7, 8-9, HS Transition to College Mathematics Textbook Selection Process
And so much more….

MPS Action (Strategic) Plan MPS Mathematics Functional Plan MPS DIFI Plan Governor’s MPS Mathematics Initiative Proposal submitted for MMP Phase II Other grant proposals
Support & Direction for Next Steps
MMP website◦www.mmp.uwm.edu
DeAnn Huinker◦[email protected]
Kevin McLeod◦[email protected]
Beth Schefelker◦[email protected]
Top Related