


Languages
Pages
Legal


1. General comments P4P
2. Second generation Independent Health model
3. Results of asthma and diabetes program
Agenda

Year 200484 programs(39 M lives)
Year 2006160 programs
Pioneers EarlyMajority
LateMajority
Laggards
AetnaHealth PartnersBCBS-HiBCBS-MdIHA-WNY
HighmarkIHA (CA-6 plans)Bridges to Excellence
Other healthplansCMS (federal)
TPAMedicaid (state)
Courtesy 2004 MedVantage Survey
Growth of Pay-for-Performance

First Generation Second Generation
PCP SCP & PCP
HMO PPO, HSA, non-gatekeeper
Component Composite(Uni-dimensional) (Multi-dimensional)
Secondary Source Primary source (Claims) (Medical record)

Focus on Simple Utilization & Satisfaction
Satisfaction, Clinical “Process” (early HEDIS)
Clinical “Outcome” (late HEDIS)
Hybrid with Efficiency Index
First Generation Second Generation

“Social Darwinism”
“Social Democrats”
learning objectives improvement literacy member-specific profiling
First Generation Second Generation

Physician Profiles+
Incentives+
Improvement Literacy
“Improvement Equation”

Chronic Conditions
Family Practice / Internal MedicineDiabetesCardiovascular risk
PediatricAsthma

Physician Profiles+
Incentives+
Improvement Literacy
“Improvement Equation”

Composite scoring methodology
Unique features: Profiles
Physician-specific
Sampling, not registry
Target “active” patients
Self-directed chart review

Process Measures Clinical Decision
Four components history Correct SeveritySeverity Assessment Right med for severityOffice PFTReview of PFT history
Influenza vaccineAction Plan
Asthma
Maximum patient score = 10

Process Measures Outcome Measures
A1C test #1 and #2 A1C < 7.0LDL test LDL < 100BP test BP sys < 130DRE dia < 80 Lower extremity examNephropathyGFR
Diabetes
Maximum patient score = 10

Process Measures Outcome Measures
Family historySmoke history LDL at goalExercise history HDL at goal BMI BP at goalEstablished goalsWaist circ (NC)
CV Risk
Maximum patient score = 10

Independent Health
Physician Office
Chart Review
Def populationsRandom sampling
93-97% participation

Independent Health
Physician Office
Chart Review
Def populationsRandom sampling
Data AnalysisReport Generation
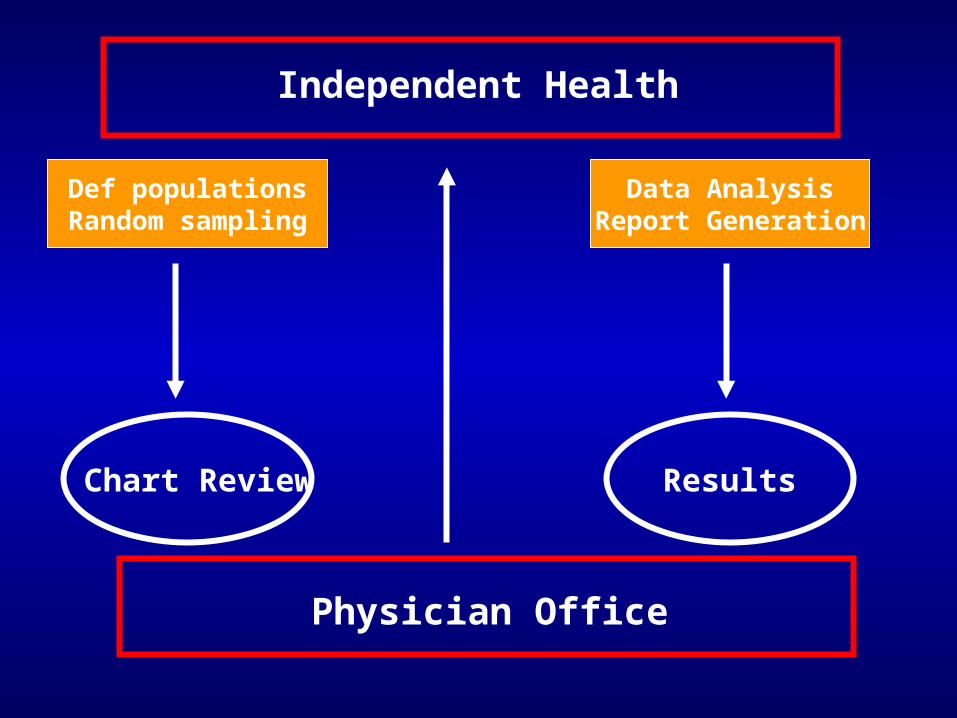
Independent Health
Physician Office
Chart Review Results
Def populationsRandom sampling
Data AnalysisReport Generation

Physician Profiles+
Incentives+
Improvement Literacy
“Improvement Equation”

CME (20 hrs)
Participation (not Performance) based
Unique features: Incentives
Board re-certification

Overall $2.40 pmpm
Diabetes / asthma $0.70 pmpmCV risk $0.80 pmpm
500 members = $4,200 per component

Physician Profiles+
Incentives+
Improvement Literacy
“Improvement Equation”

Physician account executive (PAE) outreach
Actionable reporting
Unique features: Improvement Literacy
Interactive web site for data submission


5 Minute Tip Sheet
Incomplete history ? Did you assign a severity rating ? Does your assigned severity match the patient’s clinical history (calculated severity) ? Do all available medications match the patient’s disease severity ? Did the patient receive needed services ? Patients with lowest adherence scores have the greatest need for services and management.
1
2
3
4
5
1
2
3 4
5
6
6

Identify system flaws “bad systems, not bad doctors”
Motivation / engagement of physicians and staff
Create a culture of mutual learning and discovery
Foster idea diffusion / consensus building
What is Improvement Literacy ?

Data Analysis and TrendsAsthma

Patient's Adherence Scores to Asthma Guidelines
Baseline Following Intervention
8%
35%

0%
10%
20%
30%
40%
50%
60%
70%
80%
90%
100%
Complete History Assigned severitycorrelates with history
Right Med for RightSeverity
Cycle 1 Cycle 2 Cycle 3 Cycle 4 Cycle 5

0%
10%
20%
30%
40%
50%
60%
70%
80%
90%
100%
Complete History Assigned severitycorrelates with history
Right Med for RightSeverity
Cycle 1 Cycle 2 Cycle 3 Cycle 4 Cycle 5

0%
10%
20%
30%
40%
50%
60%
70%
80%
90%
100%
Office PFT / PFR Reviewed PFdiary
Immunization Asthma actionplan
Cycle 1 Cycle 2 Cycle 3 Cycle 4 Cycle 5

0%
10%
20%
30%
40%
50%
60%
70%
80%
90%
100%
Office PFT / PFR Reviewed PFdiary
Immunization Asthma actionplan
Cycle 1 Cycle 2 Cycle 3 Cycle 4 Cycle 5

0
1
2
3
4
5
6
7
8
9
10
Adherence score
Cycle 1 Cycle 2 Cycle 3 Cycle 4 Cycle 5

0
1
2
3
4
5
6
7
8
9
10
Adherence score
Cycle 1 Cycle 2 Cycle 3 Cycle 4 Cycle 5

QMIA-asthma Adherence Score(by practice site)
0.00
1.00
2.00
3.00
4.00
5.00
6.00
7.00
8.00
9.00
10.00
Individual Physician Offices
Ad
he
ren
ce
Sc
ore
Highest Scoring Office
Lowest Scoring Office
Variation by Medical Office Site

ER Utilization 3.71 2.92 p<0.01
Hosp rate 0.83 0.81
HEDIS preferred pharmacy
age 5-9 74% 81% p<0.05
age 10-17 68% 76% p<0.01
Asthma Outcomes
2003 2004

Data Analysis and TrendsDiabetes

12.0010.008.006.004.002.000.00
Adherence to Guideline (10 point maximum score)
800
600
400
200
0
Fre
qu
en
cy
5% met all criteria
Mean = 5.4931Std. Dev. = 2.1891N = 3,982
Adherence to Diabetes Guidelines, Cycle 5
5% meet all criteria

0%
10%
20%
30%
40%
50%
60%
70%
80%
90%
100%
1st A1C completed 2nd A1c A1C at goal
Cycle 1 (baseline) Cycle 2 Cycle 3 Cycle 4 Cycle 5

0%
10%
20%
30%
40%
50%
60%
70%
80%
90%
100%
1st A1C completed 2nd A1c A1C at goal
Cycle 1 (baseline) Cycle 2 Cycle 3 Cycle 4 Cycle 5

0%
10%
20%
30%
40%
50%
60%
70%
80%
90%
100%
LDL completed LDL at goal BP at goal
Cycle 1 (baseline) Cycle 2 Cycle 3 Cycle 4 Cycle 5

0%
10%
20%
30%
40%
50%
60%
70%
80%
90%
100%
LDL completed LDL at goal BP at goal
Cycle 1 (baseline) Cycle 2 Cycle 3 Cycle 4 Cycle 5

0%
10%
20%
30%
40%
50%
60%
70%
80%
90%
100%
DRE completed Foot examcompleted
Nephropathycompleted
GFR Recorded
Cycle 1 (baseline) Cycle 2 Cycle 3 Cycle 4 Cycle 5

0%
10%
20%
30%
40%
50%
60%
70%
80%
90%
100%
DRE completed Foot examcompleted
Nephropathycompleted
GFR Recorded
Cycle 1 (baseline) Cycle 2 Cycle 3 Cycle 4 Cycle 5

0
1
2
3
4
5
6
7
8
9
10
Adherence Score
Cycle 1 (baseline) Cycle 2 Cycle 3 Cycle 4 Cycle 5

0
1
2
3
4
5
6
7
8
9
10
Adherence Score
Cycle 1 (baseline) Cycle 2 Cycle 3 Cycle 4 Cycle 5

QMIA-diabetes Adherence Score(by practice site)
0.0
1.0
2.0
3.0
4.0
5.0
6.0
7.0
8.0
9.0
10.0
Individual Physician Offfices
Ad
he
ren
ce
Sc
ore Highest Scoring Office
Lowest Scoring Office
Variation by Medical Office Site

Seven diabetes HEDIS measures:
Statistically significant improvement in 2/3rd (all LOB)
Diabetes Outcomes

Hospitalizations for Diabetic Members by Year (2001-2004 to date) and Complication by DRGDraft # 2, December 15, 2004
0
10
20
30
40
50
60
Complication based on DRG Classification
Hos
pita
liztio
ns/1
000
Mem
bers
with
Dia
bete
s
2001 2002 2003 2004

Diabetics with co-morbid conditions (20%)Had higher adherence scores
(esp outcome measures)
Ave Adherence Score
0
1
2
3
4
5
6
7
8
9
10
DM only CAD CKD HF

Data Analysis and TrendsCV Risk

CV Risk (baseline cycle 1)
0%
10%
20%
30%
40%
50%
60%
70%
80%
90%
100%
Complete Hx BP at goal LDL at goal HDL at goal BMI calculated Goalsestablished
Cycle 1

Key Learnings…
Community-wide physician engagement
Improvement without performance-based awards
Process measures = rapid Outcome measures = slower Composite measures = slowest

Key Learnings…
Sampling is an effective “touching every patient”
Improvement literacy communicated economically

Questions ?

Contact Information:
Thomas Foels, MD MMMAssociate Medical Director
Independent Health Association511 Farber Lakes DriveWilliamsville, NY 14221
(716) [email protected]
Top Related