


Languages
Pages
Legal


VISION ZERO | 1
Seattle’S plan to enD traffic DeathS anD SeriouS injurieS by 2030
We dedicate this plan to all those who have lost their lives in traffic, to those who have been seriously injured, and to their families and friends. We can, must, and will
do more to make Seattle’s streets safer for everyone.

Contents
4 Letter from the Mayor
5 Letter from sPD Chief and sDot Director
6 A Vision for safer streets
13 near-term Actions
24 evaluation
25 Conclusion

4 | CITY OF SEATTLE
Letter froM MAyor MurrAy
Dear friends,
Public safety is the foremost responsibility of city government. All Seattle residents deserve to be secure in their homes, safe in their neighborhoods, and able to explore our city without threat or intimidation. My vision for a safe Seattle extends to ensuring that people feel safe and comfortable traveling in our growing city, whether as a pedestrian, on a bike, or by car.
Seattle is a leader in traffic safety, and for the past decade, collisions on our streets have steadily declined. We were also recently named the safest city for pedestrians in the United States by Liberty Mutual Insurance. While this is wonderful news, there is still much more we can do to save lives, because even one death on our streets is unacceptable.
With this document and with many concrete and forward thinking actions to come, we are confirming our commitment to ending traffic deaths and serious injuries on our streets by 2030. This is our Vision Zero.
At the core of the worldwide Vision Zero movement is the belief that death and injury on city streets is unacceptable and preventable. Cities across the globe have set similar goals and are seeing serious reductions in crashes, deaths, and injuries.
Through smarter street design, targeted enforcement, and education, we will make our streets even safer for people of all ages and abilities, especially pedestrians and people on bikes, as they’re the most vulnerable to death and injury on our streets. The loss of a friend, parent, or child is an excruciating experience that no one should have to endure. A Vision Zero mentality and this plan will help us save lives.
I look forward to working with you all, as we each have a part to play in making this vision a reality.
Mayor Ed Murray

VISION ZERO | 5
Letter froM sPD Chief AnD sDot DireCtor
Dear fellow Seattleites,
Mayor Murray has laid out a vision for a safer Seattle, one that includes a goal of ending traffic deaths and serious injuries on our streets by 2030. Vision Zero is a city goal that can only be met if we work together.
Our departments play a key role in ensuring safe travel throughout the city. The way in which we design our streets, educate our road users, and enforce traffic laws can dramatically improve safety. Better and smarter street design, paired with targeted education and enforcement is proving effective in cities that have committed to similar goals. We can learn from these cities.
More than that, we can set new standards in safety through innovation in design, education, and enforcement. We’re already well on our way as we’ve realized safety gains by installing protected bicycle lanes, school zone safety cameras, and pedestrian median islands and crossing improvements throughout the city.
We pledge to work together toward this aggressive, yet achievable goal. We also need your commitment, as fellow residents. Help us reach zero by following the rules of the road, no matter how you’re traveling. Be predictable and look out for each other. And remember that the decisions you make on the road can have life altering effects on you and our community as whole.
Together, we’ll make Seattle even safer.
Kathleen O’Toole Chief, Seattle Police Department
Scott KublyDirector, Seattle Department of Transportation

6 | CITY OF SEATTLE
A Vision for sAfer streets
Seattle is consistently recognized as one of the safest cities in the country. Over the past decade, we’ve seen a 30 percent decline in traffic fatalities, even as our population grows.
Despite this fact, traffic collisions are a leading cause of death for Seattle residents age 5-24. Older adults are also disproportionately affected, and as our population ages, this trend could grow. In 2013, there were 10,310 police-reported collisions in Seattle. 155 people were seriously injured and 23 were killed. This is unacceptable.
We can do better.
At the core of the worldwide Vision Zero movement is the belief that death and injury on city streets is preventable. For the most part, these aren’t “accidents.” Collisions are often the result of poor behaviors and unforgiving roadway designs. So we must approach the problem from multiple angles – street designs that emphasize safety, predictability, and the potential for human error, coupled with targeted education and data-driven enforcement.
In 2013, there were 10,310 police-reported collisions in Seattle. 155 people were seriously injured and 23 were killed. This is unacceptable.
Family and friends gather at a memorial walk honoring 68-year old Leo Almanzor, who was struck by a car and killed in a hit and run collision as he walked to work on November 22, 2014. Photo credit: Cathy Tuttle.

VISION ZERO | 7
Why noW?In Seattle, nearly 30 collisions occur on our streets every day.
People walking and biking are involved in collisions daily. Each year, more than 150 people sustain life-changing serious injuries and approximately 20 people die on our streets. People over age 50 are particularly vulnerable and have made up 70 percent of pedestrian fatalities in the last three years.
While Seattle is consistently recognized as a safe city, it’s time to do more to prevent crashes.
Seattle considers safety for people walking and biking a top priority since the likelihood of injury is nearly 100 percent if they are hit. And it’s important to note that safety projects benefit all travelers – people driving, biking, and walking. Through context sensitive engineering and thoughtful enforcement patrols, we will redesign our streets to reduce risk and improve conditions for everyone.
Vision Zero provides an opportunity to integrate our safety efforts by combining the street design recommendations of our Pedestrian, Bicycle, Transit, and Freight Master Plans with targeted enforcement patrols and educational outreach to address behavioral issues.
Now is the time to coordinate our safety efforts and commit to a goal of zero fatalities by 2030.
30 CRASHES A DAY
MORE THAN 10,000 A YEAR
150 PEOPLE SUSTAIN LIFE-CHANGING INJURIES
EVERY YEAR
NEARLY 35,000 TOTAL CRASHES IN THE LAST
THREE YEARS
APPROXIMATELY 20 PEOPLE DIE ON OUR STREETS
EACH YEAR
VISION ZERO WILL SAVE LIVES

8 | CITY OF SEATTLE
the trenDs
Fatalities and serious injuries are trending in the right direction, but still far too many lives are changed in traffic incidents.
AVERAGE DAILY TRAFFIC IN SEATTLE
SEATTLE POPULATION
Seat
tle B
ridg
e Vo
lum
es
960,000
940,000
920,000
900,000
880,000
860,000
840,000
874,376
652,000
2004 2005 2006 2007 2008 2009 2010 2011 2012 2013
660,000
640,000
620,000
600,000
580,000
560,000
540,0002004 2005 2006 2007 2008 2009 2010 2011 2012 2013
CITYWIDE COLLISION RATE
Colli
sion
s pe
r Mill
ion
AADT
Tri
ps
90.0
85.0
80.0
75.0
70.0
65.0
60.0
55.0
50.02005 2006 2007 2008 2009 2010 2011 2012 2013
54.8
Seattle is one of the safest cities in the US, with a traffic fatality rate rivaling Sweden’s (the birthplace of Vision Zero). Still, we can do more to prevent death and injury on our streets.
Seattle is the fastest growing major city in the country. Even as population increases, collisions continue to decrease.
road fatality per 100,000
people2012
fatalities Population
Sweden* 3.0 285 9,500,000
United States* 11.6 36166 313,900,000
Washington State 6.4 444 6,897,012
King County 4.3 85 1,957,000
Seattle 3.2 20 634,535
Portland 5.3 32 603,106
New York City 3.2 268 8,336,697
*Data from 2013 World Health Organization Report using 2010 numbers
seAttLe PoPuLAtion
CityWiDe CoLLision rAte
VISION ZERO | 9
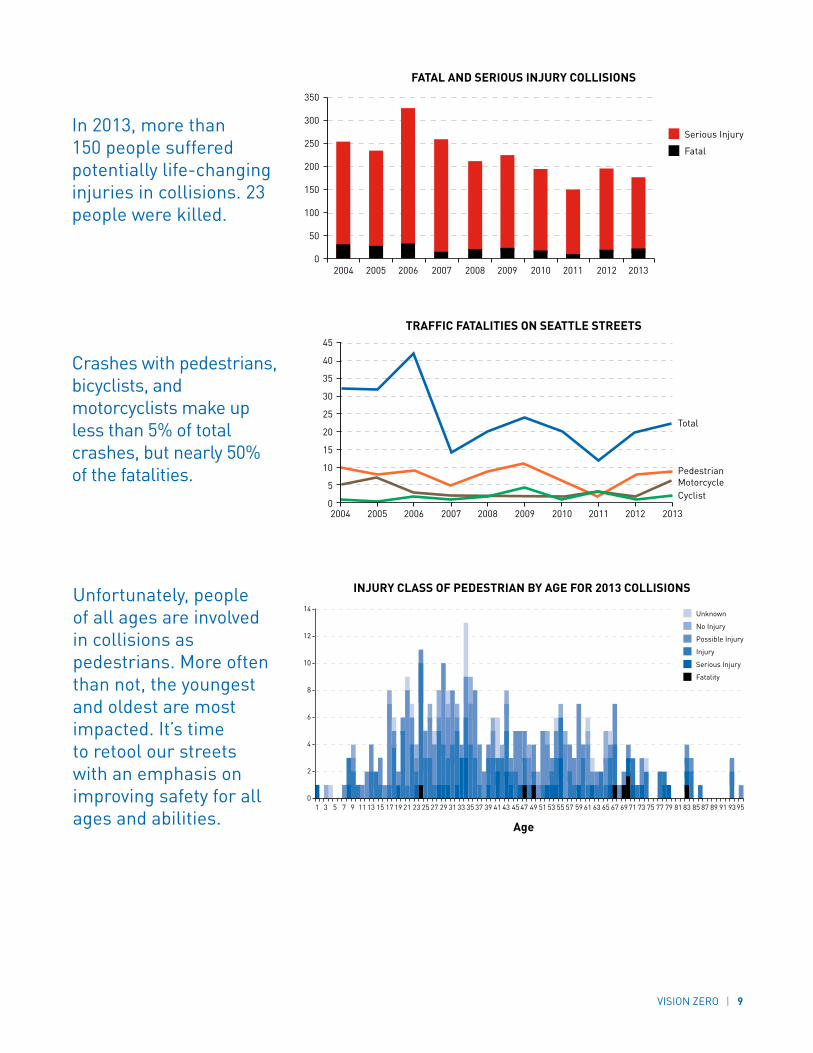
Crashes with pedestrians, bicyclists, and motorcyclists make up less than 5% of total crashes, but nearly 50% of the fatalities.
INJURY CLASS OF PEDESTRIAN BY AGE FOR 2013 COLLISIONS
Age1 3 5 7 9 11 13 15 17 19 21 23 25 27 29 31 33 35 37 39 41 43 45 47 49 51 53 55 57 59 61 63 65 67 69 71 73 75 77 79 81 83 85 87 89 91 93 95
14
12
10
8
6
4
2
0
Unknown
No Injury
Possible Injury
Injury
Serious Injury
Fatality
FATAL AND SERIOUS INJURY COLLISIONS
TRAFFIC FATALITIES ON SEATTLE STREETS
350
300
250
200
150
100
50
0
45
40
35
30
25
20
15
10
5
0
2004 2005 2006 2007 2008 2009 2010 2011 2012 2013
2004 2005 2006 2007 2008 2009 2010 2011 2012 2013
Total
PedestrianMotorcycleCyclist
Serious Injury
Fatal
FATAL AND SERIOUS INJURY COLLISIONS
TRAFFIC FATALITIES ON SEATTLE STREETS
350
300
250
200
150
100
50
0
45
40
35
30
25
20
15
10
5
0
2004 2005 2006 2007 2008 2009 2010 2011 2012 2013
2004 2005 2006 2007 2008 2009 2010 2011 2012 2013
Total
PedestrianMotorcycleCyclist
Serious Injury
Fatal
In 2013, more than 150 people suffered potentially life-changing injuries in collisions. 23 people were killed.
Unfortunately, people of all ages are involved in collisions as pedestrians. More often than not, the youngest and oldest are most impacted. It’s time to retool our streets with an emphasis on improving safety for all ages and abilities.
fAtAL AnD serious inJury CoLLisions
trAffiC fAtALities on seAttLe streets
inJury CLAss of PeDestriAn By AGe for 2013 CoLLisions
Age

10 | CITY OF SEATTLE
A strAteGy thAt WorksVision Zero’s comprehensive approach to safety has contributed to crash reductions worldwide. In Sweden, the birthplace of Vision Zero, fatalities dropped more than 30 percent since this policy was first enacted in the late 1990s. Governments in the US are taking note and adopting Vision Zero policies – most recently, New York City and San Francisco.
Washington State’s Target Zero program provides an outstanding local example of how these strategies save lives. Traffic fatalities have dropped 40 percent in our state since the first version of Target Zero was launched in 2000. Through partnerships with the Washington Traffic Safety Commission, the Washington State Department of Transportation, and the Washington State Patrol, Seattle experienced collision reductions thanks to Vision Zero-style tactics employed on busy urban corridors.
On Aurora Avenue N, collaboration with the State led to a 28 percent reduction in fatal and serious injury crashes. We’ve carried these strategies into our work on corridors like Fauntleroy Way SW, NE 125th Street, Nickerson Street and NE 75th Street where collisions and speeds have gone down.
Developed and implemented in less than six months (in 2013), the NE 75th Street Road Safety Corridor Project reduced speeds by 3 mph eastbound and 4 mph westbound. Crashes are down 50 percent. This is a strategy that works.
NE 75th Street before NE 75th Street after
VISION ZERO | 11
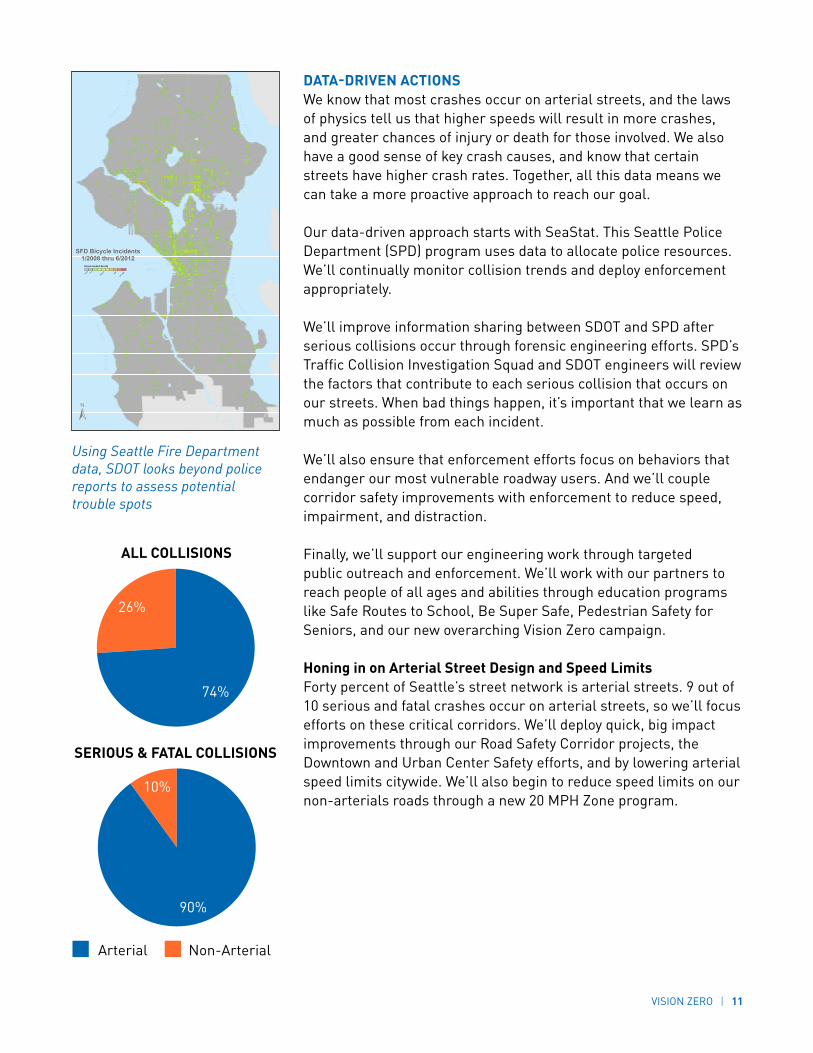
DAtA-DriVen ACtionsWe know that most crashes occur on arterial streets, and the laws of physics tell us that higher speeds will result in more crashes, and greater chances of injury or death for those involved. We also have a good sense of key crash causes, and know that certain streets have higher crash rates. Together, all this data means we can take a more proactive approach to reach our goal.
Our data-driven approach starts with SeaStat. This Seattle Police Department (SPD) program uses data to allocate police resources. We’ll continually monitor collision trends and deploy enforcement appropriately.
We’ll improve information sharing between SDOT and SPD after serious collisions occur through forensic engineering efforts. SPD’s Traffic Collision Investigation Squad and SDOT engineers will review the factors that contribute to each serious collision that occurs on our streets. When bad things happen, it’s important that we learn as much as possible from each incident.
We’ll also ensure that enforcement efforts focus on behaviors that endanger our most vulnerable roadway users. And we’ll couple corridor safety improvements with enforcement to reduce speed, impairment, and distraction.
Finally, we’ll support our engineering work through targeted public outreach and enforcement. We’ll work with our partners to reach people of all ages and abilities through education programs like Safe Routes to School, Be Super Safe, Pedestrian Safety for Seniors, and our new overarching Vision Zero campaign.
honing in on Arterial street Design and speed LimitsForty percent of Seattle’s street network is arterial streets. 9 out of 10 serious and fatal crashes occur on arterial streets, so we’ll focus efforts on these critical corridors. We’ll deploy quick, big impact improvements through our Road Safety Corridor projects, the Downtown and Urban Center Safety efforts, and by lowering arterial speed limits citywide. We’ll also begin to reduce speed limits on our non-arterials roads through a new 20 MPH Zone program.
±
Bicycle Incident Density
None
Low
Medium
High
Very H
igh
SFD Bicycle Incidents1/2008 thru 6/2012
Using Seattle Fire Department data, SDOT looks beyond police reports to assess potential trouble spots
ALL COLLISIONS
SERIOUS & FATAL COLLISIONS
Arterial Non-Arterial
74%
90%
10%
26%

12 | CITY OF SEATTLE
20MPH
HIT BY A VEHICLE TRAVELING AT:
9 out of 10 pedestrians survive
20MPH
30MPH
HIT BY A VEHICLE TRAVELING AT:
5 out of 10 pedestrians survive
30MPH
40MPH
HIT BY A VEHICLE TRAVELING AT:
Only 1 out of 10 pedestrians survives
The average car trip in Seattle is 3.5 miles.
Reducing the speed limit from 35 to 30 mph will
add about a minute to this trip (or 17 seconds per mile), assuming free
flowing traffic
2 MINUTESTime it takes to travel one mile
at 30 mph
1 MINUTE,43 SECONDS
Time it takes to travel one mile
at 35 mph
Why sPeeD MAtters
A driver’s field of vision increases as speed decreases. At lower speeds, drivers can see more of their surroundings and have more time to see and react to potential hazards.
Field of vision at 15 MPH Field of vision at 30 to 40 MPH
Speed is especially lethal for vulnerable users like pedestrians and people biking. The risk of injury and death increases as speed increases.
We should not accept death as a byproduct of commuting. It’s time to slow down to the speed of life.
VISION ZERO | 13
neAr-terM ACtions
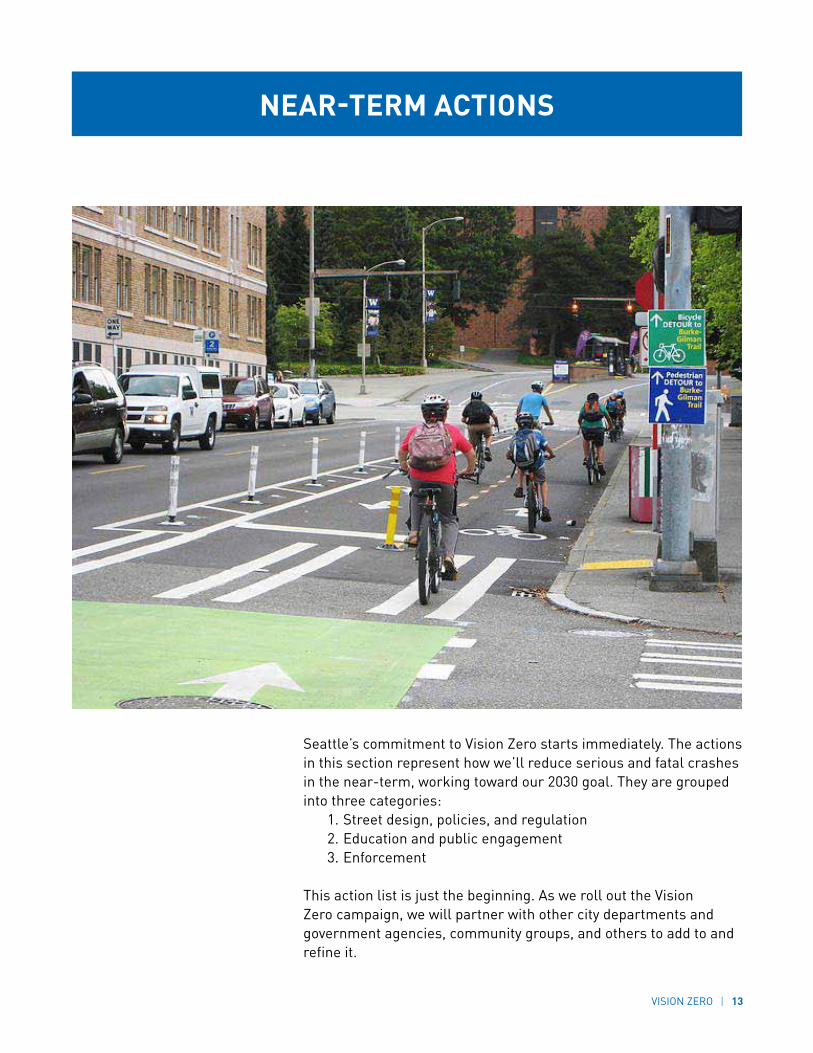
Seattle’s commitment to Vision Zero starts immediately. The actions in this section represent how we’ll reduce serious and fatal crashes in the near-term, working toward our 2030 goal. They are grouped into three categories:
1. Street design, policies, and regulation 2. Education and public engagement 3. Enforcement
This action list is just the beginning. As we roll out the Vision Zero campaign, we will partner with other city departments and government agencies, community groups, and others to add to and refine it.

14 | CITY OF SEATTLE
street DesiGn, PoLiCies, AnD reGuLAtions 20 MPh Zone Program
Reduce speed limits on residential streets through a 20 MPH Zone program. Local streets with high collision history will be primary priorities and most 20 MPH Zones will be installed near schools or parks.
Install signage and pavement markings to clearly delineate the 20 MPH Zone and ensure intersections are cleared of obstructions to improve visibility of pedestrians in crosswalks
Install 5 – 10 zones in 2015
reduce Arterial speed Limits Review arterial speed limits and reduce to 30 mph or lower. Pair speed limit reductions with tools like radar speed signs and street design changes. Review speed limits through our annual programs and Road Safety Corridor projects. Work with State partners to make changes to State Routes like Aurora Avenue North, Lake City Way NE and Sand Point Way NE.
Lower speed limits on the following corridors in 2015: Martin Luther King Jr Way S Rainier Avenue S 35th Avenue SW SW Roxbury Street/Olson Place SW Delridge Way SW Fauntleroy Way SW Harbor Avenue SW Greenwood Avenue N Holman Road NW Seaview Ave NW 5th Avenue NE 15th Avenue NE

VISION ZERO | 15
SW ROXBURY ST
RAINIERAVES
MLK
ING
JRW
AYS
14T H
AVE
HARBORAVESW 4T
HAV
ES
6TH
AVE
S
D NY WAY
32ND
A VE
NW
A MARGINAL WAY S
AURO
RAAV
EN
EST SEATTLEBRW
NE95TH ST
BEACONAVE
S
LAKE
CITY
WAY
NE
DELR
IDG E
WAY
SW
RENTONAVES
3RD
AVE
N
34TH ST
N 45TH ST 50TH ST
25TH
A VE
NE
1 5T H
AVE
S LAKEWASHINGTONBLVD
S
WEST
MARGINALW
AYSW
SWIFTAVES
CALI
FOR N
I AAV
ESW
PHIN
NEY
AVE
N
ML
KINGJR
WR
WAY
S
5TH
AVE
N E
NE70TH ST
NE45T STGR
E EN
O OD
AVE
NN 40TH ST
MLKING
JRE R
WAY
S
31ST
AVE
S
SANDPOINT
WAY
NE
1 9T H
AVE
E2 3
RDAV
ES
N 8 TH ST
35T H
AVE
S W
NE110TH ST
NE125TH ST
S JACKSON ST
SW ADMIRALWAY
NE 145TH ST
N 13 TH ST
N 145TH ST
125T ST
EMADISONST
51ST
A VE
S
DEXTERAV E
N
23RD
AVE
15TH
A VE
N E
WEST SE TT E RE
NE 55TH ST
HAV
ENE
SEWARD
PA RKAVE
S
20TH
AVE
NEN 80TH ST
1ST
AVE
N E
FAUN
TLER
OYW
AYSW
ALKI
AVESW
1ST
AVE
S
AIRPORTWAY S
ALAS
K AN
WY V
I SB
ALAS
KAN
WY
30T
0H
5
N
WW
H
N
EN
N
W
S GRAH M STA
2015 Arterial Speed Limit Review Corridors
2015 Downtown Speed Limit Reduction
2015 20 MPH Zones
Future Corridors
Other Arterial Streets
AB
E
VINB
L B
TS
B
W MCGRAW ST
W GALER ST
6TH
AVE
W
RCASSTOS
16 | CITY OF SEATTLE
Downtown safetyMost pedestrian collisions occur downtown. In fact, more than 600 people have been hit while walking downtown in the last three years. While we’ve seen positive safety gains outside of the city center, we’ve seen an increase in the severity of collisions in the central business district - specifically collisions involving speeding.Prevent collisions through low-cost, quick changes including:
Reduce speed limits to 25 mph throughout downtown, starting with Pike, Pine and James streets
Data-driven pedestrian safety enhancements may include leading or lagging pedestrian intervals, protected turn phases, elimination of dual turn lanes, signal improvements, and no turns on red. 2015 locations include:
• 5th Ave at Union, University, Spring, and Seneca Streets• 6th Ave at Pike, Spring, Cherry, James, and University
Streets• 7th Ave and Olive Way
urban Center safetyBring a higher level of safety to Seattle’s Urban Centers, where high volumes of vehicular traffic, transit, pedestrians, and bicyclists merge. Data-driven improvements may include modified signal phasing, traffic calming, protected turn phases and leading or lagging pedestrian intervals at the following locations:
Lake City at NE 125th Street and Lake City Way NE White Center/Westwood at SW Roxbury Street and Delridge
Way/16th Ave SW Columbia City and Hillman City on Rainier Ave S
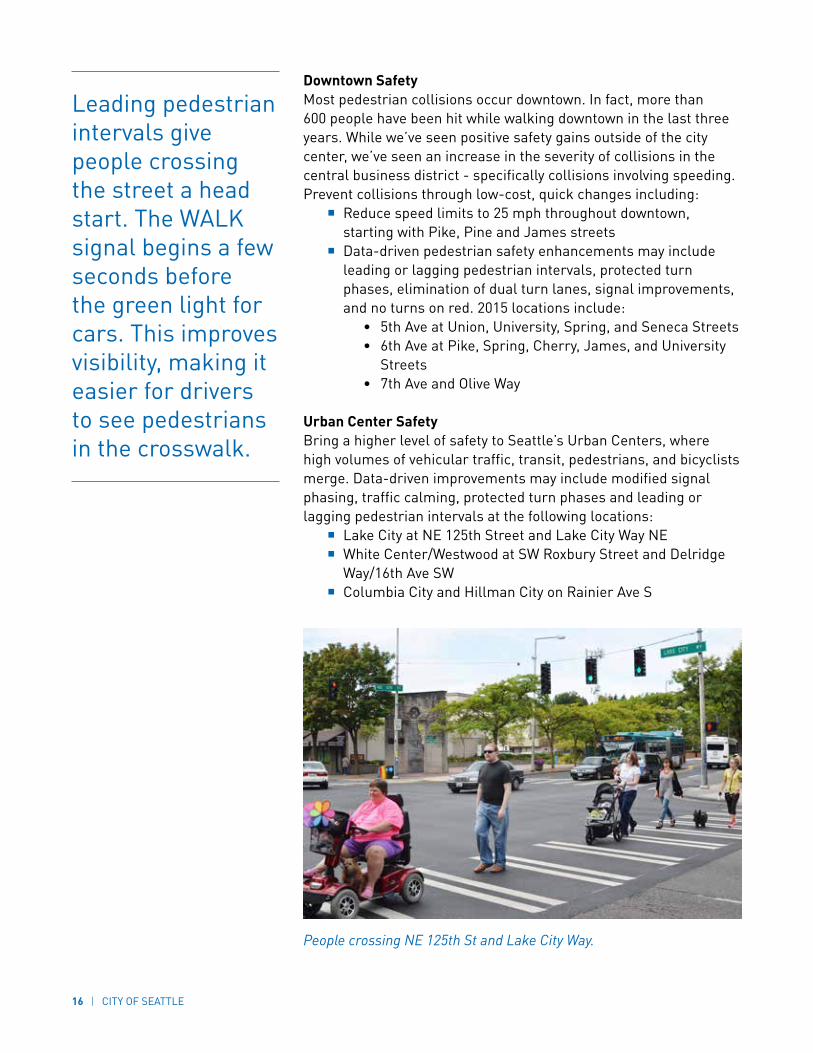
Leading pedestrian intervals give people crossing the street a head start. The WALK signal begins a few seconds before the green light for cars. This improves visibility, making it easier for drivers to see pedestrians in the crosswalk.
People crossing NE 125th St and Lake City Way.

VISION ZERO | 17
Master Plan Development and implementationIn 2015, implement safety improvements identified in the Pedestrian and Bicycle Master Plans including:
7 miles of protected bike lanes 12 miles of neighborhood greenways More than 40 crossing improvements 14 blocks of new sidewalk Remark 500 crosswalks
In addition, SDOT and our community partners will develop a Freight Master Plan to focus on safe and reliable urban truck movements to support Seattle’s maritime and manufacturing industry and our increasing demand for goods and services.
transit safety improvementsImprove safety and access for transit, through signal timing and lane allocation improvements. Make transit spot improvements that increase pedestrian safety and access to transit stops and stations.
Dexter Ave serves people biking, using transit, walking, and driving.
18 | CITY OF SEATTLE
road safety CorridorsReduce collisions through low cost engineering, enforcement and education efforts on targeted corridors including:
Rainier Ave S Lake City Way SW Roxbury Street 35th Ave SW Banner Way
Complete CorridorsPlan and develop long-term multimodal improvements on corridors such as:
Delridge Way SW East Marginal Way Yesler Way Greenwood Ave N 3rd Ave Beacon Ave S
Capital ProjectsTransform Seattle streets through major projects designed to ensure safe travel for pedestrians, bicyclists, and drivers
23rd Ave Mercer West Waterfront Broadway
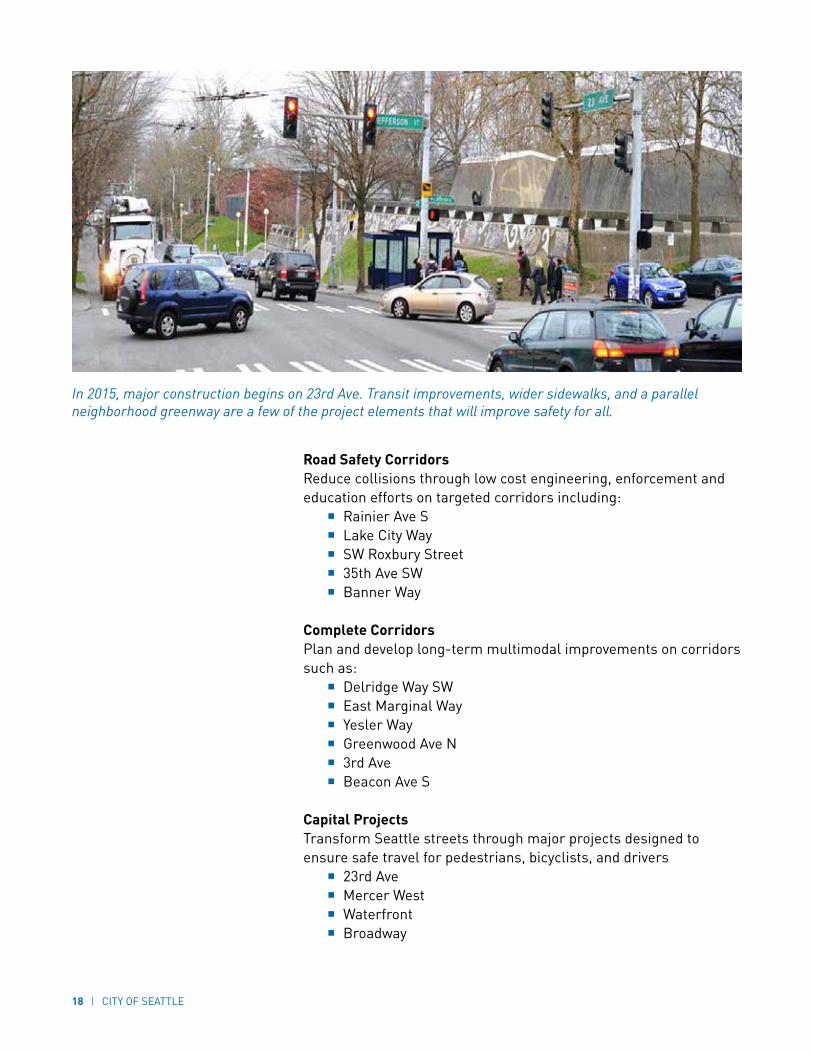
In 2015, major construction begins on 23rd Ave. Transit improvements, wider sidewalks, and a parallel neighborhood greenway are a few of the project elements that will improve safety for all.

VISION ZERO | 19
safe routes to school (srts)In 2015, SDOT and our community partners will complete our School Road Safety Action Plan as a comprehensive guide to school safety. We’ll also provide Safe Routes to Schools services throughout Seattle including:
Infrastructure improvements at more than 20 schools 40 SRTS mini-grants
Crosswalk Policy Update SDOT’s crosswalk policies to put greater emphasis on the presence of transit stops, elderly people, and students

20 | CITY OF SEATTLE
high reflectivity Pavement MarkingsIntegrate more durable and visible pavement markings as the new standard for all roadway projects in Seattle
right-of-Way improvement Manual (roWiM)Update the ROWIM to provide guidance to private developers on best practices for ensuring safety in the right of way. To include:
New street types that prioritize safety and quality for all users New pedestrian and bicycle design standards A new section on interim design treatments that can offer
low-cost, near-term solutions to improve safety in advance of secured capital funding
Construction Coordination Ensure that construction coordination strategies focus on keeping people safe on our streets during construction. Use creative and low cost solutions like signal timing modifications to ensure safe and predictable movements – especially for people walking and biking.

VISION ZERO | 21
SAFER STREETS FOR SEATTLE
eDuCAtion AnD PuBLiC enGAGeMentVision Zero Campaign Create an overarching outreach effort to highlight the impact of Seattle’s Vision Zero campaign and change the way people behave on our streets
Provide information to drivers, pedestrians and bicyclists about new roadway features, vehicle characteristics and how to look out for each other
Partner with nightlife businesses, transit agencies, taxi operators, and transportation network companies to deter impaired driving by offering special services and promotions
targeted outreachDevelop demographic, geographic, and modal-specific safety outreach materials including:
Safe Routes to School (ages 5-18) Be Super Safe (ages 18-30) Pedestrian safety for seniors (ages 50+)
transportation system user GuidesDevelop transportation user guides to ensure knowledge of transportation options and rules of the road including, whether walking, biking, using transit, or driving
Seattle by bikeyour easy-start guide to bicycling around Seattle
www.seattle.gov/transportation
stop for Pedestrians signs Install signage throughout the city to ensure that people understand existing pedestrian safety laws. This includes in-street signage at crosswalks and shoulder mounted “Stop for Me – It’s the Law” signs.
22 | CITY OF SEATTLE
Public engagement Host events and contests to distribute safety information and
create a sustained public dialog about road safety Incorporate safety education activities into existing events,
like Summer Streets and SDOT’s Play Street Program Partner with advocacy organizations and other agencies
to create a traffic safety education kit and other tools that community groups, schools, and others can use to promote road safety awareness and Vision Zero.
“re-enforcement” PatrolsOur safety record shows that Seattle does a lot of things right. SPD and SDOT will work together to reward and reinforce good behavior on our streets.
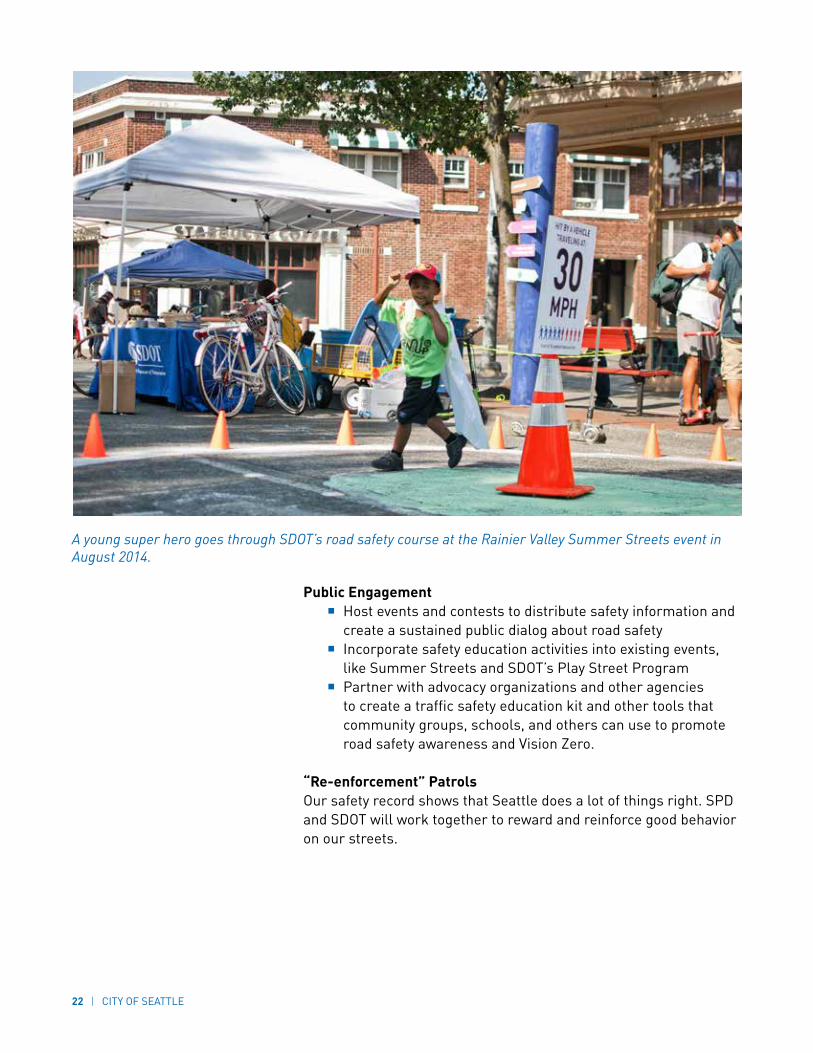
A young super hero goes through SDOT’s road safety course at the Rainier Valley Summer Streets event in August 2014.

VISION ZERO | 23
enforCeMentschool Zone Photo enforcementIn 2015, install at least twelve new cameras in six school zones, to reduce speeds and improve safety for kids, our most vulnerable travelers. SDOT will use funds generated through this program to improve the existing infrastructure near schools.
high Visibility enforcement Inform and enforce approach in high crash locations targeting risky behaviors like:
Distraction Impairment Speeding
Corridor safety PatrolsTarget corridor-specific safety issues on major arterial streets
Pedestrian safety emphasis Patrols Enforce laws about failure to yield to pedestrians and “blocking the box” at crosswalks citywide
Bicycle safety emphasis PatrolsEnforce all traffic laws for all travelers in locations where bicycle collisions occur frequently
Commercial Vehicle enforcement Collaborate with the Washington State Patrol to ensure freight operators are able to move safely and efficiently through the city

24 | CITY OF SEATTLE
eVALuAtion
Seattle builds evaluative components into most of our projects and we will report out on these efforts on an annual basis. The ‘Vision Zero Report’ will update the public on progress and tee up efforts for the upcoming year. The report will be issued in late October every year. In addition, we’ll provide continuous updates at www.seattle.gov/visionzero to monitor our progress.
Ultimately, success will be reaching zero fatalities and serious injuries by 2030. Each year, our goal is for collision trends to decrease. Annually, we will track the following data points:
Total number of collisions, fatalities, and serious injuries Total number of pedestrian collisions, fatalities, and serious
injuries Total number of bike collisions, fatalities, and serious injuries

VISION ZERO | 25
ConCLusion
Vision Zero is an aggressive, but critical goal; an acknowledgement that even one serious injury or traffic death is one too many. It is a goal that the city as a whole stands behind. It’s a partnership between city departments, other public agencies, community groups, and each of us as individuals.
Vision Zero is a key element of moving Seattle forward as we continue to grow. A safe city is central to our quality of life and our economy. A safe city means that everyone, whether 8 or 80 years old, can get around comfortably and reliably.
Whether we’re behind the wheel of a car or truck, on the seat of a road bike or tricycle, in a wheelchair, stroller, or jogging along the sidewalk – we are all people. We are neighbors, friends, moms, dads, grandparents, and children. In the rush of daily life, with so much information available at the tip of our fingers, we too often forget that we are all trying to get somewhere or to someone.
We look forward to working with you to make sure that no matter how we’re travelling and where we’re going, we reach our goal of Vision Zero together.

26 | CITY OF SEATTLE
City of Seattle(206) 684-2489 (CITY)www.seattle.gov/visionzero#VISIONZEROSEA 2.2015
Top Related