


Languages
Pages
Legal


SE 450 Software Processes & Product Metrics 1
Product Quality Engineering

SE 450 Software Processes & Product Metrics 2
Q vs q
Quality includes many more attributes than just absence of defects:
Features
Performance
Availability
Safety
Security
Reusability
Extensibility Modifiability Portability Scalability Cycletime Cost

SE 450 Software Processes & Product Metrics 3
ISO9126 Attribute Classification
FunctionalitySuitabilityAccuratenessInteroperabilityComplianceSecurity
ReliabilityMaturityFault-toleranceRecoverability
UsabilityUnderstandabilityLearnabilityOperability
EfficiencyTime behaviorResource behavior
MaintainabilityAnalyzabilityChangeabilityStabilityTestability
PortabilityAdaptabilityInstallabilityConformanceReplaceability

SE 450 Software Processes & Product Metrics 4
Another Perspective
BehaviorPerformanceDependabilityUsability
EvolvabilityExtensibilityMaintainabilityScalabilityPortability
BusinessCycletimeCostReusability
PerformanceResponse timeThroughputCapacityResources Usage• Space• Bandwidth
Not exhaustive list Not mutually independent Tradeoffs
DependabilityReliabilityAvailabilityTimelinessRobustnessPrecisionSecurity, Safety
UsabilityOperabilityLearnabilityHelpfulnessInteroperabilityControl, AffectAdaptability
• Platform• Power
Functionality

SE 450 Software Processes & Product Metrics 5
Product Quality Engineering
Objectives
DesignAnalysis
Measurement
•Attribute goals•Criticality of goals•Preferred tradeoffs
•Quantitative / Qualitative•Fidelity varies with effort, available info
•Testing & Field Data•Customer Feedback
Development

SE 450 Software Processes & Product Metrics 6
Functionality (Features)
Requirements process defines objectives. Includes decisions about release phasing
QFD (quality function deployment) to prioritize. Also address interoperability, standards compliance…
Requirements quality engineering practices. Prototyping, customer interaction for early defect detection. Requirements checklists (and templates) for defect elimination. Domain modeling for completeness and streamlining. Feasibility checking is a preliminary analysis step.
Analysis at requirements and design time. Sequence/interaction diagrams for use cases. Exploring alternative scenarios. May use formal methods to analyze consistency & completeness.
Acceptance testing measures success in feature delivery. Customer satisfaction is the ultimate measure.

SE 450 Software Processes & Product Metrics 7
Performance Engineering Practices
Specify performance objectives. Even where user does not have specific requirements, useful to set
performance targets. Analyze designs to determine performance.
Use performance benchmarking to obtain design parameters. Performance modeling and simulation, possibly using queueing theory,
for higher fidelity results. Performance testing.
Benchmarking (individual operations), stress testing (loads), soak testing (continuous operation).

SE 450 Software Processes & Product Metrics 8
Performance Objectives: Examples
Response Time Call setup: < 250ms System startup: < 2 minutes Resume service within 1.5 sec on channel switchover
Throughput 1000+ call requests /sec
Capacity 70+ simultaneous calls 50+ concurrent users
Resource Utilization Max 50% CPU usage on full load Max 16MB run time memory Max bandwidth: 96 kb/sec

SE 450 Software Processes & Product Metrics 9
Performance Analysis
E.g. spelling checker. If you were building a spelling checker that searched words in a document against a
wordlist, what will be its performance?
Gives very approximate results.
Useful to get an idea of whether the performance goals are: Impossible to meet A significant design concern A “don’t care” (can be met easily)
Helps to identify bottlenecks: which parts of the design need to worry most about performance.
SE 450 Software Processes & Product Metrics 10
Metrics for Performance Within project:
Performance targets (requirements) Estimated performance (design) Actual performance (testing) Measurements, not metrics!
Across projects: Metrics available for some domains.
E.g. polygons/sec for graphics, packets/sec for protocols Can measure performance on “standard” benchmarks
But overall, no general performance metrics.
SE 450 Software Processes & Product Metrics 11
Measuring Performance
Benchmarking operations: Run operation 1000s of times, measure CPU time used, divide to get
average time. Need to compensate for system effects: load variations, caches, elapsed vs.
CPU time etc.
Performance testing: Execute operations using applications, benchmark performance.
Performance is very sensitive to configuration.
Load testing: performance testing under typical operating conditions, where there may be multiple concurrent requests active simultaneously.

SE 450 Software Processes & Product Metrics 12
Availability Engineering Practices
Defining availability objectives similar to reliability. Based on cost impacts of downtime.
Design techniques for availability. Implement fault-tolerance at software and hardware levels.
Availability analysis: Fault trees to to determine possible causes of failures.
FMEA: Failure modes and effects analysis Sort of like fishbones!
Attach MTBF numbers to entries and propagate up the tree. Combine with recovery times to get estimated downtime.

SE 450 Software Processes & Product Metrics 13
Availability Testing & Metrics Availability testing:
Fault injection: introduce faults, study recovery behavior Fault injection capabilities built into code Study failure behavior during system tests: reliability & availability
Availability metrics: % of time system needs to be up and running (or) % of transactions that must go through to completion
Availability goals of 99.9% not unusual. 8 hours of downtime per year.
Availability goal of 99.999% (“5 NINES”) for telecom etc. Less than 5 minutes downtime per year, including upgrades. Requires upgrading the system while it is operational.
SE 450 Software Processes & Product Metrics 14
Usability Engineering Practices Specify usability objectives.
Often internal to development team. May be either quantitative or qualitative.
Workflow observation and modeling, user profiles.
Create interface prototype, analyze for usability. Interface concept has primary impact on usability. State machine models for navigation design and analysis.
Add usability “widgets” to improve usability properties.
Analysis and testing: Assess usability based on operational profiles.
Keystrokes/clicks/number of steps for frequent operations. Assess usability using surveys: SUMI standardized survey tool. User observation testing: watching actual users try to get work done.
Alpha/beta testing.
SE 450 Software Processes & Product Metrics 15
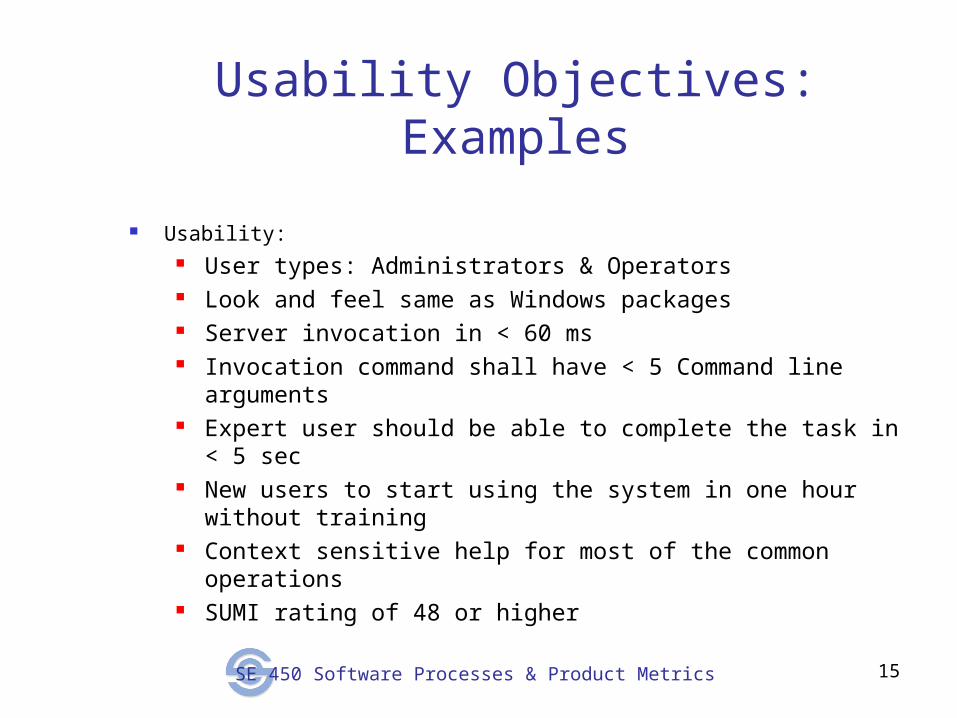
Usability Objectives: Examples
Usability: User types: Administrators & Operators Look and feel same as Windows packages Server invocation in < 60 ms Invocation command shall have < 5 Command line arguments Expert user should be able to complete the task in < 5 sec New users to start using the system in one hour without training Context sensitive help for most of the common operations SUMI rating of 48 or higher

SE 450 Software Processes & Product Metrics 16
SUMI: Software Usability Measurement Inventory
SUMI is a survey-based approach for usability analysis. Standard user questionnaire – 50 questions Pre-calibrated response analysis tool
Constantly calibrated against 100s of major software products Score is relative to state-of-the-art
Score of 0-10 along 5 dimensions: efficiency, learnability, helpfulness, control, affect
Inputs: Actual interface and software behavior, prototypes.
SUMI score is a metric for usability.
http://www.ucc.ie/hfrg/questionnaires/sumi/whatis.html

SE 450 Software Processes & Product Metrics 17
Usability: Quality Engineering
Various guidelines on what to do, not to do: User Interface Hall of Shame, Hall of Fame
Focus on eliminating various kinds of problems: Widget choices to eliminate input errors.
E.g. calendar to choose date instead of specifying. Graying out to eliminate invalid choices. Fault detection & handling model to eliminate crashes. Standardized libraries of UI widgets within applications, to eliminate
inconsistencies.
SE 450 Software Processes & Product Metrics 18
Quick Summary of Usability Engineering
UI design needs to focus first on the basics, then on the cosmetics.
Focus on user characteristics, expectations and the operations they want to perform
Consistent interface concept is the most critical part of UI design.
“Obvious” behavior is good!
Need to figure out and use the right widgets for each UI task.
Cosmetic aspects are nice add-ons after the basics in place.
Usability is about users getting things done and feeling comfortable using the software, not about impressing them!

SE 450 Software Processes & Product Metrics 19
Evolvability Engineering
Identifying evolvability objectives: Likely types of future changes
Designing with evolvability in mind: Most design patterns, theory focus on evolvability Note tradeoffs: designs that increase evolvability along one dimension may reduce
evolvability along others E.g. With OO, easier to add classes & behaviors, harder to make some types of changes
to operations (affects multiple classes)
Evolvability analysis with SAAM: SAAM: Software Architecture Analysis Method Review-based technique that analyzes the architecture to determine how hard it is to
make certain types of changes. “It is possible to analyze for subjective/qualitative attributes”!
SE 450 Software Processes & Product Metrics 20
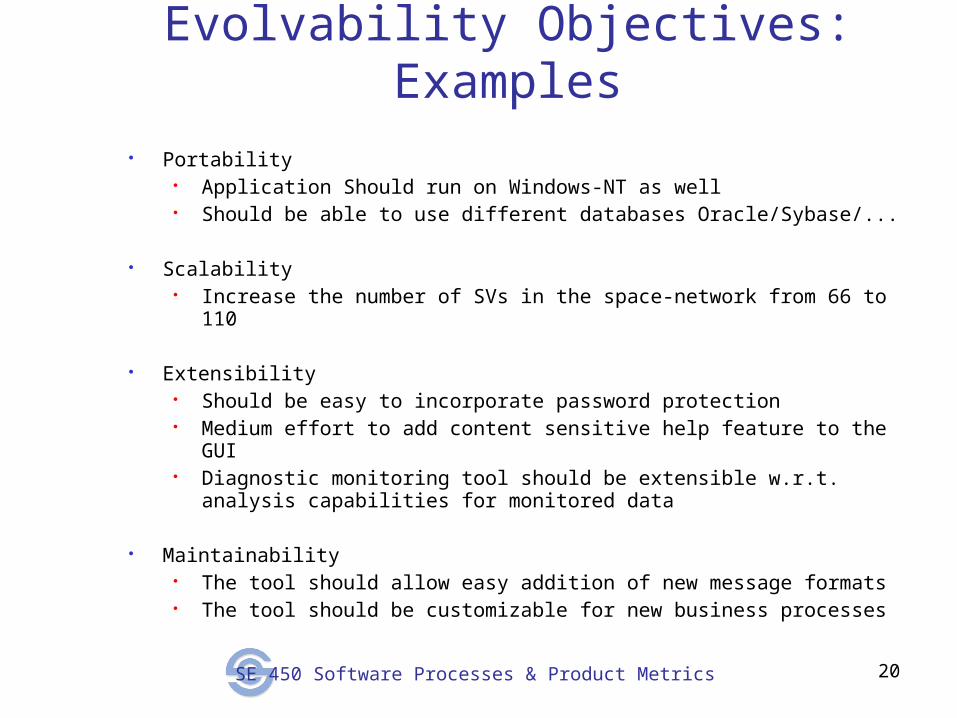
Evolvability Objectives: Examples
Portability Application Should run on Windows-NT as well Should be able to use different databases Oracle/Sybase/...
Scalability Increase the number of SVs in the space-network from 66 to 110
Extensibility Should be easy to incorporate password protection Medium effort to add content sensitive help feature to the GUI Diagnostic monitoring tool should be extensible w.r.t. analysis capabilities for
monitored data
Maintainability The tool should allow easy addition of new message formats The tool should be customizable for new business processes

SE 450 Software Processes & Product Metrics 21
Evolvability Engineering Practices
Addressing (only) those types of changes that are likely. Avoiding over-engineering. (Refactoring approach from agile programming).
Generating multiple design options and comparing their quality attributes.
Matching concerns with solutions: design patterns thinking.
Design-by-contract, built-in self-tests, test suites. To provide early detection of failures due to changes.
Changes during development itself provide feedback on evolvability.

SE 450 Software Processes & Product Metrics 22
Paramater GoalArch/Design
based ProjectionTest
ResultsBenchmark
Value
Key Product-Quality Attributes(Performance, Usability…):
Product Quality Data Chart
Evolution Req
GoalArch/Design
based ProjectionAction plan
Overall Score
Efficiency
Affect
Helpfullness
Control
Learnability
Usability score from SUMI (if used):Product Evolution Goals:
Nines goal
Nines Estimated
Nines Achieved
Availability Goal
Motorola India Electronics Ltd, 2000

SE 450 Software Processes & Product Metrics 23
Summary
Product Quality encompasses a number of attributes: “ilities”.
It is possible to systematically focus on each attribute. Specify objectives, analyze designs, measure results
during testing.
Metrics exist for some attributes but not others.
Top Related