


Languages
Pages
Legal

7/31/2019 SAMPE Baltimore May 2012
http://slidepdf.com/reader/full/sampe-baltimore-may-2012 1/13
CARBON FIBER’S SURFACE AND ITS EFFECTS ON AN
INTERPHASE FORMATION FOR ULTIMATE ADHESION-
RELATED PERFORMANCES
Felix N. Nguyen1
, Yoshifumi Nakayama2
, Daigo Kobayashi2
, Toshiya Kamae2
, KenichiYoshioka
1
1Toray Composites (America), Inc., 19002 50
thAve E, Tacoma, Washington 98446, USA
2Toray Industries, Inc., 1515, Tsutsui, Masaki-cho, Iyogun, Ehime 791-3193, JAPAN
ABSTRACT
Adhesion between a carbon fiber and a resin matrix has been documented to substantially affectadhesion-related mechanical properties of carbon fiber reinforced polymer composite (CFRP)
such as tensile, flexural, and fracture toughness. Adhesion strength generally relies on theformation of an interphase between the carbon fiber and the resin matrix, and chemical
interactions within this interphase. Nanostructures on the fiber’s surface, chemicalfunctionalities introduced by a surface treatment, and a reactive sizing material with both the
fiber’s surface and the resin are essentially critical factors. This paper discusses the uniqueness
of an intermediate modulus (IM) and high modulus (HM) carbon fiber, their surface chemistryand sizing chemistry that altogether improve adhesion strength substantially. Furthermore, when
all factors involved in the formation of the interphase were fully optimized, a tensile strength of
CFRP normalized to fiber strength and fiber volume fraction could approach 100%. Thisremarkable breakthrough is being further developed for all CFRP systems at Toray Composites
(America) Inc.
1. INTRODUCTION
When bonding carbon fibers together by a resin matrix to create a fiber reinforced polymer composite (CFRP), functional groups on the fiber’s surface is very critical. In addition, the bond
has to be durable as subjected to environmental and/or hostile conditions. Bond strength or force
per unit of interfacial area required to separate the (cured) resin from the fiber that were in
contact is a measure of adhesion. Maximum adhesion is obtained when a cohesive failure of either the resin or the fiber or both, as opposed to an adhesive failure between the fiber and the
resin, is mainly observed.
To make a strong bond, firstly oxygen functional groups on the pristine fiber’s surface must beintroduced; secondly an adhesion promoter is selected such that one end could covalently bond
to the oxygen functional groups while the other end can promote chemical interactions with thefunctional groups in the resin. Essentially, the adhesion promoter acts as a bridge connecting the
fiber to the bulk resin during curing. A surface treatment such as plasma, UV, corona discharge,
wet electro-chemical treatments is often used to introduce oxygen functional groups. Selection
of a type of surface treatment as well as a level of surface treatment depends on the surfacestructure of the pristine fiber, determined from a precursor type, a spinning process and a
7/31/2019 SAMPE Baltimore May 2012
http://slidepdf.com/reader/full/sampe-baltimore-may-2012 2/13
carbonization temperature. A successful surface treatment should provide a uniform distribution
of the oxygen functional groups on the surface without damaging the fiber and weakening it.The adhesion promoter material often called a sizing material or simply sizing or size or in other
context it might be called a surface finish. The sizing can be as simple as a silane or a polymer
to as complicated as a mixture of appropriate components to achieve adhesion-related properties
of the composite. Normally, the sizing is coated onto fibers via a wet chemical process which isin-line with the surface treatment process. Finally, the sized fibers are impregnated with the
resin, and the resulting composite is cured. Selection of a right curing method is also important.
A common method is to use an autoclave to produce the highest bonding quality. Yet, other methods such as a thermal oven, a microwave oven, a UV light, or an electron beam could also
be used, but voids might be found in the composite and thus its performances are lower.
Ultimately, to achieve the strong bond, there certainly cannot be voids at the interface between
the fiber and the resin, i.e., there is sufficient molecular contact between them upon cured.
Often, this interface is considered as a volumetric region or an interphase. The interphase canextend from the fiber’s surface a few nanometers up to several tens of micrometers, depending
on the chemical composition on the sized fiber’s surface, chemical interactions between the fiber and the bulk resin, and other chemical moieties migrating to the interface during curing [1]. The
interphase; therefore, has a very unique composition, and its properties are far different fromthose of the fiber’s surface and the bulk resin. Moreover, existence of high stress concentrations
in the interphase due to the modulus mismatch between the fiber and the resin often makes it
vulnerable to crack initiation. Such high stress concentrations could be intensified by chemicalembrittlement of the resin induced by the fiber, and local residual stress due to the thermal
expansion coefficient difference such that when a load is applied, a catastrophic failure of the
composite can be observed. As a result, an advanced interphase is critical to realize themaximum potential of carbon fibers in the composite.
The present paper introduces an innovative design methodology from Toray for such an
advanced engineering interphase (AEI) such that the resulting composite could reach a tensile
strength of 100% when normalized to strength of the carbon fiber and fiber volume (100%translation). The requirements for a stable carbon fiber’s surface and consistent surface chemical
functionalities as well as a stable sizing material for promoting a desired adhesion between the
fiber and a model resin are discussed.
2. EXPERIMENTATION
2.1. Materials
All PAN-based model carbon fibers were provided by Toray Industries, Inc. (Japan). Anintermediate modulus carbon fiber designated IM and a high modulus carbon fiber designated
HM were used for the study. A simple bisphenol-A epoxy resin system, R1, was used to study
the adhesion of the fibers to the resin while a model aerospace-grade resin, R2, was used toexamine tensile strength of the fiber composites.
7/31/2019 SAMPE Baltimore May 2012
http://slidepdf.com/reader/full/sampe-baltimore-may-2012 3/13
2.2. Methods
2.2.1. Surface Topography
A JEOL 7500F SEM equipped with a gentle beam technology and a Hitachi S-4800 SEMequipped with a deceleration beam technology both were used to examine and compare the
nanostructures on the fiber’s surfaces. Individual fibers were gently placed on an electrical tape
glued to an aluminum mount (also called ‘stud’ or ‘stub’), and inserted into a sample stage in themachine. When a negative bias voltage was applied to the stage the primary electron beam was
slowed down, and hitting the surface at a desired energy; thus surface structures is preserved
without damaging the surface. The secondary electron beam generated from the surface is thenaccelerated to the detector. The sample was observed between 1-3mm working distance, and an
accelerating voltage of less than 1kV was used.
A SPI 3800N AFM from SII NanoTechnology Inc. was used to examine surface topography of
the fibers. Individual fibers were laid flat at least one fiber distance away from one another on a
clean silicon wafer. One end of each fiber was taped onto the wafer to keep them secure.
Tapping mode was performed with a silicon cantilever (SI-DF20) having a tip radius of 10nmand a catalog spring constant of 12N/m. After the laser was aligned, the tip was set onto the
fiber such that it was parallel to the fiber’s axis. The scan direction was perpendicular to the
fiber’s axis and at a speed of 1Hz.
2.2.2. Surface chemistry
Pristine IM and HM were oxidized by a proprietary wet chemistry method to introduce a desired
amount of oxygen functional groups onto their surfaces. An x-ray photoelectron spectroscopy
(XPS) technique was used to document a change in surface chemistry of the fibers. Severalconditions of an proprietary surface treatment method were performed. A Witec Alpha300
equipped with a digital pulse forced mode (AFM-DPFM), and a Veeco (now Bruker) DimensionIcon with PeakForce QNM were used to map an adhesion force between the tip and a location on
the carbon fiber’s surface. A description of PFM method was described by Marti et al. [2-3]
while details of PeakForce QNM can be found from the manufacturer’s website. When added to
an AFM System, the PFM extends the capabilities of the microscope beyond simply measuringtopography to include the investigation of all properties described by pulsed force and force-
distance curves. In addition to adhesion, other properties such as local stiffness, viscosity,
energy dissipation, contact-time, long range forces and many more can be analyzed and imagedsimultaneously along with topography. Yet, they are not in the scope of this study.
The electronics of PeakForce QNM is essentially similar to PFM. The electronics of the DPFM
include a high speed data-acquisition system, a freely programmable modulation generator and areal-time data evaluation module. With the storage of the complete measurement, extensive
post-processing data evaluation can be easily performed.
The aforementioned procedure in Section 2.2.1 was used to prepare samples and align the tip
onto a fiber’s surface. Once a suitable applied load (set point) on the surface was found to obtain
a stable a force-curve as shown in Figure 4, as the tip was rastered across the fiber’s surface, an
7/31/2019 SAMPE Baltimore May 2012
http://slidepdf.com/reader/full/sampe-baltimore-may-2012 4/13
adhesion map along with a topography image with either 256 or 512 data points per line was
captured. Detailed operation of AFM-PFM can be referred to the manufacturer’s manual.
2.2.2. Sizing Application
Oxidized fibers were coated with an epoxy compatible sizing material to promote adhesion
between the fibers and resins R1 and R2. The fibers are called sized fibers.
2.2.3. Mechanical Tests
An adhesion test was carried out using the procedure described by Rao et al. [4] in which a fiber embedded in the resin R1 was subjected to a unidirectional tensile load until the fiber no longer
produced shorter fragments. Interfacial shear strength was determined from the strength of the
fiber, the averaged critical fragment length and the fiber’s diameter. The specimens were made by hand-picking either pristine, oxidized or sized fibers and securely placing them into a rubber
mold with eight cavities such that one fiber per cavity was allowed, impregnating resin R1 onto
the fiber and curing the mold in an oven at 75 C for 2 hr followed by 125C for 2 hr.
Tensile test was carried out according to ASTM D 3039 on 6-zero ply UD specimens. The
specimens were made as follows. Resin R2 was first casted into a thin film using a knife coater onto a release paper. The film was consolidated onto a bed of sized fibers on both sides by heat
and compaction pressure. A UD prepreg having a carbon fiber area weight of about 190g/m2
and
a resin content of about 35% was obtained. The prepregs were cut and hand laid up. Panelswere cured in an autoclave at 180
°C for 2 hr with a ramp rate of 1.7
°C/min and a pressure of 0.59
MPa.
3. RESULTS
3.1. Surface Topography and Chemistry
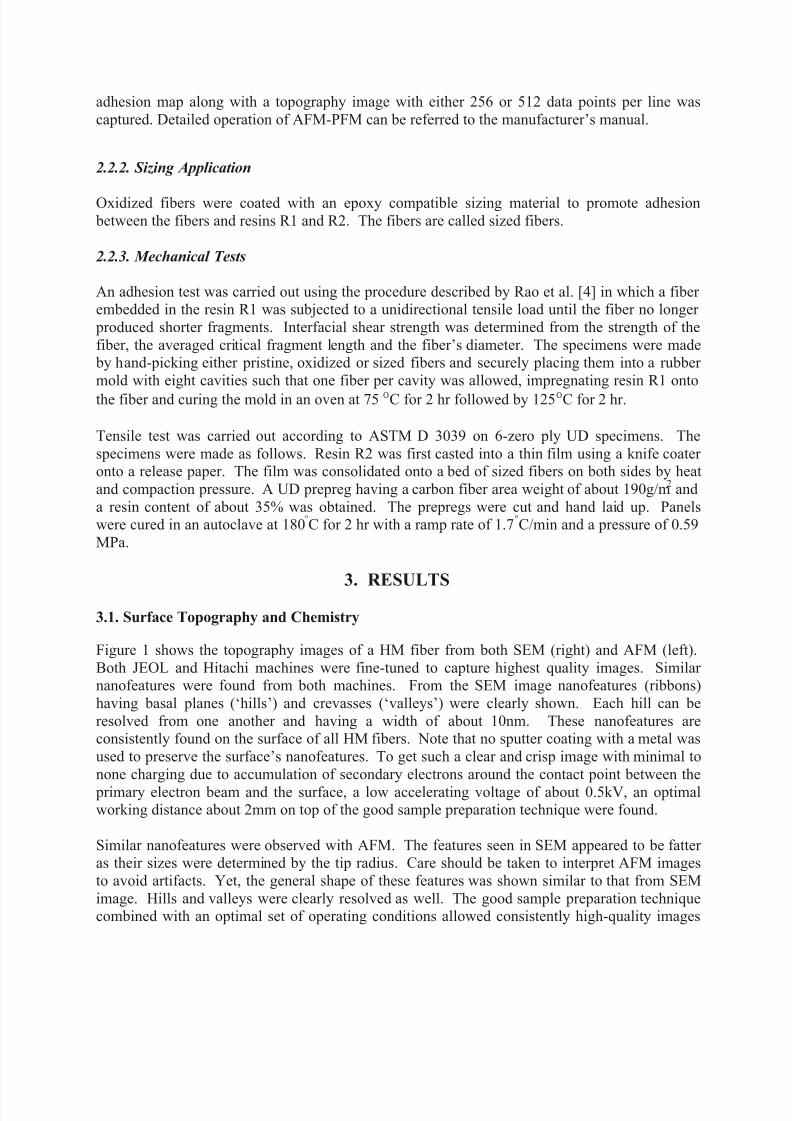
Figure 1 shows the topography images of a HM fiber from both SEM (right) and AFM (left).
Both JEOL and Hitachi machines were fine-tuned to capture highest quality images. Similar nanofeatures were found from both machines. From the SEM image nanofeatures (ribbons)
having basal planes (‘hills’) and crevasses (‘valleys’) were clearly shown. Each hill can be
resolved from one another and having a width of about 10nm. These nanofeatures areconsistently found on the surface of all HM fibers. Note that no sputter coating with a metal was
used to preserve the surface’s nanofeatures. To get such a clear and crisp image with minimal to
none charging due to accumulation of secondary electrons around the contact point between the
primary electron beam and the surface, a low accelerating voltage of about 0.5kV, an optimalworking distance about 2mm on top of the good sample preparation technique were found.
Similar nanofeatures were observed with AFM. The features seen in SEM appeared to be fatter as their sizes were determined by the tip radius. Care should be taken to interpret AFM images
to avoid artifacts. Yet, the general shape of these features was shown similar to that from SEM
image. Hills and valleys were clearly resolved as well. The good sample preparation techniquecombined with an optimal set of operating conditions allowed consistently high-quality images
7/31/2019 SAMPE Baltimore May 2012
http://slidepdf.com/reader/full/sampe-baltimore-may-2012 5/13
along the fibers to be captured. It was noted that noise could be introduced if one fiber was on
top of another, or the fiber was on top of some debris when the silicon wafer’s surface was notsufficiently cleaned. No attempt was to measure the depth of hills by SEM, but apparently it was
in the order of nanometers. Nevertheless, an averaged surface roughness could be determined by
AFM.
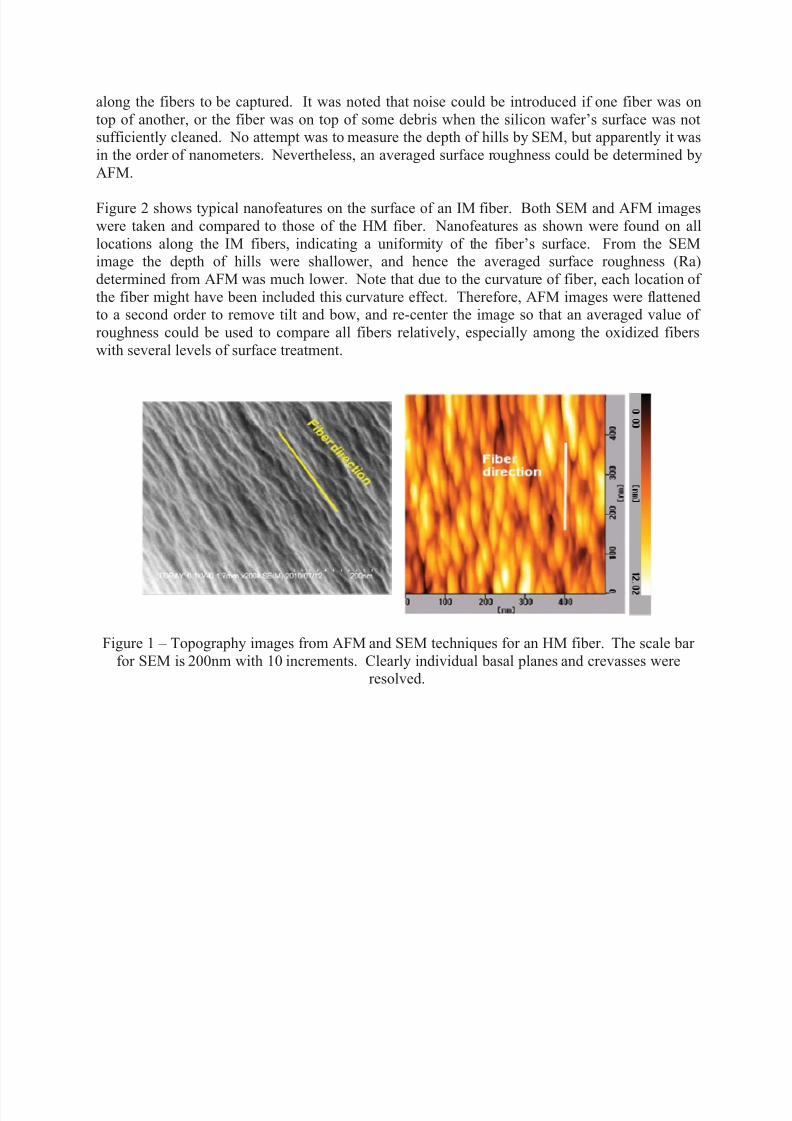
Figure 2 shows typical nanofeatures on the surface of an IM fiber. Both SEM and AFM images
were taken and compared to those of the HM fiber. Nanofeatures as shown were found on all
locations along the IM fibers, indicating a uniformity of the fiber’s surface. From the SEMimage the depth of hills were shallower, and hence the averaged surface roughness (Ra)
determined from AFM was much lower. Note that due to the curvature of fiber, each location of
the fiber might have been included this curvature effect. Therefore, AFM images were flattenedto a second order to remove tilt and bow, and re-center the image so that an averaged value of
roughness could be used to compare all fibers relatively, especially among the oxidized fibers
with several levels of surface treatment.
Figure 1 – Topography images from AFM and SEM techniques for an HM fiber. The scale bar
for SEM is 200nm with 10 increments. Clearly individual basal planes and crevasses wereresolved.
7/31/2019 SAMPE Baltimore May 2012
http://slidepdf.com/reader/full/sampe-baltimore-may-2012 6/13
Figure 2 – Topography images from AFM and SEM techniques for an HM (left) and an IM(right) fiber. Averaged surface roughness (Ra) measured by AFM is a relative value to minimize
curvature effect of the fibers.
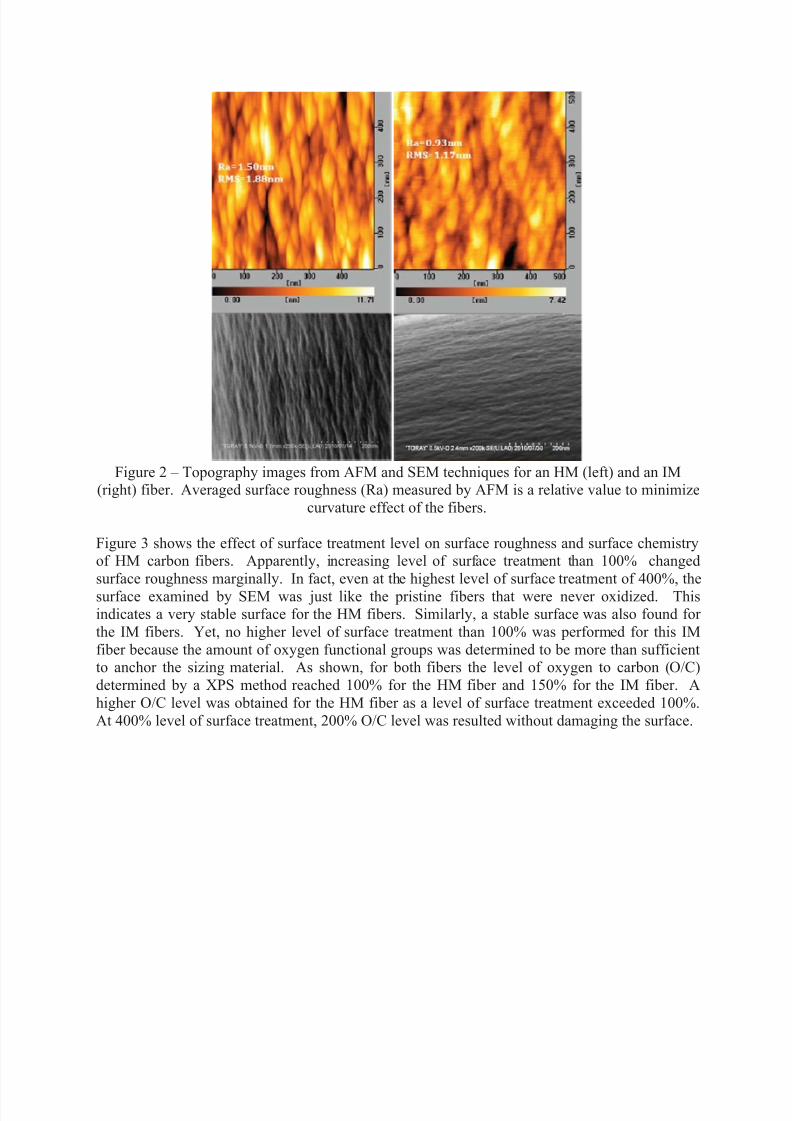
Figure 3 shows the effect of surface treatment level on surface roughness and surface chemistryof HM carbon fibers. Apparently, increasing level of surface treatment than 100% changed
surface roughness marginally. In fact, even at the highest level of surface treatment of 400%, the
surface examined by SEM was just like the pristine fibers that were never oxidized. Thisindicates a very stable surface for the HM fibers. Similarly, a stable surface was also found for
the IM fibers. Yet, no higher level of surface treatment than 100% was performed for this IM
fiber because the amount of oxygen functional groups was determined to be more than sufficientto anchor the sizing material. As shown, for both fibers the level of oxygen to carbon (O/C)
determined by a XPS method reached 100% for the HM fiber and 150% for the IM fiber. A
higher O/C level was obtained for the HM fiber as a level of surface treatment exceeded 100%.
At 400% level of surface treatment, 200% O/C level was resulted without damaging the surface.
7/31/2019 SAMPE Baltimore May 2012
http://slidepdf.com/reader/full/sampe-baltimore-may-2012 7/13
Figure 3 – Effects of surface treatment levels on surface roughness and surface chemistry. While
a substantial increase in surface functional groups with increasing surface treatment level, amodest increase in relative surface roughness was observed.
3.2. Surface Chemistry Mapping
Oxygen functional groups on a fiber’s surface is critical to allow an adhesion promoter or a
sizing material to act as a bridge connecting the fiber to the bulk resin. The pristine fiber istypically inert as all functional groups were removed during a carbonization process. To promote
oxygen functional groups on the surface, the surface is needed to be oxidized. Since the
alignment of graphitic crystallites are different between intermediate and high modulus fibers
[5], a level of surface treatment has to be optimized to achieve a desired density of thesefunctional groups on each type of fibers. The total amount of these functional groups can be
determined through an XPS method or an acid/base titration method. A general idea onuniformity and distribution of these functional groups on the surface could be accessed through a
degree of variation of average values from many XPS measurements. Yet, it is very expensive
and time consuming, but might not represent the whole lot of carbon fibers, if a stable surfacedoes not exist.
Here in this paper an attempt was made to investigate the spatial distribution of the surface
functional groups on the IM and HM fibers with different levels of O/C through a mappingtechnique of adhesion force between an AFM tip and the surface by a pulse forced mode (PFM).
Chemical force microscopy (CFM) with point-by-point measurement between an AFM tip and a
flat surface has been studied extensively [6]. Yet, AFM-PFM is much less time consumingcompared CFM as hundreds of thousands of data points can be obtained very quickly by a raster
method of the tip across the surface. This AFM-PFM method has been used extensively on a flat
surface [2-3, 7], but to our knowledge it has not been used on a curved surface of carbon fibers.
7/31/2019 SAMPE Baltimore May 2012
http://slidepdf.com/reader/full/sampe-baltimore-may-2012 8/13
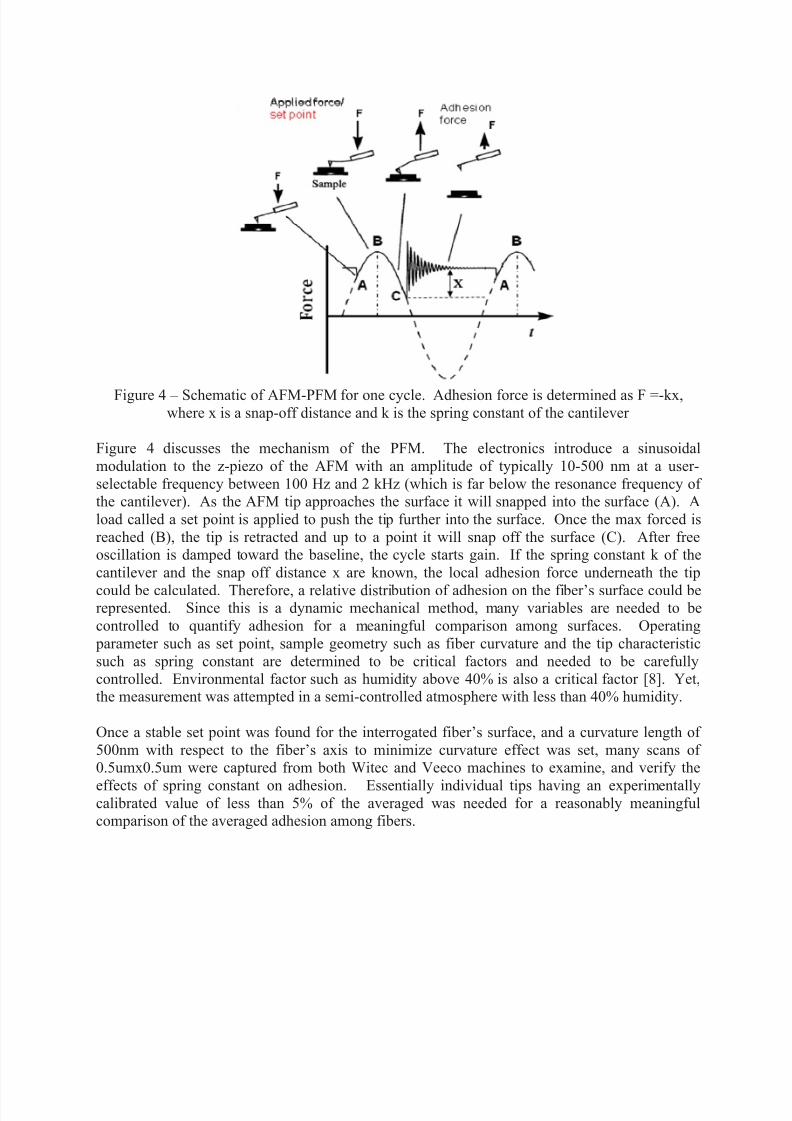
Figure 4 – Schematic of AFM-PFM for one cycle. Adhesion force is determined as F =-kx,where x is a snap-off distance and k is the spring constant of the cantilever
Figure 4 discusses the mechanism of the PFM. The electronics introduce a sinusoidal
modulation to the z-piezo of the AFM with an amplitude of typically 10-500 nm at a user-
selectable frequency between 100 Hz and 2 kHz (which is far below the resonance frequency of the cantilever). As the AFM tip approaches the surface it will snapped into the surface (A). A
load called a set point is applied to push the tip further into the surface. Once the max forced is
reached (B), the tip is retracted and up to a point it will snap off the surface (C). After freeoscillation is damped toward the baseline, the cycle starts gain. If the spring constant k of the
cantilever and the snap off distance x are known, the local adhesion force underneath the tip
could be calculated. Therefore, a relative distribution of adhesion on the fiber’s surface could berepresented. Since this is a dynamic mechanical method, many variables are needed to be
controlled to quantify adhesion for a meaningful comparison among surfaces. Operating
parameter such as set point, sample geometry such as fiber curvature and the tip characteristic
such as spring constant are determined to be critical factors and needed to be carefullycontrolled. Environmental factor such as humidity above 40% is also a critical factor [8]. Yet,the measurement was attempted in a semi-controlled atmosphere with less than 40% humidity.
Once a stable set point was found for the interrogated fiber’s surface, and a curvature length of
500nm with respect to the fiber’s axis to minimize curvature effect was set, many scans of 0.5umx0.5um were captured from both Witec and Veeco machines to examine, and verify the
effects of spring constant on adhesion. Essentially individual tips having an experimentallycalibrated value of less than 5% of the averaged was needed for a reasonably meaningfulcomparison of the averaged adhesion among fibers.
7/31/2019 SAMPE Baltimore May 2012
http://slidepdf.com/reader/full/sampe-baltimore-may-2012 9/13
(A) Pristine HM
(B) Oxidized HM
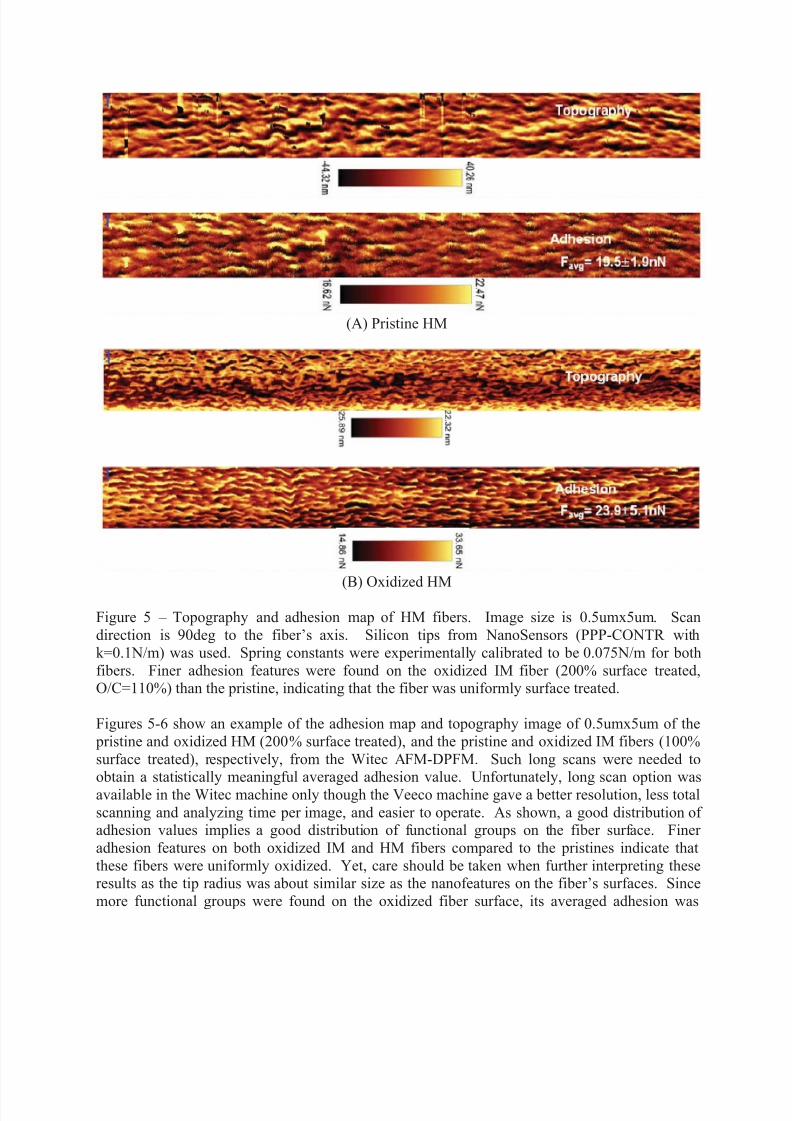
Figure 5 – Topography and adhesion map of HM fibers. Image size is 0.5umx5um. Scan
direction is 90deg to the fiber’s axis. Silicon tips from NanoSensors (PPP-CONTR with
k=0.1N/m) was used. Spring constants were experimentally calibrated to be 0.075N/m for both
fibers. Finer adhesion features were found on the oxidized IM fiber (200% surface treated,O/C=110%) than the pristine, indicating that the fiber was uniformly surface treated.
Figures 5-6 show an example of the adhesion map and topography image of 0.5umx5um of the
pristine and oxidized HM (200% surface treated), and the pristine and oxidized IM fibers (100%
surface treated), respectively, from the Witec AFM-DPFM. Such long scans were needed toobtain a statistically meaningful averaged adhesion value. Unfortunately, long scan option was
available in the Witec machine only though the Veeco machine gave a better resolution, less total
scanning and analyzing time per image, and easier to operate. As shown, a good distribution of adhesion values implies a good distribution of functional groups on the fiber surface. Finer
adhesion features on both oxidized IM and HM fibers compared to the pristines indicate that
these fibers were uniformly oxidized. Yet, care should be taken when further interpreting theseresults as the tip radius was about similar size as the nanofeatures on the fiber’s surfaces. Since
more functional groups were found on the oxidized fiber surface, its averaged adhesion was
7/31/2019 SAMPE Baltimore May 2012
http://slidepdf.com/reader/full/sampe-baltimore-may-2012 10/13
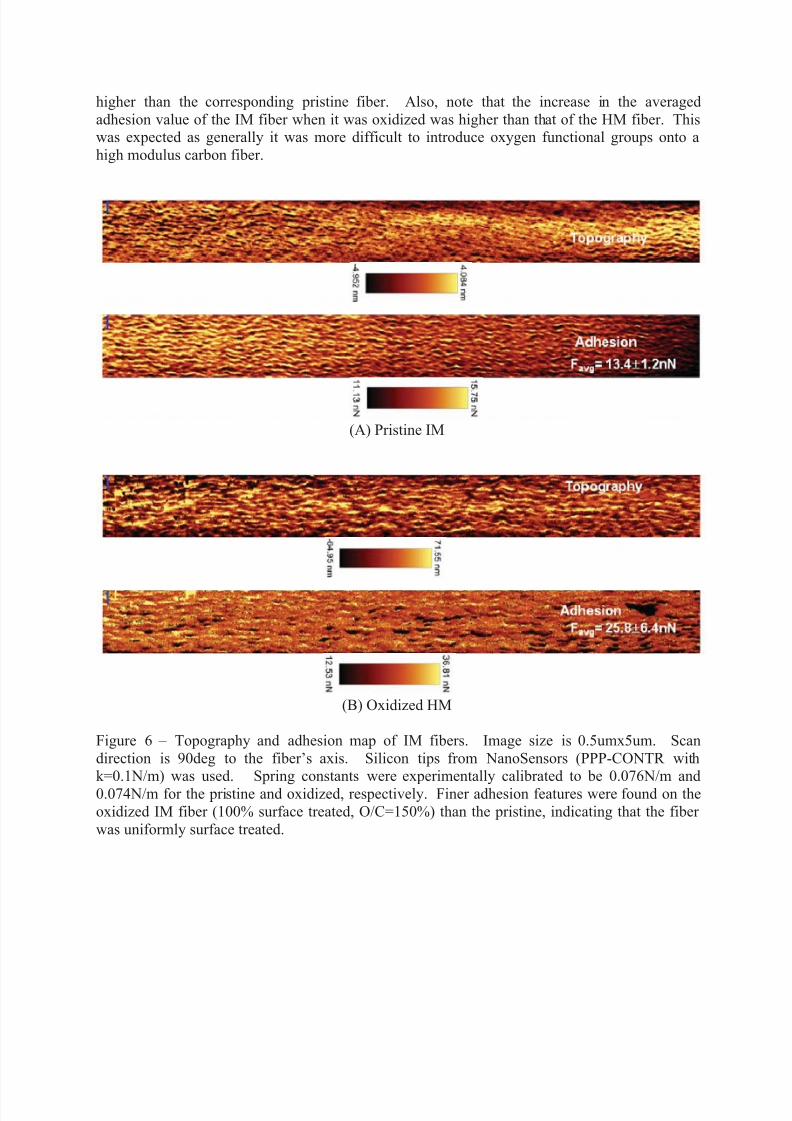
higher than the corresponding pristine fiber. Also, note that the increase in the averaged
adhesion value of the IM fiber when it was oxidized was higher than that of the HM fiber. Thiswas expected as generally it was more difficult to introduce oxygen functional groups onto a
high modulus carbon fiber.
(A) Pristine IM
(B) Oxidized HM
Figure 6 – Topography and adhesion map of IM fibers. Image size is 0.5umx5um. Scan
direction is 90deg to the fiber’s axis. Silicon tips from NanoSensors (PPP-CONTR withk=0.1N/m) was used. Spring constants were experimentally calibrated to be 0.076N/m and
0.074N/m for the pristine and oxidized, respectively. Finer adhesion features were found on the
oxidized IM fiber (100% surface treated, O/C=150%) than the pristine, indicating that the fiber
was uniformly surface treated.
7/31/2019 SAMPE Baltimore May 2012
http://slidepdf.com/reader/full/sampe-baltimore-may-2012 11/13
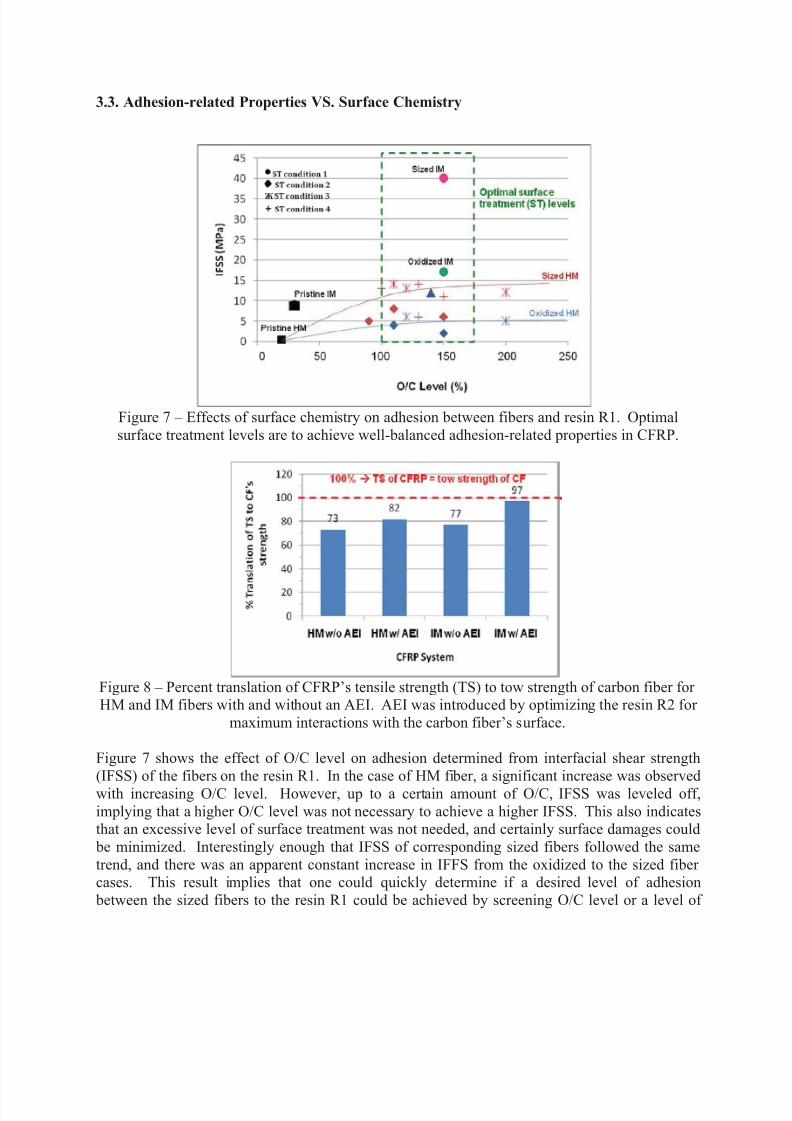
3.3. Adhesion-related Properties VS. Surface Chemistry
Figure 7 – Effects of surface chemistry on adhesion between fibers and resin R1. Optimal
surface treatment levels are to achieve well-balanced adhesion-related properties in CFRP.
Figure 8 – Percent translation of CFRP’s tensile strength (TS) to tow strength of carbon fiber for HM and IM fibers with and without an AEI. AEI was introduced by optimizing the resin R2 for
maximum interactions with the carbon fiber’s surface.
Figure 7 shows the effect of O/C level on adhesion determined from interfacial shear strength
(IFSS) of the fibers on the resin R1. In the case of HM fiber, a significant increase was observed
with increasing O/C level. However, up to a certain amount of O/C, IFSS was leveled off,
implying that a higher O/C level was not necessary to achieve a higher IFSS. This also indicatesthat an excessive level of surface treatment was not needed, and certainly surface damages could
be minimized. Interestingly enough that IFSS of corresponding sized fibers followed the same
trend, and there was an apparent constant increase in IFFS from the oxidized to the sized fiber cases. This result implies that one could quickly determine if a desired level of adhesion
between the sized fibers to the resin R1 could be achieved by screening O/C level or a level of
7/31/2019 SAMPE Baltimore May 2012
http://slidepdf.com/reader/full/sampe-baltimore-may-2012 12/13
surface treatment. SFFT then could be used to confirm the screening results. Note that in this
study, SEM was also used to examine the sized fiber’s surfaces. Yet, no difference between the pristine surface and sized fiber’s surface, indicating a uniform layer of a few nanometers of the
sizing material might be coated on the oxidized fibers. No attempts to determine the real
thickness of this layer as well as to map adhesion on these sized fibers were performed.
In the case of IM fiber similar tendencies were achieved in that higher IFSS was found for both
oxidized and sized fiber than the pristine case. Yet, IFSS of the sized IM fiber case was found
more than twice than the sized HM fiber, though the O/C level of these fibers were similar.Typically a HM fiber has about 20% lower strength than an IM fiber. Therefore, such significant
difference in IFSS could involve other factors such as the type of functional groups on each
fiber, their distribution, and more importantly the chemical interactions among the sizingmaterial, the surface functional groups and the resin R1. In other words, the interphase in the IM
and HM cases might be different.
After examined the fracture surface of tensile strength specimens with SEM, it was found that
cohesive failure occurred for the IM case, but interfacial failure for the HM case. Essentially, aninterfacial layer could have formed in both cases. Yet, it retained in the IM case, but came off in
the HM case. Nevertheless when tensile strength of IMCFRP and HMCFRP were normalized tostrength of the corresponding carbon fiber and fiber volume (% translation), a translation of
about 75% was found for both IMCFRP and HMCFRP (Figure 8). This indicates that a
sufficient adhesion might have been achieved in the HMCFRP. To further reinforce theinterfacial layer so that it could be retained in the HMCFRP system after fractured, an advanced
engineering interphase (AEI) was introduced by further optimizing the resin R2 system for
maximum interactions with the fiber’s surface. That resulted in about 10% increase intranslation, and cohesive failure finally occurred. A similar optimization performed on the
IMCFRP system remarkably yielded almost 100% translation, which is far beyond the currentstate of the art allowing the highest value between 80-90%.
4. CONCLUSIONS
The present study has shown unique surface nanofeatures of IM and HM fibers examined by
both SEM and AFM techniques. Both fibers were shown to have a very stable surface. A
surface treatment while produced more than sufficient amount of O/C level for an interphase
formation with the sizing material and the resin, surface roughness changed marginally only.AFM-PFM technique showed that finer adhesion features were found when HM and IM fibers
were oxidized at 200% and 100% level, respectively. This implies that a uniform distribution of
oxygen functional groups on the oxidized fiber’s surfaces might be achieved.
A unique and stable carbon fiber surface, a sufficient amount and uniform distribution of
functional groups, a uniform layer of the sizing material coated on the oxidized fiber, and anoptimized resin aerospace-grade system altogether contribute to a successful AEI that allowed
TS of IMCFRP to approach a translation of 100% strength of the IM fibers. The AEI also
changed interfacial failure mode in HMCFRP to cohesive failure of the resin. Yet, more work is being conducted at Toray Composites (America) Inc. to increase the translation of HMCFRP to
90% or higher.
7/31/2019 SAMPE Baltimore May 2012
http://slidepdf.com/reader/full/sampe-baltimore-may-2012 13/13
5. ACKNOWLEDEMENTS
Helpful discussions and supports by Prof. D. Eric Aston and Dr. Jamie M.F. Jabal of University
of Idaho, Department of Chemical and Materials Engineering, Moscow, ID are gratefullyacknowledged.
The authors also would like to thank Surface Analysis Recharge Center (SARC) of University of Washington, Department of Bioengineering, Seattle, WA for the use of AFM facility.
6. REFERENCES
1. Drzal L.T., Rich M.J., Lloyd P.F., “Adhesion of graphite fibers to epoxy matrices: I. Therole of fiber surface treatment”, J. Adhesion 16, 1-30 (1982)
2. Krotil H.U., Stifter T., Waschipky H., Weshaupt K., Hild S., Marti O., “Pulse force mode: a
new method for the investigation of surface properties”, Surface and Interphase Analysis 27,
336 (1999).
3. Rosa-Zeiser A., Weilandt E., Hild S. and Marti O., “The simultaneous measurement of elastic, electrostatic and adhesive properties by scanningforce microscopy: pulsed-force
mode operation”, Measurement Science and Technology 8, 1333 (1997).
4. Rao V., Drzal L.T., “The dependence of interfacial shear strength on matrix and interphase
properties”, Polymer Composites 12, 48 (1991)
5. Deurbergue A., Oberlin A., “TEM study of some recent high modulus pan-based carbonfibers “, Carbon 30, 981 (1992)
6. Noy A., Vezenov D., and Lieber C., “Chemical force microscopy”, Annual Review Materials
Science 27, 381–421 (1997)7. Miyatani T., Okamoto S., Rosa A., Marti O., Fujihira M.,” Surface charge mapping of solid
surfaces in water by pulsed-force-mode atomic force microscopy”, Applied Physics A 66,
S349–S352 (1998)
8. He M., Blum A.S., Aston E.D., Buenviaje C., Overney R.” Critical phenomena of water
bridges in nanoasperity contacts”, J. Chemical Physics 114, 1135 (2001)
Top Related