


Languages
Pages
Legal

El SalvadorCentral America
Cultural Presentation
!(
!(
!(
!(
!(
!(
!(
!(
!(
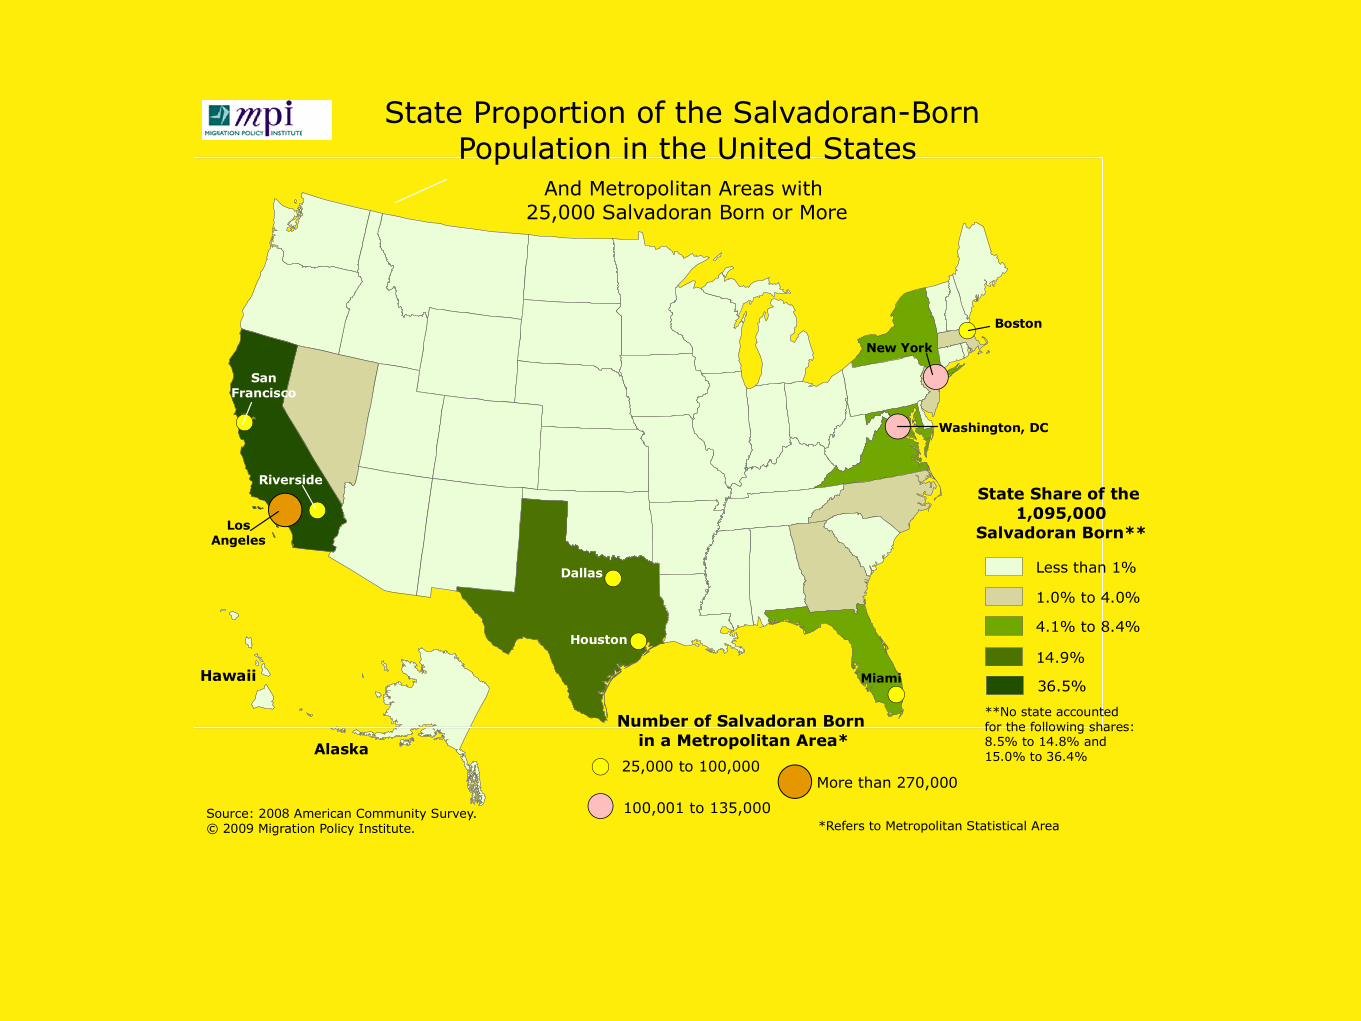
State Proportion of the Salvadoran-Born Population in the United States
Source: 2008 American Community Survey.© 2009 Migration Policy Institute.
And Metropolitan Areas with 25,000 Salvadoran Born or More
Number of Salvadoran Born
in a Metropolitan Area*Alaska
Hawaii
25,000 to 100,000
100,001 to 135,000
More than 270,000
*Refers to Metropolitan Statistical Area
San
Francisco
Miami
Boston
Riverside
New York
Washington, DC
Los
Angeles
Dallas
!(
!(!(
State Share of the
1,095,000
Salvadoran Born**
**No state accounted for the following shares:8.5% to 14.8% and 15.0% to 36.4%
Less than 1%
1.0% to 4.0%
4.1% to 8.4%
14.9%Houston
36.5%
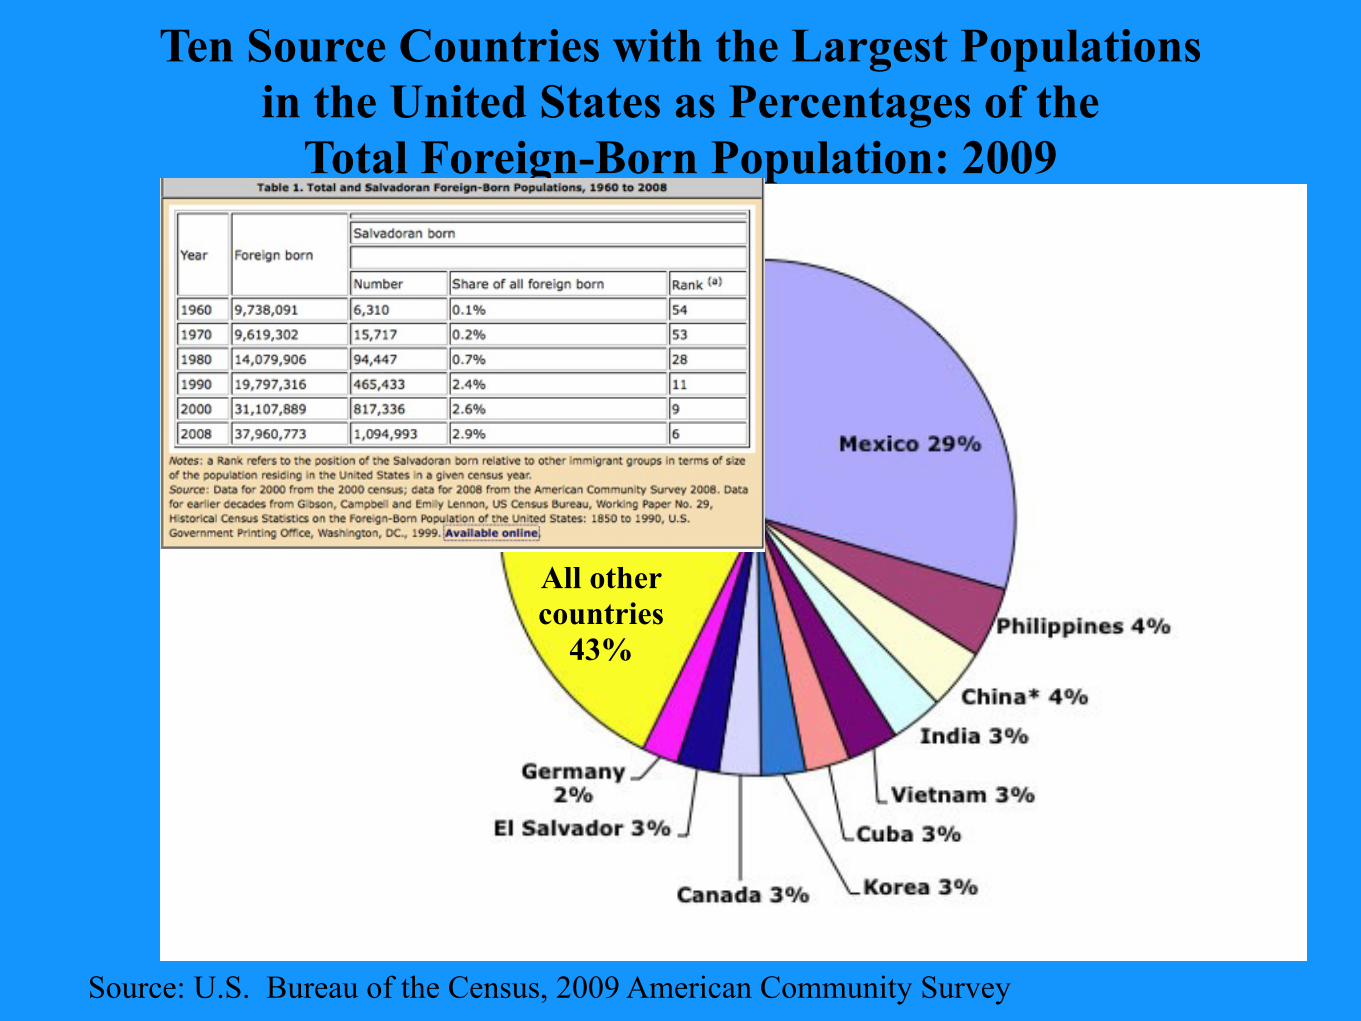
Ten Source Countries with the Largest Populations in the United States as Percentages of the
Total Foreign-Born Population: 2009
Source: U.S. Bureau of the Census, 2009 American Community Survey
All other countries
43%

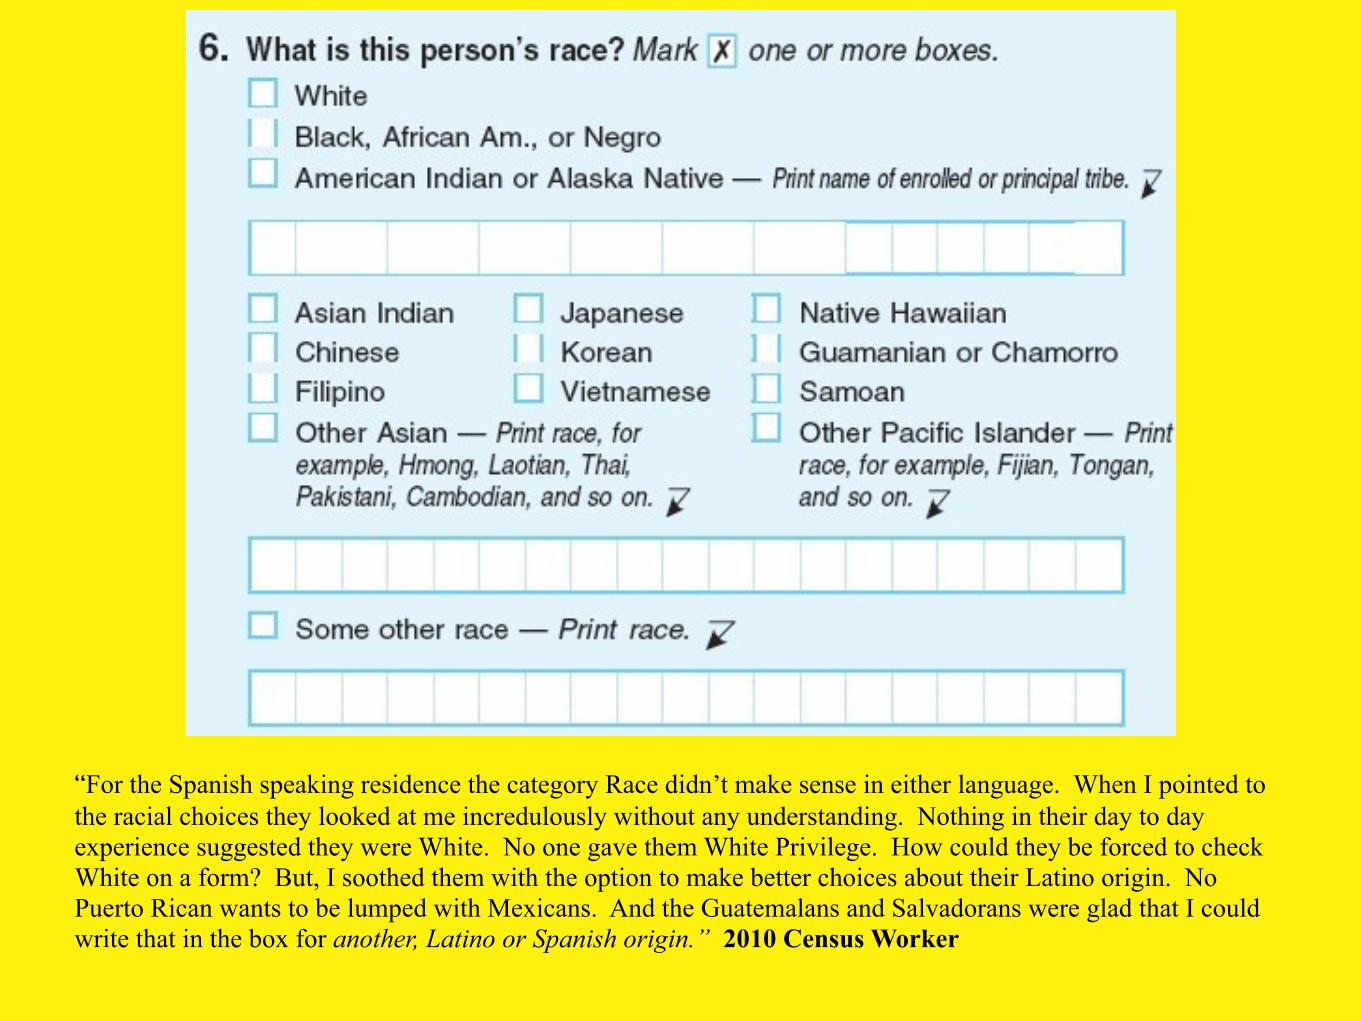
“For the Spanish speaking residence the category Race didn’t make sense in either language. When I pointed to the racial choices they looked at me incredulously without any understanding. Nothing in their day to day experience suggested they were White. No one gave them White Privilege. How could they be forced to check White on a form? But, I soothed them with the option to make better choices about their Latino origin. No Puerto Rican wants to be lumped with Mexicans. And the Guatemalans and Salvadorans were glad that I could write that in the box for another, Latino or Spanish origin.” 2010 Census Worker
Salvadoran Immigrants in the United States
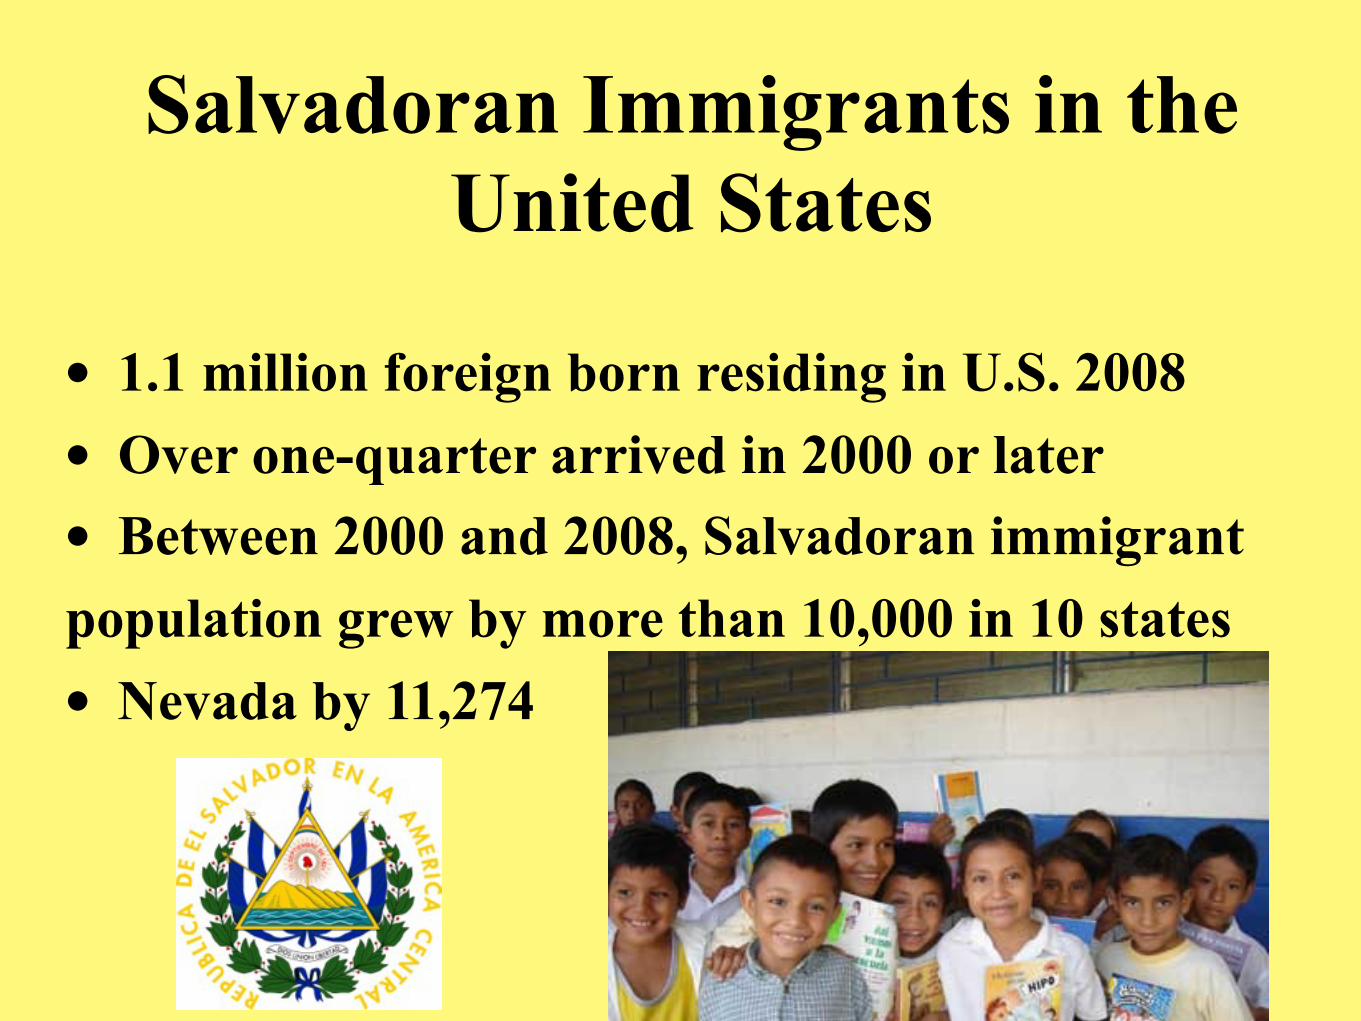
Salvadoran Immigrants in the United States
• 1.1 million foreign born residing in U.S. 2008• Over one-quarter arrived in 2000 or later• Between 2000 and 2008, Salvadoran immigrant population grew by more than 10,000 in 10 states• Nevada by 11,274
Salvadoran Immigrant English & High School Education in
United States
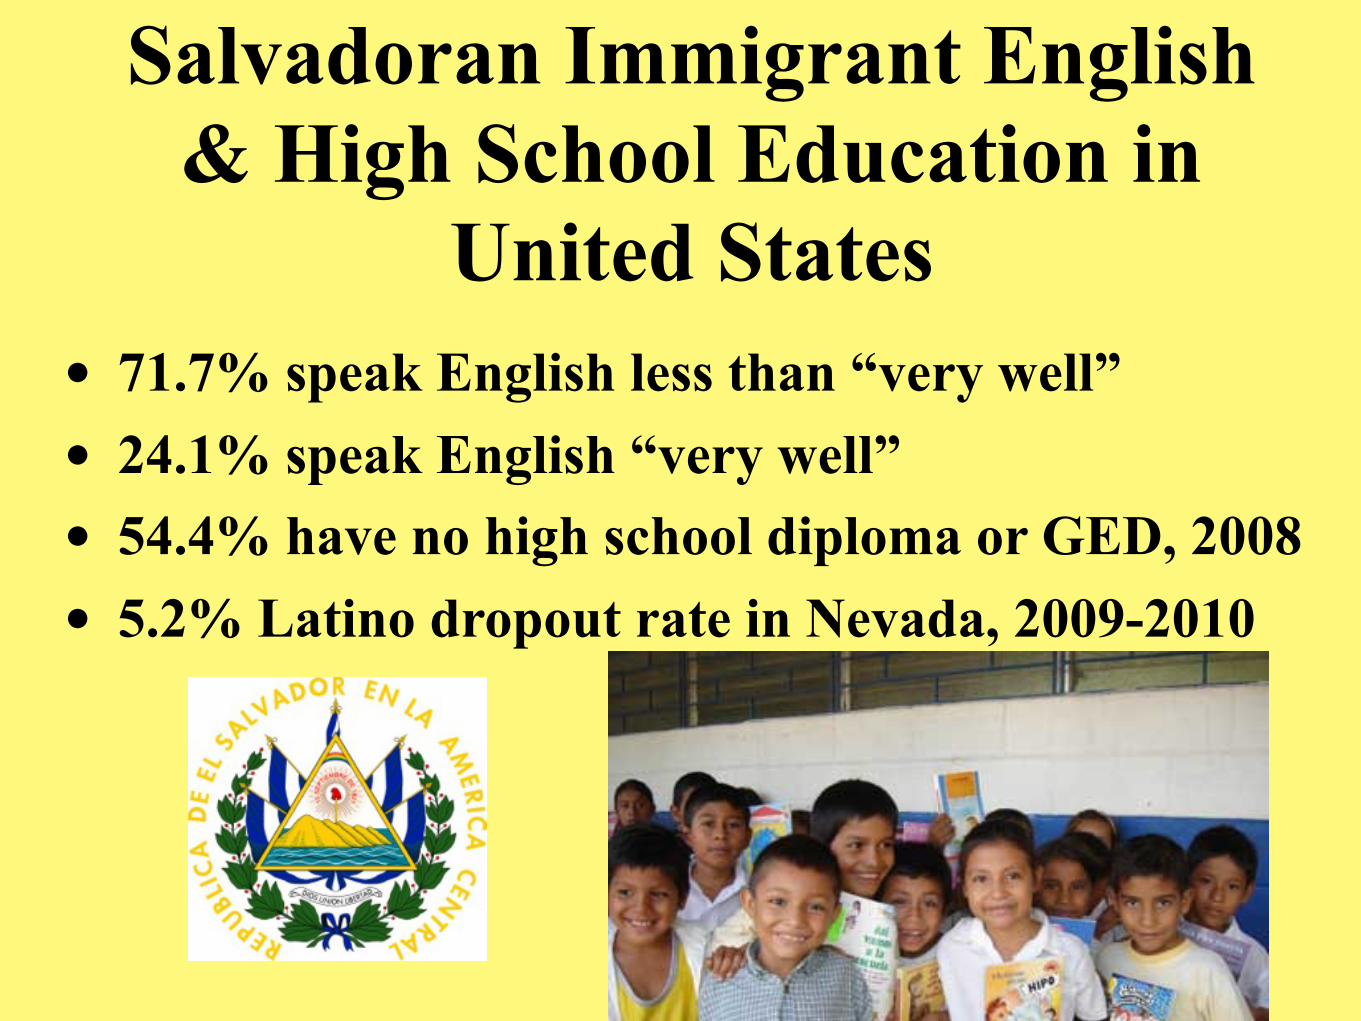
Salvadoran Immigrant English & High School Education in
United States• 71.7% speak English less than “very well”• 24.1% speak English “very well”• 54.4% have no high school diploma or GED, 2008• 5.2% Latino dropout rate in Nevada, 2009-2010

from Innocent Voices, 2004
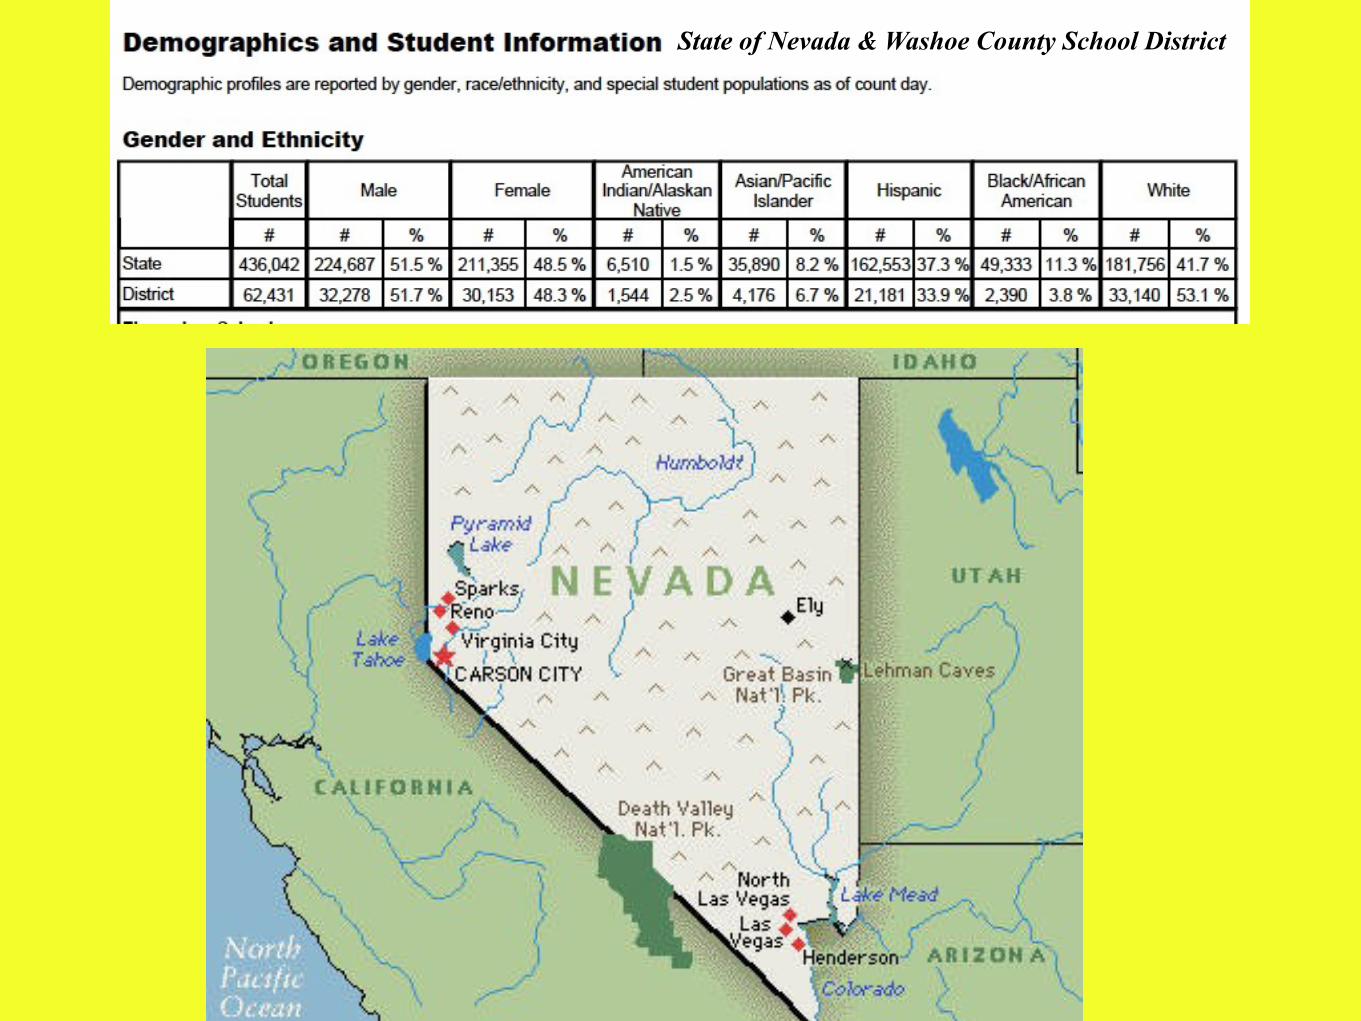
State of Nevada & Washoe County School District
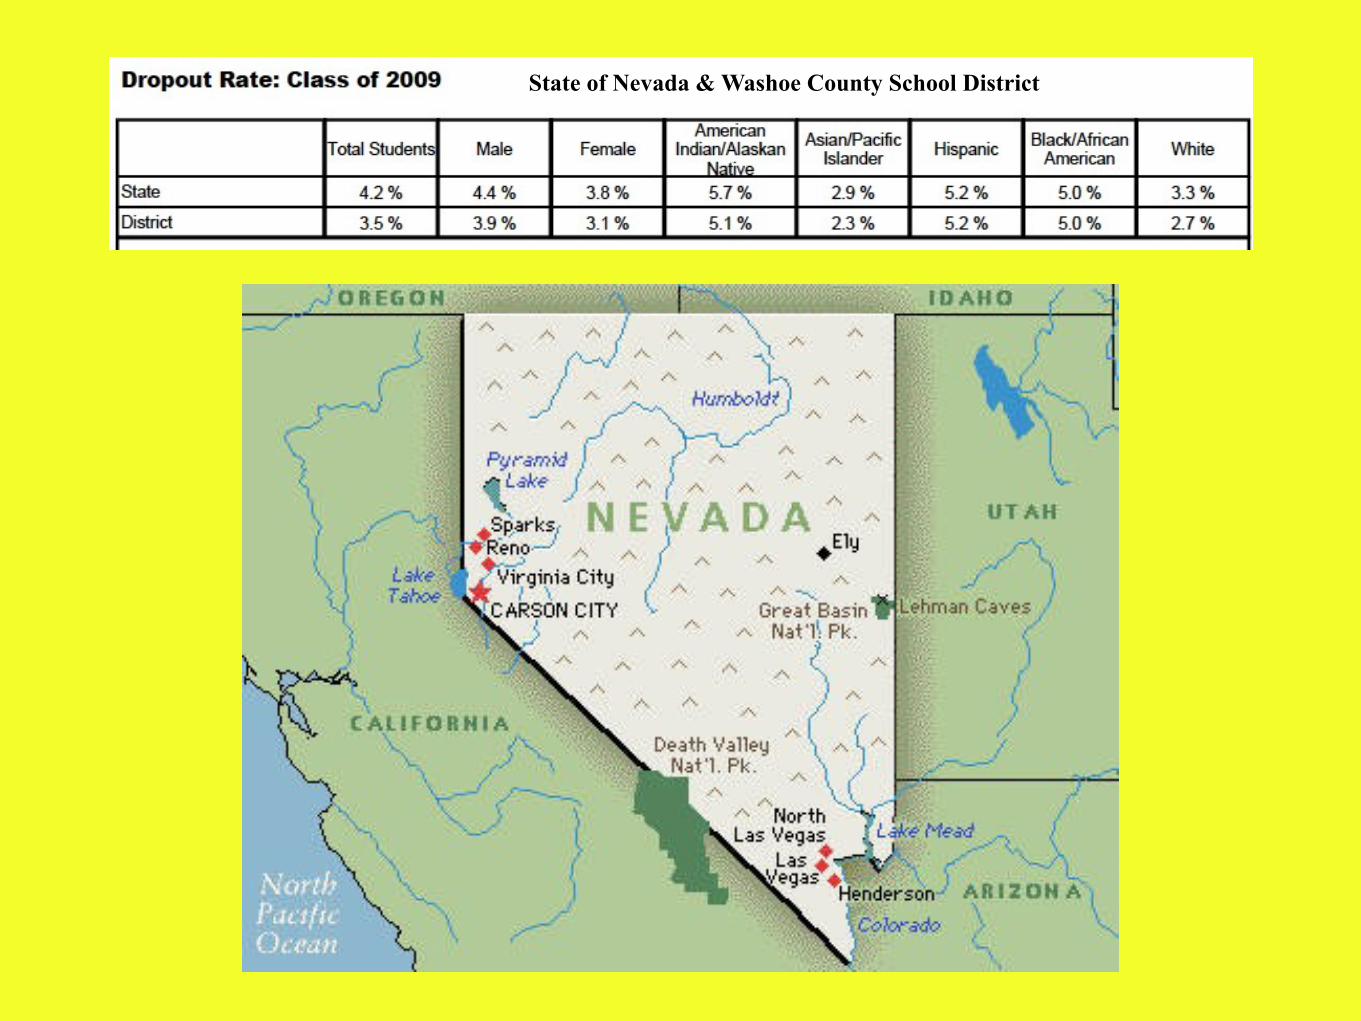
State of Nevada & Washoe County School District

8 Recommendations for Improving the Achievement of
Hispanic/Latino Students
1. Implement a district wide plan.
2. Recruit bilingual teachers.
3. Conduct ongoing professional development.
4. Provide ELL program articulation within schools.
5. Recognize and respect heritage.
6. Provide academic and emotional support.
7. Engage in authentic conversations.
8. Seek outside facilitation.
Source: Journal of Latinos and Education
8 Recommendations for Improving the Achievement of
Hispanic/Latino Students
Source: Journal of Latinos and Education

Nelson Clip
Top Related