


Languages
Pages
Legal


REPORT FROM VALLEY VISION
Sacramento County
Community Health Needs Assessment
Prepared for:
The Healthy Sacramento Coalition
September 2012

REPORT FROM VALLEY VISION
This community health needs assessment was commissioned by Sierra Health Foundation on behalf of
the Healthy Sacramento Coalition. The Healthy Sacramento Coalition is supported by a Community
Transformation Grant from the Centers for Disease Control and Prevention1. In addition to CDC, funding
support for the community health needs assessment activities was provided by Sierra Health
Foundation. The analyses presented were conducted by Valley Vision. The consultant team (listed
alphabetically) included:
Dale Ainsworth, PhD
Heather Diaz, DrPH
Mathew C. Schmidtlein, PhD
Acknowledgements
Thank you to the Healthy Sacramento Coalition members, Community Partners, community members,
and policy and program key informants who contributed their time, expertise and involvement to the
development of this community health assessment.
1 The views expressed in this project do not necessarily reflect the official policies of the CDC or imply endorsement
by the U.S. Government.

REPORT FROM VALLEY VISION
i
Results in Brief
This Community Health Needs Assessment is a companion to the report, The Chronic Disease Experience
of Sacramento County Residents, prepared by Sacramento County’s Division of Public Health in the
Department of Health and Human Services. Both reports are part of the collaborative work of the
Healthy Sacramento Coalition to prioritize health needs within Sacramento County and develop
strategies and mobilize resources to improve the health of county residents. The Healthy Sacramento
Coalition is funded by a Community Transformation Grant (CTG) from the Centers for Disease Control
and Prevention (CDC). The CTG Program’s overarching goal is to create healthier communities by making
healthy living easier and more affordable. Sacramento County is one of six counties in California
awarded CTG funding to build capacity to support healthy lifestyles and reduce health disparities.
Sacramento County covers nearly 1,000 square miles and is home to more than 1.4 million people.
Through the Healthy Sacramento Coalition, Sacramento’s CTG Program is identifying evidence-based
strategies to promote tobacco-free living, active living and healthy eating, quality clinical and other
preventive services, healthy and safe physical environments, and social and emotional wellness.
A primary purpose of the Community Health Needs Assessment was the identification and description of
areas in Sacramento County that are experiencing higher rates of chronic diseases and other health
concerns than other areas of the county.
Areas Experiencing Health Disparities The assessment identified 15 of Sacramento County’s 58 zip codes as experiencing high rates of health
disparities relative to the county as a whole and to other areas of the county. The 15 zip codes cluster
into three communities – North Sacramento, Downtown and South Sacramento.
Focus Communities Zip Codes Neighborhoods (all or a part of)
North Sacramento 95660, 95673, 95815, 95821, 95838, 95841
North Highlands, Rio Linda, Old North Sacramento, Woodlake, Del Paso Manor, Del Paso Heights, Belmont Estates
Downtown Sacramento 95811, 95814 Downtown: Richards, Alkali Flats, Mansion Flats, Midtown, Richmond Grove, Southside Park
South Sacramento 95817, 95820, 95822, 95823, 95824, 95828, 95832
Oak Park, Elmhurst, Tahoe Park, Land Park, Parkway, Valley Hi/North Laguna, City Farms, Fruitridge Manor, Florin, Meadowview
Infant mortality and mortality
Sacramento County as a whole had an infant mortality rate of 5.8 deaths/1,000 live births and an age-
adjusted mortality rate due to all causes of 71 deaths for every 10,000 people.
In the North Sacramento Focus Community, Del Paso Heights (95838) had the highest rate of infant
mortality in Sacramento County with a rate of 6.73 deaths/1,000 live births. The Old North
Sacramento/Woodlake neighborhood (95815) had the highest age-adjusted overall mortality rate in
Sacramento County at 95 deaths per 10,000 population. More residents died in this zip code
annually due to all causes than any other in the county.

REPORT FROM VALLEY VISION
ii
In the Downtown Focus Community, the infant mortality rates were not markedly different from the
county and state overall, but the downtown neighborhood of 95814 had the third highest age-
adjusted overall mortality rate in Sacramento County.
Three neighborhoods in the South Sacramento Focus Community had the second, third, and fourth
highest rates of infant mortality in the county. One of the neighborhoods had the fourth highest
age-adjusted overall mortality rate in the county.
Tobacco-Free Living
Although most counties that have major urban areas have smoking prevalence rates below the state
average of 11.6%, Sacramento County is considerably above with a rate of 14.0%.
Individual neighborhoods have even higher rates: Almost one-third of the adult residents of the Old
North Sacramento, Woodlake (95815) neighborhood described themselves as current smokers.
Downtown (95814) has rates of tobacco-related emergency department visits and hospitalizations
more than twice that of the county rate. All but one of the 15 neighborhoods have tobacco-related
emergency department visit and hospitalization rates higher than the county rate.
Active Living and Healthy Eating
Of the 10 zip codes in the county with the highest rates of diabetes-related mortality, eight are in
the Focus Communities.
Out of the county’s 58 zip codes, 20 have rates of diabetes-related visits to the emergency
department higher than the county rate. Fourteen of the 20 come from the Focus Communities.
In the county, rates of diabetes-related hospitalizations range from 40/10,000 in zip code 95680 to
377/10,000 in Downtown (95814). Nine of the 10 neighborhoods with the highest rates come from
the Focus Communities.
In several of the neighborhoods, more than 50% of the residents aged 12 and over were overweight
or obese.
Food deserts were found in all three Focus Communities, with the largest areas in North
Sacramento.
Although there are pockets in each area with access to healthy food from retail outlets, large parts
of the three Focus Communities have low proportions - 13% or less - of food retailers serving
healthy food.
High proportions of the North Sacramento and Downtown Focus Communities had access to parks
and were defined as “walkable”. However safety was a barrier to taking advantage of these
resources.
Clinical Preventive and Other Services
The Downtown 95814 neighborhood has the highest rates of heart disease and hypertension (and
diabetes) as measured by both emergency department visits and hospitalizations of any other zip
code in the county. Compared to the county rate, its rates are either more than or close to twice as
high as the overall county rate.

REPORT FROM VALLEY VISION
iii
Residents of the Downtown 95814 neighborhood died at the fourth highest rate in the county due
to heart disease. All but two of the 15 neighborhoods exceeded the county rate for heart disease-
related mortality.
The Parkway, Valley Hi/North Laguna neighborhood (95823) had the highest rate of hypertension-
related mortality in the county; five of the 15 neighborhoods were in the top 10 zip codes for
hypertension mortality.
In fourteen of the fifteen neighborhoods in the Focus Communities, rates for asthma-related
emergency department visits were above the county rate of 201 emergency department
visits/10,000 population and the state rate of 123 emergency department visits/10,000 population.
Three of the top five highest rates in all 58 Sacramento County zip codes were found in Parkway,
Valley Hi/North Laguna (95823), Downtown (95814), Old North Sacramento, Woodlake (95815).
Significant portions of the North Sacramento and Downtown Focus Communities have been
identified as Health Professional Shortage Areas by the federal Health Resources and Services
Administration.
Social and Emotional Wellness
Rates of emergency department visits and hospitalizations due to mental illness in the Downtown
95814 neighborhood are the highest of the 58 zip codes and dramatically higher than the county
rate. Several of the other neighborhoods also have elevated rates relative to the county overall.
The data on hospitalizations and emergency department visits related to mental illness or substance
abuse show strikingly similar patterns. For each indicator, the Downtown Focus Community
neighborhood in zip code 95814 is as much as five times that of the county rate and more than
twice as high as the next highest rate in the 14 other neighborhoods in the Focus Communities.
Safe and Healthy Physical Environments
Several of the neighborhoods had rates of emergency department visits and hospitalizations higher
than the county rate. The Downtown 95814 neighborhood had the highest rates, including some
more than four times the county.
Summary of Findings In spite of the favorable health status enjoyed by most residents, health disparities exist in Sacramento
County, and are concentrated in 3 geographic areas of the County containing 15 zip codes. The families
and individuals who live in these 15 neighborhoods are more likely to suffer from chronic disease and
poor health outcomes than those who live in other parts of the County. The poor health outcomes
experienced by those living in the neighborhoods contained within the 15 zip codes stem from a number
of interconnected factors. The residents in these geographic areas experience the lowest levels of
access to the ingredients that constitute a healthy community: employment, a sense of safety, healthy
food, and primary, preventive health care services. In addition, the demographic profiles of the
neighborhoods describe communities that are most vulnerable to health disparities because of socio-
economic status, race/ethnicity, insurance status and age that are associated with health disparities.
Improving the living and working conditions in communities and the opportunities of residents to thrive
are key to addressing the poor health outcomes identified in this assessment.

REPORT FROM VALLEY VISION
iv
Contents
RESULTS IN BRIEF .................................................................................................................................................... I
AREAS EXPERIENCING HEALTH DISPARITIES .......................................................................................................................... I
SUMMARY OF FINDINGS ................................................................................................................................................. III
INTRODUCTION ..................................................................................................................................................... 1
COMMUNITY HEALTH NEEDS ASSESSMENT DATA SOURCES .................................................................................. 2
SACRAMENTO COUNTY COMMUNITIES EXPERIENCING HEALTH DISPARITIES........................................................ 2
NORTH SACRAMENTO FOCUS COMMUNITY ......................................................................................................................... 4
DOWNTOWN FOCUS COMMUNITY .................................................................................................................................... 5
SOUTH SACRAMENTO FOCUS COMMUNITY ......................................................................................................................... 6
TOBACCO-FREE LIVING .......................................................................................................................................... 8
TOBACCO USE – CURRENT SMOKERS ................................................................................................................................. 8
TOBACCO-RELATED VISITS TO THE EMERGENCY DEPARTMENT AND TOBACCO-RELATED HOSPITALIZATIONS ..................................... 9
ACTIVE LIVING AND HEALTHY EATING: HEALTH OUTCOMES, BEHAVIORS AND ENVIRONMENTAL
CHARACTERISTICS ................................................................................................................................................ 11
HEALTH OUTCOMES ..................................................................................................................................................... 11
Diabetes-Related Mortality, Emergency Department Visits and Hospitalizations .............................................. 11
Overweight and Obesity ...................................................................................................................................... 13
BEHAVIORAL FACTORS................................................................................................................................................... 14
Consuming Fast Food .......................................................................................................................................... 14
Drinking Sodas .................................................................................................................................................... 15
Eating Fruits and Vegetables .............................................................................................................................. 15
ENVIRONMENTAL FACTORS ............................................................................................................................................ 16
Food access ......................................................................................................................................................... 16
Active Living ........................................................................................................................................................ 17
CLINICAL PREVENTIVE AND OTHER SERVICES ....................................................................................................... 18
CHRONIC DISEASE IN THE FOCUS COMMUNITIES................................................................................................................. 18
Heart Disease, Hypertension and Stroke ............................................................................................................. 18
Asthma ................................................................................................................................................................ 22
Disparities in Chronic Disease ............................................................................................................................. 23
LOCAL GAPS AND ASSETS IN PREVENTIVE HEALTH CARE ....................................................................................................... 24
Health Professional Shortage Areas .................................................................................................................... 24
Local Health Care Assets ..................................................................................................................................... 25
SOCIAL AND EMOTIONAL WELLNESS ................................................................................................................... 26
MENTAL ILLNESS RELATED EMERGENCY DEPARTMENT VISITS AND HOSPITALIZATIONS ............................................................... 26
EMERGENCY DEPARTMENT VISITS AND HOSPITALIZATIONS DUE TO SUBSTANCE ABUSE .............................................................. 28
DISPARITIES IN INDICATORS OF MENTAL HEALTH ................................................................................................................ 29
HEALTHY AND SAFE PHYSICAL ENVIRONMENT .................................................................................................... 30

REPORT FROM VALLEY VISION
v
EMERGENCY DEPARTMENT VISITS FOR ACCIDENTS, HOMICIDE, INJURY OR VIOLENCE ................................................................ 30
HOSPITALIZATIONS DUE TO ACCIDENTS, HOMICIDE, INJURY OR VIOLENCE ............................................................................... 31
OTHER SAFE AND HEALTHY PHYSICAL ENVIRONMENT INDICATORS ......................................................................................... 31
APPENDIX A – METHODOLOGY OVERVIEW .......................................................................................................... 32
DATA SOURCES ............................................................................................................................................................ 32
IDENTIFYING AND DESCRIBING COMMUNITIES EXPERIENCING HEALTH DISPARITIES ................................................................... 34
STUDY LIMITATIONS ...................................................................................................................................................... 36
APPENDIX B – DATA DICTIONARY ........................................................................................................................ 37
APPENDIX C – SECONDARY DATA PROCESSING METHODOLOGY ......................................................................... 40
GENERAL DATA PRE-PROCESSING ................................................................................................................................... 40
ADDITIONAL SPECIFIC VARIABLES .................................................................................................................................... 42
APPENDIX D – KEY INFORMANT INTERVIEW GUIDE ............................................................................................. 44
APPENDIX E – FOCUS GROUP INTERVIEW GUIDE ................................................................................................. 46
APPENDIX F – COMMUNITY ASSETS ..................................................................................................................... 48
REPORT FROM VALLEY VISION
vi
List of Tables and Figures
TABLE 1. FOCUS COMMUNITIES BY ZIP CODES AND NEIGHBORHOODS ................................................................. 2
MAP 1: FOCUS COMMUNITY BOUNDARIES............................................................................................................ 3
TABLE 2. NORTH SACRAMENTO FOCUS COMMUNITY SOCIO-DEMOGRAPHIC CHARACTERISTICS .......................... 4
TABLE 3. DOWNTOWN FOCUS COMMUNITY SOCIO-DEMOGRAPHIC CHARACTERISTICS ........................................ 6
TABLE 4. SOUTH SACRAMENTO FOCUS COMMUNITY SOCIO-DEMOGRAPHIC CHARACTERISTICS .......................... 7
TABLE 5. PERCENTAGE OF ADULTS WHO ARE CURRENT SMOKERS ........................................................................ 9
FIGURE 1. TOBACCO-RELATED EMERGENCY DEPARTMENT VISITS ....................................................................... 10
FIGURE 2. TOBACCO-RELATED HOSPITALIZATIONS .............................................................................................. 10
FIGURE 3. DIABETES-RELATED MORTALITY .......................................................................................................... 11
FIGURE 4. DIABETES-RELATED VISITS TO THE EMERGENCY DEPARTMENT ........................................................... 12
FIGURE 5. DIABETES-RELATED HOSPITALIZATIONS .............................................................................................. 13
TABLE 6. % OF ADULTS WHO HAD FAST FOOD 2 OR MORE TIMES IN THE LAST WEEK ......................................... 14
TABLE 7. % OF ADULTS WHO HAD SODA 2 OR MORE TIMES IN THE LAST WEEK .................................................. 15
TABLE 8. EMERGENCY DEPARTMENT VISITS AND HOSPITALIZATIONS FOR HEART DISEASE, HYPERTENSION, AND
STROKE ................................................................................................................................................................ 19
FIGURE 6. HEART DISEASE-RELATED MORTALITY ................................................................................................. 20
FIGURE 7. HYPERTENSION-RELATED MORTALITY ................................................................................................. 21
FIGURE 8. STROKE-RELATED MORTALITY ............................................................................................................. 22
FIGURE 9. ASTHMA-RELATED EMERGENCY DEPARTMENT VISITS ......................................................................... 23
FIGURE 10. MENTAL HEALTH-RELATED EMERGENCY DEPARTMENT VISITS .......................................................... 27
FIGURE 11. MENTAL HEALTH-RELATED HOSPITALIZATIONS ................................................................................. 27
FIGURE 12. SUBSTANCE ABUSE-RELATED EMERGENCY DEPARTMENT VISITS ....................................................... 28
FIGURE 13. SUBSTANCE ABUSE-RELATED HOSPITALIZATIONS .............................................................................. 29
TABLE 9. EMERGENCY DEPARTMENT VISITS FOR ACCIDENTS, HOMICIDE, INJURY OR VIOLENCE ......................... 30

REPORT FROM VALLEY VISION
1
Introduction
This Community Health Needs Assessment (CHNA) is a companion to the report, The Chronic Disease
Experience of Sacramento County Residents, prepared by Sacramento County’s Division of Public Health
in the Department of Health and Human Services (DHHS). Both reports are part of the collaborative
work of the Healthy Sacramento Coalition (Healthy Sacramento Coalition) to prioritize health needs
within Sacramento County and develop strategies and mobilize resources to improve the health of
county residents.
The Healthy Sacramento Coalition is funded by a Community Transformation Grant (CTG) from the
Centers for Disease Control and Prevention (CDC). The CTG Program’s overarching goal is to create
healthier communities by making healthy living easier and more affordable. Sacramento County is one
of six counties in California awarded CTG funding to build capacity to support healthy lifestyles and
reduce health disparities. Sacramento County covers nearly 1,000 square miles and is home to more
than 1.4 million people. Through the Healthy Sacramento Coalition, Sacramento’s CTG Program is
identifying evidence-based strategies to promote tobacco-free living, active living and healthy eating,
quality clinical and other preventive services, healthy and safe physical environments, and social and
emotional wellness.
Sierra Health Foundation is the CTG lead and fiduciary agent for Sacramento County. In addition to CDC,
funding support for CTG community health needs assessment activities was provided by Sierra Health
Foundation.
The Healthy Sacramento Coalition includes more than 60 organizations, including community-based
organizations, public agencies, hospitals, school districts, service providers, advocacy organizations,
businesses and foundations. They share a common goal of improving health and well-being for
Sacramento County residents. The coalition’s first step is a community health improvement plan
informed by the County Department of Health and Human Services report and this needs assessment.
On behalf of the coalition, Sierra Health Foundation commissioned Valley Vision to conduct the
assessment and identify:
Sacramento County communities with disproportionately high rates of chronic disease and mental health issues
community obstacles that prevent people from living healthier lives
community resources that support healthy living
To isolate areas of greatest disparity, the CHNA was organized based on the five CTG focus areas:
tobacco-related illness
active living and healthy eating
clinical preventive and other services
social and emotional wellness
healthy and safe physical environment

REPORT FROM VALLEY VISION
2
Community Health Needs Assessment Data Sources
The assessment relied primarily on secondary data from such sources as the California Office of
Statewide Health Planning and Development, California Department of Public Health, the Dignity Health
Community Need Index, and the U.S. Census, among others. These sources provided health outcome
data, socio-demographic data, and behavioral and environmental data at the zip code or census tract
level. Health outcome data included emergency department visits, hospitalization, and mortality rates
related to heart disease, diabetes, stroke, hypertension, asthma, tobacco, and safety and mental health
conditions. Socio-demographic data included data on race/ethnicity, poverty, educational attainment
and insurance status. Behavioral and environmental data included information on tobacco use, fast food
and soda consumption, neighborhood walkability and other variables. Additional information was
collected through interviews with 47 community leaders, focus group interviews with 124 community
members, feedback sessions during Healthy Sacramento Coalition meetings, and a community health
assets assessment.
Throughout the report, rates for mortality, emergency department visits and hospitalizations are
adjusted to account for differences in the population size and age profiles of the communities. The rates
are estimated per 10,000 population. For more information on the methodology and data sources, see
Appendices A and B. The data can also be seen in the form of GIS maps on the Sierra Health Foundation
website.
Sacramento County Communities Experiencing Health Disparities
The assessment identified 15 of Sacramento County’s 58 zip codes that are experiencing high rates of
health disparities relative to the county as a whole. The 15 zip codes are adjacent to others and cluster
into three communities – North Sacramento, Downtown and South Sacramento.
Table 1. Focus Communities by Zip Codes and Neighborhoods
Focus Communities Zip Codes Neighborhoods (all or a part of)
North Sacramento 95660, 95673, 95815, 95821, 95838, 95841
North Highlands, Rio Linda, Old North Sacramento, Woodlake, Del Paso Manor, Del Paso Heights, Belmont Estates
Downtown Sacramento 95811, 95814 Richards, Alkali Flats, Mansion Flats, Midtown, Richmond Grove, Southside Park
South Sacramento 95817, 95820, 95822, 95823, 95824, 95828, 95832
Oak Park, Elmhurst, Tahoe Park, Land Park, Parkway, Valley Hi/North Laguna, City Farms, Fruitridge Manor, Florin, Meadowview

REPORT FROM VALLEY VISION
3
Map 1: Focus Community Boundaries
The rest of this section describes the three focus communities and the neighborhoods they encompass.
Demographic characteristics that are indicators of vulnerability to health and economic disparities are
presented.2 These include the proportion of female-headed households under the poverty line and the
2 Data acquired from Dignity Health’s Community Needs Index
REPORT FROM VALLEY VISION
4
proportions of residents who have limited English, do not have a high school diploma, are Hispanic or
non-white, and are without health insurance. In addition, the infant mortality and general mortality
rates are used as indicators of the overall health of a community.
County rates presented in the report are based on Sacramento County’s 58 zip codes, including the 15 in
the three focus communities. As a result, health disparities observed in the neighborhood to county
comparisons would be even larger if the 15 neighborhoods were compared to neighborhoods with the
lowest rates of poor health outcomes.
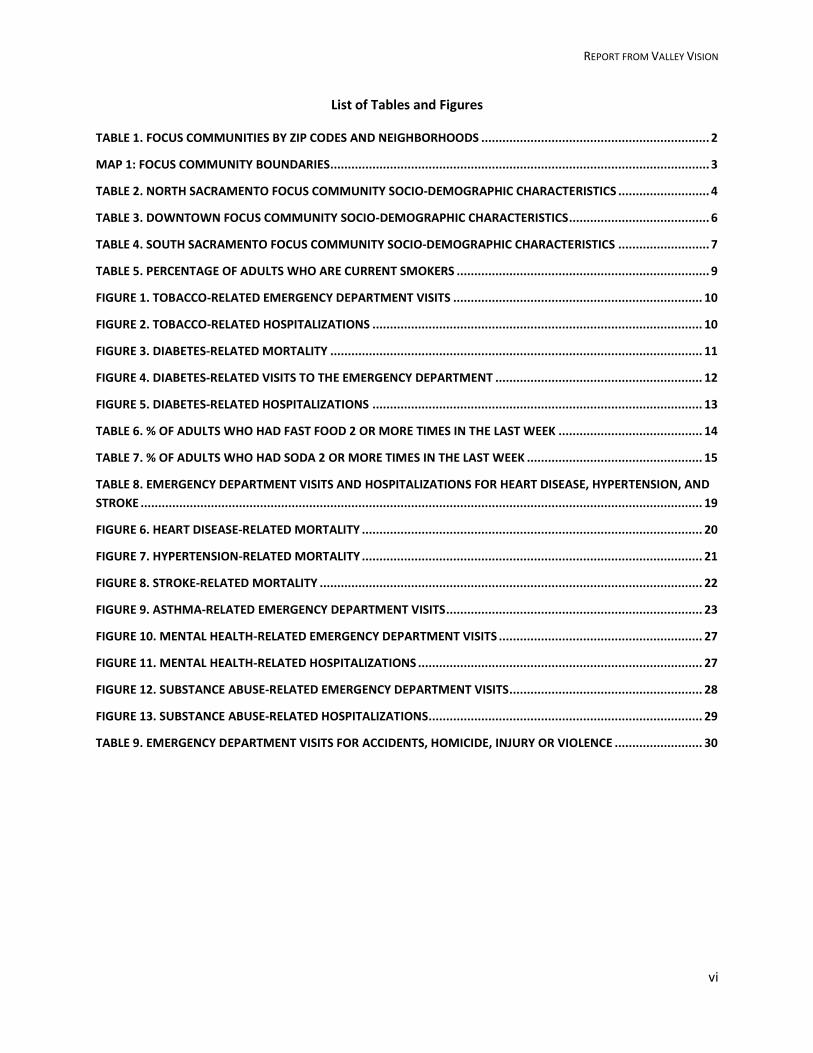
North Sacramento Focus Community
The six zip codes that make up the North Sacramento Focus Community are home to more than 160,000
residents. As the table below shows, many of the neighborhoods had large percentages of residents
living below the federal poverty level, with low educational attainment, no health insurance and a high
percentage of non-white or Hispanic residents. Compared to county rates, all the neighborhoods had
higher proportions of households headed by single females in poverty and of residents without health
insurance or a high school diploma. In addition, three of the neighborhoods (North Highlands, Old North
Sacramento/Woodlake and Del Paso Heights) had higher proportions of residents who are non-white or
Hispanic.
Table 2. North Sacramento Focus Community Socio-Demographic Characteristics3
Residents Single female
head of households
living in poverty Neighborhood
Non-white or
Hispanic+
Without health insurance
Residents with limited
English
Without High School
Diploma
North Highlands (95660) 49% 27% 8% 27% 43%
Rio Linda (95673) 32% 18% 2% 21% 32%
Old North Sac.; Woodlake (95815)
65% 42% 13% 38% 52%
Del Paso Manor (95821) 37% 31% 7% 15% 40%
Del Paso Heights (95838) 74% 32% 9% 32% 44%
Belmont Estates (95841) 37% 29% 6% 16% 37%
County 52% 14%* 21%** 12%** 25%***
+2010 Census (factfinder2.census.gov);
*U.S. Census Bureau, 2010 American Community Survey 1‐Year Estimates (from A
Market Analysis of the Sacramento Region Primary Care Safety Net, http://www.sierrahealth.org/doc.aspx?253); **
CHIS, 2009 (ask.CHIS.ucla.edu);
***2007-2011 American Community Survey 5-Year Estimates (factfinder2.census.gov)
(see www.dignityhealth.org/who_we_are/Community_Health/STGSS044508). 3 Unless otherwise noted, the data come from the sources identified in Appendix B. County-level statistics were
collected from other sources for comparison.
REPORT FROM VALLEY VISION
5
In addition to the evidence of vulnerability to economic and health disparities found in the demographic
characteristics, key informants and community members in focus groups discussed the challenges in the
neighborhoods. They noted that the stress of being unemployed and navigating the world of social
services, many for the first time, was overwhelming. As one professional stated:
For the first time I am seeing people who have been steadily employed for 30 years; lost their job
2 years ago; lost everything and have no clue where to turn. They don’t know how to live. They
don’t know how to access services. They don’t know, they don’t know what to do. They are
demoralized. They are in their 50s. No one will hire them. They are just absolutely fish out of
water (KI_2_3).
Another participant stressed the difficulty families were having getting by with everyday life activities
due to financial stressors, and expressed how these stressors affected the person in many areas of their
life:
It is everyday stressors of not having enough money and not having enough food and not being
able to find a job, and it is so much for any family to have relationship issues and mental health
issues and physical issues. It is all happening at once... (KI_2_1).
While demographic characteristics indicate vulnerability to health and economic disparities, two
variables serve as overall indicators of health outcomes: infant mortality and overall mortality. Del Paso
Heights (95838) had the highest rate of infant mortality in Sacramento County with a rate of 6.73
deaths/1,000 live births. This is well above the county rate of 5.8, the state rate of 5.2 and the Healthy
People 2020 target of 4.5 deaths/1,000 live births. Del Paso Manor (95821) also had a high rate at
6.08/1,000. The Old North Sacramento/Woodlake neighborhood (95815) had the highest age-adjusted
overall mortality rate in Sacramento County at 95 deaths per 10,000 population. More residents died in
this zip code annually due to all causes than any other in the county. The county as a whole had a
mortality rate of 71 deaths for every 10,000 people, higher than the state rate of 63.
Downtown Focus Community The Downtown Area consists of two zip codes (95811 and 95814) and is home to approximately 17,500
residents. The 95811 zip code, which was created in 2006, had relatively low rates of chronic disease
compared to 95814 and many of the neighborhoods in the North and South Sacramento Focus
Communities. Despite the indicators of good physical health, 95814 is included as one of the areas
experiencing health disparities because of its high rates of emergency department visits and
hospitalizations related to mental health conditions.
The Downtown neighborhoods were close to the county in the proportion of non-white or Hispanic
residents and had much lower proportions of residents who spoke limited English. But other data
indicated potential vulnerability to poor health outcomes. For example, in contrast to the state
uninsured rate of 21%4 and the county rate of 10%, approximately four out of every 10 residents in the
Downtown Focus Community did not have health insurance. As one of the focus group participants
4 California Healthcare Almanac, California’s Uninsured, December 2011. Retrieved from:
http://www.chcf.org/~/media/MEDIA%20LIBRARY%20Files/PDF/C/PDF%20CaliforniaUninsured2011.pdf

REPORT FROM VALLEY VISION
6
stated, “And people don’t go to the doctor because you don’t have insurance or the funds to pay for the
services and the few times when you are able to get services at the clinics, the wait is very long or you
just get the minimal medical care (FG_8).”
Table 3. Downtown Focus Community Socio-Demographic Characteristics5
% of Residents Single female
head of households
living in poverty Neighborhood Non-white or
Hispanic+
Without health
insurance
Residents with limited
English
Without High School
Diploma
Downtown (Richards, Alkali Flats, Mansion Flats, Midtown, Richmond Grove, Southside Park) (95811)
48% 44% 9% 25% 46%
Downtown (95814) 49% 39% 7% 26% 36%
County 52% 10%* 21%** 12%** 25%***
+2010 Census (factfinder2.census.gov);
*CHIS 2007, 2009 (http://www.healthycity.org);
**CHIS, 2009 (ask.CHIS.ucla.edu)
***2007-2011 American Community Survey 5-Year Estimates (factfinder2.census.gov)
With a rate of infant mortality of 5.4 deaths/1,000 live births, the Downtown neighborhoods were
slightly below the county rate of 5.8, slightly above the state rate of 5.2 and well above the Healthy
People 2020 target of 4.5. Although the infant mortality rates were not markedly different from the
county and state overall, the downtown neighborhood of 95814 had the third highest age-adjusted
overall mortality rate in Sacramento County.
South Sacramento Focus Community
The South Sacramento Focus Community has approximately 290,000 residents. Data indicated that this
area of the county was highly diverse with a large number of immigrant residents (based on the key
informant interviews and focus groups), high rates of poverty, high uninsured rates and low rates of
educational attainment. As one participant said about how living in poverty affects the treatment and
care by area practitioners: “Lower income area, you get treated low income (FG_9).”
5Unless otherwise noted, the data come from the sources identified in Appendix B. Some county-level information
was collected from other sources for comparison.

REPORT FROM VALLEY VISION
7
Table 4. South Sacramento Focus Community Socio-Demographic Characteristics6
Residents Single female
head of households
living in poverty Neighborhood Non-white or
Hispanic+
Without health insurance
Residents with limited
English
Without High School
Diploma
Oak Park (95817) 58% 43% 9% 28% 46%
Elmhurst, Tahoe Park, Oak Park (95820)
69% 34% 11% 35% 39%
Land Park (95822) 72% 30% 10% 27% 33%
Parkway, Valley Hi/North Laguna (95823)
85% 29% 11% 27% 34%
City Farms, Fruitridge Manor (95824)
84% 41% 18% 44% 51%
Florin (95828) 77% 18% 9% 23% 24%
Meadowview (95832) 90% 35% 13% 41% 48%
County 52% 10%* 21%** 12%** 25%***
+2010 Census (factfinder2.census.gov);
*CHIS 2007, 2009 (http://www.healthycity.org);
**CHIS, 2009 (ask.CHIS.ucla.edu)
***2007-2011 American Community Survey 5-Year Estimates (factfinder2.census.gov)
Infant mortality rates for several of the South Sacramento Focus Community neighborhoods were higher
than county and state rates. Compared to the county, Elmhurst/Tahoe Park/Oak Park (95820), City
Farms/Fruitridge Manor (95824) and Parkway/Valley Hi/North Laguna (95823) ranked second, third and
fourth (respectively) in infant mortality. All three had rates above 6.0/1000 live births. Overall mortality
also indicated health disparities. The Elmhurst/Tahoe Park/Oak Park neighborhood (95820) had an
overall mortality of 83.9 deaths per 10,000-the fourth highest age-adjusted overall mortality rate in the
county, which has an overall mortality rate of 71.4.
6Unless otherwise noted, the data come from the sources identified in Appendix B. Some county-level information
was collected from other sources for comparison

REPORT FROM VALLEY VISION
8
Tobacco-Free Living
Smoking behavior, tobacco-related hospitalizations and tobacco-related visits to the emergency
department were used to examine the extent of health disparities in the Focus Communities’
neighborhoods. Data on smoking behavior or tobacco use more broadly are not available for most zip
codes, so the evidence on tobacco-related illness comes primarily from tobacco-related emergency
department visits and tobacco-related hospitalizations. The results are presented below. Key findings
include:
Close to a third of the adult residents of the Old North Sacramento/Woodlake (95815) and the
Downtown neighborhoods (95811 and 95814) describe themselves as current smokers.
The Downtown neighborhood in the 95814 zip code had higher rates of emergency department
visits and hospitalizations due to tobacco-related illnesses than any other zip code in the county.
All but one of the 15 neighborhoods had rates of emergency department visits and
hospitalizations due to tobacco-related illnesses higher than the county rate.
In the North and South Sacramento Focus Communities, African-American residents had the
highest rate of tobacco-related emergency department visits.
Tobacco Use – Current Smokers
According to the 2008 California Tobacco Control Survey7, Sacramento County has a smoking prevalence
rate of 14.0%. Although most counties that have major urban areas have prevalence rates below the
state average of 11.6%, Sacramento County is considerably above. Because of the small numbers, it is
challenging to describe smoking prevalence at the neighborhood level. However, the UCLA Center for
Health Policy Research8 provided small region estimates (by combining sampling from multiple zip
codes) of tobacco smoking prevalence for some zip codes. These are presented below.
According to estimates, close to a third of the adult residents of the Old North Sacramento/Woodlake
(95815) neighborhood describe themselves as current smokers. The Downtown (combined 95811 and
95814) and Land Park (95822) neighborhoods also have relatively high proportions of smokers.
7 Al-Delaimy WK, White MM, Mills AL, Pierce JP, Emory K, Boman M, Smith J, Edland S. Two Decades of the
California Tobacco Control Program: California Tobacco Survey, 1990-2008. La Jolla, CA: University of California, San Diego; 2010. 8 California Health Interview Survey. CHIS 2005, 2007, 2009 Pooled Data Estimates from Adult Source Files
[computer file]. Los Angeles, CA: UCLA Center for Health Policy Research, September 2012.

REPORT FROM VALLEY VISION
9
Table 5. Percentage of adults who are current smokers
Neighborhood (zip code) % adults who are current
smokers+
95% Confidence
Interval
North Sacramento Focus Community*
North Highlands (95652, 95660) 19.5% (9.2 - 29.9)
Old North Sacramento, Woodlake (95815) 34.0% (14.1 - 53.8)
Del Paso Manor (95821) 23.4% (10.5 - 36.3)
Del Paso Heights (95838) 14.9% (6.6 - 23.2)
Downtown Focus Community**
Downtown (95811, 95814) 31.7% (15.1 - 48.3)
South Sacramento Focus Community**
Land Park (95822) 29.4% (14.8 - 44.1)
Parkway, Valley Hi/North Laguna (95823) 20.4% (10.2 - 30.7)
County***
16.0% (12.6 - 19.4) + Current smoker denotes adults (age 18+) who smoked at least 100 cigarettes in their lifetime and that they smoke every day
or some days. *Source: 2005, 2007, 2009 CHIS;
**Source: 2007, 2009 CHIS;
*** Source: 2009 CHIS
Tobacco-Related Visits to the Emergency Department and Tobacco-Related
Hospitalizations Tobacco-related visits to the emergency department and tobacco-related hospitalizations reflect not
just smoking but other forms of tobacco use and provide information about the tobacco-related
illnesses of the residents of the 15 neighborhoods.
All but one of the neighborhoods have tobacco-related emergency department visit and hospitalization
rates higher than the county. Downtown (95814) has rates of tobacco-related emergency department
visits and hospitalizations more than twice that of the county rate.

REPORT FROM VALLEY VISION
10
Figure 1. Tobacco-Related Emergency Department Visits
Figure 2. Tobacco-Related Hospitalizations
REPORT FROM VALLEY VISION
11
Active Living and Healthy Eating: Health Outcomes, Behaviors and
Environmental Characteristics
Many of the neighborhoods in the Focus Communities experienced high rates of negative health
outcomes related to the areas of active living and healthy eating. This section describes the diabetes
outcomes and prevalence of overweight and obesity and discusses the environmental factors related to
these negative health outcomes.
Health Outcomes
Diabetes is one of the immediate consequences of inactive living and poor nutrition habits. The
following charts present data on diabetes-related mortality, emergency department visits and
hospitalizations in the 15 neighborhoods and is followed by findings on overweight and obesity, a
common precursor to diabetes.
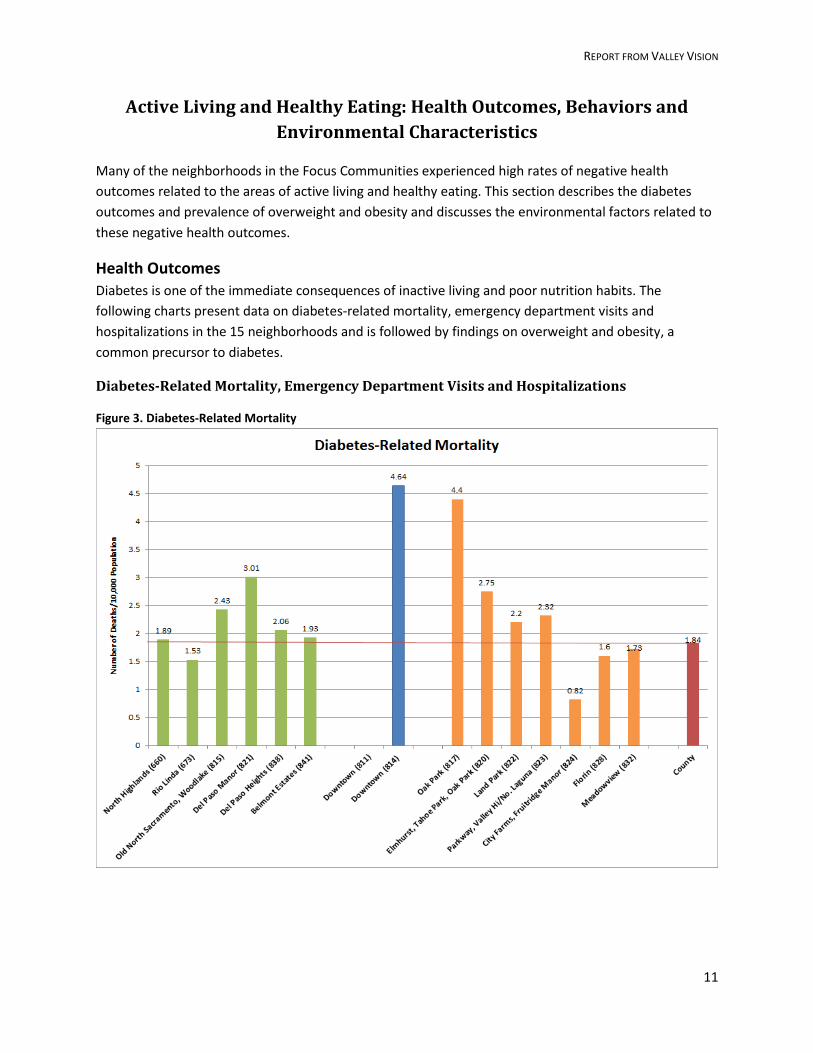
Diabetes-Related Mortality, Emergency Department Visits and Hospitalizations
Figure 3. Diabetes-Related Mortality

REPORT FROM VALLEY VISION
12
Of the 10 zip codes in the county with the highest rates of diabetes-related mortality, eight are in the
Focus Communities. With diabetes-related mortality more than twice that of the county as a whole, the
Downtown (95814) neighborhood and Oak Park (95817) in the South Sacramento Focus Community had
the highest rates of all.
Figure 4. Diabetes-Related Visits to the Emergency Department
Diabetes-related visits to the emergency department in the county range from 59/10,000 in zip code
95837 to 459/10,000 in Downtown (95814). Out of the county’s 58 zip codes, 20 have rates of diabetes-
related visits to the emergency department higher than the county rate. Fourteen of that 20 come from
the Focus Communities.

REPORT FROM VALLEY VISION
13
Figure 5. Diabetes-Related Hospitalizations
In the county, rates of diabetes-related hospitalizations range from 40/10,000 in zip code 95680 to
377/10,000 in Downtown (95814). Nine of the 10 neighborhoods with the highest rates come from the
Focus Communities.
Overweight and Obesity
At the zip code level, the proportion of residents who are overweight or obese is based on estimates
calculated from 2003 and 2005 CHIS data, so the following results are outdated, but still shed some light
on the health conditions experienced in the Focus Communities:
In the North Sacramento Focus Community, Old North Sacramento/Woodlake (95815), Del Paso
Manor (95821) and North Highlands (95660) had the highest proportions of obesity and
overweight residents age 12 and over at 54-56%.
More than 58% of the residents of Downtown zip code 95814 were overweight or obese. (No
data were available for residents living in 95811).
Estimates for neighborhoods in the South Sacramento Focus Community indicated that
approximately 60% of the residents in the Oak Park (95817) and Elmhurst/Tahoe Park/Oak Park
(95820) neighborhoods were overweight or obese, while 53-55% of the Land Park (95822) and
Parkway/Valley Hi/North Laguna (95823) had a rate of 53-55%.

REPORT FROM VALLEY VISION
14
In several of the neighborhoods, more than 50% of the residents aged 12 and over were overweight or
obese. Residents of Downtown (95814) were among the most overweight or obese in Sacramento
County.
Behavioral Factors
Eating fast foods, drinking soda, and not getting enough fruits and vegetables are behaviors that are
linked to diabetes and other negative health outcomes. Using estimates derived from combining
multiple years of CHIS data, findings related to healthy eating include:
Consuming Fast Food
To calculate fast food consumption at the zip code level, 2007 and 2009 CHIS data were combined.
Dependable data were not available for all the neighborhoods even after combining the two years.
Among those for which data are available, Belmont Estates (95841) had the second highest percentage
of adults consuming fast food two or more times in the last week. All but one of the neighborhoods in
the North Sacramento Focus Community is above the 2009 county average of 37.59. The Downtown
Focus Community neighborhoods also had a high rate of fast food consumption, more than 10% higher
than the county average. In contrast, all but one of the neighborhoods in the South Sacramento Focus
Community had rates of fast food consumption lower than the county average of 37.5%.
Table 6. % of Adults Who Had Fast Food 2 or More Times in the Last Week
Neighborhood (zip code) *
% adults who had fast food two or more times in
the last week
95% Confidence
Interval
North Sacramento Focus Community
North Highlands (95652, 95660) 41.1% (25.2 – 56.9)
Rio Linda (95673) 49.2% (24.4 – 74.0)
Old North Sacramento, Woodlake (95815) 36.7% (15.7 – 57.7)
Del Paso Manor (95821) 50.9% (36.0 – 65.9)
Del Paso Heights (95838) 44.2% (27.9 – 60.4)
Belmont Estates (95841) 55.8% (36.4 – 75.2)
Downtown Focus Community Downtown (95811, 95814) 48.6% (23.2 – 74.0)
South Sacramento Focus Community Elmhurst, Tahoe Park, Oak Park (95820) 39.7% (23.4 – 56.1)
Land Park (95822) 32.0% (17.1 – 46.8)
Parkway, Valley Hi/North Laguna (95823) 35.5% (22.3 – 48.7)
Florin (95828) 36.5% (25.9 – 46.9) *Source: Pooled cross-sectional data from 2007, 2009 CHIS
9 2009 CHIS, from ask.chis.ucla.edu

REPORT FROM VALLEY VISION
15
Six neighborhoods in the North and Downtown Focus Communities have rates of fast food consumption
(among adults 18 and over) above the 2009 county rate of 37.5%; in four neighborhoods, the rates are
more than 10% higher than the county rate.
Drinking Sodas
To examine the extent of soda consumption in the Focus Communities, the 2007 and 2009 CHIS data were combined. This analysis found an overall rate of adults drinking soda two more times in the last week of 27.42%. Of the all zip codes for which data were available, three of the neighborhoods in the Focus Communities were in the top five.
Table 7. % of Adults Who Had Soda 2 or More Times in the Last Week
Neighborhood (zip code)
% adults who had soda two or more times in the
last week
95% Confidence
Interval
North Sacramento Focus Community
North Highlands (95652, 95660) 46.3% (31.3 – 61.4)
Old North Sacramento, Woodlake (95815) 47.4% (20.6 – 74.2)
Del Paso Manor (95821) 38.8% (28.6 – 49.1)
Del Paso Heights (95838) 48.0% (30.8 – 65.2)
Belmont Estates (95841) ** 28.7% (13.6 – 43.8)
Downtown Focus Community Downtown (95811, 95814) ** 35.9% (16.2 – 55.6)
South Sacramento Focus Community Elmhurst, Tahoe Park, Oak Park (95820) 51.2% (33.1 – 69.3)
Land Park (95822) 29.1% (16.0 – 42.3)
Parkway, Valley Hi/North Laguna (95823) 40.5% (26.3 – 54.7)
Florin (95828) 18.4% (8.6 – 28.2) *Unless otherwise noted, the data for the estimates comes from pooled cross-sectional data from the 2007, 2009 CHIS.
**Estimates derived from 2005, 2007, 2009 CHIS.
All but one of the neighborhoods for which data are available had rates of soda consumption higher than
the combined rate for the county. Elmhurst/Tahoe Park/Oak Park (95820) and Del Paso Heights (95838)
had the highest proportions, with roughly half of adults had soda two or more time in the last week.
Eating Fruits and Vegetables
The data on the proportion of the population (age 5 and above) who are eating less than five servings of
fruit and vegetables a day comes from the 2003 and 2005 CHIS. Across the 15 neighborhoods in the
Focus Communities, the percent eating less than five servings ranges from 53% in one of the Downtown
neighborhoods (95814) to 59% in Meadowview (95832) in the South Focus Community. For comparison
purposes, the 2009 CHIS analysis (from ask.chis.ucla.edu) shows that the proportion of children eating
less than 5 fruits and vegetables daily was 44% in 2007, increasing to 57.6% in 2009. Given this increase
among children, it is likely that the rates for the 15 neighborhoods have also increased.
REPORT FROM VALLEY VISION
16
Environmental Factors
Unhealthy diets and overweight are not a function only of behaviors. Environmental factors also play an
important role. One key informant spoke about the importance of the environment on good health: “…it
is not just simply a matter of telling a person you need to lose weight. It is the environment that they are
in that is creating or helping them make those wrong choices (KI_CN_2).” Another interviewee spoke
about the relationship between poverty, access to healthy food and chronic disease: “I think lower
income means less access to everything including healthy food, so a lot of folks are overweight, obese,
[have] heart disease, all those things (KI_2_2).” This section examines the data on food access and
opportunities for active living.
Food access
In the focus group interviews, a community member said: “We got all the liquor stores you want. We
don’t have any grocery stores. We have got fast food restaurants up and down the street. We don’t have
a grocery store (FG_5).” This comment is borne out in the secondary data on environmental influences
on healthy eating. The major sources of information are CDC’s modified Retail Food Environmental Index
(mRFEI) which is the percentage of healthy food outlets in a census tract area compared to the total
number of all food outlets in the same tract, and the U.S. Department of Agriculture’s data on food
deserts (defined as a geographic area where 33% of the population or more than 500 people have low
access to healthy food). The data for both these variables are available at the census tract level only.
Food Deserts
In the North Sacramento Focus Community, most of the Rio Linda (95673) and Del Paso Heights (95838)
neighborhoods and portions of North Highlands (95660) and Old North Sacramento/Woodlake (95838)
neighborhoods were designated food deserts. In the Downtown Focus Community, parts of the 95811
neighborhood were within a food desert. Portions of four of the neighborhoods in the South
Sacramento Focus Community (zip codes 95820, 95824, 95828, and 95832) were identified by the US
Department of Agriculture as certified food desserts.
Food deserts were found in all three Focus Communities, with the largest areas in North Sacramento.
Retail Food Environment
Some geographic areas in the North Sacramento Focus Community had as few as 0-4% of retail food
vendors offering health food options. These included portions of the Old North Sacramento/Woodlake
(95815) and Del Paso Manor (95821) neighborhoods. Many of the census tracts in the Downtown Focus
Community had low numbers of healthy food outlets (relative to the total number of all food outlets).
However, the lowest was 10%, higher than that in North Sacramento. In the South Sacramento Focus
Community the proportion of retail food vendors offering healthy food options ranged from as low as 0-
4% to as high as 17%.
Although there are pockets in each area with access to healthy food from retail outlets, large parts of
the three Focus Communities have low proportions – 13% or less -- of health food retailers in the
neighborhoods.

REPORT FROM VALLEY VISION
17
Farmers Markets
The only certified farmers market in the North Sacramento Focus Community is located in Del Paso
Heights (95838). Although parts of the 95811 zip code were identified as food deserts, the other
Downtown Focus Community zip code (95814) was home to the highest concentration of certified
farmers markets in Sacramento County. The South Sacramento Focus Community has two certified
farmers markets.
With the exception of one of the Downtown neighborhoods, there are few farmers markets in the Focus
Communities.
Active Living
In order to provide a picture of active living, data on area park access and walkability and were
examined. Park access was measured the percentage of the population with no parks within ½ mile. 10
Walkability is measured by a score that incorporates walking routes and distances to amenities, road
connectivity metrics, and scores for individual amenity categories. 11
All three Focus Communities had large portions of the population living in areas with access to parks and
considered “walkable”. But each also had neighborhoods with high crime rates. Although crime rates
are difficult to compare because of the different sources (County Sheriff, Sacramento Police, and police
departments of other cities in the county), crime was elevated in neighborhoods throughout the Focus
Communities. Sacramento City Crime data revealed that Old North Sacramento/Woodlake (95815) had
the highest prevalence of major crime for the county, followed by Del Paso Heights (95838). In
Downtown, crime rates in zip code 95814 were among the highest in the county. Crime statistics for the
South Sacramento Focus Community were also elevated when compared to other communities.
Crime can create a barrier to active living, a point made by several focus group participants and key
informants. For example, safety of area parks was a consistent theme. One participant said: “We always
come to this park but we don’t go to this one end of the park because there is so much violent activity
that happens. And sure enough, when we were in that end [one day], a shooting happened (KI_4_8).”
Interviewees also commented about the danger of walking on heavily trafficked streets.
High proportions of the North Sacramento and Downtown Focus Communities had access to parks and
were defined as “walkable”. However safety was a barrier to taking advantage of these resources.
10
ESRI. 2010. parks.sdc. ESRI® Data & Maps, 10th edition – World, Europe, and United States. (data file) 11
Walkability score is based on walking routes and distances to amenities, road connectivity metrics, and scores
for an individual amenity category. See www.walkscores.com.

REPORT FROM VALLEY VISION
18
Clinical Preventive and Other Services
The assessment of needs related to clinical preventive and other services examined emergency
department visits, hospitalizations, and mortality related to several chronic diseases. This section also
presents information about health care assets and gaps obtained from the federal Bureau of Health
Professionals about health professional shortage areas and a local assets assessment.
Chronic Disease in the Focus Communities
Heart Disease, Hypertension and Stroke
Preventable chronic diseases such as heart disease, hypertension and stroke occurred at high rates in
most of the neighborhoods in the Focus Communities. In the following table, the rates are adjusted to
account for differences in the population size and age profiles of the communities. The rates are number
of emergency department visits or hospitalizations for every 10,000 people.
Emergency Department Visits and Hospitalizations for Heart Disease, Hypertension and Stroke
The following table shows the rates of emergency department visits and hospitalizations for heart
disease, hypertension and stroke. The numbers presented are a rate of number of visits or
hospitalizations per 10,000 residents. They have been adjusted to account for differences in the
population size and age profile in the neighborhoods.

REPORT FROM VALLEY VISION
19
Table 8. Emergency Department Visits and Hospitalizations for Heart Disease, Hypertension, and Stroke
Heart Disease Hypertension Stroke
Neighborhood (zip code) ED Hospital ED Hospital ED Hospital
North Sacramento Focus Community
North Highlands (95660) 163 304 608 509 21 68
Rio Linda (95673) 162 322 482 473 25 63
Old North Sacramento, Woodlake (95815)
181 356 632 542 22 80
Del Paso Manor (95821) 128 216 473 371 22 54
Del Paso Heights (95838) 154 342 622 536 19 69
Belmont Estates (95841) 147 281 540 470 21 60
Downtown Focus Community
Downtown (95811) 84 166 324 283 20 31
Downtown (95814) 273 477 906 754 27 94
South Sacramento Focus Community
Oak Park (95817) 128 327 560 560 21 76
Elmhurst, Tahoe Park, Oak Park (820) 158 295 568 497 23 64
Land Park (95822) 140 257 550 427 27 58
Parkway, Valley Hi/North Laguna (95823)
208 334 800 534 42 80
City Farms, Fruitridge Manor (95824) 157 317 577 525 23 75
Florin (95828) 150 253 574 433 23 61
Meadowview (95832) 196 354 712 533 20 74
Sacramento County 126 228 442 380 22 56
= = Highest rate of the 15 neighborhoods = Rate below the county rate
The areas with the two highest rates of hospitalization for heart disease in the county were the
Downtown (95814) neighborhood and the North Sacramento neighborhood of Old North
Sacramento/Woodlake (95815). The Downtown neighborhood in zip code 95814 had the highest rates
of Sacramento County’s 58 zip codes for emergency department visits and hospitalizations related to
heart disease, hypertension and stroke, and, as presented earlier, for diabetes. All the neighborhoods in
the South Sacramento Focus Community were in the ten zip codes (out of Sacramento County’s 58 zip
codes) with the highest rates of emergency department visits and hospitalization for hypertension and
stroke.
The Downtown neighborhood (95814) has the highest rates of heart disease and hypertension (and
diabetes) as measured by both emergency department visits and hospitalizations of any other zip code in
the county. Compared to the county rate, its rates are either more than or close to twice as high as the
overall county rate.

REPORT FROM VALLEY VISION
20
Mortality due to Heart Disease, Hypertension and Stroke
The Sacramento County Department of Health and Human Services reports that stroke is the fourth
leading cause of death in the county and hypertension is the ninth. Cardiovascular disease, which
includes stroke, heart disease and heart failure, is the first. The following charts show the rates of
mortality due to heart disease, hypertension and stroke in the 15 neighborhoods.
Figure 6. Heart Disease-Related Mortality
Residents of the Downtown 95814 neighborhood died at the fourth highest rate in the county due to
heart disease. All but two of the 15 neighborhoods exceeded the county rate for heart disease-related
mortality.

REPORT FROM VALLEY VISION
21
Figure 7. Hypertension-Related Mortality
Compared to the other chronic disease causes of mortality, the 15 neighborhoods had rates of mortality
due to hypertension more similar to other zip codes in the county. However, the Parkway, Valley
Hi/North Laguna neighborhood (95823) had the highest rate in the county and five of the 15
neighborhoods were in the top 10 zip codes for hypertension mortality.

REPORT FROM VALLEY VISION
22
Figure 8. Stroke-Related Mortality
Although some of the 15 neighborhoods had rates of mortality due to stroke less than or close to the
county rate, Land Park (95822) and Del Paso Manor (95617) rates of mortality due to stroke markedly
higher than the county rate. Land Park’s rate is over twice that of the county rate of 3.86.
Asthma
Asthma is a Chronic Lower Respiratory Disease. In 2009, the lifetime asthma prevalence was 13.1%
higher in Sacramento County than the state of California. As shown in the following figure, in a county
that already has a higher rate of asthma than the state, asthma is one of the chronic diseases that affect
the neighborhoods in the Focus Communities at a higher rate than the other parts of the county.
REPORT FROM VALLEY VISION
23
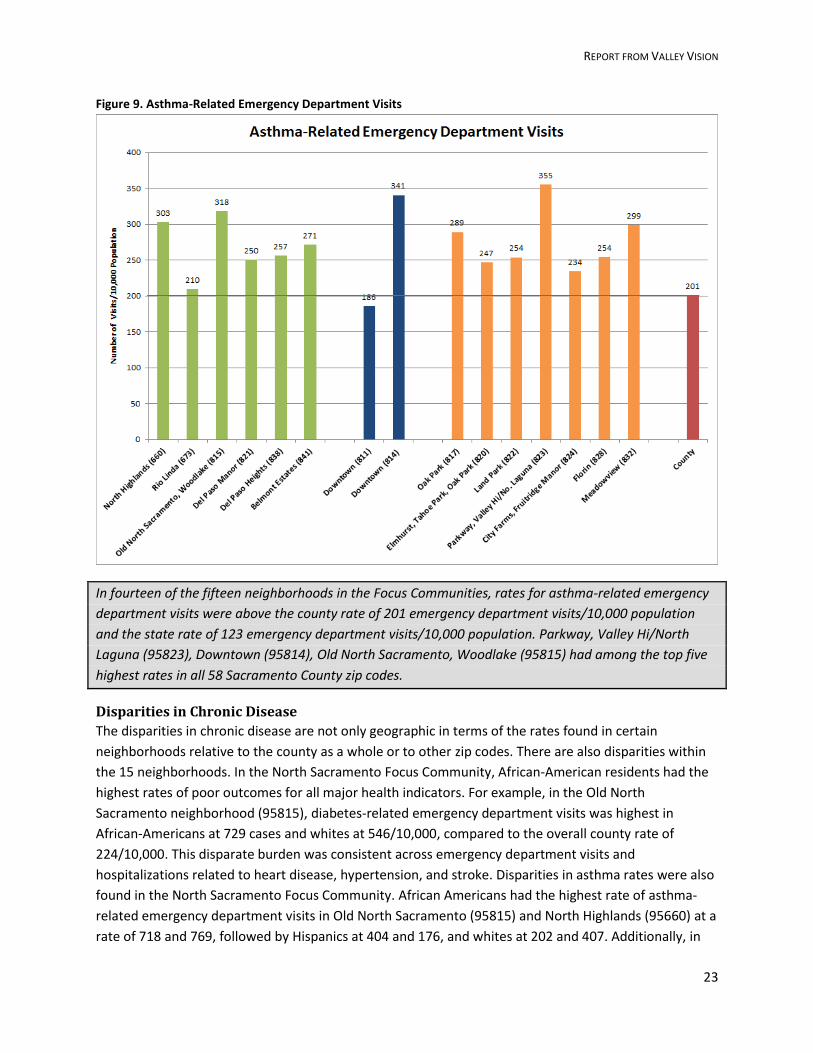
Figure 9. Asthma-Related Emergency Department Visits
In fourteen of the fifteen neighborhoods in the Focus Communities, rates for asthma-related emergency
department visits were above the county rate of 201 emergency department visits/10,000 population
and the state rate of 123 emergency department visits/10,000 population. Parkway, Valley Hi/North
Laguna (95823), Downtown (95814), Old North Sacramento, Woodlake (95815) had among the top five
highest rates in all 58 Sacramento County zip codes.
Disparities in Chronic Disease
The disparities in chronic disease are not only geographic in terms of the rates found in certain
neighborhoods relative to the county as a whole or to other zip codes. There are also disparities within
the 15 neighborhoods. In the North Sacramento Focus Community, African-American residents had the
highest rates of poor outcomes for all major health indicators. For example, in the Old North
Sacramento neighborhood (95815), diabetes-related emergency department visits was highest in
African-Americans at 729 cases and whites at 546/10,000, compared to the overall county rate of
224/10,000. This disparate burden was consistent across emergency department visits and
hospitalizations related to heart disease, hypertension, and stroke. Disparities in asthma rates were also
found in the North Sacramento Focus Community. African Americans had the highest rate of asthma-
related emergency department visits in Old North Sacramento (95815) and North Highlands (95660) at a
rate of 718 and 769, followed by Hispanics at 404 and 176, and whites at 202 and 407. Additionally, in

REPORT FROM VALLEY VISION
24
North Highland, Native Americans had a rate of 187 emergency department visits due to asthma, well
above the state rate of 124.
Similarly to the North Sacramento Focus Community neighborhoods, African Americans in the
Downtown Focus Community experienced higher rates of chronic disease in all areas. For example, the
rates for hypertension related emergency department visits for African Americans in the 95811
neighborhood was over three times that of all other groups in the neighborhood. African American
residents in that neighborhood visited the emergency department for hypertension at a rate of
957/10,000 population compared to the next highest group, whites, who visited at a rate of 271/10,000.
Asthma presented a different pattern. Native Americans were hospitalized for asthma at the highest
rate of all subgroups in the 95811 area.
In the South Sacramento Focus Community, emergency department and hospitalization rates for heart
disease were seen highest in white populations, followed by African Americans, Hispanics, Asian Pacific
Islanders, and Native Americans. In Meadowview (95832), for example, white residents visited the
emergency department due to heart disease at a rate of 347 and African Americans at a rate of 300,
compared to a county rate of 126. One exception is worth noting: in Florin (95828), the highest rates of
emergency department visits due to heart disease were seen in Native Americans at a rate of 322. For
hypertension, African Americans were over-represented in emergency department visits compared to
other groups. For example, in Land Park (95822) African-American residents visited the emergency
department due to hypertension at a rate of 1,518 compared to a county rate of 442. Further, African-
American residents of 95817 were hospitalized at a rate of 1,184 compared to Asian/Pacific Islanders
living in the same zip code with a rate of 204. Asthma rates also indicate health inequities in the South
Sacramento Focus Community. In Parkway, Valley Hi/North Laguna (95823) emergency department
visits due to asthma were highest in African Americans at a rate of 803 compared to the county rate of
201, almost 400% higher. In this neighborhood, hospitalization rates related to asthma were also high in
Native Americans at a rate of 228 compared to a county rate of 97.
Disparities in chronic disease outcomes were found between race and ethnic groups within the 15
neighborhoods. However, the pattern of disparity – which groups had the highest rates relative to others
– varied according to the Focus Community and the specific disease.
Local Gaps and Assets in Preventive Health Care
Health Professional Shortage Areas
Large areas of both the North Sacramento and Downtown Focus Communities were identified as Health
Professional Shortage Areas. These are areas defined by the federal Health Services and Resources
Administration as having a critical shortage of primary care health professionals12. In the North, the
entire Old North Sacramento/Woodlake neighborhood (95815) and most of the Del Paso Heights
neighborhood (95838) were designated as health professional shortage areas. Thus, coupled with the
high rates of uninsured residents mentioned earlier, these two neighborhoods had a large number of
12
See: http://bhpr.hrsa.gov/shortage/

REPORT FROM VALLEY VISION
25
residents with little access to primary health care. (One neighborhood in the South Sacramento Focus
Community, Meadowview (95832), was included in a larger Health Professional Shortage Area to the
southwest, but most of the community had not received the federal designation.)
The Health Professional Shortage Area designation was supported by qualitative data from the key
informant and focus group interviews. For example, when asked to discuss the critical health issues,
most respondents pointed to the inadequacies of basic health services, including primary, specialty, and
dental care. One key informant, when asked to discuss significant health issues in Sacramento County
said: “Our biggest health need is access to healthcare…a basic health network for low income people
(KI_CN_3).” Another key informant in the area expressed a need for access to dental services. One
resident said: “We have on paper these programs that are supposed to provide care for this vulnerable
population and yet we have so many road blocks that make it difficult for them to even access care
(KI_CN_2).”
Significant portions of the North Sacramento and Downtown Focus Communities have been identified as
Health Professional Shortage Areas by the federal Health Resources and Services Administration.
Local Health Care Assets
A list of health assets identified in the assessment is provided in Appendix F. Overall, the North
Sacramento Focus Community had fewer clinical preventive services than the Downtown or South
Sacramento Focus Communities. The Downtown community had a concentration of community clinics,
including Mercy Loaves and Fishes and Clinica Tepati (a UC Davis School of Medicine student-run clinic)
which are targeted primarily at uninsured residents with limited resources. In the South Sacramento
Focus Community, assets included Health-for-ALL, a clinic focused on providing screening and
management of chronic diseases for the un- and underinsured. In addition, this area of the county had a
handful of organizations focusing on meeting the health and social needs of specific subgroups including
Hmong Women’s Heritage Association, Southeast Asian Assistance Center, United lu Mien Community
Inc., and the Mexican American Alcoholism Program.

REPORT FROM VALLEY VISION
26
Social and Emotional Wellness
Sacramento County has higher rates of mental health emergency department visits and hospitalizations
and substance abuse emergency department visits and hospitalizations than the state as a whole. The
15 neighborhoods in the Focus Community have some of the highest rates in the county. Some of the
comments from the key informants and focus group participants illustrate the likely reasons for the
disproportionate prevalence of mental illness and substance abuse. Explaining the perspective of the
families that she services in the North Area, one key informant said:
They were thinking just “I got to survive. I am in survival mode.” So slowly we are moving people
along to where we are, they are stable and then eventually we get them from stable to thriving.
That is something that we hope will change. But when you are constantly thinking about
survival, the preventative stuff is just [not a priority] (KI_2_1).
Another participant said that the many chronic health conditions that North Sacramento residents
struggle with were a result of the conditions in which they lived daily: “…you see people who have
chronic health issues because of the crisis survival mode that they are living in (KI_1_2).” These
conditions may go untreated. Several key informants indicated that lack of mental health treatment
facilities were a barrier to social and emotional wellness for residents. As one informant said, “…but
there is just no good place to send [MH patients] because there are really no good psychiatric facilities as
far as capacity; there’s good facilities, but their capacity is limited (KI_4_5).” Another commented,
“Something really bad has to happen before you can get any mental health treatment and that is very
scary for everyone (KI_4_1).”
Mental Illness Related Emergency Department Visits and Hospitalizations Emergency department visits and hospitalizations for mental illness and substance abuse were
examined as indicators of social and emotional wellness.
The county rate of emergency department visits due to mental health was 489/10,000 population and
for hospitalizations it was 377/10,000. In comparison, the Downtown 95814 neighborhood rates were
2,250/10,000 for emergency department visits and 1,464/10,000 for hospitalizations. The 95814
neighborhood had the highest rates of any zip code in the county. The other Downtown neighborhood
(95811) had the third highest rate of emergency department visits (904/10,000) and the fifth highest
rate of hospitalizations (607/10,000). All but one of the 15 neighborhoods had emergency department
visit rates higher than the county rate and thirteen had hospitalizations exceeding the county rate.
Rates of emergency department visits and hospitalizations due to mental illness in the Downtown 95814
neighborhood are the highest in the county and dramatically higher than the county rates. Several of the
other neighborhoods also have elevated rates relative to the county overall.

REPORT FROM VALLEY VISION
27
Figure 10. Mental Health-Related Emergency Department Visits
Figure 11. Mental Health-Related Hospitalizations

REPORT FROM VALLEY VISION
28
Emergency Department Visits and Hospitalizations due to Substance Abuse
All 15 neighborhoods had rates of substance abuse-related emergency department visits and
hospitalizations higher than the county rate of 176/10,000. As with the mental health indicators, the
Downtown 95814 neighborhood had rates that far exceeded the other neighborhoods.
Figure 12. Substance Abuse-Related Emergency Department Visits

REPORT FROM VALLEY VISION
29
Figure 13. Substance Abuse-Related Hospitalizations
The data on hospitalizations and emergency department visits related to mental illness or substance
abuse show strikingly similar patterns. For each indicator, the Downtown Focus Community
neighborhood in zip code 95814 is as much as five times that of the county rate and more than twice as
high as the next highest rate in the 14 other neighborhoods in the Focus Communities.
Disparities in Indicators of Mental Health In the North Sacramento and Downtown Focus Communities, African Americans had the highest rates of
emergency department visits and hospitalizations for mental illness and substance abuse. For example,
in Del Paso Manor (95821), African Americans had rates of emergency department visits was
1,649/10,000, while rates for whites, Hispanics and Native Americans were 832/10,000, 402/10,000 and
367/10,000 respectively. In the South Sacramento Focus Community, whites and African Americans
visited the emergency department for mental health conditions at similar rates; however whites were
hospitalized for the same conditions at much higher rates.

REPORT FROM VALLEY VISION
30
Healthy and Safe Physical Environment
The health and safety of the physical environment in the Focus Communities was assessed primarily
through the rates of emergency department visits and hospitalizations due to injury, accidents, homicide
and violence. The following table shows the pattern of emergency department visits for the 15
neighborhoods relative to the county rate.
Emergency Department Visits for Accidents, Homicide, Injury or Violence
In 2010, heart disease and cancer were the two top leading causes of death across all racial and ethnic
groups and for both females and males in Sacramento County. Accidents were the third most common
cause of death for Hispanics and the fourth most common cause for African Americans, while fifth for
Caucasians and eighth for Asian/Pacific Islanders. Homicide was seventh for African Americans and not
on the list of top ten causes of death for any of the other groups. Disparities are also seen in the
incidence of accidents, homicides, injury, and violence in the Focus Communities compared to the
county as a whole.
Table 9. Emergency Department Visits for Accidents, Homicide, Injury or Violence
Neighborhood (zip code) Accidents Homicide Injury Violence
North Sacramento Focus Community
North Highlands (95660) 21 60 980 40
Rio Linda (95673) 19 41 810 28
Old North Sacramento, Woodlake (95815) 27 84 1,041 63
Del Paso Manor (95821) 24 58 873 34
Del Paso Heights (95838) 21 58 847 43
Belmont Estates (95841) 17 55 907 38
Downtown Focus Community
Downtown (95811) 46 84 715 67
Downtown (95814) 54 194 1,736 129
South Sacramento Focus Community
Oak Park (95817) 35 86 958 67
Elmhurst, Tahoe Park, Oak Park (95820) 21 63 870 48
Land Park (95822) 15 43 755 27
Parkway, Valley Hi/North Laguna (95823) 19 65 874 46
City Farms, Fruitridge Manor (95824) 24 54 810 32
Florin (95828) 16 42 735 29
Meadowview (95832) 15 58 842 34
Sacramento County 18 39 710 27
= Highest rate of the 15 neighborhoods = Rate below the county rate

REPORT FROM VALLEY VISION
31
After the Downtown 95814 neighborhood, the South Sacramento Focus Community had some of the
highest rates of accidents, homicides, injuries and violence of anywhere in the county. For example,
residents of 95817, 95823, and 95820 visited the emergency department due to homicide at twice the
rate of the county (86, 65, and 63 respectively compared to a county rate of 39).
Hospitalizations due to Accidents, Homicide, Injury or Violence
The pattern of hospitalizations related to accidents, homicide, injury or violence is very similar to that
for the emergency department visits. For every 10,000 residents, the county has hospitalization rates of
2.70 related to accidents, 6.04 for homicide, 208.11 due to injury and 4.28 caused by violence.
Comparing these rates to those for the 15 neighborhoods, the following neighborhoods rise to the top
repeatedly:
The Downtown 95814 neighborhood had the highest rates for all four indicators.
For accidents, the Downtown 95814 rate is 12.13, followed by Oak Park (95817) with 6.9. With a
rate of 4.5, Old North Sacramento/Woodlake (95815) also had a high rate of hospitalizations for
accidents relative to the county.
For homicide, the Downtown 95814 rate is 40.7. The next highest rate is Old North
Sacramento/Woodlake (95815). It had 15.42 hospitalizations due to homicide for every 10,000
residents.
The rates of hospitalization for injury were highest for the Downtown 95814 neighborhood with
646.04. Oak Park (95817 – 294.79), Rio Linda (95673) – 286, and Old North
Sacramento/Woodlake (95815) followed with rates of 294.79, 286.14 and 282.56, respectively.
The Downtown 95814 rate of hospitalizations for violence was 19.85, more than four times the
county rate (4.28). Old North Sacramento/Woodlake (95815) has a rate more than twice as high
– 10.3.
In the South Sacramento Focus Community, African Americans were greatly overrepresented in the
safety indicator rates. For example, the rate of emergency department visits due to homicide was
129/10,000 for African Americans while the county rate was 39 and the state rate was 32.
Several of the neighborhoods had rates of emergency department visits and hospitalizations higher than
the county rate. The Downtown 95814 neighborhood had the highest rates, including some more than
four times the county.
Other Safe and Healthy Physical Environment Indicators
The healthy environment indicators overlap and interact with those for active living. As described in the
section on active living, crime as well as traffic conditions affect residents’ sense of safety. These
concerns were a theme in the qualitative data. For example, one key informant said: “I have known like
two people that have gotten killed and they were elderly…[people] just do their daily strolls and they
have gotten hit [by cars] (KI_CN_7).”

REPORT FROM VALLEY VISION
32
Appendix A – Methodology Overview
This appendix describes the data sources, analytical framework and steps used to identify the focus
communities and assess community needs and assets.
Data Sources
The community health needs assessment analyzed secondary data from a variety of databases and
collected primary data through activities at the Healthy Sacramento Coalition meetings, key informant
interviews, community focus groups, and a community assets assessment. Sacramento County was the
focus for the assessment. Zip code boundaries were used to identify specific geographic communities
within the county experiencing disparities in chronic disease and mental health. Some indicators were
included in the assessment at the census tract level.
Secondary Data
Secondary data sources were selected based on the following criteria:
Sources must be credible as a source of high quality data.
Data must be reported consistently over time in the same way so that changes over time can be tracked.
Data must be available at the zip code (or smaller) level.
Major sources for secondary data on health outcomes and sociodemographic variables included:
California Office of Statewide Health Planning and Development (hospitalization and emergency department utilization data)
California Department of Public Health (mortality data)
Dignity Health Community Need Index
U.S. Census
California Health Interview Survey
For information on the sources and definitions for specific variables, including the variety of sources for
the behavioral and environmental health indicators, see Appendix B. Details on the processing and
analysis of the secondary data are provided in Appendix C.
Primary Data
Qualitative primary data were collected through:
Semi-structured activities at community meetings with the Healthy Sacramento Coalition
Key informant (KI) interviews with area experts
Focus groups (FG) with area community members
Community asset collection via phone interviews and website analysis Community Meetings

REPORT FROM VALLEY VISION
33
Data were collected from over 70 Coalition members at multiple Healthy Sacramento Coalition meetings
over the nine-month period. Each meeting allowed for the Healthy Sacramento Coalition to provide
input to the health assessment at key phases of the work, including the identification of data sources,
identification of organizations for KI interviews and focus groups, and discussion of preliminary findings.
At one of the meetings more than 70 attendees participated in a data collection forum where they were
asked to identify populations with health vulnerability, using maps of Sacramento County. Participants
were also asked to note special characteristics of communities by zip code and populations on the map.
Facilitators and note takers were assigned to each group, and findings were recorded and summarized
for inclusion in the health assessment. This data (combined with demographic data) served to inform
the location and selection of KI and FG interviews for the assessment.
Key Informant Interviews
To gain a deeper understanding of the health issues pertaining to chronic disease and populations living
in the county’s more vulnerable communities, 31 KI interviews were conducted that included a total of
47 health experts familiar with these populations and geographic areas. The interviews were conducted
using a theoretically grounded interview guide (see Appendix B). Each interview was recorded and
transcribed and thorough content analysis was conducted to identify key themes and important points
pertaining to each geographic area. Findings from these interviews were also used to help identify
communities for focus groups.
Focus Groups
Members of the community representing subgroups experiencing disparities were recruited to
participate in focus groups. In all, a total of 124 community members participated in 10 focus groups (for
locations see Appendix C). To understand the lived experiences of these community members as it
relates to health disparities and chronic disease, a standard protocol was used for each focus group (See
Appendix D). Demographic data collected based on interviewer observation indicated that participants
ranged in age from 18-60 years old, were 71% female, 29% male, and 23% white, 32% African-American,
13% Asian, 30% Latino, and 2% Other race. Two focus groups were conducted in Spanish, one in Hmong,
and one in Slavic (Russian). Each focus group was recorded, transcribed, and analyzed using a content
analysis method to identify key themes and salient topics to addressing the study questions and
objectives.
Community Assets
Data were collected on programs and services available throughout the community related to specific
health conditions in accordance with the CTG priority areas. A list of existing resource directories was
compiled, and additional assets identified through internet searches were added to this master list.
Detailed information for each identified asset was gathered though scans of each organization's
websites (where available) and, when possible, direct contact with staff. The final list of community
health assets contains 208 entries. Assets identified as being located in specific Focus Communities
identified in this report can be seen in Appendix E).

REPORT FROM VALLEY VISION
34
Identifying and Describing Communities Experiencing Health Disparities
By taking a systematic approach, the study was able to look at the issues affecting health (physical,
mental and emotional) from many angles. The analytical framework for collecting and organizing
information consisted of several process steps.
Step 1: Mapping Sacramento County’s Social Determinants of Health
The first step in the process was to examine socio-demographic data in order to identify areas of the
county with high vulnerability to chronic disease disparities and poor mental health outcomes. A map
was developed which included race/ethnicity, household composition, income, and age of residents in
each census tract in the county. These variables were combined into an index that assigned a level of
“vulnerability” to each census tract.
The tract level vulnerability index is based on measurements of populations within each Census tract
that correspond to disadvantaged groups who are expected to experience greater health disparities.
These populations include members of minority groups, single parent households, the very young, the
elderly population, and those in poverty. To calculate the index, 2010 American Community Survey 5-
year estimates data at the tract level were obtained for the following variables: the percent non-white
or Hispanic population, the percent of single parent households, the percent of population with income
below 125% of the poverty level, the percent of population below 5 years of age, and the percent of
population above 65 years of age. Values for each variable were standardized so that the maximum
value equaled 1 and the minimum equaled 0. These standardized values were then summed for each
tract to produce the index. Therefore, tracts with index values closer to 0 have relatively lower
proportions of these sensitive groups, while tracts that have values closer to 5 have relatively higher
proportions of these groups. Residents of a census tract were considered more vulnerable to negative
health outcomes if they had consistently high values of: 1) % of total population that was non-white or
Hispanic, 2) % of all households that were single-parent living in poverty, 3) % of all populations living at
1. Vulnerability Index
+ Community Coalition Input
2. Key Informant Interviews + Health Outcome Indicators
3. Focus Group Selection
4. Identifying Focus Communities
5. Characteristics of Focus Communities
6. Behavioral and Environmental Charactertics

REPORT FROM VALLEY VISION
35
or below 125% of the federal poverty level, and 4) % of the population under five or over 65 years of age
living in the tract.
In combination with input from the Healthy Sacramento Coalition and the results of the vulnerability
index, vulnerable neighborhoods were identified across the county. These became areas initially focused
on for conducting KI Interviews.
Vulnerable Communities in Sacramento County (by Census Tract)
Caption: Census tracts that appear darker in color are those that calculated to have more health disparities based on their demographic profile.
REPORT FROM VALLEY VISION
36
Steps 2 and 3: Focus Group Selection
Selection of locations to conduct focus groups was made with input from KI interviews and analysis of
health outcome indicators (emergency department visits, hospitalization, and mortality rates) that
pointed to disease severity. KIs were asked to identify populations (subgroups) that were most at risk for
chronic health disparities and mental health issues in their service areas. In addition, analysis of health
outcome indicators by zip code, and race/ethnicity, age, and gender, revealed communities with very
high rates above established benchmarks of state, county, and Healthy People 2020 targets. This
information was compiled to determine where in the county focus groups would be best targeted.
Step 4: Identifying Focus Communities
A total of 15 neighborhoods were identified as experiencing the greatest degree of health disparities
based on input from the Healthy Sacramento Coalition, primary data collected from KIs and FGs, and
detailed analysis of secondary health outcome data. To identify these neighborhoods (identified by zip
code boundaries), health outcome data were compared to county, state, and/or Healthy People 2020
benchmarks for emergency department utilization, hospitalization, and mortality. Those zip codes that
consistently ranked in the top 20% as having the highest rates for such conditions were noted, and
triangulated with primary data input as noted above.
Study Limitations Limitations of secondary data are a common issue in this kind of assessment. Emergency department
visit and hospitalization data used in this assessment are markers of prevalence, but do not fully
represent the prevalence of a disease in a given zip code. Currently there is no existing publically
available data set that has prevalence markers at the sub-county level for the core health conditions
focused on in this assessment: heart disease, diabetes, hypertension, stroke and mental health.
Similarly, behavioral level data at the sub-county level was also difficult to come by and not available by
race/ethnicity. CHIS data used in this assessment were hard to acquire, not current (some coming from
2003-2005) and necessitated the use of “small region” estimates.
Ensuring the inclusion of community voice can also be challenging. Many measures were taken reach
out to area organizations that represented a Focus Community geographically, racially/ethnically or
culturally, including providing incentives for the participants and food and refreshments during the
interview. Additionally, collecting data on all county assets for the community health asset assessment
was very difficult. Many organizations were hesitant to provide information to our staff over the phone,
resulting in limited data on some assets.

REPORT FROM VALLEY VISION
37
Appendix B – Data Dictionary

REPORT FROM VALLEY VISION
38

REPORT FROM VALLEY VISION
39

REPORT FROM VALLEY VISION
40
Appendix C – Secondary Data Processing Methodology
Data processing for the Healthy Sacramento Coalition Community Health Needs Assessment included a
number of general pre-processing steps applied to OSHPD and CDPH data, as well as particular
processing steps applied to calculate specific indicators. This appendix details both these general as well
as the specific process methodologies. For a detailed description of data sources, please refer to the
Data Dictionary in Appendix B.
General Data Pre-Processing
Four sets of general pre-processing steps were applied to the health outcome data obtained from
OSHPD (Hospitalization and Emergency Department utilization data) and CDPH (mortality data). First,
data reported by patient mailing zip codes were aggregated into US Census Bureau defined zip Code
Tabulation Areas (ZCTA) so they could be compared to population figures. Next, empirical Bayes (EB)
smoothed rates were calculated (where possible) for all input data. Age-adjusted rates were then
calculated for a subset of the OSHPD hospitalization and emergency department utilization data. Finally,
specific mortality related indicators, including life expectancy and infant mortality, were calculated
based on multiple years of data. The details for each of these processes are given below.
Zip Code to ZCTA Conversion
The hospitalization and emergency department usage data obtained from OSHPD, as well as the
mortality data obtained from CDPH, present some initial challenges to appropriate analysis. Both data
sets provide counts based on patient zip code. But zip codes are limited in their usefulness because they
represent either a collection of streets to which mail is delivered, a post office box, or even potentially
the campus of a large institution. zip codes corresponding to mail carrier routes are not necessarily
continuous, and do not directly correspond to any Census units for which population is collected.
The Census Bureau does, however, define regions called Zip Code Tabulation Areas (ZCTAs). ZCTAs are
created by identifying the predominate zip code of addresses within a census block, and then
aggregating census blocks corresponding to a particular zip. While ZCTAs are the closest Census defined
area to a zip code, they do not necessarily include all zip codes for which patient records are reported.
PO boxes, for example, may not be included in the ZCTAs that cover an area.
The first step in our data pre-processing was, then, to determine the relationship between patient zip
codes and ZCTAs. We did this in two steps. First, we assumed that while ZCTAs may not perfectly match
mailing zip codes, they were a reasonable representation for those zip codes with corresponding ZCTAs.
For example, while the ZCTA for 95815 may not include all (or exclusively) addresses with the mailing zip
code 95815, we assumed it to be an appropriate surrogate. For PO Box zip codes that had no
corresponding ZCTA, we identified the ZCTA within which the PO Box was located. We then assigned the
PO Box’s utilization or mortality counts to that ZCTA. This assumes that all patients receiving mail at a
given PO Box reside within the ZCTA in which that PO Box falls. While we recognize that this assumption
may not be correct in all cases, we felt that this shortcoming was preferable to ignoring patients with PO
Box zip codes.

REPORT FROM VALLEY VISION
41
Rate Calculation and Smoothing
Once input utilization and mortality data were converted to zip codes, their counts could be compared
to the Census reported populations for those areas to create utilization and mortality rates. But the
calculation of rates can pose an additional challenge. Raw rates (calculated by dividing counts by the
population of each ZCTA) can result in very misleading results in areas with small populations. Areas
with small populations can have misleadingly high rates with small numbers of events occurring. An area
with a population of 20, for example, would have a rate of 2,500 emergency department visits due to
injuries per 10,000 individuals if only 5 people visited the emergency department in a given year. This is
what is referred to as the small number problem. Additionally, conditions with very small numbers
occurring in a given year can lead to large variations in rates reported year after year.
We address these issues using rate smoothing. All OSHPD and CDPH data for this analysis were
smoothed using an EB approach. EB smoothing13 essentially works by first calculating an overall
expected rate based on values observed across a study area. In this case, ZCTAs in Solano, Sacramento,
Yolo, Nevada, El Dorado, Placer, and Amador counties were used for the wider region. The rate for each
ZCTA is then compared to this overall rate, and the ZCTA rate is adjusted to more closely match the
overall rate. Rates for areas with large populations receive very small adjustments. Rates for areas with
very small populations receive large adjustments. In this way, spuriously high rates for areas with small
populations are “shrunk” towards the overall regional mean rate, resulting in a more realistic estimate
of the true, underlying mean for the variable. Finally, since this smoothing technique addresses variance
instability by modifying the rate for every zip code, it also acts as an additional safeguard of patient
privacy.
Calculation of Age Adjusted Rates
In addition to the smoothing step described above, age adjusted rates were calculated for both
emergency department and hospitalization utilization data for diabetes, heart disease, hypertension,
and stroke. Direct age adjustment14 was used in this analysis, based on a 2010 California state standard
population generated for this analysis using 2010 Census population data and stroke.
Multi-Year Aggregation of Selected Mortality Indicators
While the majority of mortality indicators were processed using the steps described above, additional
steps were taken in the calculation of the higher level mortality indicators: infant mortality rate, age
adjusted mortality rate, and life expectancy at birth. To further remove issues related to the small
number problem, as well as instability due to annual variation, these indicators were calculated using 5
years worth of data. Mortality data from CDPH from 2006-2010 were summed for each reported zip
13
Our implementation of EB smoothing uses priors estimated through the moments method; details can be found in Anselin, L., Kim, Y.-W., and Syabri, I. (2004). Web-based analytical tools for the exploration of spatial data. Journal of Geographical Systems, 6:197–218; and Bailey, T. C. and Gatrell, A. C. (1995). Interactive Spatial Data Analysis. John Wiley and Sons, New York, NY, p 306. 14
Curtin, LR, Klein, RJ. Direct Standardization (Age-Adjusted Death Rates). Statistical notes; no.6. Hyattsville, Maryland: National Center for Health Statistics. March 1995.

REPORT FROM VALLEY VISION
42
code15. Estimated zip code population figures for the total population, as well as by age group, in 2008
(the central year of the 5 year period) was obtained from GeoLytics. The GeoLytics data did not include
estimates for the population under 1 year of age. Population in this age group was included in the 0 to 4
years of age group. Population under 1 in 2008 was estimated for each zip from the GeoLytics data by
multiplying the estimated population from 0 to 4 by the proportion of that age group who were under 1
year for the corresponding ZCTA in 2010. EB smoothed mortality rates were then calculated for each age
category. These rates were then used to calculate an age adjusted all cause mortality rate using the
same methodology and standard population described previously. These age stratified mortality rates
were also used to calculate the life expectancy at birth variable16. Finally, the infant mortality rate for
each ZCTA was calculated as an EB smoothed rate based on 2006-2010 infant mortality and live birth
data from CDPH.
Additional Specific Variables
While we attempted to use existing data from reputable sources to the fullest extent possible, there
were a number of areas where this was not possible. As a result, in addition to the general data
processing steps described above, we created or derived several other specific indicators for this
analysis. These included the Census tract level, demographic-based vulnerability index; the major crime
rate indicators for the Sacramento PD and Sacramento County Sheriffs; and the park accessibility
variables.
Major Crime Rate Indicators
The definitions of major crimes used in this analysis follow the reporting in the California Attorney
General’s office Criminal Justice Profiles Crimes by County table17. Crimes reported in this table include
homicide, forcible rape, robbery, aggravated assault, burglary, motor vehicle theft, larceny, and arson.
Data from this table was used to calculate crime rates for all incorporated cities excluding the City of
Sacramento. Crime data reported by police beat by the Sacramento Police Department18, and by zip
code for the Sacramento County Sheriff’s Department19 were used to calculate these rates for the City
of Sacramento, and the unincorporated portions of the county, respectively. But these values should be
viewed as approximations for a number of reasons.
First, Sacramento PD sometimes respond to calls outside the city, just as at times the Sheriff’s
department responds to calls inside incorporated cities. Because these calls are reported to the separate
15
To address changes in zip codes during this 5 year period, relationship tables were created to show how zips in each year related to the configuration of zips in 2008, the central year of the analysis. A zip code was deemed to exist in a given if cases had been reported in that zip in the current or any prior years. 16
Life expectancy at birth was calculated in R using code based derived from: Hunsinger, Eddie. 2011. R Code for a Period Life Table. Available online at: http://www.demog.berkeley.edu/~eddieh/AppliedDemographyToolbox/StanfordCourseLifeTable/StanfordCourseLifeTableCode.txt (Last Accessed September 20, 2012). 17
Available online at: http://oag.ca.gov/crime/cjsc-stats/2010/table11. (Last accessed September 21,2012) 18
Available online at: http://www.sacpd.org/crime/stats/#databases. (Last accessed September 21, 2012) 19
Available online at: http://www.sacsheriff.com/organization/support_services/field_support_division/records/crime_report.cfm. (Last accessed September 21, 2012)

REPORT FROM VALLEY VISION
43
agencies, they may not include activities occurring within their jurisdictional boundaries that were
responded to by another agency. Second, the coding systems used to categorize crime types were not
consistent between the three sources. While efforts were made to use consistent standards based on
the textual descriptions of the events, these efforts may not have been completely successful. Third,
additional coding errors, or misclassification of the coded information, may have resulted in further loss
of information. Finally, these data are based on a mixture of known crimes, crime reports, and arrest
records, and may not reflect the true underlying nature of crime in particular areas due to differences in
under-reporting, over-reporting, or a host of other societal issues.
Park Accessibility
Park accessibility is used in this analysis to inform an understanding about the distribution of
opportunities to engage in physical activity across the county. Measures of park accessibility should
include both a consideration of population proximity to parks, as well as the quality of the parks, which
can be related to park size20. To capture both of these issues, we created two complementary park
accessibility variables: the number of people with no parks within ½ mile, and for those areas with parks
within a half mile, the number of people per total area of all parks within ½ mile.
The creation of both of these variables began with the use of dasymetric mapping tools to create an
estimate of the distribution of the residential population within the county along a grid in which each
grid cell was just under an acre in area. To do this, county zoning data was used to identify all of the
residential parcels in the county. 2010 Census block population counts were then distributed evenly
throughout the area of all the residential parcels that fell within them. These values were then assigned
to the approximately acre sized grid cells. These population grid cells were then compared to the
locations of parks21. Populations in grid cells that were not within ½ a mile of a park were included in the
no parks within ½ mile variable. For those grid cells that were within ½ mile of a park, the population of
the grid cell was divided by the total land area of all parks that could be reached within ½ mile. This
comparison of population to total park area serves as an indicator of park quality, assuming that areas
that have a lower density of people per park area will allow residents greater freedom of access to the
parks.
20
Cutts, BB, Darby, KJ, Boone, CG, Brewis, A. (2009) City structure, obesity, and environmental justice: An integrated analysis of physical and social barriers to walkable streets and park access. Social Science & Medicine.69(9):1314-1322. 21
ESRI. 2010. parks.sdc. ESRI® Data & Maps, 10th edition – World, Europe, and United States. (data file)

REPORT FROM VALLEY VISION
44
Appendix D – Key Informant Interview Guide
Project Objective
In order to provide necessary information for sponsoring hospital’s community benefit plans and the
Healthy Sacramento Coalition to develop an implementation plan…
For each Health Service Area (HSA), identify communities and specific groups within these
communities experiencing health disparities, especially as these disparities relate to chronic
disease, and further identify contributing factors that create both barriers and opportunities these
populations to live healthier lives.
____________________________________________________________________________________
Objective #1: To understand the predominate health issues in a HSA, and those subgroups
disproportionately experiencing these issues
Question #1: What are the biggest health issues [your community, your HSA, you] struggles with?
Probes:
Diabetes, high blood pressure, heart disease, cancer Mental Health Other issues, including those that are emerging that often go undetected
Question #2: Who [which specific sub-group(s)] within [your community, your HSA] appear(s) to
struggle with these issues the most?
Probes:
How do you know, what leads you to make this conclusion? Describe race/ethnic makeup of HSA to KI if needed Subgroups within the larger categories Where in [your community, your HSA] do these groups live? Describe family status of HSA to KI if needed Describe the socio-economic status of the HSA to KI if needed Describe the overall vulnerability of the HSA to KI if needed
Question #3: In what ways do these health issues affect the quality of life of those that struggle with
them the most (those subgroups identified above)?
Objective #3: Determine the barriers and opportunities to live healthier lives in the HSA
Question #4: What are some challenges that [your community, your HSA] faces in staying healthy?
Probes:
Behaviors common to your community? Cultural norms and beliefs held by any subgroup, especially those identified above Smoking Diet, relationship with food Physical activity, relationship with one’s body

REPORT FROM VALLEY VISION
45
Safety Access to preventive services, access to basic healthcare [For specific KIs] Policies, laws, regulations (provide example if needed)
Question #5: What are opportunities in [your community, your HSA] to improve and maintain
health? What does your community have that helps [your community, your HAS] live a healthy life?
Probes:
Shifting social and community norms and beliefs Smoking and tobacco use Opportunities to exercise Access to fresh produce, healthier diet Areas for families to gather Sense of community safety Access to preventive services, access to basic healthcare [for specific KIs] Policies, laws, and/or regulations that can be updated, nullified, amended, or
enacted
Questions #6: Of all those you noted above, what is the biggest thing needed to improve the overall
health of [your community, HSA]?
Probes:
Policies? Partnerships? Economic growth? Other? Who is responsible for creating that change?
Question #7: What else does our team need to know about [your community, HSA] that hasn’t
already been addressed?

REPORT FROM VALLEY VISION
46
Appendix E – Focus Group Interview Guide
Project Objective
In order to provide necessary information for sponsoring hospital’s community benefit plans and the
Healthy Sacramento Coalition to develop an implementation plan…
For each Health Service Area (HSA), identify communities and specific groups within these
communities experiencing health disparities, especially as these disparities relate to chronic
disease, and further identify contributing factors that create both barriers and
opportunities these populations to live healthier lives.
____________________________________________________________________________
Objective #1: To understand the predominate health issues in a HSA, by those subgroups
disproportionately experiencing these issues
Question #1: What are the biggest health issues [your community, your family, you] struggles with?
Probes:
Diabetes, high blood pressure, heart disease, cancer Mental Health Other issues, including those that are emerging that often go undetected
Objective #2: Determine contributors to the health outcomes experienced by participants.
Question #2: What do you think is causing these health outcomes and health issues you’ve
described?
Probes:
Tobacco use Diet Stress and anxiety Physical activity Cultural norms and beliefs pertaining to health, diet, and exercise
Question #3: Do you think there are things where you live that contribute to some of the health
outcomes and health issues you’ve described?
Probes
Perception of safety when outdoors Lack of places to exercise Second hand smoke Etc.
Objective #3: Determine the barriers and opportunities to live healthier lives in the HAS
Question #4: What are some challenges that [your community, your HSA] faces in staying healthy?
Probes:
Behaviors common to your community?

REPORT FROM VALLEY VISION
47
Cultural norms and beliefs held by any subgroup, especially those identified above Smoking Diet, relationship with food Physical activity, relationship with one’s body Safety Access to preventive services, access to basic healthcare Policies, laws, regulations (provide example if needed)
Question #5: What are the opportunities in [your community, your HSA] to improve and maintain
health? What does your community have that helps [your community, your HAS] live a healthy life?
Probes:
Shifting social and community norms and beliefs Smoking and tobacco use Opportunities to exercise Access to fresh produce, healthier diet Areas for families to gather Sense of community safety Access to preventive services, access to basic healthcare Policies, laws, and/or regulations that can be updated, nullified, amended, or enacted
Question #6: Of all those you noted above, what is the biggest thing needed to improve the overall
health of [your community, HSA]?
Probes:
Policies? Partnerships? Economic growth? Other? Who is responsible for creating that change?
Question #7: When have you seen your community experience its greatest successes and/or
accomplishments? What happened to account for the success?
Question #8: What are your community’s greatest strengths and assets? How have these been used
in the past to create positive change?
Question #9: What would you like the hospital systems to know about your community? What can
the hospital systems do to improve the health of your community?
Question #10: What else does our team need to know about [your community, HSA] that hasn’t
already been addressed?

REPORT FROM VALLEY VISION
48
Appendix F – Community Assets
Community assets were identified primarily through the key informant and focus group interviews and a
review of members of the Healthy Sacramento Coalition. Only those organizations that are physically
located in the Focus Community are identified. There are organizations that are not listed (because their
address is outside the community) that provide services to neighborhood residents (clinics in zip codes
contiguous to those included in the Focus Communities, for example). In addition, although identified by
the neighborhood in which they are geographically located, many of the organizations in the following
tables serve a wider geographic community.
Clinics and Service Organizations in Multiple Neighborhoods
Name Tobacco-
Free Living Active Living-
Healthy Eating Clinical
Preventive S-E
Wellness Physical
Env.
Birth & Beyond (95660, 95814, 95820, 95822, 95823, 95824)
X X X
Family Resource Centers (95815, 95822, 95823)
X
Health for All Community Clinics (95815, 95822, 95832)
X
Health & Life Organization (HALO) Community Clinicis (95815, 95823)
Mercy Clinics (95838, 95811) X X X X
Planned Parenthood (95814, 95820, X
Sacramento Community Clinic (95815, 95823)
X X X
Sacramento County Wellness and Recovery Centers (95821, 95823)
X
Sacramento Food Bank and Family Services (95815, 95817)
X
WEAVE (95811, 95823) X
WellSpace Health (formerly The Effort) (95660, 95815, 95811, 95817, 95824)
X X X X
North Sacramento Focus Community Assets
Name Tobacco-
Free Living Active Living-
Healthy Eating Clinical
Preventive S-E
Wellness Physical
Env.
North Highlands (95660)
American Diabetes Association X
Child Abuse Prevention Center X
New Testament Baptist Church (Kitchen Ministry)
X
Old North Sacramento; Woodlake (95815)
American Cancer Society X X
California Diabetes Program (Dignity Health) X

REPORT FROM VALLEY VISION
49
Name Tobacco-
Free Living Active Living-
Healthy Eating Clinical
Preventive S-E
Wellness Physical
Env.
Calvary Christian Center (Medical care clinic days)
X
Center for Fathers and Families X X
Harmon Johnson Healthy Start X X X
Health for All (Clinic) X X
Roberts Family Development Center X X
WIND Youth Services X X X X X
Del Paso Manor (95821)
Interim HealthCare/Interim HomeStyle Services
X X
Muslim American Society-Social Services Foundation
X
Wellness and Recovery Center X
Del Paso Heights (95838)
Bayanihan Clinic X X
Mutual Assistance Network X X X X
Sacramento Area Community Garden Coalition
X X
Downtown Sacramento Focus Community Assets
Name Tobacco-
Free Living Active Living-
Healthy Eating Clinical
Preventive S-E
Wellness Physical
Env.
Downtown (Richards, Alkali Flats, Mansion Flats, Midtown, Richmond Grove, Southside Park) (95811)
Alchemist Community Development Corporation
X
American Heart Association, Sacramento X X
Center for AIDS Research, Education and Services (CARES)
X X X
Center for Community Health and Wellbeing (The Birthing Project)
X X
Central Downtown Food Basket X
Clean and Sober Homeless Recovery Communities
X
Clinica Tepati X
Loaves and Fishes X X
Sacramento Housing Alliance X
Sacramento Native American Health Center, Inc
X X X X
YWCA X

REPORT FROM VALLEY VISION
50
Name Tobacco-
Free Living Active Living-
Healthy Eating Clinical
Preventive S-E
Wellness Physical
Env.
Downtown (95814)
Breathe California of Sacramento Emigrant Trails
X X
California Black Health Network X X X
El Hogar X
Guest House Homeless Services X
Native TANF Program X X X
Salvation Army-Adult Rehabilitation Center X
Saving Our Legacy, African Americans for Smoke-Free Safe Places (SOL Project)
X
Sacramento Taking Action Against Nicotine Dependence (STAND Project)
X
WALKSacramento X X
South Sacramento Focus Community Assets
Name Tobacco-
Free Living Active Living-
Healthy Eating Clinical
Preventive S-E
Wellness Physical
Env.
Oak Park (95817)
Harm Reduction Services/Joan Viteri Memorial Clinic
X
Imani Clinic X
Ubuntu Green X X
Elmhurst, Tahoe Park, Oak Park (95820)
Another Choice, Another Chance X
La Familia Counseling Center X X X X X
Land Park (95822)
South Sacramento Interfaith Emergency Food Closet
X
Southeast Asian Assistance Center X
Parkway, Valley Hi/North Laguna (95823)
Golden Rule Services X
Hmong Women’s Heritage X X
Kaiser Permanente X X X X
Mexican American Alcoholism Program (MAAP
X
Sacramento County Public Health Division
Strategies for Change X
Visions Unlimited X X

REPORT FROM VALLEY VISION
51
Name Tobacco-
Free Living Active Living-
Healthy Eating Clinical
Preventive S-E
Wellness Physical
Env.
City Farms, Fruitridge Manor (95824)
United Iu Mien X
Meadowview (95832)
Antioch Progressive Church X X
Genesis Missionary Baptist Church X
Top Related