


Languages
Pages
Legal


Contacts: Pat Sheaffer, Ron Wysaske or Kevin Lycklama, Riverview Bancorp, Inc. 360-‐693-‐6650
Riverview Bancorp Earns $2.0 Millin in Third Fiscal Quarter; Highlighted by Strong Revenue Growth and Improved Net Interest Margin
Vancouver, WA – January 26, 2017 -‐ Riverview Bancorp, Inc. (Nasdaq:RVSB) (“Riverview” or the “Company”) today reported that earnings increased to $2.0 million, or $0.09 per diluted share, in the third fiscal quarter ended December 31, 2016, compared to $1.7 million, or $0.08 per diluted share, in the third fiscal quarter one year ago. In the preceding quarter, Riverview earned $1.7 million, or $0.07 per diluted share. In the first nine months of fiscal 2017, net income increased to $5.4 million, or $0.24 per diluted share, compared to $5.0 million, or $0.22 per diluted share, in the first nine months of fiscal 2016.
“Strong loan growth, improved operating efficiencies and an expanding net interest margin fueled our earnings during the quarter,” stated Pat Sheaffer, chairman and chief executive officer. “With our improving core operating income and growing revenues, coupled with the MBank transaction and other strategic initiatives, we believe Riverview is well positioned for continued profitability improvements.
“Our previously announced purchase and assumption agreement with MBank is still on track to close in February,” Sheaffer continued. “We are excited about the opportunity this transaction will offer to our company, and the transaction fits well into our strategy of further expanding our presence in the Portland market. We expect the acquisition will provide substantial EPS accretion in the first full year. We will continue to look for additional opportunities to expand our brand of community banking in the Portland market area.”
Third Quarter Highlights (at or for the period ended December 31, 2016)
• Net income increased 16.8% to $2.0 million, or $0.09 per diluted share, compared to F3Q16.
• Net interest margin improved to 3.75%.
• Net revenues increased 9.4% to $10.8 million in F3Q17 compared to F3Q16.
• Net loans increased $13.2 million, or 2.1% (8.2% on an annualized basis), during the quarter.
• Loan originations were $68.7 million during the third fiscal quarter.
• Non-‐performing assets were 0.31% of total assets.
• Total risk-‐based capital ratio was 15.93% and Tier 1 leverage ratio was 10.81%.
Income Statement
Net revenues for the third fiscal quarter (net interest income plus non-‐interest income) increased 1.6% to $10.8 million compared to the preceding quarter and increased 9.4% when compared to the third fiscal quarter a year ago. Year-‐to-‐date net revenues increased 10.0% to $31.8 million compared to $29.0 million in the same period a year ago.
Riverview’s net interest income increased $414,000 compared to the preceding quarter and $1.0 million compared to the third fiscal quarter a year ago. Year-‐to-‐date, net interest income increased $2.6 million, or 12.1%, to $24.4 million compared to $21.8 million in the first nine months of fiscal 2016. Growth in net interest

income was driven primarily by an increase in loans receivable and investment security balances during the past year.
“The net interest margin increased during the quarter, as we were able to deploy a significant amount of our excess cash into both our loan and investment portfolios,” said Kevin Lycklama, executive vice president and chief financial officer. Riverview’s net interest margin increased five basis points to 3.75% compared to the preceding quarter. In the first nine months of fiscal 2017, Riverview’s net interest margin improved six basis points to 3.73% compared to 3.67% in the same period one year earlier.
Non-‐interest income was $2.3 million in the third fiscal quarter compared to $2.6 million in the preceding quarter. Other income during the third quarter included a $108,000 impairment charge on an investment security. In the preceding quarter, other income included $407,000 of income from a Bank Owned Life Insurance (“BOLI”) claim, which was offset by a $132,000 impairment charge on an investment security. In the first nine months of fiscal 2017, non-‐interest income increased to $7.4 million compared to $7.2 million in the first nine months of fiscal 2016.
Asset management fees were $709,000 during the third fiscal quarter compared to $727,000 in the preceding quarter and $830,000 in the third fiscal quarter a year ago. Riverview Trust Company’s assets under management were $403.3 million at December 31, 2016, compared to $394.6 million at December 31, 2015. Riverview Trust Company opened a second office in the Portland suburb of Lake Oswego during January 2017.
Non-‐interest expense decreased to $7.9 million during the third fiscal quarter compared to $8.4 million in the preceding quarter. The current quarter included approximately $102,000 in expenses related to the previously announced MBank acquisition and the preceding quarter included approximately $192,000 in acquisition related expenses. In addition, the prior quarter included $475,000 in litigation settlement expenses. Year-‐to-‐date, non-‐interest expense was $24.1 million compared to $22.4 million in the same period one year earlier.
Balance Sheet Review
“Loan growth was robust during the quarter, fueled by our strong local economy,” said Ron Wysaske, president and chief operating officer. “Office buildings and pre-‐sold single-‐family construction loans generated the largest increases during the quarter. We continue to see strong loan demand in our local markets, with loan originations totaling $68.7 million during the quarter.”
Net loans increased $13.2 million during the quarter and totaled $654.1 million at December 31, 2016, compared to $640.9 million at September 30, 2016. Net loans have grown $53.5 million, or 8.9%, compared to one year ago.
The commercial loan pipeline totaled $33.9 million at the end of the quarter. Undisbursed construction loans totaled $45.0 million at December 31, 2016, with the majority of the undisbursed construction loans expected to fund during the next few quarters.
Total deposits increased $1.5 million during the quarter to $840.4 million at December 31, 2016. As noted last quarter, deposit balances at September 30, 2016 included a $16 million temporary deposit from a single customer. Deposits from this customer decreased $15 million during the current quarter. Absent this single account, total deposits increased $16.5 million during the third quarter. Average deposits increased $30.2 million during the quarter. Total deposits have grown $92.8 million, or 12.4%, compared to a year ago. Checking account balances increased to 44.0% of total deposits compared to 41.2% a year ago.
Shareholders’ equity was $109.4 million at December 31, 2016 compared to $111.0 million three months earlier and $106.0 million a year earlier. The decrease in shareholders’ equity was due to a decrease in accumulated other comprehensive income as a result of an increase in bond yields during the quarter. Tangible book value per share was $3.72 at December 31, 2016, compared to $3.79 at September 30, 2016 and $3.56 a year ago. A quarterly cash dividend of $0.02 per share was paid on January 24, 2017.
Credit Quality

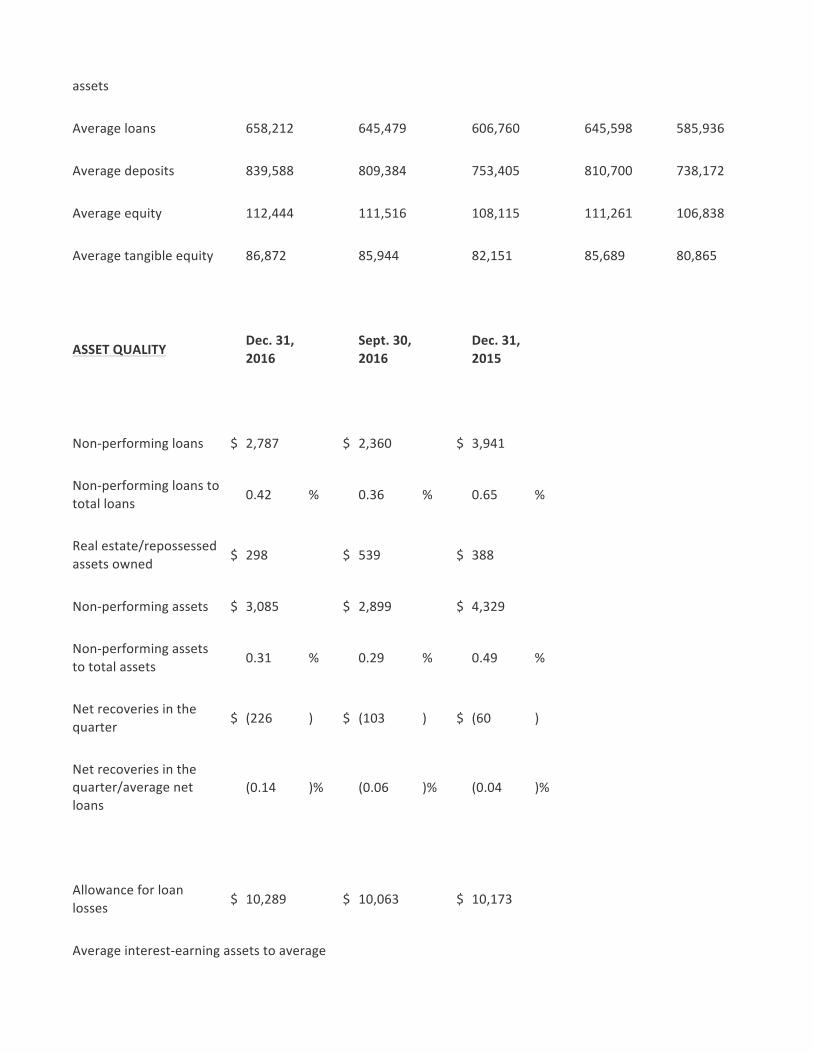
Non-‐performing loans were $2.8 million, or 0.42% of total loans, at December 31, 2016, compared to $2.4 million, or 0.36% of total loans, three months earlier. REO balances decreased to $298,000 at December 31, 2016 and included $241,000 in sales during the quarter with no write-‐downs. There were no additions to REO during the quarter.
Classified assets decreased to $4.3 million at December 31, 2016 compared to $5.5 million at September 30, 2016. The classified asset to total capital ratio was 3.8% at December 31, 2016, compared to 4.9% three months earlier.
Net loan recoveries were $226,000 during the third fiscal quarter of 2017 compared to $103,000 in the preceding quarter. The allowance for loan losses at December 31, 2016, totaled $10.3 million, representing 1.55% of total loans and 369.2% of non-‐performing loans.
Capital
Riverview continues to maintain capital levels well in excess of the regulatory requirements to be categorized as “well capitalized” with a total risk-‐based capital ratio of 15.93%, Tier 1 leverage ratio of 10.81% and tangible common equity to tangible assets ratio of 8.73% at December 31, 2016.
Non-‐GAAP Financial Measures
In addition to results presented in accordance with generally accepted accounting principles (“GAAP”), this press release contains certain non-‐GAAP financial measures. Riverview believes that certain non-‐GAAP financial measures provide investors with information useful in understanding the Company’s financial performance; however, readers of this report are urged to review these non-‐GAAP financial measures in conjunction with GAAP results as reported.
Financial measures that exclude intangible assets and nonrecurring items are non-‐GAAP measures. To provide investors with a broader understanding of capital adequacy, Riverview provides non-‐GAAP financial measures for tangible common equity, along with the GAAP measure. Tangible common equity is calculated as shareholders’ equity less goodwill and other intangible assets. In addition, tangible assets are total assets less goodwill and other intangible assets.
The following table provides a reconciliation of ending shareholders’ equity (GAAP) to ending tangible shareholders’ equity (non-‐GAAP), and ending total assets (GAAP) to ending tangible assets (non-‐GAAP).
(Dollars in thousands) December 31, 2016
September 30, 2016
December 31, 2015
March 31, 2016
Shareholders' equity $ 109,400 $ 110,986 $ 105,993 $ 108,273
Goodwill 25,572 25,572 25,572 25,572
Tangible shareholders' equity $ 83,828 $ 85,414 $ 80,421 $ 82,701
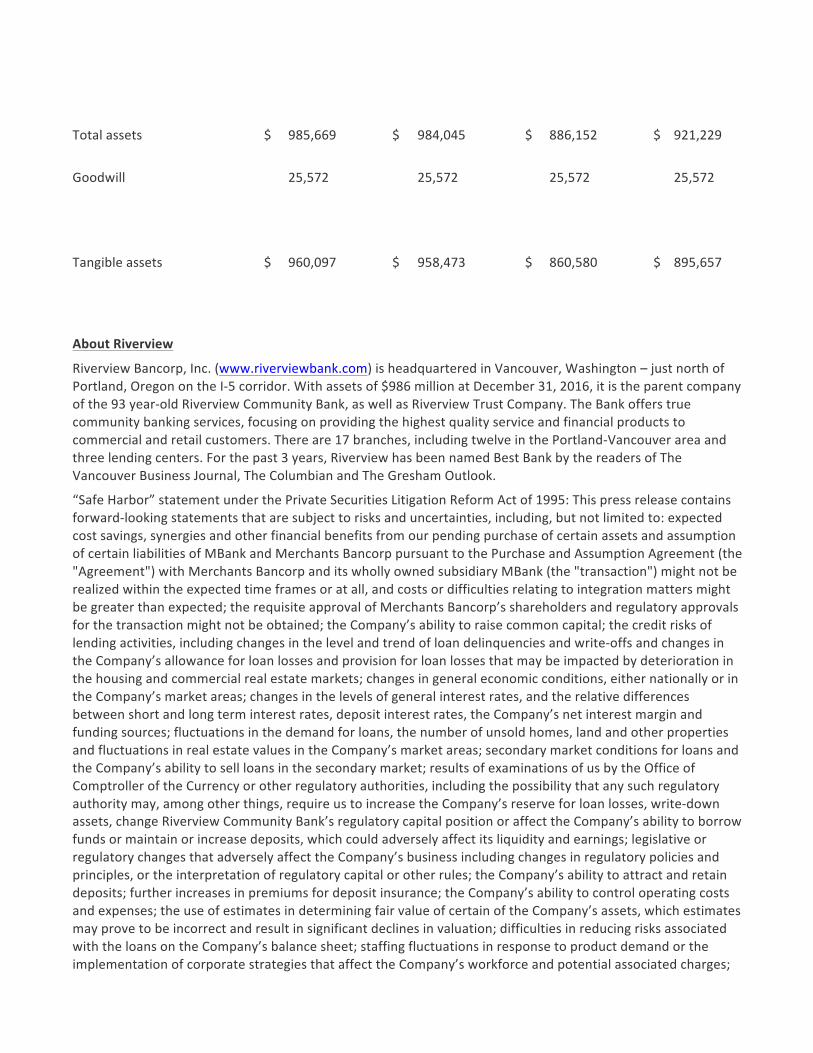
Total assets $ 985,669 $ 984,045 $ 886,152 $ 921,229
Goodwill 25,572 25,572 25,572 25,572
Tangible assets $ 960,097 $ 958,473 $ 860,580 $ 895,657
About Riverview
Riverview Bancorp, Inc. (www.riverviewbank.com) is headquartered in Vancouver, Washington – just north of Portland, Oregon on the I-‐5 corridor. With assets of $986 million at December 31, 2016, it is the parent company of the 93 year-‐old Riverview Community Bank, as well as Riverview Trust Company. The Bank offers true community banking services, focusing on providing the highest quality service and financial products to commercial and retail customers. There are 17 branches, including twelve in the Portland-‐Vancouver area and three lending centers. For the past 3 years, Riverview has been named Best Bank by the readers of The Vancouver Business Journal, The Columbian and The Gresham Outlook.
“Safe Harbor” statement under the Private Securities Litigation Reform Act of 1995: This press release contains forward-‐looking statements that are subject to risks and uncertainties, including, but not limited to: expected cost savings, synergies and other financial benefits from our pending purchase of certain assets and assumption of certain liabilities of MBank and Merchants Bancorp pursuant to the Purchase and Assumption Agreement (the "Agreement") with Merchants Bancorp and its wholly owned subsidiary MBank (the "transaction") might not be realized within the expected time frames or at all, and costs or difficulties relating to integration matters might be greater than expected; the requisite approval of Merchants Bancorp’s shareholders and regulatory approvals for the transaction might not be obtained; the Company’s ability to raise common capital; the credit risks of lending activities, including changes in the level and trend of loan delinquencies and write-‐offs and changes in the Company’s allowance for loan losses and provision for loan losses that may be impacted by deterioration in the housing and commercial real estate markets; changes in general economic conditions, either nationally or in the Company’s market areas; changes in the levels of general interest rates, and the relative differences between short and long term interest rates, deposit interest rates, the Company’s net interest margin and funding sources; fluctuations in the demand for loans, the number of unsold homes, land and other properties and fluctuations in real estate values in the Company’s market areas; secondary market conditions for loans and the Company’s ability to sell loans in the secondary market; results of examinations of us by the Office of Comptroller of the Currency or other regulatory authorities, including the possibility that any such regulatory authority may, among other things, require us to increase the Company’s reserve for loan losses, write-‐down assets, change Riverview Community Bank’s regulatory capital position or affect the Company’s ability to borrow funds or maintain or increase deposits, which could adversely affect its liquidity and earnings; legislative or regulatory changes that adversely affect the Company’s business including changes in regulatory policies and principles, or the interpretation of regulatory capital or other rules; the Company’s ability to attract and retain deposits; further increases in premiums for deposit insurance; the Company’s ability to control operating costs and expenses; the use of estimates in determining fair value of certain of the Company’s assets, which estimates may prove to be incorrect and result in significant declines in valuation; difficulties in reducing risks associated with the loans on the Company’s balance sheet; staffing fluctuations in response to product demand or the implementation of corporate strategies that affect the Company’s workforce and potential associated charges;

computer systems on which the Company depends could fail or experience a security breach; the Company’s ability to retain key members of its senior management team; costs and effects of litigation, including settlements and judgments; the Company’s ability to successfully integrate any assets, liabilities, customers, systems, and management personnel it may in the future acquire into its operations and the Company’s ability to realize related revenue synergies and cost savings within expected time frames and any goodwill charges related thereto; increased competitive pressures among financial services companies; changes in consumer spending, borrowing and savings habits; the availability of resources to address changes in laws, rules, or regulations or to respond to regulatory actions; the Company’s ability to pay dividends on its common stock; and interest or principal payments on its junior subordinated debentures; adverse changes in the securities markets; inability of key third-‐party providers to perform their obligations to us; changes in accounting policies and practices, as may be adopted by the financial institution regulatory agencies or the Financial Accounting Standards Board, including additional guidance and interpretation on accounting issues and details of the implementation of new accounting methods; other economic, competitive, governmental, regulatory, and technological factors affecting the Company’s operations, pricing, products and services and the other risks described from time to time in our filings with the SEC.
Such forward-‐looking statements may include projections. Any such projections were not prepared in accordance with published guidelines of the American Institute of Certified Public Accountants or the Securities Exchange Commission regarding projections and forecasts nor have such projections been audited, examined or otherwise reviewed by independent auditors of the Company. In addition, such projections are based upon many estimates and inherently subject to significant economic and competitive uncertainties and contingencies, many of which are beyond the control of management of the Company. Accordingly, actual results may be materially higher or lower than those projected. The inclusion of such projections herein should not be regarded as a representation by the Company that the projections will prove to be correct.
The Company cautions readers not to place undue reliance on any forward-‐looking statements. Moreover, you should treat these statements as speaking only as of the date they are made and based only on information then actually known to the Company. The Company does not undertake and specifically disclaims any obligation to revise any forward-‐looking statements to reflect the occurrence of anticipated or unanticipated events or circumstances after the date of such statements. These risks could cause our actual results for fiscal 2017 and beyond to differ materially from those expressed in any forward-‐looking statements by, or on behalf of, us, and could negatively affect the Company’s operating and stock price performance.
RIVERVIEW BANCORP, INC. AND SUBSIDIARY
Consolidated Balance Sheets
(In thousands, except share data) (Unaudited)
December 31, 2016
September 30, 2016
31-‐December 31, 2015
March 31, 2016
ASSETS
Cash (including interest-‐earning accounts of $14,302, $77,509, $16,461
$ 28,262 $ 93,007 $ 28,967 $ 55,400
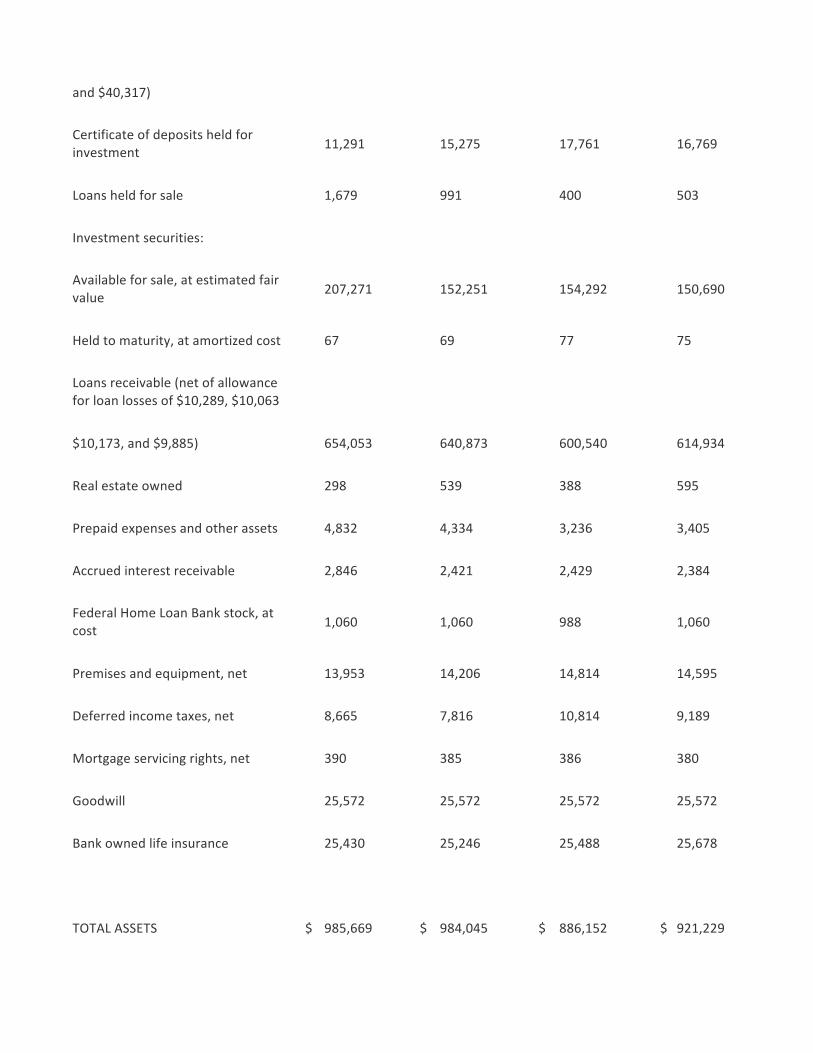
and $40,317)
Certificate of deposits held for investment 11,291 15,275 17,761 16,769
Loans held for sale 1,679 991 400 503
Investment securities:
Available for sale, at estimated fair value 207,271 152,251 154,292 150,690
Held to maturity, at amortized cost 67 69 77 75
Loans receivable (net of allowance for loan losses of $10,289, $10,063
$10,173, and $9,885) 654,053 640,873 600,540 614,934
Real estate owned 298 539 388 595
Prepaid expenses and other assets 4,832 4,334 3,236 3,405
Accrued interest receivable 2,846 2,421 2,429 2,384
Federal Home Loan Bank stock, at cost 1,060 1,060 988 1,060
Premises and equipment, net 13,953 14,206 14,814 14,595
Deferred income taxes, net 8,665 7,816 10,814 9,189
Mortgage servicing rights, net 390 385 386 380
Goodwill 25,572 25,572 25,572 25,572
Bank owned life insurance 25,430 25,246 25,488 25,678
TOTAL ASSETS $ 985,669 $ 984,045 $ 886,152 $ 921,229

LIABILITIES AND EQUITY
LIABILITIES:
Deposits $ 840,391 $ 838,902 $ 747,565 $ 779,803
Accrued expenses and other liabilities 10,450 8,175 7,178 7,388
Advance payments by borrowers for taxes and insurance 288 837 256 609
Junior subordinated debentures 22,681 22,681 22,681 22,681
Capital lease obligations 2,459 2,464 2,479 2,475
Total liabilities 876,269 873,059 780,159 812,956
EQUITY:
Shareholders' equity
Serial preferred stock, $.01 par value; 250,000 authorized,
issued and outstanding, none -‐ -‐ -‐ -‐
Common stock, $.01 par value; 50,000,000 authorized,
December 31, 2016 -‐ 22,510,890 issued and outstanding;
September 30, 2016 -‐ 22,507,890 issued and outstanding; 225 225 225 225
December 31, 2015 -‐ 22,507,890

issued and outstanding;
March 31, 2016 – 22,507,890 issued and outstanding;
Additional paid-‐in capital 64,448 64,425 64,417 64,418
Retained earnings 46,750 45,207 41,773 42,728
Unearned shares issued to employee stock ownership plan (103 ) (129 ) (206 ) (181 )
Accumulated other comprehensive income (loss) (1,920 ) 1,258 (216 ) 1,083
Total shareholders' equity 109,400 110,986 105,993 108,273
TOTAL LIABILITIES AND EQUITY $ 985,669 $ 984,045 $ 886,152 $ 921,229
RIVERVIEW BANCORP, INC. AND SUBSIDIARY
Consolidated Statements of Income
Three Months Ended Nine Months Ended
(In thousands, except share data) (Unaudited)
Dec. 31, 2016
Sept. 30, 2016
Dec. 31, 2015
Dec. 31, 2016
Dec. 31, 2015
INTEREST INCOME:
Interest and fees on loans receivable $ 7,883 $ 7,631 $ 7,109 $ 22,954 $ 20,758
Interest on investment securities -‐ taxable 946 769 702 2,435 1,986

Interest on investment securities -‐ nontaxable 11 -‐ -‐ 11 -‐
Other interest and dividends 112 130 110 344 340
Total interest and dividend income 8,952 8,530 7,921 25,744 23,084
INTEREST EXPENSE:
Interest on deposits 277 279 290 837 893
Interest on borrowings 173 163 144 494 417
Total interest expense 450 442 434 1,331 1,310
Net interest income 8,502 8,088 7,487 24,413 21,774
Recapture of loan losses -‐ -‐ -‐ -‐ (800 )
Net interest income after recapture of loan losses
8,502 8,088 7,487 24,413 22,574
NON-‐INTEREST INCOME:
Fees and service charges 1,304 1,188 1,312 3,815 3,740
Asset management fees 709 727 830 2,258 2,455
Net gain on sale of loans held for sale 191 163 125 493 425
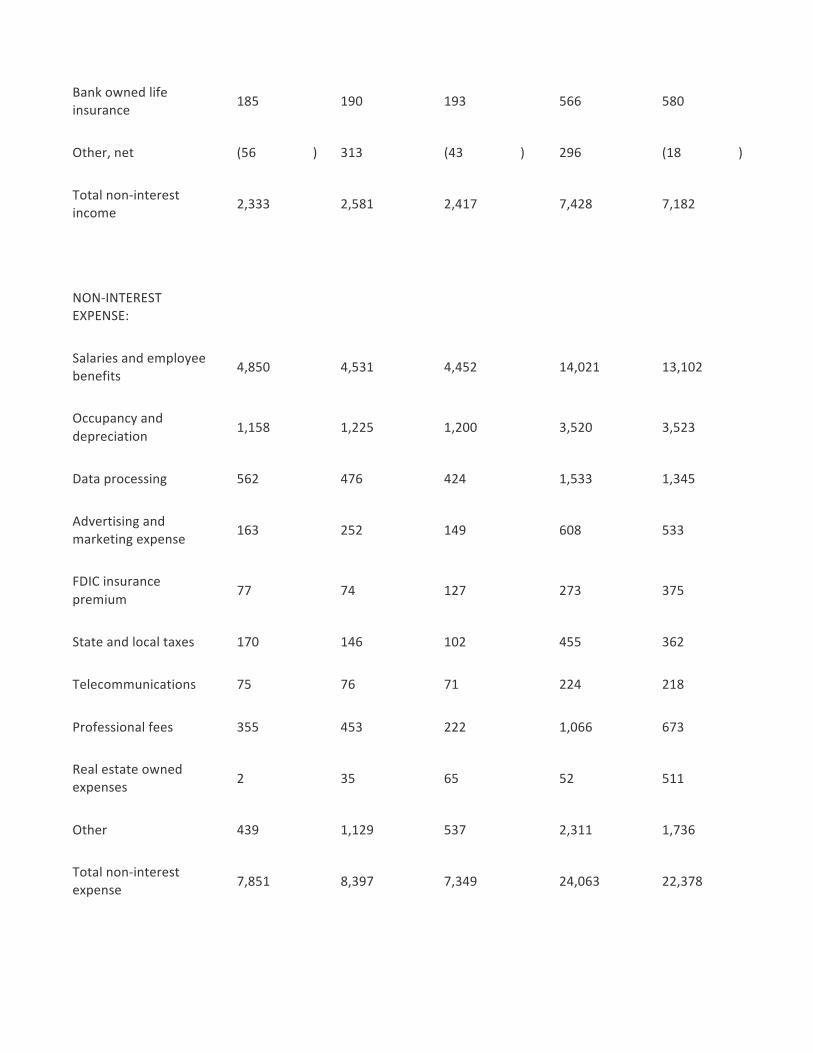
Bank owned life insurance 185 190 193 566 580
Other, net (56 ) 313 (43 ) 296 (18 )
Total non-‐interest income 2,333 2,581 2,417 7,428 7,182
NON-‐INTEREST EXPENSE:
Salaries and employee benefits 4,850 4,531 4,452 14,021 13,102
Occupancy and depreciation 1,158 1,225 1,200 3,520 3,523
Data processing 562 476 424 1,533 1,345
Advertising and marketing expense 163 252 149 608 533
FDIC insurance premium 77 74 127 273 375
State and local taxes 170 146 102 455 362
Telecommunications 75 76 71 224 218
Professional fees 355 453 222 1,066 673
Real estate owned expenses 2 35 65 52 511
Other 439 1,129 537 2,311 1,736
Total non-‐interest expense 7,851 8,397 7,349 24,063 22,378
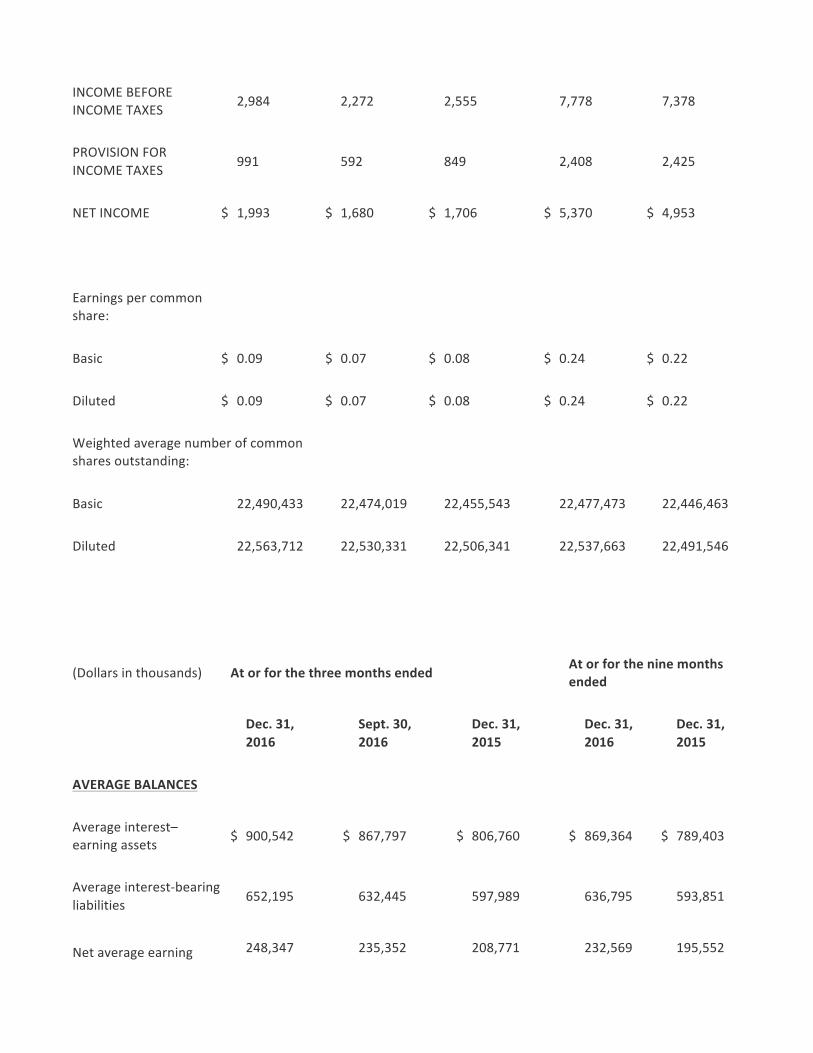
INCOME BEFORE INCOME TAXES 2,984 2,272 2,555 7,778 7,378
PROVISION FOR INCOME TAXES 991 592 849 2,408 2,425
NET INCOME $ 1,993 $ 1,680 $ 1,706 $ 5,370 $ 4,953
Earnings per common share:
Basic $ 0.09 $ 0.07 $ 0.08 $ 0.24 $ 0.22
Diluted $ 0.09 $ 0.07 $ 0.08 $ 0.24 $ 0.22
Weighted average number of common shares outstanding:
Basic 22,490,433 22,474,019 22,455,543 22,477,473 22,446,463
Diluted 22,563,712 22,530,331 22,506,341 22,537,663 22,491,546
(Dollars in thousands) At or for the three months ended At or for the nine months ended
Dec. 31, 2016
Sept. 30, 2016
Dec. 31, 2015
Dec. 31, 2016
Dec. 31, 2015
AVERAGE BALANCES
Average interest–earning assets $ 900,542 $ 867,797 $ 806,760 $ 869,364 $ 789,403
Average interest-‐bearing liabilities 652,195 632,445 597,989 636,795 593,851
Net average earning 248,347 235,352 208,771 232,569 195,552
assets
Average loans 658,212 645,479 606,760 645,598 585,936
Average deposits 839,588 809,384 753,405 810,700 738,172
Average equity 112,444 111,516 108,115 111,261 106,838
Average tangible equity 86,872 85,944 82,151 85,689 80,865
ASSET QUALITY Dec. 31, 2016
Sept. 30, 2016
Dec. 31, 2015
Non-‐performing loans $ 2,787 $ 2,360 $ 3,941
Non-‐performing loans to total loans 0.42 % 0.36 % 0.65 %
Real estate/repossessed assets owned $ 298 $ 539 $ 388
Non-‐performing assets $ 3,085 $ 2,899 $ 4,329
Non-‐performing assets to total assets 0.31 % 0.29 % 0.49 %
Net recoveries in the quarter $ (226 ) $ (103 ) $ (60 )
Net recoveries in the quarter/average net loans
(0.14 )% (0.06 )% (0.04 )%
Allowance for loan losses $ 10,289 $ 10,063 $ 10,173
Average interest-‐earning assets to average

interest-‐bearing liabilities 138.08 % 137.21 % 134.91 %
Allowance for loan losses to
non-‐performing loans 369.18 % 426.40 % 258.13 %
Allowance for loan losses to total loans 1.55 % 1.55 % 1.67 %
Shareholders’ equity to assets 11.10 % 11.28 % 11.96 %
CAPITAL RATIOS
Total capital (to risk weighted assets) 15.93 % 16.05 % 16.08 %
Tier 1 capital (to risk weighted assets) 14.68 % 14.80 % 14.83 %
Common equity tier 1 (to risk weighted assets) 14.68 % 14.80 % 14.83 %
Tier 1 capital (to leverage assets) 10.81 % 10.95 % 11.11 %
Tangible common equity (to tangible assets) 8.73 % 8.91 % 9.34 %
DEPOSIT MIX Dec. 31, 2016
Sept. 30, 2016
Dec. 31, 2015
March 31, 2016
Interest checking $ 167,522 $ 148,201 $ 130,635 $ 144,740
Regular savings 109,629 104,241 88,603 96,994

Money market deposit accounts 250,900 249,381 226,746 239,544
Non-‐interest checking 202,080 222,218 177,624 179,143
Certificates of deposit 110,260 114,861 123,957 119,382
Total deposits $ 840,391 $ 838,902 $ 747,565 $ 779,803
COMPOSITION OF COMMERCIAL AND CONSTRUCTION LOANS
Other Commercial
Real Estate Real Estate & Construction
Commercial Mortgage Construction Total
December 31, 2016 (Dollars in thousands)
Commercial $ 64,401 $ -‐ $ -‐ $ 64,401
Commercial construction -‐ -‐ 31,942 31,942
Office buildings -‐ 117,310 -‐ 117,310
Warehouse/industrial -‐ 66,739 -‐ 66,739
Retail/shopping centers/strip malls -‐ 60,257 -‐ 60,257
Assisted living facilities -‐ 1,781 -‐ 1,781
Single purpose facilities -‐ 151,258 -‐ 151,258
Land -‐ 12,276 -‐ 12,276
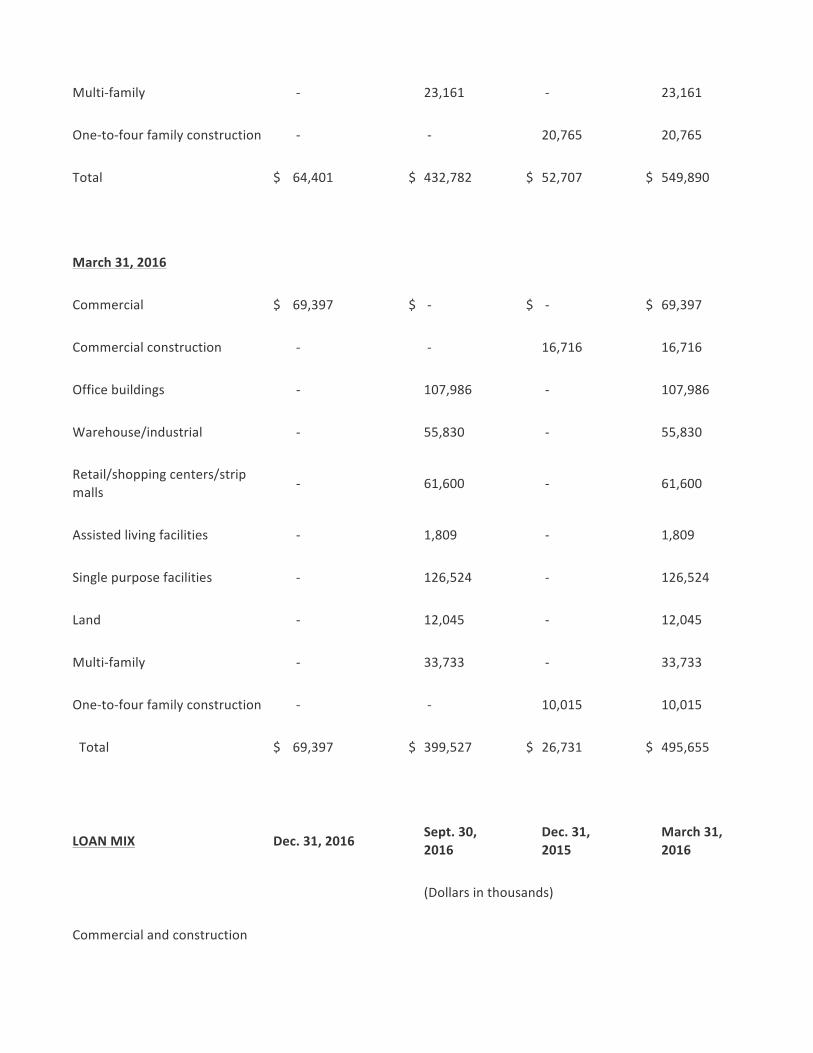
Multi-‐family -‐ 23,161 -‐ 23,161
One-‐to-‐four family construction -‐ -‐ 20,765 20,765
Total $ 64,401 $ 432,782 $ 52,707 $ 549,890
March 31, 2016
Commercial $ 69,397 $ -‐ $ -‐ $ 69,397
Commercial construction -‐ -‐ 16,716 16,716
Office buildings -‐ 107,986 -‐ 107,986
Warehouse/industrial -‐ 55,830 -‐ 55,830
Retail/shopping centers/strip malls -‐ 61,600 -‐ 61,600
Assisted living facilities -‐ 1,809 -‐ 1,809
Single purpose facilities -‐ 126,524 -‐ 126,524
Land -‐ 12,045 -‐ 12,045
Multi-‐family -‐ 33,733 -‐ 33,733
One-‐to-‐four family construction -‐ -‐ 10,015 10,015
Total $ 69,397 $ 399,527 $ 26,731 $ 495,655
LOAN MIX Dec. 31, 2016 Sept. 30, 2016
Dec. 31, 2015
March 31, 2016
(Dollars in thousands)
Commercial and construction

Commercial business $ 64,401 $ 64,176 $ 72,113 $ 69,397
Other real estate mortgage 432,782 423,729 383,187 399,527
Real estate construction 52,707 45,059 23,749 26,731
Total commercial and construction 549,890 532,964 479,049 495,655
Consumer
Real estate one-‐to-‐four family 85,956 86,321 88,839 88,780
Other installment 28,496 31,651 42,825 40,384
Total consumer 114,452 117,972 131,664 129,164
Total loans 664,342 650,936 610,713 624,819
Less:
Allowance for loan losses 10,289 10,063 10,173 9,885
Loans receivable, net $ 654,053 $ 640,873 $ 600,540 $ 614,934
DETAIL OF NON-‐PERFORMING ASSETS
Other Southwest Other
Oregon Washington Washington Other Total

December 31, 2016
Non-‐performing assets
Commercial $ -‐ $ 189 $ -‐ $ -‐ $ 189
Commercial real estate 1,262 216 -‐ -‐ 1,478
Land 801 -‐ -‐ -‐ 801
Consumer -‐ 173 -‐ 146 319
Total non-‐performing loans 2,063 578 -‐ 146 2,787
REO -‐ -‐ 298 -‐ 298
Total non-‐performing assets $ 2,063 $ 578 $ 298 $ 146 $ 3,085
DETAIL OF LAND DEVELOPMENT AND SECULATIVE CONSTRUCTION LOANS
Northwest Other Southwest
Oregon Oregon Washington Total
December 31, 2016 (dollars in thousands)
Land and Spec Construction Loans

Land development $ 89 $ 2,563 $ 9,624 $ 12,276
Speculative construction 954 119 16,298 17,371
Total land development and speculative construction
$ 1,043 $ 2,682 $ 25,922 $ 29,647
At or for the three months ended At or for the nine months ended
SELECTED OPERATING DATA
Dec. 31, 2016
Sept. 30, 2016
Dec. 31, 2015
Dec. 31, 2016
Dec. 31, 2015
Efficiency ratio (4) 72.46 % 78.70 % 74.20 % 75.57 % 77.28 %
Coverage ratio (6) 108.29 % 96.32 % 101.88 % 101.45 % 97.30 %
Return on average assets (1)
0.80 % 0.70 % 0.76 % 0.75 % 0.75 %
Return on average equity (1)
7.03 % 5.98 % 6.28 % 6.41 % 6.17 %
NET INTEREST SPREAD
Yield on loans 4.75 % 4.69 % 4.66 % 4.72 % 4.72 %
Yield on 2.06 % 1.96 % 2.09 % 1.96 % 2.06 %

investment securities
Total yield on interest earning assets
3.95 % 3.90 % 3.91 % 3.93 % 3.89 %
Cost of interest bearing deposits 0.18 % 0.18 % 0.20 % 0.18 % 0.21 %
Cost of FHLB advances and other borrowings
2.73 % 2.55 % 2.28 % 2.61 % 2.22 %
Total cost of interest bearing liabilities
0.27 % 0.28 % 0.29 % 0.28 % 0.29 %
Spread (7) 3.68 % 3.62 % 3.62 % 3.65 % 3.60 %
Net interest margin 3.75 % 3.70 % 3.69 % 3.73 % 3.67 %
PER SHARE DATA
Basic earnings per share (2) $ 0.09 $ 0.07 $ 0.08 $ 0.24 $ 0.22
Diluted earnings per share (3) 0.09 0.07 0.08 0.24 0.22
Book value per share (5) 4.86 4.93 4.71 4.86 4.71
Tangible book value per share (5)
3.72 3.79 3.56 3.72 3.56
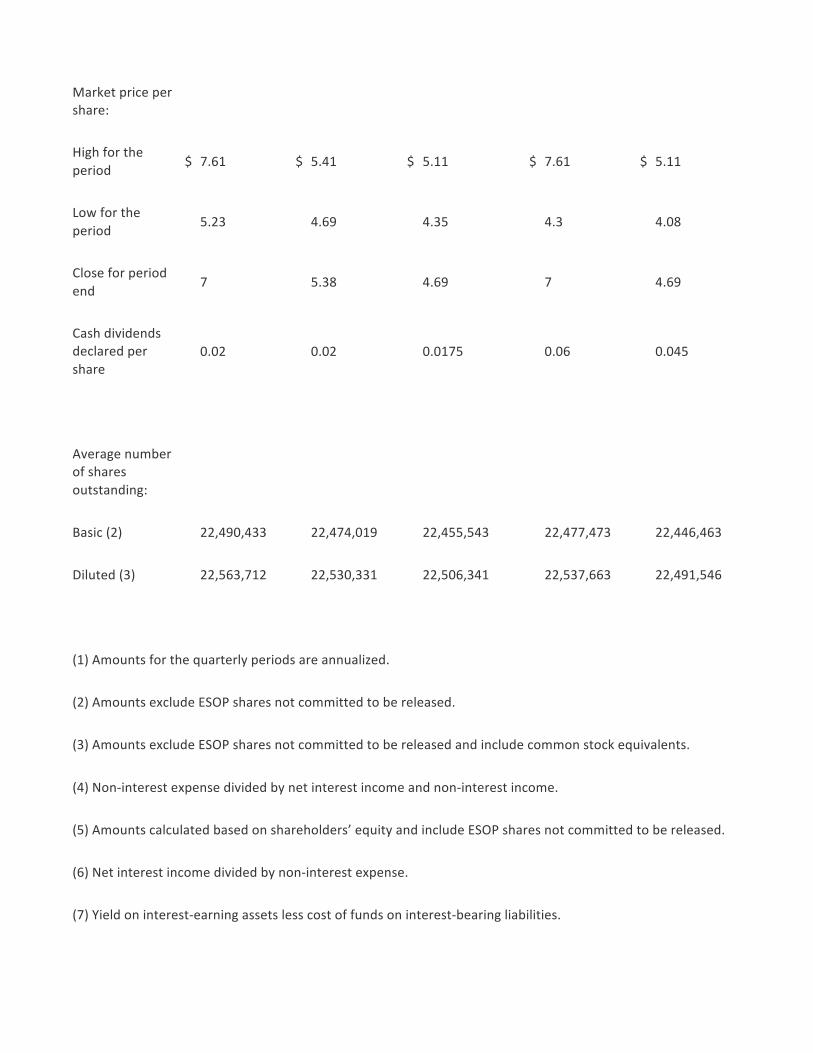
Market price per share:
High for the period $ 7.61 $ 5.41 $ 5.11 $ 7.61 $ 5.11
Low for the period 5.23 4.69 4.35 4.3 4.08
Close for period end 7 5.38 4.69 7 4.69
Cash dividends declared per share
0.02 0.02 0.0175 0.06 0.045
Average number of shares outstanding:
Basic (2) 22,490,433 22,474,019 22,455,543 22,477,473 22,446,463
Diluted (3) 22,563,712 22,530,331 22,506,341 22,537,663 22,491,546
(1) Amounts for the quarterly periods are annualized.
(2) Amounts exclude ESOP shares not committed to be released.
(3) Amounts exclude ESOP shares not committed to be released and include common stock equivalents.
(4) Non-‐interest expense divided by net interest income and non-‐interest income.
(5) Amounts calculated based on shareholders’ equity and include ESOP shares not committed to be released.
(6) Net interest income divided by non-‐interest expense.
(7) Yield on interest-‐earning assets less cost of funds on interest-‐bearing liabilities.