


Languages
Pages
Legal


Roadshow Presentation February 2015
Today’s Presenters
Magnus Welander Chief Executive Officer
Lennart Mauritzson Chief Financial Officer
Slide 2
Joined Thule Group: 2006, CEO since 2010
Born: 1966
Previous Experience: Business Area President Thule Group CEO Envirotainer Group Various management positions at Tetra Pak
Joined Thule Group: Rejoined 2011
Born: 1967
Previous Experience: CFO Beijer Electronics Vice President Finance Thule Group Vice President Finance in Cardo
Slide 3
The Thule Group Vision – Active Life, Simplified
Slide 4
Source: Company information
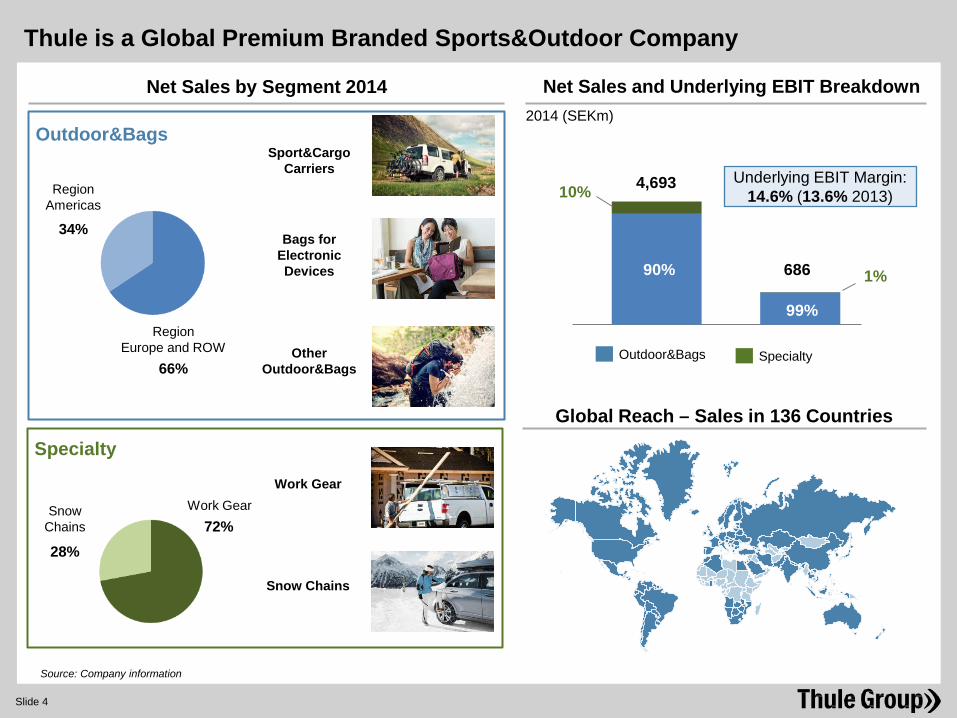
Thule is a Global Premium Branded Sports&Outdoor Company
Net Sales by Segment 2014
Sport&Cargo Carriers
Bags for Electronic Devices
Other Outdoor&Bags
Work Gear
Snow Chains
Outdoor&Bags
Specialty
Region Americas
Region Europe and ROW
Work Gear Snow Chains 72% 28%
34%
66%
Net Sales and Underlying EBIT Breakdown
4,693
686
2014 (SEKm)
Underlying EBIT Margin: 14.6% (13.6% 2013)
Global Reach – Sales in 136 Countries
90%
10%
1%
99%
Outdoor&Bags Specialty
Slide 5
Point 1 2009 2014
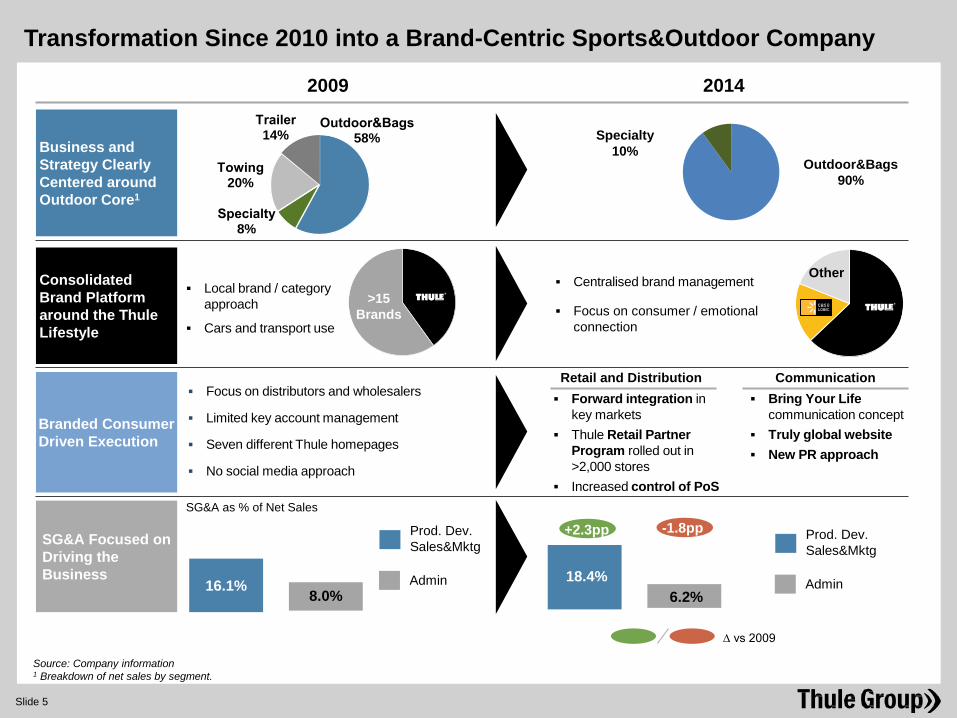
Business and Strategy Clearly Centered around Outdoor Core1
Consolidated Brand Platform around the Thule Lifestyle
Branded Consumer Driven Execution
SG&A Focused on Driving the Business
Local brand / category approach
Cars and transport use
Centralised brand management
Focus on consumer / emotional connection
Focus on distributors and wholesalers
Limited key account management
Seven different Thule homepages
No social media approach
Retail and Distribution Communication Forward integration in
key markets Thule Retail Partner
Program rolled out in >2,000 stores
Increased control of PoS
Bring Your Life communication concept
Truly global website New PR approach
SG&A as % of Net Sales
>15 Brands
Other
Outdoor&Bags58%
Specialty8%
Towing20%
Trailer14%
Source: Company information 1 Breakdown of net sales by segment.
Transformation Since 2010 into a Brand-Centric Sports&Outdoor Company
-1.8pp +2.3pp
∆ vs 2009
Prod. Dev. Sales&Mktg
Admin
Prod. Dev. Sales&Mktg
Admin 16.1% 8.0% 18.4%
6.2%
Outdoor&Bags 90%
Specialty 10%
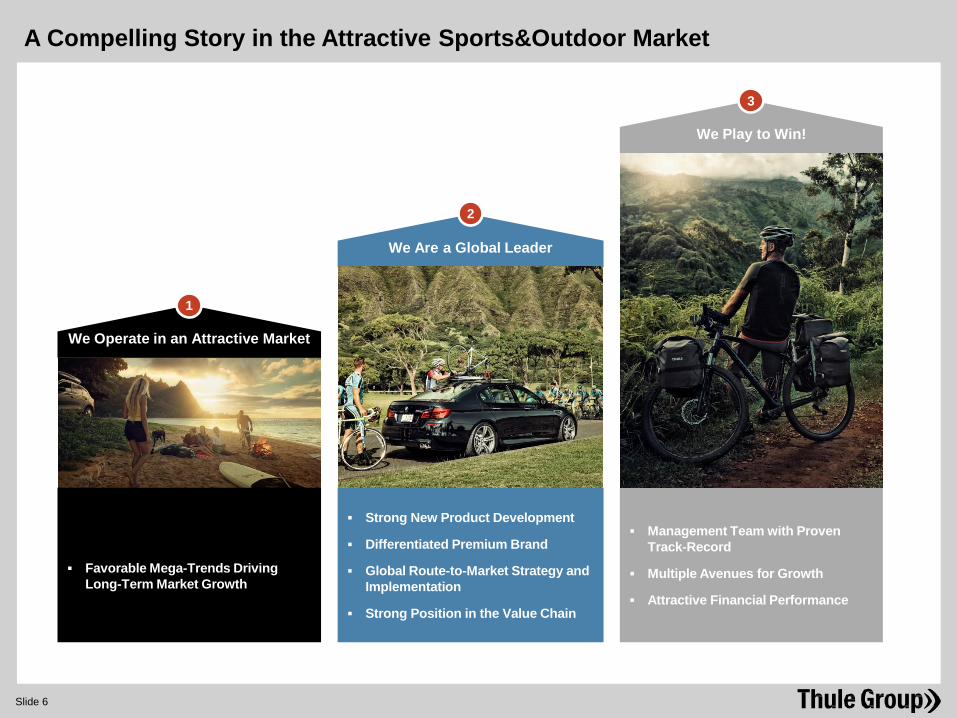
We Are a Global Leader
We Operate in an Attractive Market
Strong New Product Development
Differentiated Premium Brand
Global Route-to-Market Strategy and Implementation
Strong Position in the Value Chain
Management Team with Proven Track-Record
Multiple Avenues for Growth
Attractive Financial Performance
Favorable Mega-Trends Driving
Long-Term Market Growth
We Play to Win!
1
2
3
Slide 6
A Compelling Story in the Attractive Sports&Outdoor Market
Slide 7
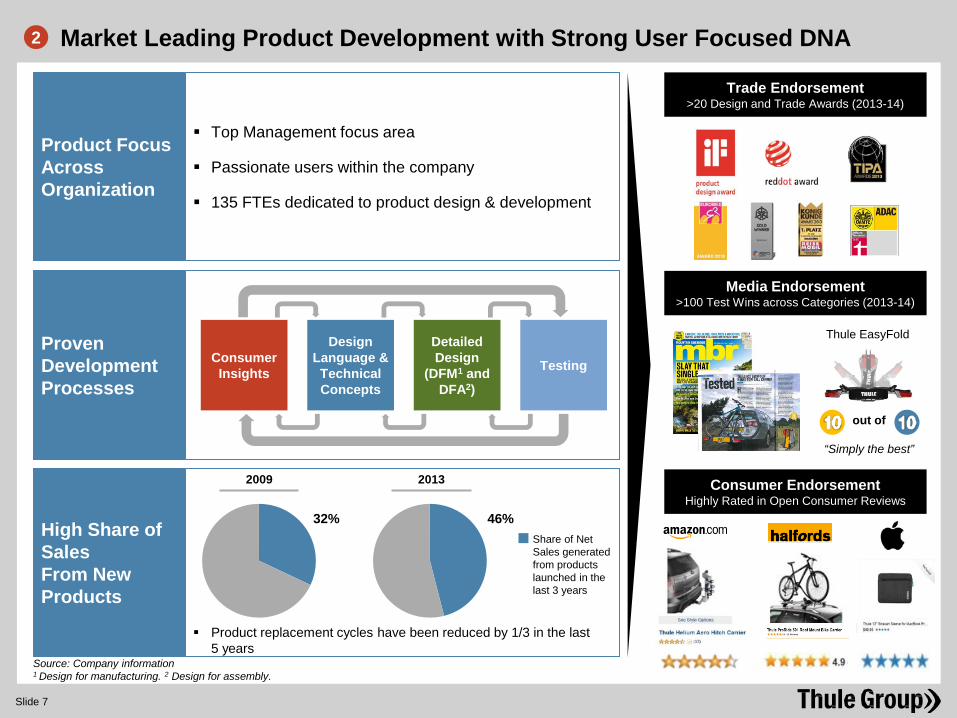
Trade Endorsement >20 Design and Trade Awards (2013-14)
Media Endorsement >100 Test Wins across Categories (2013-14)
Consumer Endorsement Highly Rated in Open Consumer Reviews
Thule EasyFold
“Simply the best”
out of
Proven Development Processes
Product Focus Across Organization
Top Management focus area
Passionate users within the company
135 FTEs dedicated to product design & development
Consumer Insights
Design Language & Technical Concepts
Detailed Design
(DFM1 and DFA2)
Testing
Source: Company information 1 Design for manufacturing. 2 Design for assembly.
Product replacement cycles have been reduced by 1/3 in the last 5 years
High Share of Sales From New Products
32% 46%
2009 2013
Share of Net Sales generated from products launched in the last 3 years
Market Leading Product Development with Strong User Focused DNA 2
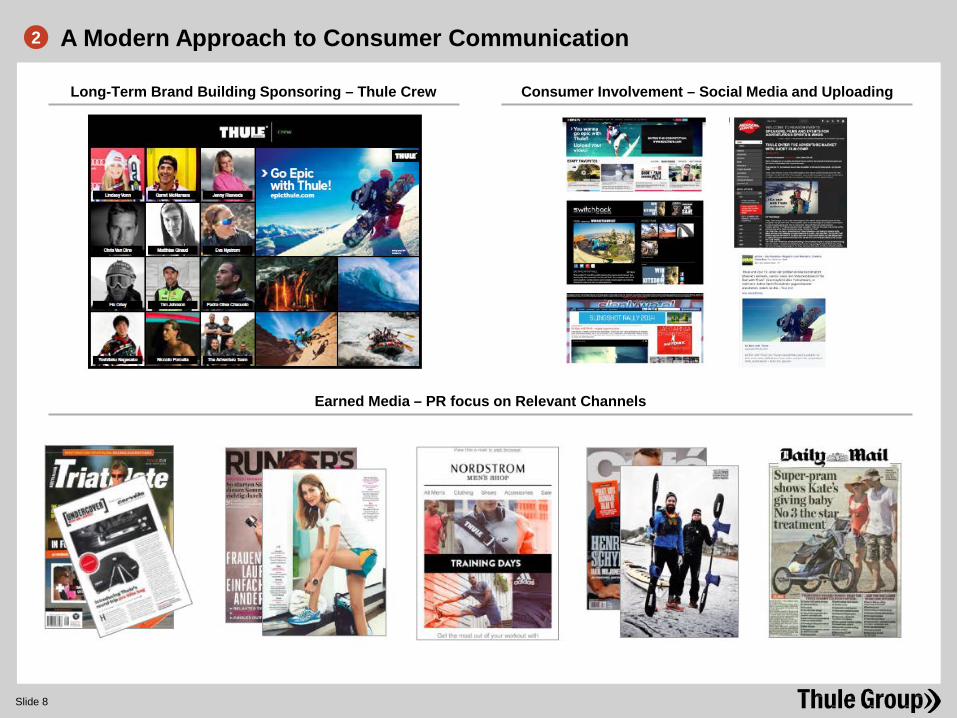
Long-Term Brand Building Sponsoring – Thule Crew
A Modern Approach to Consumer Communication
Slide 8
Consumer Involvement – Social Media and Uploading
Earned Media – PR focus on Relevant Channels
2
Slide 9
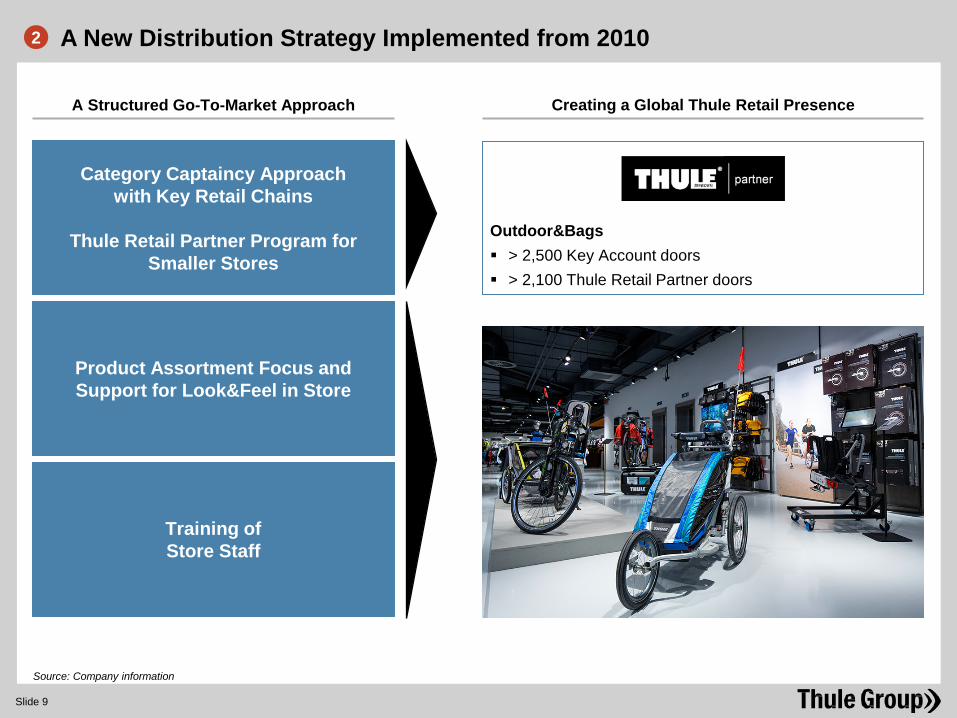
Creating a Global Thule Retail Presence
Category Captaincy Approach with Key Retail Chains
Thule Retail Partner Program for
Smaller Stores
Product Assortment Focus and Support for Look&Feel in Store
Training of Store Staff
A Structured Go-To-Market Approach
Outdoor&Bags > 2,500 Key Account doors > 2,100 Thule Retail Partner doors
Source: Company information
A New Distribution Strategy Implemented from 2010 2
Slide 10
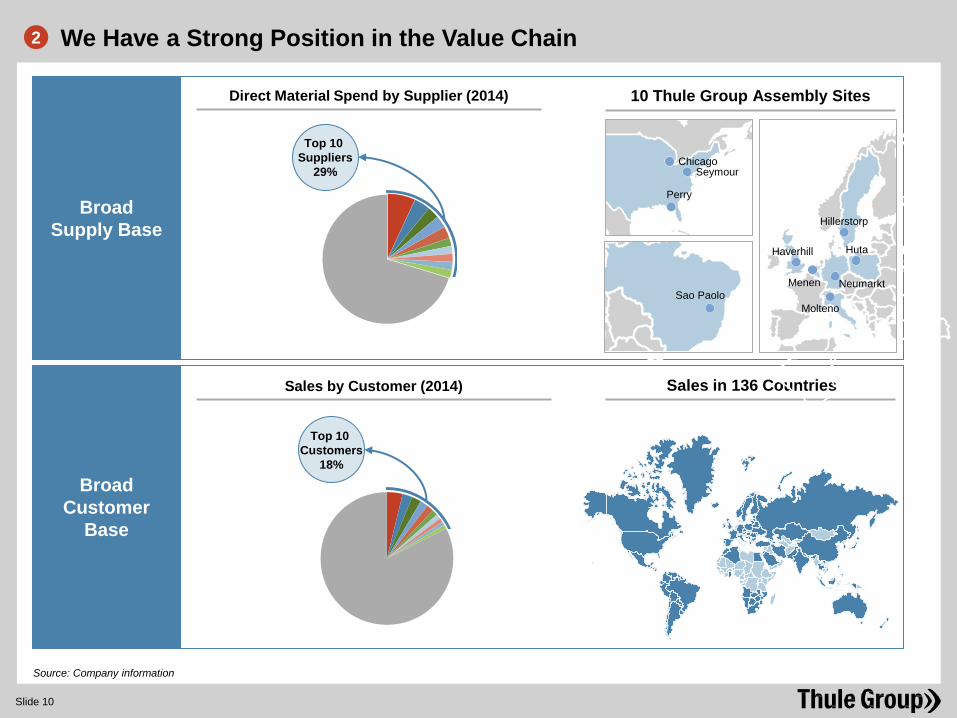
Source: Company information
Broad Supply Base
Broad Customer
Base
Top 10 Suppliers
29%
Direct Material Spend by Supplier (2014)
Top 10 Customers
18%
Sales by Customer (2014)
10 Thule Group Assembly Sites
Sales in 136 Countries
We Have a Strong Position in the Value Chain 2
Perry
Seymour Chicago
Sao Paolo
Huta
Molteno
Hillerstorp
Neumarkt
Haverhill
Menen
Slide 11
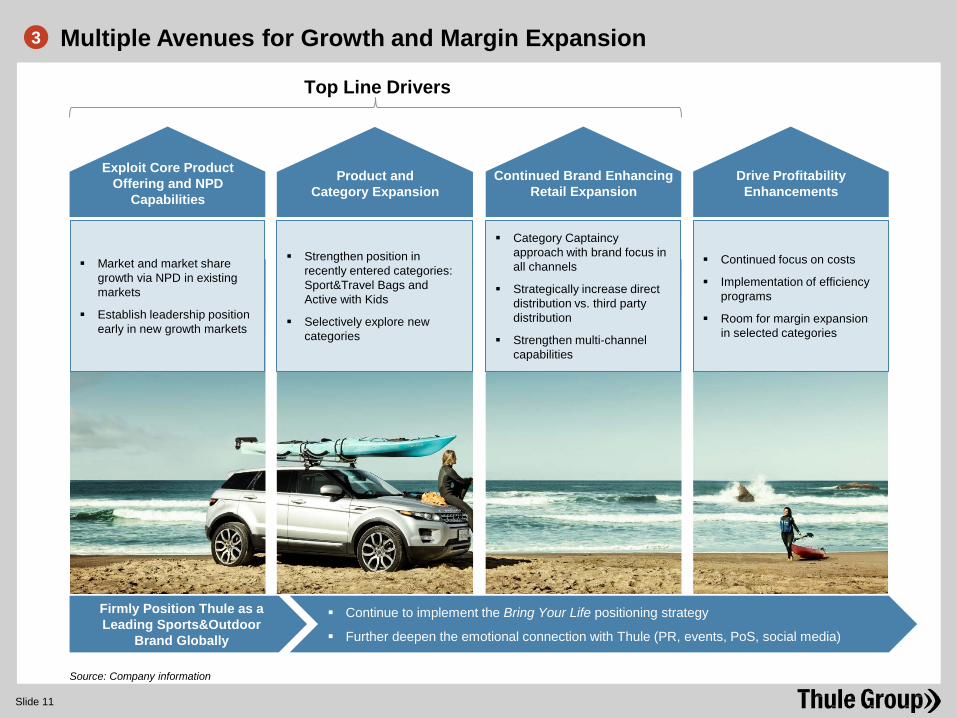
Multiple Avenues for Growth and Margin Expansion 3
Source: Company information
Drive Profitability Enhancements
Continued Brand Enhancing Retail Expansion
Exploit Core Product Offering and NPD
Capabilities
Market and market share growth via NPD in existing markets
Establish leadership position early in new growth markets
Continued focus on costs
Implementation of efficiency programs
Room for margin expansion in selected categories
Firmly Position Thule as a Leading Sports&Outdoor
Brand Globally
Continue to implement the Bring Your Life positioning strategy
Further deepen the emotional connection with Thule (PR, events, PoS, social media)
Product and Category Expansion
Strengthen position in recently entered categories: Sport&Travel Bags and Active with Kids
Selectively explore new categories
Category Captaincy approach with brand focus in all channels
Strategically increase direct distribution vs. third party distribution
Strengthen multi-channel capabilities
Top Line Drivers
Slide 12
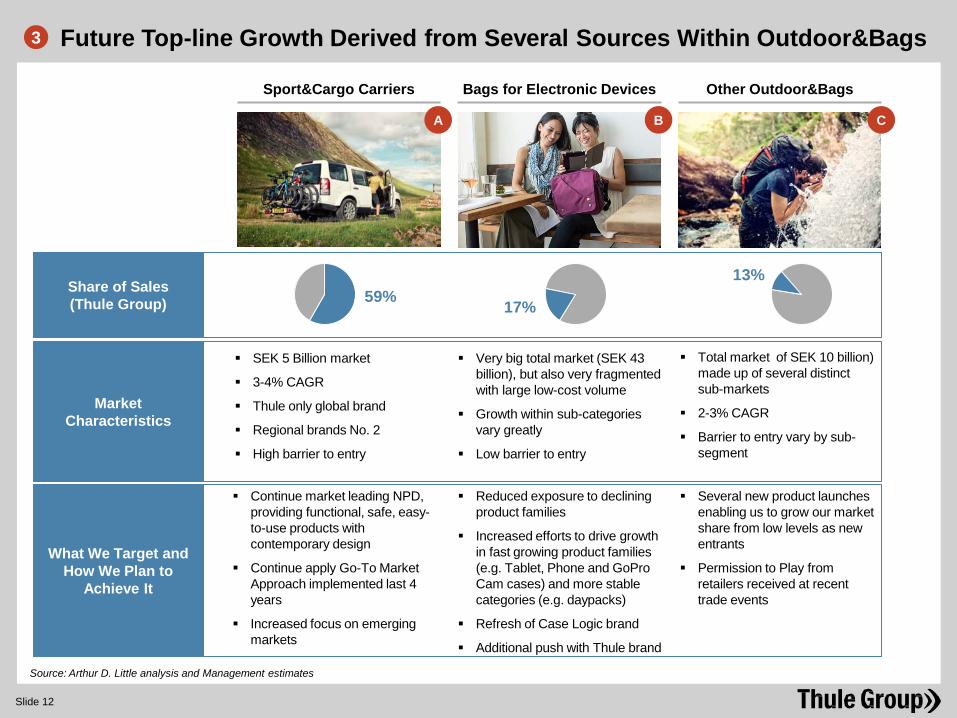
Sport&Cargo Carriers Bags for Electronic Devices Other Outdoor&Bags
Continue market leading NPD, providing functional, safe, easy-to-use products with contemporary design
Continue apply Go-To Market Approach implemented last 4 years
Increased focus on emerging markets
Several new product launches enabling us to grow our market share from low levels as new entrants
Permission to Play from retailers received at recent trade events
Share of Sales (Thule Group)
What We Target and How We Plan to
Achieve It
59% 17%
13%
Source: Arthur D. Little analysis and Management estimates
Market Characteristics
Reduced exposure to declining product families
Increased efforts to drive growth in fast growing product families (e.g. Tablet, Phone and GoPro Cam cases) and more stable categories (e.g. daypacks)
Refresh of Case Logic brand
Additional push with Thule brand
A B C
Future Top-line Growth Derived from Several Sources Within Outdoor&Bags 3
SEK 5 Billion market
3-4% CAGR
Thule only global brand
Regional brands No. 2
High barrier to entry
Very big total market (SEK 43 billion), but also very fragmented with large low-cost volume
Growth within sub-categories vary greatly
Low barrier to entry
Total market of SEK 10 billion) made up of several distinct sub-markets
2-3% CAGR
Barrier to entry vary by sub-segment
Slide 13
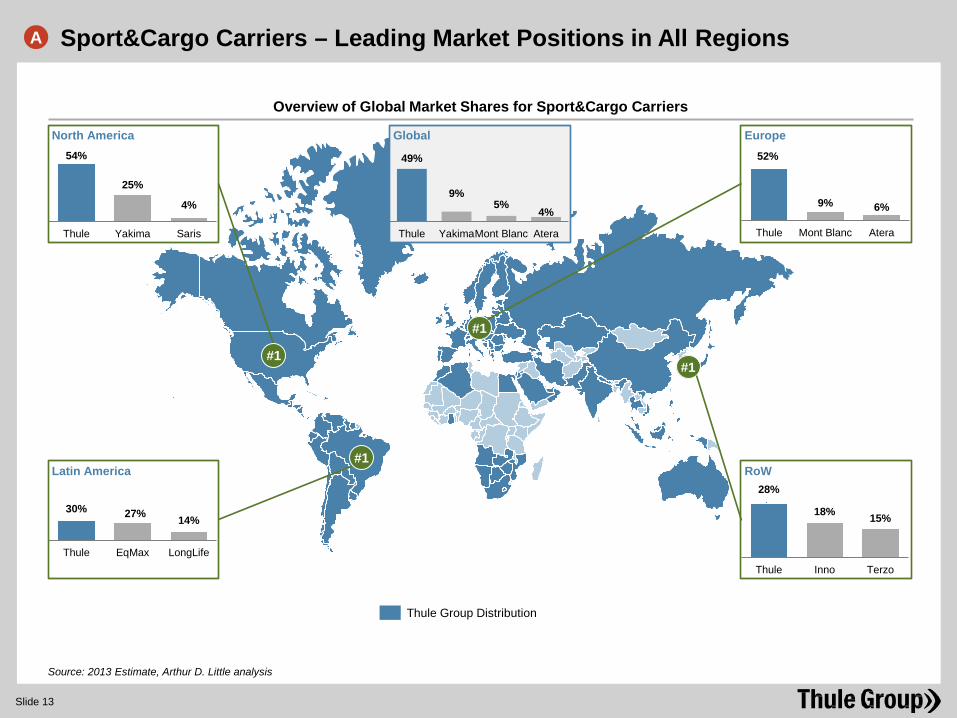
Source: 2013 Estimate, Arthur D. Little analysis
#1
#1
54%
25%
4%
Thule Yakima Saris
North America
Overview of Global Market Shares for Sport&Cargo Carriers
Thule Group Distribution
#1
#1
30% 27% 14%
Thule EqMax LongLife
Latin America
52%
9% 6%
Thule Mont Blanc Atera
Europe
28%
18% 15%
Thule Inno Terzo
RoW
49%
9% 5%
4%
Thule YakimaMont Blanc Atera
Global
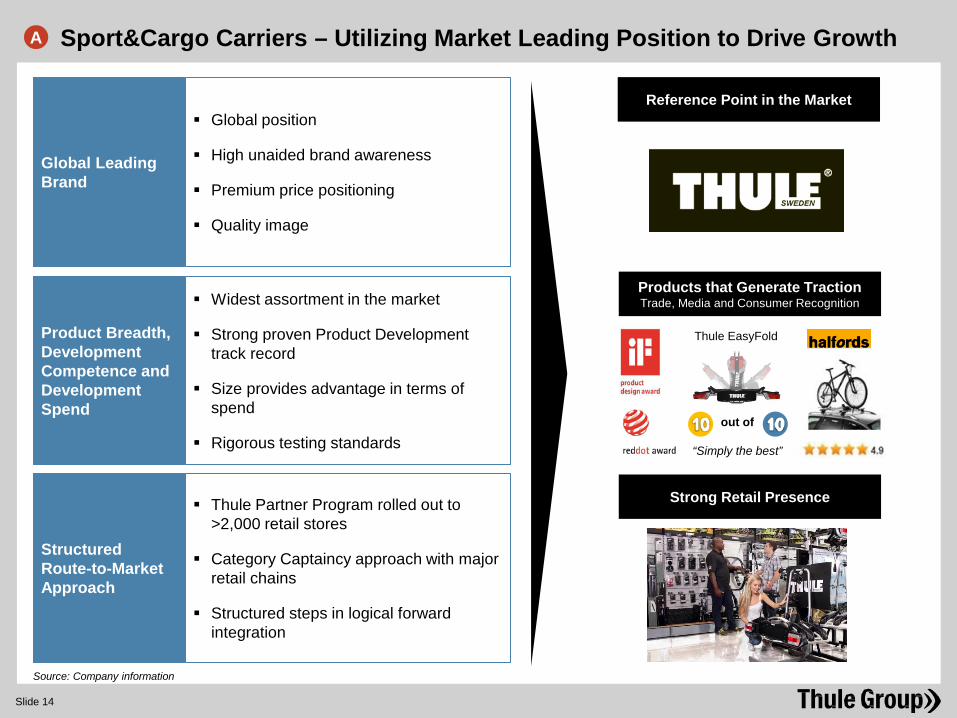
Sport&Cargo Carriers – Leading Market Positions in All Regions A
Slide 14
Widest assortment in the market
Strong proven Product Development track record
Size provides advantage in terms of spend
Rigorous testing standards
Products that Generate Traction Trade, Media and Consumer Recognition
Reference Point in the Market
Strong Retail Presence
Thule EasyFold
“Simply the best”
out of
Product Breadth, Development Competence and Development Spend
Global Leading Brand
Global position
High unaided brand awareness
Premium price positioning
Quality image
Source: Company information
Thule Partner Program rolled out to >2,000 retail stores
Category Captaincy approach with major retail chains
Structured steps in logical forward integration
Structured Route-to-Market Approach
Sport&Cargo Carriers – Utilizing Market Leading Position to Drive Growth A
Slide 15
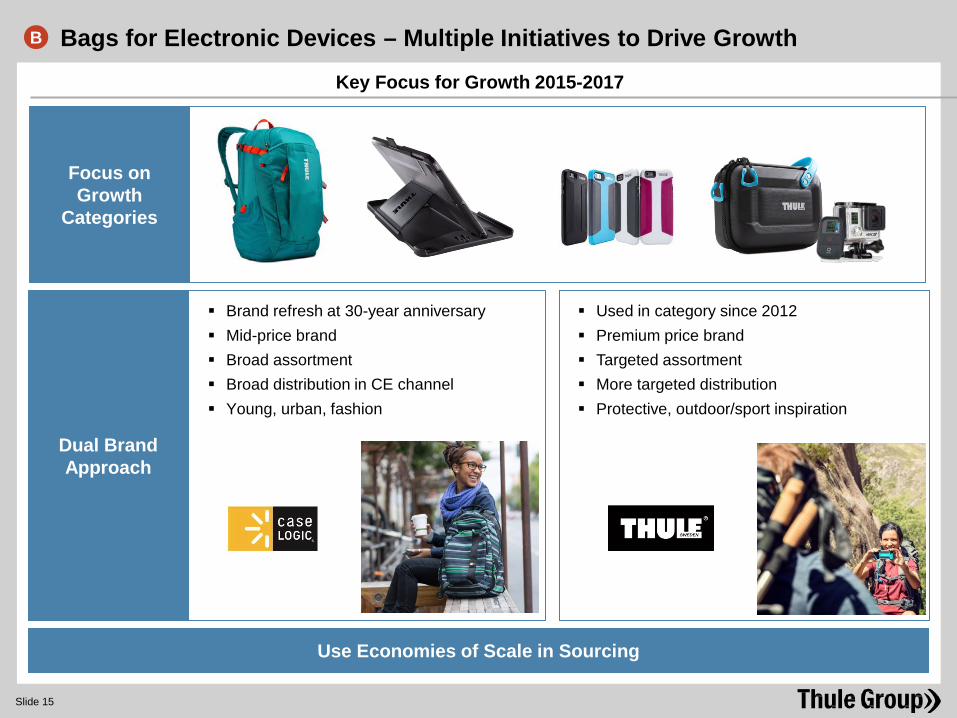
Bags for Electronic Devices – Multiple Initiatives to Drive Growth B
Key Focus for Growth 2015-2017
Dual Brand Approach
Use Economies of Scale in Sourcing
Focus on Growth
Categories
Brand refresh at 30-year anniversary Mid-price brand Broad assortment Broad distribution in CE channel Young, urban, fashion
Used in category since 2012 Premium price brand Targeted assortment More targeted distribution Protective, outdoor/sport inspiration
Slide 16
Source: Company information
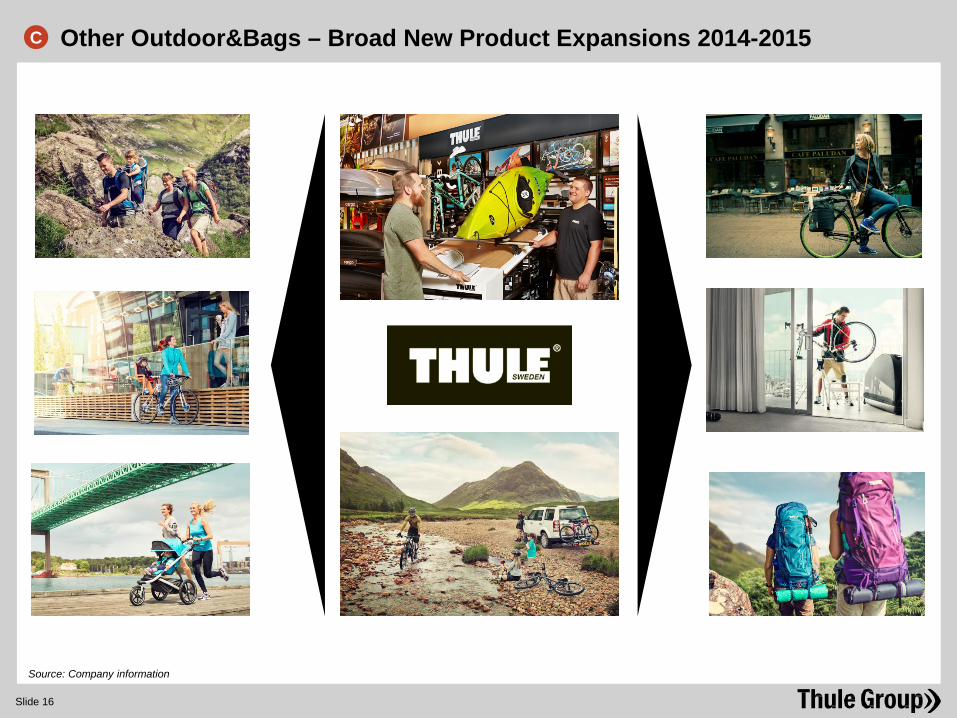
Other Outdoor&Bags – Broad New Product Expansions 2014-2015 C
Slide 17
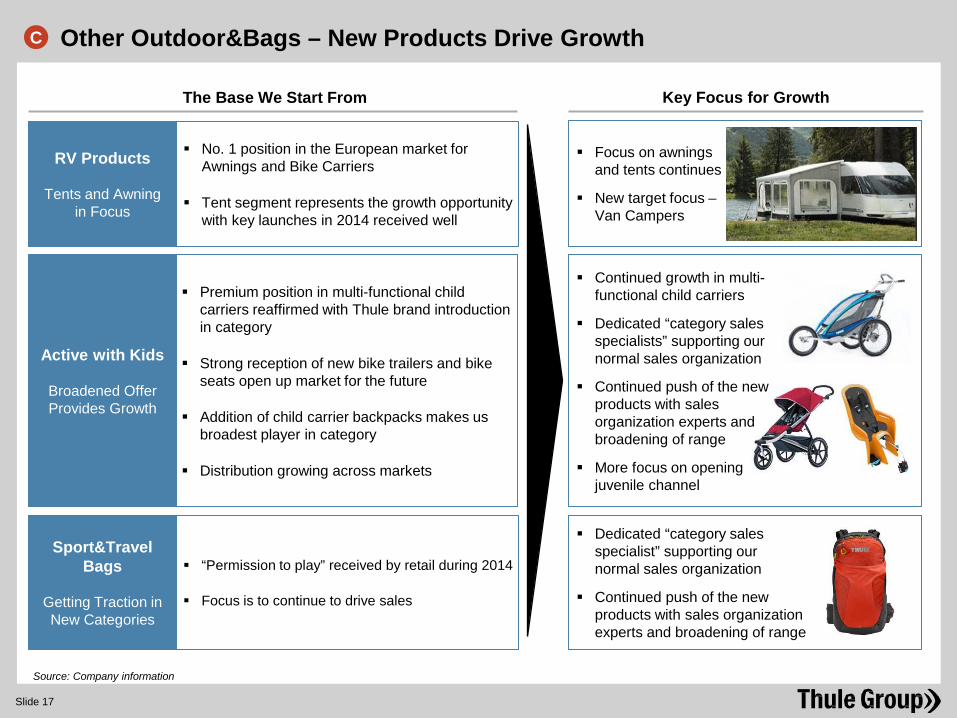
Key Focus for Growth
Active with Kids
Broadened Offer Provides Growth
Sport&Travel Bags
Getting Traction in New Categories
The Base We Start From
Premium position in multi-functional child carriers reaffirmed with Thule brand introduction in category
Strong reception of new bike trailers and bike seats open up market for the future
Addition of child carrier backpacks makes us broadest player in category
Distribution growing across markets
“Permission to play” received by retail during 2014
Focus is to continue to drive sales
RV Products
Tents and Awning in Focus
No. 1 position in the European market for Awnings and Bike Carriers
Tent segment represents the growth opportunity with key launches in 2014 received well
Dedicated “category sales specialist” supporting our normal sales organization
Continued push of the new products with sales organization experts and broadening of range
Continued growth in multi- functional child carriers
Dedicated “category sales specialists” supporting our normal sales organization
Continued push of the new products with sales organization experts and broadening of range
More focus on opening juvenile channel
Focus on awnings and tents continues
New target focus – Van Campers
Source: Company information
C Other Outdoor&Bags – New Products Drive Growth
2014 Results
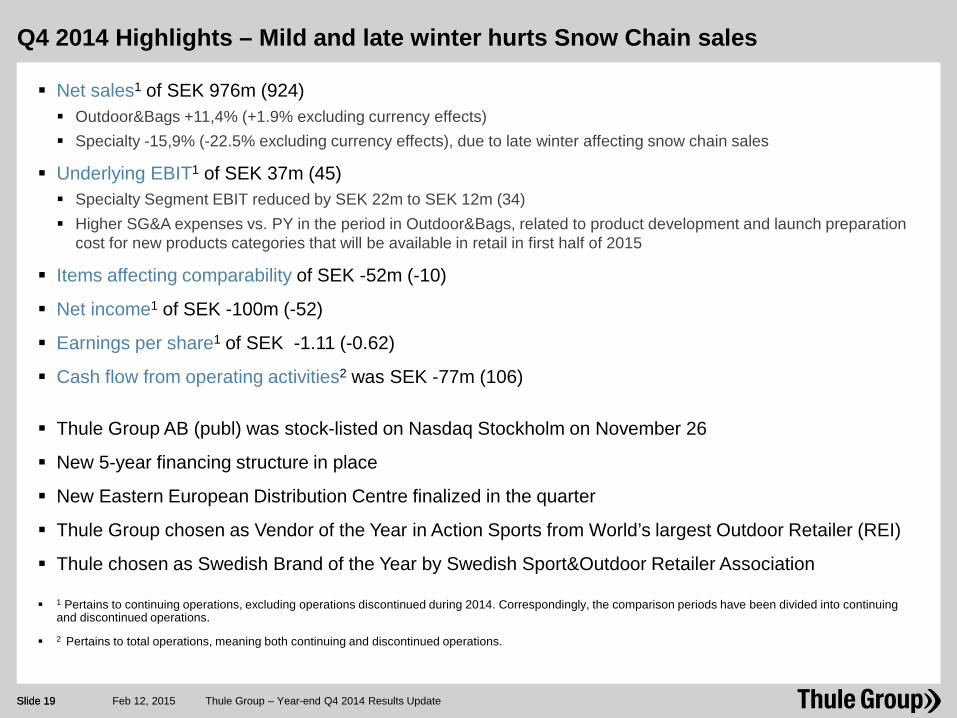
Q4 2014 Highlights – Mild and late winter hurts Snow Chain sales
Slide 19 Thule Group – Year-end Q4 2014 Results Update Feb 12, 2015 Slide 19
Net sales1 of SEK 976m (924) Outdoor&Bags +11,4% (+1.9% excluding currency effects) Specialty -15,9% (-22.5% excluding currency effects), due to late winter affecting snow chain sales
Underlying EBIT1 of SEK 37m (45) Specialty Segment EBIT reduced by SEK 22m to SEK 12m (34) Higher SG&A expenses vs. PY in the period in Outdoor&Bags, related to product development and launch preparation
cost for new products categories that will be available in retail in first half of 2015
Items affecting comparability of SEK -52m (-10)
Net income1 of SEK -100m (-52)
Earnings per share1 of SEK -1.11 (-0.62)
Cash flow from operating activities2 was SEK -77m (106)
Thule Group AB (publ) was stock-listed on Nasdaq Stockholm on November 26
New 5-year financing structure in place
New Eastern European Distribution Centre finalized in the quarter
Thule Group chosen as Vendor of the Year in Action Sports from World’s largest Outdoor Retailer (REI)
Thule chosen as Swedish Brand of the Year by Swedish Sport&Outdoor Retailer Association
1 Pertains to continuing operations, excluding operations discontinued during 2014. Correspondingly, the comparison periods have been divided into continuing and discontinued operations.
2 Pertains to total operations, meaning both continuing and discontinued operations.
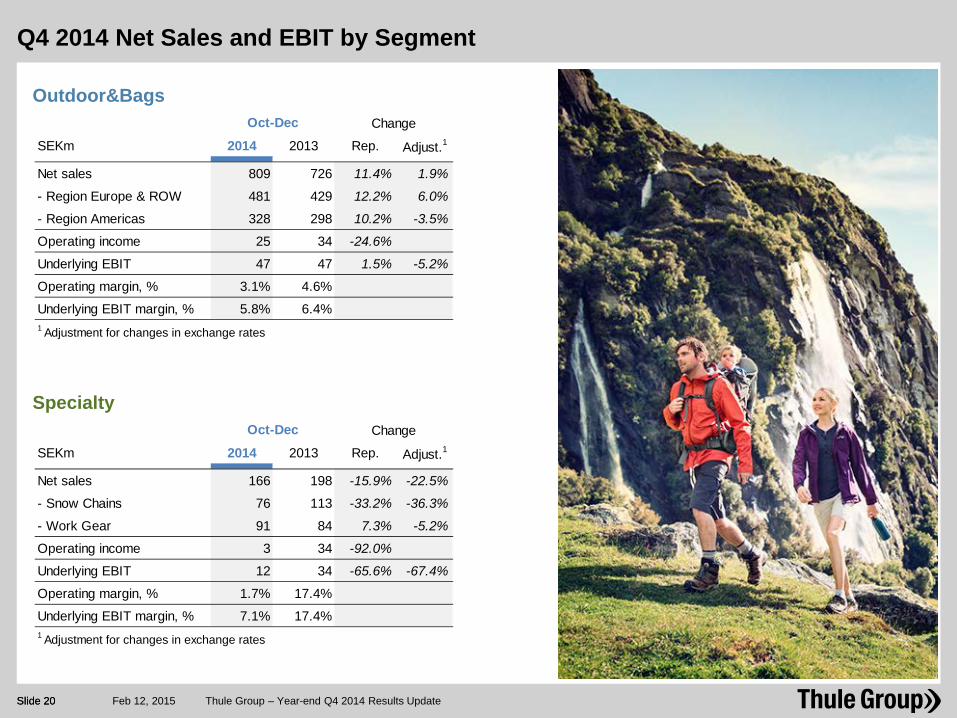
SEKm 2014 2013 Rep. Adjust.1
Net sales 809 726 11.4% 1.9%
- Region Europe & ROW 481 429 12.2% 6.0%
- Region Americas 328 298 10.2% -3.5%
Operating income 25 34 -24.6%
Underlying EBIT 47 47 1.5% -5.2%
Operating margin, % 3.1% 4.6%
Underlying EBIT margin, % 5.8% 6.4%1 Adjustment for changes in exchange rates
Oct-Dec Change
Slide 20
Q4 2014 Net Sales and EBIT by Segment
Thule Group – Year-end Q4 2014 Results Update Feb 12, 2015 Slide 20
Specialty
Outdoor&Bags
SEKm 2014 2013 Rep. Adjust.1
Net sales 166 198 -15.9% -22.5%
- Snow Chains 76 113 -33.2% -36.3%
- Work Gear 91 84 7.3% -5.2%
Operating income 3 34 -92.0%
Underlying EBIT 12 34 -65.6% -67.4%
Operating margin, % 1.7% 17.4%
Underlying EBIT margin, % 7.1% 17.4%1 Adjustment for changes in exchange rates
Oct-Dec Change
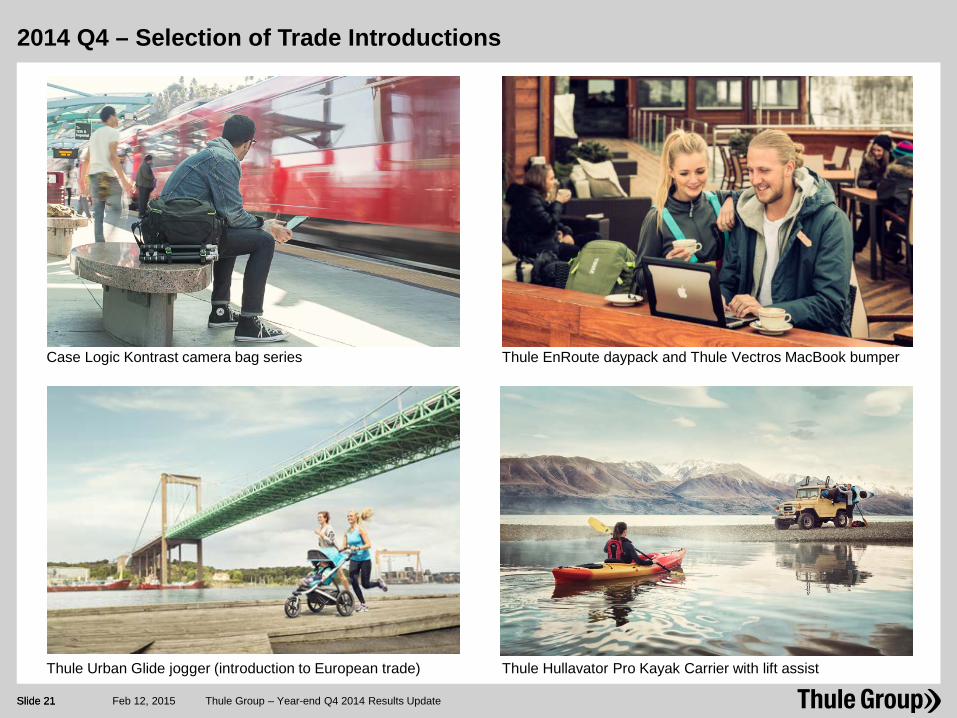
2014 Q4 – Selection of Trade Introductions
Slide 21 Thule Group – Year-end Q4 2014 Results Update Feb 12, 2015 Slide 21
Thule Urban Glide jogger (introduction to European trade) Thule Hullavator Pro Kayak Carrier with lift assist
Case Logic Kontrast camera bag series Thule EnRoute daypack and Thule Vectros MacBook bumper
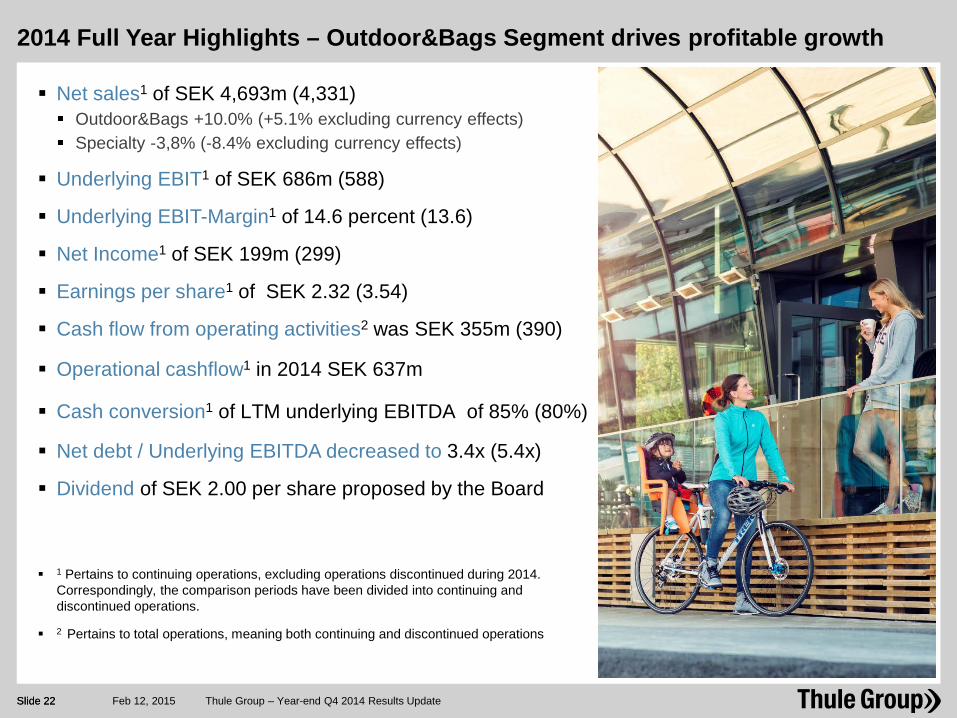
2014 Full Year Highlights – Outdoor&Bags Segment drives profitable growth
Slide 22 Thule Group – Year-end Q4 2014 Results Update Feb 12, 2015 Slide 22
Net sales1 of SEK 4,693m (4,331) Outdoor&Bags +10.0% (+5.1% excluding currency effects) Specialty -3,8% (-8.4% excluding currency effects)
Underlying EBIT1 of SEK 686m (588)
Underlying EBIT-Margin1 of 14.6 percent (13.6)
Net Income1 of SEK 199m (299)
Earnings per share1 of SEK 2.32 (3.54)
Cash flow from operating activities2 was SEK 355m (390)
Operational cashflow1 in 2014 SEK 637m
Cash conversion1 of LTM underlying EBITDA of 85% (80%)
Net debt / Underlying EBITDA decreased to 3.4x (5.4x)
Dividend of SEK 2.00 per share proposed by the Board
1 Pertains to continuing operations, excluding operations discontinued during 2014. Correspondingly, the comparison periods have been divided into continuing and discontinued operations.
2 Pertains to total operations, meaning both continuing and discontinued operations
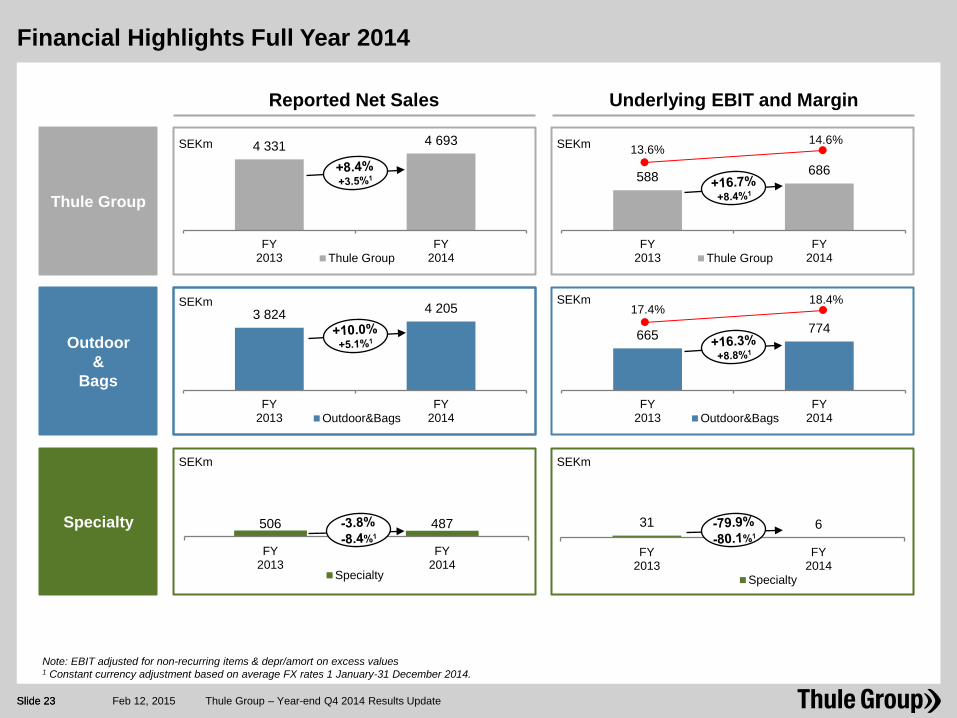
3 824 4 205
FY2013
FY2014Outdoor&Bags
4 331 4 693
FY2013
FY2014Thule Group
Slide 23
Note: EBIT adjusted for non-recurring items & depr/amort on excess values 1 Constant currency adjustment based on average FX rates 1 January-31 December 2014.
665 774
FY2013
FY2014Outdoor&Bags
Reported Net Sales
Outdoor &
Bags
Specialty
Underlying EBIT and Margin
SEKm SEKm
588 686
FY2013
FY2014Thule Group
Thule Group
SEKm SEKm
31 6
FY2013
FY2014
Specialty
O&B Americas
SEKm SEKm
506 487
FY2013
FY2014
Specialty
Financial Highlights Full Year 2014
Thule Group – Year-end Q4 2014 Results Update Feb 12, 2015
13.6% 14.6%
17.4% 18.4%
Slide 23
Source: Company information
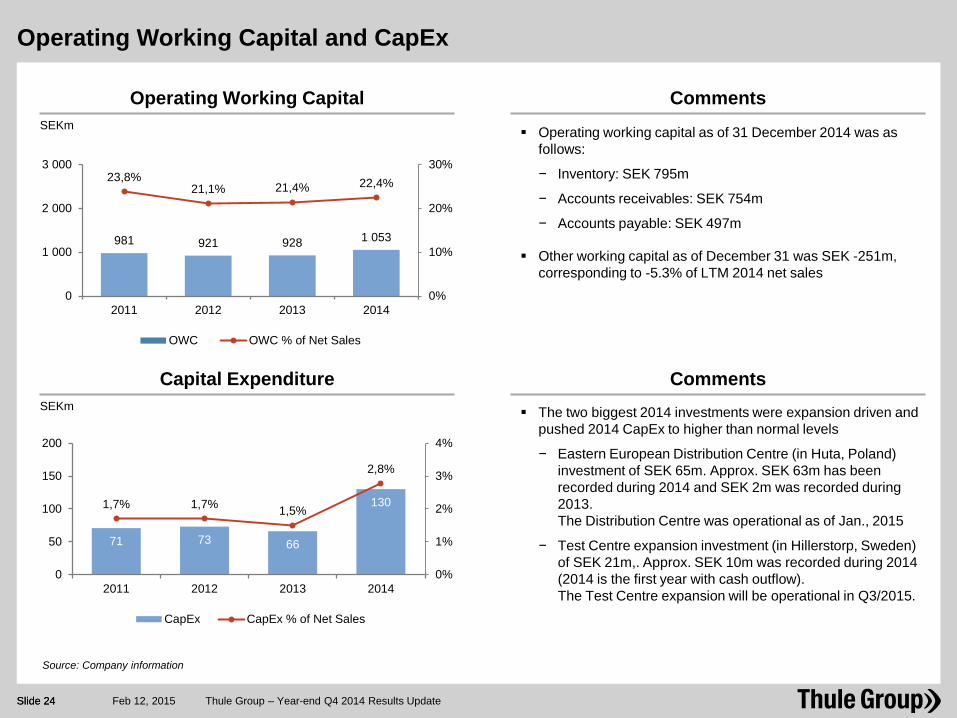
Operating Working Capital and CapEx
Operating Working Capital SEKm
Capital Expenditure
71 73 66
130 1,7% 1,7% 1,5%
2,8%
0%
1%
2%
3%
4%
0
50
100
150
200
2011 2012 2013 2014
CapEx CapEx % of Net Sales
SEKm
Comments
Operating working capital as of 31 December 2014 was as follows:
− Inventory: SEK 795m
− Accounts receivables: SEK 754m
− Accounts payable: SEK 497m
Other working capital as of December 31 was SEK -251m, corresponding to -5.3% of LTM 2014 net sales
Comments The two biggest 2014 investments were expansion driven and
pushed 2014 CapEx to higher than normal levels
− Eastern European Distribution Centre (in Huta, Poland) investment of SEK 65m. Approx. SEK 63m has been recorded during 2014 and SEK 2m was recorded during 2013. The Distribution Centre was operational as of Jan., 2015
− Test Centre expansion investment (in Hillerstorp, Sweden) of SEK 21m,. Approx. SEK 10m was recorded during 2014 (2014 is the first year with cash outflow). The Test Centre expansion will be operational in Q3/2015.
981 921 928 1 053
23,8% 21,1% 21,4% 22,4%
0%
10%
20%
30%
0
1 000
2 000
3 000
2011 2012 2013 2014
OWC OWC % of Net Sales
Slide 24 Thule Group – Year-end Q4 2014 Results Update Feb 12, 2015 Slide 24
Source: Company information
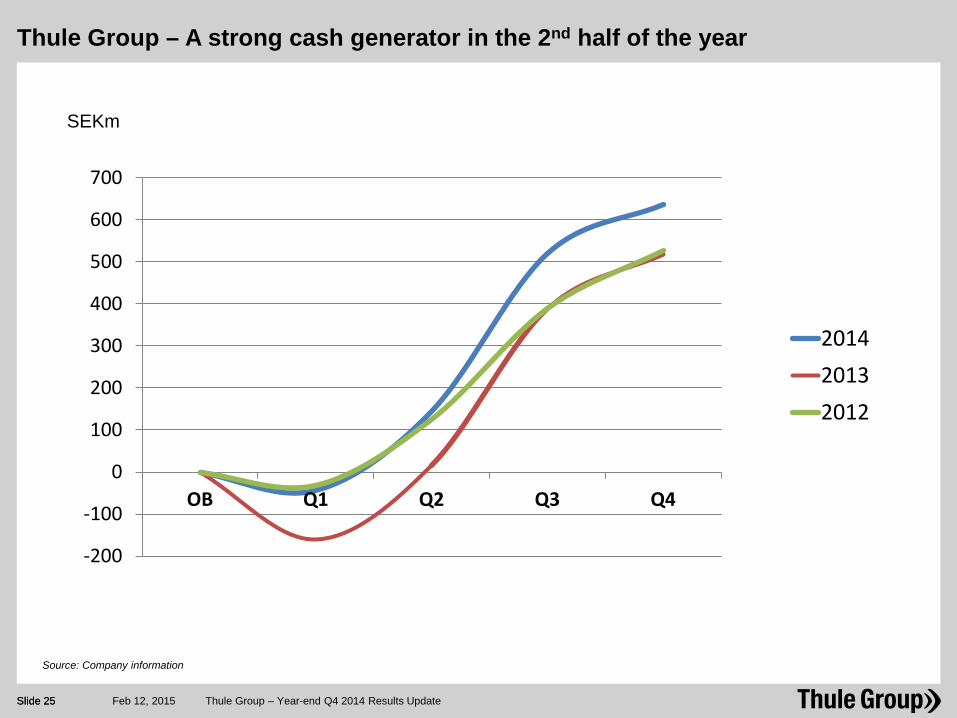
Thule Group – A strong cash generator in the 2nd half of the year
Slide 25 Thule Group – Year-end Q4 2014 Results Update Feb 12, 2015 Slide 25
SEKm
-200
-100
0
100
200
300
400
500
600
700
OB Q1 Q2 Q3 Q4
201420132012
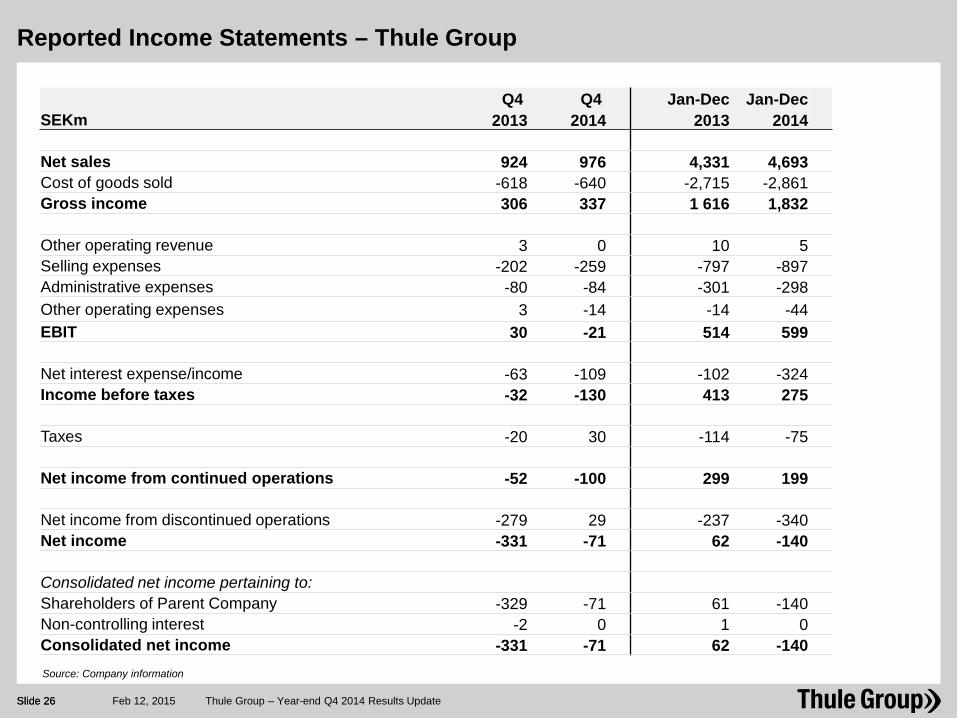
Reported Income Statements – Thule Group
Q4 Q4 Jan-Dec Jan-Dec SEKm 2013 2014 2013 2014 Net sales 924 976 4,331 4,693 Cost of goods sold -618 -640 -2,715 -2,861 Gross income 306 337 1 616 1,832 Other operating revenue 3 0 10 5 Selling expenses -202 -259 -797 -897 Administrative expenses -80 -84 -301 -298 Other operating expenses 3 -14 -14 -44 EBIT 30 -21 514 599 Net interest expense/income -63 -109 -102 -324 Income before taxes -32 -130 413 275 Taxes -20 30 -114 -75 Net income from continued operations -52 -100 299 199 Net income from discontinued operations -279 29 -237 -340 Net income -331 -71 62 -140 Consolidated net income pertaining to: Shareholders of Parent Company -329 -71 61 -140 Non-controlling interest -2 0 1 0 Consolidated net income -331 -71 62 -140 Source: Company information
Slide 26 Thule Group – Year-end Q4 2014 Results Update Feb 12, 2015 Slide 26
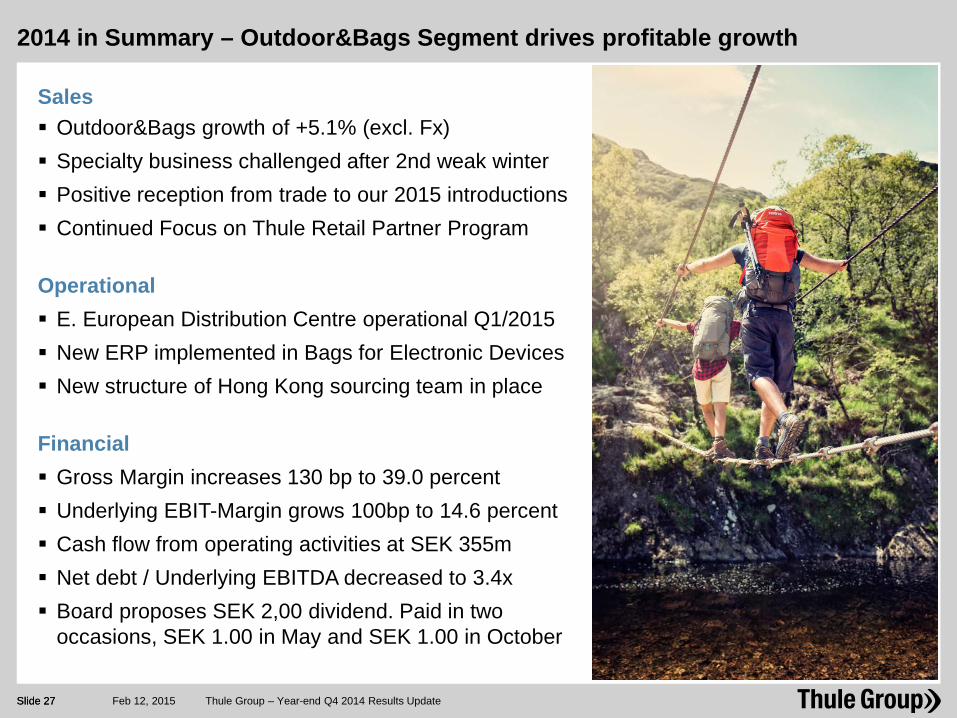
2014 in Summary – Outdoor&Bags Segment drives profitable growth
Slide 27 Thule Group – Year-end Q4 2014 Results Update Feb 12, 2015 Slide 27
Sales Outdoor&Bags growth of +5.1% (excl. Fx) Specialty business challenged after 2nd weak winter Positive reception from trade to our 2015 introductions Continued Focus on Thule Retail Partner Program
Operational E. European Distribution Centre operational Q1/2015 New ERP implemented in Bags for Electronic Devices New structure of Hong Kong sourcing team in place
Financial Gross Margin increases 130 bp to 39.0 percent Underlying EBIT-Margin grows 100bp to 14.6 percent Cash flow from operating activities at SEK 355m Net debt / Underlying EBITDA decreased to 3.4x Board proposes SEK 2,00 dividend. Paid in two
occasions, SEK 1.00 in May and SEK 1.00 in October
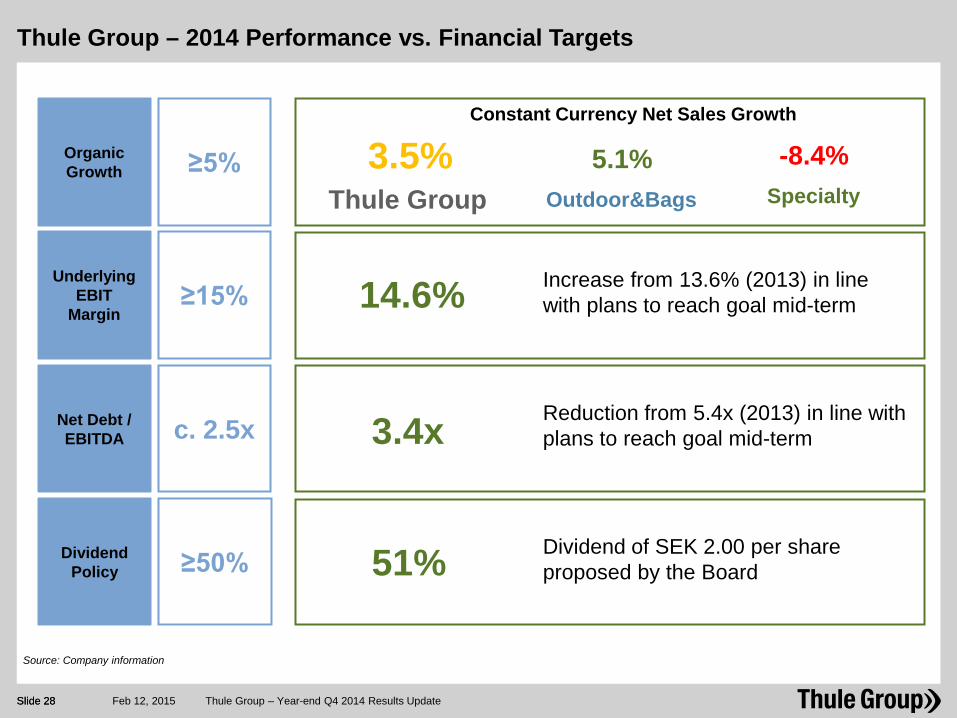
Thule Group – 2014 Performance vs. Financial Targets
Slide 28 Thule Group – Year-end Q4 2014 Results Update Feb 12, 2015 Slide 28
Source: Company information
Dividend Policy ≥50%
Organic Growth ≥5%
UnderlyingEBIT
Margin ≥15%
Net Debt / EBITDA c. 2.5x
Constant Currency Net Sales Growth
3.5% Thule Group
5.1% Outdoor&Bags
-8.4% Specialty
14.6%
3.4x Reduction from 5.4x (2013) in line with plans to reach goal mid-term
Increase from 13.6% (2013) in line with plans to reach goal mid-term
51% Dividend of SEK 2.00 per share proposed by the Board
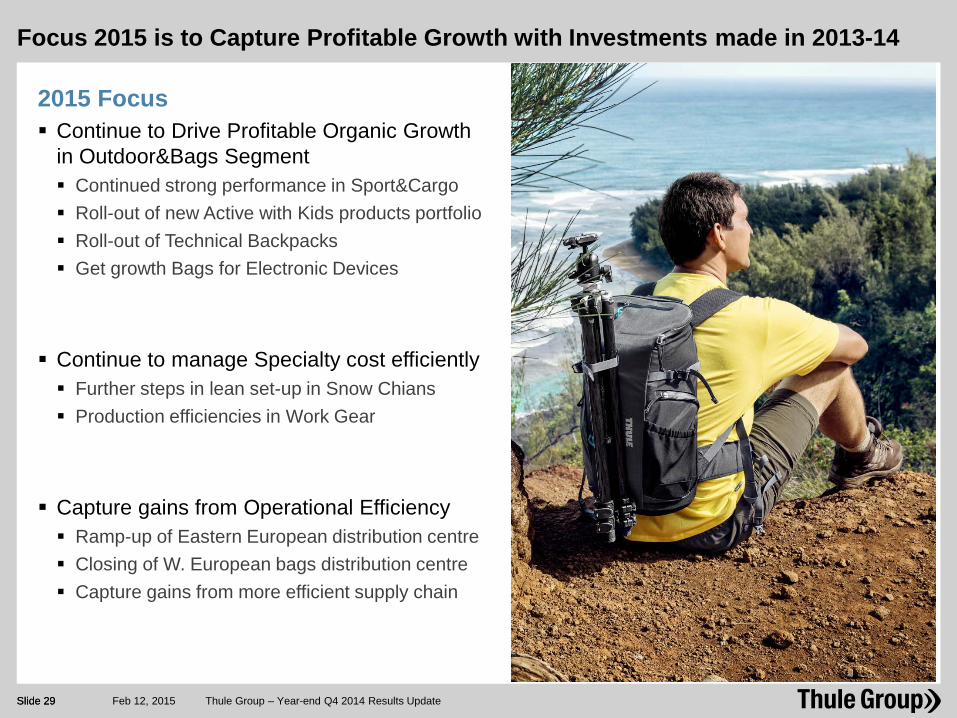
Focus 2015 is to Capture Profitable Growth with Investments made in 2013-14
Slide 29 Thule Group – Year-end Q4 2014 Results Update Feb 12, 2015 Slide 29
2015 Focus Continue to Drive Profitable Organic Growth
in Outdoor&Bags Segment Continued strong performance in Sport&Cargo Roll-out of new Active with Kids products portfolio Roll-out of Technical Backpacks Get growth Bags for Electronic Devices Continue to manage Specialty cost efficiently Further steps in lean set-up in Snow Chians Production efficiencies in Work Gear Capture gains from Operational Efficiency Ramp-up of Eastern European distribution centre Closing of W. European bags distribution centre Capture gains from more efficient supply chain
Slide 30
Q&A
Disclaimer
This presentation has been prepared by Thule Group AB (publ) (the “Company”) solely for use at this presentation and is furnished to you solely for your information and may not be reproduced or redistributed, in whole or in part, to any other person. The presentation does not constitute an invitation or offer to acquire, purchase or subscribe for securities. By attending the meeting where this presentation is made, or by reading the presentation slides, you agree to be bound by the following limitations.
Statements in this presentation, which are not historical facts, such as expectations, anticipations, beliefs and estimates, are forward-looking statements within the meaning of the United States Private Securities Litigation Reform Act of 1995. Such statements involve risks and uncertainties which may cause actual results to materially differ from those expressed in such forward-looking statements.
This presentation may contain various forward-looking statements that reflect management’s current views with respect to future events and financial and operational performance. The words “believe,” “expect,” “anticipate,” “intend,” “may,” “plan,” “estimate,” “should,” “could,” “aim,” “target,” “might,” or, in each case, their negative, or similar expressions identify certain of these forward-looking statements. Others can be identified from the context in which the statements are made. These forward-looking statements involve known and unknown risks, uncertainties and other factors, which are in some cases beyond the Company’s control and may cause actual results or performance to differ materially from those expressed or implied from such forward-looking statements. These risks include but are not limited to the Company’s ability to operate profitably, maintain its competitive position, to promote and improve its reputation and the awareness of the brands in its portfolio, to successfully operate its growth strategy and the impact of changes in pricing policies, political and regulatory developments in the markets in which the Company operates, and other risks.
The information and opinions contained in this document are provided as at the date of this presentation and are subject to change without notice.
No representation or warranty (expressed or implied) is made as to, and no reliance should be placed on, the fairness, accuracy or completeness of the information contained herein. Accordingly, none of the Company, or any of its principal shareholders or subsidiary undertakings or any of such person’s officers or employees accepts any liability whatsoever arising directly or indirectly from the use of this document.
www.thulegroup.com
Top Related