


Languages
Pages
Legal


Roadshow presentation
November 2013
2
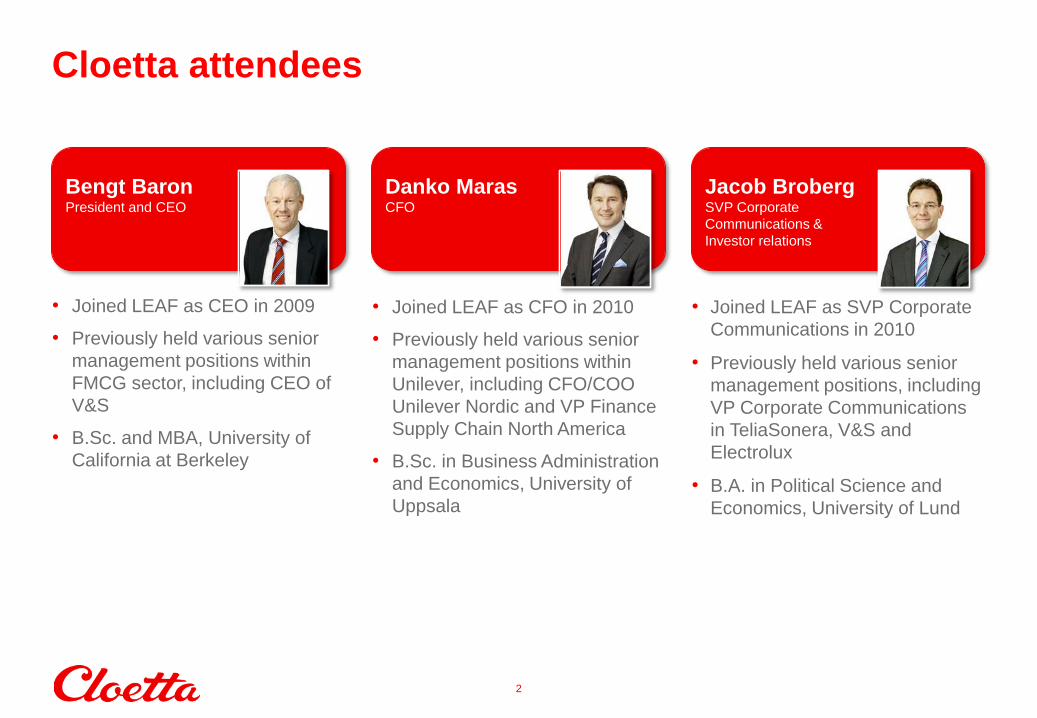
Cloetta attendees
• Joined LEAF as CEO in 2009
• Previously held various senior
management positions within
FMCG sector, including CEO of
V&S
• B.Sc. and MBA, University of
California at Berkeley
Bengt Baron President and CEO
• Joined LEAF as CFO in 2010
• Previously held various senior
management positions within
Unilever, including CFO/COO
Unilever Nordic and VP Finance
Supply Chain North America
• B.Sc. in Business Administration
and Economics, University of
Uppsala
Danko Maras CFO
• Joined LEAF as SVP Corporate
Communications in 2010
• Previously held various senior
management positions, including
VP Corporate Communications
in TeliaSonera, V&S and
Electrolux
• B.A. in Political Science and
Economics, University of Lund
Jacob Broberg SVP Corporate
Communications &
Investor relations
3
• The merger of Cloetta and LEAF was highly complementary in combination creating a Nordic
leader with full range of confectionery products
– Cloetta’s strength in the chocolate segment
– LEAF’s leading operations within the sugar confectionery segments
• The integration process is completed
• The restructuring program proceeds according to plan
• New Cloetta has a strong portfolio of iconic, local and long-established brands and has grown to
become significantly larger (5x) than old Cloetta
– Leading position and strong route to market in all Nordic countries, The Netherlands and Italy
• New financing structure in place
– Renegotiated bank facilities in August 2013
– Five year SEK 1,000m bond issue in September 2013
• Solid platform to capitalise on growth opportunities ahead
– Acquisitions are a part of the Company’s growth strategy
The new Cloetta was formed in 2012
4
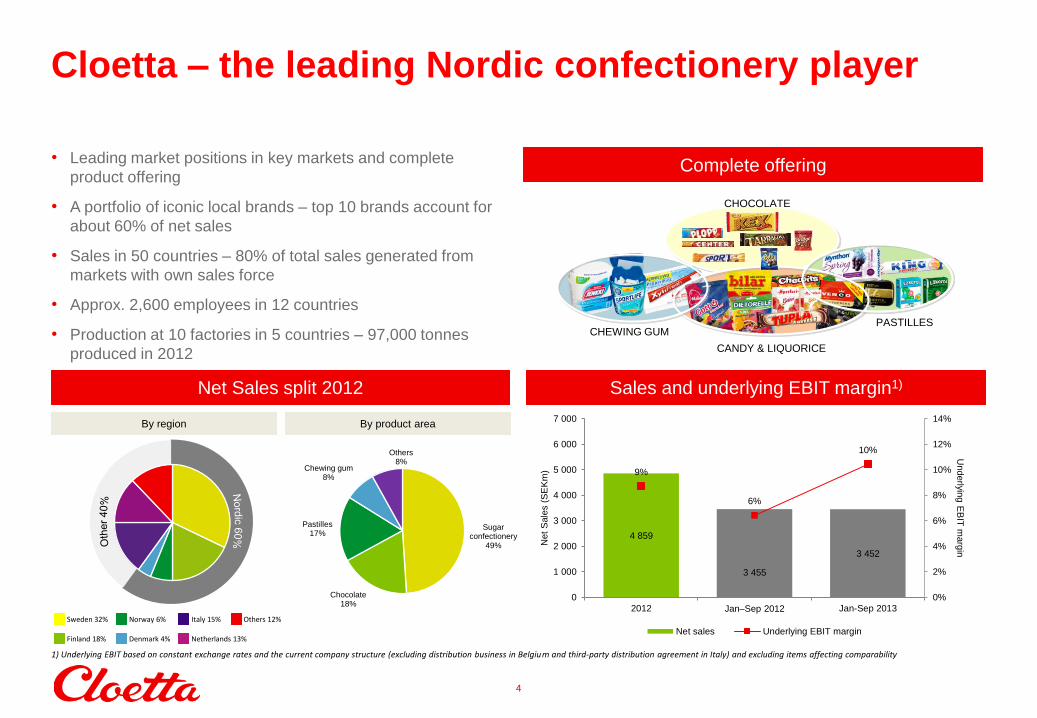
Cloetta – the leading Nordic confectionery player
• Leading market positions in key markets and complete
product offering
• A portfolio of iconic local brands – top 10 brands account for
about 60% of net sales
• Sales in 50 countries – 80% of total sales generated from
markets with own sales force
• Approx. 2,600 employees in 12 countries
• Production at 10 factories in 5 countries – 97,000 tonnes
produced in 2012
Complete offering
CANDY & LIQUORICE
CHEWING GUM PASTILLES
CHOCOLATE
Net Sales split 2012 Sales and underlying EBIT margin1)
Finland 18% Denmark 4% Netherlands 13%
Sweden 32% Norway 6% Italy 15% Others 12%
1) Underlying EBIT based on constant exchange rates and the current company structure (excluding distribution business in Belgium and third-party distribution agreement in Italy) and excluding items affecting comparability
By region By product area
Sugar confectionery
49%
Chocolate 18%
Pastilles 17%
Chewing gum 8%
Others 8%
4 859
3 455
3 452
9%
6%
10%
0%
2%
4%
6%
8%
10%
12%
14%
0
1 000
2 000
3 000
4 000
5 000
6 000
7 000
2012 Jan–Sep 2012 Jan-Sep 2013
Underlyin
g E
BIT
marg
in
Net
Sale
s (
SE
Km
)
Net sales Underlying EBIT margin
5
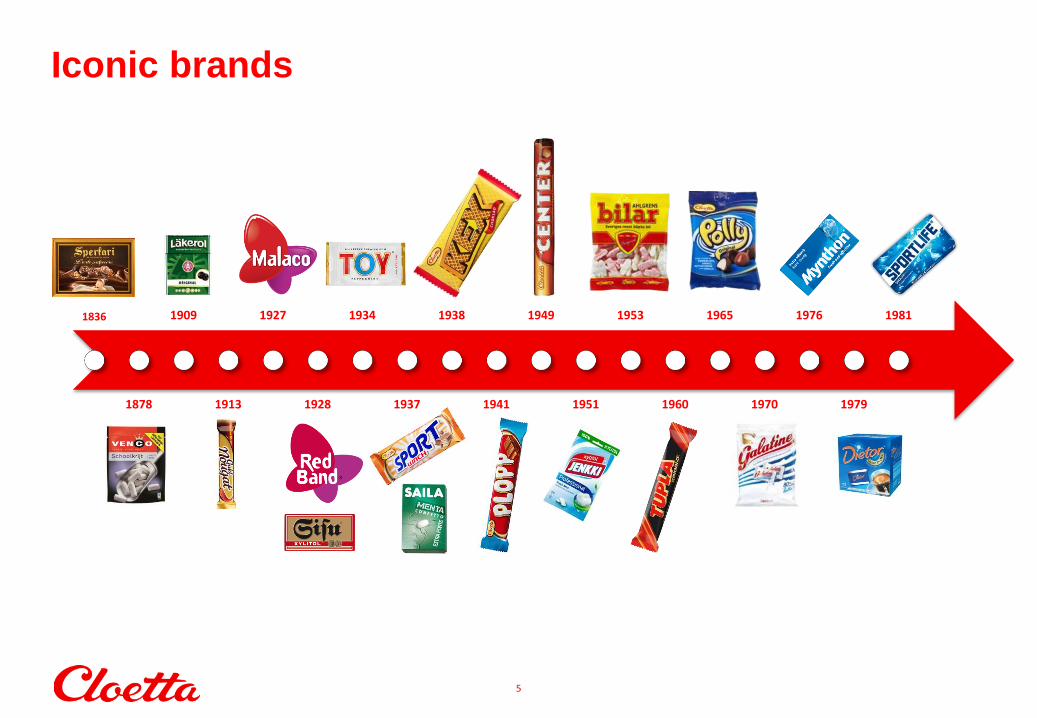
Iconic brands
1836
1878
1909
1913
1927
1928
1934
1937
1938
1941
1949
1951
1953
1960
1965
1970
1976
1979
1981
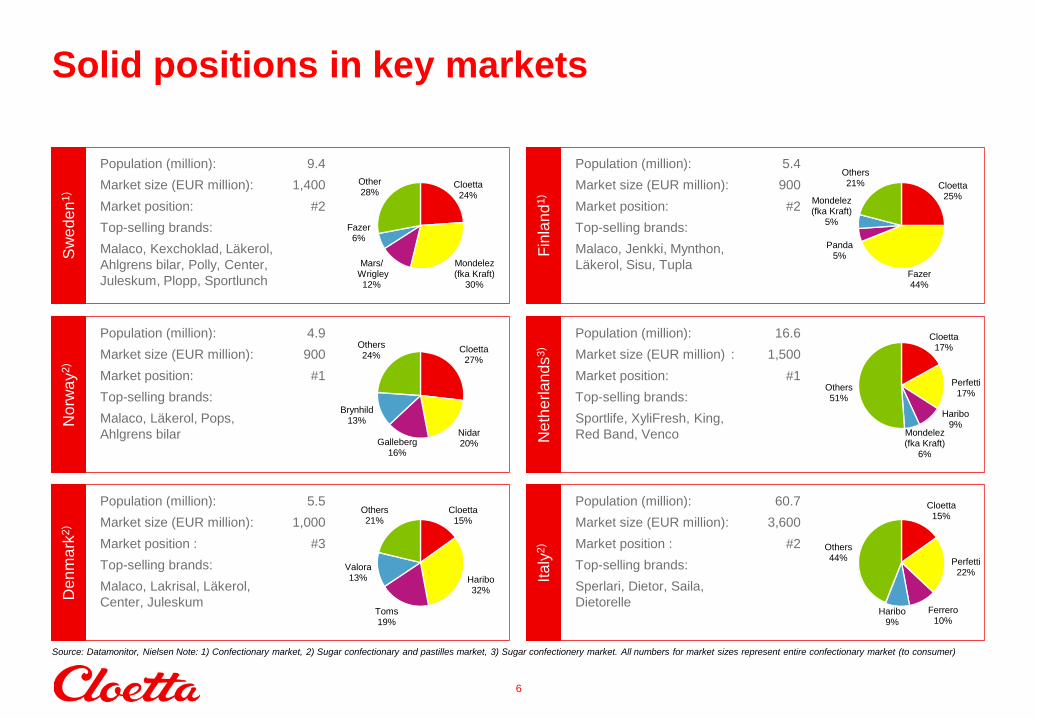
Population (million): 9.4
Market size (EUR million): 1,400
Market position: #2
Top-selling brands:
Malaco, Kexchoklad, Läkerol,
Ahlgrens bilar, Polly, Center,
Juleskum, Plopp, Sportlunch
Sw
ed
en
1)
Population (million): 4.9
Market size (EUR million): 900
Market position: #1
Top-selling brands:
Malaco, Läkerol, Pops,
Ahlgrens bilar
No
rwa
y2)
Population (million): 5.5
Market size (EUR million): 1,000
Market position : #3
Top-selling brands:
Malaco, Lakrisal, Läkerol,
Center, Juleskum
Den
ma
rk2)
Population (million): 5.4
Market size (EUR million): 900
Market position: #2
Top-selling brands:
Malaco, Jenkki, Mynthon,
Läkerol, Sisu, Tupla
Fin
lan
d1)
Population (million): 16.6
Market size (EUR million) : 1,500
Market position: #1
Top-selling brands:
Sportlife, XyliFresh, King,
Red Band, Venco Neth
erla
nds
3)
Population (million): 60.7
Market size (EUR million): 3,600
Market position : #2
Top-selling brands:
Sperlari, Dietor, Saila,
Dietorelle
Ita
ly2)
6
Solid positions in key markets
Cloetta 24%
Mondelez (fka Kraft)
30%
Mars/ Wrigley
12%
Fazer 6%
Other 28%
Cloetta 27%
Nidar 20% Galleberg
16%
Brynhild 13%
Others 24%
Cloetta 15%
Haribo 32%
Toms 19%
Valora 13%
Others 21%
Cloetta 25%
Fazer 44%
Panda 5%
Mondelez (fka Kraft)
5%
Others 21%
Cloetta 17%
Perfetti 17%
Haribo 9%
Mondelez (fka Kraft)
6%
Others 51%
Cloetta 15%
Perfetti 22%
Ferrero 10%
Haribo 9%
Others 44%
Source: Datamonitor, Nielsen Note: 1) Confectionary market, 2) Sugar confectionary and pastilles market, 3) Sugar confectionery market. All numbers for market sizes represent entire confectionary market (to consumer)
7
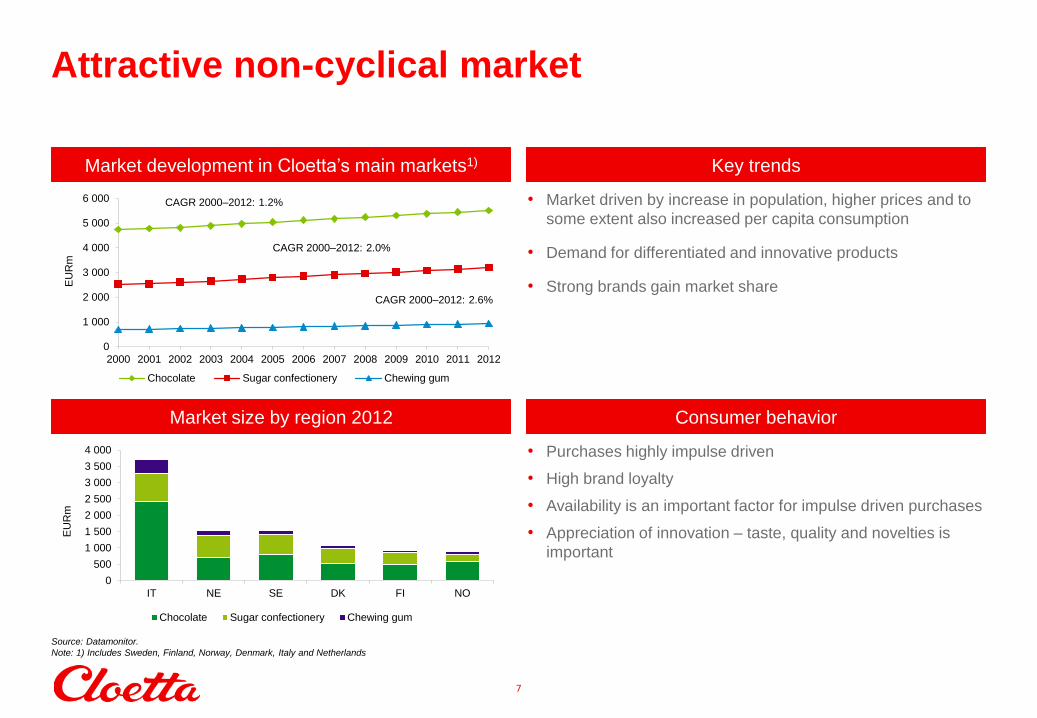
Attractive non-cyclical market
0
1 000
2 000
3 000
4 000
5 000
6 000
2000 2001 2002 2003 2004 2005 2006 2007 2008 2009 2010 2011 2012
EU
Rm
Chocolate Sugar confectionery Chewing gum
Market development in Cloetta’s main markets1) Key trends
• Market driven by increase in population, higher prices and to
some extent also increased per capita consumption
• Demand for differentiated and innovative products
• Strong brands gain market share
CAGR 2000–2012: 2.0%
CAGR 2000–2012: 1.2%
CAGR 2000–2012: 2.6%
Market size by region 2012 Consumer behavior
• Purchases highly impulse driven
• High brand loyalty
• Availability is an important factor for impulse driven purchases
• Appreciation of innovation – taste, quality and novelties is
important
Source: Datamonitor.
Note: 1) Includes Sweden, Finland, Norway, Denmark, Italy and Netherlands
0
500
1 000
1 500
2 000
2 500
3 000
3 500
4 000
IT NE SE DK FI NO
EU
Rm
Chocolate Sugar confectionery Chewing gum
8
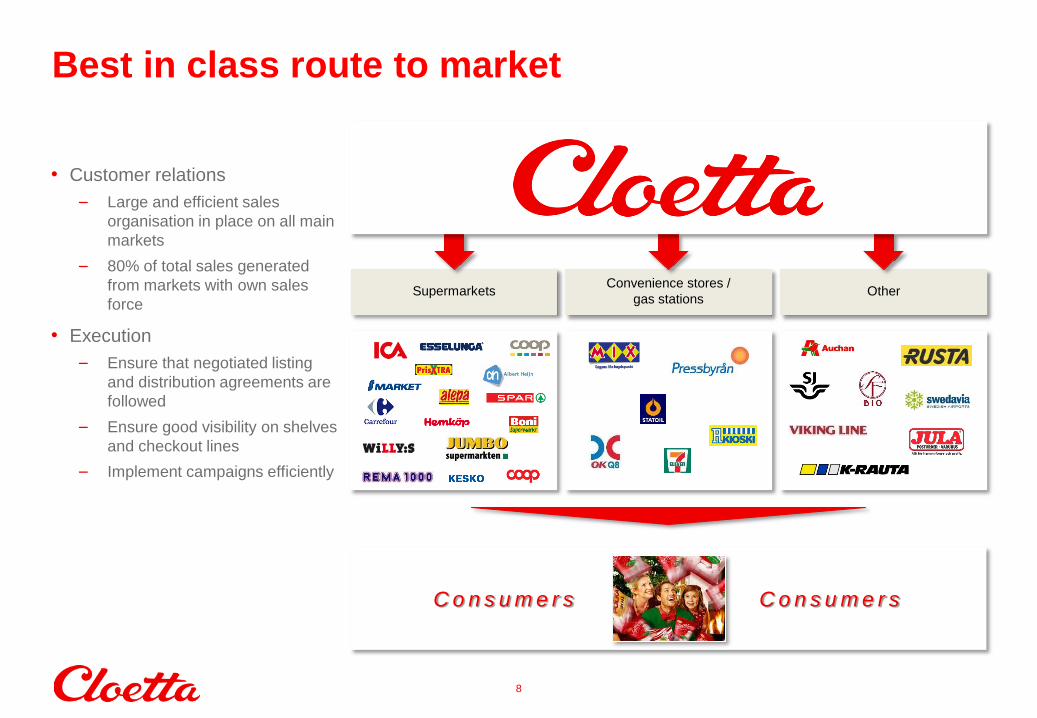
Best in class route to market
Supermarkets Convenience stores /
gas stations Other
• Customer relations
– Large and efficient sales
organisation in place on all main
markets
– 80% of total sales generated
from markets with own sales
force
• Execution
– Ensure that negotiated listing
and distribution agreements are
followed
– Ensure good visibility on shelves
and checkout lines
– Implement campaigns efficiently
C o n s u m e r s C o n s u m e r s
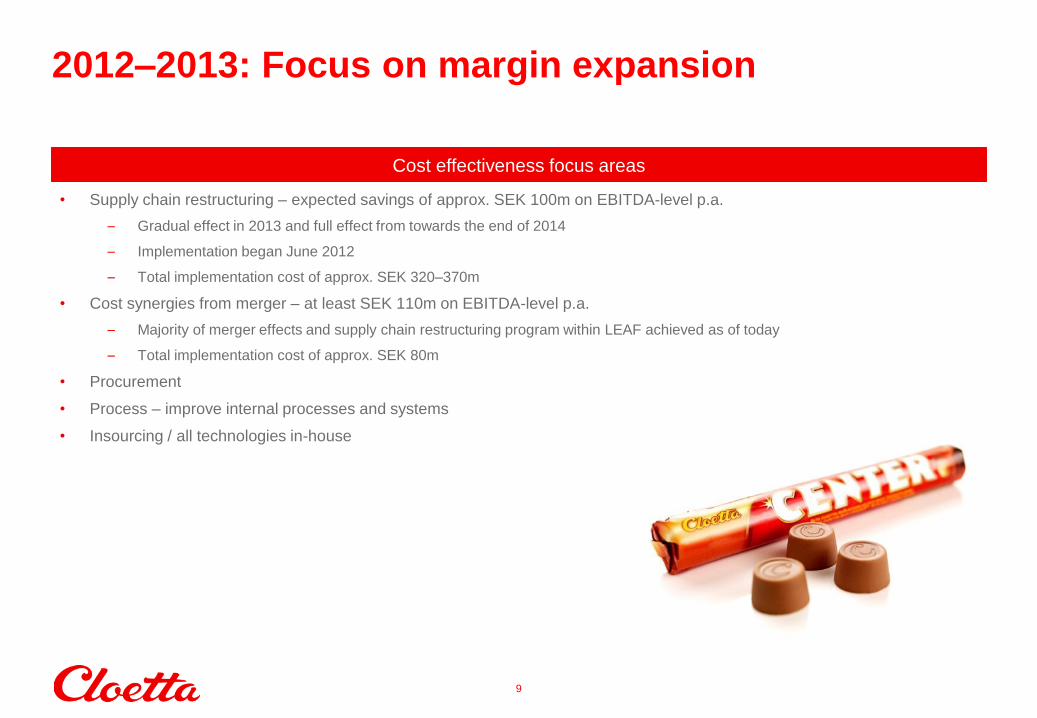
• Supply chain restructuring – expected savings of approx. SEK 100m on EBITDA-level p.a.
– Gradual effect in 2013 and full effect from towards the end of 2014
– Implementation began June 2012
– Total implementation cost of approx. SEK 320–370m
• Cost synergies from merger – at least SEK 110m on EBITDA-level p.a.
– Majority of merger effects and supply chain restructuring program within LEAF achieved as of today
– Total implementation cost of approx. SEK 80m
• Procurement
• Process – improve internal processes and systems
• Insourcing / all technologies in-house
9
2012–2013: Focus on margin expansion
Cost effectiveness focus areas
Status
10
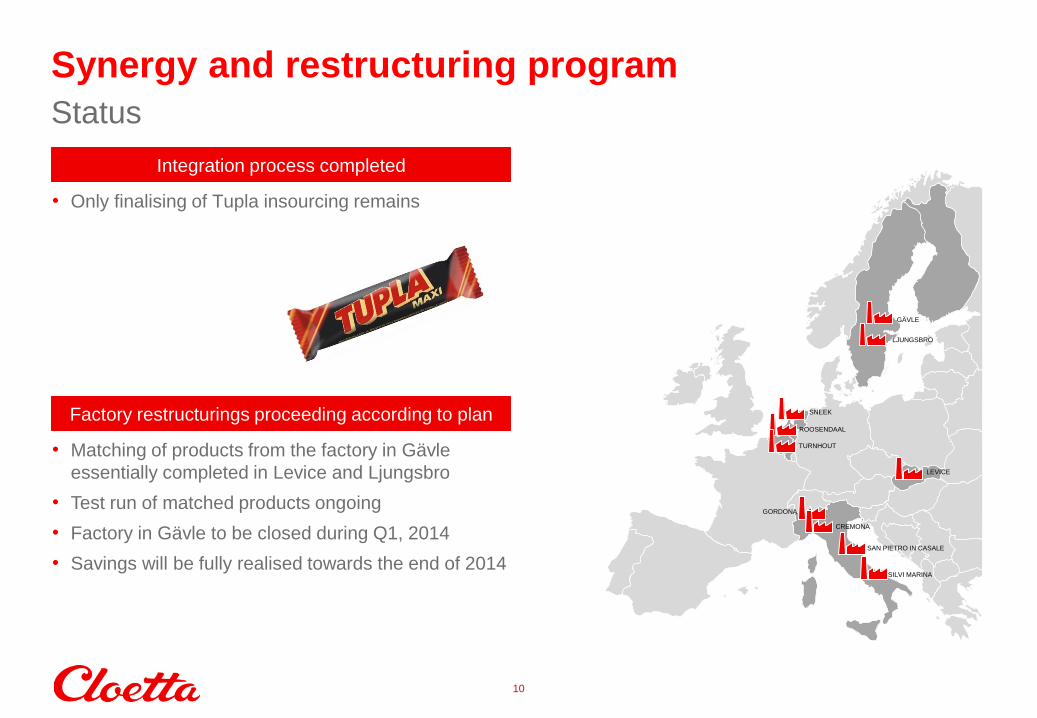
Synergy and restructuring program
Integration process completed
• Only finalising of Tupla insourcing remains
Factory restructurings proceeding according to plan
• Matching of products from the factory in Gävle
essentially completed in Levice and Ljungsbro
• Test run of matched products ongoing
• Factory in Gävle to be closed during Q1, 2014
• Savings will be fully realised towards the end of 2014
GÄVLE
LJUNGSBRO
SNEEK
ROOSENDAAL
TURNHOUT
LEVICE
GORDONA
CREMONA
SAN PIETRO IN CASALE
SILVI MARINA
11
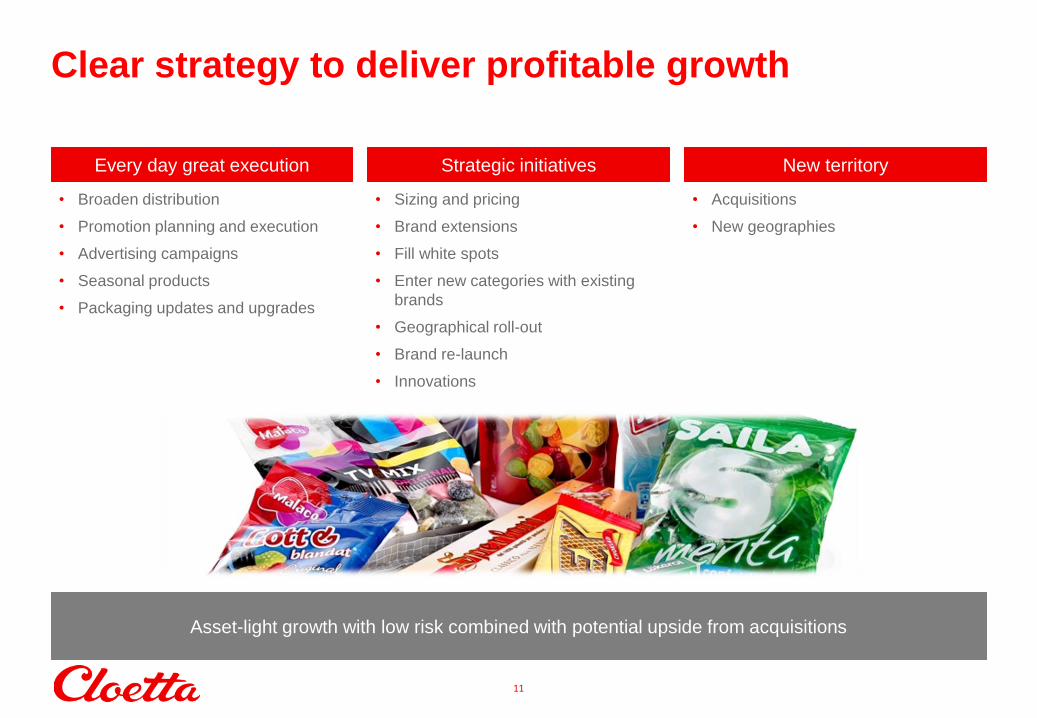
Clear strategy to deliver profitable growth
Asset-light growth with low risk combined with potential upside from acquisitions
• Acquisitions
• New geographies
New territory
• Broaden distribution
• Promotion planning and execution
• Advertising campaigns
• Seasonal products
• Packaging updates and upgrades
Every day great execution
• Sizing and pricing
• Brand extensions
• Fill white spots
• Enter new categories with existing
brands
• Geographical roll-out
• Brand re-launch
• Innovations
Strategic initiatives
Examples of initiatives
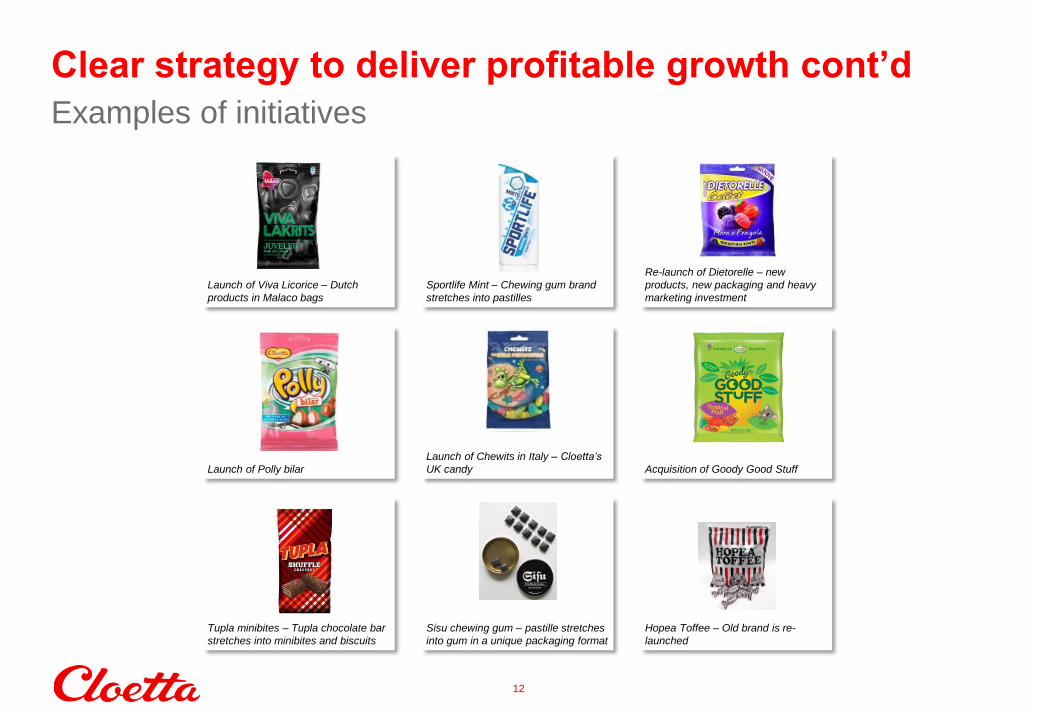
12
Clear strategy to deliver profitable growth cont’d
Launch of Viva Licorice – Dutch
products in Malaco bags
Launch of Polly bilar
Sisu chewing gum – pastille stretches
into gum in a unique packaging format
Sportlife Mint – Chewing gum brand
stretches into pastilles
Re-launch of Dietorelle – new
products, new packaging and heavy
marketing investment
Launch of Chewits in Italy – Cloetta’s
UK candy
Hopea Toffee – Old brand is re-
launched
Tupla minibites – Tupla chocolate bar
stretches into minibites and biscuits
Acquisition of Goody Good Stuff
13
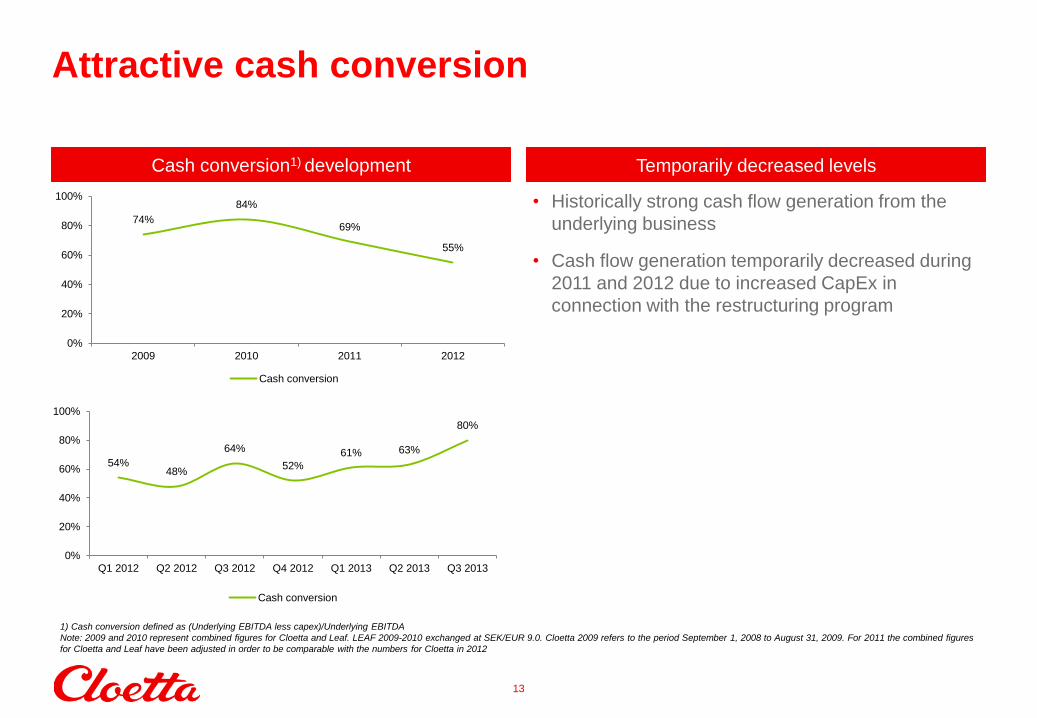
Attractive cash conversion
• Historically strong cash flow generation from the
underlying business
• Cash flow generation temporarily decreased during
2011 and 2012 due to increased CapEx in
connection with the restructuring program
Cash conversion1) development Temporarily decreased levels
1) Cash conversion defined as (Underlying EBITDA less capex)/Underlying EBITDA
Note: 2009 and 2010 represent combined figures for Cloetta and Leaf. LEAF 2009-2010 exchanged at SEK/EUR 9.0. Cloetta 2009 refers to the period September 1, 2008 to August 31, 2009. For 2011 the combined figures
for Cloetta and Leaf have been adjusted in order to be comparable with the numbers for Cloetta in 2012
74%
84%
69%
55%
0%
20%
40%
60%
80%
100%
2009 2010 2011 2012
Cash conversion
54% 48%
64%
52%
61% 63%
80%
0%
20%
40%
60%
80%
100%
Q1 2012 Q2 2012 Q3 2012 Q4 2012 Q1 2013 Q2 2013 Q3 2013
Cash conversion
Raw material and
Packaging 57%
Conversion cost 37%
Distribution and
Warehousing 6%
400
500
600
700
800
July 2006 July 2007 July 2008 July 2009 July 2010 July 2011 July 2012 July 2013
EU
R/t
Sugar price development
14
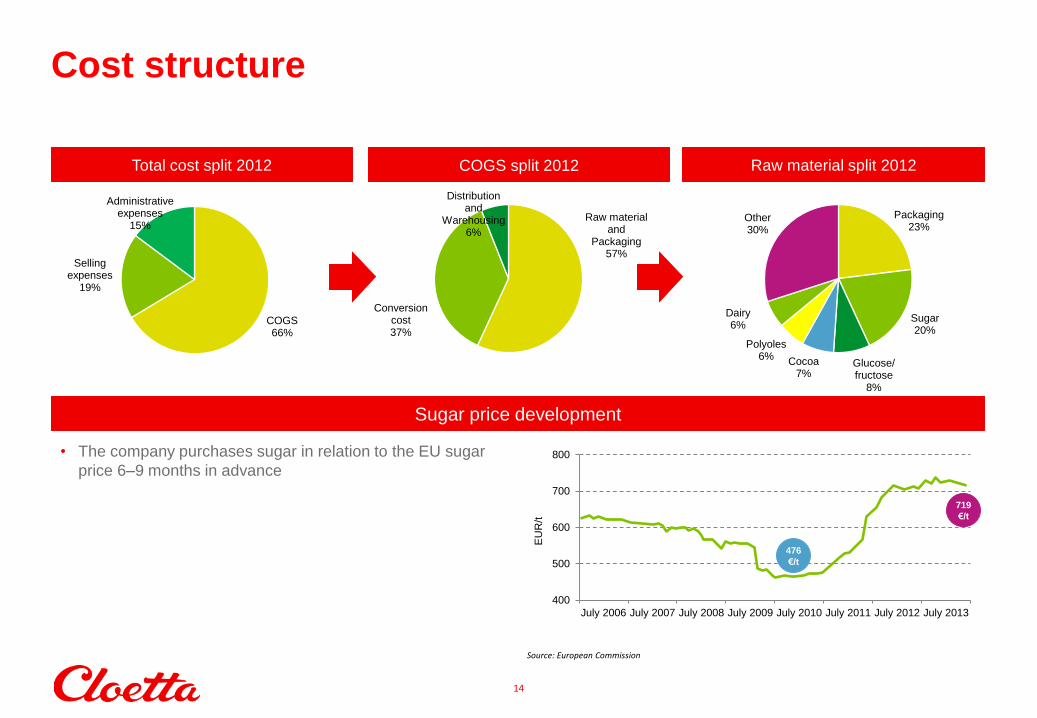
Cost structure
Raw material split 2012 Total cost split 2012 COGS split 2012
COGS 66%
Selling expenses
19%
Administrative expenses
15% Packaging
23%
Sugar 20%
Glucose/ fructose
8%
Cocoa 7%
Polyoles 6%
Dairy 6%
Other 30%
• The company purchases sugar in relation to the EU sugar
price 6–9 months in advance
Source: European Commission
476
€/t
719
€/t
15
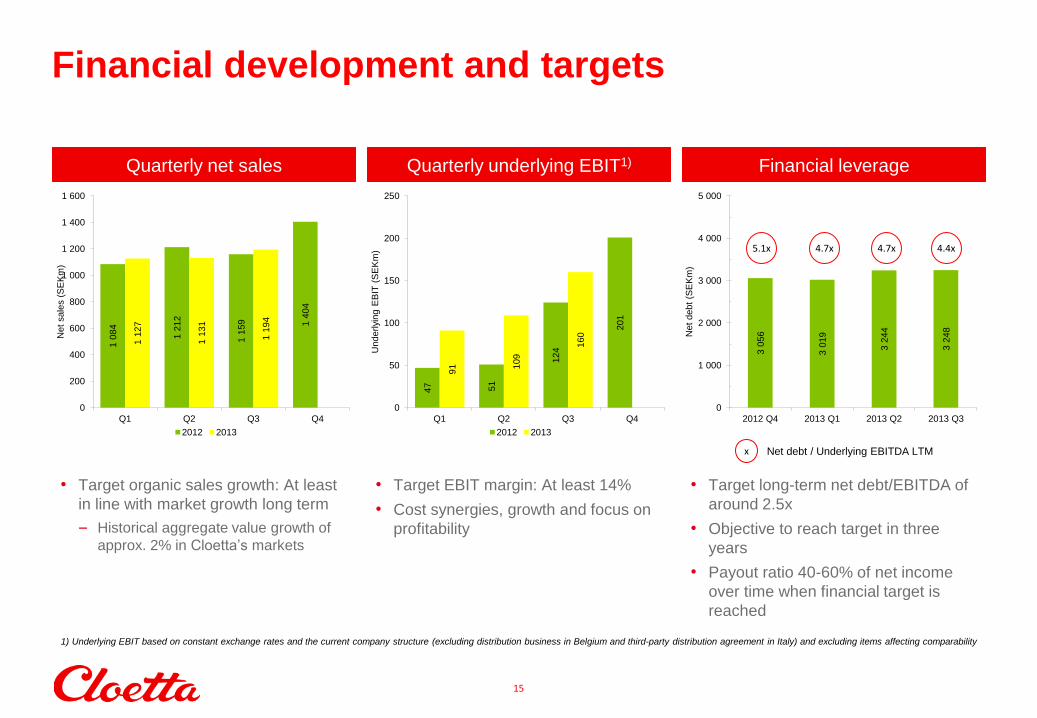
Financial development and targets
Quarterly net sales Quarterly underlying EBIT1) Financial leverage
• Target organic sales growth: At least
in line with market growth long term
– Historical aggregate value growth of
approx. 2% in Cloetta’s markets
• Target EBIT margin: At least 14%
• Cost synergies, growth and focus on
profitability
• Target long-term net debt/EBITDA of
around 2.5x
• Objective to reach target in three
years
• Payout ratio 40-60% of net income
over time when financial target is
reached
x Net debt / Underlying EBITDA LTM
4.7x 5.1x
1) Underlying EBIT based on constant exchange rates and the current company structure (excluding distribution business in Belgium and third-party distribution agreement in Italy) and excluding items affecting comparability
4.4x 4.7x
47
51
124
201
91
109
160
0
50
100
150
200
250
Q1 Q2 Q3 Q4
Underlyi
ng E
BIT
(S
EK
m)
2012 2013
3 0
56
3 0
19
3 2
44
3 2
48
0
1 000
2 000
3 000
4 000
5 000
2012 Q4 2013 Q1 2013 Q2 2013 Q3
Net
debt
(SE
Km
)
1 0
84
1 2
12
1 1
59
1 4
04
1 1
27
1 1
31
1 1
94
0
200
400
600
800
1 000
1 200
1 400
1 600
Q1 Q2 Q3 Q4
Net
sale
s (
SE
Km
)
2012 2013
16
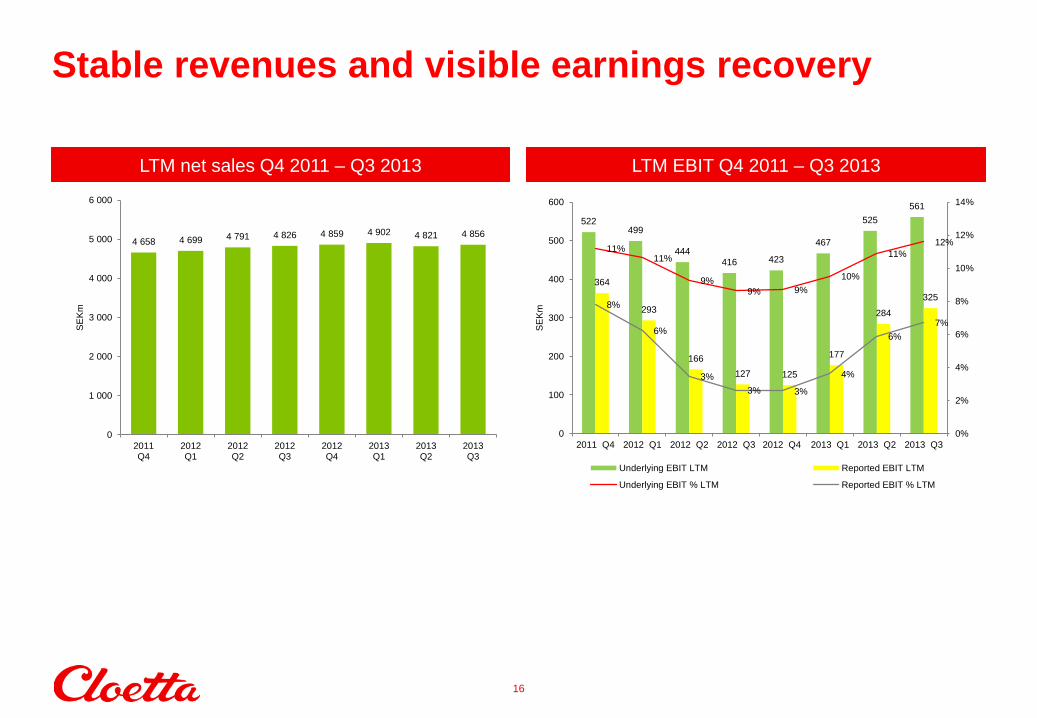
Stable revenues and visible earnings recovery
LTM net sales Q4 2011 – Q3 2013 LTM EBIT Q4 2011 – Q3 2013
4 856 4 821 4 902 4 859 4 826 4 791 4 699 4 658
0
1 000
2 000
3 000
4 000
5 000
6 000
2013Q3
2013Q2
2013Q1
2012Q4
2012Q3
2012Q2
2012Q1
2011Q4
SE
Km
522 499
444 416 423
467
525
561
364
293
166
127 125
177
284
325
11% 11%
9% 9% 9%
10%
11%
12%
8%
6%
3%
3% 3%
4%
6%
7%
0%
2%
4%
6%
8%
10%
12%
14%
0
100
200
300
400
500
600
2011 Q4 2012 Q1 2012 Q2 2012 Q3 2012 Q4 2013 Q1 2013 Q2 2013 Q3
SE
Km
Underlying EBIT LTM Reported EBIT LTM
Underlying EBIT % LTM Reported EBIT % LTM
17
Cloetta towards the future
PURPOSE / MISSION
To bring a smile to your
Munchy Moments
18
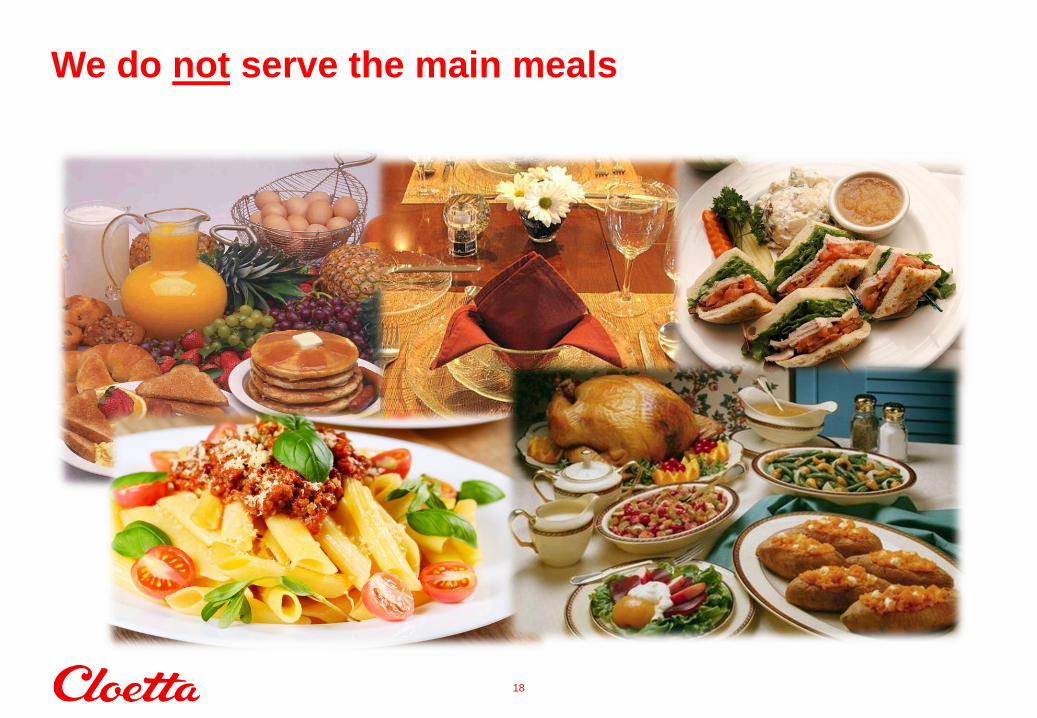
We do not serve the main meals
19
Munchy Moments is our territory!
20
• This presentation has been prepared by Cloetta AB (publ) (the “Company”) solely for use at this presentation and is furnished to
you solely for your information and may not be reproduced or redistributed, in whole or in part, to any other person. The
presentation does not constitute an invitation or offer to acquire, purchase or subscribe for securities. By attending the meeting
where this presentation is made, or by reading the presentation slides, you agree to be bound by the following limitations.
• This presentation is not for presentation or transmission into the United States or to any U.S. person, as that term is defined
under Regulation S promulgated under the Securities Act of 1933, as amended.
• This presentation contains various forward-looking statements that reflect management’s current views with respect to future
events and financial and operational performance. The words “believe,” “expect,” “anticipate,” “intend,” “may,” “plan,” “estimate,”
“should,” “could,” “aim,” “target,” “might,” or, in each case, their negative, or similar expressions identify certain of these forward-
looking statements. Others can be identified from the context in which the statements are made. These forward-looking
statements involve known and unknown risks, uncertainties and other factors, which are in some cases beyond the Company’s
control and may cause actual results or performance to differ materially from those expressed or implied from such forward-
looking statements. These risks include but are not limited to the Company’s ability to operate profitably, maintain its competitive
position, to promote and improve its reputation and the awareness of the brands in its portfolio, to successfully operate its
growth strategy and the impact of changes in pricing policies, political and regulatory developments in the markets in which the
Company operates, and other risks.
• The information and opinions contained in this document are provided as at the date of this presentation and are subject to
change without notice.
• No representation or warranty (expressed or implied) is made as to, and no reliance should be placed on, the fairness, accuracy
or completeness of the information contained herein. Accordingly, none of the Company, or any of its principal shareholders or
subsidiary undertakings or any of such person’s officers or employees accepts any liability whatsoever arising directly or
indirectly from the use of this document.
Disclaimer
Top Related