


![[SPARTITO] - Classica -Schubert-Schwanengesang (Il Canto Del Cigno)](https://static.fdocuments.net/doc/165x107/55cf94c8550346f57ba459e8/spartito-classica-schubert-schwanengesang-il-canto-del-cigno.jpg)


Languages
Pages
Legal


Rischi di progettoComplicazione e Complessità
Webinar - 26 Luglio 2016

Roberto Villa
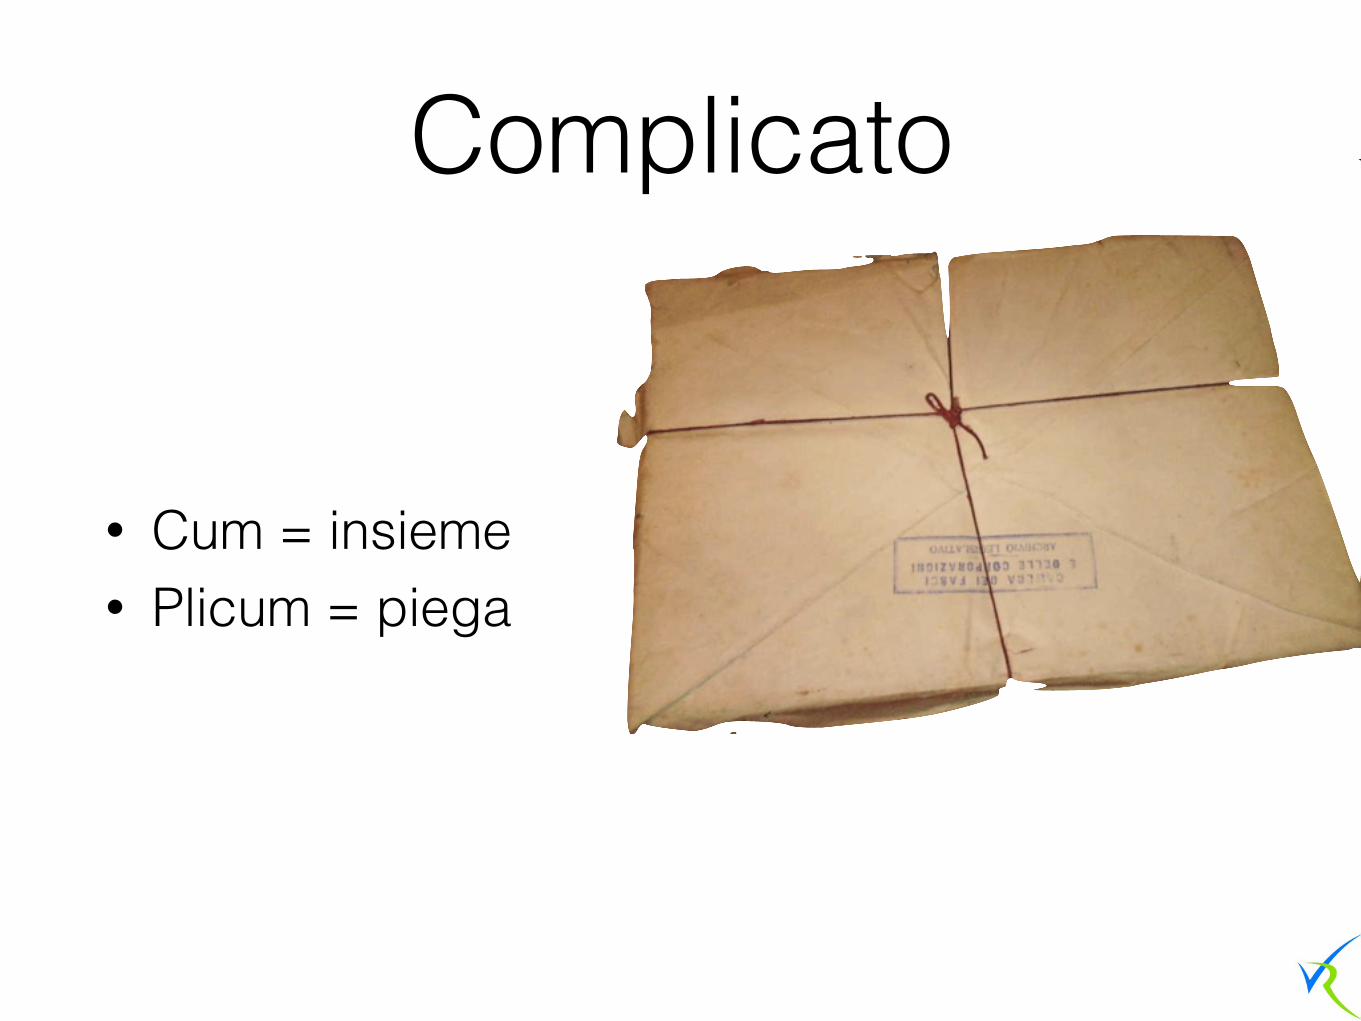
Complicato
• Cum = insieme • Plicum = piega

Complesso
• Cum = insieme • Plexum = nodo

Comprendere il sistema
• Complicato : raddrizzare le pieghe, spiegare • Complesso : guardare al tutto, alla sintesi

analitico
integrato


Gestire un progettoRiduzione, scomposizione Visione d’insieme, relazione+

comunque incerto
l’incertezza è un fatto della vita tutti siamo esperti di gestione del rischio
l’incertezza è un pericolo? l’incertezza è una sfida?

Il rischio nel progetto
è un evento futuro che ci può costare tempo e denaro

I progetti sono rischiosi perché
è nella loro natura (unico) lo si sceglie (chi non risica…)
il contesto è instabile (mercato, PESTLE, TECOP, VUCA)

Il compito della gestione dei rischi
ottimizzare le possibilità che il progetto abbia successo

ogni incertezza?
Rischio è l’incertezza che conta (David Hillson)
Il rischio è incertezza che, se si realizza, incide sul raggiungimento degli obiettivi

Qualche conferma• Effetto dell’incertezza sugli obiettivi (UNI ISO 31000)
• Il rischio è un evento o condizione incerta che, se si dovesse verificare, avrebbe un effetto positivo o negativo su uno o più obiettivi del progetto. (PMBoK® Guide)
• Uno o più eventi incerti che, qualora accadano, hanno un effetto sul raggiungimento di obiettivi. (OGC - M_o_R)

Che tipo di obiettivo?

In che modo incide?
• negativamente • fermare le cose che vanno male
• positivamente • aiutare le cose ad andare bene

Che tipo di incertezza?
• Il rischio è un evento o condizione incerta che, se si dovesse verificare, avrebbe un effetto positivo o negativo su uno o più obiettivi del progetto. (PMBoK® Guide 5ed)

Se il progetto è sia complicato che complesso anche i suoi rischi vanno visti da queste due prospettive
• PMBoK® Guide 5ed. • eventi • “condizioni” • “rischiosità” • “unknown unknowns”
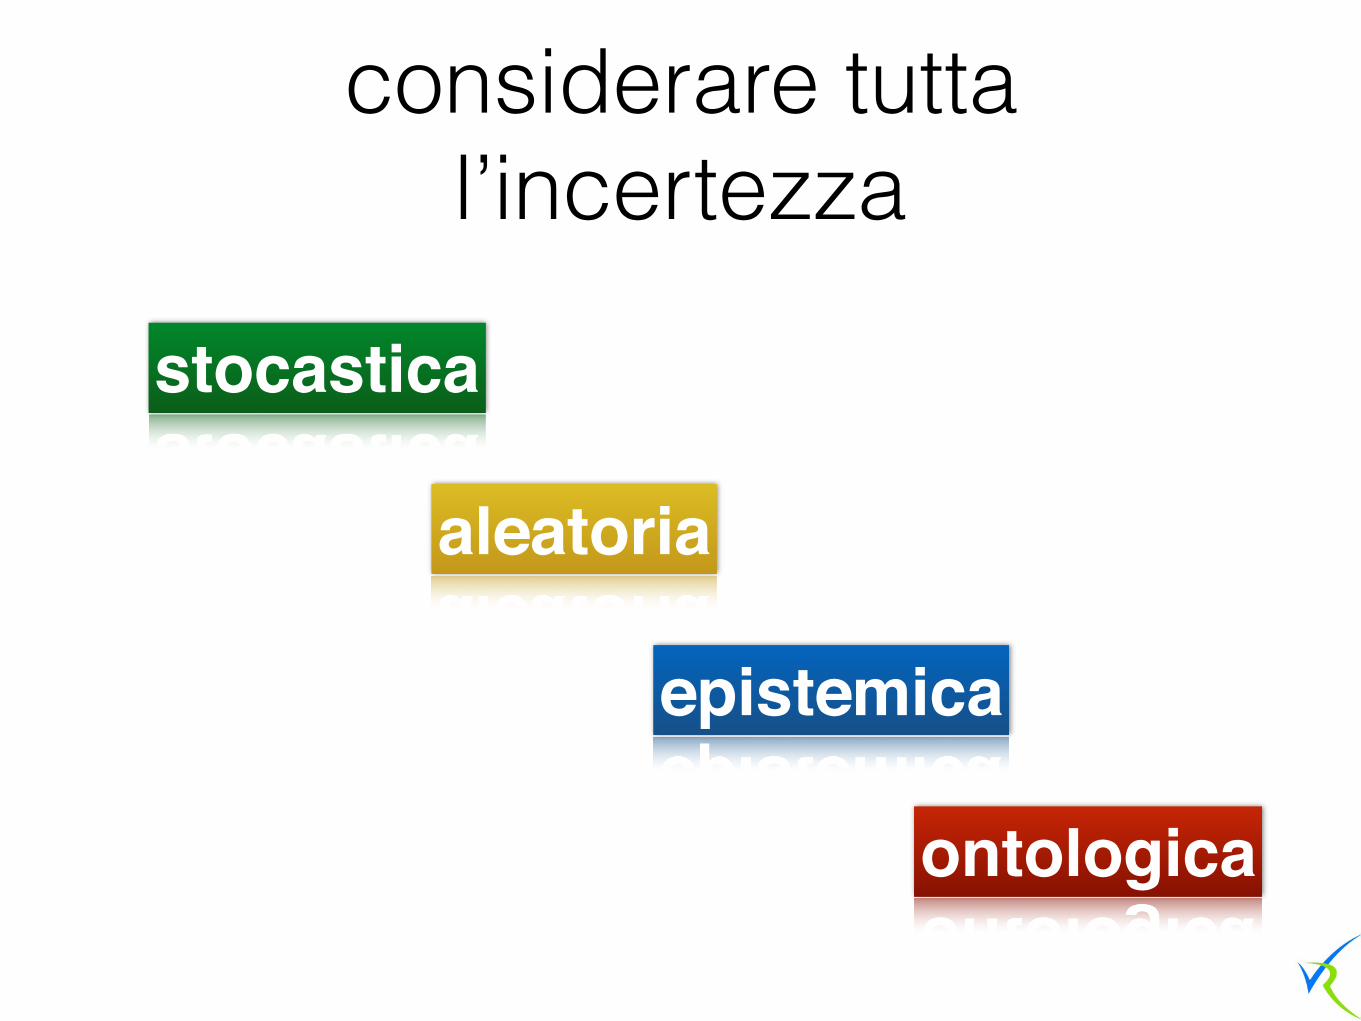
considerare tutta l’incertezza
stocastica
aleatoria
epistemica
ontologica

Stocastica
• possibili eventi futuri • singoli rischi • o succede o non succede

Sintassi del rischio
Obiettivo del progetto Causa del rischio • Genesi dell’incertezza
• Poiché…
Rischio • Problema di incertezza
• Sarebbe….
Conseguenza del rischio • Impatti sugli obiettivi del progetto
• Se questo accade, allora….

Risk Anatomy Diagram
262 Part III: Help with PRINCE2 Project Management
If you have a Project Office that provides administrative support (have a look at Chapter 12 for more on the Project Office), then that’s a good place to keep an organisational Risk Checklist. But other project staff mustn’t disown the checklist. If they see a new risk that may affect other projects, staff must ask the Project Office to add it to the list so that all projects consider it during plan-ning. Equally, if someone finds that a particular risk just can’t happen in the organisation any more, then he needs to ask the Project Office to remove that risk from the list. That way, the Risk Checklist is always up to date, relevant, and extremely useful, and only a small overhead is required to maintain it.
Identifying causes, events and effectsFor each risk it’s helpful to break it into three parts. Different approaches use different names for this but PRINCE2 uses:
✓ Cause
✓ Event (the risk itself)
✓ Effect
Although you can simply list these for each risk, another option is to use a diagram. Inspirandum’s ‘Project Techniques Toolbox’ suggests a notation with a triangle for a cause or trigger, a rectangle for the risk event and a circle for the effect, as shown in Figure 15-3. Diagrams like this can be particularly help-ful because you can readily see the interaction between the different elements. For example, a particular cause may trigger more than one risk. You can also show chain reactions in risks where the effect of one risk is actually a cause of another, and the effect of that sets off yet another risk. It gets really interesting when you start to consider not only the effect of each risk if it happens on its own, but also combined effects if more than one risk happens at the same time. If you’re working in a project with any significant amount of risk you need to move towards this sort of detail in your risk analysis.
Figure 15-3: The Risk Anatomy Diagram.
faulty
installa
tion
faultyparts
conveyor failurein new terminal
baggagedelay
21_710258-ch15.indd 26221_710258-ch15.indd 262 3/19/10 10:30 PM3/19/10 10:30 PM

Bowtie o diagramma farfalla88
4.20.1 Case Study – Risk Identifi cation – Truck Transportation – Bowtie Diagram
This case examines potential risks in transporting fruit and produce from California to New York, a 4,600 km trip, which takes an average of 3.5 days, and using refrigerated 16-m trailers. What is the event? The possibility of delays, which, in this business, is unacceptable.
Let us start by considering the sources, causes or scenarios than potentially can pose threats for complying trips schedules. Figure 4.6 shows at the left different scenarios and threats.
These threats involve weather conditions along the route that traverses the Rocky Mountains, as well as personnel failure, mechanical problems, accidents, etc., which if materialized most certainly will produce delays in delivering the merchan-dise (Top Event). Naturally, there could be more and different, but in this fi ctitious example we are assuming that after a detail examination, only these threats have been identifi ed, and with different degree of importance and probability.
While causes on the extreme left could provoke occurrence of the top event, the consequences on the extreme right show the effects of the impacts if, indeed, the top event occurs, and again, they have been selected by the analysts.
The second column of boxes on the left lists the possible prevention measures that can be taken to avoid occurrence or decrease the probability. For instance, there could be notice of heavy traffi c and signifi cant backup in one sector of the long route that can hamper on-time delivery, produced by work being done to repair the highway carpet along 17 km, and which can last at least a week. Thus, the preventive measure could consist of trying to bypass that section of the highway, choosing, if possible, an alternative route.
Assume, for instance, that the warehouse in California learns through a meteoro-logical service bulletin that the forecast warns of heavy snowfall for the next two days in the Rockies, and that traffi c delays are foreseen of at least 12 h. Thus, one
Mitigationactions(barriers)
Potentialcauses
PotentialoutcomesPrevention
actions(barriers)
Fault tree Event tree
Cause 1
Cause 2
Cause 3
Cause 4
Cause 5
Consequence B
Consequence C
Cause 1
Cause 2
Cause 3
Cause 4
Cause 5Consequence D
Consequence B
Consequence C
Consequence D
Event
Consequence A
Fig. 4.5 Bowtie or butterfl y diagram
4 Risk Identifi cation

Tassonomia
• una classificazione strutturata • si concentra su individuare caratteristiche
comuni per creare una struttura che permetta di migliorare la comprensione di un’area

PESTLE
• Political • Economic • Sociological • Technological • Legal • Environmental

Tassonomia• IEEE-SEI Tech ITO Risk
• General IT Security Risks • Confidentiality Risks • Integrity Risks • Availability Risks
• Performance Risks • Accountability Risks • Reliability Risks • Maintainability Risks • Regulatory Risks

Risposta
il processo standard di Risk Management
identificare analizzare (matrice P/I) organizzare (strategie)
rispondere

Aleatoria
• situazioni con una gamma di possibili accadimenti
• qualcosa succede, ma non si sa come

Sensitività
0.8 0.9 1 1.1 1.2
200
210
220
230
240
190
180
170
160
MaterialiManodoperaTrasportiAttrezzature
Fattore di deviazione
Costo

PERTDurata Attesa = (P+4M+O)/6

Risposta
Analisi quantitativa per definire il range dei valori possibili
Condizionare il range (preventivo) Aspettarsi una variabilità (contingency)

Epistemica
• ambiguità • vaghezza • “so di non sapere”

Dire “non lo so”
c’è una forte difficoltà, anche a livello sociale, a dire “non lo so” ed agire di
conseguenza
errore come forma di avvicinamento al bersaglio
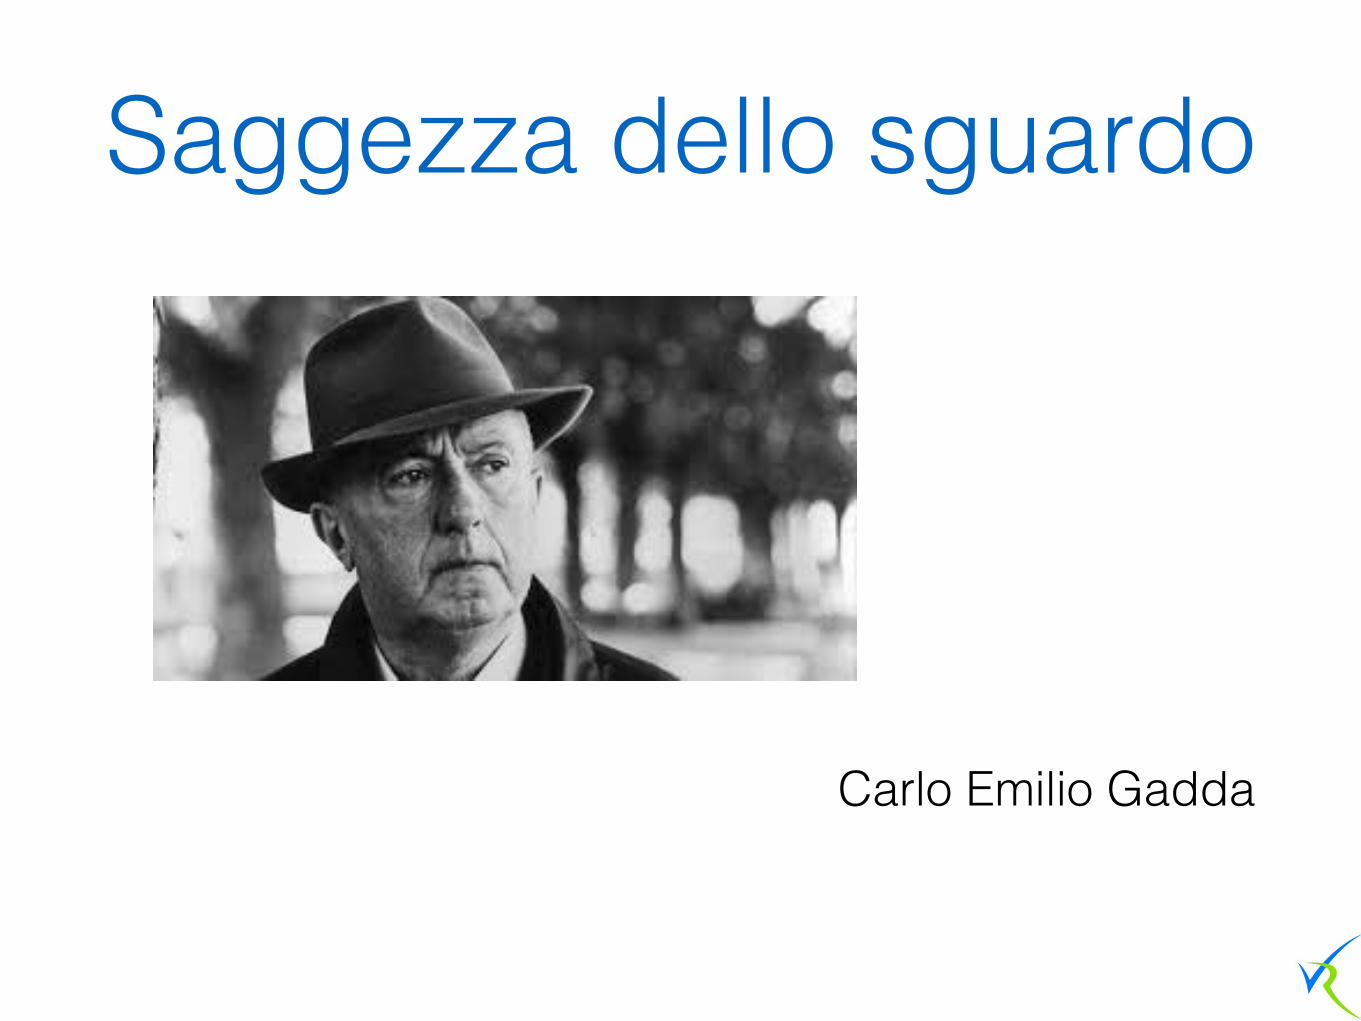
Saggezza dello sguardo
Carlo Emilio Gadda

Apprendimento
In periodi di cambiamento (Progetto) la terra sarà di coloro che apprendono, mentre coloro che sanno si troveranno ben equipaggiati per
vivere in un mondo che non esiste più. Eric Hoffer

Risposta
ascolto osservazione
apprendimento

Ontologica
• le emergenze
• Il cigno nero - Giovenale (Nassim Taleb)

Territori
Mediocristan
Estremistan

Principi di RM• crea valore e lo preserva • si integra nei processi organizzativi • corrobora le decisioni • si focalizza sull’incertezza • è sistematica, strutturata, tempestiva • si basa su quanto di meglio è a disposizione • va adattata alla specifica realtà • considera i fattori umani e culturali • è trasparente e aperta • è dinamica, iterativa e reattiva • migliora continuamente

ordine, disordine e…
• un sistema ha condizioni stabili (equilibrio stabile)
• un sistema ha condizioni irregolari (caos) • un sistema è attratto da alcuni set di
condizioni (equilibrio instabile)
orlo del caos

Fattori• incognite
scientifiche • perdita dei margini
di sicurezza • cicli di feedback
positivi • vulnerabilità
variabile • conflitti di interesse • dinamiche sociali
• salti tecnologici • complicazioni legate
al tempo • comunicazione
inadeguata • informazioni
sbilanciate • incentivi perversi • comportamenti
maliziosi

L’orlo del caos

EVM
CPI
PJ1
PJ3
PJ4
1PJ2PJ5

Risposta
• continuity management • resilienza • scrutare costantemente alla ricerca di segnali
• modelli, simulazioni • flessibilità, adattamento, ridondanza

avere una chiara idea dei rischi produce una efficace gestione dei rischi
• focalizzare gli obiettivi - tutti • gestire minacce e opportunità • considerare ognuno dei 4 tipi di incertezza

Sono debitore a
• Francesco Varanini • Alberto De Toni • David Hillson • Chris Chapman e Stephen Ward


ogni cosa riguardo al futuro è incerta… …probabilmente
Top Related