


Languages
Pages
Legal


REX Line Service Evaluation Study
REX Line Service Evaluation TOC -1 Final Recommendations
Table of Contents Page 1. Introduction ..................................................................................................................... 1 2. Service Recommendations .............................................................................................. 1
A. Extend Service on Fort Belvoir to New Post Exchange/Commissary Complex ......... 1 B. Improve Service Frequencies on Sunday from Current 60 Minutes to 30 Minutes ............. 8 C. Evaluate Scheduled Run Time - Adjust as Necessary ................................................13 D. Add Trips to Meet Hours of Service Criteria ..............................................................14 E. Implement Dedicated Supervision ............................................................................17 F. REX Branding ..............................................................................................................18
3. Passenger Facility Recommendations .............................................................................24 4. Traffic and Running Way Improvements .........................................................................28 Appendix 1 New Rider Calculations – Sunday Headway Improvement ...........................38 Appendix 2 Calculation of Layover as Percentage of Total Revenue Run Time ...............35 Appendix 3 Actual vs. Scheduled Run Time Comparison..................................................47 Appendix 4 Headway Separation Analysis ........................................................................56
List of Tables
Table 1 Estimated Cost of Adding a Bus into Service to Maintain Current
Headways after Route Extension ......................................................................... 4 Table 2 Evaluation Measure – REX Line Extension – Additional Bus In Service ............... 4 Table 3 REX Line Weekday Bus Requirements by Time of Day ........................................ 5 Table 4 Load and Crowding Impacts of Potential REX Line Headway Widening
to Accommodate Service Extension .................................................................... 7 Table 5 Estimated Operating Cost – Improved Sunday Service Frequency ..................... 9 Table 6 Evaluation Measures – Improved Service Frequency on Sundays ...................... 9 Table 7 REX Line Boardings/Alightings North of the Huntington Metrorail Station ........10 Table 8 Sunday Transfers Between the REX Line and Metrorail ......................................11 Table 9 Sunday Transfers from REX to Other Bus Lines and From Other Bus Lines
to REX ...................................................................................................................12 Table 10 REX Line Boardings/Alightings On Fort Belvoir ....................................................13 Table11 Priority Corridor Network Hours-Of-Service Standards ......................................14 Table 12 Estimated Cost – Add Trips to Meet Hours-of-Service Standards .......................15 Table 13 Estimated Ridership – New Trips (based on ridership patterns on current
last trips of the day) .............................................................................................16 Table 14 Evaluation Measures – Add Trips to Meet Hours of Service Standards ..............16 Table 15 Dedicated Supervision – Cost Estimate ...............................................................18 Table 16 REX Line Boardings and Alightings North of Huntington .....................................19

REX Line Service Evaluation Study
REX Line Service Evaluation TOC -2 Final Recommendations
Table 17 REX Transfers to Other Bus Routes North of Huntington ....................................21 Table 18 Transfers from Other Bus Routes North of Huntington to the REX Line .............22 Table 19 REX Transfers to and From Metrorail at Stations North of Huntington ..............23 Table 20 Bus Stop Amenity Capital Cost Requirements .....................................................25 Table 21 REX Line Stops Missing an ADA Bus Stop Pad ......................................................26 Table 22 Rex Line Stops Missing Sidewalk Accessibility .....................................................26 Table 23 REX Route Stops Missing Information Cases that Require
Immediate (Short-Term) Installation ...................................................................26 Table 24 REX Route Stops Missing Information Cases that Require
Future (Long-term) Installation ...........................................................................27 Table 25 REX Route Candidates for the Installation of a Trash Receptacle .......................27 Table 26 REX Route Candidates for the Installation of a Bench and/or Shelter ................28 Table 27 REX Line Candidates for the Installation of a Real Time Bus Arrival
Information Sign .....................................................................................................28
List of Figures
Figure 1 Proposed REX Line Extension to the Fort Belvoir Post Exchange ................................... 2
REX Line Service Evaluation Study
REX Line Service Evaluation 1 Final Recommendations
1. Introduction
Outlined in this document are the proposed final service and physical improvement recommendations for the REX Line Service Evaluation Study. The source of these recommendations is the Project’s “Transit Service Assessment”, the project’s “Traffic Operations Assessment”, ridership and bus stop analyses, driver interviews, public input, and extensive coordination with the project’s Project Management Team (PMT). This document includes recommendations related to the REX Line’s service structure, passenger facilities, and corridor running way and traffic signals. The recommendations in this document represent a set of final recommendations developed based on detailed coordination with the project PMT as well as feedback from the passenger survey. The remainder of this document is focused on a description of the final recommendations. Included as part of the recommendations is backup data to provide an understanding of the estimated cost and ridership impacts associated with each recommendation. In addition, a proposed time frame for implementation is provided, with short-term implementation to occur in 1-2 years, mid-range implementation to occur in 3-4 years, and long range implementation to occur in 5-6 years. 2. Service Recommendations
A. Extend Service on Fort Belvoir to New Post Exchange/Commissary Complex (proposed implementation in the short-term time frame)
1. Final Recommendation – This recommendation is to extend the REX line routing beyond its
current terminal point at the Jackson Loop on Fort Belvoir to a new terminal at the Fort Belvoir Post Exchange (PX)/Commissary complex located off of John J Kingman Road, east of Gunston Road. The extension is shown in Figure 1. This extension would be approximately 1.7 miles in length and would add approximately 4 minutes to each one-way trip. Three scenarios for accommodating the extra travel time associated with this extension are evaluated below. The scenarios evaluated include:
a. Accommodate the extension within existing cycle time/recovery time; b. Add a bus into service, where required, to cover the additional run time while
maintaining current headways; c. Widen headways such that the additional run time can be accommodated within
the existing operating cost structure.
Metrobus planners, in conjunction with Fairfax County and the City of Alexandria, will make the final decision on how best to implement the extension based on the analysis outlined below, available financial resources, and potential trade-offs between the benefits of the extension compared to the potential need to widen headways.

REX Line Service Evaluation Study
REX Line Service Evaluation 2 Final Recommendations
Figure 1 – Proposed REX Line Extension to the Fort Belvoir Post Exchange

REX Line Service Evaluation Study
REX Line Service Evaluation 3 Final Recommendations
The detailed evaluation of each of these scenarios is outlined below.
a. Accommodate Extension within the Existing Cycle Time/Recovery Time – The
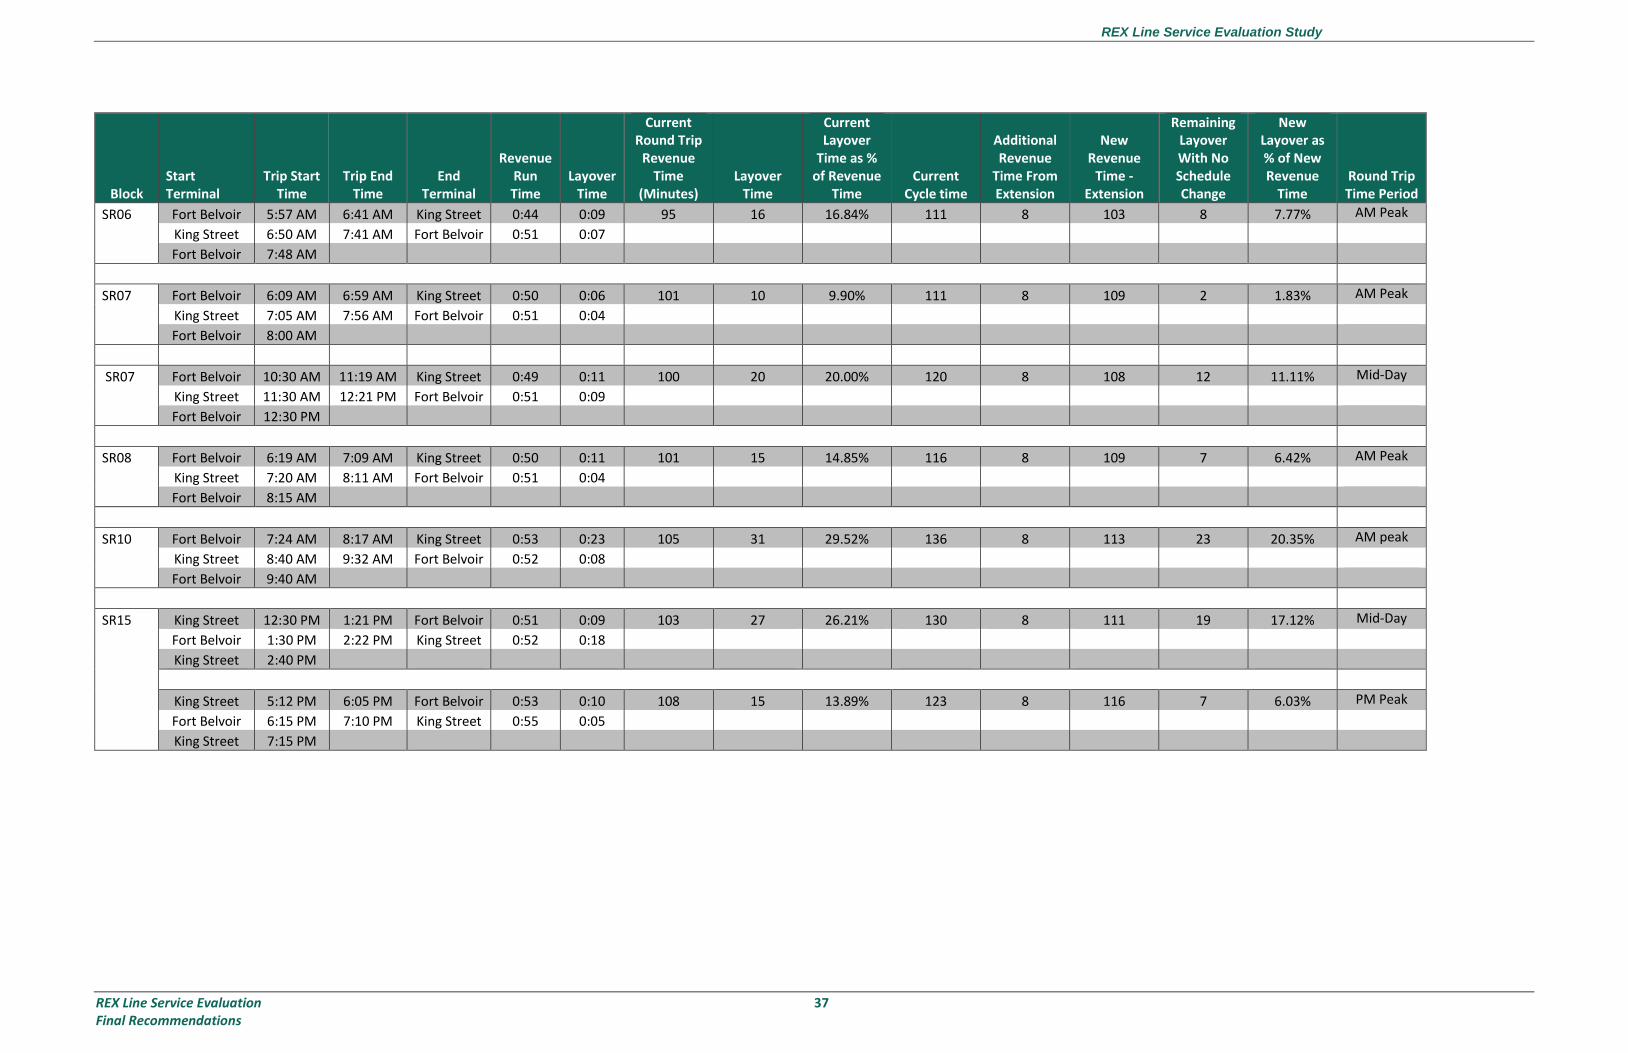
evaluation framework for this scenario is an assessment of the percent of total cycle time that is dedicated to layover and recovery time, based on the current schedule and headway sheets. The concept here is that if there is excess recovery time available within the existing total cycle time, some of that excess time can be dedicated to accommodating the added run time resulting from the route extension. Data on recovery time percentages by day of week is presented in Appendix 2. The most relevant column in the Appendix tables is the column labeled “New Layover as % of New Revenue Time” on the right side of the Table. This column shows the percent of round trip revenue run time that would be available for recovery time after the extension run time is added to the new revenue trip time (4 minutes is added to each one way trip, or 8 minutes for a round trip). The framework for assessing whether there will be sufficient recovery time remaining after the extension run time is added is the rule-of-thumb requirement that a minimum of 10% of revenue run time is required for recovery in order to ensure on-time performance and reliable service. The results by day of week are summarized below. Weekday – The weekday data in Appendix 2 shows that there are a number of instances throughout the day where the recovery time as a percent of round trip revenue run time falls below the rule-of-thumb required minimum of 10% after the additional extension-related run time is added to the current run time. This means that on weekdays there is not sufficient excess recovery time to accommodate the increase in run time associated with the extension. Therefore, one of the other scenarios noted above, addition of another bus into service, or widening weekday headways, will be necessary in order to accommodate the additional run time associated with a REX Line extension on weekdays. Saturday – The Saturday data in Appendix 2 shows that in only one instance does the recovery time as a percent of round-trip revenue run time fall below the rule-of-thumb required 10% minimum, after the additional extension-related run time is added to the current run time. This data indicates that the current scheduled recovery time can easily accommodate the additional extension-related run time while continuing to provide adequate recovery time. Sunday – The Sunday data in Appendix 2 shows that there are two instances where the recovery time as a percent of revenue run times fall below the rule-of-thumb required minimum of 10%, after the additional extension-related run time is added to the current run time (in both instances the percentage is only slightly below 10%). This data indicates that the current scheduled recovery time can easily accommodate the additional extension-related run time while continuing to provide adequate recovery time.
b. Add Vehicle to Service in Order to Maintain Current Headways – Based on the analysis outlined above, this scenario would only be applicable to weekdays, where current recovery time would not be sufficient to accommodate the additional run time

REX Line Service Evaluation Study
REX Line Service Evaluation 4 Final Recommendations
associated with an extension. In this instance, an additional bus would be added into service to accommodate the additional extension-related run time while maintaining the existing headway. The cost of this additional bus is outlined below. The cost estimate assumes that an additional bus in service would be required for the entire length of service on weekdays given the results of the analysis outlined in Appendix 2. The cost estimate is outlined below in Table 1. The fare recovery portion of the cost estimate in Table 1 is based on an increase in ridership of 176 riders per day due to the extension. This estimate is based on current boardings per trip on Fort Belvoir and an estimated percentage increase of 50% of these boardings per trip due to the extension. This estimate may be conservative given the potential activity at the PX/Commissary but in lieu of detailed activity data at the PX, it was felt this conservative estimate was best suited to the analysis. WMATA will closely monitor boardings on the extension to see if service modifications will be required.
Table 1 - Estimated Cost of Adding a Bus into Service to Maintain Current Headways after Route Extension
# of Additional Buses Required
for Extension
Hours of Weekday
Daily Service
Additional Revenue
Hours
Platform Hour
Factor
Additional Platform
Hours
Cost Per Platform
Hour
Daily Cost of
Extension
Annual Cost of
Extension (250
weekdays)
Weekday - All Day 1 19 19 1.1 20.9 $118.00 $2,466.20 $616,550
Total Estimated Cost $2,466.20 $616,550
Estimated Fare Recovery - New Riders $228.80 $57,200
Net Cost after Fare Recovery
$2,237.40 $559,350
Cost after Regional Subsidy (assumed regional subsidy covers 20% of net cost) $1,789.92 $447,480
Provided below in Table 2 are a series of evaluation measures that will allow a comparison of this recommendation against other service improvement recommendations contained in this document.
Table 2 - Evaluation Measures – REX Line Extension – Additional Bus In Service
Evaluation Factor Value
Cost per Existing Impacted Rider
$7.01
Cost per Existing Impacted Rider - Net Cost after Fare Recovery $6.36
Cost per Existing Impacted Rider - Net Cost with Regional Subsidy
$5.09
Cost per New Rider - Total Cost $14.01
Cost per New Rider - Net Cost after Fare Recovery
$12.71
Cost per New Rider - Net Cost with Regional Subsidy $10.17

REX Line Service Evaluation Study
REX Line Service Evaluation 5 Final Recommendations
c. Widen Headways and Accommodate Additional Run Time Within the Existing
Operating Cost Structure – Table 3 below shows the number of buses in service during each hour of the day between the start of service at 5:00 AM and the end of the PM peak based on the REX Line Headway sheets. The table also contains information on average headways during each hour and in each direction. This table provides the framework for understanding the number of buses required to meet service during different periods of the day under existing run times. Of specific note is the AM peak pull-out of 10 buses and PM peak pull-out of 12 buses.
Table 3 - REX Line Weekday Bus Requirements by Time of Day
Time Period #of Buses in Service Northbound Average Headway
Southbound Average Headway
5 AM –6 AM 6 12 30 6AM – 7AM 9 12 15 7AM – 8AM 10 12 15 8AM – 9AM 10 15 20
9AM – 10AM 6 20 30 10AM -11AM 6 30 30 11AM – 12PM 4 30 30 12PM – 1PM 5 30 30 1PM – 2PM 7 30 20 2PM – 3PM 7 20 20 3PM – 4PM 8 15 15 4PM – 5PM 10 15 12 5PM – 6PM 12 15 12 6PM – 7PM 12 15 15
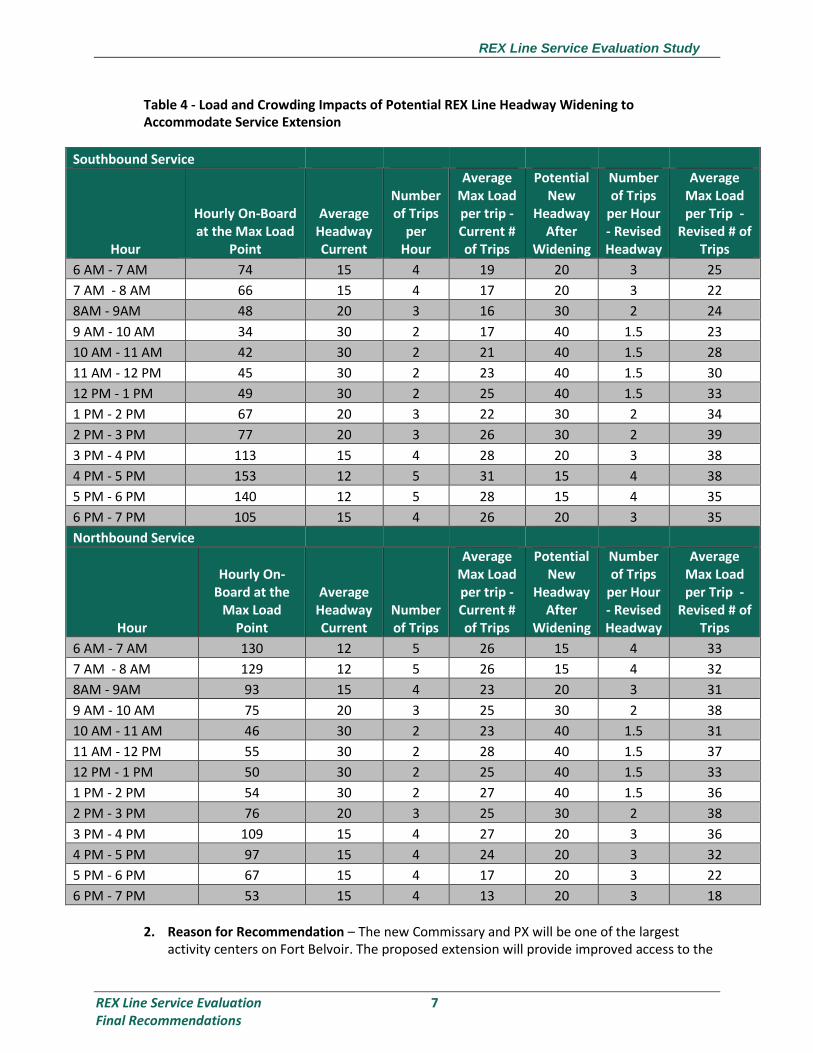
The minimum headway that can be achieved while maintaining the existing number of buses in service (and thus also maintaining the existing cost structure) will ultimately depend on how the Metrobus Scheduling Department builds the new REX Line schedules, including how much recovery time is provided (the provision of recovery time in the schedule must also consider the variability of the security procedures for REX Line buses entering Fort Belvoir at the Pence Gate. Based on an assessment of time to get through the gate based on new security procedures, the average time to pass through security is about four minutes but this can be very variable based on unanticipated issues. Schedule adherence and changes in security gate operations will be monitored and if security procedure times increase, or there is greater variability in procedure time, more recovery time to account for this variability and increased procedure times may be required). Outlined below in Table 4 is an assessment of the potential crowding implications of widening the REX Line headway to accommodate the added service-extension related run time. The data presented in the Table is based on the most conservative assumptions regarding the required headway widening associated with the additional run time. Therefore the potential loading impacts shown in the table may not arise if the Schedules Department can maintain current headways during some parts of the day when building a new schedule. It should be noted that the data in the table show that in no instance does widening headways result in excessive

REX Line Service Evaluation Study
REX Line Service Evaluation 6 Final Recommendations
crowding in either direction, even under the most conservative assumptions regarding required headway widening. Based on the data contained in Appendix 2 it appears that maintaining the same number of buses in service during the AM and PM peak periods would result in a headway widening from the current 12 minutes to no greater than 14 minutes. Further, it appears that required widened headway in the mid-day would be no more than 35 minutes (from the current 30 minutes). Again, the ultimate required headway modifications would depend on the work of the Scheduling Department.
REX Line Service Evaluation Study
REX Line Service Evaluation 7 Final Recommendations
Table 4 - Load and Crowding Impacts of Potential REX Line Headway Widening to Accommodate Service Extension
Southbound Service
Hour
Hourly On-Board at the Max Load
Point
Average Headway Current
Number of Trips
per Hour
Average Max Load per trip - Current # of Trips
Potential New
Headway After
Widening
Number of Trips
per Hour - Revised Headway
Average Max Load per Trip -
Revised # of Trips
6 AM - 7 AM 74 15 4 19 20 3 25
7 AM - 8 AM 66 15 4 17 20 3 22
8AM - 9AM 48 20 3 16 30 2 24
9 AM - 10 AM 34 30 2 17 40 1.5 23
10 AM - 11 AM 42 30 2 21 40 1.5 28
11 AM - 12 PM 45 30 2 23 40 1.5 30
12 PM - 1 PM 49 30 2 25 40 1.5 33
1 PM - 2 PM 67 20 3 22 30 2 34
2 PM - 3 PM 77 20 3 26 30 2 39
3 PM - 4 PM 113 15 4 28 20 3 38
4 PM - 5 PM 153 12 5 31 15 4 38
5 PM - 6 PM 140 12 5 28 15 4 35
6 PM - 7 PM 105 15 4 26 20 3 35
Northbound Service
Hour
Hourly On-Board at the
Max Load Point
Average Headway Current
Number of Trips
Average Max Load per trip - Current # of Trips
Potential New
Headway After
Widening
Number of Trips
per Hour - Revised Headway
Average Max Load per Trip -
Revised # of Trips
6 AM - 7 AM 130 12 5 26 15 4 33
7 AM - 8 AM 129 12 5 26 15 4 32
8AM - 9AM 93 15 4 23 20 3 31
9 AM - 10 AM 75 20 3 25 30 2 38
10 AM - 11 AM 46 30 2 23 40 1.5 31
11 AM - 12 PM 55 30 2 28 40 1.5 37
12 PM - 1 PM 50 30 2 25 40 1.5 33
1 PM - 2 PM 54 30 2 27 40 1.5 36
2 PM - 3 PM 76 20 3 25 30 2 38
3 PM - 4 PM 109 15 4 27 20 3 36
4 PM - 5 PM 97 15 4 24 20 3 32
5 PM - 6 PM 67 15 4 17 20 3 22
6 PM - 7 PM 53 15 4 13 20 3 18
2. Reason for Recommendation – The new Commissary and PX will be one of the largest
activity centers on Fort Belvoir. The proposed extension will provide improved access to the
REX Line Service Evaluation Study
REX Line Service Evaluation 8 Final Recommendations
facility for workers on the base on and will also support the overall base redevelopment efforts.
B. Improve Service Frequencies on Sunday from Current 60 Minutes to 30 Minutes (proposed
implementation in the short-term time frame)
1. Final Recommendation – This recommendation is to improve service frequencies on Sundays from the current 60 minutes to 30 minutes.
2. Reasons for Recommendation – There are two primary reasons for this proposed service
improvement. The first is that the current Sunday 60 minute headway does not meet the WMATA service standard for a Priority Corridor Network Line, which is 30 minutes on Sunday. The second is that this service improvement was one of the most requested in the passenger survey completed as part of this study. The estimated daily Sunday ridership increase due to this improvement is 95 riders (more detail on how this was estimated is provided in Appendix 1). It should be noted the primary driver of this recommendation is to improve service to meet Priority Corridor service standards, not to increase ridership.
3. Recommendation Cost Estimate – The estimated cost of this recommendation is outlined
below in Table 5. Table 5 includes the additional operating cost of the recommendation, the net cost after fares are accounted for, and the cost after estimated regional subsidies are accounted for. Since this service improvement will occur on Sunday, no additional vehicles in the REX fleet will be required.

REX Line Service Evaluation Study
REX Line Service Evaluation 9 Final Recommendations
Table 5 Estimated Operating Cost – Improved Sunday Service Frequency Additional Vehicle Requirement Calculations
Revenue Round Trip Run Time
Recovery (10% of
Revenue Run Time)
Round Trip Cycle Time Headway
Vehicle Requirement - Calculated
Vehicle Requirement
- Rounded
Current Service 94 9 103 60 1.7 2
Future Service 94 9 103 30 3.4 4
Additional Buses in Service 2
Cost Calculation
Additional Buses in Service
Hours of Service
Total Revenue
Hours per Day
Platform Hour
Factor
Total Platform
Hours
Cost per Platform
Hour
Total Daily Cost
Annual Cost (57 Sundays)
2 16 32 1.1 35.2 $118.89 $4,185 $238,541
Estimated Fare Recovery - New Riders* $123 $7,004
Net Cost after Fare Recovery $4,062 $231,536
Cost after Regional Subsidy (assumed regional subsidy covers 20% of net cost) $3,250 $185,229
*Calculated as estimated new riders * average fare of $1.30
4. Cost Effectiveness and Productivity Evaluation Measures – Provided in this section are a series of evaluation measures (see Table 6) that will allow a comparison of the different recommendations contained in this document. It should also be noted that some of these evaluation factors depend on the calculation of new riders associated with the proposed improvements in service frequencies.
Table 6 - Evaluation Measures – Improved Service Frequency on Sundays
Evaluation Factor Value
Cost per Existing Impacted Rider $4.66
Cost per Existing Impacted Rider - Net Cost after Fare Recovery $4.52
Cost per Existing Impacted Rider - Net Cost with Regional Subsidy $3.62
Cost per New Rider - Total Cost
$44.27
Cost per New Rider - Net Cost after Fare Recovery $42.97
Cost per New Rider - Net Cost with Regional Subsidy $34.38
5. Additional Considerations – Some members of the Project Management Team questioned
the need for this recommendation because of quite frequent alternative Sunday service in the Richmond Highway corridor. The Fairfax Connector 171 is a local service that runs between the Lorton VRE Station and the Huntington Metrorail Station. It mirrors the routing of the REX Line between the Pence Gate entrance to Fort Belvoir and the Huntington Metrorail Station and runs every 30 minutes throughout the day on Sunday. The combined
REX Line Service Evaluation Study
REX Line Service Evaluation 10 Final Recommendations
headway of the REX Line and 171 services is 20 minutes along the common portion of the line. In addition, the 171 service does provide access to Metrorail at the Huntington Metrorail Station.
The key questions regarding implementation of this recommendation relate to the portions of the corridor that are not served by the Fairfax Connector 171 and therefore would still be left with 60 minute service frequencies. These areas include Fort Belvoir and the area north of the Huntington Metrorail Station, between the Huntington Station and the King Street/Old Town Metrorail Station.
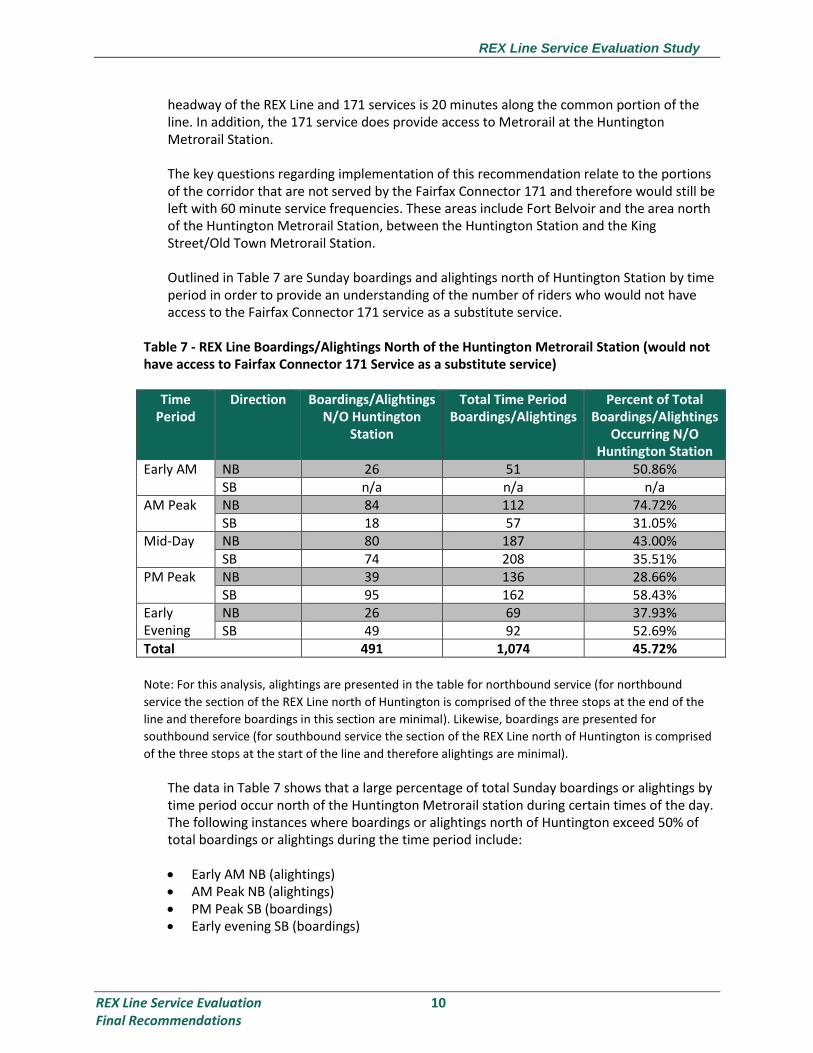
Outlined in Table 7 are Sunday boardings and alightings north of Huntington Station by time period in order to provide an understanding of the number of riders who would not have access to the Fairfax Connector 171 service as a substitute service.
Table 7 - REX Line Boardings/Alightings North of the Huntington Metrorail Station (would not have access to Fairfax Connector 171 Service as a substitute service)
Time Period
Direction Boardings/Alightings N/O Huntington
Station
Total Time Period Boardings/Alightings
Percent of Total Boardings/Alightings
Occurring N/O Huntington Station
Early AM NB 26 51 50.86% SB n/a n/a n/a
AM Peak NB 84 112 74.72% SB 18 57 31.05%
Mid-Day NB 80 187 43.00% SB 74 208 35.51%
PM Peak NB 39 136 28.66% SB 95 162 58.43%
Early Evening
NB 26 69 37.93% SB 49 92 52.69%
Total 491 1,074 45.72% Note: For this analysis, alightings are presented in the table for northbound service (for northbound
service the section of the REX Line north of Huntington is comprised of the three stops at the end of the
line and therefore boardings in this section are minimal). Likewise, boardings are presented for
southbound service (for southbound service the section of the REX Line north of Huntington is comprised
of the three stops at the start of the line and therefore alightings are minimal).
The data in Table 7 shows that a large percentage of total Sunday boardings or alightings by time period occur north of the Huntington Metrorail station during certain times of the day. The following instances where boardings or alightings north of Huntington exceed 50% of total boardings or alightings during the time period include:
Early AM NB (alightings) AM Peak NB (alightings) PM Peak SB (boardings) Early evening SB (boardings)
REX Line Service Evaluation Study
REX Line Service Evaluation 11 Final Recommendations
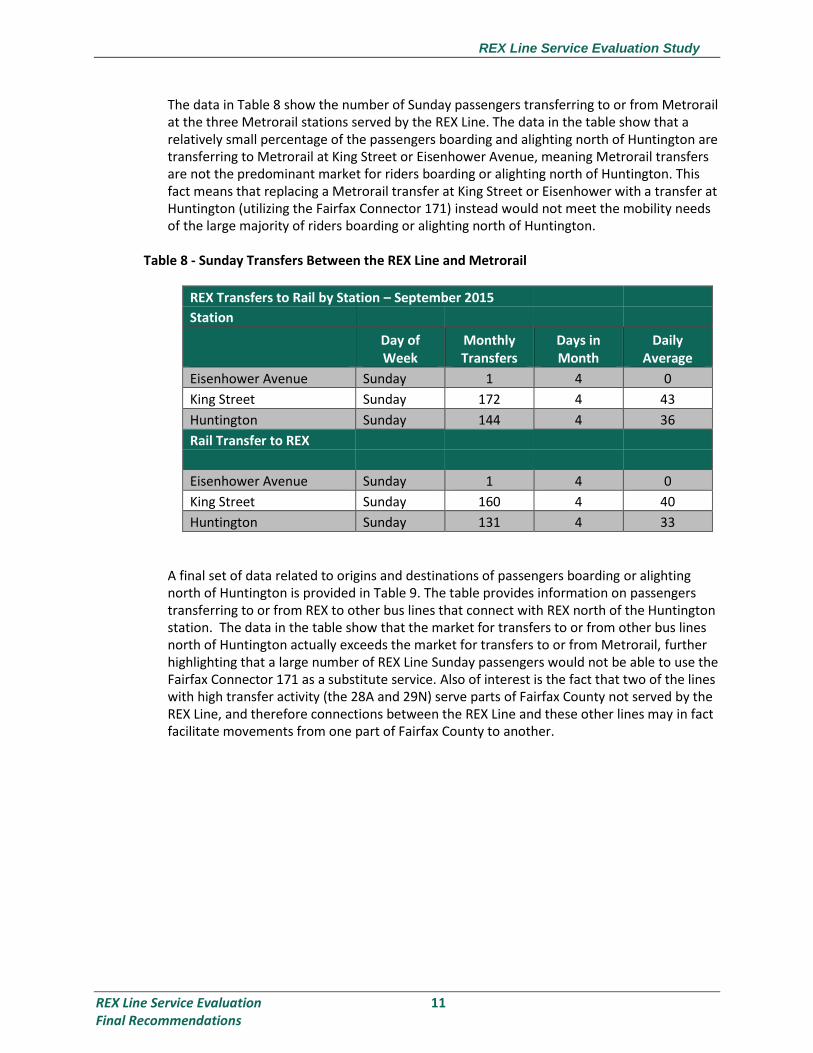
The data in Table 8 show the number of Sunday passengers transferring to or from Metrorail at the three Metrorail stations served by the REX Line. The data in the table show that a relatively small percentage of the passengers boarding and alighting north of Huntington are transferring to Metrorail at King Street or Eisenhower Avenue, meaning Metrorail transfers are not the predominant market for riders boarding or alighting north of Huntington. This fact means that replacing a Metrorail transfer at King Street or Eisenhower with a transfer at Huntington (utilizing the Fairfax Connector 171) instead would not meet the mobility needs of the large majority of riders boarding or alighting north of Huntington.
Table 8 - Sunday Transfers Between the REX Line and Metrorail
REX Transfers to Rail by Station – September 2015
Station
Day of Week
Monthly Transfers
Days in Month
Daily Average
Eisenhower Avenue Sunday 1 4 0
King Street Sunday 172 4 43
Huntington Sunday 144 4 36
Rail Transfer to REX
Eisenhower Avenue Sunday 1 4 0
King Street Sunday 160 4 40
Huntington Sunday 131 4 33
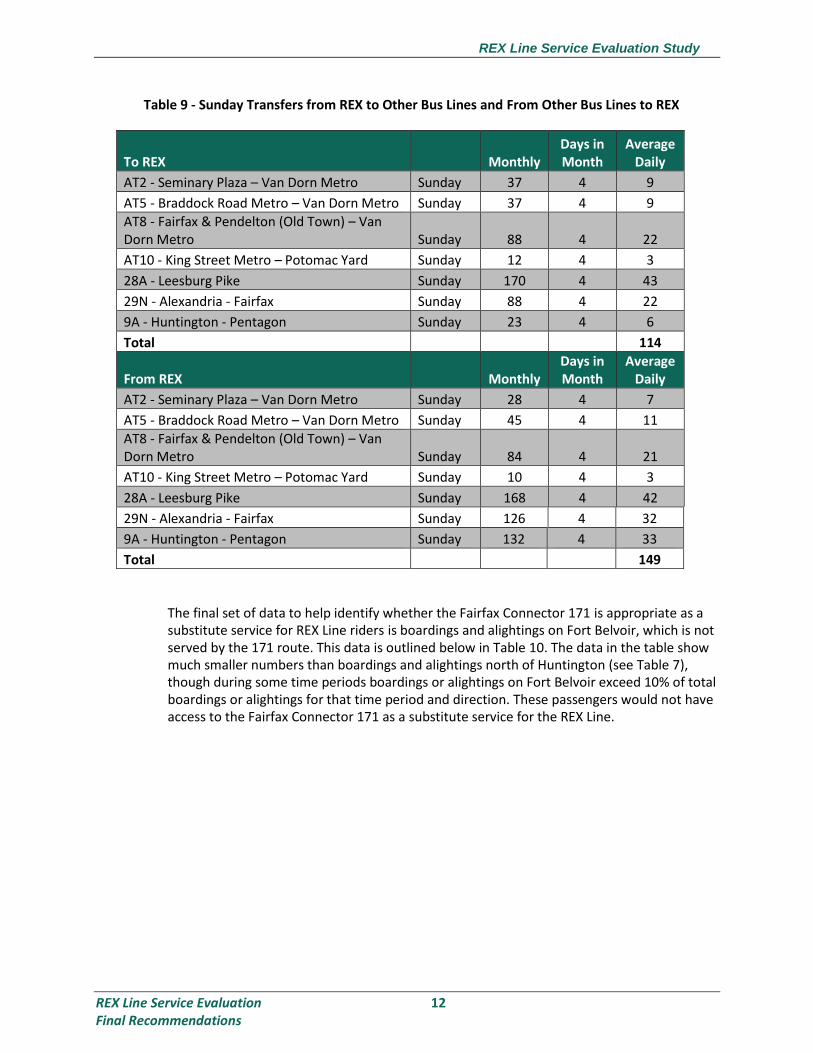
A final set of data related to origins and destinations of passengers boarding or alighting north of Huntington is provided in Table 9. The table provides information on passengers transferring to or from REX to other bus lines that connect with REX north of the Huntington station. The data in the table show that the market for transfers to or from other bus lines north of Huntington actually exceeds the market for transfers to or from Metrorail, further highlighting that a large number of REX Line Sunday passengers would not be able to use the Fairfax Connector 171 as a substitute service. Also of interest is the fact that two of the lines with high transfer activity (the 28A and 29N) serve parts of Fairfax County not served by the REX Line, and therefore connections between the REX Line and these other lines may in fact facilitate movements from one part of Fairfax County to another.
REX Line Service Evaluation Study
REX Line Service Evaluation 12 Final Recommendations
Table 9 - Sunday Transfers from REX to Other Bus Lines and From Other Bus Lines to REX
To REX Monthly Days in Month
Average Daily
AT2 - Seminary Plaza – Van Dorn Metro Sunday 37 4 9
AT5 - Braddock Road Metro – Van Dorn Metro Sunday 37 4 9
AT8 - Fairfax & Pendelton (Old Town) – Van Dorn Metro Sunday 88 4 22
AT10 - King Street Metro – Potomac Yard Sunday 12 4 3
28A - Leesburg Pike Sunday 170 4 43
29N - Alexandria - Fairfax Sunday 88 4 22
9A - Huntington - Pentagon Sunday 23 4 6
Total 114
From REX Monthly Days in Month
Average Daily
AT2 - Seminary Plaza – Van Dorn Metro Sunday 28 4 7
AT5 - Braddock Road Metro – Van Dorn Metro Sunday 45 4 11
AT8 - Fairfax & Pendelton (Old Town) – Van Dorn Metro Sunday 84 4 21
AT10 - King Street Metro – Potomac Yard Sunday 10 4 3
28A - Leesburg Pike Sunday 168 4 42
29N - Alexandria - Fairfax Sunday 126 4 32
9A - Huntington - Pentagon Sunday 132 4 33
Total 149
The final set of data to help identify whether the Fairfax Connector 171 is appropriate as a substitute service for REX Line riders is boardings and alightings on Fort Belvoir, which is not served by the 171 route. This data is outlined below in Table 10. The data in the table show much smaller numbers than boardings and alightings north of Huntington (see Table 7), though during some time periods boardings or alightings on Fort Belvoir exceed 10% of total boardings or alightings for that time period and direction. These passengers would not have access to the Fairfax Connector 171 as a substitute service for the REX Line.

REX Line Service Evaluation Study
REX Line Service Evaluation 13 Final Recommendations
Table 10 - REX Line Boardings/Alightings On Fort Belvoir (Would not Have Access to Fairfax Connector 171 Service as a Substitute Service)
Time
Period Direction Boardings/Alightings
Fort Belvoir Total Time Period
Boardings/Alightings Percent of Total
Boardings/Alightings Fort Belvoir
Early AM NB 2 51 4.04% SB n/a n/a n/a
AM Peak NB 6 106 5.62% SB 8 49 16.85%
Mid-Day NB 9 182 4.71% SB 17 196 8.65%
PM Peak NB 15 142 10.41% SB 8 163 4.81%
Early Evening
NB 7 66 10.57% SB 8 92 8.69%
Total 80 1,047 7.64% Note: For this analysis, boardings are presented in the table for northbound service (for northbound
service the section of the REX Line on Fort Belvoir is comprised of the stops at the start of the line and
therefore alightings in this section are minimal). Likewise, alightings are presented for southbound service
(for southbound service the section of the REX Line on Fort Belvoir is comprised of the stops at the end of
the line and therefore boardings are minimal).
Based on the analysis outlined above, it is recommended that WMATA continue with implementation of the improved headways. While the Fairfax Connector 171 does provide duplicate service along much of the corridor, there are large numbers of riders that cannot use the 171 as a substitute service and thus would still benefit from the proposed improved headways.
C. Evaluate Scheduled Run Time - Adjust as Necessary
1. Analysis Framework – As part of each Priority Corridor Study, an analysis of scheduled run
times versus actual run times is completed in order to assess whether scheduled run time is adequate and reflects actual operating conditions. The analysis framework for the comparison is the percent difference between scheduled run time and actual run time for each trip, with any trip where actual run time exceeds scheduled run time by 10% identified as a run time issue.
The detailed analysis of scheduled versus actual run times is outlined in Appendix 3. The instances where actual run time exceeds scheduled run time by 10% are highlighted in yellow in the Appendix 3 tables.
For weekdays, the data in Appendix 3 show that there are no run time issues in the northbound direction and a few instances in the southbound direction. In the southbound direction there is one early AM trip that exceeds the 10% difference. This trip occurs just before longer scheduled trip run times begin, indicating that the longer scheduled trip times should potentially start earlier in the AM peak. In the PM peak there are two trips, just after scheduled one-way run time drops from 55 minutes to 53 minutes that exceed the 10%
REX Line Service Evaluation Study
REX Line Service Evaluation 14 Final Recommendations
threshold. In this instance schedulers may wish to extend the 55 minute scheduled run time a little later in the PM peak.
The northbound Saturday data in Appendix 3 show a single trip in the early AM where the actual run time exceeds scheduled run time by 10% as well as four trips in the PM peak. Two of the four PM peak trips occur just after the point when scheduled one-way run times drop from 49 minutes to 45 minutes. As with weekday service, perhaps extending the 49 minute run time later in the day will help address these issues. Southbound Saturday data show two instances where actual run time exceeds scheduled run time by 10%, one in the PM peak and one later in the evening.
Sunday northbound data shows one instance, during the middle of the day, where actual run time exceeds scheduled run time by more than 10%. Sunday southbound data show two instances where actual run time exceeds scheduled run time, both in the early evening and both occurring immediately after scheduled one-way run time drops from 51 minutes to 44 minutes.
2. Final Recommendation – The data analysis contained in Appendix 3 does not show wide
scale issues with inadequate scheduled run time. Rather the analysis shows issues during specific times of the day, usually right after there is a drop in scheduled one-way run time. The recommendation here is for Metrobus schedulers to evaluate the potential for extending the number of trips that have longer run times (for instance, on Saturday in the northbound direction, rather than ending the 49 minute one-way run time with the 4:30 PM trip, extend the 49 minute run time to 6:00 PM).
D. Add Trips to Meet Hours of Service Criteria (recommended for implementation in the short-
term time frame)
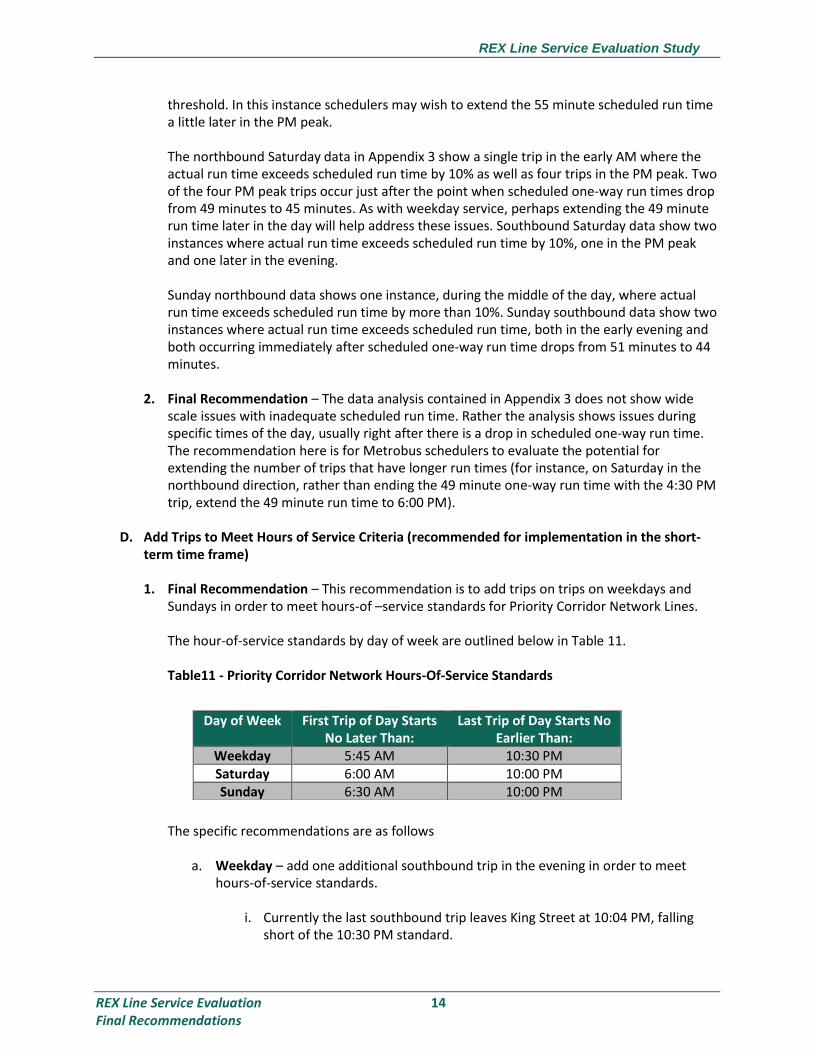
1. Final Recommendation – This recommendation is to add trips on trips on weekdays and Sundays in order to meet hours-of –service standards for Priority Corridor Network Lines.
The hour-of-service standards by day of week are outlined below in Table 11. Table11 - Priority Corridor Network Hours-Of-Service Standards
The specific recommendations are as follows
a. Weekday – add one additional southbound trip in the evening in order to meet hours-of-service standards.
i. Currently the last southbound trip leaves King Street at 10:04 PM, falling
short of the 10:30 PM standard.
Day of Week First Trip of Day Starts No Later Than:
Last Trip of Day Starts No Earlier Than:
Weekday 5:45 AM 10:30 PM Saturday 6:00 AM 10:00 PM Sunday 6:30 AM 10:00 PM

REX Line Service Evaluation Study
REX Line Service Evaluation 15 Final Recommendations
b. Sunday – add two additional southbound trips and two additional northbound trips
in the evening in order to meet hour-of-service standards.
i. Currently the last Sunday trips in the evening in each direction leave at 9:00 PM, short of the 10:00 PM standard. Of note is that the proposal to add two trips in each direction reflects Recommendation B, which proposes improving Sunday service frequency to every 30 minutes from the current 60 minutes.
Note: Weekday northbound service meets all hours-of-service standards. Saturday service also meets all hours-of-service standards.
2. Reason for Recommendation – The Priority Corridor Network (PCN) service span standards
are meant to ensure that service in corridors within the PCN is premium, high quality service that meets the needs of the riders within the corridor. Adjusting service to ensure that the hour-of-service standards are met will ensure that riders utilizing REX Line service for non-traditional work hours or for other trip purposes that fall outside traditional commute hours have the option of relying on transit for their trip needs.
3. Recommendation Cost Estimate – The estimated operating cost estimate for this recommendation, including accounting for fare recovery and the regional subsidy, is outlined below in Table 12.
Table 12 - Estimated Cost – Add Trips to Meet Hours-of-Service Standards
Day of Week Additional
Trips
Run Time
in Hours
Additional Revenue
Hours
Platform Hour
Factor
Additional Platform
Hours
Cost per Platform
Hour Daily Cost
Annual Cost
Weekday 1 0.77 0.77 1.1 0.84 $115.00 $96.98 $24,246
Estimated Fare Recovery $43.29 $10,823
Net Cost after Fare Recovery $53.69 $13,423
Sunday NB 2 0.77 1.53 1.1 1.69 $115.00 $193.97 $11,250
Estimated Fare Recovery $15.21 $882
Net Cost after Fare Recovery
$178.76 $10,368
Sunday SB 2 0.73 1.47 1.1 1.61 $115.00 $185.53 $10,761
Estimated Fare Recovery $27.50 $1,595
Net Cost after Fare Recovery $158.04 $9,166
Total Cost Before Fare Recovery $476.48 $46,257
Estimated Total Fare Recovery $86.00 $13,299
Net Cost after Fare Recovery $390.49 $32,957
Cost after regional subsidy (assumed regional subsidy covers 20% of net cost) $312.39 $26,366

REX Line Service Evaluation Study
REX Line Service Evaluation 16 Final Recommendations
4. Cost Effectiveness and Productivity Evaluation Measures – Provided in this section are a series of evaluation measures (see Table 14) that will allow a comparison of the different recommendations contained in this document. It should also be noted that some of these evaluation factors depend on the calculation of new riders associated with the expansion of service hours. Included first in this section in Table 13 is an estimate of ridership on each trip based on existing ridership on the last trips of the day. The assumption used in estimating the ridership on the new trips is that the pattern of the ridership on the last trips would continue to the new trips but would decline by 10% to reflect the fact that the new trips are later in the evening when fewer people are riding.
Table 13 – Estimated Ridership – New Trips (based on ridership patterns on current last trips of the day)
Day of Week
Direction Trip Time Total Trip Boardings
Average Boardings
10 % Decrease
Estimated Ridership
Weekday Southbound 10:00 PM 37 37 4 33
Sunday
Northbound 8:00 PM 12
9:00 PM 14 13 1 12
Southbound 8:00 PM 24
9:00 PM 23 24 2 21
Table 14 contains the actual evaluation criteria that will allow for comparison of the different proposed recommendations contained in this document.
Table 14 - Evaluation Measures – Add Trips to Meet Hours of Service Standards
Evaluation Factor Value
Weekday
Cost per New Rider - Total Cost
$2.91
Cost per New Rider - Net Cost after Fare Recovery $1.61
Cost per New Rider - Net Cost with Regional Subsidy
$1.29
Sunday
Cost per New Rider - Total Cost
$11.55
Cost per New Rider - Net Cost after Fare Recovery $10.25
Cost per New Rider - Net Cost with Regional Subsidy $8.20

REX Line Service Evaluation Study
REX Line Service Evaluation 17 Final Recommendations
E. Implement Dedicated Supervision (proposed implementation in the short-term time frame)
1. Analysis Framework/Final Recommendation – A detailed headway separation analysis for each day of the week and by direction is contained in Appendix 4. The analysis framework for this data is that any trip where actual headway separation exceeds scheduled headway separation by more than 15% is identified as a headway-separation issue.
The data in Appendix 4 show consistent headway issues throughout the day in both directions on weekdays and in the mid-day and PM peak on Saturdays. Based on the results of this analysis, it is recommended that dedicated supervision be provided during these time periods in order to proactively manage the REX line and help maintain correct headway separation. Given that the headway separation issues occur in the middle of the line in the vicinity of Ladson Lane, the proposed deployment of the dedicated supervision would be at this location in both directions, as follows:
Ladson Lane Southbound – weekday – 12 hours (6:00 AM to 6:00 PM) Ladson Lane Northbound - weekday – 12 hours (6:00 AM to 6:00 PM) Ladson Lane Southbound – Saturday – 8 hours (11:00 AM to 7:00 PM) Ladson Lane Northbound – Saturday – 8 hours (11:00 AM to 7:00 PM) It should be noted that the “Service Operations Managers Assignments – Final Report” dated May 2013 recommended dedicated supervision on the REX Line at King Street and Fort Belvoir. These recommendations were based on the best data available at the time of the completion of the report. The more detailed headway separation analysis developed for this study resulted in the modified recommendation included here.
2. Reason for Recommendation – Congestion on the U.S. 1 corridor results in a lack of
reliability and poor headway separation, as shown in the data outlined in Appendix 4. Lack of REX Line reliability was also identified by survey respondents as a key issue. Assigning dedicated supervisors at a key point along the REX Line will ensure buses are correctly separated in the middle of the line, ensuring more reliable service, more even distribution of loads and more productive use of capacity.
3. Recommendation Cost Estimate - The estimated cost of this recommendation is outlined
below in Table 14
REX Line Service Evaluation Study
REX Line Service Evaluation 18 Final Recommendations
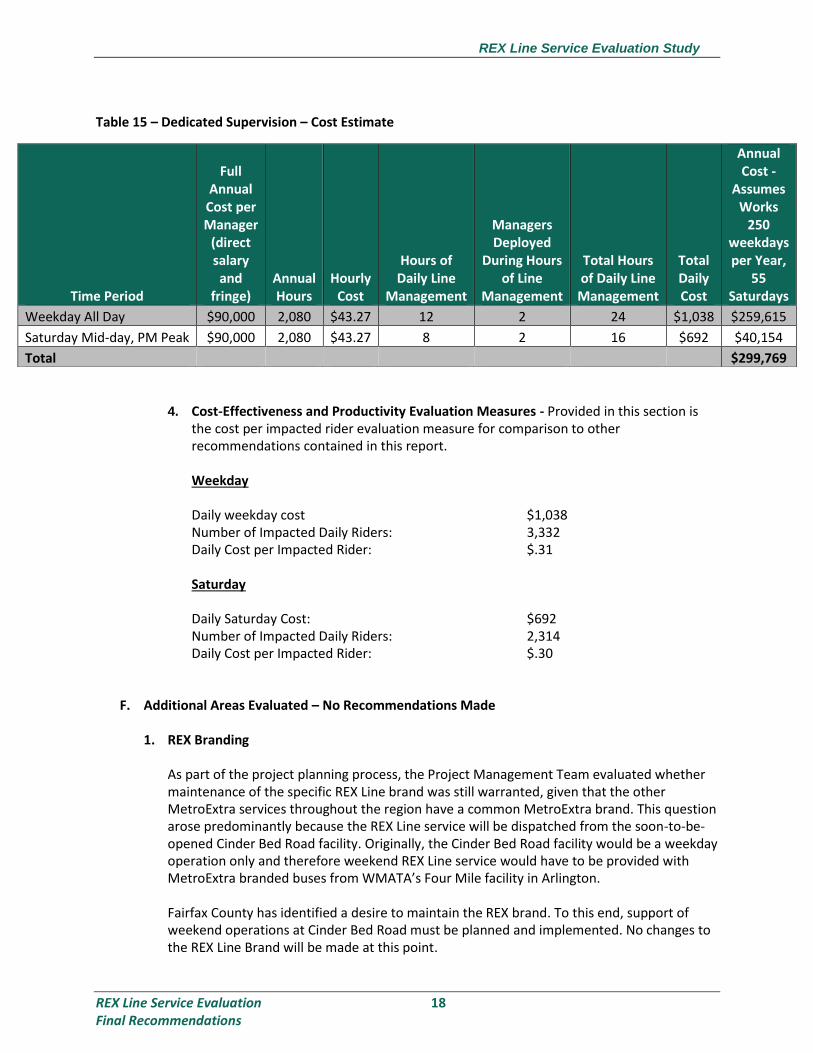
Table 15 – Dedicated Supervision – Cost Estimate
4. Cost-Effectiveness and Productivity Evaluation Measures - Provided in this section is the cost per impacted rider evaluation measure for comparison to other recommendations contained in this report. Weekday
Daily weekday cost $1,038 Number of Impacted Daily Riders: 3,332 Daily Cost per Impacted Rider: $.31
Saturday
Daily Saturday Cost: $692 Number of Impacted Daily Riders: 2,314 Daily Cost per Impacted Rider: $.30
F. Additional Areas Evaluated – No Recommendations Made
1. REX Branding As part of the project planning process, the Project Management Team evaluated whether
maintenance of the specific REX Line brand was still warranted, given that the other MetroExtra services throughout the region have a common MetroExtra brand. This question arose predominantly because the REX Line service will be dispatched from the soon-to-be-opened Cinder Bed Road facility. Originally, the Cinder Bed Road facility would be a weekday operation only and therefore weekend REX Line service would have to be provided with MetroExtra branded buses from WMATA’s Four Mile facility in Arlington.
Fairfax County has identified a desire to maintain the REX brand. To this end, support of
weekend operations at Cinder Bed Road must be planned and implemented. No changes to the REX Line Brand will be made at this point.
Time Period
Full Annual
Cost per Manager
(direct salary and
fringe) Annual Hours
Hourly Cost
Hours of Daily Line
Management
Managers Deployed
During Hours of Line
Management
Total Hours of Daily Line
Management
Total Daily Cost
Annual Cost -
Assumes Works
250 weekdays per Year,
55 Saturdays
Weekday All Day $90,000 2,080 $43.27 12 2 24 $1,038 $259,615
Saturday Mid-day, PM Peak $90,000 2,080 $43.27 8 2 16 $692 $40,154
Total $299,769

REX Line Service Evaluation Study
REX Line Service Evaluation 19 Final Recommendations
Terminate Service at Huntington Metrorail Station During the early stages of the planning process, Project Management Team members asked that an evaluation of potentially terminating REX Line service at Huntington be completed. The impetus for this request was the delays and impacts to reliability from running on congested streets in Alexandria, especially during peak periods. An evaluation was completed early in the planning process and, based on the results of the evaluation, a decision was made not to pursue this potential service change. The results of the evaluation and the foundation for the decision not to move forward with this potential recommendation are summarized below. REX Line Boardings and Alightings North of Huntington – The first piece of the evaluation was an assessment of weekday REX Line boardings and alightings north of Huntington. The results are shown below in Table 15. The data in Table 15 show that approximately ¼ of all daily boardings and alightings on the REX Line occur north of Huntington. Table 16 – REX Line Boardings and Alightings North of Huntington
The second piece of the evaluation assessed transfers to other bus lines that are located north of Huntington. This data is displayed in Table 16. The reason for this assessment is that there was speculation that most riders boarding or alighting north of Huntington were transferring to or from Metrorail at the King Street station and therefore that transfer could now occur at the Huntington Station if the service termination at
On Off
Direction Time Period
SB AM Early 23 0
AM Peak 155 54
Mid-day 200 23
PM Peak 424 27
Early Night 171 6
Total 973 110
NB AM Early 1 72
AM Peak 3 262
Mid-day
3 200
PM Peak 9 166
Early Night 1 43
Total 17 743
Total - Both Directions 990 853
Percent of Total Daily Boardings 26.36% 23.18%

REX Line Service Evaluation Study
REX Line Service Evaluation 20 Final Recommendations
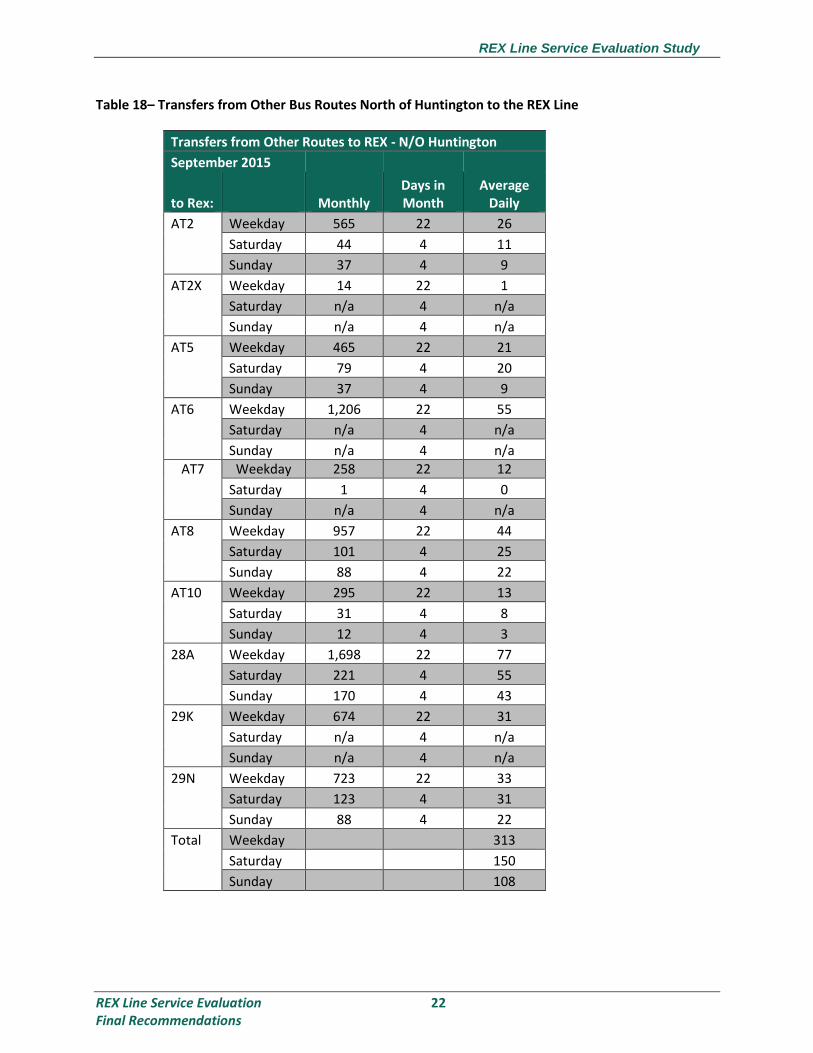
Huntington was implemented. The data in Table 16 show that 379 weekday REX Line riders are transferring to another bus line north of Huntington. This is approximately 10% of total daily weekday REX Line boardings. Table 17 contains comparable data for transfers from other bus routes north of Huntington to the REX Line. The same patterns and general numbers of transfers occur for transfers to the REX Line as transfers from the REX Line.
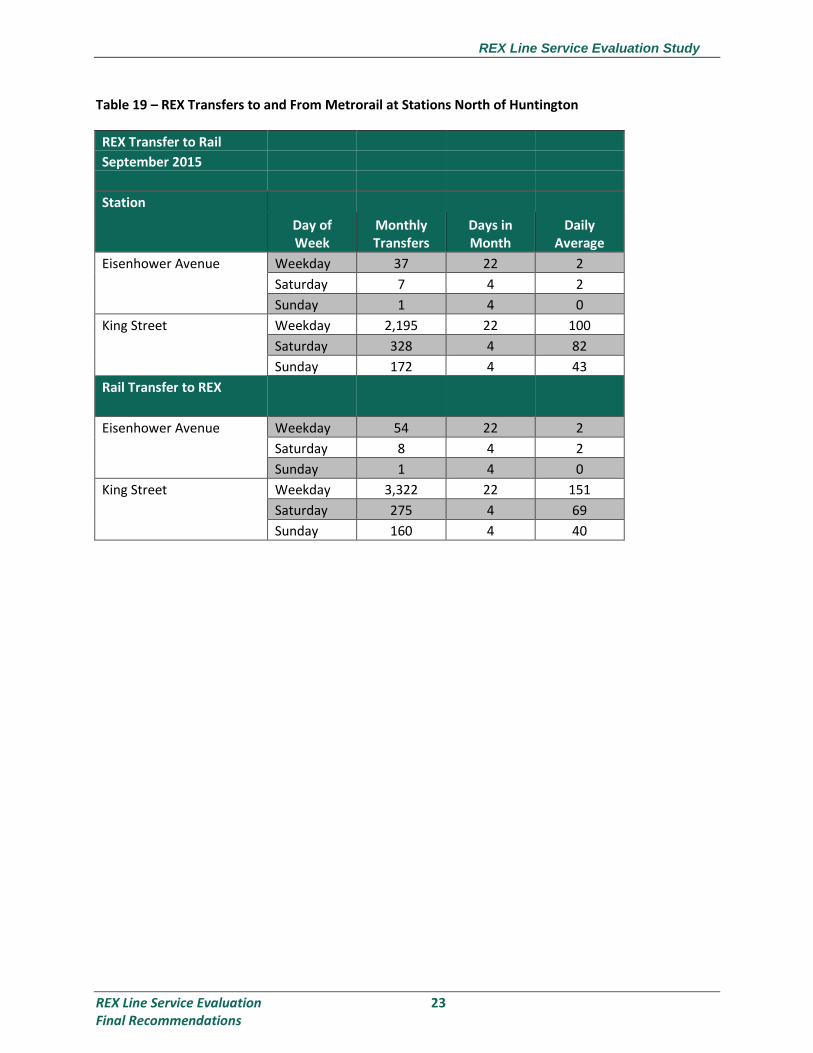
The final Table in the evaluation is Table 18, which shows the number of transfers to and from Metrorail north of Huntington. The data in the table highlight that the transfers to and from Metrorail at King Street are a relatively small proportion of the total boarding and alighting activity north of Huntington. Based on the data in Tables 15 through 18, the Project Management Team determined not to recommend the termination of service at Huntington given the potential impact to a large number of riders on the line. Instead, it was determined that the current service and route configuration should be retained.

REX Line Service Evaluation Study
REX Line Service Evaluation 21 Final Recommendations
Table 17 – REX Transfers to Other Bus Routes North of Huntington
REX transfers to Other Routes - N/O Huntington
September 2015
REX to: Monthly
Days in Month
Average Daily
AT2 Weekday 707 22 32
Saturday 35 4 9
Sunday 28 4 7
AT2X Weekday 21 22 1
Saturday n/a 4 n/a
Sunday n/a 4 n/a
AT5 Weekday 517 22 24
Saturday 103 4 26
Sunday 45 4 11
AT6 Weekday 1,505 22 68
Saturday n/a 4 n/a
Sunday n/a 4 n/a
AT7 Weekday 479 22 22
Saturday 2 4 1
Sunday n/a 4 n/a
AT8 Weekday 1,330 22 60
Saturday 111 4 28
Sunday 84 4 21
AT10 Weekday 427 22 19
Saturday 34 4 9
Sunday 10 4 3
28A Weekday 1,930 22 88
Saturday 264 4 66
Sunday 168 4 42
29K Weekday 676 22 31
Saturday n/a 4 n/a
Sunday n/a 4 n/a
29N Weekday 752 22 34
Saturday 167 4 42
Sunday 126 4 32
Total Weekday 379
Saturday 181
Sunday 116
REX Line Service Evaluation Study
REX Line Service Evaluation 22 Final Recommendations
Table 18– Transfers from Other Bus Routes North of Huntington to the REX Line
Transfers from Other Routes to REX - N/O Huntington
September 2015
to Rex: Monthly Days in Month
Average Daily
AT2 Weekday 565 22 26
Saturday 44 4 11
Sunday 37 4 9
AT2X Weekday 14 22 1
Saturday n/a 4 n/a
Sunday n/a 4 n/a
AT5 Weekday 465 22 21
Saturday 79 4 20
Sunday 37 4 9
AT6 Weekday 1,206 22 55
Saturday n/a 4 n/a
Sunday n/a 4 n/a
AT7 Weekday 258 22 12
Saturday 1 4 0
Sunday n/a 4 n/a
AT8 Weekday 957 22 44
Saturday 101 4 25
Sunday 88 4 22
AT10 Weekday 295 22 13
Saturday 31 4 8
Sunday 12 4 3
28A Weekday 1,698 22 77
Saturday 221 4 55
Sunday 170 4 43
29K Weekday 674 22 31
Saturday n/a 4 n/a
Sunday n/a 4 n/a
29N Weekday 723 22 33
Saturday 123 4 31
Sunday 88 4 22
Total Weekday 313
Saturday 150
Sunday 108
REX Line Service Evaluation Study
REX Line Service Evaluation 23 Final Recommendations
Table 19 – REX Transfers to and From Metrorail at Stations North of Huntington
REX Transfer to Rail
September 2015
Station
Day of Week
Monthly Transfers
Days in Month
Daily Average
Eisenhower Avenue Weekday 37 22 2
Saturday 7 4 2
Sunday 1 4 0
King Street Weekday 2,195 22 100
Saturday 328 4 82
Sunday 172 4 43
Rail Transfer to REX
Eisenhower Avenue Weekday 54 22 2
Saturday 8 4 2
Sunday 1 4 0
King Street Weekday 3,322 22 151
Saturday 275 4 69
Sunday 160 4 40
REX Line Service Evaluation Study
REX Line Service Evaluation 24 Final Recommendations
3. Passenger Facility Recommendations
A. Improve Bus Stop Amenities
1. Final Recommendation - As part of the study process, a field review of the REX Line was completed to identify stop amenities at each stop along the line. This list of amenities was then compared against the “WMATA Bus Stop Guidelines” to determine where additional amenities are warranted based on the Guidelines. The Guidelines are structured around a bus stop hierarchy wherein every stop should have a basic set of passenger amenities including a bus stop flag, sidewalk access to the stop, and a sidewalk or landing pad at the stop itself. Further up the hierarchy are amenities that should be installed based on the level of passenger boarding activity at a stop. These additional amenities include an information case, a trash receptacle, a shelter and bench, and real time bus arrival information signs. The proposed basic amenities are outlined first, followed by those amenities that are contingent upon boarding activity at a stop.
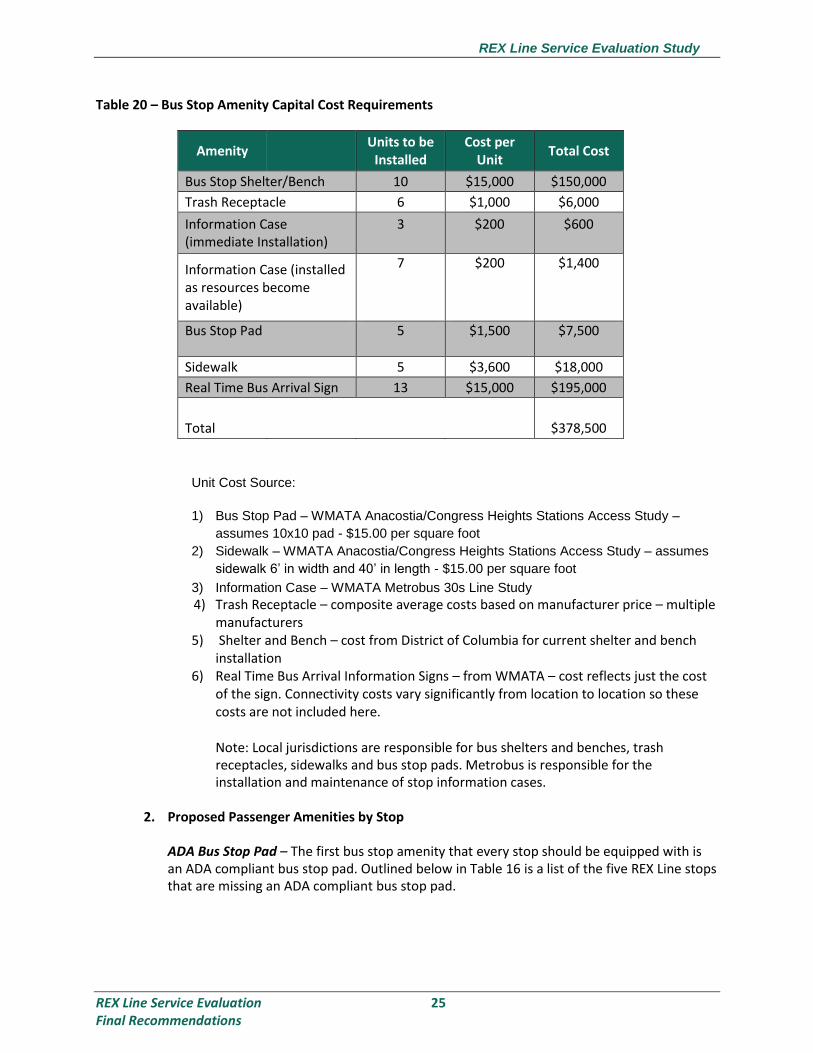
This recommendation is to begin the process of installing missing amenities based on the WMATA Bus Stop Guidelines. This recommendation is proposed to begin in the short-term time frame (1-2 years) though it is not anticipated that all amenities would be installed in that time frame. The estimated capital cost of installing the proposed amenities is shown in Table 15.
Fairfax County has a comprehensive list of improvements to improve pedestrian and transit
access in the Route 1 corridor, including bus stop improvements. Funding is available and bus stop amenity improvements are set to begin in the summer of 2016. It should also be noted that at those stops where the improvements incorporate a new shelter, the branded REX Line shelters that are currently at REX Line stops may be replaced. Finally, amenity improvements will need to be coordinated with plans to widen Route 1 between Fort Belvoir and North/South Kings Highway to accommodate median-running BRT.
REX Line Service Evaluation Study
REX Line Service Evaluation 25 Final Recommendations
Table 20 – Bus Stop Amenity Capital Cost Requirements
Amenity Units to be
Installed Cost per
Unit Total Cost
Bus Stop Shelter/Bench 10 $15,000 $150,000
Trash Receptacle 6 $1,000 $6,000
Information Case (immediate Installation)
3
$200
$600
Information Case (installed as resources become available)
7
$200
$1,400
Bus Stop Pad
5 $1,500 $7,500
Sidewalk 5 $3,600 $18,000
Real Time Bus Arrival Sign 13 $15,000 $195,000
Total $378,500
Unit Cost Source:
1) Bus Stop Pad – WMATA Anacostia/Congress Heights Stations Access Study –
assumes 10x10 pad - $15.00 per square foot
2) Sidewalk – WMATA Anacostia/Congress Heights Stations Access Study – assumes
sidewalk 6’ in width and 40’ in length - $15.00 per square foot
3) Information Case – WMATA Metrobus 30s Line Study
4) Trash Receptacle – composite average costs based on manufacturer price – multiple manufacturers
5) Shelter and Bench – cost from District of Columbia for current shelter and bench installation
6) Real Time Bus Arrival Information Signs – from WMATA – cost reflects just the cost of the sign. Connectivity costs vary significantly from location to location so these costs are not included here.
Note: Local jurisdictions are responsible for bus shelters and benches, trash receptacles, sidewalks and bus stop pads. Metrobus is responsible for the installation and maintenance of stop information cases.
2. Proposed Passenger Amenities by Stop
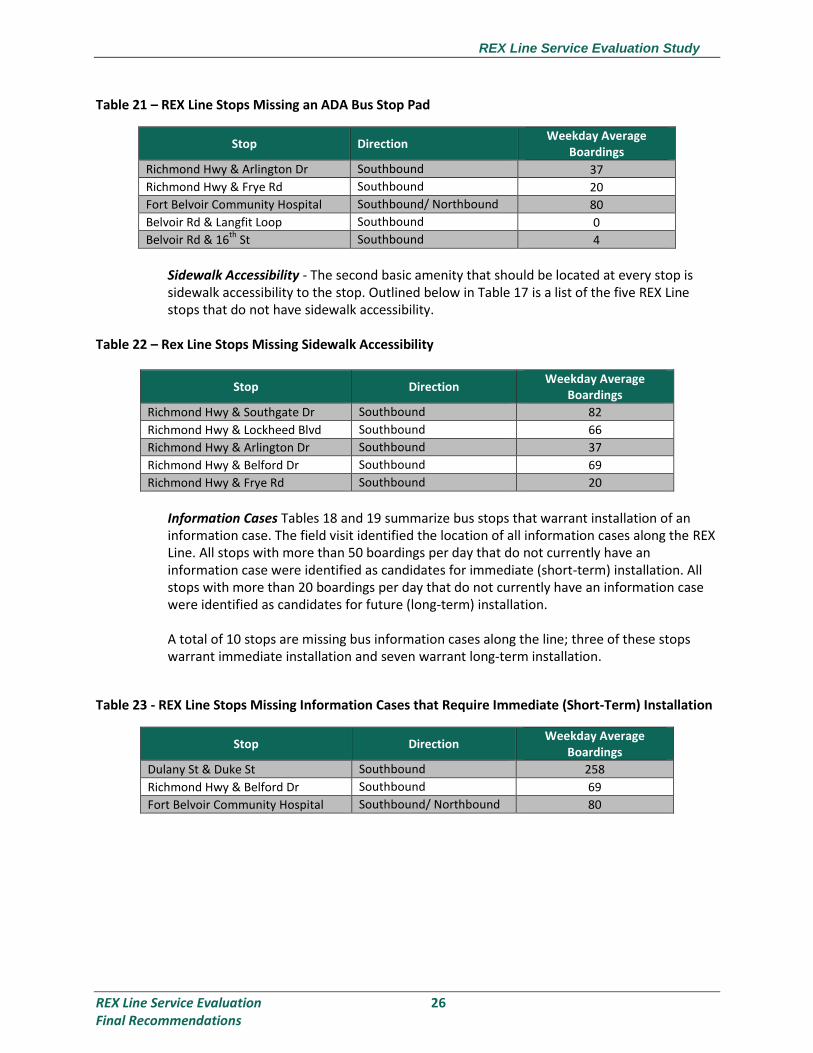
ADA Bus Stop Pad – The first bus stop amenity that every stop should be equipped with is an ADA compliant bus stop pad. Outlined below in Table 16 is a list of the five REX Line stops that are missing an ADA compliant bus stop pad.
REX Line Service Evaluation Study
REX Line Service Evaluation 26 Final Recommendations
Table 21 – REX Line Stops Missing an ADA Bus Stop Pad
Stop Direction Weekday Average
Boardings
Richmond Hwy & Arlington Dr Southbound 37
Richmond Hwy & Frye Rd Southbound 20
Fort Belvoir Community Hospital Southbound/ Northbound 80
Belvoir Rd & Langfit Loop Southbound 0
Belvoir Rd & 16th
St Southbound 4
Sidewalk Accessibility - The second basic amenity that should be located at every stop is sidewalk accessibility to the stop. Outlined below in Table 17 is a list of the five REX Line stops that do not have sidewalk accessibility.
Table 22 – Rex Line Stops Missing Sidewalk Accessibility
Stop Direction Weekday Average
Boardings
Richmond Hwy & Southgate Dr Southbound 82
Richmond Hwy & Lockheed Blvd Southbound 66
Richmond Hwy & Arlington Dr Southbound 37
Richmond Hwy & Belford Dr Southbound 69
Richmond Hwy & Frye Rd Southbound 20
Information Cases Tables 18 and 19 summarize bus stops that warrant installation of an information case. The field visit identified the location of all information cases along the REX Line. All stops with more than 50 boardings per day that do not currently have an information case were identified as candidates for immediate (short-term) installation. All stops with more than 20 boardings per day that do not currently have an information case were identified as candidates for future (long-term) installation.
A total of 10 stops are missing bus information cases along the line; three of these stops warrant immediate installation and seven warrant long-term installation.
Table 23 - REX Line Stops Missing Information Cases that Require Immediate (Short-Term) Installation
Stop Direction Weekday Average
Boardings
Dulany St & Duke St Southbound 258
Richmond Hwy & Belford Dr Southbound 69
Fort Belvoir Community Hospital Southbound/ Northbound 80

REX Line Service Evaluation Study
REX Line Service Evaluation 27 Final Recommendations
Table 24 - REX Line Stops Missing Information Cases that Require Future (Long-term) Installation
Stop Direction Weekday Average
Boardings
Belvoir Rd & 16th
St Northbound 21
Belvoir Rd & 16th
St Southbound 4
Belvoir Rd & Langfit Loop Southbound 0
Belvoir Rd & Langfit Loop Northbound 30
Belvoir Rd & Pence Gate Northbound 43
Richmond Hwy & Frye Rd Southbound 20
Dulany St & Duke St Northbound 9
Trash Receptacles – The next step in the amenity hierarchy is trash receptacles, which are proposed based on the level of boardings at a stop. The field visit identified the location of all trash receptacles along the REX Line. All stops with more than 25 boardings per day that do not currently have a trash receptacle were identified as candidates for installation. Since WMATA does not install trash receptacles, WMATA would request Alexandria and Fairfax County to install them.
There are 8 candidates for installation of a trash receptacle. These are listed below in Table 20.
Table 25 - REX Line Candidates for the Installation of a Trash Receptacle
Stop Direction Weekday Average
Boardings
Dulany St & Duke St Southbound 258
Eisenhower Ave & Swamp Fox Rd Southbound 168
Richmond Hwy & Southgate Dr Southbound 82
Richmond Hwy & Arlington Dr Southbound 37
Richmond Hwy & Belford Dr Northbound 69
Richmond Hwy & Ladson Ln Northbound 152
Fort Belvoir Community Hospital Southbound/ Northbound 80
Jackson Loop Southbound/ Northbound 42
Stop and Shelter - The next step in the amenity hierarchy is shelters and benches. The “WMATA Bus Stop Guidelines” indicate that any stop with more than 50 boardings is a candidate for a shelter and bench. Since WMATA does not install benches and shelters, WMATA would request Alexandria and Fairfax County to install them. As shown in Table 21, the REX Line has six stops that are candidates for installation of a shelter and bench.

REX Line Service Evaluation Study
REX Line Service Evaluation 28 Final Recommendations
Table 26 - REX Line Candidates for the Installation of a Bench and Shelter
Stop Direction Weekday Average
Boardings
Dulany St & Duke St Southbound 258
Eisenhower Ave & Swamp Fox Rd Southbound 168
Richmond Hwy & Belford Dr Northbound 69
Richmond Hwy & Ladson Ln Northbound 152
Richmond Hwy & Mt Vernon Memorial Hwy
Southbound 64
Fort Belvoir Community Hospital Southbound/ Northbound 80
Real Time Bus Arrival Information Signs - The final step in the amenity hierarchy is real time bus arrival information signs. Any stop with greater than 100 daily boardings is a candidate for a real time bus arrival information sign. As shown in Table 22, the REX Line has 13 stops
that are candidates for installation of a real time bus arrival information sign.
Table 27 - REX Line Candidates for the Installation of a Real Time Bus Arrival Information Sign
Stop Direction Weekday Average
Boardings
King Street Metrorail Station Southbound 549
Dulany/Duke Street Southbound 258
Eisenhower Metrorail Station Southbound 168
Huntington Metrorail Station Southbound 435
Richmond Highway/Cooper Road Northbound 165
Richmond Highway/Frye Road Northbound 189
Richmond Highway/Mohawk Lane Northbound 184
Richmond Highway/Ladson Lane Northbound 152
Richmond Highway/Belford Drive Northbound 144
Richmond Highway/Dart Drive Northbound 278
Richmond Highway/Southgate Drive Northbound 112
Richmond Highway/Kings Highway Northbound 108
Huntington Metrorail Station Northbound 144
4. Traffic and Running Way Improvements
A. Proposed Traffic and Running Way Improvements 1. Final Recommendation – A number of traffic and running way issues in the REX Line service
area were identified based on the completion of the project “Traffic Operations Assessment”. The next step in implementing improvements to address these issues will be to complete more detailed analysis at the identified intersections and other locations, including traffic counts, intersection capacity analysis, intersection geometry analysis, and signal timing and phase length analysis. This recommendation is to start the work on these next analysis steps as well as coordinate on the work with Alexandria, Fairfax County and
REX Line Service Evaluation Study
REX Line Service Evaluation 29 Final Recommendations
the Virginia Department of Transportation. The specific proposed areas of analysis are outlined below.
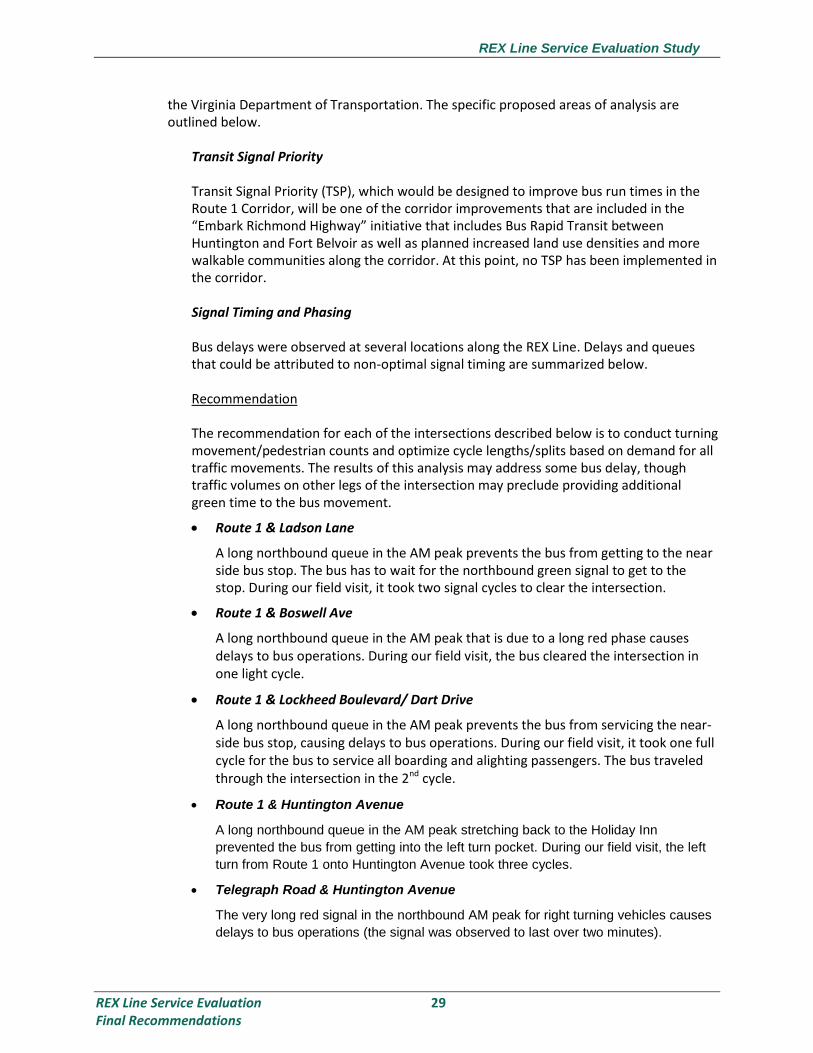
Transit Signal Priority Transit Signal Priority (TSP), which would be designed to improve bus run times in the Route 1 Corridor, will be one of the corridor improvements that are included in the “Embark Richmond Highway” initiative that includes Bus Rapid Transit between Huntington and Fort Belvoir as well as planned increased land use densities and more walkable communities along the corridor. At this point, no TSP has been implemented in the corridor. Signal Timing and Phasing Bus delays were observed at several locations along the REX Line. Delays and queues that could be attributed to non-optimal signal timing are summarized below. Recommendation The recommendation for each of the intersections described below is to conduct turning movement/pedestrian counts and optimize cycle lengths/splits based on demand for all traffic movements. The results of this analysis may address some bus delay, though traffic volumes on other legs of the intersection may preclude providing additional green time to the bus movement.
Route 1 & Ladson Lane
A long northbound queue in the AM peak prevents the bus from getting to the near side bus stop. The bus has to wait for the northbound green signal to get to the stop. During our field visit, it took two signal cycles to clear the intersection.
Route 1 & Boswell Ave
A long northbound queue in the AM peak that is due to a long red phase causes delays to bus operations. During our field visit, the bus cleared the intersection in one light cycle.
Route 1 & Lockheed Boulevard/ Dart Drive
A long northbound queue in the AM peak prevents the bus from servicing the near-side bus stop, causing delays to bus operations. During our field visit, it took one full cycle for the bus to service all boarding and alighting passengers. The bus traveled through the intersection in the 2nd cycle.
Route 1 & Huntington Avenue
A long northbound queue in the AM peak stretching back to the Holiday Inn
prevented the bus from getting into the left turn pocket. During our field visit, the left
turn from Route 1 onto Huntington Avenue took three cycles.
Telegraph Road & Huntington Avenue
The very long red signal in the northbound AM peak for right turning vehicles causes
delays to bus operations (the signal was observed to last over two minutes).

REX Line Service Evaluation Study
REX Line Service Evaluation 30 Final Recommendations
Eisenhower Avenue & Stovall Street
There is a long right turn queue in the northbound AM and PM peaks due to short right turn green time. Right-turn-on-red (RTOR) is allowed at this intersection but conflicting traffic makes RTOR difficult.
Dulany & Jamieson
There is a long left turn queue in the northbound AM and PM peak as a result of a short left turn green phase. This queue causes delays to bus operations. Most vehicles at this approach are turning left. During our field visit, the bus took two cycles to clear the intersection in the AM peak and three cycles in the PM peak.
Route 1 & Lockheed Boulevard/ Dart Drive
A long northbound queue in the PM peak spills back to the upstream intersection at Arlington Drive. During our field visit, the bus required two light cycles to pick up passengers, drop off passengers, and travel through the Arlington Boulevard intersection. The bus also needed two light cycles to pick up passengers, drop off passengers, and clear the Lockheed Boulevard/ Dart Drive intersection.
Route 1 & South King Highway
A long northbound queue in the PM peak causes delays to bus operations. During our field visit, the bus needed one light cycle to clear the intersection and get to the far-side bus stop.
Stovall St & Mill Road
The long red signal at this intersection in the southbound AM peak causes delays to bus operations.
Huntington Ave & Metroview Parkway
A long queue resulting from insufficient green time causes delays to the buses trying to turn right into the Huntington Metro Station in the southbound AM and PM peak. During our field visit the bus cleared the intersection in one cycle.
Route 1 & Beacon Hill
A long AM peak southbound through queue spills back to the upstream intersection at South Gate Drive due to high peak hour volumes and insufficient green time.
Route 1 & Arlington Drive
Long AM and PM peak southbound through queues causes delays to bus operations. During our field visit, the bus required two cycles to clear the intersection in the AM peak and one cycle in the PM peak.
Route 1 & Buckman Road/ Mt Vernon Highway
A long AM peak southbound queue causes delays to bus operations.
Route 1 & Mohawk Lane
A long AM peak southbound queue causes delays to bus operations.

REX Line Service Evaluation Study
REX Line Service Evaluation 31 Final Recommendations
Route 1 & Jeff Todd Way/ Mt. Vernon Memorial Hwy
A long AM peak southbound queue causes delays to bus operations. During our field visit the bus traveled in the right turn lane and merged in the middle of the intersection to travel southbound through the intersection.
Stop Access A number of stop access issues were identified as part of the operational analysis. Specific instances are outlined below.
Route 1 & South King Highway
Long AM and PM peak southbound through queues as a result of long cycle length delay buses trying to access the South King Highway far-side bus stop.
Route 1 & South Gate Drive
A long southbound AM peak queue spills back past the bus stop and prevents the bus from accessing the near-side stop. During our field visit, the bus had difficulty merging back into the travel lane. The queue’s origin is at the downstream intersection at Beacon Hill.
Route 1 & Mohawk Lane
A long northbound AM peak queue makes it difficult to merge back into the travel lane after serving the stop located in the right turn lane.
Route 1 & Arlington Drive
A long AM peak northbound queue can grow to prevent the bus from accessing the bus stop. During our field visit, the queue cleared the intersection in one light cycle.
Route 1 & Sacramento Drive
A long PM peak northbound queue at Sacramento delays the bus from accessing the Cooper Road stop.
Route 1 & Sherwood Hall
A long PM peak northbound queue causes delays for the bus trying to pick up and drop off passengers at the Belford Drive stop.
Route 1 & Belford Drive
There are merging issues in the northbound PM peak for the bus after picking up and dropping off passengers at the Belford Drive bus stop.
Recommendation
Evaluate the location of impacted stops to determine if there would be potential benefit from a stop-relocation. This would include an evaluation of the availability of space for a relocated stop as well as the impacts of relocation on riders. Any stop relocation recommendations will be coordinated with the stop amenity improvements scheduled to start in the summer of 2016 as well as the plans to widen Route 1 to accommodate BRT.

REX Line Service Evaluation Study
REX Line Service Evaluation 32 Final Recommendations
Safety/Operational Issues
Mill Road & Telegraph Road
Based on feedback from drivers, it is very difficult for buses to turn right onto Telegraph Road in the southbound direction because of poor sight lines and the inability of drivers to see very fast oncoming traffic coming over a rise on southbound Telegraph Road.
Recommendation Drivers recommended consideration of running service directly from the King Street Metro to Telegraph Road via Duke Street in order to avoid this turn. This re-route would bypass the Eisenhower Metrorail Station stop on the REX Line. No recommendation regarding this re-route is provided at this time. Monitoring of ridership at the Eisenhower Metrorail station in light of increased development in the station area will continue in order to determine the impact to riders of a potential re-route. No changes are proposed at this time.
REX Line Service Evaluation Study
REX Line Service Evaluation 33 Final Recommendations
Appendix 1 New Rider Calculations – Sunday Headway Improvement
REX Line Service Evaluation Study
REX Line Service Evaluation 34 Final Recommendations
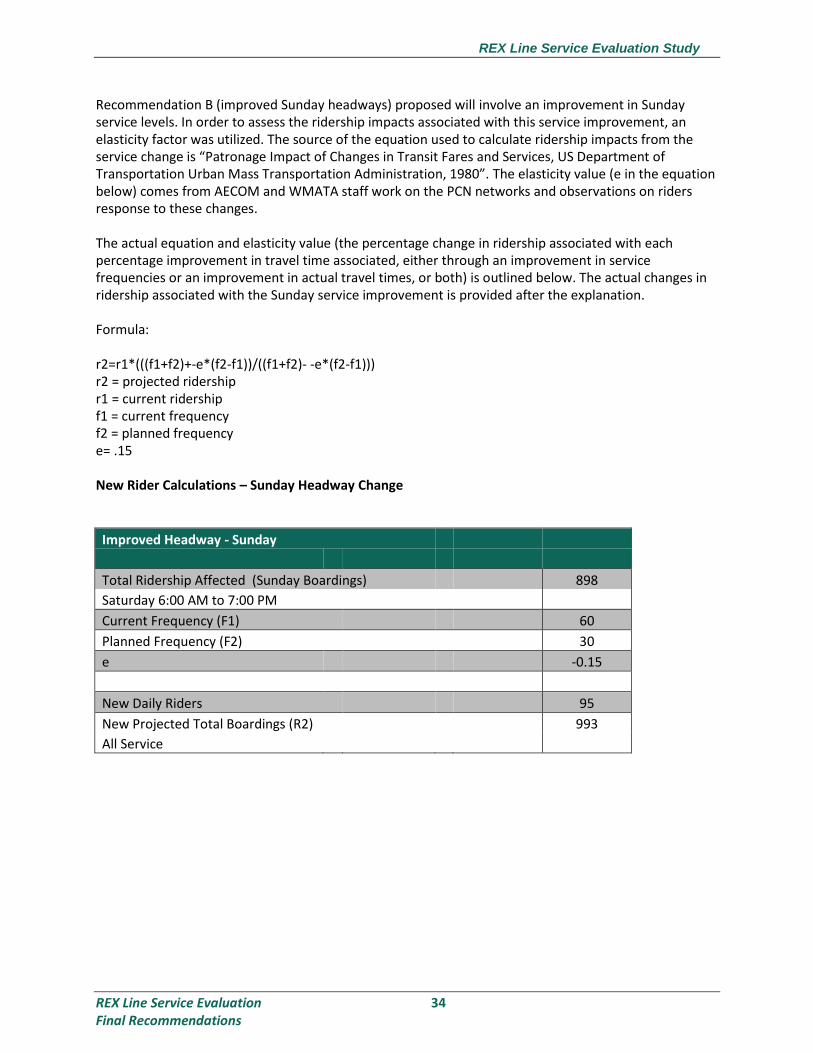
Recommendation B (improved Sunday headways) proposed will involve an improvement in Sunday service levels. In order to assess the ridership impacts associated with this service improvement, an elasticity factor was utilized. The source of the equation used to calculate ridership impacts from the service change is “Patronage Impact of Changes in Transit Fares and Services, US Department of Transportation Urban Mass Transportation Administration, 1980”. The elasticity value (e in the equation below) comes from AECOM and WMATA staff work on the PCN networks and observations on riders response to these changes. The actual equation and elasticity value (the percentage change in ridership associated with each percentage improvement in travel time associated, either through an improvement in service frequencies or an improvement in actual travel times, or both) is outlined below. The actual changes in ridership associated with the Sunday service improvement is provided after the explanation. Formula: r2=r1*(((f1+f2)+-e*(f2-f1))/((f1+f2)- -e*(f2-f1))) r2 = projected ridership r1 = current ridership f1 = current frequency f2 = planned frequency e= .15 New Rider Calculations – Sunday Headway Change
Improved Headway - Sunday
Total Ridership Affected (Sunday Boardings) 898
Saturday 6:00 AM to 7:00 PM
Current Frequency (F1)
60
Planned Frequency (F2) 30
e -0.15
New Daily Riders 95
New Projected Total Boardings (R2) 993
All Service
REX Line Service Evaluation Study
REX Line Service Evaluation 35 Final Recommendations
Appendix 2 Calculation of Layover as Percentage of Total Revenue Run Time

REX Line Service Evaluation Study
REX Line Service Evaluation 36 Final Recommendations
Weekday Layover Percentages – With and Without REX Line Extension
Block Start Terminal
Trip Start Time
Trip End Time
End Terminal
Revenue Run Time
Layover Time
Current Round Trip
Revenue Time
(Minutes) Layover
Time
Current Layover
Time as % of Revenue
Time Current
Cycle time
Additional Revenue
Time From Extension
New Revenue
Time - Extension
Remaining Layover With No Schedule Change
New Layover as % of New Revenue
Time Round Trip Time Period
SR-05 King Street 5:35 AM 6:21 AM Fort Belvoir 0:46 0:08 96 24 25.00% 120 8 104 16 15.38% AM Peak
Fort Belvoir 6:29 AM 7:19 AM King Street 0:50 0:16
King Street 7:35 AM
King Street 10:00 AM 10:51 AM Fort Belvoir 0:51 0:09 103 17 16.50% 120 8 111 9 8.11% Mid-Day
Fort Belvoir 11:00 AM 11:52 AM King Street 0:52 0:08
King Street 12:00 PM
SR-01 Fort Belvoir 5:00 AM 5:44 AM King Street 0:44 0:06 90 19 21.11% 109 8 98 11 11.22% AM Peak
King Street 5:50 AM 6:36 AM Fort Belvoir 0:46 0:13
Fort Belvoir 6:49 AM
Fort Belvoir 9:20 AM 10:09 AM King Street 0:49 0:21 100 30 30.00% 130 8 108 22 20.37% Mid-Day
King Street 10:30 AM 11:21 AM Fort Belvoir 0:51 0:09
Fort Belvoir 11:30 AM
SR-09 King Street 6:05 AM 6:51 AM Fort Belvoir 0:46 0:09 99 21 21.21% 120 8 107 13 12.15% AM Peak
Fort Belvoir 7:00 AM 7:53 AM King Street 0:53 0:12
King Street 8:05 AM
SR-03 Fort Belvoir 5:30 AM 6:14 AM King Street 0:44 0:06 90 12 13.33% 102 8 98 4 4.08% AM Peak
King Street 6:20 AM 7:06 AM Fort Belvoir 0:46 0:06
Fort Belvoir 7:12 AM
SR04 Fort Belvoir 5:45 AM 6:29 AM King Street 0:44 0:06 95 16 16.84% 111 8 103 8 7.77% AM Peak
King Street 6:35 AM 7:26 AM Fort Belvoir 0:51 0:10
Fort Belvoir 7:36 AM
Fort Belvoir 10:00 AM 10:49 AM King Street 0:49 0:11 100 20 20.00% 120 8 108 12 11.11% Mid-Day
King Street 11:00 AM 11:51 AM Fort Belvoir 0:51 0:09
Fort Belvoir 12:00 PM
REX Line Service Evaluation Study
REX Line Service Evaluation 37 Final Recommendations
Block Start Terminal
Trip Start Time
Trip End Time
End Terminal
Revenue Run Time
Layover Time
Current Round Trip
Revenue Time
(Minutes) Layover
Time
Current Layover
Time as % of Revenue
Time Current
Cycle time
Additional Revenue
Time From Extension
New Revenue
Time - Extension
Remaining Layover With No Schedule Change
New Layover as % of New Revenue
Time Round Trip Time Period
SR06 Fort Belvoir 5:57 AM 6:41 AM King Street 0:44 0:09 95 16 16.84% 111 8 103 8 7.77% AM Peak
King Street 6:50 AM 7:41 AM Fort Belvoir 0:51 0:07
Fort Belvoir 7:48 AM
SR07 Fort Belvoir 6:09 AM 6:59 AM King Street 0:50 0:06 101 10 9.90% 111 8 109 2 1.83% AM Peak
King Street 7:05 AM 7:56 AM Fort Belvoir 0:51 0:04
Fort Belvoir 8:00 AM
SR07 Fort Belvoir 10:30 AM 11:19 AM King Street 0:49 0:11 100 20 20.00% 120 8 108 12 11.11% Mid-Day
King Street 11:30 AM 12:21 PM Fort Belvoir 0:51 0:09
Fort Belvoir 12:30 PM
SR08 Fort Belvoir 6:19 AM 7:09 AM King Street 0:50 0:11 101 15 14.85% 116 8 109 7 6.42% AM Peak
King Street 7:20 AM 8:11 AM Fort Belvoir 0:51 0:04
Fort Belvoir 8:15 AM
SR10 Fort Belvoir 7:24 AM 8:17 AM King Street 0:53 0:23 105 31 29.52% 136 8 113 23 20.35% AM peak
King Street 8:40 AM 9:32 AM Fort Belvoir 0:52 0:08
Fort Belvoir 9:40 AM
SR15 King Street 12:30 PM 1:21 PM Fort Belvoir 0:51 0:09 103 27 26.21% 130 8 111 19 17.12% Mid-Day
Fort Belvoir 1:30 PM 2:22 PM King Street 0:52 0:18
King Street 2:40 PM
King Street 5:12 PM 6:05 PM Fort Belvoir 0:53 0:10 108 15 13.89% 123 8 116 7 6.03% PM Peak
Fort Belvoir 6:15 PM 7:10 PM King Street 0:55 0:05
King Street 7:15 PM

REX Line Service Evaluation Study
REX Line Service Evaluation 38 Final Recommendations
Block Start Terminal
Trip Start Time
Trip End Time
End Terminal
Revenue Run Time
Layover Time
Current Round Trip
Revenue Time
(Minutes) Layover
Time
Current Layover
Time as % of Revenue
Time Current
Cycle time
Additional Revenue
Time From Extension
New Revenue
Time - Extension
Remaining Layover With No Schedule Change
New Layover as % of New Revenue
Time Round Trip Time Period
SR20 King Street 1:00 PM 1:51 PM Fort Belvoir 0:51 0:09 103 17 16.50% 120 8 111 9 8.11% Mid-Day
Fort Belvoir 2:00 PM 2:52 PM King Street 0:52 0:08
King Street 3:00 PM
Fort Belvoir 2:00 PM 2:52 PM King Street 0:52 0:08 107 13 12.15% 120 8 115 5 4.35%
Mid-Day/PM
Peak
King Street 3:00 PM 3:55 PM Fort Belvoir 0:55 0:05
Fort Belvoir 4:00 PM
King Street 5:24 PM 6:17 PM Fort Belvoir 0:53 0:13 108 33 30.56% 141 8 116 25 21.55% PM Peak
Fort Belvoir 6:30 PM 7:25 PM King Street 0:55 0:20
King Street 7:45 PM
SR21 King Street 1:20 PM 2:11 PM Fort Belvoir 0:51 0:09 103 27 26.21% 130 8 111 19 17.12%
Mid-Day/PM
Peak
Fort Belvoir 2:20 PM 3:12 PM King Street 0:52 0:18
King Street 3:30 PM
Fort Belvoir 2:20 PM 3:12 PM King Street 0:52 0:18 107 23 21.50% 130 8 115 15 13.04%
Mid-Day/PM
Peak
King Street 3:30 PM 4:25 PM Fort Belvoir 0:55 0:05
Fort Belvoir 4:30 PM
SR22 King Street 1:40 PM 2:35 PM Fort Belvoir 0:55 0:05 107 18 16.82% 125 8 115 10 8.70%
Mid-Day/PM
Peak
Fort Belvoir 2:40 PM 3:32 PM King Street 0:52 0:13
King Street 3:45 PM

REX Line Service Evaluation Study
REX Line Service Evaluation 39 Final Recommendations
Block Start Terminal
Trip Start Time
Trip End Time
End Terminal
Revenue Run Time
Layover Time
Current Round Trip
Revenue Time
(Minutes) Layover
Time
Current Layover
Time as % of Revenue
Time Current
Cycle time
Additional Revenue
Time From Extension
New Revenue
Time - Extension
Remaining Layover With No Schedule Change
New Layover as % of New Revenue
Time Round Trip Time Period
SR22 Fort Belvoir 2:40 PM 3:32 PM King Street 0:52 0:13 107 18 16.82% 125 8 115 10 8.70% Mid-Day/PM
Peak
King Street 3:45 PM 4:40 PM Fort Belvoir 0:55 0:05
Fort Belvoir 4:45 PM
King Street 6:30 PM 7:23 PM Fort Belvoir 0:53 0:17 107 25 23.36% 132 8 115 17 14.78% PM
Peak/Evening
Fort Belvoir 7:40 PM 8:32 PM King Street 0:52 0:08
King Street 8:40 PM
SR 23 King Street 2:00 PM 2:55 PM Fort Belvoir 0:55 0:05 114 18 15.79% 132 8 122 10 8.20% Mid-Day/PM
Peak
Fort Belvoir 3:00 PM 3:59 PM King Street 0:59 0:13
King Street 4:12 PM
SR 23 Fort Belvoir 3:00 PM 3:59 PM King Street 0:59 0:13 114 21 18.42% 135 8 122 13 10.66% PM Peak
King Street 4:12 PM 5:07 PM Fort Belvoir 0:55 0:08
Fort Belvoir 5:15 PM
SR24 King Street 2:20 PM 3:15 PM Fort Belvoir 0:55 0:15 114 34 29.82% 148 8 122 26 21.31% Mid-Day/PM
Peak
Fort Belvoir 3:30 PM 4:29 PM King Street 0:59 0:19
King Street 4:48 PM
SR26 King Street 3:15 PM 4:10 PM Fort Belvoir 0:55 0:05 117 24 20.51% 141 8 125 16 12.80% PM Peak
Fort Belvoir 4:15 PM 5:17 PM King Street 1:02 0:19
King Street 5:36 PM
Fort Belvoir 4:15 PM 5:17 PM King Street 1:02 0:19 115 35 30.43% 150 8 123 27 21.95% Mid-Day/PM
Peak
King Street 5:36 PM 6:29 PM Fort Belvoir 0:53 0:16
Fort Belvoir 6:45 PM
King Street 8:00 PM 8:47 PM Fort Belvoir 0:47 0:13 99 21 21.21% 120 8 107 13 12.15% Evening
Fort Belvoir 9:00 PM 9:52 PM King Street 0:52 0:08
King Street 10:00 PM

REX Line Service Evaluation Study
REX Line Service Evaluation 40 Final Recommendations
Block Start Terminal
Trip Start Time
Trip End Time
End Terminal
Revenue Run Time
Layover Time
Current Round Trip
Revenue Time
(Minutes) Layover
Time
Current Layover
Time as % of Revenue
Time Current
Cycle time
Additional Revenue
Time From Extension
New Revenue
Time - Extension
Remaining Layover With No Schedule Change
New Layover as % of New Revenue
Time Round Trip Time Period
SR 26 Fort Belvoir 9:00 PM 9:52 PM King Street 0:52 0:08 99 15 15.15% 114 8 107 7 6.54% Evening
King Street 10:00 PM 10:47 PM Fort Belvoir 0:47 0:07
Fort Belvoir 10:54 PM
SR27 King Street 4:00 PM 4:55 PM Fort Belvoir 0:55 0:05 117 18 15.38% 135 8 125 10 8.00% PM Peak
Fort Belvoir 5:00 PM 6:02 PM King Street 1:02 0:13
King Street 6:15 PM
Fort Belvoir 5:00 PM 6:02 PM King Street 1:02 0:13 115 25 21.74% 140 8 123 17 13.82% PM
Peak/Evening
King Street 6:15 PM 7:08 PM Fort Belvoir 0:53 0:12
Fort Belvoir 7:20 PM
SR28 King Street 4:36 PM 5:31 PM Fort Belvoir 0:55 0:14 110 19 17.27% 129 8 118 11 9.32% PM Peak
Fort Belvoir 5:45 PM 6:40 PM King Street 0:55 0:05
King Street 6:45 PM
SR29 King Street 7:30 PM 8:23 PM Fort Belvoir 0:53 0:07 105 15 14.29% 120 8 113 7 6.19% Evening
Fort Belvoir 8:30 PM 9:22 PM King Street 0:52 0:08
King Street 9:30 PM
Fort Belvoir 8:30 PM 9:22 PM King Street 0:52 0:08 99 21 21.21% 120 8 107 13 12.15% Evening
King Street 9:30 PM 10:17 PM Fort Belvoir 0:47 0:13
Fort Belvoir 10:30 PM
SR25 Fort Belvoir 3:15 PM 4:14 PM King Street 0:59 0:10 114 21 18.42% 135 8 122 13 10.66% PM Peak
King Street 4:24 PM 5:19 PM Fort Belvoir 0:55 0:11
Fort Belvoir 5:30 PM
King Street 7:00 PM 7:53 PM Fort Belvoir 0:53 0:07 105 15 14.29% 120 8 113 7 6.19% Evening
Fort Belvoir 8:00 PM 8:52 PM King Street 0:52 0:08
King Street 9:00 PM 9:47 PM Fort Belvoir
Fort Belvoir 8:00 PM 8:52 PM King Street 0:52 0:08 99 21 21.21% 120 8 107 13 12.15% Evening
King Street 9:00 PM 9:47 PM Fort Belvoir 0:47 0:13
Fort Belvoir 10:00 PM 10:46 PM King Street

REX Line Service Evaluation Study
REX Line Service Evaluation 41 Final Recommendations
Saturday Layover Percentages – With and Without REX Line Extension
Block Start Terminal Trip Start
Time Trip End Time End Terminal Revenue Run
Time Layover Time
Current Round Trip
Revenue Time (Minutes) Layover Time
Current Layover Time
as % of Revenue Time
Current Cycle time
Additional Revenue Time
From Extension
New Revenue Time -
Extension
Remaining Layover With No Schedule
Change
New Layover as % of New
Revenue Time
SR04 King Street 5:30 AM 6:14 AM Fort Belvoir 0:44 0:16 82 38 46.34% 120 8 90 30 33.33%
Fort Belvoir 6:30 AM 7:08 AM King Street 0:38 0:22
King Street 7:30 AM
Fort Belvoir 6:30 AM 7:08 AM King Street 0:38 0:22 84 36 42.86% 120 8 92 28 30.43%
King Street 7:30 AM 8:16 AM Fort Belvoir 0:46 0:14
Fort Belvoir 8:30 AM
King Street 10:00 AM 10:51 AM Fort Belvoir 0:51 0:09 104 16 15.38% 120 8 112 8 7.14%
Fort Belvoir 11:00 AM 11:53 AM King Street 0:53 0:07
King Street 12:00 PM
SR01 Fort Belvoir 5:00 AM 5:38 AM King Street 0:38 0:22 82 38 46.34% 120 8 90 30 33.33%
King Street 6:00 AM 6:44 AM Fort Belvoir 0:44 0:16
Fort Belvoir 7:00 AM
King Street 6:00 AM 6:44 AM Fort Belvoir 0:44 0:16 92 28 30.43% 120 8 100 20 20.00%
Fort Belvoir 7:00 AM 7:48 AM King Street 0:48 0:12
King Street 8:00 AM
Fort Belvoir 7:00 AM 7:48 AM King Street 0:48 0:12 94 26 27.66% 120 8 102 18 17.65%
King Street 8:00 AM 8:46 AM Fort Belvoir 0:46 0:14
Fort Belvoir 9:00 AM

REX Line Service Evaluation Study
REX Line Service Evaluation 42 Final Recommendations
Block Start Terminal Trip Start
Time Trip End Time End Terminal Revenue Run
Time Layover Time
Current Round Trip
Revenue Time (Minutes) Layover Time
Current Layover Time
as % of Revenue Time
Current Cycle time
Additional Revenue
Time From Extension
New Revenue Time -
Extension
Remaining Layover With No Schedule
Change
New Layover as % of New
Revenue Time
SR02 Fort Belvoir 5:30 AM 6:08 AM King Street 0:38 0:22 82 38 46.34% 120 8 90 30 33.33%
King Street 6:30 AM 7:14 AM Fort Belvoir 0:44 0:16
Fort Belvoir 7:30 AM
King Street 6:30 AM 7:14 AM Fort Belvoir 0:44 0:16 92 28 30.43% 120 8 100 20 20.00%
Fort Belvoir 7:30 AM 8:18 AM King Street 0:48 0:12
King Street 8:30 AM
Fort Belvoir 7:30 AM 8:18 AM King Street 0:48 0:12 94 26 27.66% 120 8 102 18 17.65%
King Street 8:30 AM 9:16 AM Fort Belvoir 0:46 0:14
Fort Belvoir 9:30 AM
SR03 Fort Belvoir 6:00 AM 6:38 AM King Street 0:38 0:22 82 38 46.34% 120 8 90 30 33.33%
King Street 7:00 AM 7:44 AM Fort Belvoir 0:44 0:16
Fort Belvoir 8:00 AM
King Street 7:00 AM 7:44 AM Fort Belvoir 0:44 0:16 92 28 30.43% 120 8 100 20 20.00%
Fort Belvoir 8:00 AM 8:48 AM King Street 0:48 0:12
King Street 9:00 AM
Fort Belvoir 8:00 AM 8:48 AM King Street 0:48 0:12 99 21 21.21% 120 8 107 13 12.15%
King Street 9:00 AM 9:51 AM Fort Belvoir 0:51 0:09
Fort Belvoir 10:00 AM
SR10 King Street 3:30 PM 4:21 PM Fort Belvoir 0:51 0:09 100 50 50.00% 150 8 108 42 38.89%
Fort Belvoir 4:30 PM 5:19 PM King Street 0:49 0:41
King Street 6:00 PM
Fort Belvoir 4:30 PM 5:19 PM King Street 0:49 0:41 100 50 50.00% 150 8 108 42 38.89%
King Street 6:00 PM 6:51 PM Fort Belvoir 0:51 0:09
Fort Belvoir 7:00 PM
SR11 King Street 1:30 PM 2:27 PM Fort Belvoir 0:57 0:03 113 37 32.74% 150 8 121 29 23.97%
Fort Belvoir 2:30 PM 3:26 PM King Street 0:56 0:34
King Street 4:00 PM

REX Line Service Evaluation Study
REX Line Service Evaluation 43 Final Recommendations
Block Start Terminal Trip Start
Time Trip End Time End Terminal Revenue Run
Time Layover Time
Current Round Trip
Revenue Time (Minutes) Layover Time
Current Layover Time
as % of Revenue Time
Current Cycle time
Additional Revenue
Time From Extension
New Revenue Time -
Extension
Remaining Layover With No Schedule
Change
New Layover as % of New
Revenue Time
SR11 Fort Belvoir 2:30 PM 3:26 PM King Street 0:56 0:34 107 43 40.19% 150 8 115 35 30.43%
King Street 4:00 PM 4:51 PM Fort Belvoir 0:51 0:09
Fort Belvoir 5:00 PM
King Street 4:00 PM 4:51 PM Fort Belvoir 0:51 0:09 96 54 56.25% 150 8 104 46 44.23%
Fort Belvoir 5:00 PM 5:45 PM King Street 0:45 0:45
King Street 6:30 PM
Fort Belvoir 7:30 PM 8:15 PM King Street 0:45 0:15 91 29 31.87% 120 8 99 21 21.21%
King Street 8:30 PM 9:16 PM Fort Belvoir 0:46 0:14
Fort Belvoir 9:30 PM
SR12 King Street 2:00 PM 2:57 PM Fort Belvoir 0:57 0:03 113 37 32.74% 150 8 121 29 23.97%
Fort Belvoir 3:00 PM 3:56 PM King Street 0:56 0:34
King Street 4:30 PM
Fort Belvoir 3:00 PM 3:56 PM King Street 0:56 0:34 107 43 40.19% 150 8 115 35 30.43%
King Street 4:30 PM 5:21 PM Fort Belvoir 0:51 0:09
Fort Belvoir 5:30 PM
King Street 7:00 PM 7:46 PM Fort Belvoir 0:46 0:14 91 29 31.87% 120 8 99 21 21.21%
Fort Belvoir 8:00 PM 8:45 PM King Street 0:45 0:15
King Street 9:00 PM
Fort Belvoir 8:00 PM 8:45 PM King Street 0:45 0:15 91 29 31.87% 120 8 99 21 21.21%
King Street 9:00 PM 9:46 PM Fort Belvoir 0:46 0:14
Fort Belvoir 10:00 PM
SR13 King Street 2:30 PM 3:27 PM Fort Belvoir 0:57 0:03 106 44 41.51% 150 8 114 36 31.58%
Fort Belvoir 3:30 PM 4:19 PM King Street 0:49 0:41
King Street 5:00 PM
Fort Belvoir 3:30 PM 4:19 PM King Street 0:49 0:41 100 50 50.00% 150 8 108 42 38.89%
King Street 5:00 PM 5:51 PM Fort Belvoir 0:51 0:09
Fort Belvoir 6:00 PM

REX Line Service Evaluation Study
REX Line Service Evaluation 44 Final Recommendations
Block Start Terminal Trip Start
Time Trip End Time End Terminal Revenue Run
Time Layover Time
Current Round Trip
Revenue Time (Minutes) Layover Time
Current Layover Time
as % of Revenue Time
Current Cycle time
Additional Revenue
Time From Extension
New Revenue Time -
Extension
Remaining Layover With No Schedule
Change
New Layover as % of New
Revenue Time
SR13 King Street 7:30 PM 8:16 PM Fort Belvoir 0:46 0:14 91 29 31.87% 120 8 99 21 21.21%
Fort Belvoir 8:30 PM 9:15 PM King Street 0:45 0:15
King Street 9:30 PM
SR14 King Street 3:00 PM 3:57 PM Fort Belvoir 0:57 0:03 106 44 41.51% 150 8 114 36 31.58%
Fort Belvoir 4:00 PM 4:49 PM King Street 0:49 0:41
King Street 5:30 PM
Fort Belvoir 4:00 PM 4:49 PM King Street 0:49 0:41 100 50 50.00% 150 8 108 42 38.89%
King Street 5:30 PM 6:21 PM Fort Belvoir 0:51 0:09
Fort Belvoir 6:30 PM
King Street 8:00 PM 8:46 PM Fort Belvoir 0:46 0:14 91 29 31.87% 120 8 99 21 21.21%
Fort Belvoir 9:00 PM 9:45 PM King Street 0:45 0:15
King Street 10:00 PM

REX Line Service Evaluation Study
REX Line Service Evaluation 45 Final Recommendations
Sunday Layover Percentages – With and Without REX Line Extension
Block Start Terminal
Trip Start Time
Trip End Time
End Terminal
Revenue Run Time
Layover Time
Current Round Trip
Revenue Time
(Minutes) Layover
Time
Current Layover
Time as % of Revenue
Time Current
Cycle time
Additional Revenue
Time From Extension
New Revenue
Time - Extension
Remaining Layover With No Schedule Change
New Layover as % of New Revenue
Time
SR01 Fort Belvoir 5:00 AM 5:40 AM King Street 0:40 0:20 80 40 50.00% 120 8 88 32 36.36%
King Street 6:00 AM 6:40 AM Fort Belvoir 0:40 0:20
Fort Belvoir 7:00 AM
King Street 6:00 AM 6:40 AM Fort Belvoir 0:40 0:20 80 40 50.00% 120 8 88 32 36.36%
Fort Belvoir 7:00 AM 7:40 AM King Street 0:40 0:20
King Street 8:00 AM
Fort Belvoir 7:00 AM 7:40 AM King Street 0:40 0:20 80 40 50.00% 120 8 88 32 36.36%
King Street 8:00 AM 8:40 AM Fort Belvoir 0:40 0:20
Fort Belvoir 9:00 AM
King Street 8:00 AM 8:40 AM Fort Belvoir 0:40 0:20 85 35 41.18% 120 8 93 27 29.03%
Fort Belvoir 9:00 AM 9:45 AM King Street 0:45 0:15
King Street 10:00 AM 10:48 AM Fort Belvoir
Fort Belvoir 9:00 AM 9:45 AM King Street 0:45 0:15 93 27 29.03% 120 8 101 19 18.81%
King Street 10:00 AM 10:48 AM Fort Belvoir 0:48 0:12
Fort Belvoir 11:00 AM
SRO2 Fort Belvoir 6:00 AM 6:40 AM King Street 0:40 0:20 80 40 50.00% 120 8 88 32 36.36%
King Street 7:00 AM 7:40 AM Fort Belvoir 0:40 0:20
Fort Belvoir 8:00 AM
King Street 7:00 AM 7:40 AM Fort Belvoir 0:40 0:20 80 40 50.00% 120 8 88 32 36.36%
Fort Belvoir 8:00 AM 8:40 AM King Street 0:40 0:20
King Street 9:00 AM
Fort Belvoir 8:00 AM 8:40 AM King Street 0:40 0:20 80 40 50.00% 120 8 88 32 36.36%
King Street 9:00 AM 9:40 AM Fort Belvoir 0:40 0:20
Fort Belvoir 10:00 AM
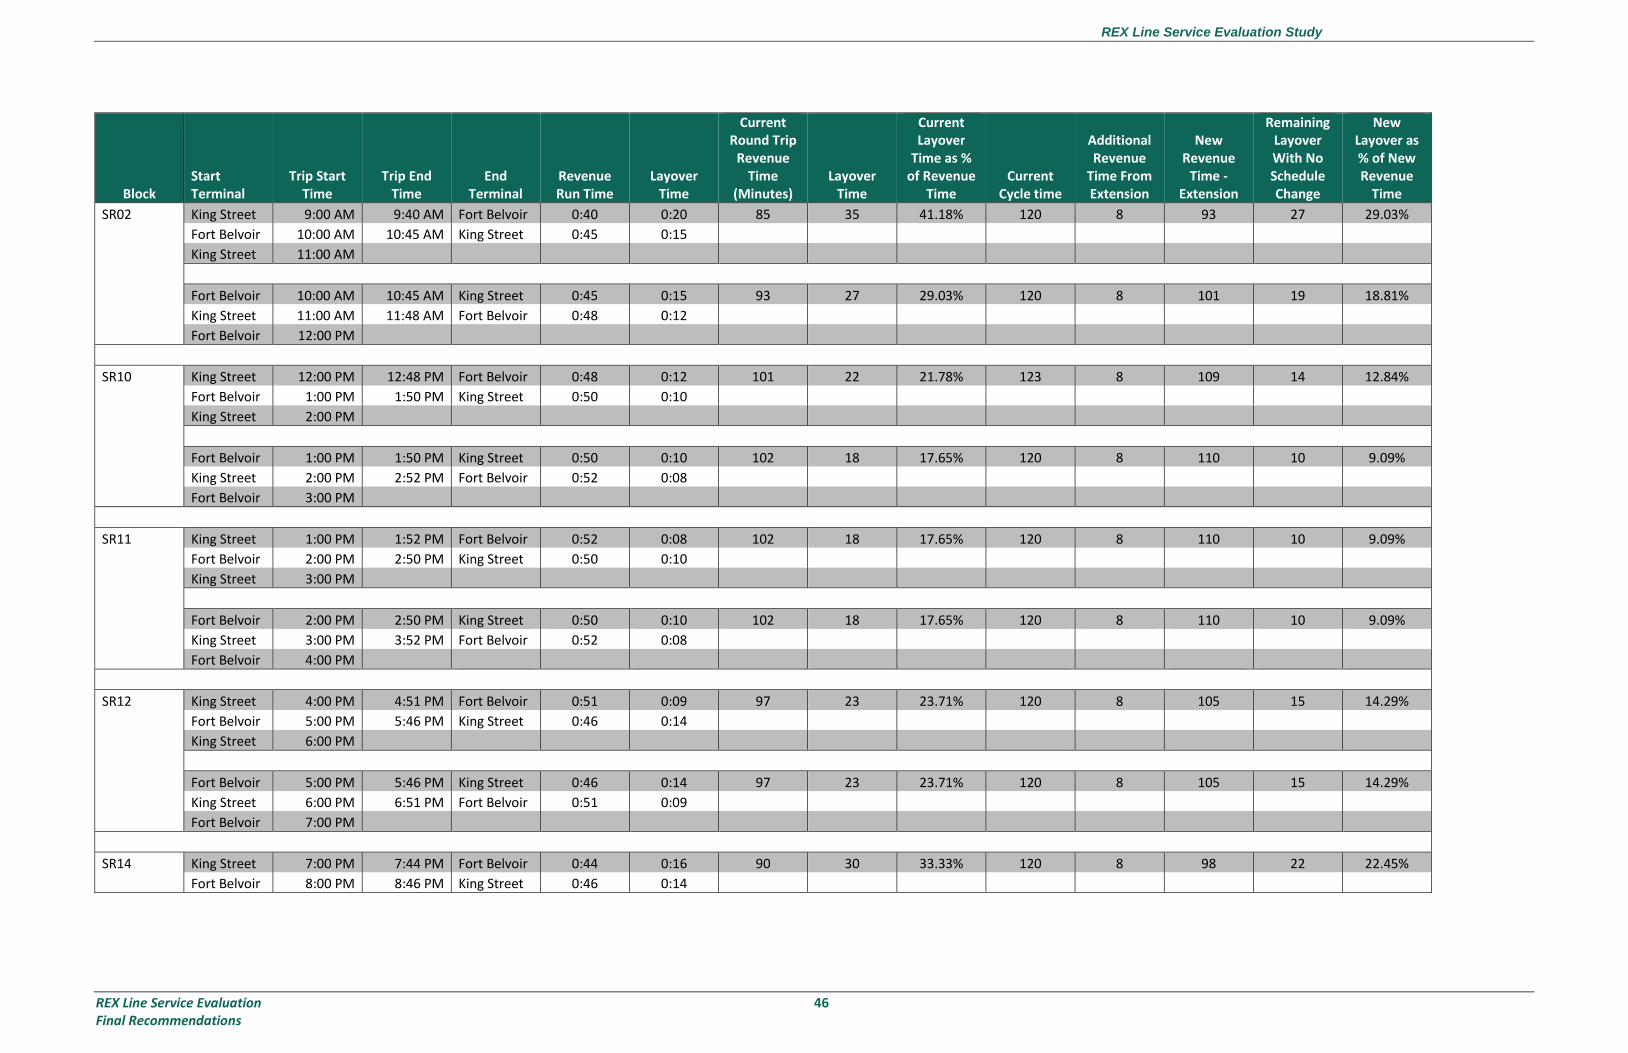
REX Line Service Evaluation Study
REX Line Service Evaluation 46 Final Recommendations
Block Start Terminal
Trip Start Time
Trip End Time
End Terminal
Revenue Run Time
Layover Time
Current Round Trip
Revenue Time
(Minutes) Layover
Time
Current Layover
Time as % of Revenue
Time Current
Cycle time
Additional Revenue
Time From Extension
New Revenue
Time - Extension
Remaining Layover With No Schedule Change
New Layover as % of New Revenue
Time
SR02 King Street 9:00 AM 9:40 AM Fort Belvoir 0:40 0:20 85 35 41.18% 120 8 93 27 29.03%
Fort Belvoir 10:00 AM 10:45 AM King Street 0:45 0:15
King Street 11:00 AM
Fort Belvoir 10:00 AM 10:45 AM King Street 0:45 0:15 93 27 29.03% 120 8 101 19 18.81%
King Street 11:00 AM 11:48 AM Fort Belvoir 0:48 0:12
Fort Belvoir 12:00 PM
SR10 King Street 12:00 PM 12:48 PM Fort Belvoir 0:48 0:12 101 22 21.78% 123 8 109 14 12.84%
Fort Belvoir 1:00 PM 1:50 PM King Street 0:50 0:10
King Street 2:00 PM
Fort Belvoir 1:00 PM 1:50 PM King Street 0:50 0:10 102 18 17.65% 120 8 110 10 9.09%
King Street 2:00 PM 2:52 PM Fort Belvoir 0:52 0:08
Fort Belvoir 3:00 PM
SR11 King Street 1:00 PM 1:52 PM Fort Belvoir 0:52 0:08 102 18 17.65% 120 8 110 10 9.09%
Fort Belvoir 2:00 PM 2:50 PM King Street 0:50 0:10
King Street 3:00 PM
Fort Belvoir 2:00 PM 2:50 PM King Street 0:50 0:10 102 18 17.65% 120 8 110 10 9.09%
King Street 3:00 PM 3:52 PM Fort Belvoir 0:52 0:08
Fort Belvoir 4:00 PM
SR12 King Street 4:00 PM 4:51 PM Fort Belvoir 0:51 0:09 97 23 23.71% 120 8 105 15 14.29%
Fort Belvoir 5:00 PM 5:46 PM King Street 0:46 0:14
King Street 6:00 PM
Fort Belvoir 5:00 PM 5:46 PM King Street 0:46 0:14 97 23 23.71% 120 8 105 15 14.29%
King Street 6:00 PM 6:51 PM Fort Belvoir 0:51 0:09
Fort Belvoir 7:00 PM
SR14 King Street 7:00 PM 7:44 PM Fort Belvoir 0:44 0:16 90 30 33.33% 120 8 98 22 22.45%
Fort Belvoir 8:00 PM 8:46 PM King Street 0:46 0:14
REX Line Service Evaluation Study
REX Line Service Evaluation 47 Final Recommendations
Appendix 3 Actual vs. Scheduled Run Time Comparison

REX Line Service Evaluation Study
REX Line Service Evaluation 48 Final Recommendations
Weekday Northbound Actual vs. Scheduled Run Time Comparison
Weekday Northbound
Actual Run Time vs. Scheduled Run Time
Trip Start Scheduled Run Time
Actual Run Time Difference
% Difference
5:00 AM 44 47.6 3.6 8.18%
5:15 AM 44 43.6 -0.4 -0.91%
5:30 AM 44 44.4 0.4 0.91%
5:45 AM 44 45.2 1.2 2.73%
5:57 AM 44 44.9 0.9 2.05%
6:09 AM 50 46.7 -3.3 -6.60%
6:19 AM 50 48.1 -1.9 -3.80%
6:29 AM 50 47.5 -2.5 -5.00%
6:39 AM 50 48.3 -1.7 -3.40%
6:49 AM 50 54.3 4.3 8.60%
7:00 AM 53 50.7 -2.3 -4.34%
7:12 AM 53 49.1 -3.9 -7.36%
7:24 AM 53 52.7 -0.3 -0.57%
7:36 AM 53 52.5 -0.5 -0.94%
7:48 AM 53 48.6 -4.4 -8.30%
8:00 AM 53 49.1 -3.9 -7.36%
8:15 AM 53 50.6 -2.4 -4.53%
8:30 AM 53 49 -4 -7.55%
8:45 AM 49 47.1 -1.9 -3.88%
9:00 AM 49 46.2 -2.8 -5.71%
9:20 AM 49 51.4 2.4 4.90%
9:40 AM 49 48.3 -0.7 -1.43%
10:00 AM 49 48.6 -0.4 -0.82%
10:30 AM 49 45.3 -3.7 -7.55%
11:00 AM 52 51.3 -0.7 -1.35%
11:30 AM 52 55.9 3.9 7.50%
12:00 PM 52 48.2 -3.8 -7.31%
12:30 PM 52 53.6 1.6 3.08%
1:00 PM 52 50.8 -1.2 -2.31%
2:00 PM 52 49.4 -2.6 -5.00%
2:20 PM 52 53 1 1.92%
2:40 PM 52 51.2 -0.8 -1.54%
3:00 PM 59 53.1 -5.9 -10.00%
3:15 PM 59 58.3 -0.7 -1.19%
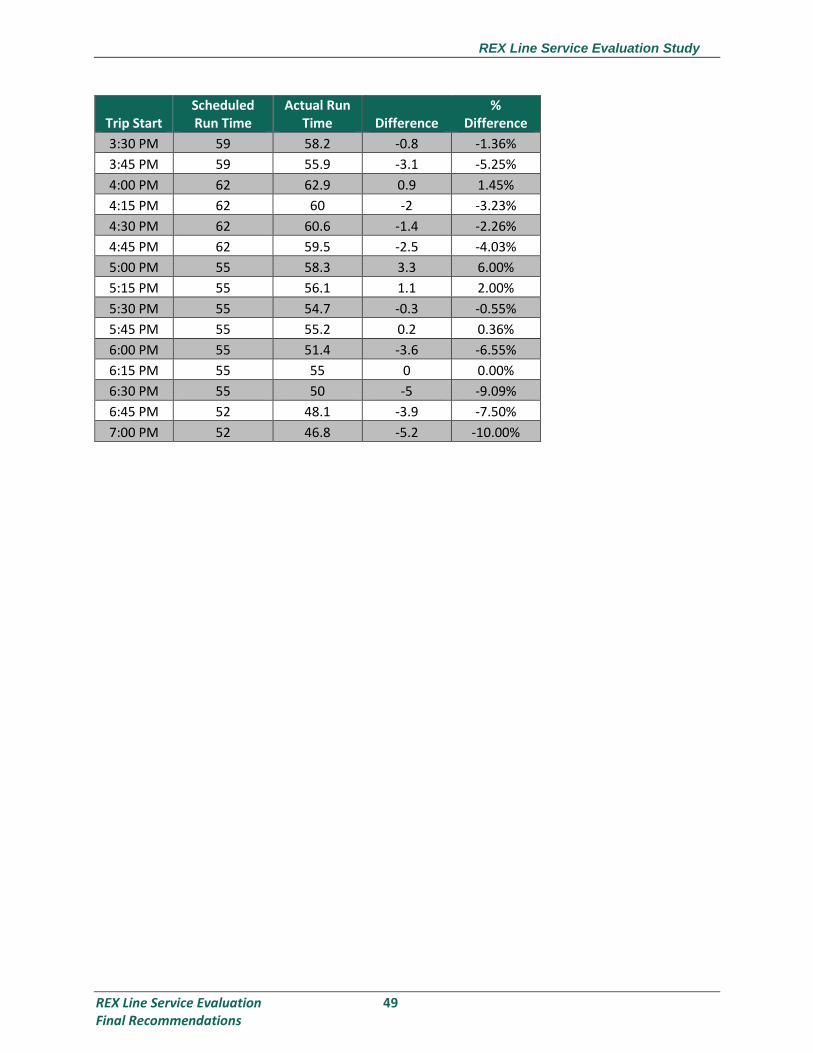
REX Line Service Evaluation Study
REX Line Service Evaluation 49 Final Recommendations
Trip Start Scheduled Run Time
Actual Run Time Difference
% Difference
3:30 PM 59 58.2 -0.8 -1.36%
3:45 PM 59 55.9 -3.1 -5.25%
4:00 PM 62 62.9 0.9 1.45%
4:15 PM 62 60 -2 -3.23%
4:30 PM 62 60.6 -1.4 -2.26%
4:45 PM 62 59.5 -2.5 -4.03%
5:00 PM 55 58.3 3.3 6.00%
5:15 PM 55 56.1 1.1 2.00%
5:30 PM 55 54.7 -0.3 -0.55%
5:45 PM 55 55.2 0.2 0.36%
6:00 PM 55 51.4 -3.6 -6.55%
6:15 PM 55 55 0 0.00%
6:30 PM 55 50 -5 -9.09%
6:45 PM 52 48.1 -3.9 -7.50%
7:00 PM 52 46.8 -5.2 -10.00%

REX Line Service Evaluation Study
REX Line Service Evaluation 50 Final Recommendations
Weekday Southbound Actual vs. Scheduled Run Time Comparison
Weekday Southbound
Actual Run Time vs. Scheduled Run Time
Trip Start Schedule Actual Difference %
Difference
5:35 AM 46 44 -2 -4.35%
5:50 AM 46 50.1 4.1 8.91%
6:05 AM 46 49.1 3.1 6.74%
6:20 AM 46 53.5 7.5 16.30%
6:35 AM 51 52.8 1.8 3.53%
6:50 AM 51 53.9 2.9 5.69%
7:05 AM 51 50.8 -0.2 -0.39%
7:20 AM 51 55.5 4.5 8.82%
7:35 AM 51 50.1 -0.9 -1.76%
7:50 AM 51 50.2 -0.8 -1.57%
8:05 AM 52 51.2 -0.8 -1.54%
8:20 AM 52 56.9 4.9 9.42%
8:40 AM 52 51.3 -0.7 -1.35%
9:00 AM 52 52 0 0.00%
9:30 AM 51 50.4 -0.6 -1.18%
10:00 AM 51 52.9 1.9 3.73%
10:30 AM 51 54.5 3.5 6.86%
11:00 AM 51 52.4 1.4 2.75%
11:30 AM 51 51.8 0.8 1.57%
12:00 PM 51 52.7 1.7 3.33%
12:30 PM 51 54.2 3.2 6.27%
1:00 PM 51 55.8 4.8 9.41%
1:20 PM 51 54.1 3.1 6.08%
1:40 PM 55 53.4 -1.6 -2.91%
2:00 PM 55 54.1 -0.9 -1.64%
2:20 PM 55 59.7 4.7 8.55%
2:40 PM 55 55.5 0.5 0.91%
3:00 PM 55 55.8 0.8 1.45%
3:15 PM 55 55.2 0.2 0.36%
3:30 PM 55 56 1 1.82%
3:45 PM 55 53.1 -1.9 -3.45%
4:00 PM 55 54.5 -0.5 -0.91%
4:12 PM 55 54.1 -0.9 -1.64%
4:24 PM 55 57.5 2.5 4.55%
4:36 PM 55 58.3 3.3 6.00%

REX Line Service Evaluation Study
REX Line Service Evaluation 51 Final Recommendations
Trip Start Schedule Actual Difference %
Difference
4:48 PM 53 61.8 8.8 16.60%
5:00 PM 53 54.5 1.5 2.83%
5:12 PM 53 55.5 2.5 4.72%
5:24 PM 53 59 6 11.32%
5:36 PM 53 55.1 2.1 3.96%
5:48 PM 53 54.9 1.9 3.58%
6:00 PM 53 55.2 2.2 4.15%
6:15 PM 53 54.9 1.9 3.58%
6:30 PM 53 54.8 1.8 3.40%
6:45 PM 53 53.7 0.7 1.32%
7:00 PM 53 50.8 -2.2 -4.15%

REX Line Service Evaluation Study
REX Line Service Evaluation 52 Final Recommendations
Saturday Northbound Actual vs. Scheduled Run Time Comparison
Saturday Northbound
Actual Run Time vs. Scheduled Run Time
Trip Start Scheduled Run Time
Actual Run Time Difference
% Difference
5:00 38 37.9 -0.1 -0.26%
5:30 38 42.4 4.4 11.58%
6:00 38 41.1 3.1 8.16%
6:30 38 40.7 2.7 7.11%
7:00 48 46 -2 -4.17%
7:30 48 46.3 -1.7 -3.54%
8:00 48 46.1 -1.9 -3.96%
8:30 48 42.9 -5.1 -10.63%
9:00 48 48 0 0.00%
9:30 53 51.2 -1.8 -3.40%
10:00 53 51.9 -1.1 -2.08%
10:30 53 53.9 0.9 1.70%
11:00 53 48.6 -4.4 -8.30%
11:30 53 52.5 -0.5 -0.94%
12:00 53 55.1 2.1 3.96%
12:30 56 53.3 -2.7 -4.82%
13:00 56 51 -5 -8.93%
13:30 56 47.7 -8.3 -14.82%
14:00 56 54.3 -1.7 -3.04%
14:30 56 53.8 -2.2 -3.93%
15:00 56 53.5 -2.5 -4.46%
15:30 49 55.9 6.9 14.08%
16:00 49 54.9 5.9 12.04%
16:30 49 49.8 0.8 1.63%
17:00 45 48.4 3.4 7.56%
17:30 45 49.7 4.7 10.44%
18:00 45 56.4 11.4 25.33%
18:30 45 49.4 4.4 9.78%
19:00 45 45.7 0.7 1.56%
19:30 45 44.9 -0.1 -0.22%
20:00 45 47.1 2.1 4.67%

REX Line Service Evaluation Study
REX Line Service Evaluation 53 Final Recommendations
Saturday Southbound Actual vs. Scheduled Run Time Comparison
Saturday Southbound
Actual Run Time vs. Scheduled Run Time
Trip Start Scheduled Run Time
Actual Run Time Difference
% Difference
5:30 AM 44 41.6 -2.4 -5.45%
6:00 AM 44 42.3 -1.7 -3.86%
6:30 AM 44 43.4 -0.6 -1.36%
7:00 AM 44 40.4 -3.6 -8.18%
7:30 AM 46 49.3 3.3 7.17%
8:00 AM 46 43.5 -2.5 -5.43%
8:30 AM 46 48.9 2.9 6.30%
9:00 AM 51 45.6 -5.4 -10.59%
9:30 AM 51 52 1 1.96%
10:00 AM 51 50.9 -0.1 -0.20%
10:30 AM 51 51.1 0.1 0.20%
11:00 AM 51 54.2 3.2 6.27%
11:30 AM 57 55.5 -1.5 -2.63%
12:00 PM 57 53.3 -3.7 -6.49%
12:30 PM 57 55.2 -1.8 -3.16%
1:00 PM 57 52.3 -4.7 -8.25%
1:30 PM 57 59.3 2.3 4.04%
2:00 PM 57 54.2 -2.8 -4.91%
2:30 PM 57 57.2 0.2 0.35%
3:00 PM 57 54.6 -2.4 -4.21%
3:30 PM 51 51.2 0.2 0.39%
4:00 PM 51 52.9 1.9 3.73%
4:30 PM 51 51.5 0.5 0.98%
5:00 PM 51 57.8 6.8 13.33%
5:30 PM 51 54.9 3.9 7.65%
6:00 PM 51 50.2 -0.8 -1.57%
6:30 PM 46 48.8 2.8 6.09%
7:00 PM 46 45.3 -0.7 -1.52%
7:30 PM 46 54.4 8.4 18.26%
8:00 PM 46 47.1 1.1 2.39%

REX Line Service Evaluation Study
REX Line Service Evaluation 54 Final Recommendations
Sunday Northbound Actual vs. Scheduled Run Time Comparison
Sunday Northbound
Actual Run Time vs. Scheduled Run Time
Trip Start Scheduled Run Time
Actual Run Time Difference
% Difference
5:00 AM 40 38.6 -1.4 -3.50%
6:00 AM 40 40.3 0.3 0.75%
7:00 AM 40 42.6 2.6 6.50%
8:00 AM 40 43.7 3.7 9.25%
9:00 AM 45 42.8 -2.2 -4.89%
10:00 AM 45 45.3 0.3 0.67%
11:00 AM 45 46.2 1.2 2.67%
12:00 PM 50 46.2 -3.8 -7.60%
1:00 PM 50 53.3 3.3 6.60%
2:00 PM 50 55.1 5.1 10.20%
3:00 PM 50 48.3 -1.7 -3.40%
4:00 PM 50 50.4 0.4 0.80%
5:00 PM 46 48.5 2.5 5.43%
6:00 PM 46 46.5 0.5 1.09%
7:00 PM 46 44.3 -1.7 -3.70%
8:00 PM 46 42 -4 -8.70%
9:00 PM 46 48.9 2.9 6.30%

REX Line Service Evaluation Study
REX Line Service Evaluation 55 Final Recommendations
Sunday Southbound Actual vs. Scheduled Run Time Comparison
Sunday Southbound
Actual Run Time vs. Scheduled Run Time
Trip Start Scheduled Run Time
Actual Run Time Difference
% Difference
6:00 AM 40 42 2 5.00%
7:00 AM 40 38.9 -1.1 -2.75%
8:00 AM 40 41.3 1.3 3.25%
9:00 AM 40 42.1 2.1 5.25%
10:00 AM 48 46.2 -1.8 -3.75%
11:00 AM 48 45 -3 -6.25%
12:00 PM 48 50.3 2.3 4.79%
1:00 PM 52 54.1 2.1 4.04%
2:00 PM 52 51.6 -0.4 -0.77%
3:00 PM 52 52.1 0.1 0.19%
4:00 PM 51 52.9 1.9 3.73%
5:00 PM 51 50.7 -0.3 -0.59%
6:00 PM 51 53 2 3.92%
7:00 PM 44 52.4 8.4 19.09%
8:00 PM 44 50.2 6.2 14.09%
9:00 PM 44 42.4 -1.6 -3.64%

REX Line Service Evaluation Study
REX Line Service Evaluation 56 Final Recommendations
Appendix 4 Headway Separation Analysis
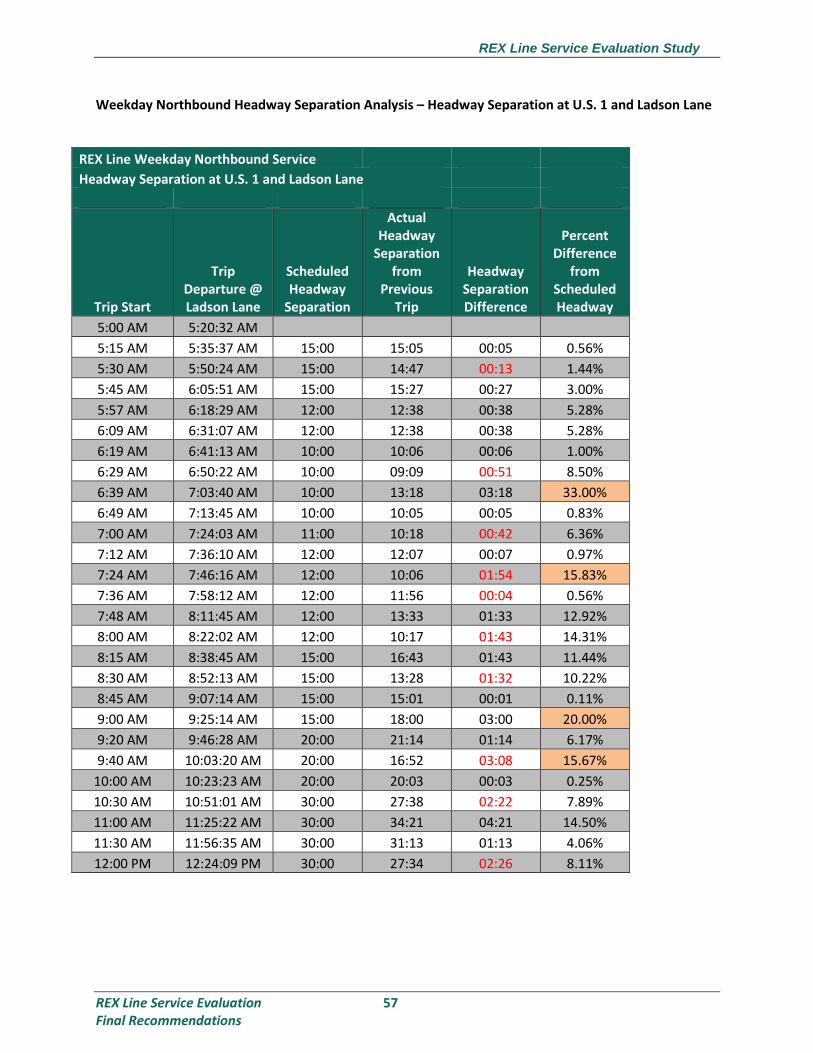
REX Line Service Evaluation Study
REX Line Service Evaluation 57 Final Recommendations
Weekday Northbound Headway Separation Analysis – Headway Separation at U.S. 1 and Ladson Lane
REX Line Weekday Northbound Service
Headway Separation at U.S. 1 and Ladson Lane
Trip Start
Trip Departure @ Ladson Lane
Scheduled Headway
Separation
Actual Headway
Separation from
Previous Trip
Headway Separation Difference
Percent Difference
from Scheduled Headway
5:00 AM 5:20:32 AM
5:15 AM 5:35:37 AM 15:00 15:05 00:05 0.56%
5:30 AM 5:50:24 AM 15:00 14:47 00:13 1.44%
5:45 AM 6:05:51 AM 15:00 15:27 00:27 3.00%
5:57 AM 6:18:29 AM 12:00 12:38 00:38 5.28%
6:09 AM 6:31:07 AM 12:00 12:38 00:38 5.28%
6:19 AM 6:41:13 AM 10:00 10:06 00:06 1.00%
6:29 AM 6:50:22 AM 10:00 09:09 00:51 8.50%
6:39 AM 7:03:40 AM 10:00 13:18 03:18 33.00%
6:49 AM 7:13:45 AM 10:00 10:05 00:05 0.83%
7:00 AM 7:24:03 AM 11:00 10:18 00:42 6.36%
7:12 AM 7:36:10 AM 12:00 12:07 00:07 0.97%
7:24 AM 7:46:16 AM 12:00 10:06 01:54 15.83%
7:36 AM 7:58:12 AM 12:00 11:56 00:04 0.56%
7:48 AM 8:11:45 AM 12:00 13:33 01:33 12.92%
8:00 AM 8:22:02 AM 12:00 10:17 01:43 14.31%
8:15 AM 8:38:45 AM 15:00 16:43 01:43 11.44%
8:30 AM 8:52:13 AM 15:00 13:28 01:32 10.22%
8:45 AM 9:07:14 AM 15:00 15:01 00:01 0.11%
9:00 AM 9:25:14 AM 15:00 18:00 03:00 20.00%
9:20 AM 9:46:28 AM 20:00 21:14 01:14 6.17%
9:40 AM 10:03:20 AM 20:00 16:52 03:08 15.67%
10:00 AM 10:23:23 AM 20:00 20:03 00:03 0.25%
10:30 AM 10:51:01 AM 30:00 27:38 02:22 7.89%
11:00 AM 11:25:22 AM 30:00 34:21 04:21 14.50%
11:30 AM 11:56:35 AM 30:00 31:13 01:13 4.06%
12:00 PM 12:24:09 PM 30:00 27:34 02:26 8.11%
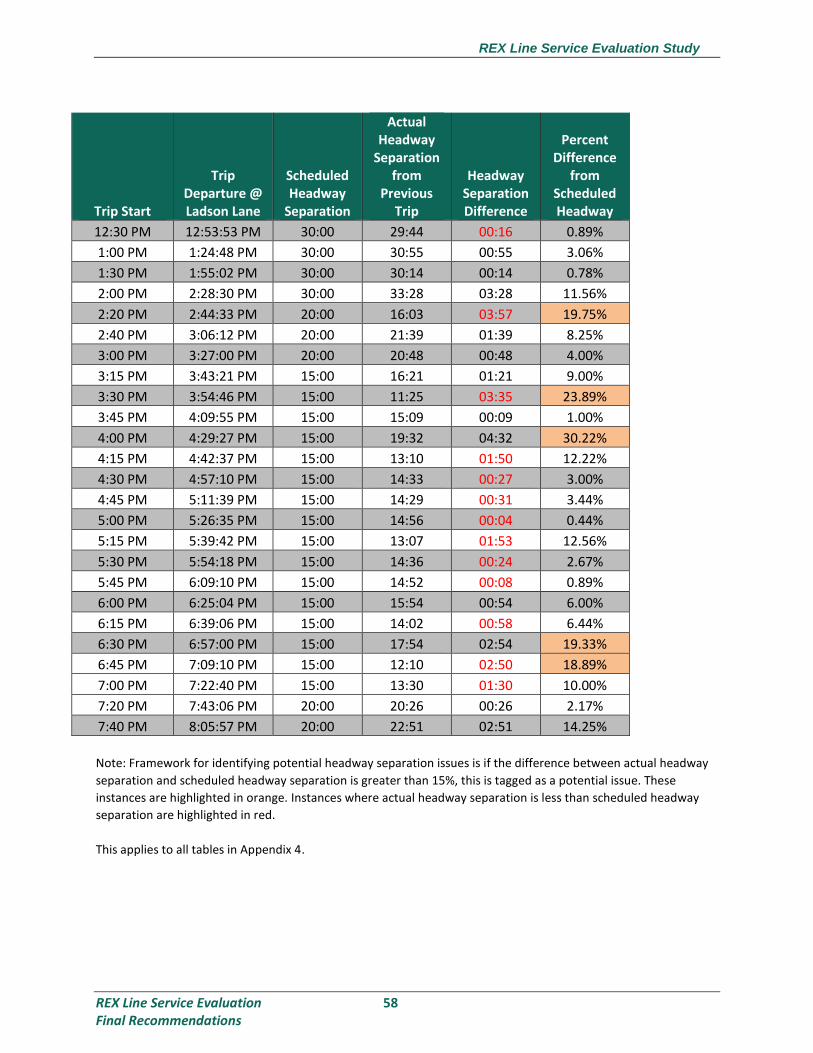
REX Line Service Evaluation Study
REX Line Service Evaluation 58 Final Recommendations
Trip Start
Trip Departure @ Ladson Lane
Scheduled Headway
Separation
Actual Headway
Separation from
Previous Trip
Headway Separation Difference
Percent Difference
from Scheduled Headway
12:30 PM 12:53:53 PM 30:00 29:44 00:16 0.89%
1:00 PM 1:24:48 PM 30:00 30:55 00:55 3.06%
1:30 PM 1:55:02 PM 30:00 30:14 00:14 0.78%
2:00 PM 2:28:30 PM 30:00 33:28 03:28 11.56%
2:20 PM 2:44:33 PM 20:00 16:03 03:57 19.75%
2:40 PM 3:06:12 PM 20:00 21:39 01:39 8.25%
3:00 PM 3:27:00 PM 20:00 20:48 00:48 4.00%
3:15 PM 3:43:21 PM 15:00 16:21 01:21 9.00%
3:30 PM 3:54:46 PM 15:00 11:25 03:35 23.89%
3:45 PM 4:09:55 PM 15:00 15:09 00:09 1.00%
4:00 PM 4:29:27 PM 15:00 19:32 04:32 30.22%
4:15 PM 4:42:37 PM 15:00 13:10 01:50 12.22%
4:30 PM 4:57:10 PM 15:00 14:33 00:27 3.00%
4:45 PM 5:11:39 PM 15:00 14:29 00:31 3.44%
5:00 PM 5:26:35 PM 15:00 14:56 00:04 0.44%
5:15 PM 5:39:42 PM 15:00 13:07 01:53 12.56%
5:30 PM 5:54:18 PM 15:00 14:36 00:24 2.67%
5:45 PM 6:09:10 PM 15:00 14:52 00:08 0.89%
6:00 PM 6:25:04 PM 15:00 15:54 00:54 6.00%
6:15 PM 6:39:06 PM 15:00 14:02 00:58 6.44%
6:30 PM 6:57:00 PM 15:00 17:54 02:54 19.33%
6:45 PM 7:09:10 PM 15:00 12:10 02:50 18.89%
7:00 PM 7:22:40 PM 15:00 13:30 01:30 10.00%
7:20 PM 7:43:06 PM 20:00 20:26 00:26 2.17%
7:40 PM 8:05:57 PM 20:00 22:51 02:51 14.25%
Note: Framework for identifying potential headway separation issues is if the difference between actual headway
separation and scheduled headway separation is greater than 15%, this is tagged as a potential issue. These
instances are highlighted in orange. Instances where actual headway separation is less than scheduled headway
separation are highlighted in red.
This applies to all tables in Appendix 4.

REX Line Service Evaluation Study
REX Line Service Evaluation 59 Final Recommendations
Weekday Southbound Headway Separation Analysis – Headway Separation at U.S. 1 and Ladson Lane
REX Line Weekday Southbound Service
Headway Separation at U.S. 1 and Ladson Lane
Trip Start
Trip Departure @ Ladson
Lane
Scheduled Headway
Separation
Actual Headway Separation from
Previous Trip
Headway Separation Difference
Percent Difference
from Scheduled Headway
5:35 AM 5:59:40 AM 5:50 AM 6:14:47 AM 15:00 15:07 00:07 0.78%
6:05 AM 6:28:47 AM 15:00 14:00 01:00 6.67%
6:20 AM 6:45:49 AM 15:00 17:02 02:02 13.56%
6:35 AM 6:59:32 AM 15:00 13:43 01:17 8.56%
6:50 AM 7:15:26 AM 15:00 15:54 00:54 6.00%
7:05 AM 7:28:37 AM 15:00 13:11 01:49 12.11%
7:20 AM 7:44:27 AM 15:00 15:50 00:50 5.56%
7:35 AM 7:59:26 AM 15:00 14:59 00:01 0.11%
7:50 AM 8:18:26 AM 15:00 19:00 04:00 26.67%
8:05 AM 8:30:57 AM 15:00 12:31 02:29 16.56%
8:20 AM 8:47:58 AM 15:00 17:01 02:01 13.44%
8:40 AM 9:04:32 AM 20:00 16:34 03:26 17.17%
9:00 AM 9:25:12 AM 20:00 20:40 00:40 3.33%
9:30 AM 9:53:40 AM 30:00 28:28 01:32 5.11%
10:00 AM 10:25:59 AM 30:00 32:19 02:19 7.72%
10:30 AM 10:56:13 AM 30:00 30:14 00:14 0.78%
11:00 AM 11:25:06 AM 30:00 28:53 01:07 3.72%
11:30 AM 11:54:57 AM 30:00 29:51 00:09 0.50%
12:00 PM 12:25:56 PM 30:00 30:59 00:59 3.28%
12:30 PM 12:56:58 PM 30:00 31:02 01:02 3.44%
1:00 PM 1:29:31 PM 30:00 32:33 02:33 8.50%
1:20 PM 1:52:51 PM 20:00 23:20 03:20 16.67%
1:40 PM 2:06:28 PM 20:00 13:37 06:23 31.92%
2:00 PM 2:27:59 PM 20:00 21:31 01:31 7.58%
2:20 PM 2:47:08 PM 20:00 19:09 00:51 4.25%
2:40 PM 3:06:17 PM 20:00 19:09 00:51 4.25%
3:00 PM 3:29:57 PM 20:00 23:40 03:40 18.33%
3:15 PM 3:41:54 PM 15:00 11:57 03:03 20.33%
3:30 PM 3:58:12 PM 15:00 16:18 01:18 8.67%
3:45 PM 4:12:13 PM 15:00 14:01 00:59 6.56%

REX Line Service Evaluation Study
REX Line Service Evaluation 60 Final Recommendations
Trip Start
Trip Departure @ Ladson
Lane
Scheduled Headway
Separation
Actual Headway Separation from
Previous Trip
Headway Separation Difference
Percent Difference
from Scheduled Headway
4:00 PM 4:27:44 PM 15:00 15:31 00:31 3.44%
4:12 PM 4:40:39 PM 12:00 12:55 00:55 7.64%
4:24 PM 4:53:06 PM 12:00 12:27 00:27 3.75%
4:36 PM 5:05:08 PM 12:00 12:02 00:02 0.28%
4:48 PM 5:17:20 PM 12:00 12:12 00:12 1.67%
5:00 PM 5:28:21 PM 12:00 11:01 00:59 8.19%
5:12 PM 5:41:32 PM 12:00 13:11 01:11 9.86%
5:24 PM 5:56:30 PM 12:00 14:58 02:58 24.72%
5:48 PM 6:16:12 PM 24:00 19:42 04:18 17.92%
6:00 PM 6:28:39 PM 12:00 12:27 00:27 3.75%
6:15 PM 6:44:06 PM 15:00 15:27 00:27 3.00%
6:30 PM 6:58:34 PM 15:00 14:28 00:32 3.56%
6:45 PM 7:12:45 PM 15:00 14:11 00:49 5.44%
7:00 PM 7:26:13 PM 15:00 13:28 01:32 10.22%
7:15 PM 7:40:50 PM 15:00 14:37 00:23 2.56%
7:30 PM 7:55:52 PM 15:00 15:02 00:02 0.22%
7:45 PM 20:12:47 15:00 16:55 01:55 12.78%

REX Line Service Evaluation Study
REX Line Service Evaluation 61 Final Recommendations
Saturday Northbound Headway Separation Analysis – Headway Separation at U.S. 1 and Ladson Lane
REX Line Weekday Northbound Service
Headway Separation at U.S. 1 and Ladson Lane
Trip Start
Trip Departure @ Ladson Lane
Scheduled Headway
Separation
Actual Headway Separation from
Previous Trip
Headway Separation Difference
Percent Difference
from Scheduled Headway
5:00 AM 5:18:21 AM
5:30 AM 5:51:01 AM 30:00 32:40 02:40 8.89%
6:00 AM 6:20:16 AM 30:00 29:15 00:45 2.50%
6:30 AM 6:53:09 AM 30:00 32:53 02:53 9.61%
7:00 AM 7:19:45 AM 30:00 26:36 03:24 11.33%
7:30 AM 7:51:50 AM 30:00 32:05 02:05 6.94%
8:00 AM 8:21:21 AM 30:00 29:31 00:29 1.61%
8:30 AM 8:52:50 AM 30:00 31:29 01:29 4.94%
9:00 AM 9:20:31 AM 30:00 27:41 02:19 7.72%
9:30 AM 9:51:43 AM 30:00 31:12 01:12 4.00%
10:00 AM 10:21:18 AM 30:00 29:35 00:25 1.39%
10:30 AM 10:55:08 AM 30:00 33:50 03:50 12.78%
11:00 AM 11:28:53 AM 30:00 33:45 03:45 12.50%
11:30 AM 11:52:20 AM 30:00 23:27 06:33 21.83%
12:00 PM 12:25:03 PM 30:00 32:43 02:43 9.06%
12:30 PM 12:52:28 PM 30:00 27:25 02:35 8.61%
1:00 PM 1:26:11 PM 30:00 33:43 03:43 12.39%
1:30 PM 2:00:26 PM 30:00 34:15 04:15 14.17%
2:00 PM 2:24:09 PM 30:00 23:43 06:17 20.94%
2:30 PM 2:54:55 PM 30:00 30:46 00:46 2.56%
3:00 PM 3:26:54 PM 30:00 31:59 01:59 6.61%
3:30 PM 3:56:19 PM 30:00 29:25 00:35 1.94%
4:00 PM 4:26:49 PM 30:00 30:30 00:30 1.67%
4:30 PM 4:51:56 PM 30:00 25:07 04:53 16.28%
5:00 PM 5:23:09 PM 30:00 31:13 01:13 4.06%
5:30 PM 5:53:04 PM 30:00 29:55 00:05 0.28%
6:00 PM 6:25:51 PM 30:00 32:47 02:47 9.28%
6:30 PM 6:55:17 PM 30:00 29:26 00:34 1.89%
7:00 PM 7:21:13 PM 30:00 25:56 04:04 13.56%
7:30 PM 7:50:28 PM 30:00 29:15 00:45 2.50%
8:00 PM 8:23:08 PM 30:00 32:40 02:40 8.89%
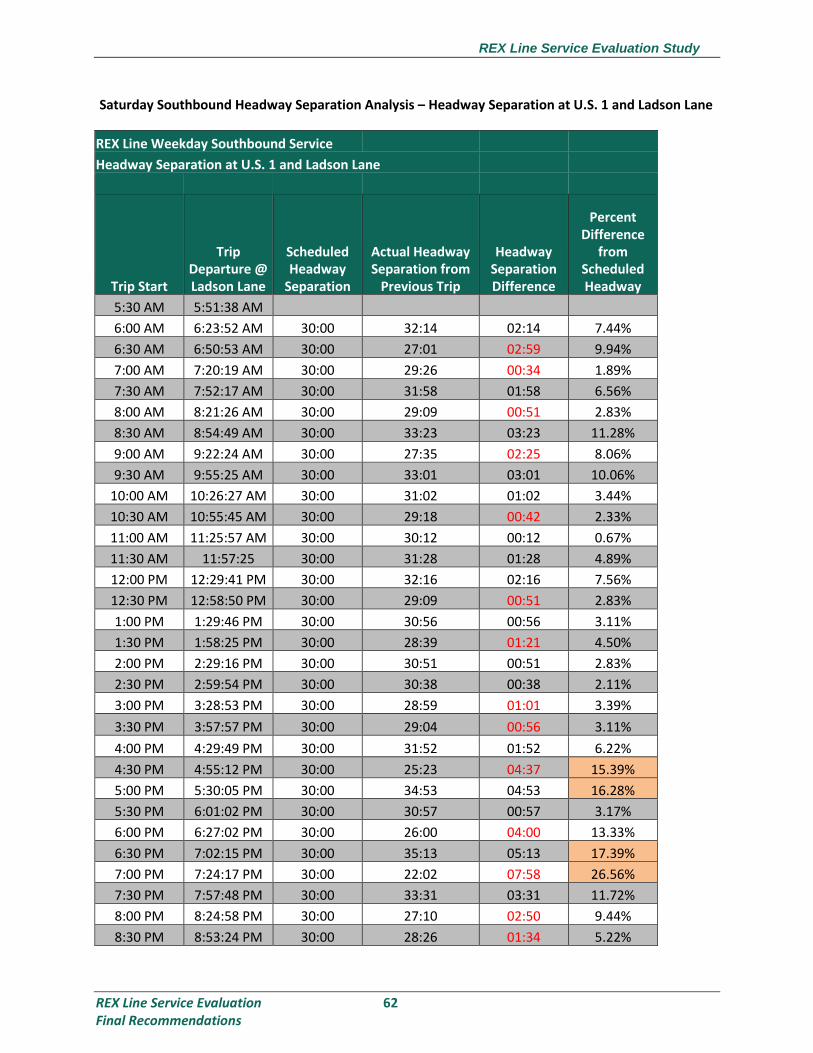
REX Line Service Evaluation Study
REX Line Service Evaluation 62 Final Recommendations
Saturday Southbound Headway Separation Analysis – Headway Separation at U.S. 1 and Ladson Lane
REX Line Weekday Southbound Service
Headway Separation at U.S. 1 and Ladson Lane
Trip Start
Trip Departure @ Ladson Lane
Scheduled Headway
Separation
Actual Headway Separation from
Previous Trip
Headway Separation Difference
Percent Difference
from Scheduled Headway
5:30 AM 5:51:38 AM
6:00 AM 6:23:52 AM 30:00 32:14 02:14 7.44%
6:30 AM 6:50:53 AM 30:00 27:01 02:59 9.94%
7:00 AM 7:20:19 AM 30:00 29:26 00:34 1.89%
7:30 AM 7:52:17 AM 30:00 31:58 01:58 6.56%
8:00 AM 8:21:26 AM 30:00 29:09 00:51 2.83%
8:30 AM 8:54:49 AM 30:00 33:23 03:23 11.28%
9:00 AM 9:22:24 AM 30:00 27:35 02:25 8.06%
9:30 AM 9:55:25 AM 30:00 33:01 03:01 10.06%
10:00 AM 10:26:27 AM 30:00 31:02 01:02 3.44%
10:30 AM 10:55:45 AM 30:00 29:18 00:42 2.33%
11:00 AM 11:25:57 AM 30:00 30:12 00:12 0.67%
11:30 AM 11:57:25 30:00 31:28 01:28 4.89%
12:00 PM 12:29:41 PM 30:00 32:16 02:16 7.56%
12:30 PM 12:58:50 PM 30:00 29:09 00:51 2.83%
1:00 PM 1:29:46 PM 30:00 30:56 00:56 3.11%
1:30 PM 1:58:25 PM 30:00 28:39 01:21 4.50%
2:00 PM 2:29:16 PM 30:00 30:51 00:51 2.83%
2:30 PM 2:59:54 PM 30:00 30:38 00:38 2.11%
3:00 PM 3:28:53 PM 30:00 28:59 01:01 3.39%
3:30 PM 3:57:57 PM 30:00 29:04 00:56 3.11%
4:00 PM 4:29:49 PM 30:00 31:52 01:52 6.22%
4:30 PM 4:55:12 PM 30:00 25:23 04:37 15.39%
5:00 PM 5:30:05 PM 30:00 34:53 04:53 16.28%
5:30 PM 6:01:02 PM 30:00 30:57 00:57 3.17%
6:00 PM 6:27:02 PM 30:00 26:00 04:00 13.33%
6:30 PM 7:02:15 PM 30:00 35:13 05:13 17.39%
7:00 PM 7:24:17 PM 30:00 22:02 07:58 26.56%
7:30 PM 7:57:48 PM 30:00 33:31 03:31 11.72%
8:00 PM 8:24:58 PM 30:00 27:10 02:50 9.44%
8:30 PM 8:53:24 PM 30:00 28:26 01:34 5.22%

REX Line Service Evaluation Study
REX Line Service Evaluation 63 Final Recommendations
Sunday Northbound Headway Separation Analysis – Headway Separation at U.S. 1 and Ladson Lane
REX Line Sunday Northbound Service
Headway Separation at U.S. 1 and Ladson Lane
Trip Start
Trip Departure @ Ladson
Lane
Scheduled Headway
Separation
Actual Headway Separation from
Previous Trip
Headway Separation Difference
Percent Difference
from Scheduled Headway
5:00 AM 5:18:16 AM
6:00 AM 6:19:20 AM 1:00:00 1:01:04 01:04 1.78%
7:00 AM 7:20:03 AM 1:00:00 1:00:43 00:43 1.19%
8:00 AM 8:20:13 AM 1:00:00 1:00:10 00:10 0.28%
9:00 AM 9:19:47 AM 1:00:00 0:59:34 00:26 0.72%
10:00 AM 10:20:46 AM 1:00:00 1:00:59 00:59 1.64%
11:00 AM 11:20:57 AM 1:00:00 1:00:11 00:11 0.31%
12:00 PM 12:20:53 PM 1:00:00 0:59:56 00:04 0.11%
1:00 PM 1:22:05 PM 1:00:00 1:01:12 01:12 2.00%
2:00 PM 2:28:00 PM 1:00:00 1:05:55 05:55 9.86%
3:00 PM 3:20:18 PM 1:00:00 0:52:18 07:42 12.83%
4:00 PM 4:25:09 PM 1:00:00 1:04:51 04:51 8.08%
5:00 PM 5:24:09 PM 1:00:00 0:59:00 01:00 1.67%
6:00 PM 6:20:38 PM 1:00:00 0:56:29 03:31 5.86%
7:00 PM 7:21:50 PM 1:00:00 1:01:12 01:12 2.00%
8:00 PM 8:17:26 PM 1:00:00 0:55:36 04:24 7.33%
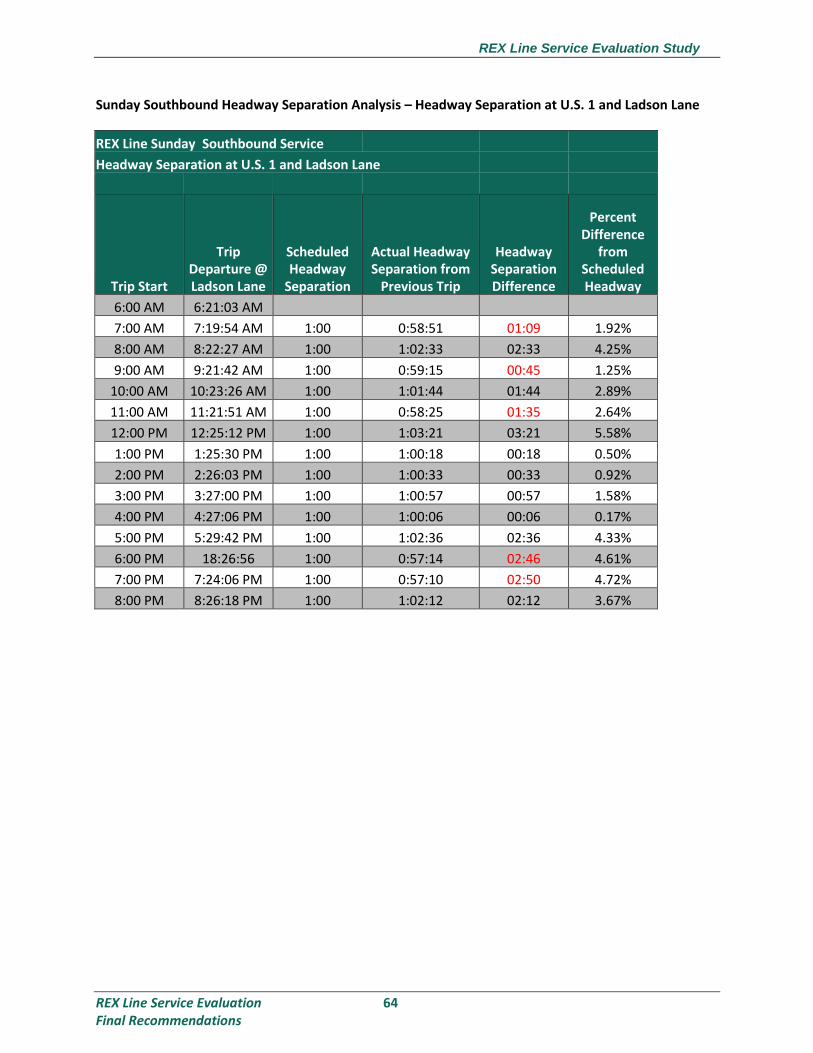
REX Line Service Evaluation Study
REX Line Service Evaluation 64 Final Recommendations
Sunday Southbound Headway Separation Analysis – Headway Separation at U.S. 1 and Ladson Lane
REX Line Sunday Southbound Service
Headway Separation at U.S. 1 and Ladson Lane
Trip Start
Trip Departure @ Ladson Lane
Scheduled Headway
Separation
Actual Headway Separation from
Previous Trip
Headway Separation Difference
Percent Difference
from Scheduled Headway
6:00 AM 6:21:03 AM
7:00 AM 7:19:54 AM 1:00 0:58:51 01:09 1.92%
8:00 AM 8:22:27 AM 1:00 1:02:33 02:33 4.25%
9:00 AM 9:21:42 AM 1:00 0:59:15 00:45 1.25%
10:00 AM 10:23:26 AM 1:00 1:01:44 01:44 2.89%
11:00 AM 11:21:51 AM 1:00 0:58:25 01:35 2.64%
12:00 PM 12:25:12 PM 1:00 1:03:21 03:21 5.58%
1:00 PM 1:25:30 PM 1:00 1:00:18 00:18 0.50%
2:00 PM 2:26:03 PM 1:00 1:00:33 00:33 0.92%
3:00 PM 3:27:00 PM 1:00 1:00:57 00:57 1.58%
4:00 PM 4:27:06 PM 1:00 1:00:06 00:06 0.17%
5:00 PM 5:29:42 PM 1:00 1:02:36 02:36 4.33%
6:00 PM 18:26:56 1:00 0:57:14 02:46 4.61%
7:00 PM 7:24:06 PM 1:00 0:57:10 02:50 4.72%
8:00 PM 8:26:18 PM 1:00 1:02:12 02:12 3.67%
Top Related