


![Index [] · Vishnu Shloka - Shanthakaram Bhujagashayanam 4 Sri Venkatesa Suprabatham 5 Sri Venkatesa Stotram 15 Sri Venkatesa Prapti 18 Sri Venkatesa Mangalashasanam 24 Sri Venkatesa](https://static.fdocuments.net/doc/165x107/5d6795b488c993306c8b64db/index-vishnu-shloka-shanthakaram-bhujagashayanam-4-sri-venkatesa-suprabatham.jpg)
![INDEX [clists.nic.in]clists.nic.in/ddir/PDFCauselists/patna/2016/Apr/...Sri Hari Shankar Singh, A.R. Criminal Disposal Section Sri Akhilesh Kumar Singh, A.R. Cr. Appeal Sri Rajesh](https://static.fdocuments.net/doc/165x107/5f1b9acde142b31d530c36e2/index-sri-hari-shankar-singh-ar-criminal-disposal-section-sri-akhilesh.jpg)


Languages
Pages
Legal


Presenter
Date
Results of the 2013 SRI Index review Corli le Roux, Head of SRI Index and Sustainability
Makhiba Mollo, SRI Index Associate

Overview of timeline
2
Initial public research commenced during June 2013
Company preliminary profiles sent out in three tranches between July and
September
• Companies given two weeks to respond to profiles
• USB responsible for researching most companies
Engagement with controversial issues and borderline cases during September
and November 2013
Results approved by Advisory Committee on 19 November 2013
Individual results distributed on 26 November 2013

Research methodology – criteria overview
3
Covers four areas of measurement
• Environment
• Society
• Governance and related sustainability concerns
• Climate change
Entry level threshold for each of the four areas of measurement
Environmental impact classification
• Aligned to sector’s overall environmental impacts relative to economic contribution of the relevant
activity to company revenue
• Currently no impact classification for social, governance or climate change

Research methodology – criteria overview (2)
4
No new indicators this year
However, two significant moves in evolution of index
• Only publicly available information considered
• Entire FTSE/JSE All Share Index automatically assessed

Experience of the process
5
157 companies assessed in 2013 (108 in 2012)
• 105 of these submitted detailed profile/survey responses – 66.9% of total (84% in 2012)
– Represents high level of engagement – increases robustness of data collection process
– Small caps with few employees find difficulty in responding
• Top 40 best responders – 92.5% of Top 40 companies responded with additional information
(83% in 2012)

Overview of results
6
46% of total assessed universe has qualified (70% in 2012)
5 companies qualifying for the first time
• 3 of these assessed for the first time
• 2 previously assessed but first time to qualify
Number of constituents in 2013:
72
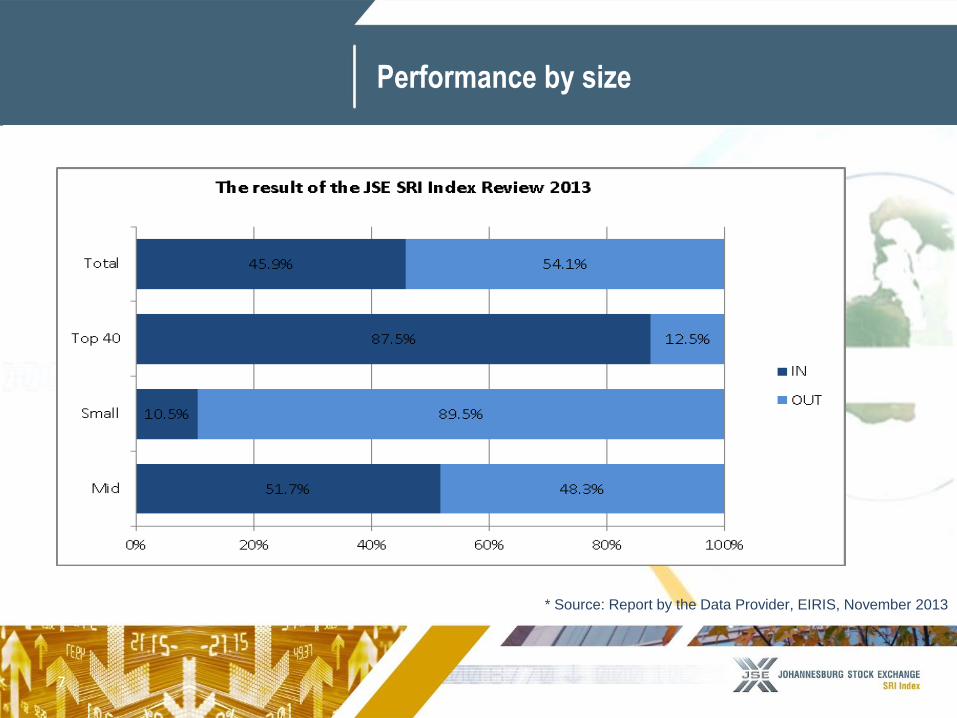
Performance by size
7
* Source: Report by the Data Provider, EIRIS, November 2013

8
31 32
34 34
36
34
36 36 36 35
17
13
17 18
23
30
33
31
33
31
3
4
7
5
4 4
5
7 7
6
0
5
10
15
20
25
30
35
40
2004 2005 2006 2007 2008 2009 2010 2011 2012 2013
Nu
mb
er o
f co
mp
anie
s
Year of assessment
Top 40
Mid Cap
Small Cap
Performance by size (2)

Sector performance
9
100% qualification by companies in life insurance sector (again)
Other strong sectors
• Mining
15 out of 19 qualified
Makes up 20.8% of total number of constituents
• General Industrials
83% qualified
• Banks
71.4% qualified

Individual research areas: Environment
10
65.6% of all assessed met environmental requirements in 2013
(79.6% in 2012)
• Full disclosure requirement a challenge, particularly for high impact and first timers
Medium impact companies do best in policy, need to improve management
and reporting
Low impact category still strong in reporting
• Lower threshold
High impact companies did best in environmental reporting this year, but
need to address disclosure of management systems

Individual research areas: Society
11
65% of all assessed met social requirements in 2013 (81.5% in 2012)
– Decline due to larger universe and public requirement
Strong themes
– Stakeholder engagement, Community relations
– Demonstrates awareness of external / societal expectations and willingness to engage
– Disclosures around health & safety, BEE and equal opportunities also sufficient
Challenging themes
– Decline in performance across training & development, employee relations, HIV/Aids
– Attributable to public requirement – areas generally addressed, but not sufficiently
available in public domain
– Still room for increased transparency

Individual research areas:
Governance & related sustainability concerns
12
90.4% of all assessed met governance requirements in 2013 (98% in 2012)
Strongest performance area
• Attributed to influence of King III and integrated reporting focus
• Improvement in Board practice
• Decline in other areas –
o Again due to public requirement – areas being addressed but not sufficiently disclosed
Strong areas
• Business value & risk management remains strong
• Broader economic issues
Governance reporting remains challenging area
• Especially for companies being assessed for the first time

Individual research areas: Climate Change
13
56.7% of all assessed met climate change entry level requirements in 2013
(75.9% in 2012)
• Decrease attributable to large number of new Small Cap companies
• Companies assessed last year show improvement
Strongest performance by Top 40 companies – 92.5% meeting entry level

Successful constituents
(in alphabetical order)
14
Advtech Barloworld Growth Point
Properties Liberty Holdings Northam Platinum Sanlam
AECI BHP Billiton Harmony Gold Mining
Company Lonmin plc Oceana Group Santam
African Bank
Investments
The Bidvest Group
Limited Intu Properties Massmart Holdings Old Mutual Sappi Limited
African Oxygen Business Connexion
Group Illovo Sugar
Mediclinic
International Pick n Pay Sasol
African Rainbow
Minerals
British American
Tobacco
Impala Platinum
Holdings Merafe Resources PPC Sibanye Gold
Allied Electronics
Corporation Discovery Holdings Imperial Holdings MMI Holdings Rainbow Chicken Standard Bank Group
Anglo American DRD Gold Investec Mondi Redefine Properties Steinhoff International
Anglo American
Platinum Exxaro Resources JD Group Mpact Remgro Sun International
AngloGold Ashanti FirstRand JSE Limited MTN Group Reunert Tongaat Hulett
ArcelorMittal South
Africa
The Foschini Group
Limited
KAP Industrial
Holdings Nampak RMB Holdings
Truworths
International
Aspen Pharmacare
Holdings Gold Fields Limited Kumba Iron Ore Nedbank
Royal Bafokeng
Platinum Vodacom Group
Barclays Africa Group Grindrod Lewis Group Ltd Netcare Limited SAB Miller plc Woolworths
International Holdings

Best performers
15
Companies that meet additional levels of performance
• All relevant core requirements in social and governance
• Independent chair
• Environmental best performer threshold
• All climate change indicators (except for “Trend data”)
Number of best performers in 2013:
6 Contraction in BP numbers due to requirement for reporting in the public
domain
• Mainly resulted from core indicators in social area not being disclosed

Best performers by size & impact
16
HEADLINE 2013
Top 40 4
Mid Cap 2
Small Cap 0
Total 6
IMPACT 2013
High 2
Medium 1
Low 3
Total 6

17
Best performers 2013
* In alphabetical order
Anglo American Platinum

18
Best performers 2013
* In alphabetical order
Illovo Sugar

19
Best performers 2013
* In alphabetical order
Netcare Limited

20
Best performers 2013
* In alphabetical order
Standard Bank

21
Best performers 2013
* In alphabetical order
Steinhoff International

22
Best performers 2013
* In alphabetical order
Vodacom Group

Quo vadis?
23
Strategy implementation begins in all earnest
• Review of criteria
• Addressing structural sector concerns
• Expanding data availability
• ESG Investor Briefing
Thank you
24

See you in 2014!
25
Advtech Barloworld Growth Point Properties Liberty Holdings Northam Platinum Sanlam
AECI BHP Billiton Harmony Gold Mining
Company Lonmin plc Oceana Group Santam
African Bank
Investments
The Bidvest Group
Limited Intu Properties Massmart Holdings Old Mutual Sappi Limited
African Oxygen Business Connexion
Group Illovo Sugar (BP) Mediclinic International Pick n Pay Sasol
African Rainbow
Minerals
British American
Tobacco
Impala Platinum
Holdings Merafe Resources PPC Sibanye Gold
Allied Electronics
Corporation Discovery Holdings Imperial Holdings MMI Holdings Rainbow Chicken
Standard Bank Group
(BP)
Anglo American DRD Gold Investec Mondi Redefine Properties Steinhoff International
(BP)
Anglo American
Platinum (BP) Exxaro Resources JD Group Mpact Remgro Sun International
AngloGold Ashanti FirstRand JSE Limited MTN Group Reunert Tongaat Hulett
ArcelorMittal South
Africa
The Foschini Group
Limited KAP Industrial Holdings Nampak RMB Holdings Truworths International
Aspen Pharmacare
Holdings Gold Fields Limited Kumba Iron Ore Nedbank
Royal Bafokeng
Platinum Vodacom Group (BP)
Barclays Africa Group Grindrod Lewis Group Ltd Netcare Limited (BP) SAB Miller plc Woolworths
International Holdings
Top Related