


Languages
Pages
Legal

Hindawi Publishing CorporationJournal of SensorsVolume 2013 Article ID 206738 10 pageshttpdxdoiorg1011552013206738
Research ArticleHigh-Density Fiber Optical Sensor and Instrumentation forGas Turbine Operation Condition Monitoring
Hua Xia12 Doug Byrd3 Sachin Dekate1 and Boon Lee1
1 Photonics Laboratory Micro and Nano Structures Technologies GE Global Research 1 Research Circle Niskayuna NY 12309 USA2College of Nanoscale Science and Engineering State University of New York at Albany NY 12222 USA3 Engineering Division GE Energy 300 Garlington Road GTTC 200D Greenville SC 29615 USA
Correspondence should be addressed to Hua Xia hxiaalbanyedu
Received 30 October 2012 Accepted 28 January 2013
Academic Editor Joao Batista Rosolem
Copyright copy 2013 Hua Xia et alThis is an open access article distributed under the Creative Commons Attribution License whichpermits unrestricted use distribution and reproduction in any medium provided the original work is properly cited
Gas turbine operation control is normally based on thermocouple-measured exhaust temperatures Due to radiation shieldingand bulky package it is difficult to provide high spatial resolution for measuring can-to-can combustion temperature profile atthe exhaust duct This paper has demonstrated that wavelength-division-multiplexing-based fiber Bragg grating sensors couldprovide high spatial resolution steady anddynamic temperaturemeasurements A robust sensor package can be designedwith eithercircumferential sensing cable or radial sensing rake for quasi-distributingmultiple fiber sensors in the gas turbine environmentThefield validations have demonstrated that quasi-distributed fiber sensors have not only demonstrated its temperature measurementaccuracy compared to existing thermocouple sensors but also shown its unique dynamic response amplitude and power spectrathat could be utilized for gas turbine transient operation condition monitoring and diagnostics
1 Introduction
Accurate static and dynamic temperature detections areessential for safe and efficient operation and control in manyindustrial machinery systems which include but are notlimited to gas turbine steam generator boiler combustorcompressor gasifier and so forth In combustion controlpractice an annular array of thermocouples is used tomeasure exhaust temperature profile which is then usedto ensure safe operation of the gas turbine Whenever afault temperature either too cold or too hot is detecteda gas turbine shutdown is initiated which in many casescould be premature Such a gas turbine operational controlmethod requires accurate annular exhaust static and dynamictemperature measurement Obviously the purpose of thestatic and dynamic temperature detection is either for real-time industrial process monitoring and diagnostics or foroperation control and optimization
Since gas temperature is one of the critical measurementparameters for gas turbine operation improvements of the
temperature measurement accuracies can improve turbineefficiency Direct combustor temperature measurement ishighly desirable for robust turbine design and operationbut normally this requirement is beyond the capabilities ofmost thermocouple sensorsThereforemostOEMsopt to useexhaust gas temperaturemeasurement as a surrogate Currentexhaust temperature measurement using the annular arrayof thermocouples (TCs) provides limited discrete sensingpoints and the sensing spatial resolution is not optimalAccordingly a conservative control and operation strategyof the gas turbine is warranted which has a limiting effecton the gas turbine performance A potential solution is toincrease the number of thermocouples and improve theirspatial arrangement However it is difficult to increase thenumber and location of the existing TCs from the currentmethod due to their bulky packaging and excessive electricalwiring needs Fiber Bragg grating (FBG) sensors are thoughtto be of great potential for temperature measurement inthe harsh environments such as turbomachinery systemsbecause of the advantages as having lowmass high sensitivity
2 Journal of Sensors
multiplexing capabilitiesmultipoint distribution capabilitiesmultisensing functions and electromagnetic interferenceimmunity [1 2]
A FBG is basically sensitive to both strain and tempera-ture variations [3] but it can be packaged for static tempera-ture measurement with so-called ldquoloss packagerdquo or freestand-ing package method [4 5] However a so-called ldquoprestrainpackagerdquo method could be used for measuring structuralinstability or dynamic signal In the presurge condition for agas turbine or compressor such packaged fiber sensors couldbe used to measure temperature variation rates or thermalspikes either at the gas inlet or downstream exhaust Asensing cable normally consists of a plurality of fiber sensorsthat have to be sealed in a metal ceramic or polymerictube or capillary depending upon the sensing environmentalconditions A sensing instrumentation is constructed bymul-tiplexing different arrays or sensing cables either with mul-tichannel optical sensing interrogator [eg Micron Optics1Hz sm1251 kHz sm130 httpwwwmicronopticscom] orwith an optical sensing interrogator plus an optical-switcher-based multiplexer [eg Micron Optics sm041] The staticand dynamic signals from FBG sensors are analyzed eitherwith time-division or with wavelength-division multiplexingmethod or their combination
This paper has presented recent progress in applyingfiber sensors and instrumentation for measuring gas turbineexhaust temperature at both startup and steady operationconditions with wavelength-division multiplexing technol-ogy For circumferential exhaust temperature detection froma gas turbine FBG sensing elements are inscribed ontoa single fiber with a spatial separation of 450mm threesensing fibers with 150mm misplacement provide doublespatial resolution for 9FB gas turbine exhaust temperatureprofile detection For radial exhaust temperature detection aprecision exhaust temperature rake is used to support FBGsensors as an integrated radial sensing rake with 100mmspatial resolution across exhaust duct wall to central barrierspaceThe obtained static wavelength data (1 data per second)are converted to temperatures with a precalibrated transferfunction while the dynamic wavelength data (1000 dataper second) are analyzed to catch vibration modes andsystem displacement amplitude with fast Fourier transformalgorithm
2 High-Density Fiber Temperature Sensor
It is understood that a grating is a telecom filter devicefor wavelength multiplexing or demultiplexing applicationsit is absolute not a temperature sensor despite its intrinsicnatures of temperature and strain dependence ConventionalType-I FBG has been used in various infrastructural health-monitoring applications [6 7] However this type of FBGhas poor thermal survivability and accuracy degradation atrelative elevated temperature of greater than 300∘C Researchhas shown that some Type-IIA Type-II regenerated FBGs(fabricated either by ultraviolet lasers or femtosecond lasers)and chiral gratings have also shown survivability even at1000ndash1100∘C [8ndash13] With thermal stable FBGs they canbe used as temperature sensor In addition a mechanical
package has to be properly designed for maintaining FBGsensorrsquos integrity survivability functionality and durability[4 5]
FBG elements used in this work have used high-powerultraviolet (UV) laser with a phase mask technology forinscribing Bragg grating in a single-mode fiber core [1213] This forms a periodic mass density-modulated gratingpattern that can be characterized by a Bragg resonant peakat
120582119861= 2 sdot 119899eff sdot Λ (120588) (1)
where the effective refractive index 119899eff in the fiber coreincludes the laser-inscription-process-produced refractiveindex modulation 119899 and mass density modulation inducedrefractive index 119899
120588 The thermal dependence of a Bragg
grating can be described by
Δ120582 = 120582119861sdot [120581120576sdot 120576 + (120573 + 120572 +
1
119899eff
120597119899120588
120597119879) sdot Δ119879
+(1
119899eff
120597119899120588
120597119905+1
Λ
120597Λ
120597119905)Δ119905]
(2)
where 120572 is the coefficient of fiber thermal expansion 120582119861sdot 120581120576
is the strain sensitivity (sim12 pm120583120576) 120573 is the thermoopticcoefficient and the Δ119905 reflects the time-dependent fibermaterial microstructure relaxation process For low-densityType-I FBGs the temperature dependence of the FBG Braggresonant wavelength can be simply expressed as
Δ120582 (119905) = 120582119861sdot [120581120576sdot 120576 + (120573 + 120572) sdot 119879 (119905) minus 119879 (0)]
= 119886 (0) + 119886 (1) sdot Δ119879 (119905)
(3)
where 119886(0) can be treated as an offset to initial wavelengthshift and 120581
119879(0) = 120582
119861sdot (120573 + 120572) is defined as temperature
sensitivity For low-temperature application the FBG has alinear response to external temperature by
Δ120582 (119905) = 120582 (119905) minus 120582119861(0) minus 119886 (0) = 119886 (1) sdot [119879 (119905) minus 119879 (0)] (4)
where 119886(1) = 120581119879(0) = 120582
119861sdot (120573 + 120572) asymp 10ndash12 pm∘C
High-density FBG is more or less related to compact fibermaterial with mass density and refractive index comodula-tion in the fiber core induced by laser inscription processSpecifically the operation at elevated temperature could turnan amorphous floppy microstructure of the fiber material toa nanocrystalline even microcrystalline morphology Withsuch a structural transition the FBG thermal responsefunction can be also described by
Δ120582 (119905) = 120582119861sdot [120581120576sdot 120576 + (120573 + 120572 + 120573
120588) sdot Δ119879 + (1 + 120585) sdot
10038161003816100381610038161003816100381610038161003816
Δ120588
120588
10038161003816100381610038161003816100381610038161003816]
= 119887 (0) + 119887 (1) sdot Δ119879
(5)
where 02 lt 120585 lt 03 This equation describes thefiber material which has experienced a structural transition
Journal of Sensors 3
High-density FBG sensor
Onset of phasetransition
FBG tempK-type TCFBG reflected power
Completion ofphase transition
1800
1500
1200
900
600
300
0
Tem
pera
ture
(∘F)
0 20 40 60 80 100Time (hours)
20
0
minus20
minus40
minus60
FBG
rsquos re
flect
ed p
ower
(dBm
)
Δ119879
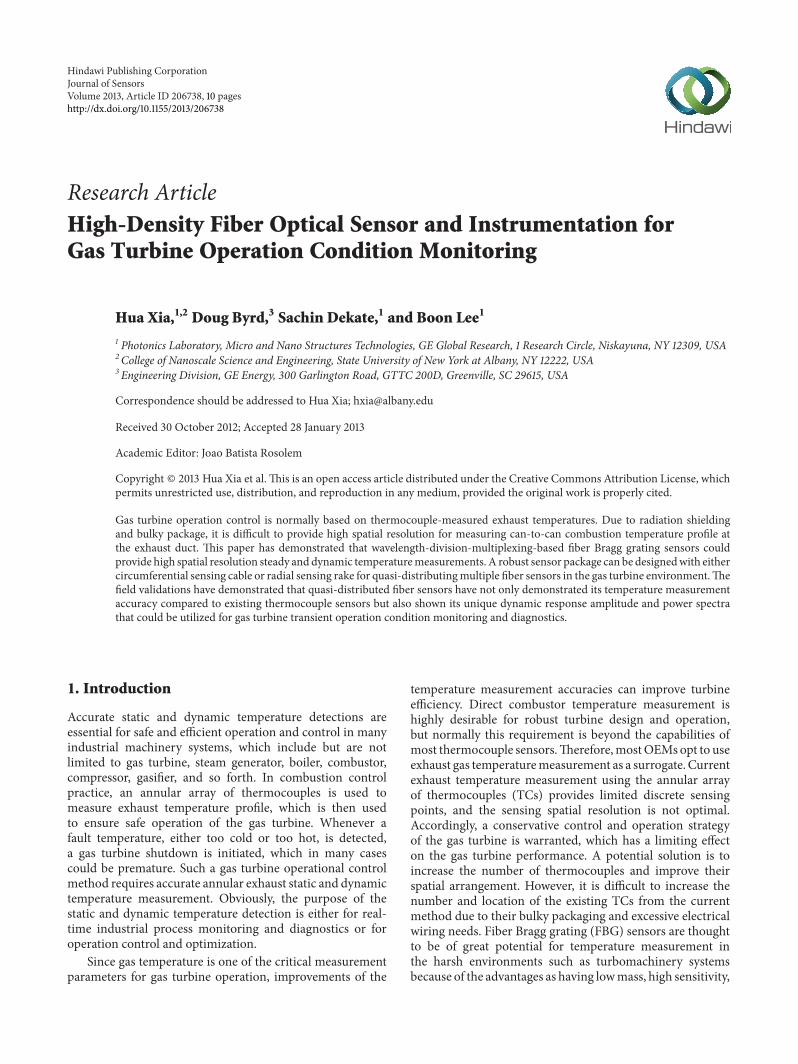
Figure 1 Fiber sensor response to external temperature changefrom ambient to 500∘F 900∘F 1200∘F (shaded area) and beyond itsmaximum operation temperature of 1200∘F
with a baseline upshift determined by fiber material densitychange Note that the temperature sensitivity has an addi-tional term where 120581
119879= 120582119861sdot (120572 + 120573 + 120573
120588) When 120573
120588gt 0
the temperature sensitivity 120581119879at high-density phase will be
greater than the low-density phase 120581119879(0) = 120582
119861sdot (120572 + 120573) as
seen from most of regenerated and Type-II FBGs with 120581119879sim
14ndash16 pm∘C For femtosecond inscribed FBGs in pure silicaor sapphire fibers the temperature sensitivity 120581
119879is120582119861sdot(120572+120573
120588)
where 120573120588depends mostly upon the used fiber material and
laser power level or irradiation energy Moreover (5) couldbe rewritten as (4) and this would approximate the inherentnature of the fiber sensor response determined by externaltemperature
The FBG elements used in this paper were fabricatedwith high-power ultraviolet (UV) laser with a phase masktechnology on a single-mode fiber material The fiber mate-rial and inscription process can be found from [14] whichhas summarized detailed grating fabrication process Theobtained FBG elements will follow a postthermal annealingprocess to stabilize material structural morphology Figure 1has shown a typical high-density-FBG-based temperaturesensor and its comparison with thermocouple measurementin three temperature ranges First is from ambient to 500∘Fsecond is from ambient to 900∘F and third is from ambientto sim1200∘F (sim650∘C) and beyond Since the fiber materialmicrostructure has been stabilized previously annealing tem-perature at 1200∘F a maximum allowed temperature thewavelength shift beyond 1200∘F (as in shaded area) will notcorrespond to real temperature because the fiber materialmicrostructure or morphology is transforming into anotherthermal stabilized state From 1200∘F to 1500∘F accompany-ing the fibermaterial structural transition the FBGrsquos reflectedpower has experienced a dramatic variation and the Braggresonant wavelength eventually stabilized at 1500∘F which isdefined as a new maximum allowed temperature Obviouslythis fiber material morphology transition has resulted inan offset of Δ119879 sim 80∘F than real temperature which isunacceptable for any machinery system control because of
this material physical phenomenon if the FBG is operated upto 1500∘F It should be pointed out that the observed ldquodipsrdquoin the FBGrsquos reflected power are more or less related to so-called grating regeneration process similar to described in[2 5 13] However to guarantee a FBG sensorrsquos accuracy andreliability the maximum operation temperature is normally10 less than its maximum allowed temperature Howeverif a pulsed and short-term thermal shock occurs than themaximum allowed temperature the deterioration of the fibersensorrsquos accuracy may be not noticeable On the contrary anew calibration is required for recovering FBG temperatureaccuracy by correcting the fiber material phase transitioninduced density and refractive index variations
3 Fiber Temperature Sensor Calibrationand Performance
Before its use as a temperature sensor a FBG has to becalibrated to obtain a so-called transfer function for convert-ing the relative measured Bragg resonant wavelength shiftto relative temperature change as shown in (4)-(5) On theother hand a transfer function may be invalid if the fibermaterial is experiencing microstructural transition processwhich occurs at 119879 gt 570∘C for Type-I FBGs and 119879 gt
870∘C forType-II FBGWhenever this situation occurs a newcalibration process will be required to ensure the measure-ment accuracy That is because the wavelength shift of theFBG is no longer associated with temperature Specificallywhen the fiber material is experiencing a microstructuraltransition its temperature sensing function is temporarilylost until a new fiber microstructure is thermally stabilizedAfterwards the FBG can be again used as a temperaturesensor with a new calibrated transfer function as discussedin the previous section Calibration process of the FBG versusstandard temperature gauge can be done in a programmablefurnace FBGs and standard temperature gauge are installedinside the furnace chamber where the temperature profile isuniform The maximum allowed temperature is defined asabout 10 higher than the desired operation temperatureBetween the lowest and maximum operation temperaturerange at least 10 data points corresponding to isothermalvalues will be required for extracting transfer function Aftersuch a calibration process the obtained transfer function canbe used directly to convert wavelength shift to temperature byembedding it into the software
To calibrate the Bragg resonant wavelength shift of aFBG against a standard thermometer it is normally tomeasure both signals in the temperature range of interestedunder an isothermal process For high accurate temperaturemeasurement a resistance temperature detector (RTD) orprecision resistance thermometer (PRT) could provide betterthan plusmn02∘C accuracy while k-Type TC only provides plusmn1∘Caccuracy RTD and PRT are popular because of their excellentstability and exhibit the most linear signal with respect totemperature of any electronic temperature sensor They aregenerally more expensive than alternatives however becauseof the careful construction and use of platinumThey are alsocharacterized by a slow response time low sensitivity and
4 Journal of Sensors
limited operation temperature (650∘C) However an RTDor PRT is commonly characterized by nonlinear quadric orcubic polynomial function of 119877
119879= 1198770[1+119886sdot119879+119887sdot119879
2
+119888sdot1198793
] or119877119879= 1198770sdot[1+119886sdot119879+119887sdot119879
2
] where119877119879is resistance at temperature
119879 1198770is nominal resistance and 119886 119887 and 119888 are constants used
to scale the RTD or PRTFor fiber sensor calibration on the other hand a transfer
function is not always linear as (4)-(5) For high-temperaturesensing application the thermooptic coefficient is a nonlinearfunction of temperature
120573eff equiv 120573 + 120573120588= 119860 + 119861 sdot Δ119879 + 119862 sdot Δ119879
2
(6)
where 120573eff may be positive or negative depending upon fibermaterial and wavelength and 119860 119861 and 119862 are constants Theassociated transfer function of the Bragg wavelength shift totemperature will have a similar form of cubic polynomialfunction for high-density FBG sensors
Δ120582 (119879) = 119886 (0) + 119886 (1) sdot Δ119879 + 119886 (2) sdot Δ1198792
+ 119886 (3) sdot Δ1198793
119886 (0) = 120582119861sdot (120581120576sdot 120576 + (1 + 120585) sdot
10038161003816100381610038161003816100381610038161003816
Δ120588
120588
10038161003816100381610038161003816100381610038161003816)
119886 (1) = 120582119861sdot (119860 + 120572) 119886 (2) = 120582
119861sdot 119861 119886 (3) = 120582
119861sdot 119862
(7)
For temperature119879 lt 200∘C the FBG sensor response can
be approximately expressed by Δ120582(119879) = 119886(0) + 119886(1) sdot Δ119879where 119886(1) asymp 120581
119879is low-density FBG temperature sensitivity
The nonlinear equation (7) however is regarded as a generictransfer function for accurate wavelength conversion for abroad temperature range measurement It should be pointedout that 119886(0) term in (7) reflects both strain effect andpotential fiber material compactness orand phase transitioninduced mass density contributions Whenever an FBGsensor has experienced extreme temperature or suffered frompackage-related strain effects the 119886(0) could be changedwhich leads to a temperature bias In another word (7) is onlyvalid to be used for a constant strain thermal stabilized FBGwhich either has not experienced any morphology change orthe microstructural transitions have been fully completed
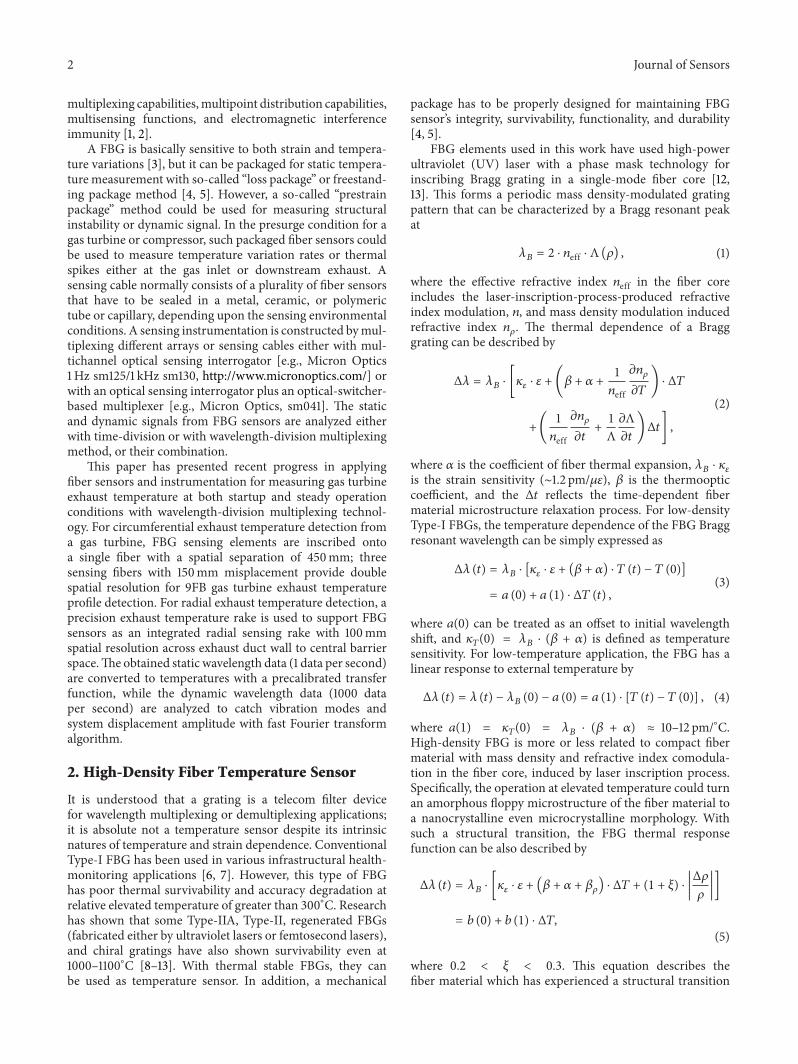
The thermal response of FBG elements is measured withan optical sensing interrogator [MOI 1Hz sm125ndash500sm041channel multiplexer] in which the wavelength can be tunedfrom 1510 nm to 1590 nm with plusmn1 pm accuracy A LabVIEW-based software automatically identifies FBG peak positionand saves both peak wavelength and converted temperaturevalues Figure 2(a) has shown a typical FBG spectrumwith itsBragg resonant wavelength at 154475 nm and peak power ofminus726 dBmat ambientThiswavelength is upshifted followingthe furnace temperatures as seen in Figure 2(b) The isother-mal values from FBG (blue lines) and from thermocouple(TC) (red lines) are plotted in Figure 2(c) and fitted to acubic polynomial functionThe obtained coefficients are usedto convert FBG wavelength shift values to temperatures (incircles) Figure 2(d) has plotted temperatures measured fromboth FBG (blue circles) and TC (red lines) during 150 hourscalibration process
With calibrated FBG sensors the thermal stability ordrifting trend has been studied under an isothermal con-dition Figure 3 has shown the measured wavelength andFBG peak power stability at 650∘C for degradation andlifetime estimations The data (circles) in Figure 3(a) hasshown a trend of the wavelength shift is sim54 times 10minus6 nmhrat 650∘C and that of FBG peak power loss is about minus(5 to20) times 10minus5 dBmhr If ignoring any oven thermal drift arisingfrom PID-controlled K-Type TC feedback control one canattribute such a trend as FBG sensor long-term thermal trendIf using approximate temperature sensitivity of 0015 nm∘Cfor 119879 gt 600
∘C the thermal variation caused temperatureerror is about plusmn04∘C per 1000 hours at 650∘C Note thatthese estimated thermal drifts are withinK-Type TC accuracyrange of plusmn04 namely plusmn25∘C at 650∘C On the other handthe measured FBG peak power loss trend could be used toestimate the lifetime of the FBG sensor at 650∘C operation Ifthe FBG peak power degradation is at a rate of minus(5 minus 20) times
10minus5 dBmhr it will lose 044ndash176 dBm per year A common
quality of an FBG sensor is of a typical peak power of 25 dBmthe corresponding time for losing 25 dBm peak power willtake 10 more years
However the real lifetime of the FBG actually stronglydepends upon external environment conditions andmechan-ical package On the other hand the linearly estimatedlifetime could be underestimated if the degradation trend isnonlinear In normal case a lifetime of 3ndash6 years is requiredfor industrial machinery system application
4 Fiber Temperature Sensor Packageand Installation
In order to install FBG sensor for high-density temperatureprofile measurement from a gas turbine engine or from acompressor interstage the operation within such a harshenvironment requires the fiber sensors to be packagedfor reliability Consequently a fiber sensor package shouldbe hermetically sealed for maintaining strong mechani-cal integrity against vibration thermal cycles and stress-corrosion-induced mechanical fatigues This is not only dueto fiber fragility itself but also due to the detrimental long-term effect of corrosive gases moisture and acidic and alka-line chemicals potentially attacking the sensors In additiona proper sensor package will not impede dynamic thermalmeasurement during gas turbine startup transient Sinceeach industrial system application may vary in temperaturepressure flow rate vibration and corrosion for examplethe sensor packages may differ from one industrial systemto another industrial system and survive different harshenvironmental conditions
FBG temperature sensors can be installed at precom-bustor flow path turbine inlet downstream of the com-bustor or exhaust and interstage locations for measuringdynamic temperature anomalies Presurge condition in aturbine engine causes abnormal temperature fluctuation inthe gas phase Key measurements for surge control aresuctiondischarge temperature and pressure and flow ratethrough the compressor The FBGs can be positioned at
Journal of Sensors 5
119875 = minus726dBm
10
minus10
minus30
minus50
minus70
Refle
cted
pow
er (d
Bm)
FBG sensor
1530 1540 1550 1560Wavelength shift (nm)
120582119861 = 154475 nm
(a)
1556
1552
1548
1544
Wav
eleng
th sh
ift (n
m)
0 40 80 120Time (hrs)
1500
1000
500
0
TC (∘
F)
(b)
Δ120582 = 4666Δ119879 + 3968 times 10minus3Δ1198792 minus 1328 times 10minus6Δ1198793
12500
10000
7500
5000
2500
0
Wav
eleng
th sh
ift (p
m)
0 400 800 1200 1600Thermocouple (∘F)
(c)
1500
1200
900
600
300
00 50 100 150
Time (hours)
FBGK-type TC
Tem
pera
ture
(∘F)
(d)
Figure 2 Fiber sensor calibration process for converting the measured Bragg resonant wavelength shift to temperature
1534
15338
15336
15334
15332
1533
Wav
eleng
th sh
ift (n
m)
TFBG (119879 = 650∘C)
0 500 1000 1500Time (hrs)
minus54 times 10minus6 nmhr
(a)
Peak
loss
(dBm
)
0
minus20
minus10
minus30
minus40
TFBG thermal stability
0 1000 2000 3000 4000Time (hrs)
Type-II FBG (minus2 times 10minus4 dBmhr)
Type-I FBG (minus457 times 10minus5 dBmhr)
119879 = 1200∘F (650 ∘C)
(b)
Figure 3 Short-term measured FBG sensor thermal stability (a) and FBG peak power loss at 650∘C
multiple locations in the compressor For example the FBGtemperature sensor installed around the periphery of theturbine engine air inlet could detect presurge temperaturespikes In addition the fiber sensing array may be installed inthe pre-combustor flow path downstream of the combustorturbine engine inlet and between the compressor stagesIf the fiber sensors are installed in the turbine exhaustduct it will enable the monitoring temperature variation
that provides a means of detecting combustor health Thismeasured temperature combinedwith pressure enables betterdiagnostics and compressor surge protection
Two fiber sensor packages have been designed for gas tur-bine exhaust temperature measurement First one is a cablebased for circumferential exhaust temperature detection inwhich the FBG elements are inscribed onto three fibers andsealed inside an Inconel 625 tube as described by [15] The
6 Journal of Sensors
(a)
FBG1
FBG12
FBG5
FBG6
FBG7
FBG8
FBG10
FBG9
FBG11
FBG13
FBG3
FBG4FBG2
TC13
TC14 TC15
TC16
TC17
TC18
TC19
TC20
TC21
FBG1
FBG12
FBG6
FBG7
FBG8
FBG10
FBG9
FBG11
FBG13
FBG4FBG2
TC13
TC14 TC15
TC16
TC17
TC18
TC19
TC20
TC21
FBG5FBG3
(b)
FBG1
FBG20
FBG10
(c)
Ligh
t in
Ligh
t out
Diffuser shell
How gas flow
Exhaustthermocouple
Bearing tube
(d)
Figure 4 Fiber sensor installation in the gas turbine exhaust duct with circumferential fiber sensing cable in (a) and (b) andwith fiber sensingrake in (c) and (d)
second one is based on a precision exhaust temperature rakewith FBG sensors attached to its surface
This integrated radial sensing rake has 100mm spatialresolution across exhaust duct wall to central barrier spacedescribed by [15] Figure 4 shows two configurations formeasuring both static and dynamic gas turbine exhaust tem-perature response For addressing the entitlement of the FBGsensor performances in accuracy reliability and durability asa backup candidate technology of the existing thermocouplesensor a fiber sensing cable is installed close to the existingexhaust thermocouples with a circumferential configurationas shown in Figures 4(a) and 4(b) For evaluating dynamicperformance in response time to transient operation condi-tion variation a fiber sensing rake is installed in a gas turbinethat can measure radial exhaust temperature from diffuser tocentral bearing tube as shown in Figures 4(c) and 4(d) A 1ndash5Hz optical sensing interrogator with 4 channels capabilityis used to detect static signal while a 1000Hz (1ms) opticalsensing interrogator is used for dynamic signal detection
For circumferential exhaust temperature detection FBGelements are inscribed onto a single fiber with a spatial sepa-ration of 450mm three sensing fibers with 150mmmisplace-ment provide double spatial resolution for gas turbine exhausttemperature profile detection The obtained wavelength data
are converted to temperatures with a precalibrated transferfunction that enables the measured FBG sensor static datato be compared with the thermocouple sensors The fibersensing cable is clamped to an existing radiation TC shieldwith entrances holes in between two thermocouples [15]Thedown selection of a metal tube geometry and size has beendetermined with a simulation that has focused on thermalstress severity mechanical strength and natural vibrationfrequency of the metal tube Since rotor blade rotation speedis 3600 rpm for a 60Hz gas turbine and 3000 rpm for a 50Hzgas turbine its fundamental first and second high-ordervibration frequencies range from 50 to 300Hz To avoid anoverlap between the natural vibration frequency of the metaltube packaged fiber sensing cable and gas turbinersquos vibrationband the modeling has shown that an Inconel tube couldmeet such a requirement with appropriate diameter and wallthickness
For radial exhaust temperature detection a precisionexhaust temperature rake is used to support FBG sensors asan integrated radial sensing rake There are 9 TCs that areembedded into the rake with a 3mm open hole to enablehot gas to pass through the hole for TC measuring hot gastemperature However the fiber sensing array is sealed in afine-gage Inconel 625 tube which is welded onto the rake
Journal of Sensors 7
surface with one-to-one correspondence between the FBGandTC location Since the Inconel tube is attached to the rakesurface and faces the hot gas flow the combustion-dynamics-induced transient total temperature 119879
119905(119905) is proportional to
flow velocity by
119879119905(119905) = 119879
119878(119905) +
120592(119905)2
2119888119901
(8)
where 119879119878(119905) is static temperature 119888
119901is gas-specific heat
coefficient and 120592(119905) is transient gas flow velocity When FBGsensors are used tomeasure both static and total temperatureswith (4) the gas flow velocity or combustion-induced flowdynamics can be directly measured by
120592 (119905) =2119888119901
120581119879(0)
(Δ120582 [119879119905(119905)] minus Δ120582 [119879
119878(119905)])12
Vortex shedding frequency prop FFT
2119888119901
120581119879(0)
(Δ120582 [119879119905(119905)] minus Δ120582 [119879
119878(119905)])
(9)
The static temperature corresponds to exhaust temperaturewith flow velocity close to zero or near duct boundary layerThe vortex shedding frequency can be used to indirectlycharacterize the flow characteristics using Strouhal numberwhich is determined by frequencylowast lengthvelocity It is clearthat the fast Fourier transform of the differentiation of staticand dynamic signals could be used to correlate to differentdynamic events and parameters such as antisurge turbineblade rotation speed variation and combustion dynamicsand so forth For example when fuel quality changes it leadsto gas-specific heat (119888
119901) variation or vortex shading frequency
variation To measure dynamic FBG response to turbineoperation condition it normally requires high-band opticalsensing interrogator that ranges from 1 kHz to 100 kHz
5 Fiber Sensor Response toStatic Exhaust Temperature
During a typical gas turbine factory test different instru-ments will monitor various parameters such as crankingmotor output turbine HP shaft speed fuel stroke referenceIGV angle averaged compressor inlet temperature vibrationamplitude turbine exhaust static pressure and air flow tofully characterize a gas turbinersquos performance before its deliv-ery to customer Corresponding to this baseline performancetest the gas turbine is under full speed without loading testFigure 5 is a typical test from the fiber sensing rake with20 FBG sensors Since the fiber sensing rake is an integrationof the existing exhaust precision temperature rake and FBGsthere are also nine TCs inside the rake as a reference Sincethe first 3 FBGs are close to gas turbine diffuser wall theboundary layer flow near the wall surface causes the mea-sured temperature to be lower than the others In Figure 5(b)these averaged TCs are plotted against additional 17 FBGs Tosee details from both TC and FBG sensors Figures 5(c) and5(d) have plotted measured temperature during the steady-status operation condition
Five of nine TCs data have been shown about 5∘Fvariation during 100min steady operation time while fibersensors have shown about 9-10∘F variation This discrepancyis due to the fact that the TCs are located inside the rakewith an open hole of sim1206013mm and the fiber sensing tubeis welded to the rake surface across nine holes Anotherpotential origination could reflect the nature of the totaltemperature measured by the fiber sensors in contrast to thestatic temperaturemeasured by the TCsMeanwhile the fibersensors have shown comparable noise characteristics withrespect to the TCs which may relate to flow rate variationduring state status operation
Figure 6 has further shown the measured temperatureprofile from a full test of nearly 7 hours from a 7FB gasturbine manufacturing qualification process The exhausttemperature from circumferential fiber sensing cable can beplotted in 3D as shown in Figure 6(a) During the startupstage of the gas turbine performance monitoring is done viaa polar diagram to highlight anomalies quickly As shownin Figure 6(b) the measured exhaust temperature appearsnot to be uniform across 27 TCs The FBG sensor at 170locations also indicates the same anomalous variation It isnoticeable that the thermal profile is not symmetrical andit is very likely due to varied can-to-can combustion andhot gas flow variation In addition the dynamic processduring startup provides variation as compared to steadybase load operation which shows up on the polar diagramas temperature variation It is clear that both 3D thermalprofile and polar diagram measured with high-density fibersensors could provide directly information on the gas turbineperformance which are comparable to the data measuredfrom existing exhaust thermocouples
6 Fiber Sensor Response to Dynamic Process
The fiber sensing rake and surface-attached fiber sensorshave shown to be comparable to standard production TCsand also to be more sensitive to dynamic processes This isillustrated by the fiber sensor response amplitude as shown inFigure 7 Since the first FBG is close to exhaust diffuser ductits response amplitude is relatively small but with the increaseof the radial distance towards the internal bearing tube thedynamic amplitudes of the FBGs have shown correspondingincrease This increased amplitude mainly arises from thestartup transient process with increased fuel gas flow com-bustion dynamics and pressure variation from compressorto gas turbine exhaust However the dynamic amplitudemay be used for monitoring anomalous structural instabilitypresurge and incomplete combustion events Formonitoringthese dynamic events the relative dynamic amplitude is moreimportant than the absolute exhaust temperature measure-ment
The other critical dynamic response feature of the fibersensor is illustrated in Figure 8 where the FBG sensorrsquosdynamic temperature response is plotted against the samelocation TC data as a function of time during first severalminutes during the gas turbine startup transient The smalldifference could be due to hot gas flow variation inducedsensing rake oscillation or strain effect
8 Journal of Sensors
1585
1575
1565
1555
1545
1535
1525
Wav
eleng
th sh
ift (n
m)
0 100 200 300 400Time (min)
FBG20
FBG18
FBG16
FBG14
FBG12
FBG10
FBG8
FBG6
FBG4
FBG2
FBG19
FBG17
FBG15
FBG13
FBG11
FBG9
FBG7
FBG5
FBG3
FBG1
(a)
FBG
sens
or re
spon
se (∘
F)
1000
800
600
400
200
0
FBG4-FBG20TC
7FA GT FBGTC tests
0 100 200 300 400Time (min)
(b)
TC re
spon
se (∘
F)
625
620
615
610
605
600
595
7FA GT TC test
100 120 140 160 180 200Time (min)
(c)
625
620
615
610
605
600
595100 120 140 160 180 200
Time (min)
FBG
resp
onse
(∘F)
7FA GT fiber sensor test
(d)
Figure 5 Fiber sensor and TC measured exhaust temperatures during a 7FA GT test with radial fiber sensing rake
In addition Figure 9 shows the dynamic response of thefiber sensors after leaving the transient startup conditionThe bottom power spectra of the Figure 9 clearly show thatthe gas turbine cranking process has a high-level inharmonicoscillation At gas turbine startup the measured frequency isclose to 60Hz of the gas turbine blade rotation speed but itgradually shifts to exhaust rake natural vibration frequencyof sim40Hz during steady-status operation Such a dynamicresponse could be leveraged as a precursor for determiningthe health of the gas turbine Thermal response of the FBGsensors can be used similar to annular array of thermocouplesas a sensor input for fuel control to the combustion systemThe dynamic temperature and power spectra can be utilizedfor antisurge gas volumetric flow rate combustion efficiencyand turbine-blade-rotation-related structural instability anal-yses
It is also important to note that the converted powerspectra and associated vibration mode profile can be usedfor gas turbine long-term performance degradation analysis
One of the features is its broad frequency band profile andits response amplitude With increase vibration mechan-ical issue becomes more of a concern which may causethe gas turbine to degrade at an increased rate Thesemechanical issues could come from the torque variationbetween the compressor and turbine coupling rotor bladevibration and tip clearance change bearing wearing bucketparts loosening Another valuable feature is fiber sensorrsquosmultifunctional nature that can be used for simultaneouslymeasuring dynamic and static temperature while its responseamplitude can be associated with various dynamic and tran-sient responses that could be related to various mechanicalthermal and electric variations
7 Conclusions
Fiber-Bragg-grating-based sensing technology has been fur-ther developed and validated in power generation systemsuch as gas turbine for operation condition monitoring
Journal of Sensors 9
0 1 2 3 4 5 6 7 8
Time (hours)
05
1015
2025
30
Sensor number
1200
1000
800
600
400
2000
Tem
pera
ture
(F)
(a)
1000
800
600
400
200
0
200
400
600
800
100060
90120
150
180
210
240270
300
330
0
30
27 fiber sensors(Dec 11 2007)
60200 PM 60430 PM 60414 PM 60445 PM 60518 PM 60549 PM
60602 PM 60659 PM 60810 PM 60936 PM 60959 PM 61102 PM
Test2 run1
(b)
Figure 6 Exhaust thermal profile measured from a circumferential fiber sensing cable of 29 FBGs (a) and polar diagram of all the fibersensors during a gas turbine startup process (b)
250
200
150
100
50
0 2 4 6 80
Dyn
amic
ampl
itude
(pm
)
Time (s)
FBG10
FBG9
FBG8
FBG7
FBG6
FBG5
FBG4FBG3FBG2FBG1
Figure 7Themeasured dynamic response amplitude from FBG1 toFBG10 from a fiber sensing rake
The fiber sensor has demonstrated its unique advantagein providing high-density multipoint and multifunctioncapability in measuring static and dynamic responses from agas turbine To meet industrial harsh environmental sensingneeds one of the critical engineering work is the fibersensor package which varies from one machinery systemto another system The fiber sensor package is not only
Tem
pera
ture
(∘F)
1000
800
600
400
200
0
Time (s)0 60 120 180 240 300 360 420 480
FBGTC
Figure 8 The transient response comparison between the fibersensor and thermocouple from a 7FA gas turbine manufacturingqualification test
required to provide accuratemeasurement but also to preventmechanical strength degradation from elevated temperaturemassive hot gas flow and blade-rotation-related structuralvibrationThe work presented in this paper is to demonstratea new testmeasurement technology that also can be usedto measure multipoint temperature from a gas turbine withonly one fiber sensing cable and one penetration This fibersensing method discussed herein is not limited to gas turbineexhaust temperaturemeasurement Its uniquemultifunctionstatic and dynamic responses and distributed sensing capa-bilities make the high-density fiber sensor more valuable for
10 Journal of Sensors
8
6
4
2
020 60 100 140 180
FBG
6
Time (min)
(548 PMndash700 PM October 24 2008)
Frequency (Hz)
FFT
(rm
s120583120576)
6040
200
(a)
1
15
0
05
1006020140 180 Time (m
in)
Frequency (Hz)
FFT
(rm
s120583120576)
2016
128
40
FBG4 response to 7FA gas turbine startup(540 PMndash601 PM October 24 2008)
(b)
Figure 9 Fiber sensor measured dynamic signal and corresponding power spectra from 7FA gas turbine startup transient qualification test
next-generation power generation turbomachinery systemoperation with respect to condition monitoring diagnosticscontrol and optimization
Acknowledgments
During this development work Kevin McCarthy JuntaoWuRenato Guida Mohamed Sakami Jerry Lopez Alex RossDavid OrsquoConnor C Wagner James Nutt Ronald Gilstrapand Mike Krok have been involved in many fundamentalresearch laboratory test work field sensor installations andvalidations
References
[1] K O Hill Y Fujii D C Johnson and B S Kawasaki ldquoPhoto-sensitivity in optical fiber waveguides application to reflectionfilter fabricationrdquo Applied Physics Letters vol 32 no 10 article647 3 pages 1978
[2] M Fokine ldquoUnderlying mechanisms applications and limita-tions of chemical composition gratings in silica based fibersrdquoJournal of Non-Crystalline Solids vol 349 no 1ndash3 pp 98ndash1042004
[3] S Pal T Sun K T V Grattan et al ldquoStrain-independent tem-perature measurement using a type-l and type-IIA optical fiberBragg grating combinationrdquo Review of Scientific Instrumentsvol 75 no 5 pp 1327ndash1331 2004
[4] H Xia K McCarthy and C M Young ldquoHarsh environmenttemperature sensing system and methodrdquo US Patent 79123342011
[5] D Barrera V Finazzi J Villatoro S Sales and V PrunerildquoPackaged optical sensors based on regenerated fiber bragggratings for high temperature applicationsrdquo IEEE Sensors Jour-nal vol 12 no 1 pp 107ndash112 2012
[6] H Guo G Xiao N Mrad and J Yao ldquoFiber optic sensors forstructural health monitoring of air platformsrdquo Sensors vol 11no 4 pp 3687ndash3705 2011
[7] L Hui and O Jinping ldquoStructural health monitoring fromsensing technology stepping to health diagnosisrdquo ProcediaEngineering vol 14 pp 753ndash760 2011
[8] B Zhang ldquoHigh-temperature resistance fiber bragg gratingtemperature sensor fabricationrdquo IEEE Sensors Journal vol 7 no4 pp 586ndash591 2007
[9] J Canning S Bandyopadhyay M Stevenson and K CookldquoFiber Bragg grating sensor for high temperature applicationrdquoin Proceedings of the Opto-Electronics and CommunicationsConference and the Australian Conference On Optical FibreTechnology (OECCACOFT rsquo08) July 2008
[10] G Brambilla ldquoHigh-temperature fibre Bragg grating ther-mometerrdquo Electronics Letters vol 38 no 17 pp 954ndash956 2002
[11] H Xia ldquoAdvanced fiber optical sensor and instrumentation forpower generation industrial monitoring and diagnosticsrdquo inFiber Optic Sensors and Applications vol 8370 of Proceedings ofSPIE 2012
[12] B Zhang andM Kahrizi ldquoHigh temperature resistance temper-ature sensor based on the hydrogen loaded Fiber Bragg gratingrdquoin Proceedings of the IEEE Conference on Sensors pp 624ndash627November 2005
[13] J Li D Zhang XWen and L Li ldquoFabrication and temperaturecharacteristics of thermal regenerated fiber bragg gratingrdquo inProceedings of the Symposium on Photonics and Optoelectronics(SOPO rsquo12) pp 1ndash4 2012
[14] H Xia ldquoFiber Bragg grating and fabricationmethodrdquo US Patent7574075 2009
[15] H Xia K McCarthy J Nutt et al ldquoBragg grating sensingpackage and system for gas turbine temperature measurementrdquoUS Patent 8306373 2012
International Journal of
AerospaceEngineeringHindawi Publishing Corporationhttpwwwhindawicom Volume 2014
RoboticsJournal of
Hindawi Publishing Corporationhttpwwwhindawicom Volume 2014
Hindawi Publishing Corporationhttpwwwhindawicom Volume 2014
Active and Passive Electronic Components
Control Scienceand Engineering
Journal of
Hindawi Publishing Corporationhttpwwwhindawicom Volume 2014
International Journal of
RotatingMachinery
Hindawi Publishing Corporationhttpwwwhindawicom Volume 2014
Hindawi Publishing Corporation httpwwwhindawicom
Journal ofEngineeringVolume 2014
Submit your manuscripts athttpwwwhindawicom
VLSI Design
Hindawi Publishing Corporationhttpwwwhindawicom Volume 2014
Hindawi Publishing Corporationhttpwwwhindawicom Volume 2014
Shock and Vibration
Hindawi Publishing Corporationhttpwwwhindawicom Volume 2014
Civil EngineeringAdvances in
Acoustics and VibrationAdvances in
Hindawi Publishing Corporationhttpwwwhindawicom Volume 2014
Hindawi Publishing Corporationhttpwwwhindawicom Volume 2014
Electrical and Computer Engineering
Journal of
Advances inOptoElectronics
Hindawi Publishing Corporation httpwwwhindawicom
Volume 2014
The Scientific World JournalHindawi Publishing Corporation httpwwwhindawicom Volume 2014
SensorsJournal of
Hindawi Publishing Corporationhttpwwwhindawicom Volume 2014
Modelling amp Simulation in EngineeringHindawi Publishing Corporation httpwwwhindawicom Volume 2014
Hindawi Publishing Corporationhttpwwwhindawicom Volume 2014
Chemical EngineeringInternational Journal of Antennas and
Propagation
International Journal of
Hindawi Publishing Corporationhttpwwwhindawicom Volume 2014
Hindawi Publishing Corporationhttpwwwhindawicom Volume 2014
Navigation and Observation
International Journal of
Hindawi Publishing Corporationhttpwwwhindawicom Volume 2014
DistributedSensor Networks
International Journal of
2 Journal of Sensors
multiplexing capabilitiesmultipoint distribution capabilitiesmultisensing functions and electromagnetic interferenceimmunity [1 2]
A FBG is basically sensitive to both strain and tempera-ture variations [3] but it can be packaged for static tempera-ture measurement with so-called ldquoloss packagerdquo or freestand-ing package method [4 5] However a so-called ldquoprestrainpackagerdquo method could be used for measuring structuralinstability or dynamic signal In the presurge condition for agas turbine or compressor such packaged fiber sensors couldbe used to measure temperature variation rates or thermalspikes either at the gas inlet or downstream exhaust Asensing cable normally consists of a plurality of fiber sensorsthat have to be sealed in a metal ceramic or polymerictube or capillary depending upon the sensing environmentalconditions A sensing instrumentation is constructed bymul-tiplexing different arrays or sensing cables either with mul-tichannel optical sensing interrogator [eg Micron Optics1Hz sm1251 kHz sm130 httpwwwmicronopticscom] orwith an optical sensing interrogator plus an optical-switcher-based multiplexer [eg Micron Optics sm041] The staticand dynamic signals from FBG sensors are analyzed eitherwith time-division or with wavelength-division multiplexingmethod or their combination
This paper has presented recent progress in applyingfiber sensors and instrumentation for measuring gas turbineexhaust temperature at both startup and steady operationconditions with wavelength-division multiplexing technol-ogy For circumferential exhaust temperature detection froma gas turbine FBG sensing elements are inscribed ontoa single fiber with a spatial separation of 450mm threesensing fibers with 150mm misplacement provide doublespatial resolution for 9FB gas turbine exhaust temperatureprofile detection For radial exhaust temperature detection aprecision exhaust temperature rake is used to support FBGsensors as an integrated radial sensing rake with 100mmspatial resolution across exhaust duct wall to central barrierspaceThe obtained static wavelength data (1 data per second)are converted to temperatures with a precalibrated transferfunction while the dynamic wavelength data (1000 dataper second) are analyzed to catch vibration modes andsystem displacement amplitude with fast Fourier transformalgorithm
2 High-Density Fiber Temperature Sensor
It is understood that a grating is a telecom filter devicefor wavelength multiplexing or demultiplexing applicationsit is absolute not a temperature sensor despite its intrinsicnatures of temperature and strain dependence ConventionalType-I FBG has been used in various infrastructural health-monitoring applications [6 7] However this type of FBGhas poor thermal survivability and accuracy degradation atrelative elevated temperature of greater than 300∘C Researchhas shown that some Type-IIA Type-II regenerated FBGs(fabricated either by ultraviolet lasers or femtosecond lasers)and chiral gratings have also shown survivability even at1000ndash1100∘C [8ndash13] With thermal stable FBGs they canbe used as temperature sensor In addition a mechanical
package has to be properly designed for maintaining FBGsensorrsquos integrity survivability functionality and durability[4 5]
FBG elements used in this work have used high-powerultraviolet (UV) laser with a phase mask technology forinscribing Bragg grating in a single-mode fiber core [1213] This forms a periodic mass density-modulated gratingpattern that can be characterized by a Bragg resonant peakat
120582119861= 2 sdot 119899eff sdot Λ (120588) (1)
where the effective refractive index 119899eff in the fiber coreincludes the laser-inscription-process-produced refractiveindex modulation 119899 and mass density modulation inducedrefractive index 119899
120588 The thermal dependence of a Bragg
grating can be described by
Δ120582 = 120582119861sdot [120581120576sdot 120576 + (120573 + 120572 +
1
119899eff
120597119899120588
120597119879) sdot Δ119879
+(1
119899eff
120597119899120588
120597119905+1
Λ
120597Λ
120597119905)Δ119905]
(2)
where 120572 is the coefficient of fiber thermal expansion 120582119861sdot 120581120576
is the strain sensitivity (sim12 pm120583120576) 120573 is the thermoopticcoefficient and the Δ119905 reflects the time-dependent fibermaterial microstructure relaxation process For low-densityType-I FBGs the temperature dependence of the FBG Braggresonant wavelength can be simply expressed as
Δ120582 (119905) = 120582119861sdot [120581120576sdot 120576 + (120573 + 120572) sdot 119879 (119905) minus 119879 (0)]
= 119886 (0) + 119886 (1) sdot Δ119879 (119905)
(3)
where 119886(0) can be treated as an offset to initial wavelengthshift and 120581
119879(0) = 120582
119861sdot (120573 + 120572) is defined as temperature
sensitivity For low-temperature application the FBG has alinear response to external temperature by
Δ120582 (119905) = 120582 (119905) minus 120582119861(0) minus 119886 (0) = 119886 (1) sdot [119879 (119905) minus 119879 (0)] (4)
where 119886(1) = 120581119879(0) = 120582
119861sdot (120573 + 120572) asymp 10ndash12 pm∘C
High-density FBG is more or less related to compact fibermaterial with mass density and refractive index comodula-tion in the fiber core induced by laser inscription processSpecifically the operation at elevated temperature could turnan amorphous floppy microstructure of the fiber material toa nanocrystalline even microcrystalline morphology Withsuch a structural transition the FBG thermal responsefunction can be also described by
Δ120582 (119905) = 120582119861sdot [120581120576sdot 120576 + (120573 + 120572 + 120573
120588) sdot Δ119879 + (1 + 120585) sdot
10038161003816100381610038161003816100381610038161003816
Δ120588
120588
10038161003816100381610038161003816100381610038161003816]
= 119887 (0) + 119887 (1) sdot Δ119879
(5)
where 02 lt 120585 lt 03 This equation describes thefiber material which has experienced a structural transition
Journal of Sensors 3
High-density FBG sensor
Onset of phasetransition
FBG tempK-type TCFBG reflected power
Completion ofphase transition
1800
1500
1200
900
600
300
0
Tem
pera
ture
(∘F)
0 20 40 60 80 100Time (hours)
20
0
minus20
minus40
minus60
FBG
rsquos re
flect
ed p
ower
(dBm
)
Δ119879
Figure 1 Fiber sensor response to external temperature changefrom ambient to 500∘F 900∘F 1200∘F (shaded area) and beyond itsmaximum operation temperature of 1200∘F
with a baseline upshift determined by fiber material densitychange Note that the temperature sensitivity has an addi-tional term where 120581
119879= 120582119861sdot (120572 + 120573 + 120573
120588) When 120573
120588gt 0
the temperature sensitivity 120581119879at high-density phase will be
greater than the low-density phase 120581119879(0) = 120582
119861sdot (120572 + 120573) as
seen from most of regenerated and Type-II FBGs with 120581119879sim
14ndash16 pm∘C For femtosecond inscribed FBGs in pure silicaor sapphire fibers the temperature sensitivity 120581
119879is120582119861sdot(120572+120573
120588)
where 120573120588depends mostly upon the used fiber material and
laser power level or irradiation energy Moreover (5) couldbe rewritten as (4) and this would approximate the inherentnature of the fiber sensor response determined by externaltemperature
The FBG elements used in this paper were fabricatedwith high-power ultraviolet (UV) laser with a phase masktechnology on a single-mode fiber material The fiber mate-rial and inscription process can be found from [14] whichhas summarized detailed grating fabrication process Theobtained FBG elements will follow a postthermal annealingprocess to stabilize material structural morphology Figure 1has shown a typical high-density-FBG-based temperaturesensor and its comparison with thermocouple measurementin three temperature ranges First is from ambient to 500∘Fsecond is from ambient to 900∘F and third is from ambientto sim1200∘F (sim650∘C) and beyond Since the fiber materialmicrostructure has been stabilized previously annealing tem-perature at 1200∘F a maximum allowed temperature thewavelength shift beyond 1200∘F (as in shaded area) will notcorrespond to real temperature because the fiber materialmicrostructure or morphology is transforming into anotherthermal stabilized state From 1200∘F to 1500∘F accompany-ing the fibermaterial structural transition the FBGrsquos reflectedpower has experienced a dramatic variation and the Braggresonant wavelength eventually stabilized at 1500∘F which isdefined as a new maximum allowed temperature Obviouslythis fiber material morphology transition has resulted inan offset of Δ119879 sim 80∘F than real temperature which isunacceptable for any machinery system control because of
this material physical phenomenon if the FBG is operated upto 1500∘F It should be pointed out that the observed ldquodipsrdquoin the FBGrsquos reflected power are more or less related to so-called grating regeneration process similar to described in[2 5 13] However to guarantee a FBG sensorrsquos accuracy andreliability the maximum operation temperature is normally10 less than its maximum allowed temperature Howeverif a pulsed and short-term thermal shock occurs than themaximum allowed temperature the deterioration of the fibersensorrsquos accuracy may be not noticeable On the contrary anew calibration is required for recovering FBG temperatureaccuracy by correcting the fiber material phase transitioninduced density and refractive index variations
3 Fiber Temperature Sensor Calibrationand Performance
Before its use as a temperature sensor a FBG has to becalibrated to obtain a so-called transfer function for convert-ing the relative measured Bragg resonant wavelength shiftto relative temperature change as shown in (4)-(5) On theother hand a transfer function may be invalid if the fibermaterial is experiencing microstructural transition processwhich occurs at 119879 gt 570∘C for Type-I FBGs and 119879 gt
870∘C forType-II FBGWhenever this situation occurs a newcalibration process will be required to ensure the measure-ment accuracy That is because the wavelength shift of theFBG is no longer associated with temperature Specificallywhen the fiber material is experiencing a microstructuraltransition its temperature sensing function is temporarilylost until a new fiber microstructure is thermally stabilizedAfterwards the FBG can be again used as a temperaturesensor with a new calibrated transfer function as discussedin the previous section Calibration process of the FBG versusstandard temperature gauge can be done in a programmablefurnace FBGs and standard temperature gauge are installedinside the furnace chamber where the temperature profile isuniform The maximum allowed temperature is defined asabout 10 higher than the desired operation temperatureBetween the lowest and maximum operation temperaturerange at least 10 data points corresponding to isothermalvalues will be required for extracting transfer function Aftersuch a calibration process the obtained transfer function canbe used directly to convert wavelength shift to temperature byembedding it into the software
To calibrate the Bragg resonant wavelength shift of aFBG against a standard thermometer it is normally tomeasure both signals in the temperature range of interestedunder an isothermal process For high accurate temperaturemeasurement a resistance temperature detector (RTD) orprecision resistance thermometer (PRT) could provide betterthan plusmn02∘C accuracy while k-Type TC only provides plusmn1∘Caccuracy RTD and PRT are popular because of their excellentstability and exhibit the most linear signal with respect totemperature of any electronic temperature sensor They aregenerally more expensive than alternatives however becauseof the careful construction and use of platinumThey are alsocharacterized by a slow response time low sensitivity and
4 Journal of Sensors
limited operation temperature (650∘C) However an RTDor PRT is commonly characterized by nonlinear quadric orcubic polynomial function of 119877
119879= 1198770[1+119886sdot119879+119887sdot119879
2
+119888sdot1198793
] or119877119879= 1198770sdot[1+119886sdot119879+119887sdot119879
2
] where119877119879is resistance at temperature
119879 1198770is nominal resistance and 119886 119887 and 119888 are constants used
to scale the RTD or PRTFor fiber sensor calibration on the other hand a transfer
function is not always linear as (4)-(5) For high-temperaturesensing application the thermooptic coefficient is a nonlinearfunction of temperature
120573eff equiv 120573 + 120573120588= 119860 + 119861 sdot Δ119879 + 119862 sdot Δ119879
2
(6)
where 120573eff may be positive or negative depending upon fibermaterial and wavelength and 119860 119861 and 119862 are constants Theassociated transfer function of the Bragg wavelength shift totemperature will have a similar form of cubic polynomialfunction for high-density FBG sensors
Δ120582 (119879) = 119886 (0) + 119886 (1) sdot Δ119879 + 119886 (2) sdot Δ1198792
+ 119886 (3) sdot Δ1198793
119886 (0) = 120582119861sdot (120581120576sdot 120576 + (1 + 120585) sdot
10038161003816100381610038161003816100381610038161003816
Δ120588
120588
10038161003816100381610038161003816100381610038161003816)
119886 (1) = 120582119861sdot (119860 + 120572) 119886 (2) = 120582
119861sdot 119861 119886 (3) = 120582
119861sdot 119862
(7)
For temperature119879 lt 200∘C the FBG sensor response can
be approximately expressed by Δ120582(119879) = 119886(0) + 119886(1) sdot Δ119879where 119886(1) asymp 120581
119879is low-density FBG temperature sensitivity
The nonlinear equation (7) however is regarded as a generictransfer function for accurate wavelength conversion for abroad temperature range measurement It should be pointedout that 119886(0) term in (7) reflects both strain effect andpotential fiber material compactness orand phase transitioninduced mass density contributions Whenever an FBGsensor has experienced extreme temperature or suffered frompackage-related strain effects the 119886(0) could be changedwhich leads to a temperature bias In another word (7) is onlyvalid to be used for a constant strain thermal stabilized FBGwhich either has not experienced any morphology change orthe microstructural transitions have been fully completed
The thermal response of FBG elements is measured withan optical sensing interrogator [MOI 1Hz sm125ndash500sm041channel multiplexer] in which the wavelength can be tunedfrom 1510 nm to 1590 nm with plusmn1 pm accuracy A LabVIEW-based software automatically identifies FBG peak positionand saves both peak wavelength and converted temperaturevalues Figure 2(a) has shown a typical FBG spectrumwith itsBragg resonant wavelength at 154475 nm and peak power ofminus726 dBmat ambientThiswavelength is upshifted followingthe furnace temperatures as seen in Figure 2(b) The isother-mal values from FBG (blue lines) and from thermocouple(TC) (red lines) are plotted in Figure 2(c) and fitted to acubic polynomial functionThe obtained coefficients are usedto convert FBG wavelength shift values to temperatures (incircles) Figure 2(d) has plotted temperatures measured fromboth FBG (blue circles) and TC (red lines) during 150 hourscalibration process
With calibrated FBG sensors the thermal stability ordrifting trend has been studied under an isothermal con-dition Figure 3 has shown the measured wavelength andFBG peak power stability at 650∘C for degradation andlifetime estimations The data (circles) in Figure 3(a) hasshown a trend of the wavelength shift is sim54 times 10minus6 nmhrat 650∘C and that of FBG peak power loss is about minus(5 to20) times 10minus5 dBmhr If ignoring any oven thermal drift arisingfrom PID-controlled K-Type TC feedback control one canattribute such a trend as FBG sensor long-term thermal trendIf using approximate temperature sensitivity of 0015 nm∘Cfor 119879 gt 600
∘C the thermal variation caused temperatureerror is about plusmn04∘C per 1000 hours at 650∘C Note thatthese estimated thermal drifts are withinK-Type TC accuracyrange of plusmn04 namely plusmn25∘C at 650∘C On the other handthe measured FBG peak power loss trend could be used toestimate the lifetime of the FBG sensor at 650∘C operation Ifthe FBG peak power degradation is at a rate of minus(5 minus 20) times
10minus5 dBmhr it will lose 044ndash176 dBm per year A common
quality of an FBG sensor is of a typical peak power of 25 dBmthe corresponding time for losing 25 dBm peak power willtake 10 more years
However the real lifetime of the FBG actually stronglydepends upon external environment conditions andmechan-ical package On the other hand the linearly estimatedlifetime could be underestimated if the degradation trend isnonlinear In normal case a lifetime of 3ndash6 years is requiredfor industrial machinery system application
4 Fiber Temperature Sensor Packageand Installation
In order to install FBG sensor for high-density temperatureprofile measurement from a gas turbine engine or from acompressor interstage the operation within such a harshenvironment requires the fiber sensors to be packagedfor reliability Consequently a fiber sensor package shouldbe hermetically sealed for maintaining strong mechani-cal integrity against vibration thermal cycles and stress-corrosion-induced mechanical fatigues This is not only dueto fiber fragility itself but also due to the detrimental long-term effect of corrosive gases moisture and acidic and alka-line chemicals potentially attacking the sensors In additiona proper sensor package will not impede dynamic thermalmeasurement during gas turbine startup transient Sinceeach industrial system application may vary in temperaturepressure flow rate vibration and corrosion for examplethe sensor packages may differ from one industrial systemto another industrial system and survive different harshenvironmental conditions
FBG temperature sensors can be installed at precom-bustor flow path turbine inlet downstream of the com-bustor or exhaust and interstage locations for measuringdynamic temperature anomalies Presurge condition in aturbine engine causes abnormal temperature fluctuation inthe gas phase Key measurements for surge control aresuctiondischarge temperature and pressure and flow ratethrough the compressor The FBGs can be positioned at
Journal of Sensors 5
119875 = minus726dBm
10
minus10
minus30
minus50
minus70
Refle
cted
pow
er (d
Bm)
FBG sensor
1530 1540 1550 1560Wavelength shift (nm)
120582119861 = 154475 nm
(a)
1556
1552
1548
1544
Wav
eleng
th sh
ift (n
m)
0 40 80 120Time (hrs)
1500
1000
500
0
TC (∘
F)
(b)
Δ120582 = 4666Δ119879 + 3968 times 10minus3Δ1198792 minus 1328 times 10minus6Δ1198793
12500
10000
7500
5000
2500
0
Wav
eleng
th sh
ift (p
m)
0 400 800 1200 1600Thermocouple (∘F)
(c)
1500
1200
900
600
300
00 50 100 150
Time (hours)
FBGK-type TC
Tem
pera
ture
(∘F)
(d)
Figure 2 Fiber sensor calibration process for converting the measured Bragg resonant wavelength shift to temperature
1534
15338
15336
15334
15332
1533
Wav
eleng
th sh
ift (n
m)
TFBG (119879 = 650∘C)
0 500 1000 1500Time (hrs)
minus54 times 10minus6 nmhr
(a)
Peak
loss
(dBm
)
0
minus20
minus10
minus30
minus40
TFBG thermal stability
0 1000 2000 3000 4000Time (hrs)
Type-II FBG (minus2 times 10minus4 dBmhr)
Type-I FBG (minus457 times 10minus5 dBmhr)
119879 = 1200∘F (650 ∘C)
(b)
Figure 3 Short-term measured FBG sensor thermal stability (a) and FBG peak power loss at 650∘C
multiple locations in the compressor For example the FBGtemperature sensor installed around the periphery of theturbine engine air inlet could detect presurge temperaturespikes In addition the fiber sensing array may be installed inthe pre-combustor flow path downstream of the combustorturbine engine inlet and between the compressor stagesIf the fiber sensors are installed in the turbine exhaustduct it will enable the monitoring temperature variation
that provides a means of detecting combustor health Thismeasured temperature combinedwith pressure enables betterdiagnostics and compressor surge protection
Two fiber sensor packages have been designed for gas tur-bine exhaust temperature measurement First one is a cablebased for circumferential exhaust temperature detection inwhich the FBG elements are inscribed onto three fibers andsealed inside an Inconel 625 tube as described by [15] The
6 Journal of Sensors
(a)
FBG1
FBG12
FBG5
FBG6
FBG7
FBG8
FBG10
FBG9
FBG11
FBG13
FBG3
FBG4FBG2
TC13
TC14 TC15
TC16
TC17
TC18
TC19
TC20
TC21
FBG1
FBG12
FBG6
FBG7
FBG8
FBG10
FBG9
FBG11
FBG13
FBG4FBG2
TC13
TC14 TC15
TC16
TC17
TC18
TC19
TC20
TC21
FBG5FBG3
(b)
FBG1
FBG20
FBG10
(c)
Ligh
t in
Ligh
t out
Diffuser shell
How gas flow
Exhaustthermocouple
Bearing tube
(d)
Figure 4 Fiber sensor installation in the gas turbine exhaust duct with circumferential fiber sensing cable in (a) and (b) andwith fiber sensingrake in (c) and (d)
second one is based on a precision exhaust temperature rakewith FBG sensors attached to its surface
This integrated radial sensing rake has 100mm spatialresolution across exhaust duct wall to central barrier spacedescribed by [15] Figure 4 shows two configurations formeasuring both static and dynamic gas turbine exhaust tem-perature response For addressing the entitlement of the FBGsensor performances in accuracy reliability and durability asa backup candidate technology of the existing thermocouplesensor a fiber sensing cable is installed close to the existingexhaust thermocouples with a circumferential configurationas shown in Figures 4(a) and 4(b) For evaluating dynamicperformance in response time to transient operation condi-tion variation a fiber sensing rake is installed in a gas turbinethat can measure radial exhaust temperature from diffuser tocentral bearing tube as shown in Figures 4(c) and 4(d) A 1ndash5Hz optical sensing interrogator with 4 channels capabilityis used to detect static signal while a 1000Hz (1ms) opticalsensing interrogator is used for dynamic signal detection
For circumferential exhaust temperature detection FBGelements are inscribed onto a single fiber with a spatial sepa-ration of 450mm three sensing fibers with 150mmmisplace-ment provide double spatial resolution for gas turbine exhausttemperature profile detection The obtained wavelength data
are converted to temperatures with a precalibrated transferfunction that enables the measured FBG sensor static datato be compared with the thermocouple sensors The fibersensing cable is clamped to an existing radiation TC shieldwith entrances holes in between two thermocouples [15]Thedown selection of a metal tube geometry and size has beendetermined with a simulation that has focused on thermalstress severity mechanical strength and natural vibrationfrequency of the metal tube Since rotor blade rotation speedis 3600 rpm for a 60Hz gas turbine and 3000 rpm for a 50Hzgas turbine its fundamental first and second high-ordervibration frequencies range from 50 to 300Hz To avoid anoverlap between the natural vibration frequency of the metaltube packaged fiber sensing cable and gas turbinersquos vibrationband the modeling has shown that an Inconel tube couldmeet such a requirement with appropriate diameter and wallthickness
For radial exhaust temperature detection a precisionexhaust temperature rake is used to support FBG sensors asan integrated radial sensing rake There are 9 TCs that areembedded into the rake with a 3mm open hole to enablehot gas to pass through the hole for TC measuring hot gastemperature However the fiber sensing array is sealed in afine-gage Inconel 625 tube which is welded onto the rake
Journal of Sensors 7
surface with one-to-one correspondence between the FBGandTC location Since the Inconel tube is attached to the rakesurface and faces the hot gas flow the combustion-dynamics-induced transient total temperature 119879
119905(119905) is proportional to
flow velocity by
119879119905(119905) = 119879
119878(119905) +
120592(119905)2
2119888119901
(8)
where 119879119878(119905) is static temperature 119888
119901is gas-specific heat
coefficient and 120592(119905) is transient gas flow velocity When FBGsensors are used tomeasure both static and total temperatureswith (4) the gas flow velocity or combustion-induced flowdynamics can be directly measured by
120592 (119905) =2119888119901
120581119879(0)
(Δ120582 [119879119905(119905)] minus Δ120582 [119879
119878(119905)])12
Vortex shedding frequency prop FFT
2119888119901
120581119879(0)
(Δ120582 [119879119905(119905)] minus Δ120582 [119879
119878(119905)])
(9)
The static temperature corresponds to exhaust temperaturewith flow velocity close to zero or near duct boundary layerThe vortex shedding frequency can be used to indirectlycharacterize the flow characteristics using Strouhal numberwhich is determined by frequencylowast lengthvelocity It is clearthat the fast Fourier transform of the differentiation of staticand dynamic signals could be used to correlate to differentdynamic events and parameters such as antisurge turbineblade rotation speed variation and combustion dynamicsand so forth For example when fuel quality changes it leadsto gas-specific heat (119888
119901) variation or vortex shading frequency
variation To measure dynamic FBG response to turbineoperation condition it normally requires high-band opticalsensing interrogator that ranges from 1 kHz to 100 kHz
5 Fiber Sensor Response toStatic Exhaust Temperature
During a typical gas turbine factory test different instru-ments will monitor various parameters such as crankingmotor output turbine HP shaft speed fuel stroke referenceIGV angle averaged compressor inlet temperature vibrationamplitude turbine exhaust static pressure and air flow tofully characterize a gas turbinersquos performance before its deliv-ery to customer Corresponding to this baseline performancetest the gas turbine is under full speed without loading testFigure 5 is a typical test from the fiber sensing rake with20 FBG sensors Since the fiber sensing rake is an integrationof the existing exhaust precision temperature rake and FBGsthere are also nine TCs inside the rake as a reference Sincethe first 3 FBGs are close to gas turbine diffuser wall theboundary layer flow near the wall surface causes the mea-sured temperature to be lower than the others In Figure 5(b)these averaged TCs are plotted against additional 17 FBGs Tosee details from both TC and FBG sensors Figures 5(c) and5(d) have plotted measured temperature during the steady-status operation condition
Five of nine TCs data have been shown about 5∘Fvariation during 100min steady operation time while fibersensors have shown about 9-10∘F variation This discrepancyis due to the fact that the TCs are located inside the rakewith an open hole of sim1206013mm and the fiber sensing tubeis welded to the rake surface across nine holes Anotherpotential origination could reflect the nature of the totaltemperature measured by the fiber sensors in contrast to thestatic temperaturemeasured by the TCsMeanwhile the fibersensors have shown comparable noise characteristics withrespect to the TCs which may relate to flow rate variationduring state status operation
Figure 6 has further shown the measured temperatureprofile from a full test of nearly 7 hours from a 7FB gasturbine manufacturing qualification process The exhausttemperature from circumferential fiber sensing cable can beplotted in 3D as shown in Figure 6(a) During the startupstage of the gas turbine performance monitoring is done viaa polar diagram to highlight anomalies quickly As shownin Figure 6(b) the measured exhaust temperature appearsnot to be uniform across 27 TCs The FBG sensor at 170locations also indicates the same anomalous variation It isnoticeable that the thermal profile is not symmetrical andit is very likely due to varied can-to-can combustion andhot gas flow variation In addition the dynamic processduring startup provides variation as compared to steadybase load operation which shows up on the polar diagramas temperature variation It is clear that both 3D thermalprofile and polar diagram measured with high-density fibersensors could provide directly information on the gas turbineperformance which are comparable to the data measuredfrom existing exhaust thermocouples
6 Fiber Sensor Response to Dynamic Process
The fiber sensing rake and surface-attached fiber sensorshave shown to be comparable to standard production TCsand also to be more sensitive to dynamic processes This isillustrated by the fiber sensor response amplitude as shown inFigure 7 Since the first FBG is close to exhaust diffuser ductits response amplitude is relatively small but with the increaseof the radial distance towards the internal bearing tube thedynamic amplitudes of the FBGs have shown correspondingincrease This increased amplitude mainly arises from thestartup transient process with increased fuel gas flow com-bustion dynamics and pressure variation from compressorto gas turbine exhaust However the dynamic amplitudemay be used for monitoring anomalous structural instabilitypresurge and incomplete combustion events Formonitoringthese dynamic events the relative dynamic amplitude is moreimportant than the absolute exhaust temperature measure-ment
The other critical dynamic response feature of the fibersensor is illustrated in Figure 8 where the FBG sensorrsquosdynamic temperature response is plotted against the samelocation TC data as a function of time during first severalminutes during the gas turbine startup transient The smalldifference could be due to hot gas flow variation inducedsensing rake oscillation or strain effect
8 Journal of Sensors
1585
1575
1565
1555
1545
1535
1525
Wav
eleng
th sh
ift (n
m)
0 100 200 300 400Time (min)
FBG20
FBG18
FBG16
FBG14
FBG12
FBG10
FBG8
FBG6
FBG4
FBG2
FBG19
FBG17
FBG15
FBG13
FBG11
FBG9
FBG7
FBG5
FBG3
FBG1
(a)
FBG
sens
or re
spon
se (∘
F)
1000
800
600
400
200
0
FBG4-FBG20TC
7FA GT FBGTC tests
0 100 200 300 400Time (min)
(b)
TC re
spon
se (∘
F)
625
620
615
610
605
600
595
7FA GT TC test
100 120 140 160 180 200Time (min)
(c)
625
620
615
610
605
600
595100 120 140 160 180 200
Time (min)
FBG
resp
onse
(∘F)
7FA GT fiber sensor test
(d)
Figure 5 Fiber sensor and TC measured exhaust temperatures during a 7FA GT test with radial fiber sensing rake
In addition Figure 9 shows the dynamic response of thefiber sensors after leaving the transient startup conditionThe bottom power spectra of the Figure 9 clearly show thatthe gas turbine cranking process has a high-level inharmonicoscillation At gas turbine startup the measured frequency isclose to 60Hz of the gas turbine blade rotation speed but itgradually shifts to exhaust rake natural vibration frequencyof sim40Hz during steady-status operation Such a dynamicresponse could be leveraged as a precursor for determiningthe health of the gas turbine Thermal response of the FBGsensors can be used similar to annular array of thermocouplesas a sensor input for fuel control to the combustion systemThe dynamic temperature and power spectra can be utilizedfor antisurge gas volumetric flow rate combustion efficiencyand turbine-blade-rotation-related structural instability anal-yses
It is also important to note that the converted powerspectra and associated vibration mode profile can be usedfor gas turbine long-term performance degradation analysis
One of the features is its broad frequency band profile andits response amplitude With increase vibration mechan-ical issue becomes more of a concern which may causethe gas turbine to degrade at an increased rate Thesemechanical issues could come from the torque variationbetween the compressor and turbine coupling rotor bladevibration and tip clearance change bearing wearing bucketparts loosening Another valuable feature is fiber sensorrsquosmultifunctional nature that can be used for simultaneouslymeasuring dynamic and static temperature while its responseamplitude can be associated with various dynamic and tran-sient responses that could be related to various mechanicalthermal and electric variations
7 Conclusions
Fiber-Bragg-grating-based sensing technology has been fur-ther developed and validated in power generation systemsuch as gas turbine for operation condition monitoring
Journal of Sensors 9
0 1 2 3 4 5 6 7 8
Time (hours)
05
1015
2025
30
Sensor number
1200
1000
800
600
400
2000
Tem
pera
ture
(F)
(a)
1000
800
600
400
200
0
200
400
600
800
100060
90120
150
180
210
240270
300
330
0
30
27 fiber sensors(Dec 11 2007)
60200 PM 60430 PM 60414 PM 60445 PM 60518 PM 60549 PM
60602 PM 60659 PM 60810 PM 60936 PM 60959 PM 61102 PM
Test2 run1
(b)
Figure 6 Exhaust thermal profile measured from a circumferential fiber sensing cable of 29 FBGs (a) and polar diagram of all the fibersensors during a gas turbine startup process (b)
250
200
150
100
50
0 2 4 6 80
Dyn
amic
ampl
itude
(pm
)
Time (s)
FBG10
FBG9
FBG8
FBG7
FBG6
FBG5
FBG4FBG3FBG2FBG1
Figure 7Themeasured dynamic response amplitude from FBG1 toFBG10 from a fiber sensing rake
The fiber sensor has demonstrated its unique advantagein providing high-density multipoint and multifunctioncapability in measuring static and dynamic responses from agas turbine To meet industrial harsh environmental sensingneeds one of the critical engineering work is the fibersensor package which varies from one machinery systemto another system The fiber sensor package is not only
Tem
pera
ture
(∘F)
1000
800
600
400
200
0
Time (s)0 60 120 180 240 300 360 420 480
FBGTC
Figure 8 The transient response comparison between the fibersensor and thermocouple from a 7FA gas turbine manufacturingqualification test
required to provide accuratemeasurement but also to preventmechanical strength degradation from elevated temperaturemassive hot gas flow and blade-rotation-related structuralvibrationThe work presented in this paper is to demonstratea new testmeasurement technology that also can be usedto measure multipoint temperature from a gas turbine withonly one fiber sensing cable and one penetration This fibersensing method discussed herein is not limited to gas turbineexhaust temperaturemeasurement Its uniquemultifunctionstatic and dynamic responses and distributed sensing capa-bilities make the high-density fiber sensor more valuable for
10 Journal of Sensors
8
6
4
2
020 60 100 140 180
FBG
6
Time (min)
(548 PMndash700 PM October 24 2008)
Frequency (Hz)
FFT
(rm
s120583120576)
6040
200
(a)
1
15
0
05
1006020140 180 Time (m
in)
Frequency (Hz)
FFT
(rm
s120583120576)
2016
128
40
FBG4 response to 7FA gas turbine startup(540 PMndash601 PM October 24 2008)
(b)
Figure 9 Fiber sensor measured dynamic signal and corresponding power spectra from 7FA gas turbine startup transient qualification test
next-generation power generation turbomachinery systemoperation with respect to condition monitoring diagnosticscontrol and optimization
Acknowledgments
During this development work Kevin McCarthy JuntaoWuRenato Guida Mohamed Sakami Jerry Lopez Alex RossDavid OrsquoConnor C Wagner James Nutt Ronald Gilstrapand Mike Krok have been involved in many fundamentalresearch laboratory test work field sensor installations andvalidations
References
[1] K O Hill Y Fujii D C Johnson and B S Kawasaki ldquoPhoto-sensitivity in optical fiber waveguides application to reflectionfilter fabricationrdquo Applied Physics Letters vol 32 no 10 article647 3 pages 1978
[2] M Fokine ldquoUnderlying mechanisms applications and limita-tions of chemical composition gratings in silica based fibersrdquoJournal of Non-Crystalline Solids vol 349 no 1ndash3 pp 98ndash1042004
[3] S Pal T Sun K T V Grattan et al ldquoStrain-independent tem-perature measurement using a type-l and type-IIA optical fiberBragg grating combinationrdquo Review of Scientific Instrumentsvol 75 no 5 pp 1327ndash1331 2004
[4] H Xia K McCarthy and C M Young ldquoHarsh environmenttemperature sensing system and methodrdquo US Patent 79123342011
[5] D Barrera V Finazzi J Villatoro S Sales and V PrunerildquoPackaged optical sensors based on regenerated fiber bragggratings for high temperature applicationsrdquo IEEE Sensors Jour-nal vol 12 no 1 pp 107ndash112 2012
[6] H Guo G Xiao N Mrad and J Yao ldquoFiber optic sensors forstructural health monitoring of air platformsrdquo Sensors vol 11no 4 pp 3687ndash3705 2011
[7] L Hui and O Jinping ldquoStructural health monitoring fromsensing technology stepping to health diagnosisrdquo ProcediaEngineering vol 14 pp 753ndash760 2011
[8] B Zhang ldquoHigh-temperature resistance fiber bragg gratingtemperature sensor fabricationrdquo IEEE Sensors Journal vol 7 no4 pp 586ndash591 2007
[9] J Canning S Bandyopadhyay M Stevenson and K CookldquoFiber Bragg grating sensor for high temperature applicationrdquoin Proceedings of the Opto-Electronics and CommunicationsConference and the Australian Conference On Optical FibreTechnology (OECCACOFT rsquo08) July 2008
[10] G Brambilla ldquoHigh-temperature fibre Bragg grating ther-mometerrdquo Electronics Letters vol 38 no 17 pp 954ndash956 2002
[11] H Xia ldquoAdvanced fiber optical sensor and instrumentation forpower generation industrial monitoring and diagnosticsrdquo inFiber Optic Sensors and Applications vol 8370 of Proceedings ofSPIE 2012
[12] B Zhang andM Kahrizi ldquoHigh temperature resistance temper-ature sensor based on the hydrogen loaded Fiber Bragg gratingrdquoin Proceedings of the IEEE Conference on Sensors pp 624ndash627November 2005
[13] J Li D Zhang XWen and L Li ldquoFabrication and temperaturecharacteristics of thermal regenerated fiber bragg gratingrdquo inProceedings of the Symposium on Photonics and Optoelectronics(SOPO rsquo12) pp 1ndash4 2012
[14] H Xia ldquoFiber Bragg grating and fabricationmethodrdquo US Patent7574075 2009
[15] H Xia K McCarthy J Nutt et al ldquoBragg grating sensingpackage and system for gas turbine temperature measurementrdquoUS Patent 8306373 2012
International Journal of
AerospaceEngineeringHindawi Publishing Corporationhttpwwwhindawicom Volume 2014
RoboticsJournal of
Hindawi Publishing Corporationhttpwwwhindawicom Volume 2014
Hindawi Publishing Corporationhttpwwwhindawicom Volume 2014
Active and Passive Electronic Components
Control Scienceand Engineering
Journal of
Hindawi Publishing Corporationhttpwwwhindawicom Volume 2014
International Journal of
RotatingMachinery
Hindawi Publishing Corporationhttpwwwhindawicom Volume 2014
Hindawi Publishing Corporation httpwwwhindawicom
Journal ofEngineeringVolume 2014
Submit your manuscripts athttpwwwhindawicom
VLSI Design
Hindawi Publishing Corporationhttpwwwhindawicom Volume 2014
Hindawi Publishing Corporationhttpwwwhindawicom Volume 2014
Shock and Vibration
Hindawi Publishing Corporationhttpwwwhindawicom Volume 2014
Civil EngineeringAdvances in
Acoustics and VibrationAdvances in
Hindawi Publishing Corporationhttpwwwhindawicom Volume 2014
Hindawi Publishing Corporationhttpwwwhindawicom Volume 2014
Electrical and Computer Engineering
Journal of
Advances inOptoElectronics
Hindawi Publishing Corporation httpwwwhindawicom
Volume 2014
The Scientific World JournalHindawi Publishing Corporation httpwwwhindawicom Volume 2014
SensorsJournal of
Hindawi Publishing Corporationhttpwwwhindawicom Volume 2014
Modelling amp Simulation in EngineeringHindawi Publishing Corporation httpwwwhindawicom Volume 2014
Hindawi Publishing Corporationhttpwwwhindawicom Volume 2014
Chemical EngineeringInternational Journal of Antennas and
Propagation
International Journal of
Hindawi Publishing Corporationhttpwwwhindawicom Volume 2014
Hindawi Publishing Corporationhttpwwwhindawicom Volume 2014
Navigation and Observation
International Journal of
Hindawi Publishing Corporationhttpwwwhindawicom Volume 2014
DistributedSensor Networks
International Journal of
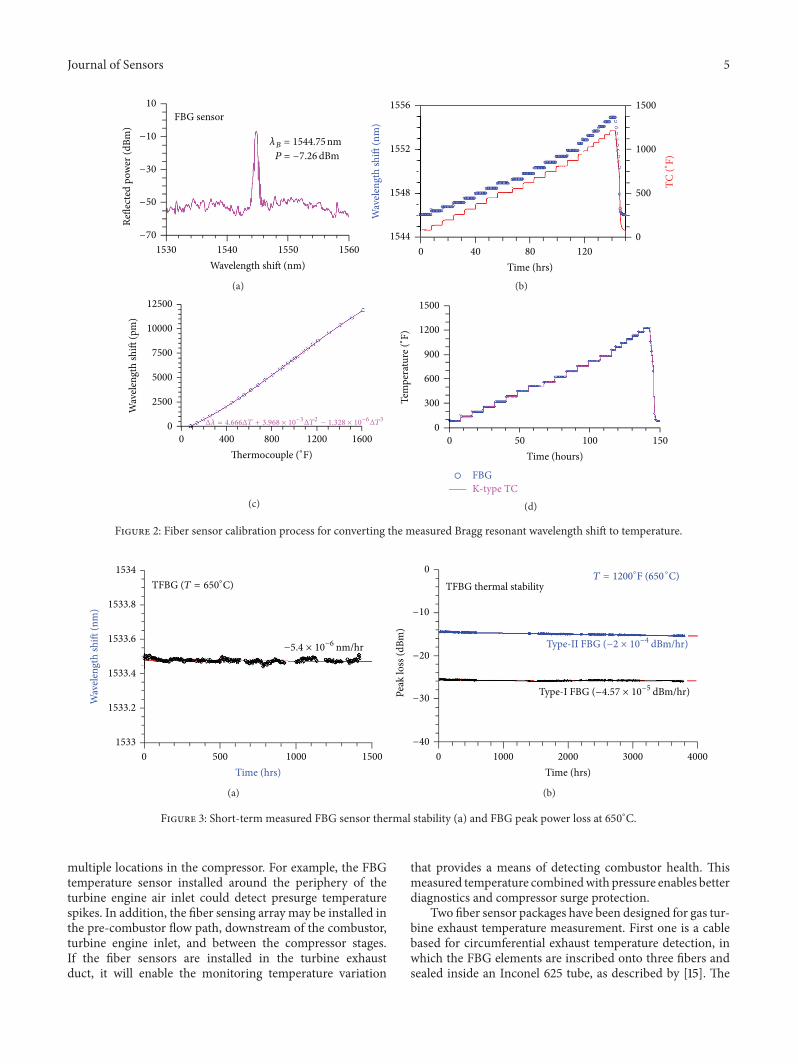
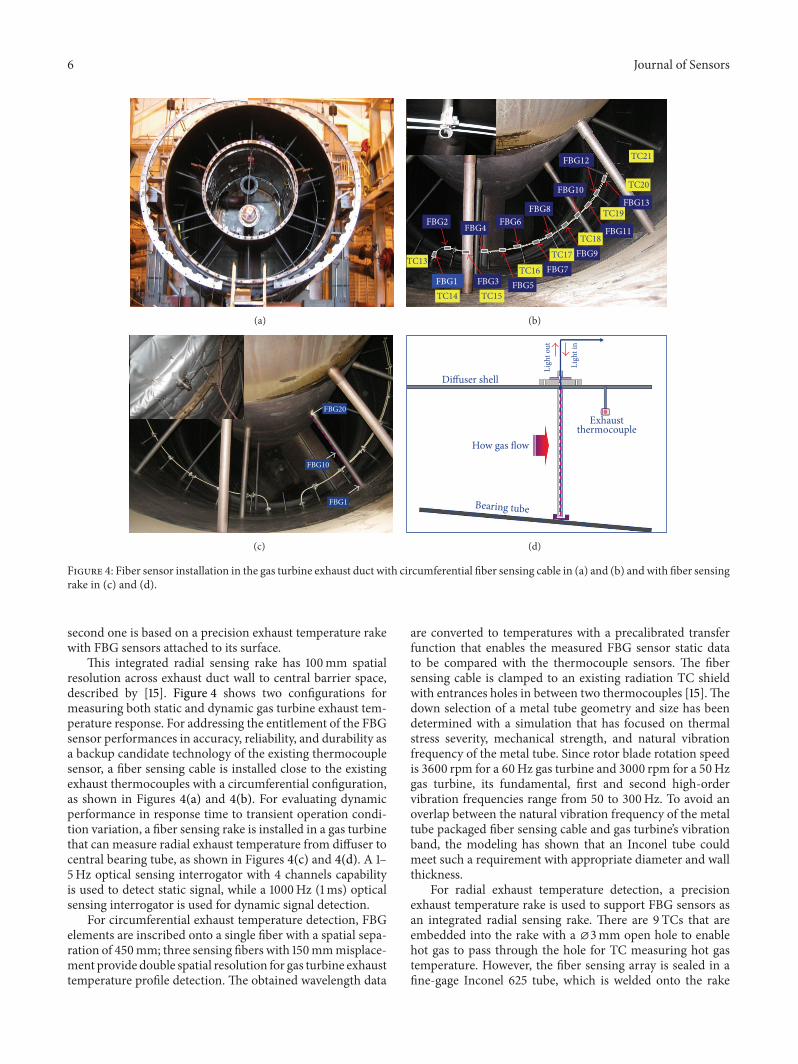
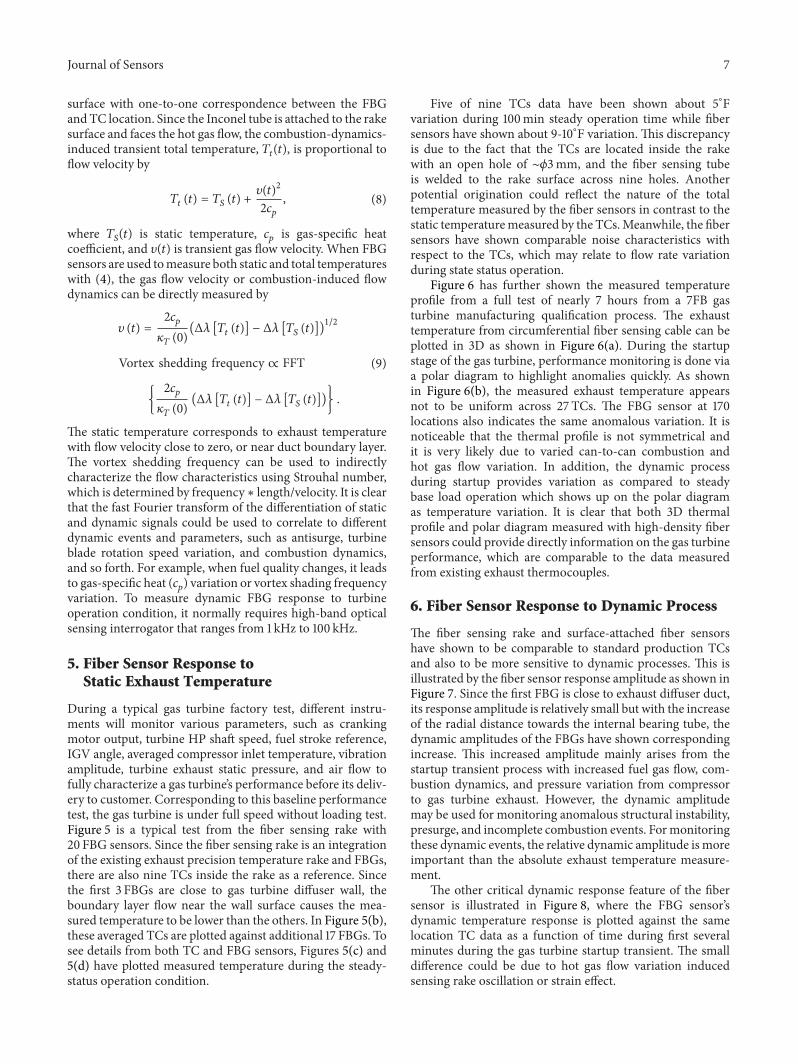
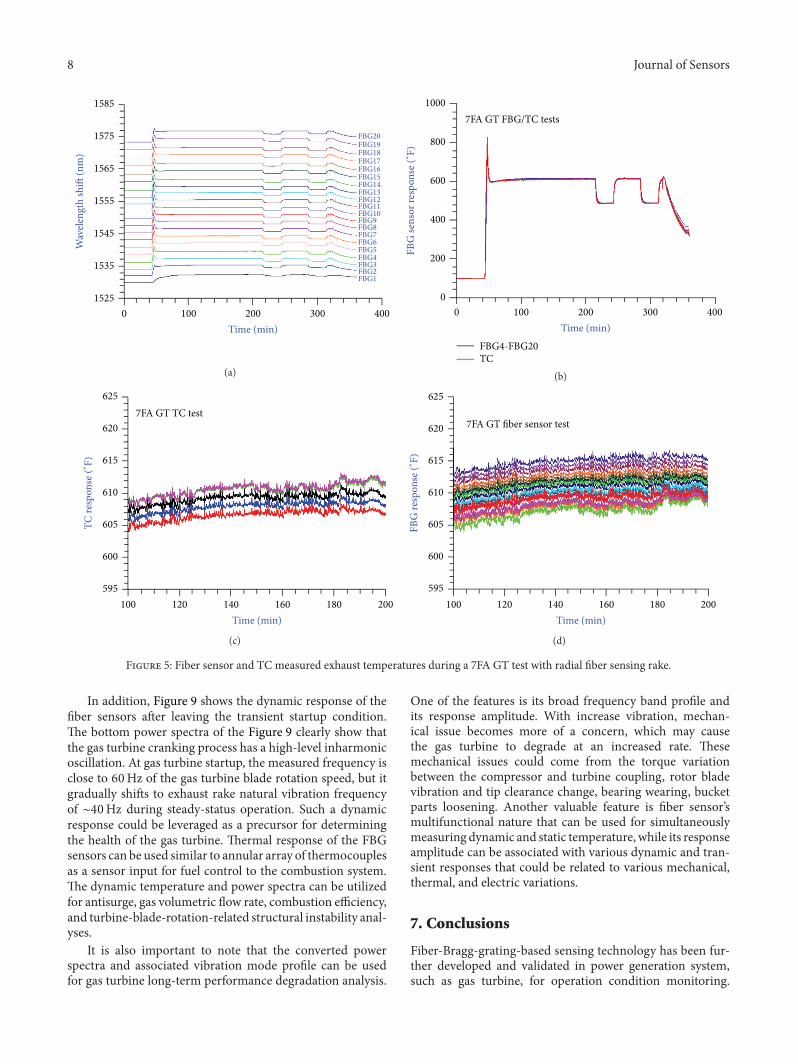
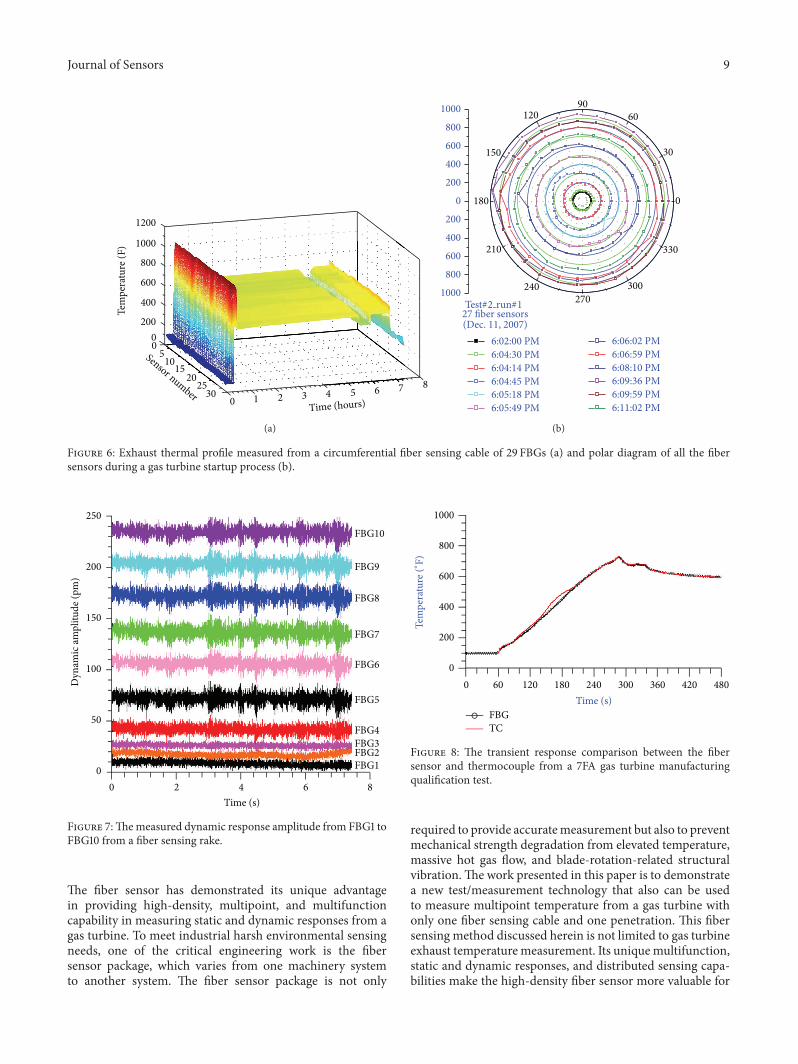
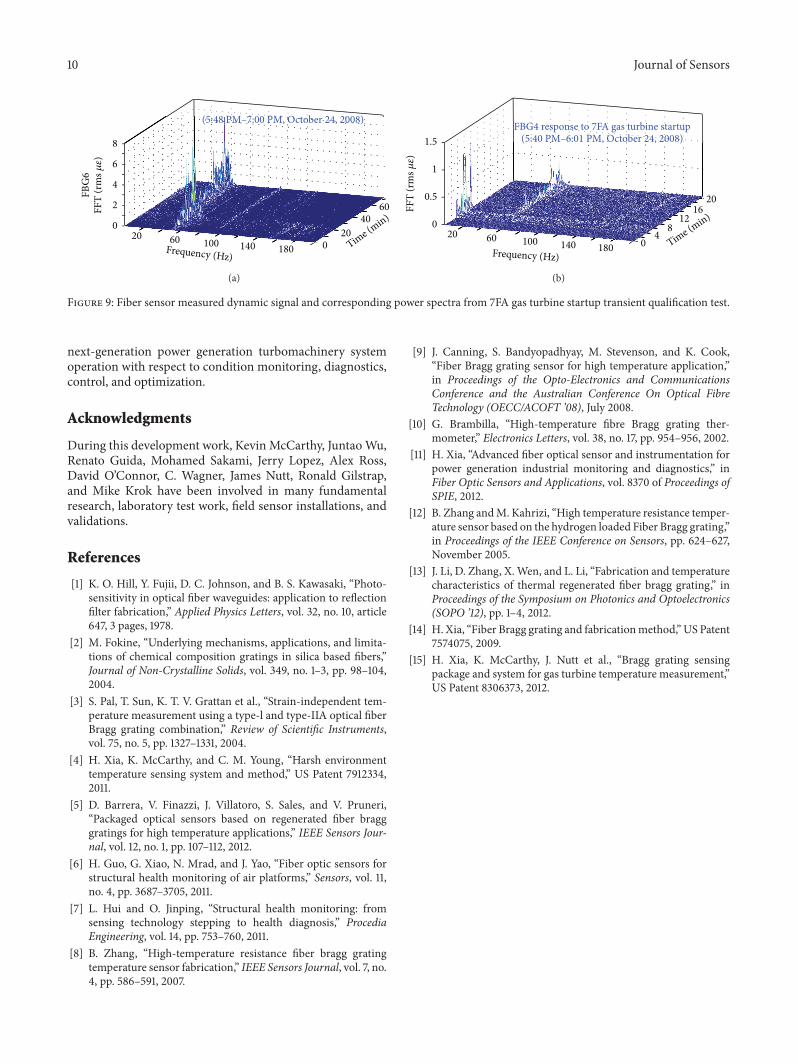

International Journal of
AerospaceEngineeringHindawi Publishing Corporationhttpwwwhindawicom Volume 2014
RoboticsJournal of
Hindawi Publishing Corporationhttpwwwhindawicom Volume 2014
Hindawi Publishing Corporationhttpwwwhindawicom Volume 2014
Active and Passive Electronic Components
Control Scienceand Engineering
Journal of
Hindawi Publishing Corporationhttpwwwhindawicom Volume 2014
International Journal of
RotatingMachinery
Hindawi Publishing Corporationhttpwwwhindawicom Volume 2014
Hindawi Publishing Corporation httpwwwhindawicom
Journal ofEngineeringVolume 2014
Submit your manuscripts athttpwwwhindawicom
VLSI Design
Hindawi Publishing Corporationhttpwwwhindawicom Volume 2014
Hindawi Publishing Corporationhttpwwwhindawicom Volume 2014
Shock and Vibration
Hindawi Publishing Corporationhttpwwwhindawicom Volume 2014
Civil EngineeringAdvances in
Acoustics and VibrationAdvances in
Hindawi Publishing Corporationhttpwwwhindawicom Volume 2014
Hindawi Publishing Corporationhttpwwwhindawicom Volume 2014
Electrical and Computer Engineering
Journal of
Advances inOptoElectronics
Hindawi Publishing Corporation httpwwwhindawicom
Volume 2014
The Scientific World JournalHindawi Publishing Corporation httpwwwhindawicom Volume 2014
SensorsJournal of
Hindawi Publishing Corporationhttpwwwhindawicom Volume 2014
Modelling amp Simulation in EngineeringHindawi Publishing Corporation httpwwwhindawicom Volume 2014
Hindawi Publishing Corporationhttpwwwhindawicom Volume 2014
Chemical EngineeringInternational Journal of Antennas and
Propagation
International Journal of
Hindawi Publishing Corporationhttpwwwhindawicom Volume 2014
Hindawi Publishing Corporationhttpwwwhindawicom Volume 2014
Navigation and Observation
International Journal of
Hindawi Publishing Corporationhttpwwwhindawicom Volume 2014
DistributedSensor Networks
International Journal of
Top Related