


Languages
Pages
Legal


DOCUMENT RESUME
ED 440 051 SP 039 045
AUTHOR Shields, Patrick M.; Esch, Camille E.; Humphrey, Daniel C.;Young, Viki M.; Gaston, Margaret; Hunt, Harvey
TITLE Teaching and California's Future. The Status of the TeachingProfession: Research Findings and Policy Recommendations.
INSTITUTION Center for the Future of Teaching and Learning, Santa Cruz,CA.
PUB DATE 1999-00-00NOTE 180p.; Produced with the assistance of The California State
University Institute for Education Reform; Policy Analysisfor California Education; Recruiting New Teachers, Inc.; TheUniversity of California, Office of the President; andWestEd Research conducted by SRI International.
AVAILABLE FROM Center for the Future of Teaching and Learning, 133 MissionStreet, Suite 220, Santa Cruz, CA 95060. Tel: 831-427-3628;Web site: http://www.cftl.org.
PUB TYPE Reports Evaluative (142)EDRS PRICE MF01/PC08 Plus Postage.DESCRIPTORS Academic Achievement; *Academic Standards; Beginning Teacher
Induction; Beginning Teachers; Educational Policy;*Educational Quality; Elementary Secondary Education;Excellence in Education; Faculty Development; HigherEducation; Preservice Teacher Education; State Standards;Teacher Competencies; *Teacher Improvement; *TeacherQualifications; Teacher Supply and Demand; Teachers;*Teaching Skills
IDENTIFIERS *California-
ABSTRACTThis document summarizes findings from a 1998-99 study of
teacher development that investigated California's challenge to provide highquality teachers for all students. California's set of standards to improveeducation for all requires that all students have qualified teachers. Inorder for California's move toward academic excellence to succeed, it mustsimultaneously increase the quality and quantity of the teacher workforce. Toaddress this challenge, a coalition of stakeholders came together to searchfor solutions. This document summarizes findings from the study and presentsrecommendations of the state task force. It discusses the supply of anddemand for qualified teachers; distribution of unqualified teachers; thesystem of preparing qualified teachers; support for beginning teachers;teacher professional development; and state and district support. Resultsfind that California has been aggressively developing and implementing manynew programs to address professional development needs, but it has notcreated a system that supports the kind of teacher learning and professionalgrowth that translates into excellence. Most schools and districts provideinadequate supports and incentives to allow teachers to enhance their ownlearning. Too many teachers work in conditions that inhibit professionalism.An appendix presents data collection methods and analysis. (Containsapproximately 85 references.) (SM)
Reproductions supplied by EDRS are the best that can be madefrom the original document.
Teaching and California's Future
The Status of the Teaching Profession:Research Findings and Policy Recommendations
The Center for the Future of Teaching and Learning
And
The California State University Institute for Education ReformPolicy Analysis for California EducationRecruiting New Teachers, Inc.The University of California, Office of the PresidentWest Ed
Research Conducted by SRI International
Suggested citation:
PERMISSION TO REPRODUCE ANDDISSEMINATE THIS MATERIAL HAS
BEEN GRANTED BY
-w ;(kTO THE EDUCATIONAL RESOURCES
INFORMATION CENTER (ERIC)1
U.S. DEPARTMENT OF EDUCATIONOffice of Educational Research and Improvement
EDUCATIONAL RESOURCES INFORMATIONCENTER (ERIC)
T his document has been reproduced asreceived from the person or organizationoriginating it.Minor changes have been made toimprove reproduction quality.
Points of view or opinions stated in thisdocument do not necessarily representofficial OERI position or policy.
Shields, Patrick M., Esch, Camille E., Humphrey, Daniel C., Young, Viki M., Gaston, Margaret,& Hunt, Harvey. (1999). The Status of the Teaching Profession:Research Findings andPolicy Recommendations. A Report to the Teaching and California's Future Task Force.Santa Cruz, CA: The Center for the Future of Teaching and Learning
_Hc\i
C."' Copyright © 1999. All rights reserved.n The Center for the Future of Teaching and Learning 133 Mission Street, Suite 220 Santa Cruz, CA 95060831-427-3628 www.cftl.org
t. )
4.1) BEST COPY AVAILABLE

Co-SponsorsNancy Brownell, Interim Director Gerald Hayward, Co-DirectorCSU Institute for Education Reform Policy Analysis for California Education
Niko la Filby, Regional Laboratory Coordinator Harvey Hunt, Co-DirectorWest Ed Center for the Future of Teaching and Learning
Margaret Gaston, Co-Director Bob Polkinghorn, Assistant Vice PresidentThe Center for the Future of Teaching and Learning School/University Partnership
University of California, Office of PresidentDavid Haselkorn, PresidentRecruiting New Teachers, Inc.
Task Force MembersCo-Chair Co-ChairJosh Edelman, Teacher and Director Karl Pister, Vice PresidentRISE Mentor Program Educational OutreachMenlo Atherton High School, Menlo Park, CA University of California, Office of President
Carl Cohn, SuperintendentLong Beach Unified School District
George Datz, Director of Special ProjectsCalifornia School Employees Association
Leslie DeMersseman, PresidentCalifornia School Boards Association
Carolyn L. Ellner, Ph.D.Commission on Teacher Credentialing
Glen Harvey, Chief Executive OfficerWest Ed
Stan Hitomi, TeacherMonte Vista High School, Danville, CA
Elaine Johnson, Assistant to the PresidentCalifornia Federation of Teachers
Carol Katzman, CommissionerCalifornia Commission on Teacher Credentialing
Karen Kent, Past DirectorCA Professional Development Reform Initiative
Linda Bond, Director of Governmental RelationsCalifornia Commission on Teacher Credentialing
Davis Campbell, Executive DirectorCalifornia School Boards Association
Linda Darling-HammondCharles E. Ducommon Professor of EducationStanford University School of Education
Leslie Fausset, Chief Deputy SuperintendentCalifornia Department of Education
Dave Gordon, SuperintendentElk Grove Unified School District
Kimi Kinoshita, TeacherMistletoe School, Redding, CA
Jeannette La Fors, Teacher, San Francisco, CA
Bob Pearlman, PresidentAutodesk Foundation
Diane Siri, SuperintendentSanta Cruz County Office of Education
Jerry Swanitz, TeacherSanta Ynez High School, Santa Ynez, CA
Beth Threatt, ManagerInstructional Professional DevelopmentCalifornia Teachers Association
Bob Trigg, MemberState Board of Education
Arthurlene G. Towner, DeanSchool of Education and Allied StudiesCalifornia State University, Hayward
Advisors
3
Judith Warren Little, ProfessorGraduate School of EducationUniversity of California
Richard SimpsonAssistant to the Speaker, State Capitol
Jon Snyder, DirectorGraduate School of EducationUniversity of California, Santa Barbara
Bill WhiteneckEducation Consultant
Bill WilsonCSU Office of the Chancellor

EXECUTIVE SUMMARY
In the middle of the 1990s, Californians awoke to a disturbing fact: our schools were not
succeeding in educating our children. Results from the 1994 National Assessment of
Educational Progress showed what many had suspected: California students ranked at the bottom
of the nation in reading achievement.' What had once been considered among the best
educational systems in the nation had significantly eroded:
California's response has been a determined march to improve the state's schools. At the
heart of this effort has been the development of standards for what students should know and be
able to do. The state now has well-articulated student learning goals, by grade, in the core subject
areas of mathematics, reading and language arts, science, and social studies/history. State policy-
makers have sent a clear message to educators and parents alike: all children must achieve at
higher levels.
The goal of high standards for all students is a deceptively radical one. On the surface, it is a
rhetorical phrase with which most would have long agreed. Yet, if taken seriously, it represents a
rejection of a basic tenet of American schooling: some students will achieve at high levels, most
will succeed moderately, and others inevitably will be low achievers. The California standards, in
contrast, call not for just the best and the brightestor the most advantagedto succeed; all
students are expected to reach high levels of performance.
To support the implementation of the standards, California has taken a series of policy
actions. The state assessment systemSTARhas been augmented to include items to assess
students' progress relative to standards. Instructional materials will be updated with new
appropriations. A new accountability system supports and, if necessary, will place sanctions on
schools whose students do not perform up to standard. Beginning in the 2003-04 school year, all
students will have to pass a new high school exit exam to graduate from high school. These
actions come on top of a massive investment in class size reduction, which itself was aimed at
improving student learning in the early grades.
Yet standardsand the curricular, assessment and accountability systems designed to
support themwill have little impact if teachers are not prepared to enact powerful instructional
strategies necessary for all students to reach the standards. The bottom line is that standards-
based reform asks more not only of students but also of all the adults expected to support student
learning. No adults are more important to student success than teachers. Study after study has
demonstrated the strong relationship between teacher quality and student learning. It is
4

estimated that the difference between an effective and ineffective teacher can be a full grade
level of achievement in a school year.?
Effective teachers are those with strong verbal and mathematics skills, deep content
knowledge in the subject they teach, and strong teaching skills.3 Measuring such characteristics is
not always easy. In California, the state has established minimum requirements for a yegular
teaching credential that combine coursework, practical experience in classrooms, and passing
scores on basic skills and subject matter assessments. Successful completion of these requirements
represents the minimum acceptable indication of quality and effectiveness to teach in the state's
classrooms. In fact, research in California has shown that students perform better in schools where
most teachers have met these requirements; students perform worse when they are in schools with
larger numbers of underqualified teachers.4
Attainment of high standards for all California students, then, requires that every student
have a qualified teacher to help him or her reach the standards. And thisproviding a competent
and effective teacher for every studentis the greatest challenge California faces.
The challenge is daunting, for many. reasons. Under the best of circumstances, training and
supporting a professional workforce is orders of magnitude more difficult than drafting
standards, choosing instructional materials, or creating additional test items. Yet the present
conditions are far from optimal. The teacher workforce in California is huge, approximately
284,000. Continued growth in student enrollment and the attrition of teachers from the
profession have increased the demand for teachers, but not enough qualified teachers are willing
to take jobs in public schools, resulting in severe shortages of credentialed teachers in
California's classrooms.
Of course, even those teachers holding full credentials are being asked to do more and to
do it with an increasingly culturally and linguistically diverse student body. These teachers need
intensive and ongoing supportopportunities to acquire new subject matter knowledge and to
learn more effective pedagogy. Furthermore, veteran teachers must be supported in their efforts
to usher novices into the profession and, in some cases, to provide professional development to
their colleagues.
In short, if California's march toward academic excellence is to be successful, it must
simultaneously increase the quantity and the quality of the teacher workforce. Failure to do so
to place high-quality, effective teachers in every classroomwill transform the ambitious
standards-based movement into a meaningless game of politics, teacher frustration, and, worse,
increased student failure.
ii
5

Teaching and California's Future
To address this challenge, a coalition of stakeholders with interests in teacher recruitment,
preparation, induction support, and professional development have come together to search for
ways to ensure that all California schoolchildren have a qualified and effective teacher. Led by
the Center for the Future of Teaching and Learning and cosponsorsthe California State
University Institute for Educational Reform; Policy Analysis for California Education (PACE);
Recruiting New Teachers, Inc.; University of California Office of the President; and West Ed
these stakeholders are implementing an initiative focused on building teacher workforce
capacity. Teaching and California's Future involves a twofold strategy: (1) convening a Task
Force of key policy-makers, practitioners, institutions of higher education, and professional
organizations to develop and implement a plan to improve teacher development policies and
practices in California; and (2) undertaking a comprehensive study of the conditions of teacher
development in the state to inform the work of the Task Force.
During the 1998-99 school year, SRI International conducted the statewide study of teacher
development. The study involved a survey of a representative sample of K-12 California public
school teachers and eight case studies of local teacher development systems throughout
California. In addition, the SRI research team extensively reviewed secondary databases,
analyzed new state policy initiatives, and interviewed key state policy-makers.5
This document summarizes the findings of the research carried out in support of Teaching
and California's Future and includes the recommendations the Task Force developed in
response to the research findings. At the request of the Task Force, the study focused on what is
being done (1) to ensure a qualified teacher in every California classroom and (2) to build and
maintain the strengths of the current teacher workforce.
Ensuring a Qualified Teacher for Every California Schoolchild
Does California produce, attract, and retain a sufficient number of teachers to ensure that
every California schoolchild is in a classroom with a qualified teacherand will it be able to do
so in the future? Which students are most likely to be taught by an underqualified teacher?
What is being done in terms of preparing teachers to ensure a qualified and effective teacher for
every California schoolchild?
The answers to these questions are quite sobering. No, California currently does not
provide qualified teachers for all students. More than 1 in every 10 classrooms in the state are
staffed by teachers who have not met the state's minimum requirements. California policy-
makers, including the Governor, are aware of this situation and have initiated a number of new
iii

policies to address the problem since the beginning of 1998such as the expansion of the
teacher preparation programs in the California State University system. Still, we project that at
best it will be many years before current policies will be sufficient to bridge the gap between the
demand for teachers and the supply of qualified candidates willing to take jobs in the state's
schools.
In the meantime, those students in greatest need of effective teachers are the most
likely to be in classrooms with underqualified teachers. 6 In fact, the distribution of qualified
teachers is quite uneven across the state. Students in poor, inner-city schools are much more
likely than their more advantaged suburban counterparts to have underqualified teachers.
Students who score in the bottom quartile of reading achievement in third grade are five times as
likely as students scoring in the top quartile to have an underqualified teacher. These are the
students who, if they do not learn to read well soon, will be unable to perform well in any subject
area. And, of course, it is just these students whom, a few years hence, the state will most likely
deny graduation from high school because they cannot meet the standards.
In response to the shortage of teachers, efforts are under way to increase the capacity of the
teacher preparation system to turn out more teaching candidates and to create more flexible and
streamlined routes into the profession. To the extent that policy efforts promise to increase the
number of individuals preparing for the profession, they also raise serious questions about the
capacity of alternative providers to support teacher candidates and about the quality of these
alternative routes. Of particular concern are the disincentives in areas of high demand for
teacher candidates to completeor even begintheir preparation before entering theclassroom as a full-time teacher.
Building and Maintaining the Strengths of the Current Teacher Workforce
As California struggles to attract and prepare a sufficient number of candidates for
teachingand to place them where they are in greatest demandit faces the challenge of
supporting those teachers already practicing in classrooms. Currently, there are approximately
284,000 practicing teachers in the state's public schoolsall of whom is being asked to do more
with their students. If these teachers are expected to help all of California's students to reach the
state's standards for learning, the teachers themselves will require high-quality learning
opportunities.
In light of the importance of equipping teachers for their expanded role in helping students
reach standards, we asked set of questions related to teacher learning. First, what kinds of
learning opportunities are available to and taken advantage of by California's teachers? Second,
iv
7

what is the quality of these opportunitiesin particular, to what degree does professional
development improve teachers' ability to do their jobs? Third, what are the state and local
districts doing to support high-quality professional development?
The answers to these questions show that California has not progressed far enough in
ensuring that all teachers receive high-quality professional development. There certainly are
many professional development initiatives and programs, and, in fact, teachers do report
participating in about 3 work-weeks of professional development per year. Yet much of
professional development continues to be disconnected workshops and other "traditional"
activities. Intensive, ongoing, and content-based learning opportunities are uncommon for
California teachers.
Although examples of high-quality professional development exist, in general,
teachers do not believe that the professional development activities they participate in havea substantial impact on their teaching. Only half of all teachers respond that they received
new information from professional developmenta relatively low standard of impact. One in
five teachers think that the professional development they participated in was a waste of their
time. Still, the small percentage of teachers who have opportunities for high-quality professional
development, who collaborate around concrete activities focused on instruction and student
work, report that their professional development experiences have a greater impact on their
professional growth and instructional skills than do other teachers.
Our review of state policy demonstrates the commitment of the state to the importance of
professional development. The many state professional development initiatives provide needed
resources to districts and schools to address important goals, like increasing reading
achievement. At the same time, some state policies restrict local efforts, increase the burden
on local educators as they seek to follow state guidelines, and, in combination with myriad
federal and privately sponsored initiatives, make it difficult for districts, schools, or
teachers to formulate a coherent professional development strategy.
Thus, although much is being done to support teachers' professional development, too little
of it is sufficiently focused and coherent to help teachers bring California's students up to the
state standards.
8
Task Force Recommendations to Strengthen the Teaching Profession inCalifornia
In response to these findings, the Task Force has made the following recommendations:
Ensure that every child has a fully qualified, effective teacher.
Implement a comprehensive program of preparing and placing qualified teachers ininadequately staffed schools through specifically focused competitive grantsavailable to publicly supported colleges and universities which are located in areaswith high percentages of inadequately staffed schools.
Provide 100% forgivable state loans of at least $20,000, plus tuition fees and booksto students who enroll in and complete a teacher preparation program andimmediately go on to teach in a hard-to-staff school for a minimum of 4 years, byexpanding APLE loans and Cal T grants.
Expand SB 1X to provide annual discretionary grants of $350 per student for up tothree years to enable inadequately staffed schools to attract and retain fullyqualified classroom teachers, develop the skills and knowledge of the school'sresident staff, and take steps to create a positive learning environment for studentsand teachers.
Expand the provisions of existing law to require the Commission on TeacherCredentialing to notify annually all local education agencies when they employmore than 150% of the statewide average of under-qualified teachers, encourage theidentified districts to review and modify their recruitment, hiring, and placementpractices.
Encourage local policy makers and bargaining units to focus Peer Assistance andReview programs (PAR) on inadequately staffed school sites. Special attention inthese efforts should be given to the identification, selection, and preparation ofaccomplished teachers responsible for ushering novice teachers into the profession.
Provide training for accomplished teacher leaders called upon to provideprofessional development or support for novice teachers, and ensure that theirclassrooms are staffed by fully qualified teachers in their absence.
Establish regional cadres of accomplished veteran teachers and recognized experts,with additional incentives for drawing from the pool of retired teachers, to provideprofessional development and support for novice teachers at inadequately staffedschools. Classrooms of teachers providing professional development and/orsupport for novice teachers must be staffed by fully qualified teachers.
Eliminate the hiring of unqualified teachers.
Phase out the approval of waivers and emergency permits over the next 5 years,allowing waiver of credential requirements by the Commission on TeacherCredentialing only in exceptional cases where specialized individual skill and talentor eminence is involved.
vi

Expand Cal T grants in size and number, with special emphasis on shortage fields(i.e., math, physical science, computer science, special education).
Improve the ability of the teaching profession to attract and keep fully qualifiedteachers.
Revise the current beginning teacher salary incentive of $32,000 to establish atarget minimum of $40,000 for fully qualified new teacher hires in order to maketeaching more competitive with other professional opportunities in attractingtalented and qualified individuals.
Continue and expand through Cal Teach and other state and local programs effortsto recruit teacher candidates whose background and experiences mirror those of thestate's diverse student population.
Provide incentives for developing and maintaining a professional workingenvironment that address facilities use, scheduling, safety, materials, supplies, andother conditions under which teachers are attracted to and stay in the profession.
Strengthen accountability for all teacher education programs.
The Commission on Teacher Credentialing should ensure, as a part of monitoring oraccreditation processes being developed, that teacher preparation programs,including district or university internships, prepare teachers in a manner consistentwith the California Academic Standards and the California Standards for theTeaching Profession.
Initiate an effort to stop the flow of prospective teachers out of the public educationsystem before classroom placement through a statewide system to monitor theprogress of preservice candidates through professional preparation and into the jobmarket. Such a system must include a standardized reporting format for allaccredited teacher preparation programs, and an annual summary report publishedby the Commission on Teacher Credentialing.
Reduce unnecessary barriers to teaching.
Continue to pursue aggressively full reciprocity with other high-standards states andrecruit aggressively from states with surpluses of qualified teachers.
Initiate an independent effort to review local hiring and placement practices and todevelop model policies and procedures designed to reduce the delays in hiring newteachers and identify steps local districts and bargaining units can take to ensurethat students with the greatest educational needs are placed with teachers bestqualified to teach them.
vii
10

Encourage and support teachers to reach high levels of subject matter expertise andinstructional skill.
Commission, on behalf of the Legislature, an independent analysis of existingstatutes, regulations, policies, procedures, and guidelines with the intent ofeliminating provisions that deflect teachers' professional development time tomatters other than the enhancement of subject matter expertise and instructionalskills, and that don't reflect the elements of high quality professional development.
Focus professional development on enabling students to meet the state standards bycalling for all appropriate public agencies, including the legislature, State Board ofEducation, State Department of Education, and the California Commission onTeacher Credentialing, to take action to ensure that state-sponsored and locallysponsored professional development opportunities are consistent with the elementsof high-quality professional development.
Ensure that all novice teachers, including interns and those on emergency permitsand waivers, get the support and guidance they need to enable their students toreach the state standards for student learning.
Make available to districts incentives of up to $250 per student (75% new fundingwith a local match of25% from existing sources) to restructure the teaching dayand year to embed time for teachers to participate in high quality professionaldevelopment that addresses student standards.
Create incentives for teacher preparation institutions to offer experienced teachersmasters degree programs consistent with standards set forward by the NationalBoard for Professional Teaching Standards that culminate in the award of both amaster of arts degree and successful completion of the National Board certificationassessments.
By 2005 the Legislature should establish an overall statewide goal in statute of atleast one teacher certified by the National Board for Professional TeachingStandards for every school in the state.
Support for National Board certification candidates should be included annually inthe budget with funds authorized for 1) continuing the incentives established in AB858, 2) subsidizing candidate application fees, and 3) developing candidate supportprograms. Priority in allocation of these funds should be given to candidates fromand programs providing service to inadequately staffed schools.
Summary
In the considered opinion of the Task Force, California policy-makers and educators should
be congratulated for the bold steps taken in the last few years to bolster the state's public school
system. The research conducted for Teaching and California's Future documents the promise of
the many new state initiatives, the statewide commitment to higher standards for all students, and
viii
11
CONTENTS
Executive Summary
Chapter 1. Introduction
Background: High Standards for All 1
The Key to Student Success: High-Quality Teachers 2
Teaching and California's Future 3
Progress to Date 4
Looking Ahead: Principles for Improving Teacher Development in California 5
Products of Teaching and California's Future 6
Endnotes 7
PART I. ENSURING A QUALIFIED TEACHER FOR EVERY CALIFORNIASCHOOLCHILD 9
Chapter 2. The Supply of and Demand for Qualified Teachers for California's Classrooms 11
The Demand for Teachers in California Classrooms 12
The Supply of Qualified Teachers for California Classrooms 16
Putting Supply and Demand Together 23
Endnotes 27
Chapter 3. Distribution of Underqualified Teachers 29
Statewide Distribution of Underqualified Teachers 30
Maldistribution of Underqualified Teachers by Student Characteristics 32
Distribution of Underqualified Teachers within Districts 36
Who are Underqualified Teachers? 39
The Impact of High Concentrations of Underqualified Teachers 47
Reasons Why Schools and Districts Have High Numbers of Underqualified Teachers 49
What Districts Can Do to Reduce the Number of Underqualified Teachers 53
What Districts Cannot Do (Alone) to Reduce the Number of Underqualified Teachers 55
Endnotes 58
Chapter 4. The System of Preparing Qualified Teachers for Every California Classroom 59
The Capacity of the Teacher Preparation System 60
The Quality of New Teachers 65
xi
12

New Approaches to Preparing Classroom Teachers 69
Prospects for the Teacher Preparation System 74
Endnotes 77
Part I Summary and Policy Recommendations 79
PART II. BUILDING AND MAINTAINING THE STRENGTHS OF THECURRENT TEACHER WORKFORCE 83
Chapter 5. Supporting Beginning Teachers Through the Critical First Years 87
State Policy in Support of New Teachers 88
District Induction Support 91
Extent and Nature of Induction 94
Quality of Induction 99
The Changing Landscape: The Expansion of BTSA 102
Endnotes 107
Chapter 6. Building on the Strengths of the Teacher Workforce: ProfessionalDevelopment 109
Nature of Professional Development 110
Content of Professional Development Activities 114
Quality of Professional Development 116
Understanding the Professional Development Experiences of California Teachers 125
Endnotes 126
Chapter 7. Finding Coherence in an Incoherent System 127
State Policy in Support of Professional Development for California Teachers 128
District Support for Professional Development 133
Supports and Incentives for Professional Development 139
The Challenges of Coherence and Capacity in Professional Development 147
Endnotes 150
Part II Summary and Policy Recommendations 151
References 153
xii
13

Appendix. Data Collection Methods and Analysis A-1
Part I
Figure 2-1
Figure 2-2
Figure 2-3
Figure 2-4
Figure 2-5
Figure 3-1
Figure 3-2
Figure 3-3
Figure 3-4
Figure 3-5
Figure 3-6
Figure 3-7
Figure 3-8
Figure 3-9
Figure 3-10
Figure 4-1
Figure 4-2
Figure 4-3
FIGURES
Historical and Projected Demand for Teachers in California 13
Actual and Projected Teacher Hires, 1992-2007 14
Estimated Historical and Projected Reentrants vs. Total Teacher Hires,1992-2007 18
Total Emergency Permits, 1991-92 to 1998-99 24
Projected Teacher Workforce through 2007-08 25
Statewide Distribution of Underqualified Teachers 31
Average School-Level Underqualified Teachers by Third-Grade StudentAchievement Level 33
Distribution of Underqualified Teachers by Student Poverty Level 34
Distribution of Underqualified Teachers by Percent Minority Students 35
Comparison of Distribution of Underqualified Teachers by Urbanicity 36
Distribution of Underqualified Teachers in California School Districts 37
Comparison of Distribution of Underqualified Teachers Statewide andin Ravenswood City Elementary School District 38
Comparison of Distribution of Underqualified Teachers Statewide andin Los Angeles Unified School District 39
California Student and Teacher Ethnicity, 1997-98 41
51When Teachers are Hired and Informed of Exact Teaching Assignment
Share of New Credentials Recommended by CSU, UC, and IndependentInstitutions, 1991-92 to 1997-98 61
Number of New Multiple- and Single-Subject Credentials Recommendedby Independent IHEs 64
Institutional and District Intern Credentials, 1991-92 to 1997-98 72
14

Part II
Figure 5-1 Induction Support Activities Offered to Beginning Teachers 96
Figure 5-2 Significant Differences in Induction Support, by School Level 97
Figure 5-3 Mentor Support Activities for Beginning Teachers, by Frequency ofActivity 98
Figure 5-4 Perceived Overall Effectiveness of Induction Support 99
Figure 5-5 Perceived Effectiveness of Induction Support, by Participation inObservation Activities 100
Figure 5-6 Percent of Beginning Teachers Reporting Mentor Support Activitiesas Helping Them Feel Effective in Classroom, by Frequency of Activity 101
Figure 6-1 Focus of Professional Development Activities 115
Figure 6-2 Prevalence of Certain Characteristics of Professional Development 117
Figure 6-3 Teacher Reports on Content of Professional Development MeetingTheir Needs 121
Figure 6-4 Teacher Reports on Impact of Professional Development Activities 122
Figure 6-5 Prevalence of Certain Characteristics of Professional Development, TeachersWho Share Student Work Often vs. All Others 123
Figure 7-1 Average Hours Worked Daily, Teacher Reports vs. Public Estimates 140
Figure 7-2 School/District Rewards for Teacher Development Activities 143
Figure 7-3 Teacher Perceptions of Evaluation Process 145

TABLES
Part I
Table 3-1 Estimated Number of Teacher Hires: Areas with Highest Need (1998-99) 43
Table 3-2 Qualifications of LAUSD Teachers, 1994-1998 45
Table 3-3 Qualifications of First-Year LAUSD Teachers, 1994-1998 46
Table 3-4 Reasons Teachers Choose the District They Teach In 49
Table 3-5 Underqualified Teachers in Imperial County School Districts 56
Table 4-1 Self-Contained Classroom Teachers' Preparation to Teach CoreSubject Matter 66
Table 4-2 Single-Subject Teachers' Reported Preparation to Teach the SubjectMatter Covered in Their Teaching Assignment(s) 66
Table 4-3 How Well Credentialed Teachers Feel Their Preparation Program HelpedThem in Increase Their Ability to Master Skills Described in the CSTP 67
Part II
Table 5-1 BTSA Funding and Participant History 89
Table 5-2 Type of Support Offered New Teachers 95
Table 6-1 Professional Development Activities Reported by Teachers 111
Table 6-2 Frequency of Reported Collaboration Activities 119
Table 6-3 Effectiveness of Professional Development on CSTP Skills, Teachers WhoShare Student Work Often vs. All Others 124
Table 7-1 Time for Professional Development 141
Table 7-2 Teachers' Expenditures on Professional Development 144
xv 16
CHAPTER 1. INTRODUCTION
Background: High Standards for All
In the middle of the 1990s, Californians awoke to a disturbing fact: our schools were not
succeeding in educating our children. Results from the 1994 National Assessment of
Educational Progress showed what many had suspected: California students ranked at the bottom
of the nation in reading achievement.' What had once been considered among the best
educational systems in the nation had significantly eroded.
The response to these results has been a determined march to improve the state's schools. At
the heart of this effort has been the development of standards for what students should know and
be able to do. The state now has well-articulated student learning goals, by grade, in the core
subject areas of mathematics, reading and language arts, science, and social studies/history. State
policy-makers have sent a clear message to educators and parents alike: all children must achieve
at higher levels.
The goal of high standards for all students is a deceptively radical one. On the surface, it is a
rhetorical phrase with which most would have long agreed. Yet, if taken seriously, it represents a
rejection of a basic tenet of American schooling: some students will achieve at high levels, most
will succeed moderately, and others inevitably will be low achievers. The California standards, in
contrast, call not for just the best and the brightestor the most advantagedto succeed; all
students are expected to reach high levels of performance.
To support the implementation of the standards, California has taken a series of policy
actions. The state assessment systemSTARhas been augmented to include items to assess
students' progress relative to standards. Instructional materials will be updated with new
appropriations. A new accountability system supports and, if necessary, will place sanctions on
schools whose students do not perform up to standard. Beginning in the 2003-04 school year, all
students will have to pass a new high school exit exam to graduate from high school. These
actions come on top of a massive investment in class size reduction, which itself was aimed at
improving student learning in the early grades.
Yet standardsand the curricular, assessment and accountability systems designed to
support themwill have little impact if teachers are not prepared to enact powerful instructional
strategies necessary for all students to reach the standards. In fact, when California students
performed poorly on the first administration of standards-based items on the state assessment,
controversy erupted over the question of whether students had been adequately prepared. State
1
17
Superintendent of Public, Instruction Delaine Eastin captured the problem succinctly: "They
[students] were asked to answer questions on materials they had not yet been taught or had the
chance to learn."2
The Key to Student Success: High-Quality Teachers
The bottom line is that standards-based reform asks more not only of students but also of all
the adults expected to support student learning. No adults are more important to student success
than teachers. Study after study has demonstrated the strong relationship between teacher quality
and student learning. It is estimated that the difference between an effective and an ineffective
teacher can be a full grade level of achievement in a school year.3 A study in Tennessee, for
example, showed that whereas low-achieving students with the least effective teachers gained
about 14 percentile point's in a year, similarly low-achieving students gained 53 percentile points in
the most effective teachers' classrooms.4
Effective teachers are those with strong verbal and mathematics skills, deep content
knowledge in the subject they teach, and strong teaching skills.5 Measuring such characteristics is
not always easy. In California, the state has established minimum requirements for a regular
teaching credential that combine coursework, practical experience in classrooms, and passing
scores on basic skills and subject matter assessments. Successful completion of these requirements
represents the minimum acceptable indication of quality and effectiveness to teach in the state's
classrooms. In fact, research in California has shown that students perform better in schools where
most teachers have met these requirements; students perform worse when they are in schools with
larger numbers of underqualified teachers.6
Attainment of high standards for all California students, then, requires that every student
have a qualified teacher to help him or her achieve to the standards. And thisproviding a
competent and effective teacher for every studentis the greatest challenge California faces.
The challenge is daunting, for many reasons. Under the best of circumstances, training and
supporting a professional workforce is orders of magnitude more difficult than drafting
standards, choosing instructional materials, or creating additional test items. Yet the present
conditions are far from optimal. The teacher workforce in California is huge, approximately
284,000. Continued growth in student enrollment and the attrition of teachers from the
profession have increased the demand for teachers, but not enough qualified teachers are willing
to take jobs in public schools, resulting in severe shortages of credentialed teachers. In 1998-99,
more than 10% of California's classrooms are headed by adults who have not met the state's
minimum requirements. And those students who need the greatest assistance, those whose
2
18

current performance is farthest below the state standards, are the most likely to be in classrooms
with underqualified teachers.
Of course, even those teachers holding full credentials are being asked to do more and to
do it with an increasingly culturally and linguistically diverse student body. These teachers need
intensive and ongoing supportopportunities to acquire new subject matter knowledge and to
learn more effective pedagogy. Again, research points to the efficacy of intensive content-based
professional development for teachers in improving teacher practice and student achievement.7
Yet the system of professional development in the state remains largely uncoordinated, placing
the burden on individual teachers to create coherent learning opportunities to increase their
capacity to bring students up to standards.
In short, if California's march toward academic excellence is to be successful, it must
simultaneously increase the quantity and the quality of the teacher workforce. Failure to do so
to place high-quality, effective teachers in every classroomwill transform the ambitious
standards-based movement into a meaningless game of politics, teacher frustration, and, worse,
increased student failure.
Teaching and California's Future
To address this challenge, a coalition of stakeholders with interests in teacher recruitment,
preparation, induction support, and professional development have come together to search for
ways to ensure that all California schoolchildren have a qualified and effective teacher. Led by
the Center for the Future of Teaching and Learning and cosponsorsthe California State
University Institute for Educational Reform; Policy Analysis for California Education (PACE);
Recruiting New Teachers, Inc.; University of California Office of the President; and West Ed
these stakeholders are implementing an initiative focused on building teacher workforce
capacity. Teaching and California's Future involves a twofold strategy: (1) convening a Task
Force of key policy-makers, practitioners, institutions of higher education, and professional
organizations to develop and implement a plan to improve teacher development policies and
practices in California; and (2) undertaking a comprehensive study of the conditions of teacher
development in the state to inform the work of the Task Force.
The Task Force on Teaching and California's Future comprises practitioners and leaders
from the key organizations responsible for oversight of the teacher development system. The
cosponsors have identified and brought to the table representatives from a broad cross-section of
the critical policy and educational leadership organizations in the state, as well as leading
3
19
practitioners, including accomplished classroom teachers. The charge to each Task Force
member includes:
Providing counsel on the design and conduct of a study of teacher development inCalifornia.
Encouraging the cooperation of those inside his/her own organization throughout thestudy period.
Deliberating on the findings from the research and drawing from the datarecommendations to strengthen teacher development.
Mobilizing his/her agency or organization to carry out the recommendations of the TaskForce.
Progress to Date
Since January 1998, the Task Force has convened six times. At its second meeting, in June
1998, the Task Force was presented with An Inventory of the Status of Teacher Development in
California, prepared by SRI International.8 The Inventory reviewed and assembled secondary
data on key issues facing the teacher development system. Based on previous studies, analyses
of available databases, review of legislation and program documents, and interviews with key
actors throughout the state, this report provided an objective picture of the status of the teaching
profession in California.
The Task Force's review of the Inventory resulted in a decision to move forward with the
design of a study to collect data on a series of issues not well addressed through existing data.
The design of that original data collection was presented to the Task Force in fall 1998. During
the remainder of the 1998-99 school year, the SRI research team undertook the study, the results
of which are the source of the findings in this document. This research included a statewide
teacher survey and eight case studies of local teacher development systems throughout
California. In addition, the SRI research team continued to review secondary databases to update
the key findings in the original Inventory.
The statewide teacher survey targeted a representative sample of K-12 California public
school teachers. Seventy-seven percent of the surveyed teachers responded to the 60-item
survey. The survey instrument asked teachers for their perspectives in the following key areas,
concentrating particularly on those topics for which we found significant gaps in existing
statewide data during our work on the original Inventory:
Teacher preparation
Job search and recruitment
4
r10

Induction for new teachers
Professional development and workplace support
Compensation and evaluation of teachers.
Details on survey data collection and analysis can be found in Appendix A.
To corhplement the breadth of statewide data gathered through the inventory and the
teacher survey, we conducted case studies of eight local systems of teacher developmentin El
Centro, Elk Grove, Eureka, Los Angeles, San Diego, San Francisco, Santa Monica, and Selma.
Case study sites were selected to achieve a mix of regional 'settings and represent urban,
suburban, and rural districts. In addition, the case study sample was selected to include both
districts with high access to teacher professional development opportunities and those with more
typical levels of access.
Each case study focused on one district and included visits to the district office, visits to
four schools within the district, and in-depth interviews with four teachers at each school. In
addition, we conducted larger focus groups with additional teachers, interviews with school and
district administrators, and interviews with other key players in the district's professional
development system. The case studies examined teachers' career decisions and learning
opportunities, the effectiveness of these opportunities, and the extent to which the current system
of teacher development is integrated and coherent. Additional detail on the case studies is also
presented in Appendix A.
Looking Ahead: Principles for Improving Teacher Development in California
A draft of this document was presented to the Task Force in September 1999 to provide its
members with the most up-to-date information on the status of the system of teacher
development in California and, in doing so, to pinpoint the key areas that require the attention of
policy-makers. As a result, the Task Force leadership developed a set of key recommendations,
which are detailed later in this document. In brief, these are:
1. Ensure that every child has a fully qualified, effective teacher.
2. Eliminate the hiring of unqualified teachers.
3. Improve the ability of the teaching profession to attract and keep fully qualified teachers.
4. Strengthen accountability for all teacher education programs.
5. Reduce unnecessary barriers to teaching.
6. Encourage and support teachers to reach high levels of subject matter expertise andinstructional skill.

Products of Teaching and California's Future
This document includes the main research findings of Teaching and California's Future
and the detailed recommendations of the Task Force. The document is organized into two main
parts. Part I addresses the issue of ensuring a qualified and competent teacher for every
California schoolchild. It includes chapters on the supply of and demand for teachers, the
distribution of qualified and underqualified teachers in the state, and the system for preparing
teachers for California's classrooms. Part II addresses the issue of building and maintaining the
strengths of the current teacher workforce. It contains chapters on induction, professional
development, and state and district supports for professional development. In both parts, each
chapter is preceded by a short synopsis of the key findings presented therein. Each part ends
with key recommendations from the Task Force.
In addition to this document, the Center for the Future of Teaching and Learning
commissioned or adopted a series of papers to address issues raised in this study and to inform
the work of the Task Force. These papers are available from the Center:
The Essential ProfessiA, by David Haselkorn, Louis Harris, and Elizabeth Fideler9
Professional Development for Teachers: Setting the Stage for Learning from Teaching,by Linda Darling-Hammondl°
Preparation for Teaching California's Culturally and Linguistically Diverse Students, byPatricia Gandara and Julie Maxwell-Jollyll
Teachers and Standards, by Phil Daro12
Good Teaching Matters...A Lot, by Kati Haycock13
A White Paper on Teacher Induction in California, by SRI International (cosponsored bythe New Teacher Center)'4

Endnotes
1 Results refer to fourth-grade reading achievement as reported in National Assessment of Educational Progress.1994. The nation's report card. Washington, DC: National Center for Education Statistics.
2 Eastin, Delaine. (1999, June). Draft letter from State Superintendent of Instruction to parents.
Hanushek, Eric A. (1992). The trade-off between child quantity and quality, Journal of Political Economy(cited in Haycock, 1998).
4 Sanders, William J., & Rivers, June C. (1996). Cumulative and residual effects of teachers on future students'academic achievement. Knoxville: University of Tennessee Value-Added Research and Assessment Center.
5 Haycock, K. (1998, Summer). Good teaching matters...A lot. Thinking K -16, 3(2), The Education Trust,Washington, DC.
6 Fetler, M. (1999, March). High school staff characteristics and mathematics test results. Education PolicyAnalysis Archives, 7(9).
7 See, for example, Shields, P. M., David, J. L., Humphrey, D. C., & Young, V. M. (1999). Evaluation of the PewNetwork For Standards-Based Reform: Third year report. Menlo Park, CA: SRI International; and Cohen, D., &Hill, H. (1998, January). CPRE policy briefs: State policy and classroom performance: Mathematics reform inCalifornia. Philadelphia, PA: Consortium for Policy Research in Education.
8 Shields, P. M., Marsh, J. M., & Powell, J. (1998). An inventory of the status of teacher development inCalifornia. Menlo Park, CA: SRI International.
9 Haselkorn, D., Harris, L., & Fideler, E. (1998). The essential profession. Belmont, MA: Recruiting NewTeachers, Inc.
to Darling-Hammond, L. (1999). Professional development for teachers: Setting the stage for learning fromteaching. Santa Cruz, CA: The Center fOr the Future of Teaching and Learning.
Gandara, P., & Maxwell-Jolly, J. (1999). Preparation for teaching California's culturally and linguisticallydiverse students. Santa Cruz, CA: The Center for the Future of Teaching and Learning.
12 Daro, P. (1999). Teachers and standards. Santa Cruz, CA: The Center for the Future of Teaching andLearning.
13 Haycock, K. (1998, Summer).14 SRI International. (Forthcoming). A white paper on teacher induction in California. Santa Cruz, CA: The
Center for the Future of Teaching and Learning and the New Teacher Center.

PART I. ENSURING A QUALIFIED TEACHER FOR EVERYCALIFORNIA SCHOOLCHILD
The hope of having all students reach ambitious academic standards turns on the state's
capacity to ensure a qualified and competent teacher in every classroom in the state. With a
teacher workforce of approximately 284,000 and the need to hire at least 26,000 new teachers
each year, filling every classroom with a qualified teacher is and will remain a challenge. Yet, if
the state does not do so, the call for higher standards rings hollow. Without the political courage
and will to provide every student a fully qualified and effective teacher, the state has no right to
hold either schools or students accountable for high levels of achievement.
In this first part of the report, we ask three basic questions. First, does California produce,
attract, and retain a sufficient number of teachers to ensure that every California schoOlchild is in
a classroom with a qualified teacherand will it be able to do so in the future? Second, which
students are most likely to be taught by an underqualified teacher, and what is the impact on a
child's education? Third, what is being done in terms of preparing teachers to ensure a qualified
and effective teacher for every California schoolchild?
The answers to these questions, which we address in detail, are quite sobering. No,
California currently does not provide qualified teachers for all students. More than 1 inevery 10 classrooms in the state are staffed by teachers who have not met the state's minimum
requirements. California policy-makers, including the Governor, are aware of this situation and
have initiated a number of new policies to address the problem since the beginning of 1998
such as the expansion of the teacher preparation programs in the California State University
system. Still, we project that at best it will be many years before current policies will be
sufficient to bridge the gap between the demand for teachers and the supply of qualified
candidates willing to take jobs in the state's schools.
In the meantime, those students in greatest need of effective teachers are the most
likely to be in classrooms with underqualified teachers. In fact, the distribution of qualified
teachers is quite uneven across the state. Students in poor, inner-city schools are much more
likely than their more advantaged suburban counterparts to have underqualified teachers.
Students who score in the bottom quartile of reading achievement in third grade are five times as
likely as students scoring in the top quartile to have an underqualified teacher. These are the
students who, if they do not learn to read well soon, will be unable to perform well in any subject
area. And, of course, it is just these students whom, a few years hence, the state will most likely
refuse to graduate from high school because they cannot meet the standards.

In response to the shortage of teachers, efforts are under way to increase the capacity of the
teacher preparation system to turn out more teaching candidates and to create more flexible and
streamlined routes into the profession. To the extent that policy efforts promise to increase the
number of individuals preparing for the profession, they also raise serious questions about the
capacity of alternative providers to support teacher candidates and about the quality of these
alternative routes. Of particular concern are the disincentives in areas of high demand for
teacher candidates to completeor even begintheir preparation before entering theclassroom as a full-time teacher.
In essence, California is embarked on a path where there are not enough qualified teachers
in our classrooms and where the neediest students are allocated the fewest professional
resources. Such an indictment of the current educational system in the state must be based on
sound data and analysis. We devote the remainder of Part I of this report to the presentation of
these data and analyses. In Chapter 2, we explore the overall statewide supply of and demand
for teachers. In Chapter 3, we examine the distribution of shortages across the state and
underscore the strong relationship between the needs of students and the percentage of
underqualified teachers in that school. In Chapter 4, we examine the capacity of the system of
teacher preparation to produce a sufficient number of qualified teacher candidates, describe
current trends toward alternative preparation programs, and raise some issues about the potential
effectiveness of such programs. We conclude Part I with the relevant Task Force
recommendations.
10
25

CHAPTER 2. THE SUPPLY OF AND DEMAND FOR QUALIFIEDTEACHERS FOR CALIFORNIA'S CLASSROOMS
DEMAND
How many teachers will California schools have to hire to serve the state's growing and diversestudent population?
Through the middle of the next decade, California can expect a sustained demand for a largenumber of teachersincreasing from 28,000 new hires in 1999 to 36,000 in 2007.
From 1999-2000 through 2007-08, we estimate that approximately 287,000 new teachers will need tobe hired to adequately serve California's growing student population (for a total teacher workforce of306,000 in 2007-08).
The central factors fueling the increased demand for teachers are student enrollment growth, classsize reduction, teacher attrition, and baby-boomer retirement.
SUPPLY
How many teachers will the state produce to meet the demand for new teachers?California issued approximately 17,000 new credentials in 1997-98.
However, the number of new credentials does not equal the number of new teachers entering theworkforce. It is estimated that 50% to 70% of new credential holders take jobs the following year.This fact is somewhat offset by credentialed teachers reentering the labor pool.
Taking into account recent key policies, estimates of teacher supply in the year 2007-08 range from-a high of approximately 315,000 to a low of approximately 268,000.
SUPPLY AND DEMAND
Will there be enough new teachers to meet the demand in California schools?
Currently, there are not enough qualified teachers in California classrooms. In 1998-99, more than28,500 emergency permits were issued to underqualified teachers, a sharp increase from the 15,400emergency permits issued in 1995-96, before class size reduction.
California will need 306,000 qualified teachers to staff its classrooms in school year 2007-08.
We project that the supply of credentialed teachers willing to take these jobs is likely to fall short ofthis demand, absent aggressive policy intervention.
Even under the most optimistic scenarios, we do not project the gap between the demand forteachers and the supply of credentialed teachers willing to take jobs to close for 7 years.
11
26

Does California produce, attract, and retain a sufficient number of teachers to ensure that
every California schoolchild is in a classroom with a qualified teacher? The answer is no. Over
the past decade, the state has experienced a severe shortage of fully credentialed teachers willing
to accept jobs in the public school system. As we outline in detail in this chapter, as student
enrollment has grown, class size reduction has been put in place, and teachers have left the
system, increasingly larger nurnberS of California classrooms have been staffed by underqualified
teachersteachers who have not met the state's minimum requirements for obtaining a full
credential.
Is there any hope that the situation will improve in the future? Certainly, state policy-
makers have taken some steps to address the problem, such as the expansion of the Beginning
Teacher Support and Assessment program and the expansion of the capacity of the California
State University system to prepare teachers. The degree to which these and other policies can
close the gap can only be estimated. Such estimates have to be combined with projections of the
future decisions of hundreds of thousands of current teacherswhether they will stay in the
professionand potential future teachersthose who currently hold credentials but have chosen
to remain out of the teacher workforce, those who are in teacher preparation programs, and those
who potentially could enter preparation programs in the future. Past trendsof attrition,
retirement, and job takingcan serve as guides to these projections but can yield only estimates.
Consequently, we present our projections as a range of possible outcomes. We conclude
that even under the most optimistic scenarioone with historically low attrition, high job-taking
rates, and effective implementation of new state policiesthe shortage of qualified teachers in
California classrooms is likely to continue for at least another 7 years. Under less optimistic
scenarios, the gap will continue into the foreseeable future, abSent aggressive policy intervention.
In the remainder of this chapter, we build these findings in detail. We begin with an
examination of the historical demand for teachers in the state and project that demand into the
future, accounting for a series of factors we identify as fueling demand. Next, we examine the
historical supply of qualified teachersthat is, fully credentialed teachers willing to take available
jobsand project supply figures into the future as well. In doing so, we consider the impact of
recent policy initiatives designed to increase the number of qualified teachers.
The Demand for Teachers in California's Classrooms
The demand for teachers in California has grown dramatically during the 1990s and is
expected to continue to increase. In the past decade, the size of the teacher workforce has
increased nearly 40%, starting with approximately 197,000 teachers in 1988 -89.' In 1998-99,
12
27

there were approximately 284,000 teachers in K-12 classrooms throughout California.2 This
increasing demand for teachers stems from a combination of increasing enrollment, natural
attrition, increasing retirement from the profession, and the policy decision to reduce class sizes in
the early elementary grades. Figure 2-1 illustrates both the historical demand for teachers in
California and our projection of the future demand.
The large increases in the demand for teachers during the 1996-97 and 1997-98 school
years, as illustrated in Figure 2-1, are largely reflective of the 1996-97 class size reduction (CSR)
legislation. The projected increase in demand reflects the anticipated retirement of the baby
boomers, should the average retirement age remain unchanged.
This rising demand means that California can expect to hire a large number of teachers
growing from 28,000 in 1999-2000 to 36,000 in 2007-08, and averaging about 32,000 each year
(see Figure 2-2). From 1999 through 2008, we estimate that about 287,000 new teachers must be
hired to fill California's classrooms. These figures do not include the credentialed teachers
needed to replace emergency permit holders currently in California classrooms.
320,000
300,000
280,000
N.... 260,000Aa)H
240,000
220,000
200,000
Figure 2-1Historical and Projected Demand for Teachers in California
,4-1., ...,,:p re ,cbeo e e 4:bcb 9,cbq diz. tp, ,,,,,,t, ,,,,b 04 0 4p ccf5, 1/443,cfb , e \cP e ,053 \cfb ,cP it' 1,o° e , ,,e q5P e e1 Historical demand A Projected demand
Sources: Fetler (1997)3; SRI analysis.
13
28

45,000
40,000
35,000
30,000
25,000
20,000
15,000
10,000
5,000
Figure 2-2Actual and Projected Teacher Hires, 1992-2007
co? 401, oje &or° acC` %Cr Cr \Cr cb4 193"sq NCP
Year
e ec° 614.6 C.\\6b
0Actual (teachers hired) a Projected (teachers needed)
Sources: CDE (August 1997); SRI analysis.4
Projecting the demand for new teachers requires assumptions about enrollment trends, the
stability of teacher-student ratios, and attrition and retirement rates. Thus, these projections
represent estimates and should be interpreted as such. It is also important to keep in mind that
other contextual factors could change and subsequently affect these projections. For example, if
class size reduction were expanded to cover more grade levels, we would expect a sharp increase
in the demand for teachers. Conversely, increases in teacher salaries or other policy initiatives
might reduce attrition and lower the growing demand. Below, we explore three key factors that
are fueling the demand for teachers.
Factors Fueling Demand: Student Enrollment Growth
Increasing numbers of school-age children account for some of the growing demand for
teachers. Student enrollment is growing nationally, in part because of "the baby boom echo," as
children of baby boomers continue to fill classrooms.5 In California, which has added
approximately 4 million new residents since 1990, student enrollment is also affected by overall
population growth.6 From 1988-89 to 1997-98, student enrollment in California grew by
approximately 1.1 million, or 25%.7 Looking forward, enrollment in California is projected to
grow from 5.8 million K-12 students in 1998-99 to 6.2 million students by 2007-08.8 Assuming
14
29
the current pupil-teacher ratio, California would need to add about 19,400 new teachers from
1998-99 to 2007-08 to keep pace with student enrollment growth alone.
Factors Fueling Demand: Attrition and Retirement
Much of the predicted increase in future demand is due to the expected departure of many
teachers from California's workforce through retirement and attrition. The attrition of practicing
teachersand their retirement, to a lesser extentare individual economic decisions, based on
the salary for teaching vis-à-vis salaries in competing industries, working conditions, teaching
assignments available, and location of the job. Because available data on retirement and attrition
is limited and because we can only estimate how individuals will choose to act in the future, the
demand due to these factors can only be estimated.
Overall, most estimates of annual attrition (the loss of teachers from the profession for
reasons other than retirement) cluster around 6%.9 This estimate includes the high number of
teachers who leave the profession early in their careers.1° Estimates of annual retirement cluster
around 2%ranging between 1.3% and 2.3%." These estimates are generally based on data
from the California State Teachers' Retirement System (STRS). We estimate that 1.9% of active
STRS members retired in fiscal year 1997-98.12
However, many expect the retirement rate to increase among teachers (as it probably will in
all professions) in the coming years because of the age of the current workforce. In 1997-98, half
of all active STRS members were more than 45 years old, and one out of seven were 55 or
older." Although current data sources do not allow a precise analysis of the probable impact of
the baby boomers' retirement, a rudimentary analysis with available data shows that the potential
impact is enormous.
Using conservative assumptions based on average 10-year historical STRS membership
growth and the average membership retirement age of 60, we estimate that the annual retirement
rate for K-12 teachers could increase from 2% in 1998-99 to a high of 5.3% by 2007. The
increasing rate of retirement would stimulate, from 1999 through 2008, a cumulative demand for
53,000 teachers.'4
Factors Fueling Demand: Class Size Reduction (CSR)
Despite existing shortages of qualified teachers in California classrooms, policy-makers
implemented CSR in 1996 to address the problem of large classes and to lower student-teacher
ratios in the primary grades. By 1998-99, the third year of CSR implementation, nearly all first-
and second-grade students, 80% of kindergartners, and 74% of third-grade students were in
15
30
classes of 20 students or fewer.15 Lowering class sizes in these grades forced many districts in the
state to hire additional teachers. Statewide, the CSR initiative created a need for approximately
18,400 new elementary teachers in 1996-97, its first year of implementationin addition to the
approximately 16,000 elementary teachers hired for normal replacement and growth needs.16 This
represented a 115% increase in the demand for new elementary teachers over the previous year."
An estimated 7,800 additional teachers had to be hired to fully implement CSR in the second year
of implementation, 1997-98.18 In addition, the 1998 augmentation of the 1989 Morgan-Hart
Class Size Reduction Act aimed to reduce class sizes in ninth-grade core subject areas and
resulted in increased demand for single-subject high school teachers.
Our projections of teacher demand (Figures 2-1 and 2-2) rely on a stable pupil-teacher ratio
that assumes full implementation of CSR in K-3 and in grade 9 in the core subjects. As noted
above, we project that California will need to hire 287,000 new teachers through school year
2007-08. Next, we turn to the supply side of the supply and demand equation.
The Supply of Qualified Teachers in California Classrooms
Here we examine historical data on the supply of teachers and present projections of future
supply. These projections include estimates of the impacts of recent key policy initiatives meant
to increase teacher supply.
We define the supply of teachers as the number of teachers who hold preliminary or
professional clear credentials as specified by California's Commission on Teacher Credentialing
(CTC) requirements and who are willing to take jobs for the salary, assignment, location, and
working conditions offered. Our supply count does not include those who are teaching with
emergency permits, waivers, or internship credentials from the CTC. As such, the supply
includes: (1) the base of veteran credentialed teachers remaining in the workforce at the beginning
of each school year, (2) "new" teachers entering the workforce for the first time, and (3)
"reentrant" teachers who hold credentials and are returning to the profession after a period of
absence.
A larger supply pool of individuals who hold teaching credentials but who are not teaching
exists. This supply pool consists of those who left the profession, those who completed teacher
preparation programs but did not take teaching jobs, and those who hold credentials from another
state and are not teaching in California. These individuals, though qualified, choose not to teach
for a variety of reasons that presumably include higher salaries in competing industries, working
conditions, location, and teaching assignments available. There are no estimates of the size of the
16
31
supply pool, but arguably policies directed at economic factors might draw these qualified
individuals into teaching.19
Below, we describe what is known about the participation of veteran teachers, newly
credentialed teachers, and reentrants in the workforce.
The Base of Veteran Credentialed Teachers
The base of veteran credentialed teachers at the beginning of a given school year is equal to
the number of teachers in the workforce from the previous year minus normal attrition and
retirement, and minus teachers with emergency permits, waivers, or internships.
Thus, for example, at the end of the 1997-98 school year, there were approximately 270,000
teachers in California classrooms. We estimate that approximately 22,000 retired or left the
profession (approximately 8%) and more than 26,000 held emergency permits, waivers, or
internship credentials. Thus, at the beginning of the 1998-99 school year, the base of veteran
credentialed teachers remaining in the workforce from 1997-98 was about 222,000.
New Teachers Entering the Profession
Each year, the base of veteran teachers is augmented by "new" credentialed teachers. In
1997-98, the California Commission on Teacher Credentialing issued approximately 17,000 new
multiple- and single-subject teaching credentials to individuals recommended by teacher
preparation programs. The actual number of newly credentialed teachers who take vacant
positions each year, however, is not equivalent to the total number of new credentials. Many
recent graduates of California teacher preparation programs do not apply for teaching positions
the following year.* The exact number of first-time, in-state credential holders who actually enter
the teaching force each year is hard to estimate. Because neither the state nor teacher preparation
programs track the employment of these individuals, estimates must be made from limited data
collected at the district level. Estimates of how many preparation program graduates actually
enter the workforce go as high as 70% based on national data2° and down to around 50% based
on California data.21
Of the approximately 17,000 individuals who completed a teacher preparation program in
1998-99, only 8,500 would have entered the teaching force in the fall of 1999, assuming a 50%
*Out-of-state teachers who apply for temporary credentials typically have high prospects of employmentit is forthat reason that they make their application. Thus, we assume that the vast majority of out-of-state teachers whoreceive credentials actually go on to teach.
participation rate, and 11,900 using the 70% assumption. In the projections presented here, we
estimate the impact of both 50% and 70% participation of newly credentialed teachers.
The Influx of Reentrants to the Teacher Workforce
Many teachers leave the profession early in their careerswhether for personal reasons (to
raise a family), professional ones (to pursue other career interests), or economic ones (to pursue
more lucrative jobs). These teachers make up a large part of the supply pool of qualified teachers.
Some portion of the supply pool reenters the workforce each year, supplementing the number of
newly credentialed teachers just graduating from training programs. Following the methodology
of other workforce projections,22 we estimate that reentrants comprise just over 40% of new
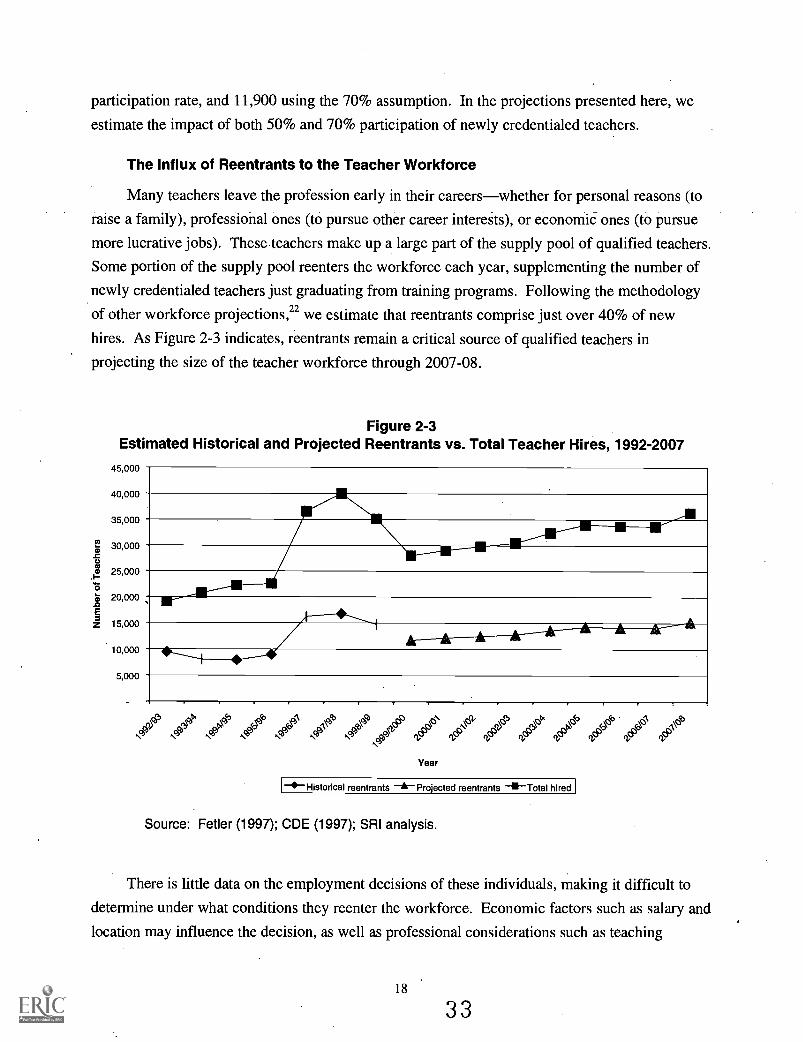
hires. As Figure 2-3 indicates, reentrants remain a critical source of qualified teachers in
projecting the size of the teacher workforce through 2007-08.
Figure 2-3Estimated Historical and Projected Reentrants vs. Total Teacher Hires, 1992-2007
45,000
40,000
35,000
30,000
25,000
20,000
15,000
10,000
5,000
\cp \op Ncbq e q5S5 qCP eYear
Historical reentrants AProjected reentrants 6Total hired
Source: Fetler (1997); CDE (1997); SRI analysis.
There is little data on the employment decisions of these individuals, making it difficult to
determine under what conditions they reenter the workforce. Economic factors such as salary and
location may influence the decision, as well as professional considerations such as teaching
18
33

assignment and working conditions. The number of reentrants did surge with class size reduction
as teaching positions opened up in every community in the state. Other potential policy
initiatives, such as increasing teachers' salaries, might attract more of these individuals back into
the profession; as well.
Projecting the Supply of Qualified Teachers in California Classrooms
Projecting the size of California's teaching force depends on a series of assumptions that can
be based only in part on historical data. Not only do we need to estimate the numbers of veteran
and new teachers who remain in the teaching force, we also must project potential impacts of new
policies. In the wake of class size reduction and the attendant spike in the demand for classroom
teachers, state policy-makers have enacted a series of initiatives to address the supply of qualified
teachers. It is impossible to estimate the impacts of many of these initiatives, but we have
sufficient information to project the impacts of two promising policy initiatives from the 1998
legislative session: the expansion of the Beginning Teacher Support and Assessment program,
designed to reduce attrition, and the expansion of the capacity of the CSU system, intended to
produce a greater number of newly credentialed teachers. The projections presented here do not
take into account other policies designed to address aspects of supply for which we have no
historical data to project impact.
Incremental Impact of BTSA Expansion. The Beginning Teacher Support and
Assistance program provides fully credentialed first- and second-year teachers with opportunities
to deepen their pedagogical content knowledge and skill with the assistance of support
providersmore experienced and expert teachers. SB 2042 (1998) requires that all teachers who
receive preliminary credentials participate in a formal induction program to receive their clear
credential. The 1999-2000 budget provided $72 million for BTSA programs, up from $17.7
million in 1997-98, to support all teachers in their first 2 years of teaching.
Pilot studies of BTSA's precursors, such as the California New Teacher Project (CNTP),
showed higher retention rates among those teachers who volunteered to participate in an
induction program than among nonparticipants. Eighty-seven percent of CNTP teachers returned
to teach in the same district for a second year, and 81% for a third year, both much higher than
national averages. Even higher percentages remained in the teaching profession, even if they
changed districts.23 The expansion of BTSA to all new teachers is meant to reduce the attrition
rate among teachers in their first 5 years of teaching
Because this historical data represents the results of pilot programs, we are uncertain of the
degree to which the scaled-up program will have similar results. Consequently, we present high

and low estimates of the future impact of the BTSA legislation on the size of the teacher
workforce. High estimates assume that expanded BTSA programs will be almost as successful as
they have been in the past, at an 80% 5-year retention rate and a participation rate of 70% of
newly credentialed teachers. Under these assumptions, we estimate that improved retention of
new teachers produces a cumulative increase of 104,000 teachers from 1999-2000 to 2007-08, so
that by the year 2007, almost 27,000 teachers will be in the workforce who otherwise would not
be. At a 60% 5-year retention rate and 50% participation of newly credentialed teachers, low
estimates assume a lower effectiveness of expanded BTSA programs but recognize improvements
over the historical 50% 5-year retention rate of new teachers. The low assumption results in an
additional 25,000 teachers over the same period of time, and an incremental increase of almost
6,500 in 2007.
Increasing CSU's Capacity to Prepare Additional Teachers. The California State
University system has historically been the state's largest producer of teaching candidates.
Throughout the 1990s, as we will explore in Chapter 4 of this document, CSU-recommended new
credentials have remained relatively flat while both the absolute number and the percentage of the
total credentials produced in independent schools have increased.
In response, the state augmented CSU's funding to increase its production of credentialed
candidates. CSU plans to produce a total of 15,000 credentialed graduates per year by 1999-
2000, up from 11,736 in 1996-97 and almost 13,900 in 1997-98.24 Because the majority of new
credential growth has been among the independents at much higher tuition fees than those CSU
charges, we can expect that prospective teachers who otherwise would have enrolled in
independent institutions of higher education (IHEs) will fill some percentage of the new CSU
positions. Thus, the announced expansion does not realistically represent the net number of
new credentials. We use sensitivity analysis to estimate the impact of the new CSU positions
under several scenariosfrom 100% (i.e., 0% shift from independents) to 50% new positions
and assume that all new teachers participate in the expanded BTSA programs discussed above.
Under a moderate assumption of 75% new positions (i.e., 25% shift from independents), the
cumulative number of new teachers entering and staying in the workforce through 2007-08 as a
result of the CSU expansion policy is 18,500, assuming low 'BTSA impact and 50%
participation of newly credentialed teachers, and 29,000 assuming high BTSA impact and 70%
participation.
The Promise of Other State Policies to Affect the Supply of Fully CredentialedTeachers
Other state policies enacted in California in recent years aim at lowering entry barriers to the
teaching profession. Without any historical data, however, their impacts are extremely difficult to
quantify. They will need to be tracked in the ensuing years to accurately gauge whether the
measures are sufficient to meet the remaining gap and to end the need for emergency permits
within a reasonable time. Three types of programs appear especially promising in that they may
increase the supply of teachers in the next few years: those that support uncredentialed teachers,
those that lower barriers for out-of-state teachers, and those that offer financial incentives to
current and prospective teachers.
Support for Uncredentialed Teachers. The Intern and Pre-intern programs support
practicing teachers who have not yet completed a teacher preparation program and who do not
hold a preliminary teaching credential. Both aim to support and retain these individuals in the
classroom, as well as get them through a preparation program. Individuals qualify for intern
status if they have a baccalaureate degree and have passed the California Basic Education Skills
Test (CBEST) and subject matter requirements. While teaching full-time, interns also engage in a
planned course of study with expert teachers or IHE faculty. In 1999-2000, the intern program is
funded at $11.0 million to serve 7,300 interns.
Introduced in 1998, the Pre-intern program targets individuals on emergency permits who
have not met subject matter requirements and typically have had no previous teaching experience.
The program is supposed to help pre-interns meet subject matter requirements, as well as give
them basic classroom management strategies and instructional methods. In 1998-99, the CTC
issued approximately 250 pre-intern certificates. For 1999-2000, the legislature has earmarked
$11.8 million to serve 6,000 pre-interns.
Lowering Barriers for Out-of-State Teachers. Passed in 1998, AB 1620 will reduce the
barriers that teaching candidates credentialed outside of California face in accepting teaching
positions in California. The CTC is in the process of evaluating other states' teacher preparation
standards and so far has identified nine states with standards that are equivalent to California's.
Credentials from institutions in these states will be recognized in California, and the bill will also
simplify the process for those from states whose standards are not equivalent to California's.
With lower entry barriers, teaching in California may be a more attractive alternative for out-of-
state graduates than it previously was.
Financial Incentives. Several recent initiatives aim to increase teacher recruitment and
retention with financial incentives, either student aid or salary enhancements. In 1998, the Cal
21
36

Grant T Program was initiated, providing $10 million in awards for prospective teachers enrolled
in teacher preparation programs. Funding allows for up to 3,000 awards annually
approximately $1,600 for CSU students, $3,600 for UC students, and $9,000 for students at
independent institutions. This program may increase access to teacher preparation programs and
increase the pool of credentialed teachers.
The Assumption Program of Loans for Education (APLE) assumes educational loans for
students who promise to enter the teaching profession and agree to teach in a subject area with
teacher shortages or in schools that serve large populations of students from low-income families.
In 1998, the number of APLE warrants was expanded from 400 to 4,500. In addition, the
program was expanded to require participants to teach for 4 rather than 3 years in a California
public school, a feature aimed at retaining teachers through the first few critical years. In the first
year, the program assumes $2,000 of a teacher's student loans. In years 2 to 4, the program
assumes $3,000 of a teacher's loans, for a total of $11,000 over 4 years. The APLE program is
designed to increase recruitment and retention of new teachers.
A new program initiated in 1999 offers financial incentives to districts to increase their
minimum teacher salary to at least $32,000. The Beginning Teacher Salary Incentive Program
provides funds only to increase salaries of teachers who hold a valid teaching credential, and
cannot be used to pay teachers on emergency permits or waivers. As with the Cal Grant T and
APLE programs, this prograin is expected to have a positive impact on the number of teachers
attracted to and retained in the profession.
Other Policies. Other policies expected to have some marginal impact are: accreditation of
out-of-state preparation programs with satellite campuses in California, the California Math
Initiative, blended 4-year teacher preparation programs, and CalTeach. In addition, CSU
launched a new credential program, CalStateTEACH, in the fall of 1999. This 18-month program
will use the Internet, school site mentors, and site-visiting faculty supervisors, and aims to certify
up to 1,000 teachers per cohort currently working on emergency permits.
In aggregate, policies designed to help underqualified teachers get credentials and remain in
the profession, to lower barriers to teachers from other states, and to increase the financial
incentives to enter the profession can be expected to have a positive impact on the supply of
qualified teachers willing to take jobs in the state's schools. Unfortunately, because these
programs are only beginning to be implemented, their implementation is quite uneven (for
example, many districts have not chosen to accept the incentive to raise beginning teacher
salaries) and because we have no historical data on which to base estimates of their impact, we do
not include their potential effects in the projections presented here.

Putting Supply and Demand Together
Given historical trends and our projections of the future supply of and demand for qualified
teachers, will California have a sufficient number of teachers to fill the state's classrooms? Such
an analysis has to begin with recognition of the fact that California has long suffered from a
shortage of fully credentialed teachers willing to teach in its classrooms. At the beginning of the
1990s, 12,200 classroom teachers held emergency permits, representing about 5.5% of the
teacher workforce. * This figure remained steady through the first half of the decade until the
implementation of class size reduction, when the number of teachers with emergency permits
increased to over 18,000 in 1996-97 and climbed to over 28,500 in 1998-99 (Figure 2-4).
Currently, we estimate that about 10% of California classrooms are staffed by teachers holding an
emergency permit.
The minimum requirements for an emergency single- or multiple-subject teaching permit are completion of abachelor's degree, passage of the California Basic Education Skills Test (CBEST), and verification of subjectmatter competence at a level established in regulation for the emergency permit. Individuals serving on anemergency permit must enroll in a CTC-approved professional preparation program for the credential andcomplete a minimum of six semester units of coursework each year to renew the permit. Emergency permits canbe renewed for only five consecutive years, after which individuals on emergency permits wishing to remain inteaching must achieve a preliminary or professional clear credential.

35000
30000
25000
a
co
s 20000E
o.0ei 15000.oE
z
1 0 0 0 0
5000
Figure 2-4Total Emergency Permits, 1991-92 to 1998-99a
1991/92 1992/93 1993/94 1994/95 1995/96
Year
1996/97 1997/98 98/99
Source: CTC.25
a Preliminary data for 1998-99. The CTC anticipates that the actual count will be slightlyhigher.
In addition to emergency permits, there are two other categories of working teachers who
have not completed the minimum state requirements for a basic teaching credential and whom we
therefore define as underqualified: interns and waiver holders. Interns are individuals who are
teaching while concurrently enrolled in a teacher preparation program. We discuss interns further
in Chapter 4. Waivers are issued when teacher candidates cannot meet or have not yet met the
requirements for an emergency permit. In 1997-98, according to data collected by the California
Department of Education, 12% of the credentials held by teachers working in California's
classrooms were emergency permits, intern certificates, or waivers.26 Although complete data is
not available for 1998-99, the preliminary estimate of emergency permits issued by the California
Commission on Teacher Credentialing is approximately 10% of the current size of the teacher
workforce. As in previous years, we would conclude that the total percentage of working
teachers who are underqualifiedthat is, emergency permit holders, waiver holders, and interns
24
39

combinedis more than 10%. Future demand for teachers includes the replacement of these
individuals with fully credentialed teachers.
Finally in Figure 2-5, we present our estimate of the supply of credentialed teachers
participating in the workforce relative to overall demand through the year 2007-08. We project
two estimates of the future teacher workforce, based on the assumptions we described in this
chapter, combined with high and low estimates of the impact of BTSA and CSU expansion.
320,000
300,000
280,000
240,000
Figure 2-5Projected Teacher Workforce through 2007-08
220,000 A`
200,000
Ifb'b 4cbt. 4§3 Afp e ,(1,e e e e e e \cf) \c§b osg§ 45P rip I,n,t* bp43 44, co\ ,x\o`b
cS=i
OBTSA/CSU impact, high estimate BTSA/CSU impact, low estimate IHistorical and projected demand
Sources: Fetler (1997); CDE (1998); SRI analysis.
As Figure 2-7 shows, under the most optimistic scenarios of high participation of newly
credentialed teachers, BTSA expansion, and CSU expansion, the gap between supply and demand
is projected to remain until 2006. Using the low-impact estimates, the gap grows to 37,000 in
2007-08, to be filled by underqualified teachers. These projections incorporate the estimated
impact of the retirement of baby boomers. Although the total number of emergency permits
25
40

issued may drop or even be eliminated in the medium term, it will by no means be insignificant in
the next few years.
The above projections illustrate the difficulty of estimating the supply of California's
teaching force and can be refined only with better data tracking. The incompleteness of data on
supply factors, in particular, necessitates a range of assumptions that cloud the answer as to
whether there will be enough qualified individuals willing to take the jobs offered to replace the
existing large numbers of emergency permit holders and to meet new demand.
Given the high stakes involved for studentsnot being able to graduate from high school if
they cannot meet state standardswe believe that the state should not rely on the outside hope
that the most optimistic scenario will prevail. Importantly, it seems likely that large numbers of
emergency permits will be necessary for a number of years; even under the most optimistic
scenario, today's first-graders will be in junior high before the gap is closed. Moreover, because
the shortages of teachers willing to take jobs are not evenly distributed across geographic or
content areasas discussed in the following chaptereven optimistic scenarios about the
aggregate number of teachers in the state will not necessarily translate into qualified teachers in
every classroom.

Endnotes
2
California Department of Education (CDE), Educational Demographics Unit, Research, Evaluation andTechnology Division. (1997, August). Number, percent, and average salary of new teachers in Californiapublic schools: 1981-82 through 1996-97 (one year of total educational service). Sacramento, CA: Author.
CDE, Educational Demographics Unit. (1999). Statewide classroom teacher credential and experience reportfor the year 1998-99. Sacramento, CA: Author.
3 CDE, Educational Demographics Unit. (1997, January). Count of certificated and classified staff in Californiapublic school districts, in the California Basic Educational Data System (CBEDS), in Fetler, M. (1997,January). Where have all the teachers gone? Education Policy Analysis Archives, 5(2).
4 CDE. (1997, August). SRI analysis follows the methodology in Fetler (1997, January).5
6
National Center for Education Statistics. (1997). Projections of education statistics to 2007. Washington,DC: Author.
State of California, Department of Finance. (1998, December). Historical state population estimates withcomponents of change and crude rates, July 1, 1941-1998. Sacramento, CA: Author.
7 State of California, Department of Finance. (1998). California public K -12 enrollment projections by ethnicity,1998 series. Sacramento, CA: Author.
8 CDE, Educational Demographics Unit. (1999). Statewide enrollment in California public schools by ethnicgroup, 1998-99. Sacramento, CA: Author.
State of California, Department of Finance. (1998, December).
SRI analysis.
9 Cohen, D. K., & Das, H. (1996, Jul y). The need for teachers in California (Working paper series, PolicyAnalysis for California Education). Berkeley, CA: University of California at Berkeley.
Fetler (1997, January).io Although we do not have hard data on when in their career trajectories teachers actually leave the profession,
others have estimated that as many as 50% of all new teachers leave the profession within the first 5 years. SeeCSU Institute for Education Reform. (1996, September). A state of emergency ... in a state of emergencyteachers. Sacramento, CA: Author. The SB 1422 Advisory Panel reported that 30% to 50% of teachers leavewithin the first 3 years. See also Fetler (1997, January).
Cohen & Das (1996) and Fetler (1997, January).12 California State Teachers' Retirement System (STRS). (1998). Population information for fiscal year 1997-
1998. Sacramento, CA: Author.
SRI analysis. STRS data includes community college teachers as well as K-12 teachers.
13 STRS (1998).
11
14 The retirement rate as a percentage of the K-12 teaching force should start to decrease beginning in 2007, thepoint at which the largest cohort of baby boomers, aged 52 in 1999, will pass the average retirement age of 60.The retirement rate will flatten out, signifying the end of the "bulge" when those aged 41 in 1999 reach theaverage retirement age of 60 in 2018.
15 Bohrnstedt, G. W., & Stecher, B. M. (Eds.). (1999). Class size reduction in California: Early evaluationfindings 1996-98 (CSR Consortium, year I evaluation report). Palo Alto, CA: American Institutes forResearch.

CHAPTER 3. DISTRIBUTION OF UNDERQUALIFIED TEACHERS
DISTRIBUTION
How are underqualified teachers distributed in California schools and districts?24% of schools have no underqualified teacher, and another 15% have fewer than 5%. In contrast,20% of California schools have more than 20% underqualified teachersthese schools, and thestudents in them, face serious problems.
Students in low-performing schools with high percentages of poor, minority, and English languagelearner studentsthose students who need the most assistanceare most likely to haveunderqualified teachers.
The problem of underqualified teachers is not isolated to a few large districts. Almost one in eightCalifornia districts have over 20% underqualified teachers across all of their schools.
The distribution of underqualified teachers within a district varies, depending on size and diversity,but in larger districts there is typically a subset of schools with extremely high concentrations ofunderqualified teachers.
COMPOSITION
Who comprise the population of underqualified teachers throughout the state?Some underqualified teachers are hired purposefully and strategically, because they are promisingcandidates or have special characteristics that match district priorities.
Other underqualified teachers are hired as a result of shortages of credentialed teachers in certainsubject areas, such as special education, bilingual education, math, and science.
A third group of underqualified teachers are those who are hired because districts are desperate tofill classrooms and unable to find fully qualified teachers.
What is the impact of high concentrations of underqualified teachers on schools?Large concentrations of underqualified teachers negatively affect school and district functioning andundermine working conditions, teacher professional culture, and student learning.
DISTRICT ACTION
What are the possibilities and limitations of district actions to reduce the number ofunderqualified teachers?
Districts act to reduce the number of underqualified teachers by offering financial incentives,creating strategic partnerships with universities, developing district-based preparation programs,recruiting aggressively, and streamlining hiring practices.
The effectiveness of these district strategies is limited by factors beyond a district's control, such asits location and its inherent attractiveness to teachers.
In addition, although some districts may be successful at attracting qualified teachers, they often doso by siphoning such teachers away from other, less attractive surrounding districts.
District action alone cannot overcome the core problem of a too-small pool of qualified candidateswho are willing to work in the schools that need them most.
29

We have shown that many California classrooms are staffed by teachers who have not met
the minimum state requirements for a teaching credential. In this chapter, we ask the basic
question: which students are taught by these teachers? If these underqualified teachers were
evenly distributed across the state, each California student would have an approximately 1 in 10
chance of being in a classroom with an underqualified teacher. Yet, as we will demonstrate in
great detail, these teachers are concentrated in schools where students are in greatest need of
high-quality instruction. Urban districts serving large numbers of poor and minority students are
most likely to have high concentrations of underqualified teachers. In some schools, the problem
is so severe that the majority of students attend class after class, year after year, without being
taught by a qualified teacher.
We begin the analysis by examining hdw the current teacher shortage is distributed in
schools throughout the state. We then examine which students are in classrooms and schools
staffed by underqualified teachers. Next, we examine shortages at the district level and look at
the distribution of underqualified teachers within some of the more heavily affected districts.
Next, we step back and describe who the population of underqualified teachers are and their
impact on schools, and examine the different reasons why they are hired. Finally, we examine
district policies to reduce teacher shortages and the limitations of these policies.
Statewide Distribution of Underqualified Teachers
We define underqualified teachers as those who hold an emergency permit, waiver, or
intern certificate. These teachers do not hold a full credential for their particular teaching
assignment and have not completed a teacher preparation program and/or other requirements for
their teaching assignment.*
Figure 3-1 shows the statewide distribution of underqualified teachers. There are many
schools with no or relatively few underqualified teachers. Nearly 40% of the schools in the state
have fewer than 5% underqualified teachers; 24% have no underqualified teachers at all. These
are the schools in which, from our case study work, the number of underqualified teachers is not
overwhelming the overall work of the school. At the other extreme, nearly one-fifth of
California schools have 20% or more underqualified teachers.t This subset of the most critically
affected schools enrolls about 21% of all California studentsover 1 million children in total.
*A small percentage of emergency permit holders have a regular credential but have added emergency certificationto teach an additional subject area. From 1991-92 to 1996-97, this averaged from 4% to 9% of all single- andmultiple-subject emergency permit holders.The analysis in Figure 3-1 (and subsequent analyses on the distribution of underqualified teachers) uses data fromschool year 1997-98 and does not include adult, vocational, or other alternative schools.

50%
45%
40%
35%
02 30%N
.0 25%
U
20%50.
15%
10%
5%
0%
Figure 3-1Statewide Distribution of Underqualified Teachers
39%
19%
14%
0-<5 5-<10 10-<15 15-<20 20-<25 25-<30 30-<35 35-<40 40-<45 45-<50 50-<55 55-<60 60-<65 65-<70 70-<75 75-<80 80-<85
Percent faculty teaching without appropriate credentials
Note: There are one or two schools in each of the percentage categories above 65%. However,the schools in each of these categories constitute less than 0.5% and are represented as 0.0% inFigure 3-1.Sources: CDE (1999); SRI analysis.'
As we will discuss later in this chapter, not all underqualified teachers are equally
unprepared. There are some with relevant previous experience whom the school administration
expects to be effective teachers despite their not having completed the requirements for their
credential. Others are candidates who show exceptional promise or who meet particular district
needsmany of these are teacher candidates who are close to finishing a preparation program.
Others, however, are hired because administrators are desperate to fill classrooms and are unable
to find qualified teachers.
As the percentage of underqualified teachers in a school increases, serious problems begin
to arise. In schools with few underqualified teachers, these teachers tend to be hired for some
desirable characteristics, and they are supported by a large portion of veteran teachers. In these
schools, a limited number of children are affected by being in classrooms staffed by
BEST COPY AVAILABLE31 4 5,

underqualified teachers. Although it is never appropriate for an underqualified teacher to lead a
classroom, these teachers tend to complete their prep program and become fully qualified in a
short period of time. In schools with high percentages of underqualified teachers, these teachers
are more likely to have been selected just to fill classrooms, and there are fewer veteran teachers
to provide support. More students are affected and for a longer period of time, since turnover is
higher.
At some point, as the percentage of underqualified teachers grows, the school's overall
functioning is impaired. The exact point at which this occurs depends on the strength of
professional development and induction systems in the district and at the school, and the overall
workplace support for adult learning opportunities within the school. However, we observed in
case studies that schools with more than 20% underqualified teachers were hard pressed to
provide adequate professional support to their entire faculty. These are the hard-to-staff schools
in the state, those where a child's opportunities to receive the kind of instruction needed to meet
the state standards are severely compromised. As noted above, one in five schools in the state
fall into this category.
Maldistribution of Underqualified Teachers by Student Characteristics
Who are the children most likely to be taught by an underqualified teacher? In short, they
are the students who can least afford itthose whose achievement puts them at risk of school
failure without effective intervention. Analysis of third-grade reading scores on the SAT-9
shows that schools where students are achieving at the lowest levels in the stateessentially
those schools where students are still struggling to learn to read well in third gradehave, on
average, five times as many underqualified teachers as high-achieving schools (Figure 3-2).
Statewide, those schools with the highest achievement in third-grade reading have, on average,
only 4% underqualified teachers. About 900 schools fall into this category. In contrast, those
schools with the most poor students and the lowest achievement in third-grade reading have, on
average, 22% underqualified teachers. Nearly a thousand schools in the state fall into this
category. These are the schools, as we noted above, that are the most dysfunctional and the least
likely to support student learning.
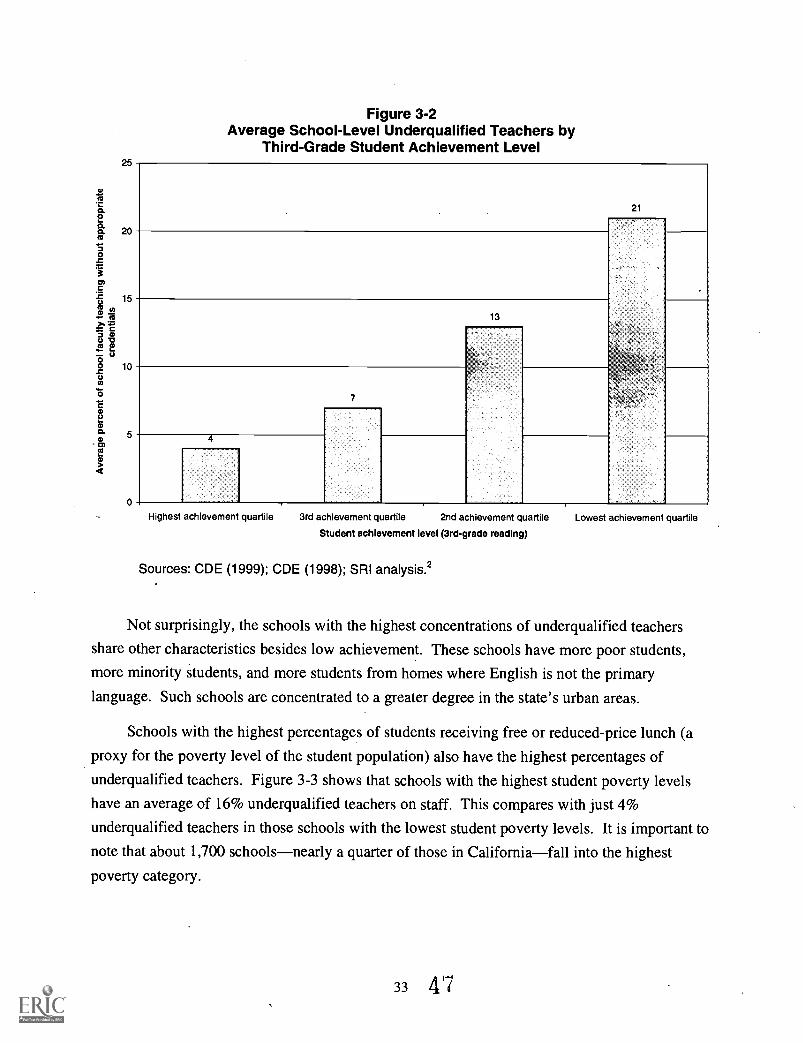
25
w
a.0a.a. 20
00.c
c15
co
2 Tot"a)
2
O °.c0 10
"6
ON
5
0
Figure 3-2Average School-Level Underqualified Teachers by
Third-Grade Student Achievement Level
21
13
7
4
Highest achievement quartile 3rd achievement quartile 2nd achievement quartile
Student achievement level (3rd-grade reading)
Sources: CDE (1999); CDE (1998); SRI analysis.2
Lowest achievement quartile
Not surprisingly, the schools with the highest concentrations of underqualified teachers
share other characteristics besides low achievement. These schools have more poor students,
more minority students, and more students from homes where English is not the primary
language. Such schools are concentrated to a greater degree in the state's urban areas.
Schools with the highest percentages of students receiving free or reduced-price lunch (a
proxy for the poverty level of the student population) also have the highest percentages of
underqualified teachers. Figure 3-3 shows that schools with the highest student poverty levels
have an average of 16% underqualified teachers on staff. This compares with just 4%
underqualified teachers in those schools with the lowest student poverty levels. It is important to
note that about 1,700 schoolsnearly a quarter of those in Californiafall into the highest
poverty category.
33 4'7

18%
.60 16%CV
14%111
2a 12%to
0.c11 10%
co 8%
36%
OC
4%
cn
2%
0%
Figure 3-3Distribution of Underqualified Teachers by Student Poverty Level
0-25% >25%-50% >50%-75%
Percent students in school receiving free or reduced-price lunch
Sources: CBEDS (1999); SRI analysis.3
>75%-100%
Similarly, Figure 3-4 shows that schools with more than 90% minority students have, on
average, 19% underqualified teachers on staff. This group consists of more than 1,300 schools,
or about 19% of all California schools. Schools with the fewest minority students have, on
average, only 3% underqualified teachers. Similar patterns exist for limited English proficient
(LEP) students, who typically are from minority groups and poor families.
34
48

20%
18%
C1:2' 16%
ra. 14%0
a"5 12%0
.c
2' 10%
Uco
8%
:0 6%CU
wa 4%0)co
< 2%
0%
Figure 3-4Distribution of Underqualified Teachers by Percent Minority Students
0-30% >30%-60% >60%-90%
Percent minority students In school
Sources: CDE (1999); SRI analysis!'
>90%-100%
The distribution of underqualified teachers also varies by a number of school-level
characteristics, including the urbanicity of the school site and the demographics of the student
population. Overall, urban areas face more severe shortages than suburban and rural areas.
Compared with the statewide average of 12%, urban schools had, on average, 17%
underqualified teachers in 1997-98. Rural and suburban schools each had approximately 8%
underqualified teachers. As Figure 3-5 shows, the distribution of underqualified teachers in rural
and suburban districts is similar to the statewide distribution, with about half of schools having
fewer than 5% underqualified teachers. In contrast, only about 18% of urban schools have fewer
than 5% underqualified teachers. Even worse, 37% of urban schools have more than 20%
underqualified teachers in their classrooms.

60%
50%
40%
CO
s 30%
U
20%
10%
0%
Figure 3-5Comparison of Distribution of Underqualified Teachers by Urbanicity
0-<5 5-<10 10-<15 15-<20 20-<25 25-<30 30-<35 35-<40
Percent teaching without appropriate credentials
40-<45 45-<50
0Urban school districts ...3 Suburban school districts r. a. Rural school districts
Sources: CBEDS (1999); SRI analysis.5
50-<55 55-<60
These numbers make a compelling case: those students who currently are struggling in
school and who are most likely to come from homes where, for economic and linguistic factors,
parents are unable to compensate for poor schooling opportunities, are the least likely to be
getting a high-quality instructional experience. In short, those students who are currently least
likely to meet the new state standards are receiving the least help and therefore will be the most
likely to fail to meet the new state graduation requirements in the future.
Distribution of Underqualified Teachers within Districts
Although concentrations of underqualified teachers are found most often in schools with
large percentages of poor and minority students, they are not limited to a few large districts.
Many districts are struggling with high concentrations of underqualified teachers. As Figure 3-6
shows, nearly half the state's school districts (48%) have fewer than 5% underqualified teachers
(and 23% have no underqualified teachers at all). However, 12%, or one in every eight
California school districts, have more than 20% underqualified teachers.
BEST COPY AVAILABLE
365 0

60%
50%
40%
30%
20%
10%
Figure 3-6Distribution of Underqualified Teachers in California School Districts
0% 494. .-eit 1 9134.. +-cm, 4%0-<5 5-<10 13-<15 15-<20 20-<25 25-<30 30-<35 35-<40 40-<45 45-<50 50-<55 55-<60 60-<65 65-<70 70-<75 75-<80 80-<85
Average percent of faculty in district schools,teaching without appropriate credentials
Sources: CDE (1999); SRI analysis.6
Within districts with high concentrations of underqualified teachers, how teachers are
distributed depends on the degree of diversity among district schools. In a geographically small
district where all schools have similar economic and racial makeup, the concentration of
emergency teachers is likely to be similar across all schools. For example, Ravenswood City
Elementary School District in East Palo Alto has 11 schools located in a relatively compact
geographic area. Schools in this district have an average of 38% underqualified teachers, and the
distribution is relatively narrow. As Figure 3-7 shows, all Ravenswood schools have more than
20% underqualified teachers. Some Ravenswood schools are in worse shape than otherstwo
have more than 50% underqualified teachersbut none have escaped the problem.
BEST COPY AVAILABLE37 51

45%
40%
35%
30%
25%
20%
15%
10%
5%
0%
0-<5 5-<10 10-<15 15-<20 20-<25 25-<30 30-<35 35-<40 40-<45 45-<50 50-<55 55-<60 60-<65 65-<70 70-<75 75-<80 80-<85
Percent of faculty teaching without appropriate credentials
Figure 3-7Comparison of Distributions of Underqualified Teachers Statewide and in
Ravenswood City Elementary School District
MEN Ravenswood City Elementary School District 0Statewide
Sources: CBEDS (1999); SRI analysis.'
In large districts with greater economic and racial diversity among schools, the distribution
is broader. In Los Angeles Unified School District (LAUSD), for example, the district average is
25% underqualified teachers, but, as shown in Figure 3-8, this average is composed of schools on
both ends of the spectrumsome schools have very few underqualified teachers, while others
have more than 50%. Fully two-thirds of LAUSD schools have more than 20% underqualified
teachers, creating serious problems at both the school and district levels. As at the state level, an
overall percentage in a large district can mask extreme cases and an overall inequitable
distribution.
BEST COPY AVAILABLE
38 5 2

45%
40%
35%
30%
25%
20%
15%
10%
5%
0%
Figure 3-8Comparison of Distributions of Underqualified Teachers Statewide and in
Los Angeles Unified School District
0-<5 5-<10 10-<15 15-<20 20-<25 25-<30 30-<35 35-<40 40-<45 45-<50 50-<55 55-<60 60-<65 65-<70 70-<75 75-<80 80-<85
Percent of faculty teaching without appropriate credentials
L Los Angeles Unified School District 0Statewide
Sources: CDE (1999); SRI analysis.8
Who Are Underqualified Teachers?
Underqualified teachers, by definition, do not hold the appropriate credential for their
teaching assignment. Beyond that common characteristic, however, these teachers vary
considerably in their preparation to teach. In this section, we describe what kinds of individuals
are hired to teach without appropriate credentials and why.
Promising Candidates
Many districts, whether they are facing shortages or not, will hire underqualified teachers
strategically to secure the employment of particularly promising candidates. The Selma Unified
School District is an example of a district that uses the emergency credentialing process to hire
promising candidates. Although they have 400 to 500 applications each year for around 35
BEST COPY AVAILABLE39 5 3

teaching positions, Selma officials report that they sometimes recruit strong candidates that have
not yet completed their credential program. This is a strategic choice rather than a last-resort
option. The underqualified teachers they hire are typically candidates they know well, who have
demonstrated strong teaching skills in their student teaching assignments, and who come highly
recommended by preparation program faculty. Often, these candidates have completed their
coursework but have not yet finished their student teaching.
Far from being unhappy with such hires, Selma often makes special efforts to hire them.
One teacher candidate credits the district superintendent with working "fervently" with the
university to construct a special program for him to teach and get his credential at the same time.
The district made special efforts to prepare and support him and even arranged for him to
observe a well-known master teacher for 6 weeks in another district's year-round school before
he entered the classroom. The district was impressed with the candidate and also delighted to
find a male Latino interested in teaching elementary school. Rather than hold off and risk losing
him to another district, Selma used the emergency process to hire him immediately.
Elk Grove Unified School District is another district where promising candidates are hired
before they earn their credentials. In Elk Grove, these candidates are often part of the district's
Teacher Education Institute (TEI), a teacher. preparation program run by the district in
conjunction with San Francisco State University. TEI participants are well known to district
officials and school principals. When openings occur during the school year, the most promising
candidates are offered full-time teaching positions while they finish their coursework. Here
again, the district is in control of the situation and is able to distribute these teachers evenly
across the district so that no schools are overwhelmed with large numbers of underqualified
teachers. Despite the fact that Elk Grove is the second-fastest-growing school district in the
country, almost 90% of its schools have fewer than 10% of their teachers in the underqualified
category.
A variation on the promising candidate is the case of the well-qualified teacher who does
not happen to have a credential. In these rarest cases, the emergency teacher has developed
outstanding teaching skills and strong content knowledge without the assistance of a traditional
preparation program. For example, one district we visited had hired a native French speaker
with an advanced literature degree from France to teach high school French. She had no
appropriate credential, but was viewed by the districts as well qualified to teach high school
French literature.
40 5 4
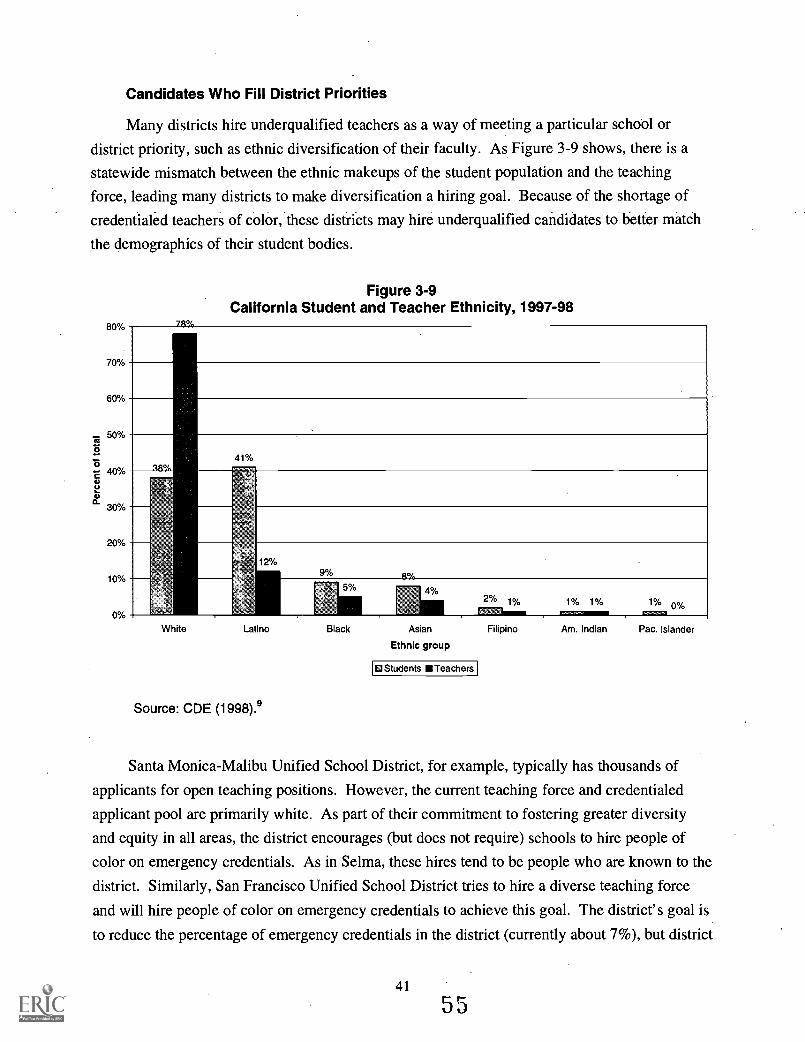
Candidates Who Fill District Priorities
Many districts hire underqualified teachers as a way of meeting a particular school or
district priority, such as ethnic diversification of their faculty. As Figure 3-9 shows, there is a
statewide mismatch between the ethnic makeups of the student population and the teaching
force, leading many districts to make diversification a hiring goal. Because of the shortage of
credentialed teachers of color, these districts may hire underqualified candidates to better match
the demographics of their student bodies.
80%
70%
60%
50%
2
E 40%
30%
20%
10%
0%
78w
Figure 3-9California Student and Teacher Ethnicity, 1997-98
:18./41%
12%
5% 4%2% 1%
rfiMise.1% 1% 1% 0%
EMSMIMI 1:2=521
White Latino
Source: CDE (1998).9
Black Asian
Ethnic group
0Students Teachers
Filipino Am. Indian Pac. Islander
Santa Monica-Malibu Unified School District, for example, typically has thousands of
applicants for open teaching positions. However, the current teaching force and credentialed
applicant pool are primarily white. As part of their commitment to fostering greater diversity
and equity in all areas, the district encourages (but does not require) schools to hire people of
color on emergency credentials. As in Selma, these hires tend to be people who are known to the
district. Similarly, San Francisco Unified School District tries to hire a diverse teaching force
and will hire people of color on emergency credentials to achieve this goal. The district's goal is
to reduce the percentage of emergency credentials in the district (currently about 7%), but district

staff acknowledge that they may never eliminate them completely because doing so would run
contrary to their goal of diversification.
From the district perspective, the flexibility to hire a small number of promising candidates
before they are lured away to another district is a useful tool in a tight labor market. The
drawbacks are that such hires often require additional support that the school may not have the
capacity to provide. Taking a teaching job brings immediate income, but also an overwhelming
challenge. From the student's perspective, hiring an underqualified teacher means the difference
between having a trained teacher and having an untrained teacher for a full year. Although the
district may benefit from this type of strategic hiring in the long run, students suffer in the short
run.
Teachers Who Fill Shortage Areas
Many underqualified teachers are hired as a result of shortages of credentialed teachers in
certain subject areas. As has been the case for decades, teachers in certain areassuch as
bilingual education, special education, science, and mathematicscontinue to be in especially
short supply.
According to district-predicted hirings for 1998-99, the largest area of reported need is in
self-contained classrooms,10 driven primarily by the demands of the K-3 class size reduction
program. Table 3-1 lists the number of teachers that districts expected to hire in each subject and
special area for 1998-99.

Table 3-1Estimated Number of Teacher Hires:Areas with Highest Need (1998-99)
TeachingArea
Number ofPredicted Hires
Percent of AllExpected Hires
Self-contained 7,843 38
Bilingual education 3,175 15
Special education 2,858 14
Mathematics 1,133 6
English/drama 1,149 6
Life science 810 4
Social science 722 4
Physical science 618 3
Foreign language 522 3
Source: CDE (April 1998)."
Special Education Teachers. In 1997-98, nearly 8,000 emergency permits and waivers
were issued to education specialists and resource specialistsleaving over one-third of special
education staff in these categories without proper credentials.I2
In 1997, the CTC adopted regulations that changed the requirements for special education
credentials, in part as a response to the shortage of special education teachers. The new
requirements, which teacher preparation programs are currently phasing in, provide more
flexibility for special education teachers coming from out of state. They also eliminate the
requirement that special education teachers first earn a multiple- or single-subject credential
before earning a special education credential. Instead, general education and special education
coursework is now integrated into a single credential program. The changes also allow for more
flexibility in assigning teachers to teach students with different types of disabilities in a range of
instructional settings (e.g., special day classes, special schools, resource rooms). However, given
the large number of special education teachers without proper credentials, it remains to be seen
whether these steps will be adequate to address the need.
Bilingual Teachers. Despite the passage of Proposition 227, many districts maintain
classrooms in which teachers need a Bilingual Crosscultural, Language, and Academic
Development credential. As Table 3-1 shows, 15% of districts' anticipated new hires for
1998-99 were for teachers with bilingual credentials.
43
5'

The San Diego Unified School District case is illustrative of the bilingual education and
special education teacher shortage. The district is able to hire a fully credentialed teacher for
every regular K-6 classroom and enjoys a lower overall percentage of underqualified teachers
than the state average. However, the district struggles to find credentialed bilingual and special
education teachers and is forced to hire underqualified candidates for these positions. San Diego
has roughly 400 teachers with emergency permits, about 90% of whom are in bilingual and
special education classrooms. In addition, about 60 out of the 88 teachers in the district's
internship programs are in the bilingual internship program.
Teachers of Math, Science, and Other Subject Areas with Shortages. Traditionally,
mathematics and science have been recognized as subject areas lacking sufficient numbers of
teachers. Math and science are the subjects with the largest numbers of single-subject
emergency permit holders. According to the California Department of Education, in 1997-98,
approximately 22% of all single-subject emergency permits and waivers were issued in the area
of science, and 21% were in mathematics.13 Disaggregated data indicate that almost all counties
in the state request science and math emergency permits.14 Table 3-1 shows that 13% of the
anticipated new hires for 1998-99 were math and science teachers.
Many districts also experience difficulty recruiting secondary-level teachers of English,
social studies, and physical educationsubjects that are not typically recognized as shortage
areas. In 1997-98, approximately 15% of all single-subject emergency permits and waivers
issued were in the area of English, 10% were in social science, and 10% were in physical
education. is
Another result of subject area shortages at the secondary level are teachers who teach "out
of field," that is, do not hold degrees in the subject area they teach. Some of these teachers,
however, have demonstrated subject matter competency in the process of obtaining single-
subject credentials, either by completing coursework or by passing appropriate tests. These
people hold valid credentials for their teaching assignment despite not having a degree in their
subject area.
Other teachers are certified to teach in one subject area but teach additional or different
subjects out of their field because of shortages at their school. These teachers do not have
degrees in the subject they are teaching nor have they demonstrated subject matter competency.
Technically, teachers should hold an emergency credential for any class in any subject in which
they have not proven subject matter competency. It is believed, however, that schools widely
underreport the practice of credentialed teachers' teaching out of field, making it very difficult to
approximate the scope of the problem.16

SRI survey results show that 40% of all single-subject teachers do not have- a major or
minor in the subject area of their main teaching assignment. This number includes credentialed
teachers who have demonstrated subject matter competency and those who have not, as well as
teachers holding emergency permits.
Filling Classrooms
For many districts, the only type of underqualified teachers hired hold many promising
characteristics. However, for some districtsor at least for some schools in those districtsthe
need to simply fill classrooms is the main reason for hiring large numbers of underqualified
teachers. At the beginning of this chapter, we described 20% of California's schools as having
20% or more underqualified teachers. In these schools, large numbers of underqualified teachers
typically have been hired because administrators can find few qualified teachers to fill any open
positions. It is in these schools that students encounter the most serious hurdles to student
learning.
LAUSD illustrates how the problem of hiring underqualified teachers to fill classrooms can
escalate uncontrollably. The district has faced teacher shortages for many years, but in recent
years the number of underqualified teachers has grown dramatically. As shown in Table 3-2,
one-quarter of all LAUSD faculty are currently working on an emergency permit, waiver, or
intern credential. More alarming, however, are figures for new hires. Table 3-3 shows that 75%
of new teachers hired for the 1998-99 school year did not have regular teaching credentials.
Table 3-2Qualifications of LAUSD Teachers, 1994-1998
Preliminary orProfessional Clear
Credential
Emergency Permit,Waiver, or Internship
Credential
1994-95 88% 12%
1995-96 88% 12%
1996-97 83% 17%
1997-98 79% 21%
1998-99 75% 25%
Source:Los Angeles Unified School District (1999).
45 5 9

Table 3-3Qualifications of First-Year LAUSD Teachers, 1994-1998
(Includes New Hires Only)
Preliminary orProfessional Clear
Credential
Emergency Permit,Waiver, or Internship
Credential
1994-95 40% 60%
1995-96 47% 53%
1996-97 31% 69%
1997-98 26% 74%
1998-99 25% 75%
Source: Los Angeles Unified School District (1999).
Issues in Understanding the Different Types of Underqualified Teachers
Not all underqualified teachers are the same. Some teachers may be effective without
having gone through a full teacher preparation program, but we have no data to suggest that
these are not simply rare exceptions. Many teachers are filling shortage areaslike special
educationwhere the skills needed for the job and the working conditions are such that current
compensation formulas cannot attract sufficient numbers of qualified candidates. In these cases,
students are likely to suffer. Other teachers are seen as quite promising or as filling specific
district criteria. In these cases, schools and districts often express gratitude at being able to have
hired them. But again, the end result is some period of time when students are being taught by a
less than fully trained teacher. It is especially problematic that districts are seeking to hire young
ethnic minority candidates before they have completed their degreesputting these individuals
in the difficult situation of teaching full-time while continuing their education.
In almost all cases, then, individual students and classrooms are likely to be negatively
affected by having underqualified teachers. We showed earlier in this chapter that schools with
more fully credentialed teachers have higher test scores. Another study has shown that even
after controlling for the poverty level of the students, the qualifications of math teachers in a
school significantly predict schoolwide test scores in math.17 Our case studies showed that the
detrimental impact on school culture and student learning is more dramatic in schools where
there are large numbers of underqualified teachers. We turn to this issue next.
46 60

The Impact of High Concentrations of Underqualified Teachers
Case studies show that having a high percentage of underqualified teachers in a given
school can create problems throughout the entire school community. The lack of qualified
teachers becomes the primary personnel issue, year after year. Desperate to fill classrooms,
these schools must hire from pools of untrained applicants. Often, these are the very schools
suffering from overcrowding and the difficult working conditions that follow.* The lack of
mentors, overcrowded buildings, year-round schedules, and assignments to the most challenging
classes all conspire against even the most well-meaning emergency-credentialed teacher. Many
new teachers in these schools leave after a short time, opening up slots that inevitably must be
filled with more underqualified teachers. The stability and reputation of the schools suffer,
making it even more difficult to attract qualified teachers and making schools unable to pull
themselves out of their hiring crisis.
In addition to exacerbating poor teacher retention rates, high concentrations of
underqualified teachers can erode professional development for the entire faculty. Resources for
professional development are necessarily redirected to the underprepared teachers, and
credentialed teachers have fewer professional development resources available to them. In
addition, high concentrations of emergency permit teachers quickly exhaust the pool of potential
mentor teachers. As more positions are filled by untrained teachers, the overall level of
professional expertise in the school drops too low to move the school in a positive direction.
Survey findings, discussed more extensively in a later section, show that teachers in schools with
many underqualified teachers (21% or more) collaborate less than their counterparts in schools
with few underqualified teachers.
In addition to depleting a school's capacity to provide professional development, high
concentrations of underqualified teachers can damage the working environment simply by
eroding teachers' sense of professionalism. As one credentialed teacher said, "It's an
embarrassment that anyone can walk in and get a teaching job. The lack of professionalism
blows my mind. The discrepancy between trained and untrained teachers is huge." In addition,
teachers point out, having students that were previously taught by untrained teachers makes the
instructional aspect of their job more difficult. As another veteran teacher said, "We all pay for
it if an emergency teacher flounders all year."
Of course, the most distressing aspect of high percentages of underqualified teachers is the
negative impact on students. Veteran teachers in such schools are frank about what they see in
Working conditions in overcrowded schools and their impacts on professional learning communities are discussedmore extensively in Chapter 6.
47 61

the classrooms of their underqualified colleagues. One teacher at an LAUSD middle school with
more than 25% underqualified teachers said, "On a scale of 1 to 10, new [underqualified]
teachers are doing a 1.5. They come with no experience. They're bombing." Another teacher
from the same school reported that an outsider would be shocked by a visit to the classrooms of
many of the underqualified teachers. "They just aren't doing anything in those classrooms."
In some schools, the shortages are so severe that classes are staffed by a revolving door of
long-term substitutes. For example, one middle school math teacher in a year-round school
reported serving as a substitute during off-track time because the school was unable to fill a
position. By the time this teacher offered to fill in for the month, the class had been staffed by 17
different teachers.
INSIDE PERSPECTIVE
Fifteen percent of the teachers at Jones High School lack appropriate credentials. Theschool has a hard time attracting and keeping new teachers. For example, last year theschool hired 5 new science teachers for a department of about 25, and not even half of thedepartment has been there for over 5 years. In the math department, two or three positionsremain unfilled. As one veteran teacher on the hiring committee reported, "Almost allapplicants do not have teaching experience, and those who do have experience raisesuspicion, like 'Why is this person transferring after 10 years experience?' Basically, weinterview people and try to decide which one is most likely to survive...the district has totake what it can get to fill teaching positions."
Teachers also report that the professional culture and working conditions are lacking."Teachers at this high school rarely talk about teaching, and neither does the administration....I can't recall the last time the science department sat down and discussed practices orwhat we're teaching."
The impact on student achievement is devastating. As one teacher reported, "There issome learning going on, but a combination of things contribute to low student achievement.There are many inexperienced teachers who don't know how to present material in a waythat will cause learning to happen. Many have had to develop strategies just to survive inthe classroom, some of which are probably harmful to learning. ... There's also a lack ofmotivation on kids' part. ... It is really hard to get some kids to do homework. I see a fewreasons for this. One, when you have a bad teacher, you're not motivated to do anything.Also a lack of basic skills in reading and math really hurts kids in other subjects. ... I usedto feel like things were improving, but I'm more cynical now. Unless something drastichappens, nothing will change. Every year, I say it can't get worse, but then it does."
48 62

Reasons Why Schools and Districts Have High Numbers of UnderqualifiedTeachers
Concentrations of underqualified teachers can result from many factors that vary from
district to district. One of the primary reasons is that many hard-to-staff schools have terrible
working conditions where no well-qualified professional would want to work. As discussed
more extensively in Part II, overcrowding, lack of adequate facilities and space, and weak or
nonexistent professional support create extremely difficult and undesirable workplaces. Because
they are in high demand, qualified teachers go elsewhere. Schools find themselves with many
open positions to fill and few qualified applicants to choose from.
In addition to the problem of working conditions, the difficulty of these jobs is rarely
reflected in the salaries offered to teachers who fill them. As shown in Table 3-4, when asked
why they chose the district they work in, nearly half of teachers name pay scale and benefits as
the most, second most, or third most important reason. Teachers in high-poverty, high-minority
districts name it as an important reason even more often. Districtsespecially those with poor
working conditionsmust compete not only with neighboring districts but with other
professions for the teachers they want.
Table 3-4Reasons Teachers Choose the District They Teach In
Percent of Teachers Ranking Reason asMost, 2nd Most, or 3rd Most Important
How close to home 59
Pay scale/benefits 48
Assignment available 40
Previous experience with district 33
Positive reputation of district 33
Support for new teachers 30
Challenge of particular assignment 16
Safety of school/community 11
Source: SRI statewide teacher survey.
Related to working conditions is the location of a schoolmany schools with large
proportions of underqualified teachers are located in areas considered undesirable to teachers.
California does not have one large labor market for teachers; instead, there are multiple regional
labor markets. When teachers are asked why they chose the district they currently work in, a
4963

majority report that proximity to home is an important reason, as shown in Table 3-4. This result
is consistent with previous findings that show that teachers choose schools close to their current
homes and that a majority limit their job search to a 25-mile radius.18 These findings imply that
teachers are generally not willing to relocate or commute great distances to take a teaching job.
Typically, a qualified teacher living in Humboldt County is not going to pack up and move to
Compton, even if he or she were hired early and paid slightly more than in a position in her local
district.
A second aspect of location is the particular neighborhood a school is located in. Although
we know that teachers generally limit their job search in terms of area, these findings do not
imply that teachers will take any job that is near their home. Within a local market, schools may
be competing with nearby schools that are in more affluent areas and perceived as safer or
"nicer."
A third reason why schools or districts may have a high number of underqualified teachers
is that they do an inadequate job of recruiting and hiring teachers. As Figure 3-10 shows, many
teachers are hired and given their teaching assignments very late. One-quarter of California
teachers hired in the past 5 years were offered their job less than 1 month before the start of the
school year. Nearly another quarter were offered their teaching job after the school year had
already started. Figure 3-10 also shows that teachers are, on average, not informed of their exact
teaching assignment for some time after they are hired. Because teaching assignment is a key
factor in teachers' employment decisions, this fact further handicaps "late" districts.
50 64

40
35
30
25
20
15
10
Figure 3-10When Teachers Are Hired and Informed of Exact Teaching Assignment
(Of Teachers Hired in the Past 5 Years)
ti> 6 mos. prior to start of 4-6 mos. prior to start of 1-3 mos. prior to start of
school year school year school year< 1 mo. prior to start of Aker school year started
school year
0 When offered job When informed of exact teaching assignment
Source: SRI statewide teacher survey.
Some district officials complain that they hire late because they are not sure of their
budgets until the state passes its budget. More frequently, districts are slow to hire because of
requirements that experienced teachers get first choice of open positions. In large districts,
clumsy central office bureaucracy and an ambiguous division of recruiting and hiring
responsibilities between schools and the central office can result in slow hiring.
In San Diego, as in many districts, the union contract requires that job openings be posted
and that teachers with seniority be given an opportunity to bid on them. If a senior teacher takes
a new position and vacates the old one, that job must be posted. The resulting chain reaction can
cause late openings.

In LAUSD, several factors combine to create a tangled, inefficient hiring process. The
district must abide by the Rodriguez court decree, which attempts to equalize funding across the
district. According to the decree, schools that have many experienced teachers must hire a less
expensive beginning teacher if a vacancy opens. Large schools with many beginning teachers
are supposed to have priority for those experienced teachers who are looking for jobs. (In
reality, there often are no experienced teachers who apply for such positions, and the district
must hire emergency teachers for these openings.) Another mandatory hiring consideration is
whether the applicant is minority or nonminority and how the person's employment will affect
the ethnic distribution of a particular school's staff. The district also must take into account
whether another teacher has priority for a vacancy, according to the union agreement. By all
teacher accounts, the amount of "red tape" generated by the hiring process makes the entire
process impersonal, unpleasant, and full of roadblocks. Although clearly not the sole source of
the teacher shortages in the district, the cumbersome hiring procedures do not help.
Interestingly, the timing of teacher hiring overall shows no relationship to the poverty level
of the school, the percentage of minority students in the school, or the number of emergency
teachers in the school. This finding indicates that districts with high percentages of emergency
teachers are not, on average, hiring later than other districts with low percentages of emergency
teachers. However, reports from teachers indicate that districts may be doing an inadequate job
of hiring relative to their particular hiring needs. In other words, districts that know they are
likely to have many open positions need to recruit aggressively and hire early to have a chance of
getting qualified teachers. More desirable districts can afford to hire later and still manage to fill
their positions with credentialed teachers.
Of course, for any given school or district, it is unlikely that there is one reason to explain a
high concentration of underqualified teachers. In reality, it is likely that more than one factor is
operating, clouding the question of who or what is responsible for the problem. One thing that is
clear is that to attract good, well-qualified teachers, schools must offer an attractive package of
nearly all of the following: good working conditions, good salaries, a smooth hiring process, and
a desirable location. Schools lacking a desirable location, in particular, need other ways to be
attractive. Below we discuss what districts can do to make themselves more attractive to
teachers and reduce the number of underqualified teachers. Next, we discuss those problems that
are bigger than the district unit and beyond the district's scope of control.
E6

What Districts Can Do to Reduce the Number of Underqualified Teachers
Districts can and do take action to improve their recruitment and hiring practices in an
effort to reduce the number of underqualified teachers. Whereas many districts suffer severe
shortages of teachers year after year, somewith similar demographicssucceed in attracting
credentialed teachers. Proactive districts' actions range from offering financial incentives to
building "pipelines" into the districts with preparation programs to more aggressive recruitment
combined with a streamlined hiring process. In this section, we describe effective district
recruitment and hiring strategies, as well as some of the challenges and constraints districts face
in implementing them.
Financial Incentives for Teachers
Districts can offer various financial incentives to compete with neighboring districts for
new teachers. El Centro and Selma are both semirural districts that offer comparatively high pay
scales and are able to attract and hold qualified teachers. Selma purposefully has designed its
pay scale to be high for the first few years and plateau somewhat in subsequent years. The
district believes that once teachers begin working in the district, they are likely to stay. Signing
bonuses are another variation on this strategy. Anticipating shortages, Elk Grove offered $2,500
signing bonuses to attract new teachers in 1999. In addition, many districts try to attract
experienced teachers by offering full salary credit for most or all years of previous experience
outside of the receiving district. LAUSD now accepts up to 12 years of outside-district
experience on the district's pay scale; Elk Grove accepts 10 years of experience.
As we discussed earlier, teachers report that salaries are one consideration in their selection
of a teaching position. Unfortunately, our research does not indicate what level of salary would
be sufficient to attract qualified teachers to hard-to-staff schools. However, it is clear from our
case studies that, at the very least, a combination of financial incentives and dramatically
improved working conditions is required to address the crisis.
Strategic Partnerships with Universities
Some districts foster close partnerships with universities to help create a pipeline of new
teachers into their schools. One example of a formal approach is Santa Monica-Malibu Unified
School District's partnership with UCLA's Center X. This partnership places Center X students
in Santa Monica schools and, in turn, helps the district work toward its goal of diversifying its
teaching staff. Informal efforts in Selma include fostering strong personal connections with local
IHE faculty to get names of promising candidates and approach them directly. In LAUSD and
53 6 7

other districts, principals actively seek student teachers to work in their schools, in order to have
a good chance to hire them.
District-Based Preparation Programs
The number of district-based preparation programs is growing, in part, because these
programs are tailored to district needs and serve as pipelines into the district's schools. Elk
Grove's Teacher Education Institute (TEI) graduates about 80 teachers each year and places
most of them in district schools. San Francisco also has a district-based preparation program and
is expanding the program during the 1999-2000 school year. In addition, district internship
programs are growing in response to the need to hire underqualified teachers. District officials
see these programs as effective ways to deal with shortages and build a cadre of teachers likely
to stay in their district. All 1,100 participants in LAUSD's District Intern program teach full-
time while they are enrolled in the program. These district interns can earn a teaching credential
after 2 years without having to pay tuition.
Aggressive Recruitment
One of the ways districts have successfully increased the flow of new teachers into their
schools is through aggressive recruitment efforts. Our survey findings bear out the importance
of formal and informal district recruitment efforts. Forty-one percent of teachers hired in the
past 5 years say that the school district assisted them in finding their current job. Thirty-seven
percent report that word of mouth served the same function. Districts like New Havenwhich
has a stellar reputation for attracting high-quality teachershave pioneered the use of
technology to conduct out-of-state interviews and receive resumes via e-mail, as well as
sophisticated marketing and recruitment strategies that mirror those in the business world. Elk
Grove has formed a district advisory committee for recruitment. Selma, a smaller district, has a
targeted strategy of directly approaching candidates whom district staff have heard about through
IHE faculty. In addition, Selma makes the most of routine job fairs by doing preliminary
interviews on the spot and immediately following up with promising candidates.
Streamlined Hiring
Despite the problems of late state budgets and union contracts, some districts manage to
make early hiring decisions and beat out competing districts for teachers. In Selma, for example,
the district surveys its teachers in February to determine which jobs will be open the following
year and which teachers want to change teaching assignments. Once open positions are
identified, the district tries to fill them immediately. Typically, all jobs are filled by June, far
ahead of neighboring districts that finish their hiring processes around August. Similarly, Elk

Grove completes its transfer phase by March and does a hiring round then and again in May, and
then actively continues to offer contracts through October. San Diego has an aggressive out-of-
state recruiting campaign and goes to several key college and job fairs annually. Given the large
number of teachers it must hire each year and wanting to avoid hiring delays, the district offers
hundreds of contracts in the spring, before knowing which particular schools have openings.
What Districts Cannot Do (Alone) to Reduce the Number of UnderqualifiedTeachers
In Chapter 2, we discussed teacher supply in terms of people with credentials who are
willing to take the jobs available, given the current working conditions and salaries offered. We
distinguished between this pool of people, which is too small to fill all the teaching positions
available, and the larger supply poolthat is, individuals who have credentials but are currently
unwilling to take the available jobs. The district policies discussed above, though successful in
the eyes of the district, are limited in their reach. Even if all districts implemented the strategies
described above, they probably would not solve the statewide problem of too many
underqualified teachers. In reality, these district policies probably are drawing a teacher from the
smaller pool into one school rather than another, rather than drawing in a new person who would
not otherwise be in the teaching workforce. Consequently, proactive districts that are successful
in recruiting qualified teachers often do so at the expense of neighboring districts.
The El Centro School District illustrates how an attractive, proactive district can "cream"
qualified teachers from the local labor pool. The town of El Centro is the largest in Imperial
County and is considered a good place to live, especially compared with the surrounding
communities. The schools have a good reputation for treating teachers professionally and paying
them well. The fact that El Centro is able to attract and hold the best teachers in the Imperial
Valley contributes to its strength and ultimately to its attractiveness. By contrast, the surrounding
districts are weak and lose their best teachers almost immediatelya process that makes them less
attractive to good teachers. The size of the local pool of teachers who are willing to take jobs at
the salaries offered and in the conditions offered is limited. Thus, as Table 3-5 illustrates, El
Centro is able to meet its hiring needs with qualified teachers, but nearly all the other districts in
Imperial County are struggling to do the same. As the superintendent of the Imperial County
district of Westmorland Union Elementary explained, "Our biggest challenge is retaining staff.
It's very difficult for us to keep teachers, even though our pay scale is relatively high, and we give
up to 12 years of credit. Nine teachers out of 25 on our staff are new, and this happens to us every
year." This district, like El Centro, is trying to attract and retain teachers with the resources it has.
However, its strategies are not as powerful as El Centro's, and they certainly are not powerful

enough to reach beyond the limited number of people willing to work under current conditions and
salaries.
Table 3-5Underqualified Teachers in Imperial County School Districts
District Number of Schools
Average PercentUnderqualified Teachers,
1997-98
Brawley Elementary 4 11
Brawley Union High 1 22
Calexico Unified 7 9
,Calipatria Unified 4 23
Central Union High 2 14
EI;Centro Elementary. 11
Heber Elementary 1 10
Holtville Unified 4 19
Imperial Unified 4 13
Magnolia Union Elementary 1 20
McCabe Union Elementary 1
Meadows Union Elementary 1 12
Mulberry Elementary 1 38
San Pasqual Valley Unified 3 27
Seeley Union Elementary 1 20
Westmorland Union Elementary 1 31
Sources: CBEDS (1999); SRI analysis.'
Even El Centro has difficulty recruiting and holding high school teachers, particularly in
math and science. The primary reason is that teacher candidates must travel outside the Imperial
Valley to do the coursework necessary for secondary specialties. This smaller pool of potential
teachers are frequently lured away from El Centro to more lucrative and appealing positions in
San Diego, for example. This is another example of the "creaming" effect, except that qualified
teachers are siphoned in the opposite directionaway from El Centro, rather than toward it.
To avoid the process of merely shuffling around a too-small pool of teachers who are
willing to take available jobs, California cannot simply produce more and more teachers without
attention to working conditions and salaries. For years, the teacher preparation system has
56

produced many more credentialed teachers than the number that actually take jobs. We believe
that, given current working conditions and salaries, the supply of candidates who are willing to
take jobs will never match or exceed the number of jobs available. Therefore, strategies that do
not reach deeper into the larger supply of teachers, all those in the state who hold a teaching
credential, are ineffective for making significant changes beyond the district unit.
Instead, the production of teacher candidates must be coupled with efforts to improve the
jobs they are expected to take and the compensation they are offered. Although districtsEl
Centro, for examplecan work to toward this goal to some degree, as well as do their part to
tighten recruitment and hiring efforts, they cannot bear the burden of fixing the state's teacher
crisis. Districts' actions may in many cases aggravate the problem of too many underqualified
teachers, but the problem is bigger and beyond the district unit. Districtsbe they small or
large, rural or urbando not have the financial or human resources to fix working conditions
enough or increase salaries enough to reach deeper into the larger supply of credentialed
teachers. At best, they may siphon a few teachers away from another district.
57
71

Endnotes
1 California Department of Education (CDE), Educational Demographics Unit. (1999). School-level teachercertification data compiled by special request. SRI analysis.
2 Teacher data from CDE. (1999). Student achievement data from CDE (1998) STAR reports research filesSacramento, CA: Author. Retrieved in '1999 from the California Basic Educational Data System (CBEDS)databases on the World Wide Web: http://star.cde.ca.gov/star98/research_index.html. SRI analysis.
3 CDE (1999). SRI analysis.4 CDE (1999). SRI analysis.5 CDE (1999). SRI analysis.6 CDE (1999). SRI analysis.7 CDE (1999). SRI analysis.8 CDE (1999). SRI analysis.9 CDE, Educational Demographics Unit. (1998). Number of teachers in California schools by ethnic group,
1981-82 through 1997-98 and Enrollment in California public schools by ethnic designation, 1981-82 through1998-99. Sacramento, CA: Author. Retrieved in 1999 from CBEDS demographics reports on the World WideWeb: http://www.cde.ca.gov/demographics/reports/.
10 CDE, Educational Demographics Unit. (1998, April). Teacher shortage and demand: School year 1997-98.Sacramento, CA: Author. The total need reported by districts does not match our estimate of total teacher need.This is in part because districts are estimating future hires, rather than reporting actual numbers, and in partbecause we calculate the need for credentialed teachers only and therefore count all positions filled byemergency permit, waiver, and internship credential holders as unfilled.
CDE (1998, April).
12 Emergency permit data from Commission on Teacher Credentialing (CTC). (1999). Totals of credentialsgranted fiscal year 1997/98. Sacramento, CA: Author. Waiver data from CTC. (1998, August). Analysis ofapproved credential waiver requests, 1997-98. Sacramento, CA: Author. Total staff data from CDE,Educational Demographics Unit. (1998). Course listing enrollment and staff in California public schools,October 1997. Sacramento, CA: Author. Retrieved in 1999 from CBEDS demographics reports on the WorldWide Web: http://www.cde.ca.govidemographics/
13 CDE (1998, April).
14 CTC. (1998, May). 1996-97 Annual report: Emergency permits and credential waivers. Sacramento, CA:Author.
15 CDE (1998, April).
16 CTC. (1999). Personal communication.
17 Fetler, M. (1997, January). Where have all the teachers gone? in Education Policy Analysis Archives 5(2).18 Tierney, D. (1994). A study of the employment patterns of graduates of California teacher education programs
and the employment decisions of a selected sample of California school districts. Sacramento, CA: CTC,Professional Services Division.
19 CDE (1999). SRI analysis.

CHAPTER 4. THE SYSTEM OF PREPARING QUALIFIED TEACHERSFOR EVERY CALIFORNIA CLASSROOM
CAPACITY
Does the teacher education system have the capacity to meet the demand for new teachers?
In the past decade, the proportion of new teachers educated through the CSU and UC systemsdeclined while the proportion from independent institutions increased. A majority of the increaseis accounted for by two institutions: National and Chapman.
Both CSU and UC are committed to addressing this issue and increasing their capacity to preparemore teachers. New state funds promise to boost the public system's production of new teachers.
Yet few policy initiatives focus on ensuring that teaching candidates enter the workforce and that asufficient number of teachers are being prepared to take and remain in jobs in the hardest-to-staffschools.
QUALITY
Do different approaches to teacher education result in better-prepared or less-well-preparedteachers?
As a group, teachers generally feel well prepared to teach the subject matter in their classes.Underqualified teachers feel less well prepared.
New teachers and administrators generally give their preparation programs moderate to negativeratings. No one sector (public or independent) is identified as producing stronger teachercandidates. A few extended programs, like UCLA's Center X, produce new teachers who arehighly regarded by teachers and administrators.
ALTERNATIVE APPROACHES
What progress have we made with alternative approaches to teacher preparation?
Institutions of higher education and districts are making efforts to develop and expand moreflexible routes into the profession, including district-based preparation programs and internshipprograms.
These programs, while showing promise, may be limited in terms of quantity and quality. District-based programs break down barriers between districts and IHEs, but they rely heavily on a finitepool of veteran teachers and are limited in capacity. Internship programs show promise forattracting and retaining desirable candidates, but historically they prepare only a small fraction ofteachers andby definitionplace underqualified teachers in the classroom.Alternative approaches that place unprepared teachers in the classroom can create disincentivesfor teacher candidates to enter preparation programs before beginning to teach.
The concentration of underqualified teachers in hard-to-staff schools has eliminated incentives forteacher candidates to become prepared to teach in these schools.
59
7 3
If every California schoolchild is to have a qualified and effective teacher, the state's
teacher preparation system must produce a sufficient number of high-quality teaching candidates.
In doing so, teacher educators face the core dilemma involved in solving the problem of
underqualified teachers in an era of rising standards: how to increase the quantity of teaching
candidates willing to accept jobs in the state while simultaneously increasing the quality and
effectiveness of those teaching candidates.
In this chapter, we assess California's progress in meeting this challenge. We ask two
related questions: Does the state system of teacher preparation have the capacity to produce a
sufficient number of new teachers to meet the demand in California classrooms? Is the system
turning out teaching candidates capable of helping all students learn to high standards? As in
previous chapters, we assess the prospects of emerging policies and trends for affecting the
capacity of the teaching workforce in the long run.
The Capacity of the Teacher Preparation System
There is no formal "system" of teacher preparation in the state. Teachers are prepared
through two separate public systemsthe California State University (CSU) and University of
California (UC) systemsand 43 independent institutions. The CSU system is charged by the
state with major responsibility for teacher preparation, and CSU's programs on 22 different
campuses have long produced the majority of new teacher candidates in the state. UC, which is
charged primarily with carrying out relevant research on educational issues, produces a much
smaller number throiigh its eight-campus system.I The independent institutions produce the rest
of the teaching force.
At the beginning of the 1990s, the CSU and UC systems in combination prepared two-
thirds of the state's teacher candidates. By the end of the decade, their share of the total number
of teachers trained in the state had dropped to 58%. In contrast, the proportion of teacher
candidates prepared at independent institutions increased from 34% at the beginning of the
decade to 41% by 1998 (see Figure 4-1).

9:7)/0
4Y/0
si 3CPC/oa)U
a)
co 2Y/0"5
UwLt 10%
CP/0
Figure 4-1Share of New Credentials Recommended by CSU, UC, and
Independent Institutions, 1991-92 to 1997-98
1991-92 1992-93
Source: CTC (1998, 1999).2
1993-94 1991-95 1%6-96
.csu 1i it 6 hipantrts
193697 1997-93
CSU's Capacity to Produce New Teachers
CSU's declining share during this period resulted not from a lack of demand but rather
from a lack of capacityitself a result of policy decisions. CSU teacher education programs'
space and faculty allotments have been limited by state budgetary considerations and internal
resource allocation decisions. That is, the state budget did not provide additional funds to allow
CSU to meet rising client demand, and CSU policy-makers chose not to reallocate available
funds to the high-demand teacher preparation programs. As a result, CSU had to turn away
qualified applicants. According to rough estimates by the deans of these programs, 1,000
qualified individuals were not admitted to CSU teacher preparation programs in 1997-98.
Since 1998, the state legislature and university leaders have tried to address the problem of
diminished capacity in the public teacher preparation system. In 1998, a report from the CSU
Presidents' Commission on Teacher Education acknowledged CSU's responsibility to "produce
an increasing number of well-qualified teachers to staff California schools."3 Following this

report, CSU trustees voted to revamp their teacher preparation program with the aim of
increasing the number of students recommended for credentials by 25% by the year 2000.
CSU's commitment is supported by recent state budget additions. In 1997-98, the state
budget provided CSU with an additional $5 million in Economic Improvement Initiative Funds
to build capacity for preparing more teachers. CSU administrators directed campus presidents to
use these new funds exclusively for multiple-subject programs and the coordination of K-12
collaborative partnership arrangements with schools, districts and subject matter departments. In
1998-99, the budget allocated $9.3 million to fund an additional 1,800 full-time students in CSU
teacher preparation programs. In addition, the budget included $5 million in one-time funds to
develop a distance learning teacher preparation program.
UC's Capacity to Produce New Teachers
As with CSU, the University of California's capacity is constrained by state budgetary and
internal policy decisions. Tight state budgets through the early 1990s and the dictate of the
Master Plan that UC not have teacher preparation as a primary mission have limited its ability to
expand its programs. As a result, UC's share of new credentials recommended has been cut in
half during the 1990s, and the absolute number of credential candidates has actually declined
during this period. The UC leadership is aware of the situation and has committed itself to
increasing the number of teachers the UC system prepares each year4although UC's
production of new teachers is likely to remain small, its programs play an important research and
leadership role.
Growth of Independent Institutions' Capacity
Independent institutions, which are not constrained by state budgetary decisions, have been
able to respond to the rising demand for teacher credential programs in the past decade. As
tuition-driven programs, independent universities can expand as new candidates pay for the
increased institutional capacity. The result has been an increase in the percentage and the
numbers of teachers being prepared in private universities and colleges.
However, the growth in teacher candidates has been concentrated in a few independent
institutions. Most independent schools have experienced slow growth, preferring to limit their
capacity and focus on a relatively stable number of students. For example, Mills College in
Oakland has graduated between 40 and 60 students per year throughout the decade. In fact, two
schoolsChapman and Nationalaccount for the vast majority of the growth in teacher
credentials issued by independent institutions. As shown in Figure 4-2, Chapman and National

together now produce more teacher candidates than the rest of the independent institutions
combined.
The growth of the National and Chapman teacher education programs reportedly is the
result of their responsiveness to the needs of career changers and emergency permit holders who
work full-time while earning their credentials. Often, these types of teachers report that they
could not have obtained a credential without choosing an independent institution. Although
comparatively expensive, these independent programs are considered more "user friendly,"
offering classes at many locations at convenient times. In contrast, teacher candidates in
programs at public institutions often report having a hard time getting the classes they want or
being unable to transfer subject matter competency credits from other universities. One new
teacher we spoke with who went through National's program noted, "It was the only way I could
do it. I was working full-time doing construction and so I could only attend classes at night."
Another informant described the local CSU program as "[h]olding regular business hours that do
not work for teachers who must be in class all day."
Market-driven independent institutions clearly have an important role to play in meeting
the demand for new teachers. In fact, the California Commission on Teacher Credentialing is
evaluating teacher preparation programs at a number of out-of-state universities that have
satellite campuses in California and that are not currently accredited by the Western Association
of Schools and Colleges (WASC). The CTC will evaluate whether teacher preparation by these
schools is adequate for California teacher certification. Accreditation of these schools probably
would increase the number of flexible programs available to potential teachers.
63

8000
7000
6000
5000
4000
3000
2000
1000
Figure 4-2Number of New Multiple- and Single-Subject Credentials
Recommended by Independent IHEs
1991-92 1992-93 1993-94 1994-95 1995-96 1996-97
-4All independent IHEs IIIChapman and National aOther independent IHEs
Source: CTC (1998, 1999).5
1997-98
Issues in Understanding the Capacity of the Teacher Preparation System
In combination, the expansion of CSU's output of new teachers, UC's renewed
commitment to teacher preparation, and the continued expansion of the market-driven
independent sectoraided by the statepromise to increase the number of new teacher
candidates in the next few year's. Indeed, preliminary numbers show that the expansion has
already started.
Yet, in considering the prospects for meeting the state's need for credentialed teachers, a
few issues need to be considered. First, a central problem is not simply producing a sufficient
number of teaching candidates but also ensuring that a high proportion actually take jobs. Large
numbers of teaching candidates awarded credentialssomewhere between 30% and 50%do
not go into the teaching workforce.6 Teacher preparation programs cannot control whether
individual graduates accept employment, but certainly program leaders should be doing
everything in their power to assist their graduates, they should be tracking how many of their
64
78

graduates successfully find jobs, and they should be developing policies to increase the
percentage who take jobs. Currently, there are no statewide data available on these issuesand
neither the CSU nor UC system tracks placement rates. Increasing the capacity of the teacher
candidate pipeline without efforts to plug current leaks simply means continued loss of valuable
state dollars that support teacher training.
Second, it is not clear that these developments will address the maldistribution of the
teacher shortage. Will expanding the capacity of teacher preparation programs across the CSU
campuses ensure that the areas in greatest need will get sufficient teaching candidates? Will
facilitating the entrance of additional independent institutions address the needs of the hardest-to-
staff schools? We expect that the answer to both questions is no, that policies designed to
increase the overall capacity of the system, although necessary, will not be sufficient to ensure
that students in the hardest-to-staff schools will have a qualified teacher. Without targeted
efforts to produce more qualified teachers in geographic areas with high concentrations of these
schools, the current maldistribution of underqualified teachers is likely to continue.
Finally, efforts to increase capacity always have to be balanced with efforts to ensure that
expanded programs are of high quality. We turn to the issue of quality in the subsequent sections
of this chapter.
The Quality of New Teachers
Regardless of absolute numbers, are California's teacher preparation programs producing
candidates who become effective teachers? This study did not directly measure teacher
effectiveness, nor did we directly assess the relative efficacy of different teacher preparation
programs, or even of different models of teacher preparation. We did not directly observe
teacher preparation classes, nor did we sample programs to be able to describe the full range of
approaches. Data from both the case studies and surveys, however, do shed some light on the
issue of teacher quality.
First, we look at teachers' perceptions of their preparedness to teach in their assigned
classrooms. In response to the teacher survey, teachers generally report that they feel well
prepared to teach (Tables 4-1 and 4-2). Self-contained classroom teachers report that they feel
much better prepared to teach reading (and, to a lesser extent, mathematics) than science and
computer/technology literacy. These tables also compare underqualified teachersthose on
emergency and intern credentialswith fully credentialed teachers. In every case except
computer/technology literacy, underqualified teachers report themselves to feel less well
prepared than do credentialed teachers.

Table 4-1Self-Contained Classroom Teachers' Preparation
to Teach Core Subject Matter
SubjectMean Score (Scale of 1-5; 1=not well
prepared; 5=very well prepared)
Fully CredentialedTeachers
UnderqualifiedTeachers
Reading/language arts 4.5 4.1*
Mathematics 4.3 4.0**
Social studies/history 4.1 3.7*
Science 3.6 3.1
Computer/technologyliteracy
3.0 3.2
Source: SRI statewide teacher survey, 1999.* Contrasts on mean ratings significant at p<=0.05** Contrasts on mean ratings significant at p<=0.01
Table 4-2 shows that fully credentialed single-subject teachers (those not in self-contained
classrooms) report feeling better prepared to teach the subject matter in their main teaching
assignment than their counterparts who hold emergency or intern credentials.
Table 4-2Single-Subject Teachers' Reported Preparation to Teach the
Subject Matter Covered in Their Teaching Assignment(s)
Mean Score (Scale of 1-5; 1=not wellprepared; 5=very well prepared)
Fully CredentialedTeachers
UnderqualifiedTeachers
Main teaching assignment 4.7 4.3**
Secondary assignment 4.3 4.0
Source: SRI statewide teacher survey, 1999.**Contrasts on mean ratings significant at p<=0.01
These findings are somewhat surprising. First, self-reported preparedness is higher than we
would have expected. Second, the differences between underqualified and credentialed teachers
are not as large as we expected, although they are generally statistically significant. Logically,
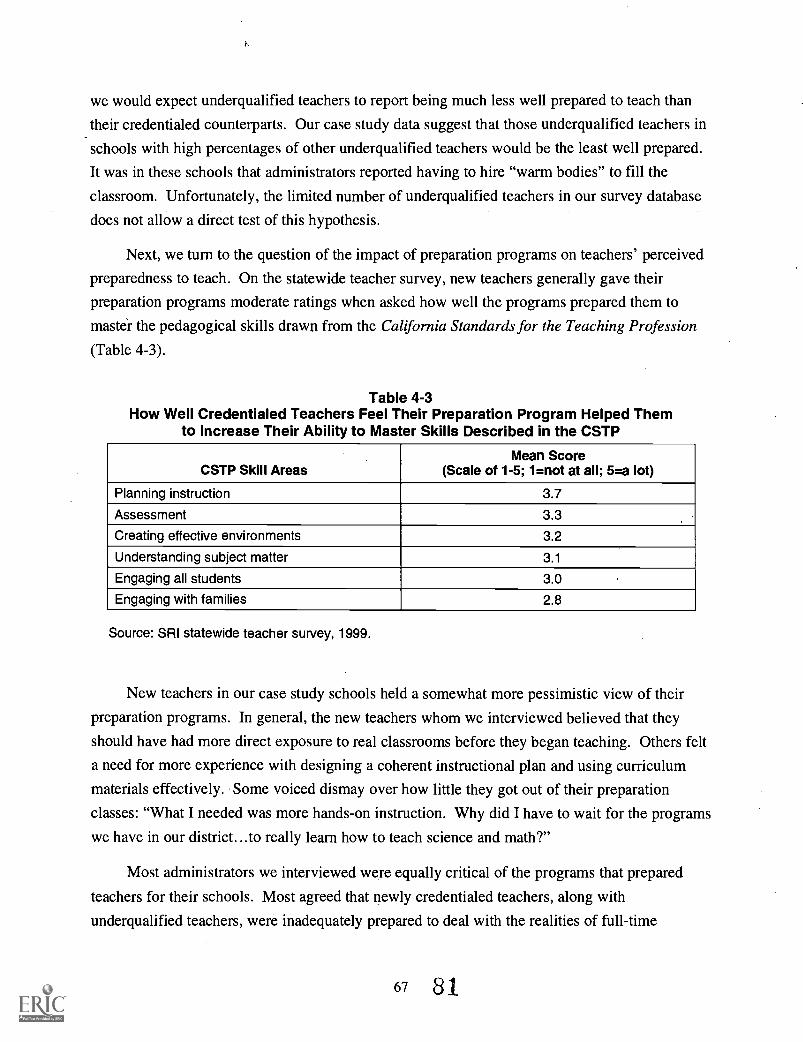
we would expect underqualified teachers to report being much less well prepared to teach than
their credentialed counterparts. Our case study data suggest that those underqualified teachers in
schools with high percentages of other underqualified teachers would be the least well prepared.
It was in these schools that administrators reported having to hire "warm bodies" to fill the
classroom. Unfortunately, the limited number of underqualified teachers in our survey database
does not allow a direct test of this hypothesis.
Next, we turn to the question of the impact of preparation programs on teachers' perceived
preparedness to teach. On the statewide teacher survey, new teachers generally gave their
preparation programs moderate ratings when asked how well the programs prepared them to
master the pedagogical skills drawn from the California Standards for the Teaching Profession
(Table 4-3).
Table 4-3How Well Credentialed Teachers Feel Their Preparation Program Helped Them
to Increase Their Ability to Master Skills Described in the CSTP
CSTP Skill AreasMean Score
(Scale of 1-5; 1=not at all; 5=a lot)
Planning instruction 3.7
Assessment 3.3
Creating effective environments 3.2
Understanding subject matter 3.1
Engaging all students 3.0
Engaging with families 2.8
Source: SRI statewide teacher survey, 1999.
New teachers in our case study schools held a somewhat more pessimistic view of their
preparation programs. In general, the new teachers whom we interviewed believed that they
should have had more direct exposure to real classrooms before they began teaching. Others felt
a need for more experience with designing a coherent instructional plan and using curriculum
materials effectively. Some voiced dismay over how little they got out of their preparation
classes: "What I needed was more hands-on instruction. Why did I have to wait for the programs
we have in our district...to really learn how to teach science and math?"
Most administrators we interviewed were equally critical of the programs that prepared
teachers for their schools. Most agreed that newly credentialed teachers, along with
underqualified teachers, were inadequately prepared to deal with the realities of full-time
67 81

teaching. Some were more specific: "They're not trained in critical-thinking processes, they
can't move students from recall to the application and synthesis level." Others complained about
new teachers' inability to teach reading and their lack of classroom management skills. No
administrator felt that new teachers entered the classroom ready to teach.
Despite these concerns, some administrators noted that the impacts of even the best
preparation programs are limited by their short duration. As one administrator explained: "What
do I think of the teacher preparation program? Well not much, but really, realistically, I don't
expect much. After all, they just have them [teacher candidates] for a year. What can you do in
a year? I [at the district] have them for 30 years. So I feel the greater responsibility for their
education and development."
At the same time, we found that teachers and administrators do not report significant
differences in the effectiveness of teacher education programs sponsored by CSU, UC, or
independents (although the survey did not differentiate among the different campuses of CSU
and UC, nor among the many independents). In the survey, there were no statistically significant
differences in new teachers' responses associated with the sector in which they received their
credential. Administratorsin large part because of their perceptions of the limitations of
preparation programsgenerally did not see major differences in preparation across the different
sectors. One central office personnel director noted, "We have had some bad ones from each of
the local schools, and we have had some great ones from each."
Unfortunately, we were not able to survey teachers about their specific preparation
programs to make program-by-program comparisons. However, we did find one extended
program that received extremely high marks from teachers and administrators. Indeed, the only
exception to the common negative perception of the quality of teacher preparation programs was
the case of UCLA's Center X.* In the Los Angeles area, this 2-year program was praised for its
ability to attract high-quality candidates and for its focus on significant clinical experience in
local schools, combined with strong theoretical and subject matter training. Local administrators
and teachers saw graduates of Center X as significantly better prepared than their peers from
other institutions.
This study did not set out to examine the quality of teacher preparation programs in depth.
We are struck by the generally moderate to negative perceptions of preparation programs by
teachers and school administrators. With the exception of one UCLA center, no teacher
preparation program was identified by teachers and administrators as especially superior to
* We do not mean to imply that UCLA's Center X is the only strong program in the state. It was simply the onlyone that showed up in our limited and not statistically representative sample of case study districts and schools.

others. And we found no relationship between the sector of the higher education community
where a teacher was trained and perceptions of the quality of those programs.
These findings suggest again the importance of seeing "teacher learning" as an ongoing
process, one that does not stop with the awarding of a credential. It also points to the continued
need to focus on building the capacity of local districts to help teachers learn and to raze any
barriers that remain between the expertise of university faculty and practicing teachers.
New Approaches to Preparing Classroom Teachers
In response to concerns about the quality of traditional programs and about the quantity of
teachers needed to fill the state's classrooms, there have been a number of related developments.
The state, through legislation, has developed a credentialing system that tries to reconceptualize
teacher preparation as a career-long process. The state's "Learning to Teach Continuum" defines
two levels of certification: a Level 1or preliminarycredential is issued to individuals who
have completed a basic teacher preparation program; a Level 2or clearcredential requires
participation in an individual induction program, formal assessment, and an individual growth
program with 150 hours of professional development. Expansion of the Beginning Teacher
Support and Assessment program and the new California Peer Assistance and Review Program
are part of this system.
As we discuss later in this document, this new system is just being put in place, and its
impact on teacher preparation is unknown at this point. In the meantime, there has been a
growth in "alternative" approaches to traditional teacher education. By traditional programs we
mean fifth-year programs that include university-based classes combined with a set schedule of
supervised student teaching. Alternatives to this model vary from minimal modifications (e.g.,
holding classes in K-12 schools) to radical departures in which teachers are trained "on the job."
Here we discuss these different approaches. We conclude by raising a number of issues about
the long-term prospects for the teacher preparation system.
More Flexible Traditional Programs
The growth of independent institutions like National and Chapman are part of a broader
trend as educators try to craft more flexible teacher preparation programs. In part, these efforts
are designed to meet the needs of "alternative" teacher candidatestypically older, employed
professionals. Hence, programs are holding night and weekend classes at more convenient
locations.
69 8 3

The California State University system has committed itself to creating more flexible
programs that will meet the needs of prospective teachers. The CSU Presidents' Commission on
Teacher Education recognized that changes were necessary in order to fulfill this obligation. "If
the CSU teacher preparation programs are to succeed in producing more teachers, they need to
be more flexible, more entrepreneurial, more responsive, and more user friendly."7 Planned
changes include offering undergraduate coursework in education and fieldwork for prospective
teachers and offering integrated programs, district partnerships, and 4-year and traditional fifth-
year programs on campus and through distance learning. CSU has also launched a new
credential program, CalStateTEACH, that will use the Internet, school site mentors, and site-
visiting faculty supervisors to support the training of candidates from around the state.
District-Based Teacher Preparation Programs
Another development is the increased involvement of districts in creating their own teacher
preparation programs. For example, at San Francisco State University, a co-principalship has
been established with a San Francisco Unified School District principal and an SF State faculty
member. Credential candidates work in K-5 classrooms in the morning and attend university
classes in the afternoon at the school site. The program is scheduled to expand to other schools
in the district in the 1999-2000 school year.
In LAUSD, the Accelerated Collaborative Training (ACT) program is a collaboration
between the Polytechnic school family and CSU Northridge (CSUN), and is designed to fully
prepare teacher candidates within 1 year. Unlike the vast majority of new teachers in the district
who hold emergency permits, these candidates are full-time students. They spend the majority of
the school day observing teachers in Polytechnic classrooms while taking courses in the
afternoon and evening. Participating schools provide master teachers for ACT teacher
candidates, and CSUN faculty teach courses at an on-site Professional Development Center
located at Polytechnic High School.
School administrators are excited about the potential of the ACT program to place qualified
teachers in desperately understaffed schools. As one principal explained, "With this program,
teachers will know what they're getting into; they will have been trained in this cluster."
However, the ACT program is producing only about 60 new teachers a year and must find
candidates willing to forgo immediate employment opportunities in a district where most new
teachers have not completed a preparation program.

Internship Programs
Another response to the changing makeup of the teaching force is the development and
expansion of internship programs. Internship programs are meant to offer an alternative
certification route to those who enter the profession without completing a teaching credential but
who have met certain requirements. While working as the teacher of record, interns are enrolled
in a planned course of study and receive support from mentor teachers and/or IHE faculty.
Individuals qualify for intern status if they have a baccalaureate degree and have passed the
CBEST and subject matter requirements.
Figure 4-3 shows the growth in institutional and district intern programs from 1991 to
1998. The CTC issued a total of 2,689 new intern credentials in 1997, up from 1,820 in 1996
and 1,116 in 1995.8 Because intern credentials are valid for 2 years, we estimate that there were
4,509 first- and second-year interns in 1997. Increased funding for internship programs indicates
future growth, as well. Until 1997, state funding for all internship programs was $2 million per
year. In 1997, $4.5 million was added for expansion to facilitate class size reduction and
improve reading and math instruction in reduced classes taught by interns.9 The 1998-99 budget
raised the annual funding to $11 million, and preliminary estimates from the CTC show that the
number of interns continues to grow.
Internship programs hold promise for a number of reasons. They provide a subset of new
teachers holding emergency permits with support and a coherent academic program leading to a
full credential. Second, the programs are designed to increase the supply of teachers and reduce
the attrition of teachers with emergency permits. Although we do not have data on the
percentage of interns who actually finish their program, high percentages of graduating interns
do remain in teaching after graduationand usually in the same school district where they
pursued their internship.1°
65
71

3000
2500
2000
5
a) 1500
0
Ez 1000
500
Figure 4-3Institutional and District Intern Credentials, 1991-92 to 1997-98
1991/92 1992/93
Source: CTC (1999).
1993/94 1994/95
Year
Institutional 0 District
1995/96 1996/97 1997/98
Finally, internship programs are expected to attract candidates who already live in the
communities in which teachers are in demand. Existing data suggest that these interns are more
likely to reflect the ethnic makeup of the student body. The CTC reports that almost half (48%)
of the interns in funded district and university internship programs are members of ethnic groups
currently underrepresented in California's teaching workforce. Some districts use their
internship programs, explicitly to attract more individuals from underrepresented groups. For
example, San Francisco's district internship program is targeted particularly toward increasing
the diversity of its teaching staff: 95% of participants are minorities.
Although internships offer some promise, there are questions about the limits of the ability
of internship programs to address the teacher shortagein terms of both quantity and quality.
Historically, internship programs have prepared only a small fraction of new teachers, and,
although this figure is growing, it still remains small. Regardless of how well internships
prepare new teachers, theyby definitionplace underqualified teachers into classrooms.
72 8 6

Although internship programs might train emergency teachers quite ably within a year or two,
for the duration of the internship, the students in their classrooms are taught by someone who is
learning the craft as he or she goes.
LOS ANGELES UNIFIED SCHOOL DISTRICT INTERN PROGRAM
LAUSD's District Intern (DI) program illustrates both the strengths and limitations of theinternship model. The DI program is the largest (currently 1,100 first-year and second-yearinterns) and longest running (since 1984) in the state. The DI program is 2 years in duration,and teachers are grouped in cohorts of 20 to 30, according to grade level or subject area.The program is a planned course of study in 6-week modules, meeting once every week, andcovering topics such as classroom management, literacy, authentic assessment, math andscience, and cultural diversity. A summer project includes networking, communityconnections, field trips (to local resources), and corresponding write-ups. The second yearcovers the specialty areas: art, music, PE, special needs. District administrators andexperienced teachers conduct all evening classes.
The district considers the District Intern program to be one of its strongest recruiting tools.Reportedly, teacher candidates are attracted to the program because of its price tag (tuitionfree), its cohort grouping, and its instruction in classroom management and teachingpractices.
Equally important, retention rates among graduates of the program are very high, with 87.5%of the participants remaining in the district after 5 years. Attrition rates among all who enterthe program are not known, but anecdotal evidence suggests a high drop out rate during theprogram. Still, local administrators report very positive experiences in hiring district interns:of all the underqualified teachers they deal with, the district interns are the most able to copewith the realities of teaching. A middle school principal enthused, "The DI program isoutstanding. They really do their homework, they get BTSA [on-the-job] training, there's anemphasis on literacy. I would hire a DI anytime."
Although the DI program is quite successful in recruiting and retaining good teachers, it maynot be a long-term solution to LAUSD's teacher shortage problems. The DI programaccounted for only 11.7% of the new hires in 1998-99, compared with 62.3% of new hireswho were not enrolled in any kind of internship or preparation program. Moreover, the DIprogram still places underqualified teachers in charge of classrooms.
Ironically, the DI program creates a disincentive for prospective teachers to receive trainingbefore they begin teaching. The district recruits directly out of undergraduate programs onuniversity campuses, even while maintaining that teacher candidates who go through thetraditional IHE program would be preferable to interns.

Pre-internship Programs
Introduced in 1998, pre-internship programs aim to provide continuous support to move
emergency permit teachers toward entrance into a teacher preparation or intern program. Pre-
internship programs are distinct from internship programs in that they serve emergency-
credentialed teachers who are not yet enrolled in a teacher preparation program and who have
not demonstrated subject matter competence. Pre-intern support includes both training in basic
teaching skills and help in meeting the requirements for entrance to an internship program.
In 1997-98, an initial $2 million in grants was made available to school districts, county
offices of education, institutions of higher education, and other professional organizations to help
emergency-waiver holders to become fully credentialed teachers. Beginning in 1998-99, the
state's annual budget provides $11.8 million to serve 4,000 teachers with emergency permits. To
date, there are no data on how many pre-interns actually complete their subject matter
requirements, move into intern programs, and ultimately receive a preliminary or professional
clear credential.
Prospects for the Teacher Preparation System
It is still too early to assess the impact of the many new developments in teacher
preparation in California. For example, many of CSU's initiatives, such as its "blended" 4-year
programs and the new CalStateTEACH initiative, are just beginning. For other developments,
like the growth of more flexible programs, no data are available to assess their relative efficacy.
But what we know about these programs does raise some issues. The first relates to the capacity
of the system to support "alternative" approaches. The second has to do with the potential
quality of those programs.
The System's Capacity to Support Alternative Programs
District-based preparation programs, internships programs, and pre-internship programs all
shift some of the "preparation" responsibility from traditional programs located in higher
education institutions to local district and school personnel. These shifts are occurring on top of
the extensive use of local veteran teachers and district administrators as instructors in the
growing independent preparation programs like Chapman and National, as well as in public
preparation programs.
There are some clear advantages to this trend: it serves to break down the barrier between
higher education and K-12 and creates the possibility of tapping the most talented professionals
from both sectors to help prepare teachers. For example, San Diego State University's satellite
74
campus at Calexico enlists practicing exemplary teachers from surrounding districts to teach
methods courses. The practice bolsters the tiny full-time staff at the university and helps make
methods classes more practical and relevant. In the case of El Centro Unified School District,
skilled mentor teachers serve as adjunct faculty, and, simultaneously, the SDSU faculty are
increasingly involved in the large progressive reform efforts undertaken by the district.
Yet the increased involvement of districts and district staff in teacher preparation raises a
capacity issue. Whether by formal arrangement, such as Elk Grove's TEI, or by individual
arrangements between K-12 staff and teacher preparation institutions, district participation in
teacher preparation typically relies on the willingness of individuals to take on added
responsibilities. In districts hardest hit by the teacher shortage, the influx of state dollars for
internships and pre-internships does not translate directly into making available a sufficient
number of veteran teachers to serve as mentors and instructors. And, of course, it is not just a
matter of numbers, it is also a matter of match: as one district intern who taught high school
English reported, "The mentor they assigned to me was a math teacher from a school 20 miles
away. I never saw him."
Quantity and Speed at the Expense of Quality?
The demand for new teachers from districts seeking to fill classrooms and the apparent
increase in older and currently employed individuals to enter the profession has motivated many
teacher preparation programs to alter their traditional approaches. The result has been efforts to
streamline programs and to offer more on-the-job training. These efforts are justified as
reasonable responses to a crisis situationand indeed they do hold some promise for increasing
the number of credentialed teaching candidates.
Yet research suggests that more extended preparation programs with significant clinical
experience produce higher-quality teachers. Not only do graduates of extended programs feel
better prepared, but they enter the profession and stay in the profession at higher rates than
graduates of shorter preparation programs." In addition, research has established, at least in
terms of mathematics education, the connection between more college-level content courses,
certification in the discipline taught, and effective teaching.12
Although we do not have data from this study to assess the degree to which such research
accurately reflects the current situation in California, these findings raise questions about the
direction in which many teacher preparation programs are heading. Of particular concern is the
trend in areas of high demand for fewer teacher candidates to participate in traditional fifth-year
programs with student teaching components. Instead, candidates are increasingly choosing to

take teaching jobs before earning a credential. For prospective teachers willing to work in
districts with severe shortages, there are virtually no incentives to enter a credential program.
For example, of the 292 multiple and single subject teacher candidates at Cal State LA
participating in their clinical experience during spring 1999, only 33 were not already full-time
teachers of record.13
In effect, California has multiple systems of teacher preparation. On one end of the
spectrum, California can boast of a handful of intensive and extended programs, like Center X.
On the other end are pre-internship programs and internship programs in which credential
candidates are working in high-need schools with little or no preparation. By employing an on-
the-job training model, we have solved the problem of unattended classrooms but have
eliminated incentives for candidates to be prepared to teach. One result is that many teacher
preparation programs in California have a new and disheartening mission: to prepare the
unprepared while they teach. Of course, the biggest losers are the students denied access to a
high-quality teacher.
76 90

PART I SUMMARY AND POLICY RECOMMENDATIONS
In the first part of this report, we have documented the shortage of qualified teachers in
California's classrooms. More than 1 in 10 classrooms are staffed by individuals who have not
received the appropriate credentials. These teachers are not evenly distributed across the state:
they are most likely to be teaching our poor and ethnic- and language-minority students. Those
students most in need of help to meet California's ambitious standards for student learning
those scoring lowest on current testsare the most likely to have an underqualified teacher.
There have been numerous policy responses to this problem, including an increased
capacity of CSU to produce more teachers, increased flexibility in CSU's programs to respond to
the needs of a diverse group of potential teaching candidates, lowered barriers to out-of-state-
teachers and institutions, and increased support for alternative routes into the profession. For the
most part, these efforts have focused on increasing the quantity of teachers, with less attention
paid to quality. In particular, efforts at streamlining preparation programs and internship
programs decrease the amount of time teachers receive in preparation before being given full
responsibility for a classroom. Most importantly, these policy initiatives are not focused on the
hardest-to-staff schools.
In response to these findings, the Task Force has made the following recommendations:
Ensure that every child has a fully qualified, effective teacher.
Implement a comprehensive program of preparing and placing qualified teachers ininadequately staffed schools through specifically focused competitive grantsavailable to publicly supported colleges and universities which are located in areaswith high percentages of inadequately staffed schools.
Provide 100% forgivable state loans of at least $20,000, plus tuition fees and booksto students who enroll in and complete a teacher preparation program andimmediately go on to teach in a hard-to-staff school for a minimum of 4 years, byexpanding APLE loans and Cal T grants.
Expand SB 1X to provide annual discretionary grants of $350 per student for up tothree years to enable inadequately staffed schools to attract and retain fullyqualified classroom teachers, develop the skills and knowledge of the school'sresident staff, and take steps to create a positive learning environment for studentsand teachers.
Expand the provisions of existing law to require the Commission on TeacherCredentialing to notify annually all local education agencies when they employmore than 150% of the statewide average of under-qualified teachers, encourage the
79 91

identified districts to review and modify their recruitment, hiring, and placementpractices.
Encourage local policy makers and bargaining units to focus Peer Assistance andReview programs (PAR) on inadequately staffed school sites. Special attention inthese efforts should be given to the identification, selection, and preparation ofaccomplished teachers responsible for ushering novice teachers into the profession.
Provide training for accomplished teacher leaders called upon to provideprofessional development or support for novice teachers, and ensure that theirclassrooms are staffed by fully qualified teachers in their absence.
Establish regional cadres of accomplished veteran teachers and recognized experts,with additional incentives for drawing from the pool of retired teachers, to provideprofessional development and support for novice teachers at inadequately staffedschools. Classrooms of teachers providing professional development and/orsupport for novice teachers must be staffed by fully qualified teachers.
Eliminate the hiring of unqualified teachers.
Phase out the approval of waivers and emergency permits over the next 5 years,allowing waiver of credential requirements by Commission on TeacherCredentialing only in exceptional cases where specialized individual skill and talentor eminence is involved.
Expand Cal T grants in size and number, with special emphasis on shortage fields(i.e., math, physical science, computer science, special education).
Improve the ability of the teaching profession to attract and keep fully qualifiedteachers.
Revise the current beginning teacher salary incentive of $32,000 to establish atarget minimum of $40,000 for fully qualified new teacher hires in order to maketeaching more competitive with other professional opportunities in attractingtalented and qualified individuals.
Continue and expand through Cal Teach and other state and local programs effortsto recruit teacher candidates whose background and experiences mirror those of thestate's diverse student population.
Provide incentives for developing and maintaining a professional workingenvironment that address facilities use, scheduling, safety, materials, supplies, andother conditions under which teachers are attracted to and stay in the profession.

PART II. BUILDING AND MAINTAINING THE STRENGTHS OF THE CURRENTTEACHER WORKFORCE
As California struggles to attract and prepare a sufficient number of candidates for
teachingand to place them where they are in greatest demandit faces the challenge of
supporting those teachers already practicing in classrooms. Currently, there are approximately
284,000 practicing teachers in the state's public schools. Each of these teachers is being asked to
do more with an increasingly culturally and linguistically diverse student body. If these teachers
are expected to help all of California's students to reach the state's standards for learning, the
teachers themselves will require high-quality learning opportunities.
More than a decade ago, an influential study commissioned by the legislature sharply
criticized teacher professional development in California. The report, Staff Development in
California: Public and Personal Investments, Program Patterns, and Policy Choices, found that
professional development occurs "on the periphery of school and classroom life, a situation
exacerbated and perpetuated by funding patterns, by a marketplace with short-term skill training,
and by a daily and yearly schedule that squeezes staff development into widely separated days or
hours."1 In addition, the study found that classroom and school reinforcement, or follow-up, was
rarely part of teachers' professional development.
Since that time, California has implemented numerous initiatives to improve professional
development opportunities for teachersas we discuss in detail laterand researchers have
learned much about the kind of professional development that helps teachers improve their
practice and increase student learning. Such professional development is characterized by a
focus on subject matter expertise, building on teachers' knowledge of teaching, coherence with
instructional goals, duration over a sustained time with sufficient follow-up support, and
collaborative and active learning on the part of teachers.2 Building on this research base, the
California Professional Development Reform Initiative reviewed that literature and proposed a
set of elements to guide the design of high-quality professional development. These elements
include using data about student learning, developing and expanding teachers' ability to integrate
pedagogical repertoire and content knowledge, and providing for collaboration, collegial work,
and reflection.3
In light of the importance of equipping teachers for their expanded role in helping students
reach standards and given an emerging consensus on the characteristics of high-quality
professional development, we turn in this second part of the report to a set of questions related to
teacher learning. First, what kinds of learning opportunities are available to and taken advantage
83
93

CHAPTER 5. SUPPORTING BEGINNING TEACHERSTHROUGH THE CRITICAL FIRST YEARS
STATE POLICY
What is the state doing to support new teachers?California has a comprehensive policy to support new teachers. It requires that teachers go througha formal induction experience to receive a clear credential, has created standards to guide suchprograms and provides funds to support them, has supported model induction programs throughoutthe state, and has brought together the lessons from many of those models in the CFASST system.
DISTRICT SUPPORT
How do districts support new teachers?District induction programs traditionally have ranged from quick orientation workshops to full-timesupport providers working with new teachers throughout the school year.
With the growth of state support for teacher induction, local programs are in a period of flux as theyscale up, become more formalized, and begin requiring participation.
A core issue for local programs is whether to build teams of full-time support providers for newteachers or to use a revolving group of veteran teachers who maintain their own classrooms.
NATURE AND QUALITY OF INDUCTION SUPPORT
What does induction support look like, and does it help teachers?Most beginning teachers (92%) receive some kind of induction support; the most common supportinvolves attendance at workshops.
For many teachers (50% to 68%), induction support includes opportunities to observe, be observed,and collaborate with their peers and mentors. Yet such experiences are infrequent, typically nottaking place on a regular basis.
Teachers who have opportunities for peer observation, who are formally assigned mentors, and whoengage with mentors in frequent support activities are uniformly more likely to report thoseexperiences as effective.
CHALLENGES OF BTSA SCALE-UP
What districts can do to support new teachers depends largely on the proportion of new teachers inthe local workforce.Few districts and no large urban districts we studied have the capacity, in terms of support providersor of professionals to help the support providers, to take the Beginning Teacher Support andAssessment Program (BTSA) to scale.
Districts have yet to determine how BTSA, and especially the CFASST system, fits into other effortsto foster adult learning in their schools.
87
94

Supporting teachers as they first enter the profession is a core strategy for building and
retaining a high-quality teaching workforce. It is during teachers' first years in the profession
that they learn to meld their schooled knowledge with the everyday practice of teaching. In
doing so, they develop instructional strategies and management approaches that form the basis of
their practice through the remainder of their careers. It is also during this induction period that
teachers make the decision whether or not to continue to pursue teaching as a career. Many
teachers choose not to continue. Attrition rates among new teachers in California are extremely
high. It is estimated that 30% of new teachers leave the profession within their first 3 years of
service; figures go as high as 50% in certain parts of the state.'
Careful attention and support given to teachers during their first years of teaching can
reduce attrition rates and enhance teachers' performance. Formal induction programs that
provide systematic and sustained assistance in the form of guidance from experienced teachers,
additional training, and individualized feedback can produce the long-term benefits of reducing
frustration, isolation, burnout, and ultimately attrition.2 With regular support from more-expert
mentor teachers that focuses on classroom practice, beginning teachers are more likely to
transition from a focus on discipline and classroom management concerns to concerns about
teaching and learning.3
In this chapter, we begin our examination of teacher learning opportunities in California
with four questions: What is the state doing to support new teachers during the crucial first year?
What do districts do to support new teachers? What kind and how much support do new
teachers receive? What is the quality and impact of that support? We conclude the chapter with
a discussion of the issues involved in scaling up induction support to all new teachers in the state.
State Policy in Support of New Teachers
Policy-makers in California have long recognized the need to support beginning teachers.
For more than a decade, the state has funded efforts to help teachers through the induction
period. The state's initial effort was an extensive pilot study known as the California New
Teacher Project (CNTP). The CNTP tested alternative models of providing support for
beginning teachers by funding local pilot projects throughout the state. Findings from the CNTP
indicated that effective induction programs could reduce attrition among first- and second-year
teachers by two-thirds. One leading site in Santa Cruz has found that close to 90% of its
participants are still in teaching 7 years later. 4 The CNTP also found that retention rates
improved for minority teachers and teachers working in urban and rural areas. Moreover, new

teachers who participated in induction programs reportedly developed skills to plan complex and
challenging instructional activities .5
On the basis of findings from the CNTP, guidelines for supporting beginning teachers were
developed, and the Beginning Teacher Support and Assessment Program (BTSA) was authorized
by SB 1422 in. 1992. SB 1422 called for "the gradual phase-in of support and assessment for all
beginning teachers in California."6 The state has been working toward this goal: following 4
years of slow growth, the BTSA budget was nearly quadrupled in 1998-99 to bring the program
"to scale," that is, to provide sufficient resources for all new teachers to receive support (Table
5-1). In addition, SB 2042 (1998) requires that teachers beginning their employment in school
year 1999-2000 go through some formal induction experience to receive a clear credential.
Table 5-1BTSA Funding and Participant History
Year FundingNumber ofPrograms
Estimated Number ofNew Teachers
Supported
1992-93 $4.9 million 15 1,100
1993-94 $4.8 million 30 2,300
1994-95 $5.5 million 30 1,900
1995-96 $5.5 million 29 1,900
1996-97 $7.5 million 32 2,000
1997-98 $17.5 million 73 5,500
1998-99 $67.8 million 83 12,410
1999-00* $72.0 million 150 23,500
Sources: Mitchell et al. (1997); Bartell and Ownby (19941; Governor's Office of ChildDevelopment and Education (May 1998); Wright (1998).*Figures for 1999-2000 are estimates.
Standards and Assessment in Support of New Teachers
BTSA has been an integral part of the developrhent of standards to guide both the teaching
profession and programs that support new teachers. The bill that established BTSA, SB 1422,
also called for the creation of standards for beginning teachers' knowledge and professional
skills, and the establishment of standards for programs that support new teachers. The resulting
documents are the California Standards for the Teaching Profession (CSTP) and Standards of
Quality and Effectiveness for Beginning Teacher Support and Assessment Programs (or BTSA

Program Standards). Interestingly, what were originally intended to be standards for beginning
teachers evolved into standards that are descriptive of all exemplary teachers. AB 1266 (1997)
requires that BTSA grants go to local programs that foster the skills called for in the CSTP.
AB 1266 also requires that BTSA devise a way to assess beginning teachers that is aligned
with the standards set out in the CSTP. The legislation states that BTSA must "establish an
effective, coherent system of performance assessments that are based on the California Standards
for the Teaching Profession...." In response to this directive, the BTSA Interagency Task Force
formed a design team that developed the California Formative Assessment and Support System
for Teachers (CFASST). This comprehensive assessment process integrates the use of formative
assessment tools with new teacher support and training for support providers. Local BTSA
programs are supposed to use CFASST unless they have a comparable local assessment
instrument. Finally, the state has sponsored a Handbook for BTSA Formal Program Review that
is meant to be used as a tool in both self-reviews and external reviews of BTSA programs.
The Evolving Mentor Teacher Program
As BTSA has grown, a key source of support providers for novice teachers has been the
ranks of the California Mentor Teacher Program (CMTP). The CMTP was established by the
Hughes-Hart Educational Reform Act of 1983 (SB 813) with the primary purpose of
encouraging exemplary teachers to stay in the classroom by providing them additional
compensation ($4,000 per year), as well as additional professional opportunities.8
Historically, the CMTP was funded at a much higher level than BTSA, rising from $67
million in 1990-91 to $80 million in 1998-99. Although no statewide figures exist, it is widely
reported that many of the 11,000 CMTP teachers have served as support providers to teachers in
BTSA.9 In many districts, the two programs are coordinated to ensure a higher level of service
for novice teachers.
In the 1999 special session of the legislature, AB1X 1 essentially eliminated the California
Mentor Teacher Programmaking it inoperative in July 2001 and repealing it as of January
2002. The legislation replaces the CMTP with the California Peer Assistance and Review
Program for Teachers (PAR)a peer review and assistance program for veteran teachers. The
law does clearly state, however, that the primary function of a mentor is to provide "guidance
and assistance to new teachers" and makes funds available under the statute (which includes
those funds previously allocated to the CMTP) to be used in support of BTSA. Although PAR is
not yet in place in districts, the legislative language, combined with additional funds allocated for
PAR, makes it likely that the new law will not result in the diversion of mentor teachers away
from supporting novice teachers.
Issues in Understanding State Induction Support
Taken together, these various initiatives create the potential for a coherent system of
support for novice teachers. California requires that teachers go through a formal induction
experience to receive a clear credential, has created standards to guide such programs and
provides funds to support them, has supported model induction programs throughout the state,
and has brought together the lessons from many of those models in the CFASST system.
Justifiably, California's support for induction is held up nationally as a systemic approach to
supporting new teachers.'°
Yet it is too soon to tell exactly how these recent policy changes will interact at the district
and school levels. Full funding for induction has been in place for only one school year, the
requirement that all new teachers participate is being phased in, and the future impact of PAR is
unknown. Data from both the statewide teacher survey and the case studies of local systems of
teacher development provide a portrait of a system in flux. Our data were collected during the
period of BTSA scale-up: survey data generally refer to teachers' experiences in school year
1997-98, whereas the case study data come from school year 1998-99. Although the induction
landscape continues to evolve, our findings provide, insights into issues associated with the
expansion of BTSA. We turn to these findings next.
District Induction Support
Given the rapid growth in state support for new teachers, district induction programs are
evolving, growing, and becoming more formalized. At this point, the statewide picture is one of
wide variation across districts in the degree and nature of support. This variation reflects in part
the state tradition, from the very beginning of the California New Teacher Project, to encourage
locally designed programs. As a result, early induction efforts, whether funded by the state or
not, varied widely in howand in how muchbeginning teachers were supported. Local
programs varied from quick orientation workshops to full-time support providers working with
new teachers throughout the school year. In many districts, of course, induction also included
informal relationships among individual teachers at the school site. The composition of the
support cadre varied across districts, as well, with some opting for full-time support providers
and others for part-time mentors.
The typical district induction program, pre-BTSA scale-up, combined some kind of formal
district orientation, formal mentor support for a limited number of beginning teachers, and
informal and ad hoc support for other teachers through the school year. For example, Selma
Unified has long held a new teacher workshop for a few days at the beginning of each school
year, which introduces new teachers to the profession and then gives them some pointers on
classroom management.
Santa Monica similarly has had a district orientation. Since 1997-98, the district also has
assigned formal mentors to most school buildings. District funds are used to hire substitutes so
teachers can observe others' classrooms and mentors can observe new teachers in action. New
teachers are also welcome to participate in teacher inquiry groups, Santa Monica's primary
professional development vehicle. Although the inquiry groups do not necessarily provide
specific teaching ideas or materials, which beginning teachers commonly say they need, new
teachers find participation in the groups valuable because it involves them in "the life of the
whole school." In the case of both Selma and Santa Monica, strong networks of informal support
augment the district-sponsored efforts.
The Beginning Educators Support Team (BEST) Center in Elk Grove, which predates
BTSA expansion by more than 5 years, provides another example of a balance between the many
purposes of induction.
Elk Grove's BEST Center
The BEST Center in Elk Grove runs two simultaneous programs, one for elementaryteachers and one for secondary teachers. Its programming is designed to provide anoverview of district-specific standards, curriculum frameworks, and rules and regulationstargeted at the balance of newly credentialed and experienced teachers who compriseEGUSD's new hires each year. Two master teachers lead each grade-level group at theelementary level. Two and a half introductory days for elementary teachers include a halfday of orientation to the district, 1 day of reading and language and instruction, and 1 day ofclassroom management. These are followed up with eight monthly meetings: five meetingsare 3 hours long and feature a presentation, usually by a district-level administrator, andgrade-level discussion groups focused on the topic of the presentation; the other threemeetings focus on classroom issues and are held at a master teacher's classroom (studentsare not present). Explained the elementary master teacher coordinator, "The new teachersspend 85% of their time on reading, language arts, and math [in the classroom]. In additionto classroom management and effective teaching, they are the main things to focus on:taking the [content] standards and benchmarks and resources and figuring out how do youstart with that and where go from there. The main concern is that classroom management isin place so that they can teach. That's why we have 3 hours focusing on classroommanagement, and everything after that returns/alludes to that." A host of other topics aretouched on, including parent communication and involvement, English languagedevelopment, test administration, evaluation, clear credential application, and formulating apersonal growth plan.
Through participation in BTSA, both Selma and Elk Grove augmented their traditional
programs with more formal efforts reaching out to a greater number of first- and second-year
teachers, with each new teacher formally assigned a mentor who works with him or her
throughout the school year, following the materials for the California Formative Assessment and
Support System for Teachers.
Both Elk Grove and Selma use veteran classroom teachers as support providers who take
on this role in addition to their regular classroom duties. An alternative induction program
model relies on full-time support providers who have been released temporarily from their
regular teaching duties. For example, LAUSD has approximately 10 full-time BTSA support
providers, whose primary responsibilities are to support new teachers in schools that do not have
adequate numbers of mentor teachers.
The decision to release teachers full-time or to compensate full-time teachers for extra duty
has implications for the ways in which new teachers experience induction support. Support
providers whose primary responsibility is teaching their own students often do not have the
93
u 0

opportunity to work with new teachers in the classroom. Even when mentor teachers are given
release time during the day and their mentees work at the same school, making it is possible for
the mentor teacher to go to another classroom, mentor teachers typically do not want to leave
their own students. Thus, new teachers have fewer opportunities to receive direct feedback on
their instruction, and conferencing between support providers and new teachers most often
occurs at the end of a full day of teaching.
In contrast, full-time released teachers, whose main responsibility is the development of
new teachers' techniques and knowledge, have more flexibility in working directly in the
classroom with novices. Below we describe how full-time support providers in LAUSD support
new teachers.
Activities of LAUSD's Full-time Support ProvidersFull-time LAUSD support providers assist new teachers one-on-one in the classroom,typically once every week for 2 months at a school before moving to another school lackingsufficient mentors. Support providers do classroom observations using the CSTP standardsfor classroom environment, recording what they see and hear, and then holding a dialoguewith the teacher based on the script. They model teaching for the new teacher or take overone of the small groups. Explained one BTSA Advisor, "Frequently, you take over a smallgroup, having discussed the lesson beforehand with the teacher, then you debrief aboutwhat happened. Other things usually come up, and you can explain the way you stand backand be a facilitator, the language you use, how to show respect to students. But also I'vewalked in more than once when somebody is dying up there. Sometimes it's not their fault;for example, they're in an auditorium and all they have is a blackboard and pointer, so I'vetaken over and used some old tried and true strategies that they don't know. So you throwthem a life preserver. We recognize that teachers are developmental."
The Santa Cruz New Teacher Project, which we did not study directly as part of this work,
also uses full-time support providers, who themselves receive a significant amount of
professional development and who in turn focus solely on building the skills of new teachers.
This kind of support is virtually impossible for a full-time classroom teacher to provide as a
mentor teacher because he/she typically does not have enough release time.a
Extent and Nature of Induction
Given the differentand evolvingapproaches to induction across California districts,what kind of support do new teachers receive? Overall, support for novice teachers in California
is widespreadand was so even before the scale-up of BTSA. In the 1998-99 statewide survey,
94% of teachers with less than 5 years of teaching experience report having received some form
94 101

of assistance during their first 2 years of teaching (Table 5-2). About half of the new teachers
report receiving such support through a formal program; about half of theseor 28% of the total
pool of new teachersreport participating in BTSA. We know from the case study data and
from statewide figures that the number of teachers receiving support through BTSA expanded
during the 1998-99 school yearmore than doubling, according to state figures (see Table 5-1).
Table 5-2Type of Support Offered New Teachers
Type of Support forNew Teachers
Percent of AllBeginning Teachers
Any support 94
Support through a formal state ofdistrict program
52
BTSA 28
Other formal program 24
Source: SRI statewide teacher survey. Data refer to school year 1997-98.
Characteristics of Induction Programs
By far the most common type of support provided new teachers is the opportunity to attend
workshops specific to themmore than 7 out of 10 new teachers report attending such activities
(see Figure 5-1). From our case studies, we know that such workshopsespecially toward the
beginning of the school yearare typically focused on district policies and procedures, as well
as on issues regarding classroom management.
Support for new teachersimportantlyalso involves assignment to a mentor (68%) and
providing time for new teachers to observe other teachers (55%) and to meet with other teachers
(50%). Such opportunities are crucial because much of what teachers learn about their craft is
"learned on the job," and it is through their interaction with others that they can become self-
critical practitioners." Time to meet with others can also serve to break down the traditional
barriers created among teachers by classroom walls and bell schedules.
Novice teachers are bombarded with new responsibilities and, in some systems, are likely
to get the most challenging assignments. We find that induction programs, whether funded
through BTSA or not, rarely provide reduced duties (9% overall). In some instances, school
principals and department chairs work to ensure that a new teacher's assignment is not overly
burdensome, but none of the case study sites addressed the negotiated right of more senior
teachers to request specific assignments, often leaving the most challenging to teachers new to
95
102
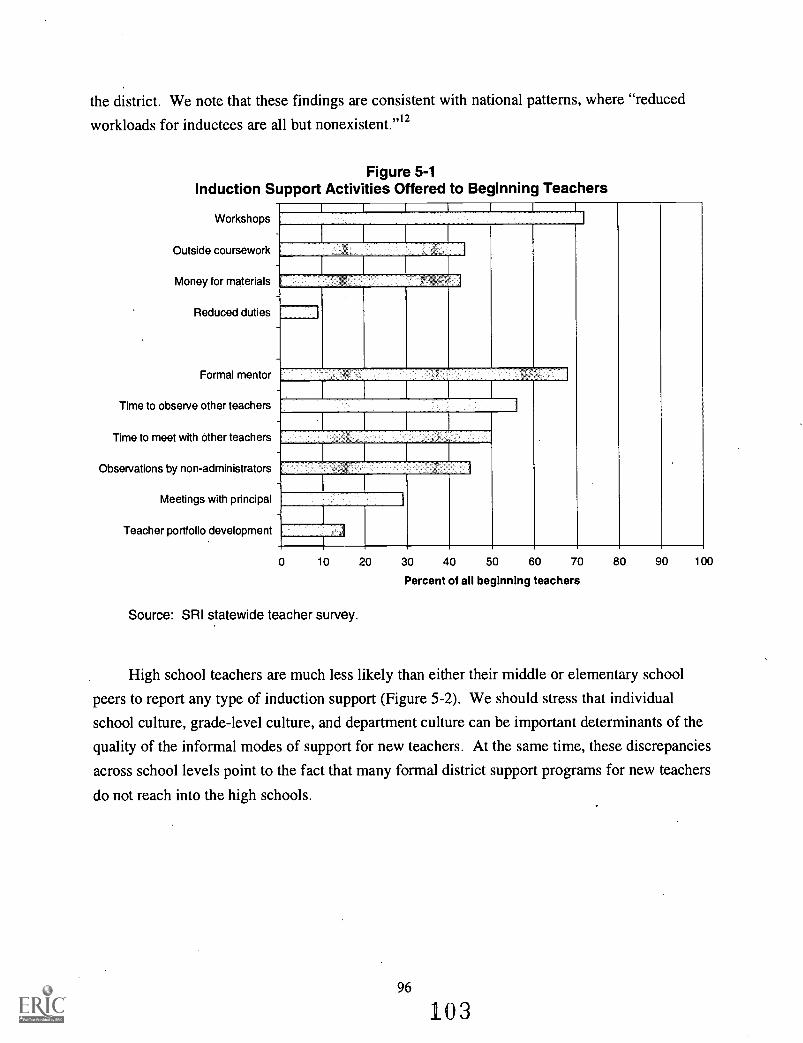
the district. We note that these findings are consistent with national patterns, where "reduced
workloads for inductees are all but nonexistent."I2
Figure 5-1Induction Support Activities Offered to Beginning Teachers
Workshops
Outside coursework
Money for materials
Reduced duties
Formal mentor
Time to observe other teachers
Time to meet with other teachers
Observations by non-administrators
Meetings with principal
Teacher portfolio development
0 10 20 30 40 50 60 70
Percent of all beginning teachers
Source: SRI statewide teacher survey.
80 90 100
High school teachers are much less likely than either their middle or elementary school
peers to report any type of induction support (Figure 5-2). We should stress that individual
school culture, grade-level culture, and department culture can be important determinants of the
quality of the informal modes of support for new teachers. At the same time, these discrepancies
across school levels point to the fact that many formal district support programs for new teachers
do not reach into the high schools.
96
103

Figure 5-2Significant Differences in Induction Support, by School Level
School/district workshops fornew teachers
Regular meetings with othernew teachers
Regular meetings withprincipal
Teacher portfoliodevelopment
Reduced duties
0 10 20 30 40 50 60
Percent of new teachers
El High Middle 0 Elementary
70 80
Note: Chi-square tests between school levels significant at p<=0.05 for activities shown.Source: SRI statewide teacher survey.
90 100
Intensity of Induction
It is encouraging that a large percentage of novice teachers receive some type of induction
support and that for a majority of these, such support offers opportunities for collaboration with
other teachers. But how often do teachers engage in these activities? In Figure 5-3, we show
teachers' reports of the frequency of various actions by their mentors or support providers. The
general pattern is that mentors and support providers interact with their beginning teachers
infrequently. For example, close to 60% of beginning teachers report that their mentors observed
their classroomsbut only 16% report that such observations occurred at least monthly.
Similarly, whereas 43% of beginning teachers report that their mentors demonstrated lessons,
only 7% report that such demonstrations took place at least monthly.
97
104

Figure 5-3Mentor Support Activities for Beginning Teachers, by Frequency of Activity
Prepared/sent materials
Visited and talked aboutclass
Talked aboutstrengths/needs of
students
Conducted formalobservations
Helped plan lessons
Demonstrated lessons inthe classroom
Helped develop aprofessional growth plan
0 10 20 30 40 50 60 70 80 90 100
Percent of new teachers
0 Once or a few times At least monthly
Source: SRI statewide teacher survey.
The infrequency of such support activities is not surprising. From our case studies, we
know that most mentors and support providers are stretched thin. In many induction programs,
support providers are practicing teachers who are helping beginning teachers in addition to
carrying a full teaching load. Observing a mentee's class then requires that the mentor find
someone to cover his or her class. In addition, matching beginning teachers with available
mentors in the same field and the same grade level is often difficultespecially in the same
school. When teachers are paired across schools, the travel burden further reduces their
interaction.
98
105

Quality of Induction
The primary goals of induction support are to increase the quality of teaching and to retain
teachers in the profession. We would expect a high-quality program to have impacts in both of
these areas. Although we did not research teacher retention in this study, we did ask teachers to
report on the impact of their induction experiences on their teaching skills and other professional
competencies. In general, teachers report moderate impacts (Figure 5-4). Not surprisingly, high
school teachers, who get less formal induction support, also see less impact of induction on their
professional lives in every category of effectiveness that was asked in the survey.
Figure 5-4Perceived Overall Effectiveness of Induction Support
Feel relaxed/confident inparent contacts
Feel relaxed/confident inclassroom
Feel effective in classroom
Understand way school/districtworks
Develop collaborativerelationships with other
teachers
Ask for additionalhelp/feedback
Source: SRI statewide teacher survey.
2 3 4
Mean effectiveness score (1=not at all; 5=a lot)
Teachers' perceptions of the effectiveness of their induction experiences differ, depending
on the nature of those experiences. Beginning teachers whose induction supports include
opportunities to observe and be observed by peers rate their overall induction experience as more
99
106
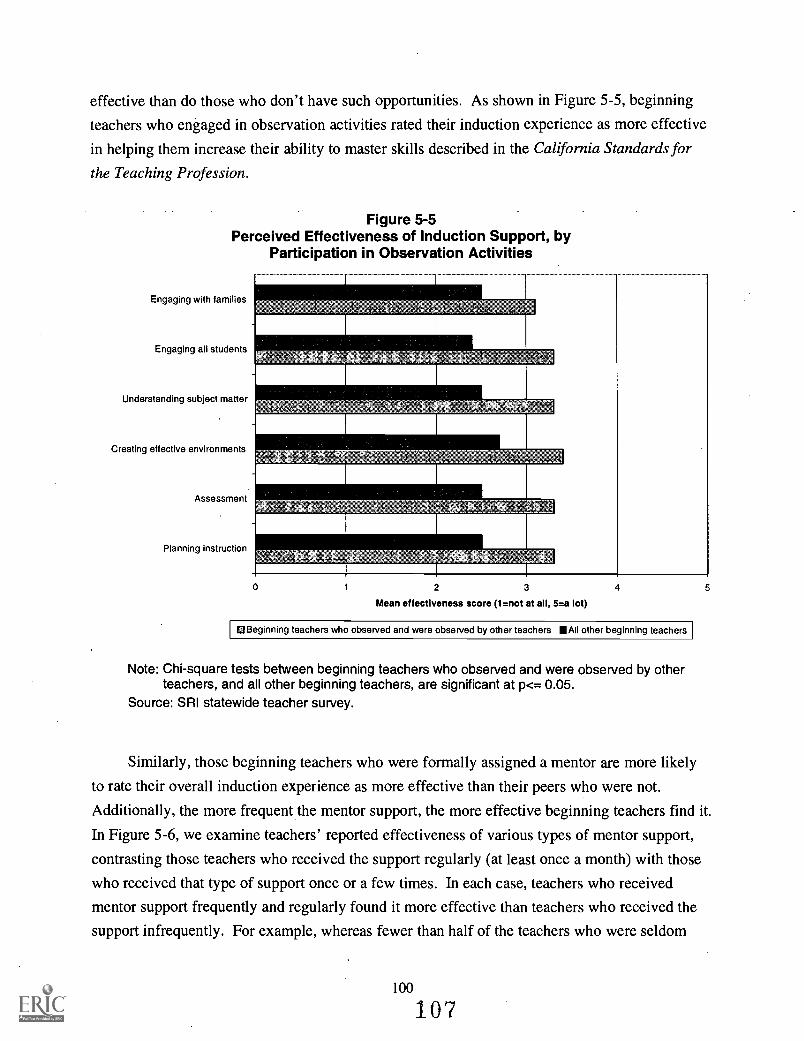
effective than do those who don't have such opportunities. As shown in Figure 5-5, beginning
teachers who engaged in observation activities rated their induction experience as more effective
in helping them increase their ability to master skills described in the California Standards for
the Teaching Profession.
Figure 5-5Perceived Effectiveness of Induction Support, by
Participation in Observation Activities
Engaging with families
Engaging all students
Understanding subject matter
Creating effective environments
Assessment
Planning instruction
0 2 3
Mean effectiveness score (1=not at all, 5=a lot)
4
D Beginning teachers who observed and were observed by other teachers All other beginning teachers
Note: Chi-square tests between beginning teachers who observed and were observed by otherteachers, and all other beginning teachers, are significant at p<= 0.05.
Source: SRI statewide teacher survey.
Similarly, those beginning teachers who were formally assigned a mentor are more likely
to rate their overall induction experience as more effective than their peers who were not.
Additionally, the more frequent the mentor support, the more effective beginning teachers find it.
In Figure 5-6, we examine teachers' reported effectiveness of various types of mentor support,
contrasting those teachers who received the support regularly (at least once a month) with those
who received that type of support once or a few times. In each case, teachers who received
mentor support frequently and regularly found it more effective than teachers who received the
support infrequently. For example, whereas fewer than half of the teachers who were seldom
100
107

observed by their mentors or support providers found the support "very effective," 100% of
those teachers who were observed at least monthly did so.
Figure 5-6Percent of Beginning Teachers Reporting Mentor Support Activities as Helping Them
Feel Effective in Classroom, by Frequency of Activity100
90
80a).c13 70
Ea o
oy60
CU
(/)co
> 50
r, was
rn
>40ct
O a)O. 30
O 20P-a)
10
0
Visited class Formal Talked about Professional Demonstrated Preparedobservation observation development lessons materials lessons students
plan
Mentor activities
Helped plan Talked about
-4Once or a few times -41At least monthly
Note: Chi-square tests significant at p<= 0.02 for all mentor activities except demonstratedlessons (p=0.06) and prepared materials (p=0.07).
Source: SRI statewide teacher survey.
The general pattern from the survey and case study data is clear: the vast majority of
beginning teachers receive some kind of induction support. Although the type of support
reported by the greatest number of teachers involves attendance at workshops, induction support
for many teachers includes opportunities to observe, be observed, and collaborate with their
peers and mentors. Yet such experiences are infrequent, typically not taking place on a regular
basis. Teachers who have opportunities for peer observation, who are formally assigned
mentors, and who engage with mentors in frequent support activities are uniformly more likely
to report those experiences as effective.
101
108
The Changing Landscape: The Expansion of BTSA
As California districts and schools are now faced with the availability of much more money
to support induction efforts and the requirement that all their new teachers soon go through an
induction program, we find them building on these previous efforts to formalize their programs
and take them to scale. We visited schools and districts during the first year of the BTSA scale-
up and observed very uneven and stuttering efforts to structure support for all new teachers. In
this section, we highlight how induction programs are evolving in districts with the expansion of
BTSA. We discuss the issues involved in reaching larger numbers of novice teachers,
formalizing what had been an informal process in many districts, finding a sufficient number of
support providers, and integrating the growing BTSA programs into ongoing reform efforts in
the district.
Scaling Up BTSA
Regardless of how districts supported new teachers in the past, they are all changingor
planning to changetheir approach, given the infusion of dollars into BTSA and the
requirement that all new teachers soon go through a formal induction process. Districts begin
the scaling-up process on different trajectories based in part on the supports they provided to
their new teachers in the past. In some cases, typically where the needs are the lowest (fewer
new teachers, strong informal supports in place), districts are still in the planning stage. El
Centro and Santa Monica had not begun a BTSA program at all, though they had just received
or were in the process of applying for BTSA grants. Few teachers in Eureka participate in the
BTSA program housed in Del Norte County. In these cases, new dollars are welcome, but there
is not a sense of urgency to implement a formal program. In other sites, however, big changes
are under way. In general, these changes are taking two forms: increasing the number of
teachers served and formalizing previously informal arrangements.
BTSA dollars and new credentialing requirements have pushed districts to serve more
teachers. Again, in districts with few new teachers, the scale-up is rather straightforward. Selma
quickly designed a program and is serving all its 40 new teachersas well as a few from
surrounding districts that have not yet put together a program. But in other districts, the numbers
are daunting. San Diego's BTSA program has traditionally served 70 to 90 teachers. In 1998-
99, that number was increased to 500, with the goal of reaching 1,100 in school year 1999-2000.
But the district has 1,700 first- and second-Year teachers, so the program still has a way to go.
San Francisco increased its participants from 50 to 180 teachers in 1998-99, but it has close to
1,000 first- and second-year teachers. Elk Grove served 53 teachers in 1998-99, its second year
102
109
of BTSA implementation, but this again is only a fraction of the hundreds of first- and second-
year teachers in the district.
Formalization of the BTSA Process
The receipt of BTSA dollars and/or the scale-up of previous induction efforts has also
resulted in the formalization of what was in many districts a relatively informal process. First,
there is slow movement toward mandating participation in the district's induction program.
Among our case study sites, only Selma has taken this step so farbut, of course, that is the only
site with a BTSA program that has the capacity to serve all its new teachers. In the other sites,
administrators are struggling with how to transform what was traditionally a volunteer program
and make it part of a new teacher's required duties. For example, San Francisco's BTSA
program has a number of strong components, including a series of required full-day Saturday
workshops. Among the volunteer participants, the workshops are highly valued; as one
participant described, "The first Saturday workshop was on the physical environment of the
classroom. It was great. Outside consultants gave the workshops. We looked at slides of other
people's classrooms, what they looked like, the math area, the reading area. How to get
everything organized." But will it be feasible to holdand requiresuch workshops for nearly
1,000 teachers?
As they reach larger numbers of beginning teachers, local induction efforts also struggle
with formalizing what often were informal ways of supporting new teachers. As Santa Monica
plans for a BTSA grant, it is considering how to adapt its current support structure, which relies
on individual school-based mentors who provide varying degrees of support to teachers,
depending on the mentor's perception of need, to create a more formal one with district oversight
and a formal assessment component, as required by BTSA.
As noted earlier, both Elk Grove and Selma have already begun participation in BTSA. In
both places, one support provider, who is a full-time teacher, ideally serves two beginning
teachers. Beginning teachers are expected to meet with their support providers weekly to
complete the CFASST portfolio. Support providers meet monthly to voice their concerns and
reflect on their roles as mentors. Meeting times are generally arranged by each mentor/mentee
pair on their own schedule, although Selma reserves one early release day per month for BTSA
meetings, and Elk Grove designates five to six meetings throughout the school year for
participating beginning teachers and support providers to work together.
Reactions from new teachers participating in these well-structured programs are mixed.
Teachers generally like the communication with their mentor. One participant noted:
103
110

"The best thing about BTSA is the one-on-one mentor. If you're fortunate, you havesomeone who really listens. [My mentor] is a very good teacher. We e-mail backand forth. We're supposed to meet once each week, but we teach on differenttracks...."
Yet some teachers report that the CFASST process turns into a paperwork burdenand at times
can become an end in itself. "I get tired of filling out those forms every time I see my mentor,"
noted one teacher. A number of teachers note that they would have preferred to have an informal
mentor at the school site and "forget all the paperwork."
The formalization of the induction process certainly facilitates the definition and
communication of these activities to large numbers of beginning teachers and support providers.
The paradox that faces districts, however, is that as districts recruit more and more beginning
teachers into BTSA, the range of teachers' needs increases, and this variation in needs is
increasingly met with a highly standardized, though well-developed, program that may not
sufficiently reflect individual needs and concerns.
Capacity Issues
The number of teachers participating in BTSA will increase tenfold from school year 1996-
97 to school year 1999-2000, and it will have to nearly double again to reach all new first- and
second-year teachers. A scale-up of this magnitude necessarily strains the capacity of the
systemin terms of both quantity of support providers and the quality of their work. Because
the distribution of new teachers is uneven, the challenge of the scale-up is much greater in some
districts than in others.
In San Diego, the district had used full-time resource teachers to provide direct support to
the most needy new teachers, while full-time classroom teachers served as traditional support
providers to other new teachers. As the program grew, the full-time teachers were given three
new teachers to work with instead of two. The results were quite poor: overworked support
providers and unsupported teachers. As the district scales the program up further, it is going to
use its full-time resource teachers to help the support providers, who, in turn, will be assigned
only two beginning teachers each. The problem with this strategy is that it requires close to 900
support providers, nearly one out of six veteran teachers in the district.
The magnitude of the challenge facing local districts depends on how many new teachers
they have relative to veterans and on how "new" those new teachers arewhether they are new
to the profession or just new to the district. For example, El Centro in the Imperial Valley hired
approximately 24 teachers in 1998, but most of them had a few years of experience in
surrounding districts. Similarly, Eureka hires only a dozen new teachers a year and is able to
104
111

pick and choose among the best of hundreds of applicants. In contrast, Elk Grove, in the suburbs
of Sacramento, hired approximately 500 in 1998-99a full quarter of its teaching force. But
because of its strong recruitment program, only 35% of these were teachers new to the
profession. In San Diego, the story is mixed. Most schools have low turnover and few new
teachers; some hard-to-staff inner-city schools are forced to hire proportionally more teachers
and to use more interns and emergency-permit teachers. LAUSD hired almost 4,000 new
employees in 1998. As we have detailed earlier in the report, 75% of these are on emergency
permits, waivers, or internship credentials. Only 9% of the new hires are newly credentialed
teachers; the remaining 16% are credentialed reentrants.
Districts with disproportionately few new hires or with new hires who are predominantly
experienced teachers face much less of a challenge. They have few teachers to serve, the
teachers already know how to teach and so have fewer needs, and there are more veteran
teachers to provide support. Consequently, in districts like Santa Monica, El Centro, and
Selmawhere these conditions holdinduction has traditionally been a more informal
arrangement. Support has been provided through principals and-school teams, augmented by
orientation sessions from the district.
Faced with large numbers of new teachers or high proportions of teachers new to the
profession, districts traditionally have been forced to create more formal structures for induction
support. In Elk Grove, the BEST Center is a centralized effort to uniformly support all new hires
each year. In LAUSD, the sheer number of new hires throughout the year and the predominance
of emergency permit holders require that the district run its Teacher Academy for new teachers
every week without break, except Thanksgiving. Nine or 10 sessions run concurrently during the
peak summer months.
Integrating BTSA into Ongoing District Reforms
A final issue facing districts is how to fit BTSA, especially the CFASST system, into other
efforts to foster adult learning in the district schools. Every district in our study had its own
reform thrust and its own strategy for supporting teachers to improve their practice, as we discuss
in the next chapter. Santa Monica has established inquiry groups for teachers, and these groups
set the agenda for professional development. As new teachers are integrated into these
supportive groups, it is not clear where CFASST will fit in.
San Diego has launched a district-wide literacy initiative. At the core of the initiative is the
role of the principal as the key provider of professional development for teachers in the building.
Principals are supposed to spend a good portion of their day in classrooms, and they are going
105112

through extensive professional development themselves. Principals also retain the central role of
evaluating teachers, and that evaluation is supposed to take place in relation to specified district
priorities. The BTSA system, which seeks to have support providers assess teachers relative to
standards other than those in use in San Diego and which excludes the principal from that
assessment process, may clash with the district initiative.
None of these issuesformalization of BTSA, capacity, or integration of reformsshould
stop districts from moving forward with induction programs for new teachers. But as they
advance, it is important to keep in mind the kinds of challenges they will face. Just as
importantly, the state needs to consider these issues in terms of the kinds of support local
districts need and the kinds of regulations that might be difficult to follow.
106113

CHAPTER 6. BUILDING ON THE STRENGTHS OF THE TEACHER WORKFORCE:PROFESSIONAL DEVELOPMENT
What is the nature of teachers' professional development experiences?Teachers participate in a wide spectrum of professional development, but the most common activityis workshops offered by their schools or districts. Those engaging in high levels of professionaldevelopment do so on their own initiative.
Teachers in high-poverty schools are more likely to participate in workshops, are less likely to receivetraining in technology, and participate in activities sponsored by the California Subject Matter Projectsat twice the rate of their counterparts in low-poverty schools.
On average, teachers spend more time on professional development as they gain experience,peaking some time between their 6th and 10th years. Opportunities to mentor novice teachers is animportant source of professional growth for experienced teachers.
What is the content of teachers' professional development opportunities?The most common focuses of professional development tend to be new curriculum and technology.
Elementary school teachers participate in more professional development during the year, primarilybased on school and district initiatives in early literacy. Middle and high school teachers seeksubject-matter-specific activities typically provided by professional associations.
How do teachers perceive the quality of their professional development and does it meet theirneeds?
Overall, teachers provide mixed reviews of the quality of their professional development. Fewer thanhalf report that their experiences are sustained and tailored to their instructional areas.
Teachers emphasize the importance of collaborative work between colleagues. However, workplaceconditions in overcrowded, urban, high-poverty schools constrain teachers' ability to collaborate.
Teachers do report greater professional growth as a result of certain types of learning opportunities,such as frequently sharing student work, working together to develop curriculum materials, andobserving each other's classrooms.
109
114

The vast majority of teachersmore than a quarter millionare "veterans" who teach
most of California's schoolchildren. Creating learning opportunities for the state's students to
reach high standards will require opportunities for these experienced professionals to learn, as
well. The state has established a research-based vision of high-quality professional development
that calls for opportunities for teacher learning characterized by a focus on using data about
student learning, expanding teachers' instructional repertoire and content knowledge, and
providing for collaboration, collegial work, and reflection.'
In this chapter, we explore California's teachers' current professional development relative
to this vision. We explore three key questions: What is the nature of professional development
opportunities that teachers currently have, and how do they differ for various groups of teachers?
What is the content of their professional development? What is teachers' perception of its
quality and does it meet their needs?
Nature of Professional Development
Teachers in California have access to a broad constellation of professional development
opportunities, ranging from specific skills training to reflection within a community of
practitioners, from one-shot events to intensive experiences sustained over time, and from
activities mandated for all teachers within the school or district to teachers' choice to participate
as individuals without colleagues from the same school community.
Teachers, on average, report that they engaged in 122 hours of professional development,
defined broadly, in 1997-98, equivalent to approximately 3 work-weeks or about 2 hours and 20
minutes per week throughout the year. This time includes professional development activities
sponsored by the school or district (e.g., workshops, committee work related to curriculum and
instruction), activities conducted by outside providers (e.g., NCTM and other subject matter
associations, California Subject Matter Projects), and activities that teachers select and complete
independently (e.g., professional reading, individual research, graduate and extension courses).
Although teachers face a wide range of options, the most common forms of professional
development are workshops. Ninety-two percent of teachers participated in workshops led by
school staff and 87% in workshops led by district or external trainers. Participants averaged 19
hours for each type of workshop. An impressive majority (74%) report that they have regularly
scheduled collaboration with their colleagues; however, the amount of time averages a mere 44
minutes per week for those who have it at all (see Table 6-1).
110
115

Table 6-1Professional Development Activities Reported by Teachers
Activity
Percent ofTeachers
Participating
AverageAnnual Hoursper Participant
Workshops and training designed and/or led byschool staff
92 19
Workshops and training designed and/or led byoutside consultants or district/county staff
87 19
Independent professional reading, not necessarilyfocused on a specific topic
71 35
Activities, such as conferences or working groups,sponsored by subject matter professionalassociations (e.g., NCTE, NCTM)
47 19
University extension or adult education courses,excluding alternative certification programs
29 50
Graduate courses in your academic subject area(s)(e.g., math, science)
18 76
Regularly scheduled collaboration with otherteachers
74 27
School or district committee on a topic related tocurriculum and instruction, including standards,curriculum, and textbook selection committees
61 16
Individual or collaborative research on a topic ofinterest to you professionally
37 37
Activities sponsored by one or more CaliforniaSubject Matter Projects (e.g., Writing Project, MathProject)
22 25
Source: SRI statewide teacher survey.
Teachers reporting high amounts of professional development in 1997-98 (more than 145
hours) tend to supplement workshop experiences with more extensive involvement in graduate
and extension courses, the California Subject Matter Projects, research, or independent
professional reading. In contrast, teachers reporting low levels of professional development
(fewer than 70 hours) participate primarily in school- or district-sponsored workshops for fewer
hours, on average. Underlying these state averages, important differences in the nature of
professional development occur between low- and high-poverty schools and between teachers at
different stages of their careers.
111

Differences in Professional Development between Low- and High-Poverty Schools
In Chapter 3, we described the high concentrations of underqualified teachers in high-
poverty schools, where the students have the greatest instructional needs. Are there also
differences in teachers' professional learning experiences at high- and low-poverty schools? A
greater percentage of teachers at high-poverty schools (93%) than teachers of low-poverty
schools (83%) report participating in workshops conducted by individuals outside of their school
community suggesting a slightly greater reliance on outside expertise. Further, teachers in low-
poverty schools report far more training in education technology than do teachers in high-
poverty schools. In 1997-98, teachers in low-poverty schools averaged 22 hours of training in
education technology, almost triple the 8 hours teachers in high-poverty schools received. These
findings suggest that high-poverty schools have somewhat less capacity to build the skills of
their teachers.
On the other hand, the California Subject Matter Projects, which are generally considered
high quality, intensive, and subject matter focused, reached 31% of teachers from high-poverty
schools in 1997-98, double the percentage of teachers in low-poverty schools. Under new
legislation, the CSMPs are required to hold 75% of their positions open for teachers from low-
performing schools. Given the correlation between low-performing schools and high poverty
levels, we would expect to see the percentage of teachers from high-poverty schools participating
in CSMP-sponsored events to increase over time, and thus a larger investment in the teachers in
high-poverty schools.
Professional Development Needs during Different Stages of Teachers' Careers
As teachers gain experience, the extent and nature of their professional development
changes, probably because of shifting incentives and needs over various stages of their careers.
First, we observe a steady increase in the total amount of professional development from
teachers in their first 2 years of teaching to teachers with 3 to 5 years of experience, peaking
when teachers are in their 6th to 10th years of teaching. The development process for novice
teachers is marked by high workshop involvement as they seek improved instructional skills and
effective classroom activities, as well as attendance in graduate courses, presumably to complete
the requirements for a preliminary or professional clear credential. At the height of teachers'
participation in professional development, they engage in training with outside experts and
revisit graduate coursework, perhaps to obtain a master's degree or advanced or additional
certification (e.g., BCLAD/CLAD, special education, new teaching assignment).
112
117
Teachers with more than 10 years experience report fewer professional development
commitments. Typically, those who have reached the top of the pay scale no longer receive any
incentive to attend staff development. We found that veteran teachers report lower participation
in school-based workshops but maintain relatively high involvement in what they view as
collaborative activities. Veteran teachers also told us that the types of professional development
they value, which they feel are different from what less experienced teachers need, are not
offered through typical workshop training. Thus, they tend to be highly selective in participating
in optional district- or school-offered professional development. As one veteran high school
English teacher in a suburban district told us, "I can afford to be choosyI have a clear
credential.... It's not a motivation to take classes to raise my pay; my time is too important."
Often, veteran teachers seek opportunities with outside affiliations that allow them to
develop new roles in their teaching careers. For example, one high school physics teacher in Elk
Grove has become a teacher trainer for California in an applied physics program that has its
genesis in the tech-prep/school-to-career movement. The district spent $6,000 on a 4-week
summer course in Colorado, where she studied every unit of the Principles of Technology
curriculum, and when she returned, she implemented the Principles of Technology program at
her high school for students tracked out of regular high school physics. She usually spends 2
weeks each summer conducting training for other teachers outside of her district. The teacher
finds her work with Principles of Technology deeply meaningful "I know it affects 20 to 30
[students'] lives every year"and her work in training other teachers in this program is integral
to her service to students.
Mentor Teacher Opportunities. One of the few ways that teachers can mark different
stages in their careers is by mentoring novices. Both the National Board for Professional
Teaching Standards (NBPTS) and the California Standards for the Teaching Profession (CSTP)
endorse opportunities to teach colleagues as an important responsibility of accomplished
teachers. In our survey, almost one-quarter (23%) of all teachers have been assigned to support
beginning teachersfor example, as a mentor teacher or BTSA support providerwithin thelast 5 years.
Overall, teachers view their experiences as mentor teachers as positive professional
learning opportunities for them. Approximately two-thirds think that their experience as mentor
teachers helped improve their own instructional strategies (67%) and increased their motivation
and commitment to teach (69%). Approximately half of the mentor teachers feel that
opportunities to observe others (52%) and have others observe them (46%) strengthened their
113118
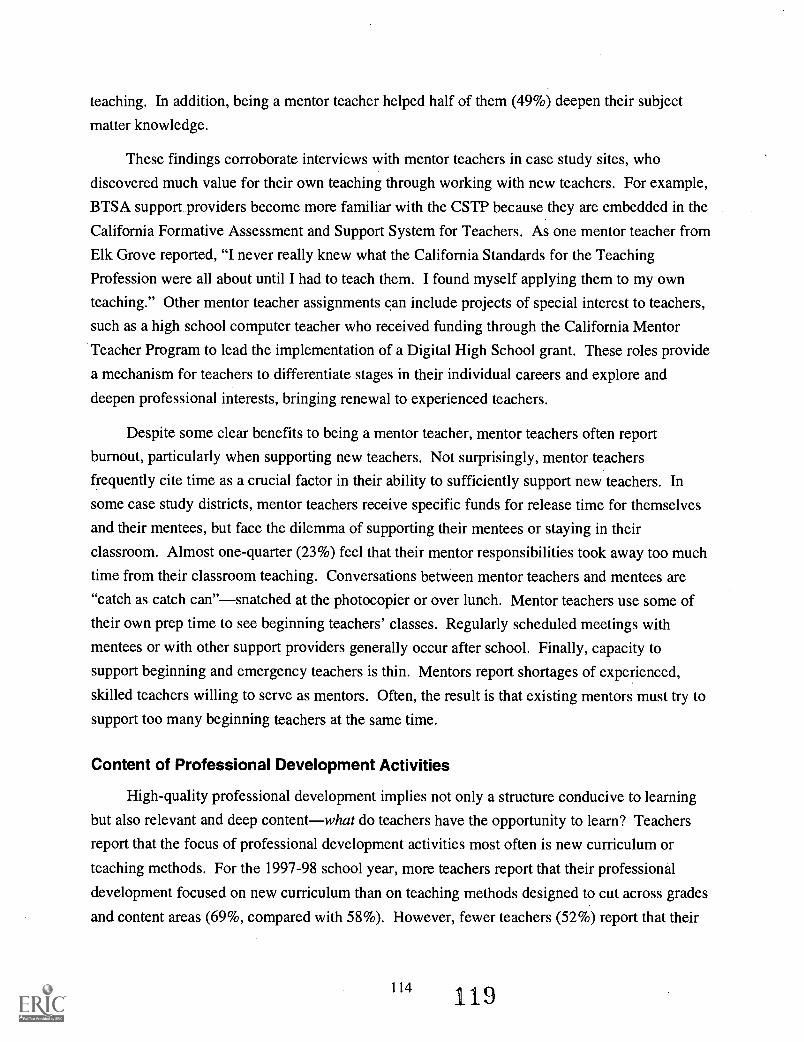
teaching. In addition, being a mentor teacher helped half of them (49%) deepen their subject
matter knowledge.
These findings corroborate interviews with mentor teachers in case study sites, who
discovered much value for their own teaching through working with new teachers. For example,
BTSA support providers become more familiar with the CSTP because they are embedded in the
California Formative Assessment and Support System for Teachers. As one mentor teacher from
Elk Grove reported, "I never really knew what the California Standards for the Teaching
Profession were all about until I had to teach them. I found myself applying them to my own
teaching." Other mentor teacher assignments can include projects of special interest to teachers,
such as a high school computer teacher who received funding through the California Mentor
Teacher Program to lead the implementation of a Digital High School grant. These roles provide
a mechanism for teachers to differentiate stages in their individual careers and explore and
deepen professional interests, bringing renewal to experienced teachers.
Despite some clear benefits to being a mentor teacher, mentor teachers often report
burnout, particularly when supporting new teachers. Not surprisingly, mentor teachers
frequently cite time as a crucial factor in their ability to sufficiently support new teachers. In
some case study districts, mentor teachers receive specific funds for release time for themselves
and their mentees, but face the dilemma of supporting their mentees or staying in their
classroom. Almost one-quarter (23%) feel that their mentor responsibilities took away too much
time from their classroom teaching. Conversations between mentor teachers and mentees are
"catch as catch can"snatched at the photocopier or over lunch. Mentor teachers use some of
their own prep time to see beginning teachers' classes. Regularly scheduled meetings with
mentees or with other support providers generally occur after school. Finally, capacity to
support beginning and emergency teachers is thin. Mentors report shortages of experienced,
skilled teachers willing to serve as mentors. Often, the result is that existing mentors must try to
support too many beginning teachers at the same time.
Content of Professional Development Activities
High-quality professional development implies not only a structure conducive to learning
but also relevant and deep contentwhat do teachers have the opportunity to learn? Teachers
report that the focus of professional development activities most often is new curriculum or
teaching methods. For the 1997-98 school year, more teachers report that their professional
development focused on new curriculum than on teaching methods designed to cut across grades
and content areas (69%, compared with 58%). However, fewer teachers (52%) report that their
114 119

staff development activities focused on teaching methods that are tailored to their particular
teaching assignment. Almost two-thirds (66%) report that their training often focused on uses of
educational technology, and approximately 60% report that activities focused on student
assessment. (See Figure
6-1.)
New curriculum (or instructionalmaterials)
Uses of educational technology forinstruction
Student assessment
Teaching methods that can beapplied across subjects
Teaching methods specificallytailored to your subject field(s)
Classroom management, includingstudent discipline
Figure 6-1Focus of Professional Development Activities
0 10 20 30 40 50 60
Percent of teachers*
70 80 90 100
* Percent of teachers reporting that their PD activities overall had specific focus.Source: SRI statewide teacher survey.
Teachers at different grade levels have different needs that largely influence the focus of
their professional development. Overall, elementary teachers spent 10 more hours on
professional development over the course of the 1997-98 school year than did secondary
teachers. Case study data suggest that the extra professional development time is related to
emphases in reading and early literacy. All of the case study elementary sites provide their
teachers with more extensive workshops focused on early literacy than on any other content area.
115 120

Reading initiatives at the middle and high school levels are less common and less extensively
supported.
In contrast, middle and high school teachers seek content-specific professional
development activities from subject matter associations. High school teachers repeatedly told us
that professional development offered schoolwide did not meet their subject-matter-specific
needs, and they looked to professional associations and conferences to gain more depth in
specialized fields of knowledge. A language arts teacher at the middle school in Los Angeles,
for example, is an expert in reading across the content areas, the writing process, and literary
analysis. The most influential experiences for her professional growth originated outside of the
district, specifically with the California Literacy Project. She also seeks professional
development from National Council of Teachers of English and International Reading
Association conferences and local colleges rather than the district's offerings. In addition, she is
involved in a variety of mentoring and trainer activities. Unfortunately, the high turnover of staff
and the high numbers of emergency teachers at her school mean that this accomplished teacher
has few peers to learn from in her own school community.
We see, then, that teachers face a wide range of professional development opportunities
that vary in both type and intensity. The professional development that teachers receive depends,
in part, on where they teach, how long they have taught, and their grade level. How do teachers
perceive the quality of these professional development activities, are these activities meeting
their needs, and what is the impact of their professional development experiences? We turn to
these questions next.
Quality of Professional Development
California teachers give at best moderate reviews to their professional development.
Although teachers most frequently suggest that they need more time to talk to one another, fewer
than half (46%) report that their overall professional development experiences often or very
often promote collaboration. Only 36% of teachers report that their staff development often
recognizes and builds on their knowledge and experiences. And only about one-quarter (26%) of
California teachers report that their professional development is often sustained over time, with
ample participant follow-up and teacher support. Correspondingly, 42% report that their
professional development is most often a series of single events with little or no follow-up (see
Figure 6-2).

Figure 6-2Prevalence of Certain Characteristics of Professional Development
Promotes collaboration among teachers.
Focuses on subject-matter content.
Recognizes and builds on individual teachers' knowledge and experience.
Is developed and organized by teachers in the school.
Is a good fit with what I need or want in my current teachingassignment(s).
Is sustained over time, with ample participant follow-up and teachersupport.
Is a series of single events with little or no follow-up.
0 10 20 30 40 50 60 70 80
Percent of teachers*
90 100
* Percent of teachers reporting that PD activities reflected specific characteristic often or very often.Source: SRI statewide teacher survey.
The survey data, which case studies corroborate, indicate that disconnected workshops still
dominate the staff development experiences of a majority of teachers. Even though workshops
can be used in effective ways as a component of a coherent training program, part of the problem
with the workshops that teachers currently experience is their typical lack of differentiation for
teachers with varying skills and experiences. Without sufficient time and follow-up to delve
more deeply into the topic and to have opportunities to individualize the training, workshops
must be general, and often are targeted at those in most neednewly credentialed, emergency,
or weak teachers. Typically, veteran teachers characterized their district's menu of workshops as
"watered-down" and "general." One middle school teacher who led reading workshops
observed, "The staff is polite; they listen, but that's about it. They don't do anything with it."
Absent any coherent plan, staff buy-in, and multiple opportunities to discuss, try out, and reflect
on new concepts, teachers feel little impact from such workshops. In a suburban district, a high
school teacher with more than 10 years experience recounted, "In the last 2 to 3 years, I've
logged 100 hours of reading training and reading in the content area. A lot of it is repetitious;
BEST COPY AVAILABLE "122

it's just basic good teaching, but I'm not a new teacher." She went on to articulate the very
dilemma schools and districts face: "Do you develop courses for new teachers or veteran
teachers or touch everyone?" In the same district, another teacher is meaningfully engaged with
national reform efforts like the Institute for Learning at the Learning Research and Development
Center (LRDC), and finds the district's professional development offerings weak. "I've tried to
push the district [to use resources from LRDC], and it did not work. So I've been seeking my
own professional growth outside of the district."
Importance of Collaborative Work
Teachers highly value collaborating with and learning from their colleagues. Instead of
single workshops that provide few opportunities for teachers to exchange ideas, teachers
emphasize the importance of collaboration. "That district speaker may be inspirational, but the
only time I will actually change the way I teach is through working and learning with a team or
colleague at the school," reported one teacher. Teachers consistently reiterate the value of
sharing and learning from each other and the need for more time more frequently to do so. As
one Santa Monica teacher reported about her inquiry group, the major source of professional
development for teachers in that district, "Inquiry is a place to think about things in whole new
ways, so you can redefine yourself as a teacher, and be experimental. This is where I started to
think about teaching as an art form. There are so many different ways to teach a kid something,
why stick with a way that doesn't work? Why don't you look at the kids that you have, really
think about them, and decide how you're going to teach them? For me, inquiry does that."
A collaborative work environment fosters team approaches to problem solving and
permits professionals to seek help from other professionals. In our survey, the majority, almost
three out of four teachers, report that they have regularly scheduled collaborative time. In
general, half to almost 70% of teachers report that they often discuss common problems with
each other. But far fewer engage in substantive collaborative work; specifically, 46% often
share student work, 40% often work together to create curriculum, and only 8% often observe
each other. Indeed, almost one-third (31%) of all teachers report that they "never" observe each
other (see Table 6-2).
Table 6-2 also reveals that, along every dimension, fewer teachers at high-poverty schools
than at low-poverty schools report engaging often in collaborative activities. One explanation
for this difference in work cultures stems from the drastic overcrowding and relatively larger
proportion of new and underqualified teachers in urban, high-poverty schools.
118
123
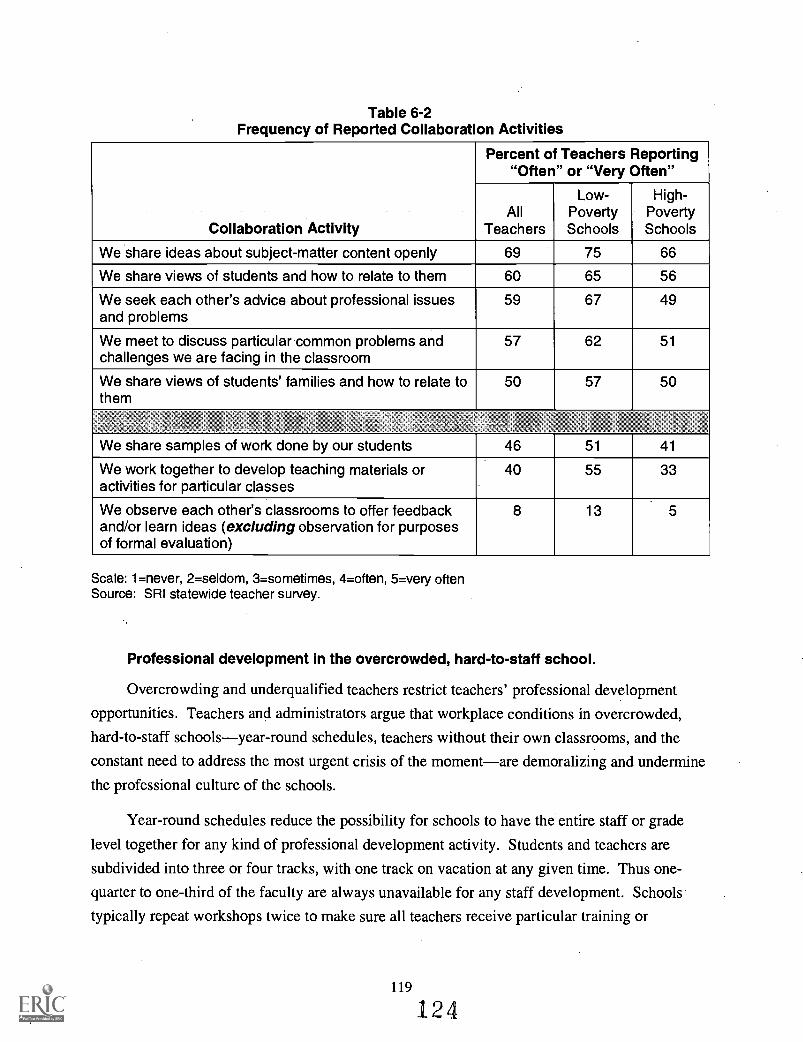
Table 6-2Frequency of Reported Collaboration Activities
Collaboration Activity
Percent of Teachers Reporting"Often" or "Very Often"
AllTeachers
Low-PovertySchools
High-PovertySchools
We share ideas about subject-matter content openly 69 75 66
We share views of students and how to relate to them 60 65 56
We seek each other's advice about professional issuesand problems
59 67 49
We meet to discuss particular common problems andchallenges we are facing in the classroom
57 62 51
We share views of students' families and how to relate tothem
50 57 50
We share samples of work done by our students 46 51 41
We work together to develop teaching materials oractivities for particular classes
40 55 33
We observe each other's classrooms to offer feedbackand/or learn ideas (excluding observation for purposesof formal evaluation)
8 13 5
Scale: 1=never, 2=seldom, 3=sometimes, 4=often, 5=very oftenSource: SRI statewide teacher survey.
Professional development in the overcrowded, hard-to-staff school.
Overcrowding and underqualified teachers restrict teachers' professional development
opportunities. Teachers and administrators argue that workplace conditions in overcrowded,
hard-to-staff schoolsyear-round schedules, teachers without their own classrooms, and the
constant need to address the most urgent crisis of the momentare demoralizing and undermine
the professional culture of the schools.
Year-round schedules reduce the possibility for schools to have the entire staff or grade
level together for any kind of professional development activity. Students and teachers are
subdivided into three or four tracks, with one track on vacation at any given time. Thus one-
quarter to one-third of the faculty are always unavailable for any staff development. Schools
typically repeat workshops twice to make sure all teachers receive particular training or
119
124

information. Sharing among colleagues is further restrained by the schedule. "It's like having
three separate faculties. Buy-back days don't work outside of the instructional year. School is
on all the time. In the past, at least we could juggle things and hold staff development when
everyone was here." In large urban secondary schools, the professional community can be
nonexistent. One teacher says, "You can't get the entire faculty together at the same time. There
are many people on the faculty that I don't know. I don't even know who is a sub and who is a
regular teacher."
A deeper problem of the year-round schedule is the ghettoization of a particular track in
schools with high numbers of new and emergency teachers. Senior teachers usually choose the
track that most resembles the traditional school year. The track that runs through the summer,
with the official year-end on June 30 and the official start on July 1, is the least popular because
teachers end with one group of students and begin with another without a break at all. It is this
track that gets filled with the newest and least-prepared teachers. Thus, veteran and new teachers
work separately from each other, severely hampering the ability of new teachers to seek
mentorship and informal assistance from their more experienced colleagues. Collaborative work
cultures that allow teachers to learn from each other cannot root in such impoverished workplace
conditions.
Meeting Professional Learning Needs of Teachers
Teachers feel that their current professional development activities meet certain curriculum
and instructional needs, while poorly addressing others. Nearly three-quarters of participating
teachers (73%) said that professional development focused on teaching methods tailored to their
content area met their needs (Figure 6-3). Approximately the same percentage of teachers (75%)
said that activities sponsored by subject matter professional associations' were important to their
professional growth. These results match other studies that found that when professional
development is focused on teachers' specific content areas, teachers' needs are better met.2
However, our data also reveal that much more support is necessary to meet teachers' other
instructional needs. In implementing a new curriculum or instructional materials and in using
educational technology, student assessment, or new teaching methods, half of all teachers feel
their needs were met while the other half do not. These relatively low satisfaction rates illustrate
the difficulty of meeting the broad spectrum of teachers' needs, particularly with large-group
activities such as workshops that do not have focused follow-up.
120
125

Figure 6-3Teacher Reports on Content of Professional Development Meeting Their Needs
Teaching methods specifically tailored toyour subject field(s)
Classroom management, includingstudent discipline
New curriculum (or instructional materials)
Uses of educational technology forinstruction
Teaching methods that can be appliedacross subjects
Student assessment
0 10 20 30 40 50 60 70 80 90 100
Percent of teachers'
* Percent of teachers rating 4 or 5, where 1=focus of professional development activities did notmeet needs and 5=focus of professional development activities completely met needs.
Source: SRI statewide teacher survey.
In general, then, teachers do not believe that the professional development activities they
participate in have a substantial impact on them.. Half of all teachers responded that they
received new information from professional development, a relatively low standard of impact,
while 27% reported that they sought further information as a result of staff development, and
17% said that professional development changed their views of teaching. Even more revealing,
one in five teachers think that the professional development they participated in was a waste of
their time (Figure 6-4).
These reports, unfortunately, are in sharp contrast to the vision laid out by the California
Professional Development Reform Initiative and the research on professional development
discussed in the introduction to Part II of this report. This sobering portrait points to the general
lack of effectiveness of professional development from teachers' vantage point. Overall,
teachers face many options for staff development, but little of it is perceived as high in quality.
BEST COPY AVAILABLE121
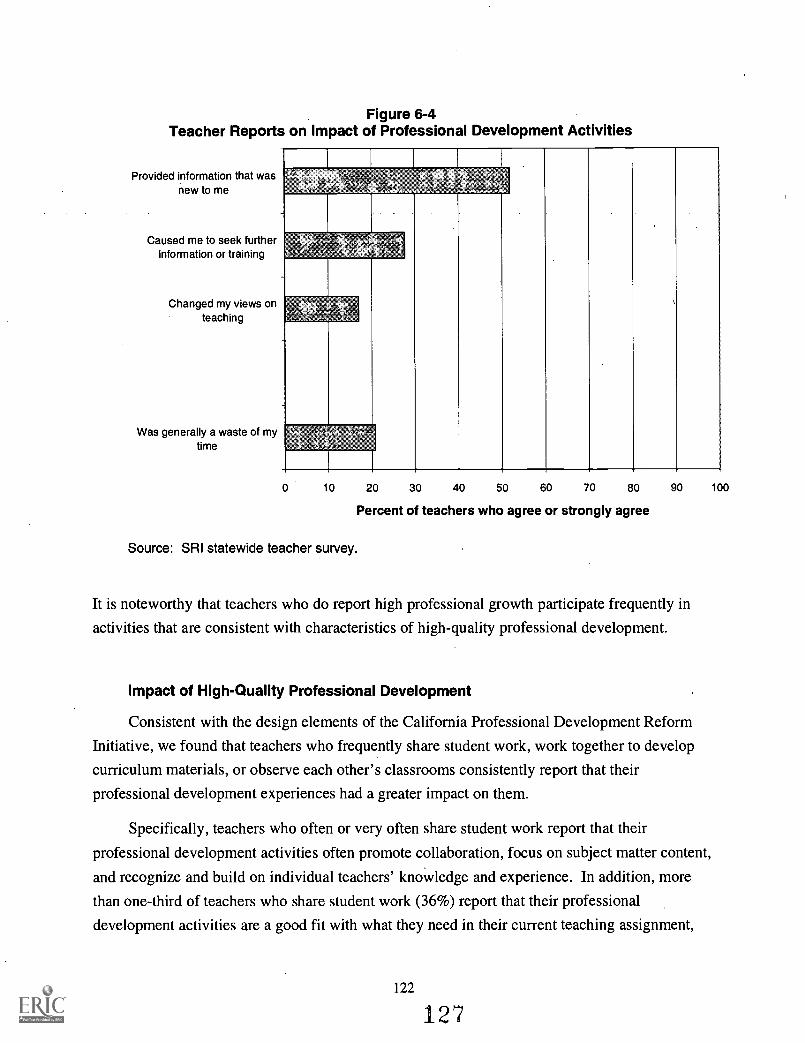
Figure 6-4Teacher Reports on Impact of Professional Development Activities
Provided information that wasnew to me
Caused me to seek furtherinformation or training
Changed my views onteaching
Was generally a waste of mytime
10 20 30 40 50 60 70 80 90 100
Percent of teachers who agree or strongly agree
Source: SRI statewide teacher survey.
It is noteworthy that teachers who do report high professional growth participate frequently in
activities that are consistent with characteristics of high-quality professional development.
Impact of High-Quality Professional Development
Consistent with the design elements of the California Professional Development Reform
Initiative, we found that teachers who frequently share student work, work together to develop
curriculum materials, or observe each other's classrooms consistently report that their
professional development experiences had a greater impact on them.
Specifically, teachers who often or very often share student work report that their
professional development activities often promote collaboration, focus on subject matter content,
and recognize and build on individual teachers' knowledge and experience. In addition, more
than one-third of teachers who share student work (36%) report that their professional
development activities are a good fit with what they need in their current teaching assignment,
122
127

compared with 16% of all other teachers (see Figure 6-5). The differences are also significant
when we compare teachers who work together to create curriculum materials and all others, and
those who observe each other and all others.
Figure 6-5Prevalence of Certain Characteristics of Professional Development,
Teachers Who Share Student Work Often vs. All Others
Promotes collaboration among teachers
Focuses on subject-matter content
Recognizes and builds on individual teachers' knowledge and experience
Is a good fit with what I need or want in my current teachingassignment(s)
Is developed and organized by teachers in the school
Is sustained over time, with ample participant follow-up and teachersupport
Is a series of single events with little or no follow-up
0 10 20 30 40 50 60 70 80 90 100
Percent of teachers
13 All other teachers Teachers who share student work often*
Scale: 1=never, 2=seldom, 3=sometimes, 4=often, 5=very often.Percent of teachers reporting that PD activities reflected specific characteristic often or very often.*Chi-square significant at p<0.05; contrasts on mean rating significant at p<0.05 on all items.Source: SRI statewide teacher survey.
Although a minority of teachers have opportunities to share student work, write curriculum,
or observe each other, these teachers report that participating in their professional development
activities helped them increase their proficiency in specific instructional skills embodied in the
CSTP, more so than other teachers do. Table 6-3 provides data for teachers who share student
work that is also illustrative of data for teachers who write curriculum together and observe each
other often.
BEST COPY AVAILABLE 123 128

Table 6-3Effectiveness of Professional Development on CSTP Skills,
Teachers Who Share Student Work Often vs. All Others
Mean Rating*
Participation in professional development has helped meincrease my ability to...
Teachers WhoShare StudentWork Often**
All OtherTeachers
Understand subject matter in sufficient depth andcommunicate that understanding to my students.
3.4 3.0
Help students to connect classroom learning to their lifeexperiences and cultural understandings.
3.2 2.8
Use strategies that support subject-matter learning andlanguage development for second language learners.
3.1 2.8
Engage students in problem-solving activities and encouragemultiple approaches and solutions.
3.5 3.0
Help students accept and respect different experiences,ideas, backgrounds, feelings, and points of view.
3.1 2.8
Help students to internalize classroom rules, routines, andprocedures and to become self-directed learners.
3.0 2.6
Develop and use a repertoire of instructional strategies wellsuited to teaching a particular subject matter.
3.5 3.0
Select and use instructional materials and resources thatpromote students' understanding of subject matter.
3.4 3.0
Use technologies to convey key concepts in the subject-matter area.
3.0 2.5
Plan to use instructional strategies appropriate to thecomplexity of the lesson content and student learning needs.
3.3 2.9
Ensure that student learning goals reflect key subject-matterconcepts, skills, and applications.
3.4 3.0
Use assessment tools that are matched to and support mygoals for student learning.
3.4 2.9
Engage in positive dialogue and interactions with families, andrespond to their concerns about student progress.
2.9 2.3
* Scale: 1=not at all, 5=a lot.**Contrasts on mean rating significant at p<0.05 on all items.Source: SRI statewide teacher survey.
Below, we describe one of the school families (a high school and its feeder schools) funded
through the Los Angeles Annenberg Metropolitan Project (LAAMP) as an example of sustained,
subject-matter-focused professional learning. This LAAMP family is implementing a long-term
124
129

early literacy program in its elementary schools. The level of effort and resources gives teachers
continued exposure and supports to put in place in the classroom what they learned in initial
training outside of the classroom. Teachers report that the training is very useful and that they
see some improvement in students' literacy.
Early Literacy in the Los Angeles Annenberg Metropolitan Project
The LAAMP family elected to train the elementary teachers in the California Early LiteracyLearning (CELL) program. At a particularly proactive elementary school, a 3-year plan totrain every K-3 teacher began in summer 1998. Each teacher attends 5 full days of trainingon interactive writing, guided writing, guided reading, shared reading, read-alouds, andliteracy centers. During the school year, the teachers meet monthly in "critical friends"groups to share implementation strategies. They also have observed each other doingCELL lessons and observed teachers at another elementary school that started using CELLearlier. Teachers report that other weekly grade-level meetings are teacher led, supportive,and focused on looking at student work as it relates to content standards. One teacherreceived additional training to be an in-house coach, providing demonstration lessons andattention to new teachers. The teachers in this school reflect a serious commitment to thisearly literacy initiative, are confident that they are receiving the training they need to improvestudent learning, and are dedicated to helping each other be successful.
Understanding the Professional Development Experiences of California Teachers
California teachers have plentiful learning opportunities, yet only a minority of teachers
view these opportunities as valuable and meaningful to their classroom teaching. A large
majority of teachers report having time to collaborate with each other, yet only a minority focus
the time to collaborate on student work and instructional issues. More teachers report having
content-specific workshops than workshops focused on generic instructional techniques.
Nonetheless, teachers report a general fragmentation of the time they spend on professional
development, insufficient support for mentor teachers, and many professional development
experiences that do not meet their needs in either subject matter specificity or level of teaching
expertise.
125
130
Endnotes
California Professional Development Reform Initiative. (1999, April ). Design for learning, California fieldguide for teachers' professional developmentDraft. Sacramento, CA: Author.
Corcoran, T., Wang, A., & Foley, E. (1999). What kinds of professional development build capacity better? Ananalysis of the impact of professional development on, teaching practice in the school district of Philadelphia.Philadelphia, PA: Consortium for Policy Research in Education.
126
131

CHAPTER 7. FINDING COHERENCE IN AN INCOHERENT SYSTEM
STATE POLICY
How does state policy support high-quality professional development?From the passage of SB 1882 in 1988, the state has launched a series of broad initiatives to supportteacher learning.
Most recently, state initiatives in reading and mathematics have infused even more dollars into theprofessional development system, although the reduction in time available during the school year hasrestricted local professional development activities.
In combination with federal, private, and district initiatives, state professional development policiestypically result in an incoherent and disconnected set of opportunities for teachers and schools.
DISTRICT SUPPORT FOR PROFESSIONAL DEVELOPMENT
How do districts support high-quality professional development?
We identify three district approaches to supporting professional development that, in general, districtsuse in some combination: offering a wide menu of activities for individual teachers to choose from;developing a comprehensive school or district strategy in which all teachers are required toparticipate; and supporting collaborative, teacher-directed approaches.
Whatever approach is taken, districts are challenged to interpret and navigate the flow of policies anddirectives from the state legislature in a coherent and efficient manner.
Districts face similar Challenges in developing sufficient expertise and capacity to provide all teacherswith high-quality professional development opportunities.
SUPPORTS AND INCENTIVES
What supports and incentives are offered to teachers to encourage participation in high-qualityprofessional development?
Although most teachers receive some release time for professional development, finding time duringthe school day to reflect on and improve teaching strategies is a major challenge across the state.
State policy that increased instructional days has made it harder for districts to build professionaldevelopment days into the school calendar.
Most teachers do not receive monetary supports, such as stipends, for participating in professionaldevelopment, unless they are providing direct support to other teachers.
Teacher evaluation is typically divorced from professional development and California's teachingstandards.
127
132
The professional development opportunities of California's teachers fall far short of what
they themselves perceive as sufficient and short of what research has shown to be effective in
helping students learn to high standards. Why is this so? Our review of state and local policy
demonstrates that policy-makers at every level of the system recognize the importance of
professional development. Beginning with the state's comprehensive effort in the late 1980s to
build a coherent system of professional development and continuing through the 1999
legislature's special session on education, California has actively supported a variety of
professional development initiatives. These state initiatives exist alongside various federal,
private, and local professional development opportunities available to districts and schools. In
fact, the number and range of learning opportunities appear almost limitless.
Yet it is precisely the dizzying array of voluntary and mandated professional development
opportunities that make it difficult for districts, schools, or teachers to formulate a coherent
professional development strategy. Each program must be implemented in a limited amount of
time, often by the same group of district and school personnel. Moreover, in many cases, the
incentives for teachers to pursue meaningful learning opportunities and the resources available
for them to do so turn out to be insufficient to motivate and to support high-quality professional
development.
In this chapter, we illustrate the tension that districts, schools, and teachers face between
reacting to existing and new state directives and sustaining sharply focused professional
development strategies. We review the state policy context, beginning with the sweeping
legislation on professional development in the late 1980s. We then describe various approaches
that districts and schools take to mediate the space between state and federal mandates and local
professional development needs. Finally, we examine the supports and incentives that the state,
districts, and schools use to promote professional development.
State Policy in Support of Professional Development for California Teachers
The 1987 study Staff Development in California: Public and Personal Investments,
Program Patterns, and Policy Choices, commissioned by the legislature, was sharply critical of
most teacher professional development in California. It found that despite several promising
activities, "On the whole...the current array of staff development activities and incentives is
unlikely to yield substantial change in the thinking or performance of California's classroom
teachers." 1
In partial response to the publication of the 1987 report, the 1988 legislature passed a
comprehensive professional development package under Senate Bill 1882. The legislation
128
133

established a three-tiered professional development strategy, including site-level projects,
Regional Consortia, and the California Subject Matter Projects (CSMPs).
The first program of SB 1882 provided resources to schools and districts for planning and
implementing professional development linked to improvement in curriculum, instruction, and
assessment at about 300 selected high schools. The purpose of the program was to allow for
better alignment of professional development activities with local teachers' needs and
schoolwide goals. District entitlements are calculated on a formula of approximately $11.75 per
student, based on average daily attendance (ADA) for all eligible schools.
The second program, the professional development Regional Consortia, was created to
provide regional coordination, brokerage, and direct services to support the implementation of
high-quality professional development at the local level. The goals of the Regional Consortia
were to help schools and districts create, implement, and evaluate school and district
development plans; facilitate collaborative learning agreements among school faculty; assist
teachers in implementing the state curriculum frameworks; and build cooperative agreements
between districts and institutions of higher education. Ten consortia were reauthorized for
funding from 1995 to 2000.
The third and best-known provision of SB 1882 gave resources to institutions of higher
education to deliver intensive subject-matter-based professional development. There are nine
different Subject Matter Projects and approximately 100 different project sites throughout the
state, which tend to be located on university campuses.2
A key feature of the CSMPs is regional summer institutes that last between 3 and 4 weeks.
Other CSMP activities include weekend workshops during the school year, leadership
academies, teacher action-research groups, and newsletters. All these activities focus on the
pedagogy and content of each discipline area. They also support teachers' needs for collegiality
and professional enrichment. The projects draw heavily on expert teachers as leaders to teach
and support their colleagues.
Whereas evaluation data on the first two provisions of SB 1882 are thin, we know much
about the progress of the Subject Matter Projects, which, according to our survey as well as
previous work, reach more than one in five California teachers. CSMP activities are highly
valued by its participants, again according to our work and the work of others.3 Still, in
combination, the three provisions of the law did not result in anything like a comprehensive
system of professional development. In fact, the 1998 reauthorization of the Subject Matter
129
134

Projects explicitly directs the projects to move away from a focus on individual teachers aside
from their school and district contexts.
Professional Development Initiatives in the Wake of SB 1882
In spite of its goal of serving as the basis of a comprehensive system of professional
development, SB 1882 was followed by numerous state initiatives designed with various
purposes in mind. One telling example was the combined effort of the Mathematics Renaissance
and the California Science Implementation Network, which were launched in the late 1980s and
early 1990s. Together, these measures were designed as part of a systemic strategy to implement
the California frameworks in mathematics and science.4 These were quite successful efforts in
terms of their reachtens of thousands of teachersand their impact, with clear impacts on
student learning. In this context, they are notable because they functioned as a parallel effort to
the work of the Subject Matter Projects in science and mathematicsexcept they were under the
control of the State Superintendent of Instruction and not the'University of California. These
programs exemplify how policy-makers can duplicate efforts and build numerous, differently
funded, and competing efforts to support teachers.
Through the 1990s, older programs, such as the Bilingual Teacher Training Program,
continued, and new ones, like SB 1274 grants to restructure schools, supported professional
development for teachers throughout the state. Taken individually, each of these efforts had
clear merits. Yet, together, they did no more than SB 1882 to build a more coherent statewide
system for supporting teacher learning.
Recent Professional Development Initiatives
During the past few years, the legislature has also added funds to the state budget for
professional development in reading and mathematics in an attempt to raise the test scores of the
state's students. In addition, other recent legislative initiatives have implications for teachers'
opportunities to learn. We review these key initiatives below.
Reading Instruction Development Program. AB 1086 (1997) provided $56 million to
expand the Teacher Reading Instruction Development Program for grades K-3 and created
similar programs for teachers in grades 4-8.5 This legislation also required the State Board of
Education, in consultation with the Commission on Teacher Credentialing, to develop a list of
approved contract providers of training in reading instruction. ABX1 2 (1999) provides for
another $75 million to establish the Elementary School Intensive Reading Program. The funds
support "multiple, intensive reading opportunities for pupils in [K-4]" and "give first priority to
130135

increasing instructional opportunities for pupils who are experiencing difficulty learning to
read."6
Reading Professional Development Institutes. Under ABX1 2, passed in 1999, the
legislature requested that the University of California, along with partner CSU sites and
independent colleges and universities, develop and execute reading professional development
institutes for up to 6,000 teachers. The legislation directs that the training be consistent with the
Reading/Language Arts Framework and include the instruction of explicit reading skills; a strong
literature, language, and comprehension component; ongoing diagnostic assessment; and early
intervention techniques.
Mathematics Professional Development Grants. In addition to the increased funding
available for reading, the 1998 Budget Act provided $28.5 million for staff development in
mathematics for teachers in grades 4 to 12. AB 2442 provides approximately $14 million in
grants to local districts to reimburse teachers for fees and materials arising from taking college
and university mathematics classes. AB 1331 provides another $14 million in grants for in-
service training in mathematics. The professional development providers are specified through
an approved list, similar to the provisions of AB 1086 in reading.
Elimination of "Noninstructional" Days. Beginning in 1977, the state had authorized
and funded districts to include up to 8 noninstructional days in the school-year calendar. Most
districts used 4 or 5 of those days for professional development. The 1998-99 budget stipulated
a minimum of 180 instructional days for students, effectively eliminating all staff development
days within the teacher contract year. The 1998 budget act appropriated $195 million to fund up
to 3 days of staff development at $270 per day for certificated staff and up to 1 day at $140 per
day for classified staff. Because these pupil-free days cannot replace any days within the 180
day instructional year, districts must extend the school year beyond the 180 days for which
teachers are contracted to implement any of the staff development days. Teachers and
administrators argue that this legislation further exacerbated schools' difficulties in supporting
teachers' professional development. At the very least, the legislation forces schools and districts
to change the ways in which professional development is scheduled.
California Peer Assistance and Review Program (PAR). ABX1 1 emerged from the
1999 special legislative session and established the California Peer Assistance and Review
Program (PAR). PAR seeks to create "a critical feedback mechanism that allows exemplary
teachers to assist veteran teachers in need of development in subject matter knowledge or
teaching strategies, or both."7 PAR will become fully operational on July 1, 2001, when it will
completely displace the California Mentor Teacher Program. Funds received under PAR may be
131
136
used for BTSA, pre-intern programs, district intern programs, and other professional
development.
Public School Performance Accountability Program. The special legislative session of
1999 further established the Public School Performance Accountability Program, under which,
among other provisions, 430 schools scoring below the 50th percentile on the Standardized
Testing and Reporting (STAR) program would be "invited" to participate in the Immediate
Intervention/Underperforming Schools Program. In 1999, the first year of implementation, more
than 430 schools volunteered to participate. Participating schools will receive $50,000 as a
planning grant to assess their weaknesses and design a plan of action to improve student
achievement.
Issues in Understanding State Support for Professional Development
These many state professional development initiatives provide needed resources to districts
and schools to address important goalslike increasing reading achievement. At the same time,
they can also restrict local efforts, increase the burden on local educators as they seek to follow
state guidelines, and, in combination with myriad federal and privately sponsored initiatives,
make it difficult for districts, schools, or teachers to formulate a coherent professional
development strategy.
The task of interpreting the policies flowing down from the state legislature and
implementing the directives in some coherent and efficient manner is made more difficult by the
noninstructional nature of some mandates. An examination of Elk Grove's catalogue illustrates
that, even for this progressive district, the menu of staff development courses is studded with a
host of noncurricular, noninstructional topics, including:
Illness and Injury Prevention Program, Hazardous Materials, and Blood BornePathogens training for new employees.
CPR/Community First Aid & Safety and CPR Recertification.
Mandatory Child Abuse Workshop for new teachers.
How to Develop and Implement 504 Plans for Students.
Although each of the mandated professional development topics addresses important social
and educational problems, the requirement to offer these and other workshops to remain in
compliance with state policies fractures teachers', schools', and districts' concentration on
student learning and consumes valuable time and financial resources. One principal expressed
her struggle in focusing on instructions: "If policy-makers were all focused on student
achievement, that would be fine. Just focus on that. But there are 10 new things that have came
132
137

up in the last year. We are supposed to be instructional leaders, but the pie of my time keeps
getting sliced up. The piece for instruction is only a small piece." At the same time, the state
picture changes so rapidly that districts must sprint to catch up with all the mandates. "The
messages coming from [the state] have been so chaotic and inconsistent...." This assistant
superintendent for curriculum and instruction continued, "The message from [the state] changes
on a monthly basis. We don't really know how to respond...we are left on our own."
The lesson for state policy-makers is that the influence of any individual state policy must
always be considered in the context of what is already asked of districts, schools, and teachers.
Constructive state efforts to promote teacher learningproviding sufficient resources, creating
model programs, setting overall priorities, tapping the expertise of the state university systems
can be undermined when combined with restrictive mandates or new programs that are simply
layered on existing efforts. In essence, the state cannot mandate what really matters: coherent
and effective learning opportunities for all teachers. The success of state initiatives will always
turn on the actions and will of local educators. The state can provide the resources, the focus,
and the motivation; however, it can also inadvertently create confusion and lessen the likelihood
that California teachers will develop the skills and knowledge needed to bring all students up to
the state standards.
District Support for Professional Development
In the face of the vast universe of professional development options, districts seek to
develop a coherent and strategic approach to teacher learning. In fashioning a strategy, districts
and schools make a series of choices regarding professional development, including (1) the
content, (2) the source of expertise, and (3) the participants. Separate from these issues is the
question of who makes the decisions for each of these questions. Strong leadership and explicit
goals and incentives can result in more centralized decision-making at the school or district level.
A very decentralized system allows teachers to be the main arbiter of their own professional
growth activities. It is through making these decisions that districts and schools choose to
respond to state initiatives.
In our case study districts, we found a wide range of district activities designed to provide
teachers with multiple learning opportunities. In each site, districts faced the daunting task of
identifying professional development priorities, interweaving appropriate state goals and
resources, and covering other, unrelated state mandates. The following examples illustrate how
schools and districts attempt to create coherence out of state directives, teacher needs, disparate
flows of monetary resources, and unconnected incentives and supports.
133 138

Menu Approach
One common district approach is for the central office to provide a broad array of
workshops, presentations, and seminars for teachers to choose from. An important goal of the
menu of offerings is to provide something of interest to everyone. In a menu approach, the
central office distributes a catalogue of staff development activities for teachers to choose from,
thus acting as a clearinghouse of activities, resources, and expertise. The menu is also the way
districts can efficiently cope with all of the noninstructional state mandates, such as CPR and
hazardous-materials training.
The professional development activities vary widely. Entries in a typical catalogue from
one case study site included such workshop titles as "Speed Reading," "Fall Art Docent
Training," "Ways to Improve Your Existing Units with Innovative Strategies and Resources,"
"Beginning Spanish," and "Memory Mastery." At another district, the curriculum and
technology professional development calendar included "Using Online Resources in Elementary
Science," "NuCalc," "Using Internet Search Skills," "Creating and Using Excel Spreadsheets,"
"Using Primary Resources in California and U.S. History: the California Heritage Project," and
"Geometer Sketchpad." In addition, professional development activities covered both topics that
cut across content areas, such as classroom management or working with special populations,
and those specific to grade levels and content areas, such as teaching time and calendar concepts
in K-2.
Under the menu approach, the district identifies the needs to be addressed and selects the
sources of expertise, whether district curriculum specialists, external experts, or full-time
classroom teachers. But it is the teacher who makes key decisions about which topics to seek out
and how much time to spend on such activities, since participation is largely voluntary.
A menu approach is usually an insufficient vehicle for improving teaching practice in
specific areas of instructional need, because the emphasis is on something for everyone. In at
least three case study districts, administrators stated that they wanted to reduce the number of
workshops and topics on the menu and increase the focus on specific instructional or student
learning goals. To the extent that the menu approach is maintained to cover the extraneous state
requirements, teachers face an incoherent set of offerings and choices.
However, a menu approach can supplement a more targeted professional development
strategy, as in the case of Elk Grove. The example of Elk Grove Unified School District, in a
fast-growing suburb of Sacramento, illustrates how a tailored menu approach can signal district
priorities. In this case, the professional development office ties the menu of choices into district
instructional priorities through an elaborate incentive structure. District administration augments
134139

the salary schedule such that credits for the top steps can be earned only through designated
workshops focusing on specific content areas. Credits toward the second-highest step are
available for workshops focusing on English, math, science, or social studies. Teachers attain
credits for the highest step, introduced just 2 years ago with the simultaneous launch of a reading
initiative, for workshops related to early literacy, reading for information, and reading across the
content areas.
Thus, the selection of workshops and seminars is coupled with financial resources and
teacher incentives to reflect the district's goals. For these targeted areas, the professional
development activities are somewhat more sustained than a typical menu approach. They are
less often one-shot workshops and more often a series of three or four seminars spaced apart to
allow for some follow-up over the course of the series. In the case of the literacy initiative, the
reading courses reinforce and complement more intensive staff development that includes
literacy coaches and reading specialists who work with teachers in the schools, through
coaching, grade-level meetings, and, to a limited extent, demonstrating and observing lessons.
However, even with a more streamlined menu approach, central office staff admit that "some
folks miss the mark and just focus on moving up the salary steps."
Comprehensive School and District Strategies
In addition to offering broad-based professional development menus to teachers, several
districts had developed and sustained a comprehensive professional development strategy around
very specific instructional focuses. We present several contrasting examplesones where state
policies happened to support district goals and plans already in place, and others where
professional development based on local needs flourished with little relationship to state policies.
The first two examples are Selma Unified School District in the Central Valley, near
Fresno, and San Diego Unified. Selma has placed a long-term, strategic-focus on early literacy.
Beginning more than 5 years ago, Selma redirected half of its Title I resources to a new reading
initiative. Accessing high-quality external expertise to build internal capacity, Selma contracted
with outside reading experts for three consecutive summers. In addition, the district supported a
1-year training of a full-time district reading specialist through a partnership with the local
university, CSU Fresno. The district specialist then trained several school-based teacher leaders.
The full-time specialist, a local external consultant, and the teacher leaders have thus far trained
22 Selma teachers, who spend half of each school day working with students. This capacity is
sufficient for all first-grade classes to have access to the program and for each elementary school
to have at least one trained teacher. Selma intends to continue expanding the program so that
enough teachers are trained to support students in all the primary grades. Training for
135
140

kindergarten to grade 2 teachers consists of 2 days with an outside expert, with a focus on
assessment. Monthly grade-level meetings, led by the cadre of local teacher leaders, reinforce
and deepen the initial training. In addition, upper elementary teachers work with the local
consultant on using assessment to make instructional decisions and using a small-group approach
to better customize instruction to students' needs.
San Diego Unified School District likewise has an aggressive implementation strategy
targeting literacy. Importing key elements of the literacy program used in Community District 2
in New York City, where the current San Diego Chancellor for Instruction was the
superintendent, San Diego has restructured the central office, redirected resources to support
professional development for teachers, and made principals accountable for instruction in their
schools. The district established the Institute for Learning, which houses a cadre of instructional
leaders whose job it is to train and support teachers in literacy instruction. Instructional leaders
work directly in classrooms with teachers and lead after-school and weekend workshops. All
principals are expected to spend 2 hours each day in classrooms to help their teachers improve
instruction. The district further mandated a daily 3-hour block for literacy in every elementary
school.
In both the Selma and San Diego examples, the strategic direction and key decisions about
resources, structure, capacity, and content of the training are set at the top of the district system.
In both cases, California's Reading Initiative supported these districts' professional development
strategies through financial resources and statewide training opportunities. Both took advantage
of AB 1086 dollars to provide additional professional development opportunitiesbut they did
so in a way that fit state resources and support into their ongoing initiatives. San Diego, for
example, used AB 1086 dollars to support professional development from a state-approved
external provider in one strand (Word Study) of a multiple-strand balanced literacy program.
District and other external funds were used to support professional development in the other
strands. In neither San Diego nor Selma did the district leadership simply "implement" a state
policy. In fact, the strength of their approach was in adapting state policy to local needswhich
were consistent with basic state intentions. Selma and San Diego already had in place structures
that allowed them to take advantage of the extra resources provided by the state. Thus, these two
districts did not have to alter their focus and attention to incorporate the direction from the state.
136 141

Teachers Directing Their Own Professional Development
In two other examples, we illustrate district approaches that are teacher driven,
collaborative, and sustained. It is interesting that these alternative approaches matured in the
absence of directly related state policies and indeed are sustained in spite of the fragmentation
and disparate pressures applied by various state initiatives.
Inquiry groups in the Santa Monica-Malibu Unified School District exemplify teacher
collaborative groups directing professional development. The inquiry groups, funded externally
by the Los Angeles Annenberg Metropolitan Project (LAAMP), involve teachers, administrators,
and, in some instances, students working together to solve specific problems. The inquiry
groups complement the district's move toward site-based management and constitute Santa
Monica's primary professional development approach. Although voluntary, the inquiry groups
have drawn in almost 100% of all elementary teachers in Santa Monica, approximately 70% of
middle school teachers, and 65% of high school teachers. Through a long-term alliance with
Center X at UCLA, the district has identified the inequitable learning opportunities between
Caucasian and minority students as the single most pressing issue facing the district, and expects
the inquiry groups to address this issue in their own ways. Inquiry groups consist of 8 to 12
people who meet for 2 to 3 hours every 2 weeks, generally during school hours. A trained
"critical friend," usually an external consultant, facilitates these structured discussions, which are
designed to promote self-reflection on instructional practice.
Unlike the finding from the 1987 report that teachers have little influence over decisions
regarding their professional development, the participants in the inquiry groups direct the
activities. The degree to which the inquiry group is action oriented rather than limited to
discussion depends on the group participants themselves. In one strong example, the inquiry
process precipitated an overhaul of the math program at one middle school so that all students
could take algebra. The planned overhaul included:
A review of the math courses and math instruction at the middle school and feederelementary schools.
A summer working group with guidance from a UCLA professor and access to theCalifornia Math Project at Center X to research different approaches to organizing andteaching math.
Rewriting of the math curriculum.
Adoption of new textbooks.
Development of criteria for elementary math programs.
137 142

In this example, teachers working together developed a plan of action, identified the
reforms needed, located appropriate external expertise, built internal capacity to institute change,
and had control over resources to execute the steps of the plan. Teachers saw the work of
reforming the curriculum so that all students would have the opportunity to learn algebra as part
of their instructional responsibilities.
One elementary school in Elk Grove Unified embarked 3 years ago on Results, a program
that is now associated with the California Reading and Literature Project, emphasizing the
analysis of student data to drive instructional decision-making. Adoption of the initiative grew
organically, beginning with a reading specialist at the school who independently sought out
external training. With support from her principal, she instituted training for teachers at the
school on a voluntary basis. Teachers select and administer a variety of reading diagnostic tests,
meet in grade-level groups weekly to examine the assessment results, and plan, as a team,
instructional strategies based on their analyses. Teachers at the school describe Results as a
"philosophy, not a curriculum" and point to after-school programs designed for the lowest-
performing students as tangible reforms flowing from a paradigm of basing instructional
decisions on the analysis of assessment results. Novice teachers at the school report that
participating in the Results discussions has given them concrete assessment skills that have
improved their sense of efficacy in the classroom. "Results is a great thing for a new teacher
because it gives you ready assessments, and new teachers are looking for something to guide
them.
In this example, professional development takes the form of collaborative, problem-solving
discussions and analysis that lead'to specific, action-oriented goals. Teachers testify to its
profound influence on their teaching: "Results...allows us to do small-group instruction and is
focused on what individual kids know and can do. It is powerful because of its focus and the
information it gives. Once you do the assessment for the second time, you understand and can't
imagine ever doing without it. I can't image teaching another way." Much of the power of the
Results work seems to be associated with the shared responsibility of teachers at the same grade
level. "It has to be a team effort. We teach each other's kids, rearrange groups, and give
suggestions for teaching strategies with kids that are not making it. It leads to powerful
discussions. ... Our mantra is 'Every child a reader and every child a name'." Teachers in the
lower grades in this school made it clear that their most powerful professional development
occurred through everyday interactions with their colleagues as they discussed the students'
progressit was not an adjunct activity.
138 143
Like the examples of Selma and San Diego, Elk Grove's and Santa Monica's approaches to
professional development demonstrate the core role of the district in affording teachers coherent
learning opportunities. It was in part because of the success of Results in local districts like Elk.
Grove, in fact, that the Subject Matter Projects adopted it statewide. Here we have an example
of local efforts influencing statewide policy.
Supports and Incentives for Professional Development
Regardless of the programs and strategies that the state, districts, and schools create to
support professional development, core decisions about what teachers participate in and how
seriously teachers pursue opportunities lie in the hands of the teachers themselves. Thus, much
of what policy-makers can do to promote quality professional development turns on the supports
and incentives they offer individual teachers. Supports and incentives signal the priority that
schools and districts place on different activities. Here, we discusses the system of supports and
incentives for teachers' participation in professional development. We address the issues of
time, rewards, and evaluation.
Time for Professional Development
Teachers work long hours. Overall, California teachers report working on a variety of
tasks outside of their regular contract day, many of which help build their professional skills and
knowledge. The vast majority of teachers report working more than 8 hours per day (Figure 7-
1). Thirty-three percent work 9 hours and 38% work more than that each day. Public
perceptions of the teaching profession generally err on the side of underestimating the workload
of teachers.8 Thirty-five percent of the California public estimate that teachers work more than 8
hours a day, but equal percentage (36%) estimate that teachers work less than 8 hours. Even
though the public holds misconceptions of teachers' workloads, 82% believe in compensating
teachers more for professional development and planning.
139 144
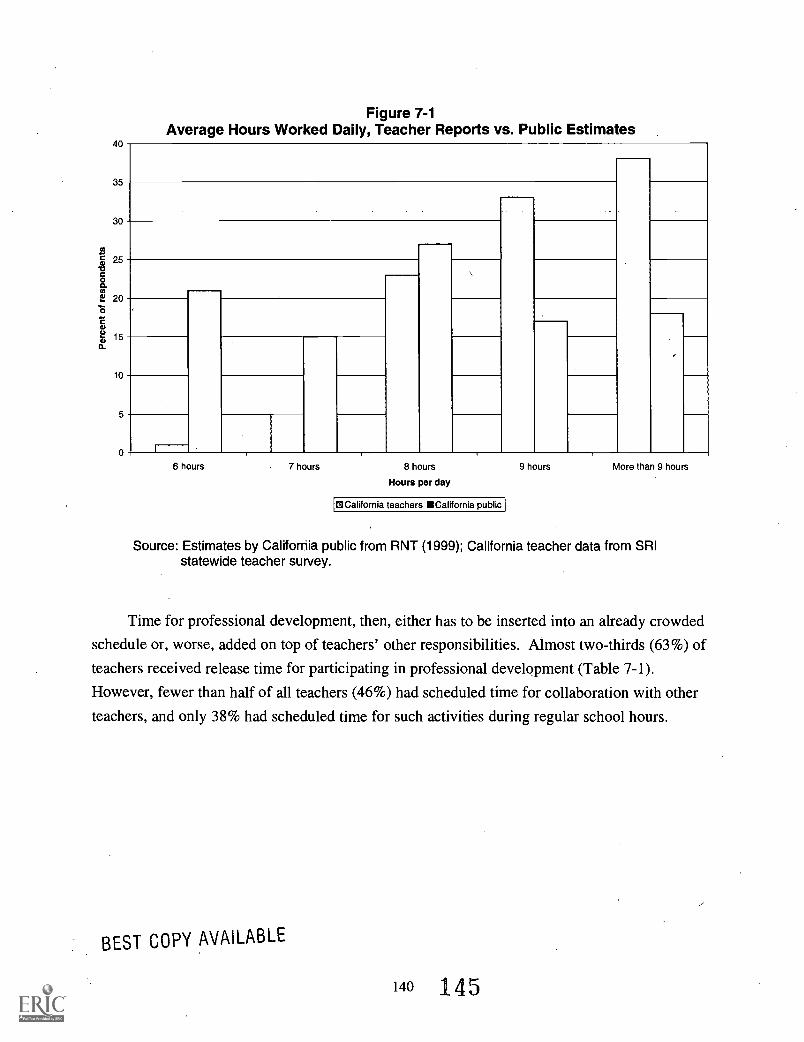
40
35
30
25
20
15
10
Figure 7-1Average Hours Worked Daily, Teacher Reports vs. Public Estimates
6 hours 7 hours 8 hours
Hours per day
OCalifornia teachers California public
9 hours More than 9 hours
Source: Estimates by California public from RNT (1999); California teacher data from SRIstatewide teacher survey.
Time for professional development, then, either has to be inserted into an already crowded
schedule or, worse, added on top of teachers' other responsibilities. Almost two-thirds (63%) of
teachers received release time for participating in professional development (Table 7-1).
However, fewer than half of all teachers (46%) had scheduled time for collaboration with other
teachers, and only 38% had scheduled time for such activities during regular school hours.
BEST COPY AVAILABLE
140 145

Table 7-1Time for Professional Development
Time Provided Teachers in 1997-98Percent ofTeachers
Release time from teaching (i.e., when your regular teachingresponsibilities are covered by someone else)
63
Scheduled time for collaboration with other teachers, includingyour regular planning period if it is used for this purpose
46
Scheduled time in the weekly master schedule for pupil-free time(i.e., time for professional development built into your regularschedule)
38
Source: SRI statewide teacher survey.
Teachers and district personnel whom we interviewed for the case studies generally
anticipate even less time for professional development as a result of the elimination of
"noninstructional" days. As mentioned earlier in this chapter, the 1998-99 budget stipulated a
minimum of 180 instructional days for students, effectively eliminating all staff development
days within the teacher contract year. Teachers and administrators across the state complained
about the reduction of the state-funded instructional development days. "We used to have up to
7 days of in-service, but not with the new bill. It's got to be either before or after school,"
explained a high school administrator in a rural district. "The value of having 1 or 2 days before
school is very questionable in my mind, but that is our only alternative right now." In addition,
the difficulties of scheduling time for teachers' professional development were exacerbated when
the statewide implementation of class size reduction significantly reduced the pool of substitutes.
In an attempt to provide models of creating time for professional learning, the California
Professional Development Reform Initiative (CPDRI) summarized some possible strategies:
Purchasing time, such as release days, summer stipends, or adding days to the contract.
Reallocating time, such as expanding staffing with substitutes and part-time teachers;flexible classroom coverage by teaching assistants, interns, or team teaching;alternative scheduling, such as common prep time, block scheduling, banking time;reducing teacher workload/student contact time.
Improving the use of time during staff development days and faculty meetings.9
CPDRI notes that these solutions have their drawbacks. Purchasing time tends to be "one-shot"
rather than ongoing. Reallocating time is nearly impossible, as we have noted, in districts with
141 146

teacher shortages because few substitutes are available. Flexible coverage is a temporary
strategy and cannot free teachers for long periods of time.
Some schools and districts are already implementing some of these suggestions and have
developed other ways of building in time for teacher learning. For example, Selma Unified has
each Tuesday as an early release day for pupils, allowing teachers an hour and 45 minutes for
professional development (but the other four days of the week have slightly longer hours). One
Tuesday per month is reserved for BTSA mentors and mentees to meet. Another Tuesday per
month is used for grade-level meetings, which bring all elementary teachers in the district
together. At the junior high, the early release days are used for team meetings. At the high
school, Digital High School training occurs twice per month and department meetings once per
month.
In another example, a San Francisco middle school moved to block scheduling. Every
teacher has two prep periods per day, and teachers meet every day. The principal believes, as do
the staff, that communication is crucial to developing expertise within the school. In this school,
teachers have common planning time within their interdisciplinary families, as well as in vertical
departmental teams. A veteran teacher told us, "I love this school because teachers have
common planning time, time to talk to each other. There is a lot of collaboration here because of
the [interdisciplinary] families; there is a lot of interaction over student learning."
San Diego has taken a different approach to affording teachers professional development
time by placing staff developers in schools 2 to 4 days per week. These peer coaches work
directly in teachers' classrooms, modeling lessons, observing, and offering critical feedback. But
they also take over teachers' classes to allow those teachers to observe in others' classrooms.
Thus, professional development time takes place during the regular daily schedule.
In the absence of such integrated approaches, professional development time becomes
fragmented as activities are fit into the small periods available, resulting in unsustained and
shallower focus on the content of professional development activities. As one administrator
expressed: "Time! As a system we just haven't been able to organize time in ways that support
professional development. It will take a radical reconceptualization of the way we think about a
school year." In addition, there are serious time constraints on the planning and development of
professional development. As one teacher reported: "There's a PD committee that includes
teachers and administrators that tries to come up with things. But the PD is not well focused, not
in-depth. It's all flavor of the month. It's not well thought out because it's developed in
teachers' spare time. I've given in-services...and I know that it has to be developed at lunch,
after school, off-track. There's no time in the schedule for it."
142
147

Rewards for Professional Development
Another way districts can support teachers is by providing them certain benefits for
professional-development-related activities. The types of rewards districts can offer are
influenced by state policy. For example, because of funds available through the California
Mentor Teacher Program and BTSA, a large percentage of teachers report being rewarded
monetarily for working with new teachers (Figure 7-2). Much lower percentages of teachers
report getting either monetary or nonmonetary benefits for other relevant activities. Strikingly,
fewer than half of teachers who provide direct professional development to their peers or take on
leadership roles are paid for it. At minimum, this suggests to those teachers that professional
development is not an expectation of their job; at worst, it acts as a disincentive to pursue
professional development, given the scarcity of time, and to pursue those things that are
rewarded.
Figure 7-2School/District Rewards for Teacher Development Activities
Work directly with new teachers
Provide school, district, or regionalstaff development
Work directly with inexperiencedteachers
Seek additional certification
Take on leadership roles
Take advantage of professionaldevelopment opportunities to
improve their knowledge and skills
Seek National Board for ProfessionalTeaching Standards (NBPTS)
certification
0 10 20 30 40 50 60
Percent of teachers
70 80
0 Not rewarded Rewarded nonmonetarily 0 Rewarded monetarily
Source: SRI statewide teacher survey.
143 148
90 100
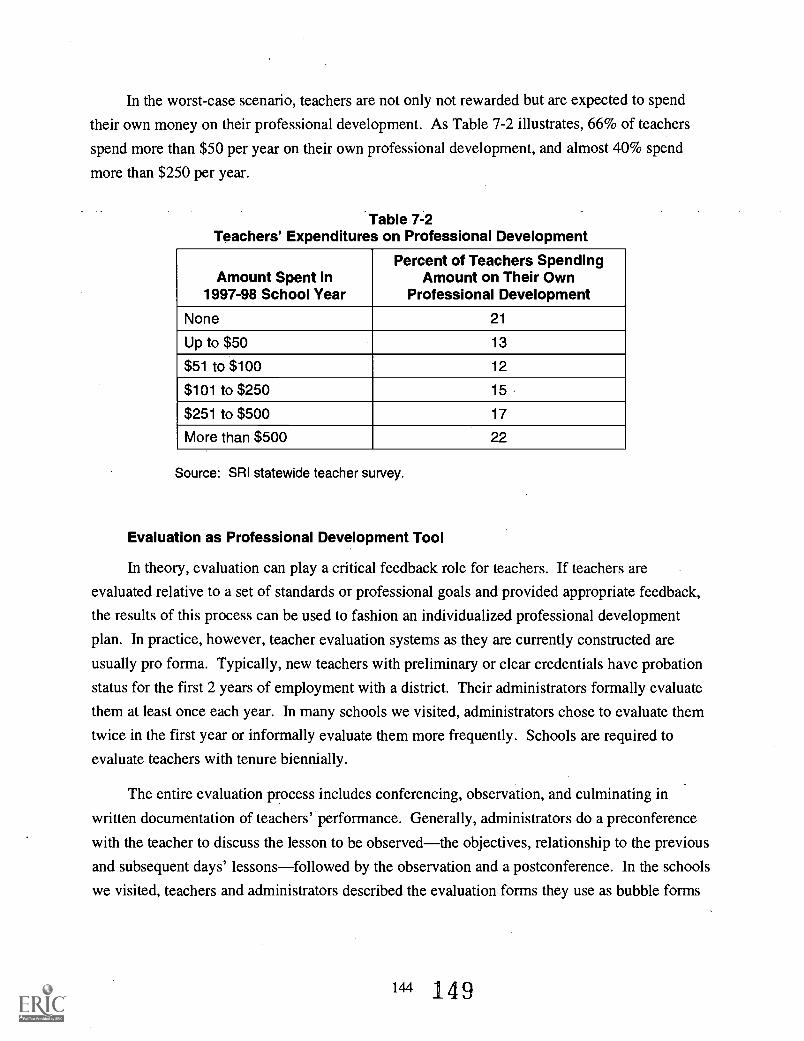
In the worst-case scenario, teachers are not only not rewarded but are expected to spend
their own money on their professional development. As Table 7-2 illustrates, 66% of teachers
spend more than $50 per year on their own professional development, and almost 40% spend
more than $250 per year.
Table 7-2Teachers' Expenditures on Professional Development
Amount Spent in1997-98 School Year
Percent of Teachers SpendingAmount on Their Own
Professional Development
None 21
Up to $50 13
$51 to $100 12
$101 to $250 15
$251 to $500 17
More than $500 22
Source: SRI statewide teacher survey.
Evaluation as Professional Development Tool
In theory, evaluation can play a critical feedback role for teachers. If teachers are
evaluated relative to a set of standards or professional goals and provided appropriate feedback,
the results of this process can be used to fashion an individualized professional development
plan. In practice, however, teacher evaluation systems as they are currently constructed are
usually pro forma. Typically, new teachers with preliminary or clear credentials have probation
status for the first 2 years of employment with a district. Their administrators formally evaluate
them at least once each year. In many schools we visited, administrators chose to evaluate them
twice in the first year or informally evaluate them more frequently. Schools are required to
evaluate teachers with tenure biennially.
The entire evaluation process includes conferencing, observation, and culminating in
written documentation of teachers' performance. Generally, administrators do a preconference
with the teacher to discuss the lesson to be observedthe objectives, relationship to the previous
and subsequent days' lessonsfollowed by the observation and a postconference. In the schools
we visited, teachers and administrators described the evaluation forms they use as bubble forms
144 149
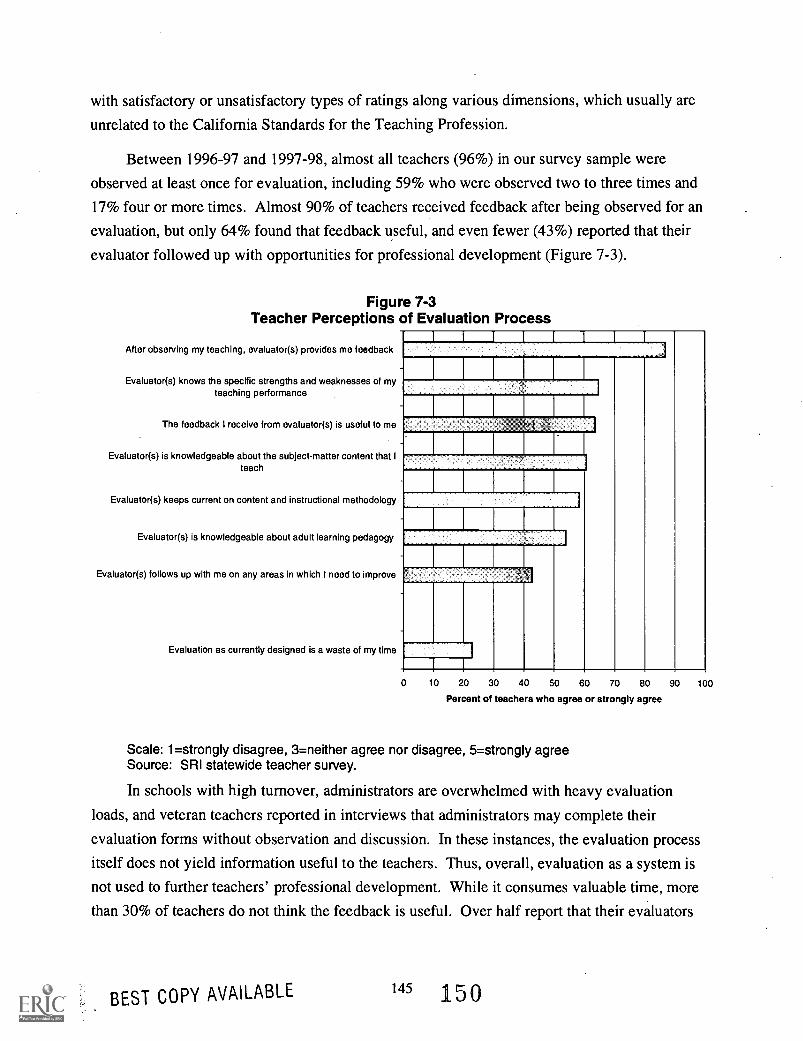
with satisfactory or unsatisfactory types of ratings along various dimensions, which usually are
unrelated to the California Standards for the Teaching Profession.
Between 1996-97 and 1997-98, almost all teachers (96%) in our survey sample were
observed at least once for evaluation, including 59% who were observed two to three times and
17% four or more times. Almost 90% of teachers received feedback after being observed for an
evaluation, but only 64% found that feedback useful, and even fewer (43%) reported that their
evaluator followed up with opportunities for professional development (Figure 7-3).
Figure 7-3Teacher Perceptions of Evaluation Process
After observing my teaching, evaluator(s) provides me feedback
Evaluator(s) knows the specific strengths and weaknesses of myteaching performance
The feedback I receive from evaluator(s) is useful to me
Evaluator(s) is knowledgeable about the subject-matter content that Iteach
Evaluator(s) keeps current on content and instructional methodology
Evaluator(s) is knowledgeable about adult learning pedagogy
Evaluator(s) follows up with me on any areas in which I need to improve
Evaluation as currently designed is a waste of my time
I I
0 10 20 30 40 50 60 70 80 90 100
Percent of teachers who agree or strongly agree
Scale: 1=strongly disagree, 3=neither agree nor disagree, 5=strongly agreeSource: SRI statewide teacher survey.
In schools with high turnover, administrators are overwhelmed with heavy evaluation
loads, and veteran teachers reported in interviews that administrators may complete their
evaluation forms without observation and discussion. In these instances, the evaluation process
itself does not yield information useful to the teachers. Thus, overall, evaluation as a system is
not used to further teachers' professional development. While it consumes valuable time, more
than 30% of teachers do not think the feedback is useful. Over half report that their evaluators
BEST COPY AVAILABLE 145 150

do not follow up with them regarding needed improvements, and almost one-quarter think
evaluation is a waste of time.
There are, of course, exceptions to these general trends. To improve on the standard
evaluation process, some schools use individual plans that are intended to guide professional
development choices and link evaluation and professional development. In one middle school in
Elk Grove Unified, all teachers are required to meet with an administrator (principal or assistant
principal) to develop a professional development plan. Each teacher then must submit a
portfolio that demonstrates progress toward annual professional development goals. The
administrators review and provide feedback on the portfolios each year, even for veteran
teachers. Administrators and teachers alike report gaining more valuable information from this
process than through the district-required evaluation form. Unfortunately, the school must
comply with the standard process, in addition to its own system, even though the standard
process is less useful for both teachers and administrators.
Santa Monica-Malibu Unified has an innovative districtwide evaluation system (described
below). Tenured teachers have two options: the regular 2-year evaluation cycle or a 3-year
professional growth cycle that includes setting goals and submitting evidence of achieving the
goals.
Teacher Evaluation in Santa Monica
In the first year, Santa Monica teachers are observed three times, the third of which is aformal evaluation, usually performed by the principal. For teachers with satisfactoryevaluations the first year, there are no formal evaluations in the second year. (However,new teachers may be observed and given informal feedback by the principal.) If the teacherdid not get a satisfactory evaluation the first year, then the Year 1 process is repeated thesecond year. In the third year, a new teacher who was successful in the first 2 years getstenure. All teachers get their choice in the third year of the cycle to either repeat theprocess described above or to enter a "3-year professional growth cycle." A teacher whochooses the professional growth cycle develops a plan for what he or she wants to do over2 years and submits it to the principal. The teacher then follows the plan, taking courses,reading, taking professional development offerings in areas of interest (e.g., interacting witha community and families served, National Board certification, and so on). At the end of thefourth year, the teacher submits a portfolio or other evidence of professional growth for theprincipal to assess. If satisfactory, there is no evaluation in the fifth year of the cycle. Thenthe cycle starts again with Year 1 of the 3-year professional growth cycle.
146
151
These uses of evaluation to support professional learning goals are the exception. In
general, teacher evaluation systems in our case sites were divorced from professional
development and were not tied to teaching standards. However, the legislative mandates under
Peer Assistance and Review (ABX1 1) could change local evaluation procedures.
Teachers participating in PAR are expected to have individual improvement plans, and
districts and schools will have to provide appropriate staff development and support for teachers
to progress toward their improvement goals, most notably the assistance of an exemplary
"consulting teacher." Further, the bill amends existing law to require school district governing
boards to evaluate certificated employee performance as "it reasonably relates to" the progress
pupils are making toward meeting state standards, as measured by "state adopted criterion
referenced assessments." In addition, the CDE will provide guidelines on how to develop local
PAR programs that are based on the CSTP and the NBPTS. The final evaluation results of a
teacher's participation in PAR will become part of the teacher's personnel file.1° Although these
provisions may improve the usefulness of the evaluation process for participating teachers, it is
unclear how many teachers will actually participate, given the capacity constraints of enough
master teachers, mentor teachers, BTSA support providers, and now consulting teachers.
The Challenges of Coherence and Capacity in Professional Development
The state, districts, and schools face two fundamental challenges in ensuring that all
teachers have access to high-quality professional development: (1) sustaining a consistent and
coherent vision, goal, and strategy for instructional reform over a long period of time; and (2) the
scale of the human and financial resources necessary to support instructional improvement over
the long term in multiple subjects and multiple grades.
At each level of the system, the coherence of teachers' professional development
opportunities is a key issue. At the state level, various pieces of legislation do not attempt to
coordinate the disparate approaches to professional 'development, nor do they effectively ensure
that the quality of professional development will be high. Yet they are increasingly prescriptive.
"The fragmentation of funding sources is a major problem. It leads to creating a situation where
the amount of local discretion is the smallest it's ever been, while the dollar amounts are the
largest. We are told very specifically how to spend those dollars," stated another superintendent.
Regardless of state policy, however, districts shoulder some responsibility for making
sense of competing mandates and providing professional development opportunities for teachers
that make sense in the district context. Our case study districts provided examples of how strong
local leaders can do much to develop coherent approaches. Elk Grove, for example, uses a series
147 152
of incentives to encourage teachers to take advantage of opportunities in line with district
objectives. San Diego has built of system of peer coaches and a literacy focus, taking advantage
of state resources.
School leaders also have a role in helping to forge professional development that makes
sense for their teachers. In Santa Monica, there has been an explicit effort to build school-level
capacity, shared among the principal and teachers, to make sure that teachers have learning
opportunities that meet their particular needs.
In the absence of a coherent message from policy-makers at each level of the system about
the importance and direction of professional development, teachers' learning experiences will
too often be fragmented and incoherent themselves. More importantly, disjointed and
contradictory policies can lead teachers to begin to ignore policy-makers' reform initiatives and
take a "this too shall pass" approach to urgent efforts to improve our schools.
A related challenge at each level of the system is building sufficient capacity to implement
high-quality professional development for all teachers. Simply put, helping teachers learn
requires many helpersother adults who are prepared to help teachers improve their practice.
The numbers involved, if all teachers are to be reachedare startling. For example, San Diego
Unified created more than 100 school-site staff developer positionsat a cost of millions of
dollarsto ensure that teachers receive adequate support in the classroom during the
instructional day. All of these dedicated staff are focused on literacy. Similarly, Elk Grove has
two full-time staff in the central office maintaining the district's catalogue of offerings and the
BTSA program and a full-time coordinator for the literacy coaches. Teachers on special
assignment serve as literacy coaches, one for every two elementary schools. Middle and high
schools each have at least one half-time reading specialist. Again, except for central office staff,
this capacity is focused exclusively on literacy and reading. To replicate this kind of capacity for
other content areas requires even more people dedicated full-time to the professional
development role and the political will to allocate the financial resources required.
The time required to establish instructional changes in the classroom calls for the capacity
to lead, adhere to, and implement a long-term strategy. Selma has sustained a 5-year focus on
literacy and reading, including a 1-year training for the lead in-house Reading Recovery expert.
The San Diego reform model derives from a 10-year literacy effort in New York City's
Community District 2. The stable leadership and consistent long-term vision that are necessary
are also rare in large urban districts.
148 153

Overall, then, our findings illustrate that intensive support for teachers to change their
instructional practices requires time, money, people, and expertise. The investments made thus
far, mostly in early literacy, point to the scale of the challenge in replicating those investments in
math, science, and social studies.
154149
Endnotes
Little, J. W., Gerritz, W. H., Stern, D. S., Guthrie, J. W., Kirst, M. W., & Marsh, D. D. (1987, December). Staffdevelopment in California: Public and personal investments, program patterns, and policy choices, p. 7. SanFrancisco, CA: Far West Laboratory & Berkeley, CA: PACE.
Center for the Future of Teaching and Learning. (1998, March). A review of proposed state budgetexpenditures for fiscal 1998-99 teacher professional development. Santa Cruz, CA: Author.
St. John, M. (1996). The California Subject Matter Projects. Summary of evaluation findings 1993 to 1996.Inverness, CA: Inverness Research Associates.
Shields, P. M., Marsh, J., Marder, C., & Wilson, C. L. (1998, March). A case study of California's SSI(CAMS). Menlo Park, CA: SRI International.
California Institute for School Improvement. (1997). 1997 school program update resource book.Sacramento, CA: Author.
ABX1 2, Assembly Bill, First Extraordinary Session (Chaptered 1999, January 19). Retrieved June 1, 1999,from the California Legislative Counsel's Digest on the World Wide Web:http://www.leginfo.ca.gov/pub/bill/asm/ab_0001-0050/abx1_2_bill_19990329_chaptered.html
ABX1 1, Assembly Bill, First Extraordinary Session (Chaptered 1999, April 6). Retrieved June 1, 1999, fromthe California Legislative Counsel's Digest on the World Wide Web:http://www.leginfo.ca.gov/pub/bill/asm/ab0001-0050/abxl_l_bill_19990406_chaptered.html
Haselkorn, D., Harris, L., & Fideler, E. (1998). The essential profession. Belmont, MA: Recruiting NewTeachers, Inc.
California Professional Development Reform Initiative (CPDRI). (1999, April). Designs for learning, highquality professional development: How do we find time? (Draft). Sacramento, CA: Author.
10 CDE. (1999). AB IX California Peer Assistance and Review program for teachers: Highlights. RetrievedAugust 1999, from the World Wide Web: http://www.cde.ca.gov/bills/AB1XHIGH.HTM
155150

PART II SUMMARY AND POLICY RECOMMENDATIONS
In the second part of this report, we have examined the systems charged with
building the strengths of the existing teacher workforce. We found that California has
been aggressively developing and implementing a variety of new programs to address the
professional development needs of teachers at various stages of their careers. Despite
these efforts, the state has yet to create a system that supports the kind of teacher learning
and professional growth that translate into a world-class school system.
California has fully funded an induction program for new teachers that is among the
most innovative in the nation. However, many districts around the state lack a sufficient
number of mentor teachers to meet the demand created by the flood of new teachers into
the system. California has invested in the professional development of the state's
teachers and has recently enacted new programs to further improve reading and
mathematics instruction. However, the professional development system is cluttered with
too many disconnected and time-consuming programs. In addition, California teachers
find that too much of their formal professional development is of poor quality, fails to
meet their needs, and has little impact on their teaching. To make matters worse, most
schools and districts do not provide adequate supports and incentives that would
encourage and allow teachers to enhance their own learning. Moreover, far too many of
California teachers must work in school conditions that inhibit professionalism.
In response to these findings, the Task Force has made the following
recommendations:
Encourage and support teachers to reach high levels of subject matterexpertise and instructional skill.
Commission, on behalf of the Legislature, an independent analysis of existingstatutes, regulations, policies, procedures, and guidelines with the intent ofeliminating provisions that deflect teachers' professional development time tomatters other than the enhancement of subject matter expertise and instructionalskills, and that don't reflect the elements of high quality professionaldevelopment.
Focus professional development on enabling students to meet the state standardsby calling for all appropriate public agencies, including the legislature, StateBoard of Education, State Department of Education, and the CaliforniaCommission on Teacher Credentialing, to take action to ensure that state-sponsored and locally sponsored professional development opportunities areconsistent with the elements of high-quality professional development.
151 156
Ensure that all novice teachers, including interns and those on emergencypermits and waivers, get the support and guidance they need to enable theirstudents to reach the state standards for student learning.
Make available to districts incentives of up to $250 per student (75% newfunding with a local match of 25% from existing sources) to restructure theteaching day and year to embed time for teachers to participate in high qualityprofessional development that addresses student standards.
Create incentives for teacher preparation institutions to offer experiencedteachers masters degree programs consistent with standards set forward by theNational Board for Professional Teaching Standards that culminate in the awardof both a master of arts degree and successful completion of the National Boardcertification assessments.
By 2005 the Legislature should establish an overall statewide goal in statute ofat least one teacher certified by the National Board for Professional TeachingStandards for every school in the state.
Support for National Board certification candidates should be included annuallyin the budget with funds authorized for 1) continuing the incentives establishedin AB 858, 2) subsidizing candidate application fees, and 3) developingcandidate support programs. Priority in allocation of these funds should begiven to candidates from and programs providing service to inadequately staffedschools.
152 157

REFERENCES
ABX1 1, Assembly Bill, First Extraordinary Session (Chaptered 1999, April 6). Retrieved June1, 1999, from the California Legislative Counsel's Digest on the World Wide Web:http://www .leginfo.ca.gov/pub/bill/asm/ab0001-0050/abxl_l_bill_19990406_chaptered.html
ABX1 2, Assembly Bill, First Extraordinary Session (Chaptered 1999, January 19). RetrievedJune 1, 1999, from the California Legislative Counsel's Digest on the World Wide Web:http://www.leginfo.ca.gov/pub/bill/asm/ab0001-0050/abx1_2_bill_19990329_chaptered.html
Andrew, M., & Schwab, R. (1995). Has reform in teacher education influenced teacherperformance? An outcome assessment of graduates of eleven teacher education programs.Action in Teacher Education 17, 43-53.
Bartell, C., & Ownby, L. (1994). Governor's Office of Child Development and Education(May 1998). Governor's 1998-99 May revision: Education budget and priorities.Sacramento, CA: Author.
Bartell, C., & Ownby, L. (1994, December). Report on implementation of the BeginningTeacher Support and Assessment program (1992-94): Report to the legislature pursuant toEducation Code 44279.2. Sacramento, CA: Beginning Teacher Support and AssessmentInteragency Task Force.
Bohrnstedt, G. W., & Stecher, B. M., (Eds.). (1999). Class size reduction in California: Earlyevaluation findings 1996-98, (CSR Consortium, year 1 evaluation report). Palo Alto, CA:American Institutes for Research.
California Commission on Teacher Credentialing. (CTC). (1997, August 5). Analysis ofapproved credential waiver requests: 1996-97. Sacramento, CA: Author.
CTC. (1998, May). 1996-97 Annual report: emergency permits and credential waivers.Sacramento, CA: Author.
CTC. (1998, August). Analysis of approved credential waiver requests, 1997-98. Sacramento,CA: Author.
CTC. (1998, November). Numbers of multiple and single subject teaching credentials issued bythe commission upon the recommendation of California institutions of higher educationwith commission-approved programs. Sacramento, CA: Author.
CTC. (1998). Credential profile for fiscal year 1996/97. Sacramento, CA: Author.
CTC. (1998). Six year report on emergency permits issued during fiscal years 1991 through6/30/1997. Sacramento, CA: Author.
CTC. (1998). Teacher credentialing reform fact sheet. Sacramento, CA: Author.
153 158

CTC. (August 1999). Multiple and single subject teaching credentials: Number of firsttime/new type documents issued upon recommendation. Sacramento, CA: Author.
CTC. (1999). Seven year summary report of multiple subject, single subject, and specialeducation internships. Unpublished.
CTC. (1999). Totals of credentials granted fiscal year 1997/98. Sacramento, CA: Author.
CTC. (1999). 1997-1998 multiple and single subject teaching credentials. Sacramento, CA:Author.
CTC. (1999). A report on commission actions on credential waiver requests July-December,1999. Sacramento, CA: Author.
CTC & California Department of Education (CDE). (1992). Success for beginning teachers: TheCalifornia New Teacher Project. Sacramento, CA: Authors.
CTC & CDE. (n.d.). BTSA: California Beginning Teacher Support and Assessment program(brochure). Sacramento, CA: Authors.
CDE, Educational Demographics Unit. (1997, January). Count of certificated and classified staffin California public school districts, in the California Basic Educational Data System(CBEDS). Cited in Fetler, M. (1997, January).
CDE, Educational Demographics Unit, Research, Evaluation and Technology Division. (1997,August). Number, percent, and average salary of new teachers in California publicschools: 1981-82 through 1996-97 (one year of total educational service). Sacramento,CA: Author.
CDE, Educational Demographics Unit. (1998, April). Teacher shortage and demand: Schoolyear 1997-98. Sacramento, CA: Author.
CDE, Educational Demographics Unit. (1998). Course listing enrollment and staff in Californiapublic schools, October 1997. Sacramento, CA: Author. Retrieved in 1999 from CBEDSdemographics reports on the World Wide Web:http://www.cde.ca.gov/demographics/reports/
CDE, Educational Demographics Unit. (1998). Enrollment in California public schools byethnic designation, 1981-82 through 1998-99. Sacramento, CA: Author. Retrieved in1999 from CBEDS demographics reports on the World Wide Web:http://www.cde.ca.govidemographics/reports/.
CDE, Educational Demographics Unit. (1998). Number of teachers in California schools byethnic group, 1981-82 through 1997-98. Sacramento, CA: Author. Retrieved in 1999from CBEDS demographics reports on the World Wide Web:http://www.cde.ca.gov/demographics/
CDE. (1999, June). Summary data as of June 1999: K-3 class size reduction program.Sacramento, CA: Author.
154 159
CDE. (1999). AB IX California Peer Assistance and Review program for teachers: Highlights.Retrieved August 1999, from the World Wide Web:http://www.cde.ca.gov/ABIXHIGH.HTM
CDE. (1999). 1998 STAR reports research files Sacramento, CA: Author. Retrieved in 1999from CBEDS databases on the World Wide Web:http://star.cde.ca.gov/star98/research_index.html
CDE, Educational Demographics Unit. (1999). School-level teacher certification data.Compiled by special request. Unpublished.
CDE, Educational Demographics Unit. (1999). Statewide classroom teacher credential andexperience report for the year 1998-99. Sacramento, CA: Author.
CDE, Educational Demographics Unit. (1999). Statewide enrollment in California publicschools by ethnic group, 1998-99. Sacramento, CA: State of California, Department ofFinance.
California Institute for School Improvement. (1997). 1997 School program update resourcebook. Sacramento, CA: Author.
California Professional Development Reform Initiative (CPDRI). (1999, April). Designs forlearning, high quality professional development: How do we find time? (Draft).Sacramento, CA: Author.
CPDRI. (1999, April ). Design for learning, California field guide for teachers' professionaldevelopment. (Draft). Sacramento, CA: Author.
California State Teachers' Retirement System (STRS). (1998). Population information forfiscal year 1997-1998. Sacramento, CA: Author.
California State University Institute for Education Reform. (1996, September). A state ofemergency ... in a state of emergency teachers. Sacramento, CA: Author.
California State University Presidents' Commission on Teacher Education. (1998). Teachereducation for the twenty-first century. Long Beach, CA: Office of the President, CaliforniaState University.
Center for the Future of Teaching and Learning. (1998, March). A review of proposed statebudget expenditures for fiscal 1998-99 teacher professional development. Santa Cruz, CA:Author.
Choy, S. P., et al. (1993). Schools and staffing in the United States: A statistical profile, 1990-91. Washington, DC: National Center for Education Statistics, U.S. Department ofEducation.
Cohen, D. K., & Das, H. (1996, July). The need for teachers in California. (Working paperseries, Policy Analysis for California Education). Berkeley, CA: University of Californiaat Berkeley.
155160

Cohen, D. K., & Hill, H. (1998, January). CPRE policy briefs: State policy and classroomperformance: Mathematics reform in California. Philadelphia, PA: Consortium forPolicy Research in Education.
Corcoran, T., Wang, A., & Foley, E. (1999). What kinds of professional development buildcapacity better? An analysis of the impact of professional development on teaching practicein the school district of Philadelphia. Philadelphia, PA: Consortium for Policy Research inEducation.
Darling-Hammond, L. (1990). Teaching and knowledge: Policy issues posed by alternativecertification of teachers. Peabody Journal of Education, 67(3), 123-154, cited in Smylie(1994).
Darling-Hammond, L. (1999). Solving the dilemmas of teacher supply, demand, andstandardsHow we can ensure a competent, caring, and qualified teacher for every child.Retrieved October 15, 1999, from the World Wide Web:http://www.tc.columbia.edu/-teachcomm/CONFERENCE-99/SOLVING/
Darling-Hammond, L. (1999). Professional development for teachers: Setting the stage forlearning from teaching. Santa Cruz, CA: The Center for the Future of Teaching andLearning.
Daro, P. (1999). Teachers and standards. Santa Cruz, CA: The Center for the Future ofTeaching and Learning.
Eastin, D. (1999, June). Draft letter from State Superintendent of Instruction to parents.
Fetler, M. (1997, January). Where have all the teachers gone? Education policy analysisarchives, 5(2).
Fetler, M. (1999, March). High school staff characteristics and mathematics test results.Education Policy Analysis Archives, 7(9).
Fideler, E. & Haselkorn, D. (1999). Learning the ropes: Urban teacher induction programsand practices in the United States. Belmont, MA: Recruiting New Teachers, Inc.
Gandara, P., & Maxwell-Jolly, J. (1999). Preparation for teaching California's culturally andlinguistically diverse students. Santa Cruz, CA: The Center for the Future of Teaching andLearning.
Goldhaber, D., & Brewer, D. (1999). Teacher licensing and student achievement. In M.Kanstoroom & C. Finn (Eds.), Better teachers, better schools. Washington, DC: ThomasB. Fordham Foundation.
Gray, L., et al. (1993). New teachers in the job market. 1991 update. Washington, DC: U.S.Department of Education, Office of Educational Research and Improvement.
Hanushek, Eric A. (1992). The trade-off between child quantity and quality. Journal ofPolitical Economy. Cited in Haycock (1998).
156 161
Haselkorn, D., Harris, L., & Fide ler, E. (1998). The essential profession. Belmont, MA:Recruiting New Teachers, Inc.
Haycock, K. (1998, Summer). Good teaching matters... A lot. Thinking K-16, 3(2), TheEducation Trust, Washington, DC.
Little, J. W. & McLaughlin, M.W. (1993). Teachers' work. Individuals, colleagues andcontexts. New York: Teachers College Press.
Little, J. W., Gerritz, W. H., Stern, D. S., Guthrie, J. W., Kirst, M. W., & Marsh, D. D. (1987,December). Staff development in California: Public and personal investments, programpatterns, and policy choices. San Francisco, CA: Far West Laboratory & Berkeley, CA:PACE.
Lowney, R. (1986). Mentor teachers: The California model. Phi Delta Kappa Fastback Series.Bloomington, IN: Phi Delta Kappa, cited in Mitchell, D., Scott, L., & Hendrick, I. (1996,June). California Mentor Teacher Program evaluation. Riverside, CA: CaliforniaEducational Research Cooperative.
McKibbin, Michael. (1998, January). Teaching internship programs: Alternative preparationand licensure in California: Purposes, procedures and performance. Sacramento, CA:CTC.
McKibbin, Michael, D., & Schrup, Marie G. (1995). Alternative certification program optionsin California. Issues in Teacher Education, 4(1), 5-11.
Mitchell, D., Scott, L., Takahashi, S., & Hendrick, I. (1997, June). The California BeginningTeacher Support and Assessment program: A statewide'evaluation study. Riverside, CA:California Educational Research Cooperative.
Monk, D. (1994). Subject area preparation of secondary math and science teachers and studentachievement. Economics of Education Review, 13(2).
National Assessment of Educational Progress. (1994). The nation's report card. Washington,DC: National Center for Educational Statistics.
National Center for Education Statistics. (1997). Projections of education statistics to 2007.Washington, DC: Author.
National Commission on Teaching & America's Future. (1996, September). What mattersmost: Teaching for America's future. New York: Author.
Odell, S. (1986). Induction support of new teachers: A functional approach. Journal of TeacherEducation, 37, 26-30. Cited in Smylie (1994).
Outreach Task Force for the Board of Regents of the University of California. (1997, July).New directions for outreach: A report of the University of California Outreach TaskForce. Oakland, CA: Author.
151 6 2
Rowan, B., Chiang, F., & Miller, R. (1997, October). Using research on employees'performance to study the effects of teachers on students' achievement. Sociology ofEducation, 70.
Sanders, W. J., & Rivers, J. C. (1996). Cumulative and residual effects of teachers on futurestudents academic achievement. Knoxville, TN: University of Tennessee, Value-AddedResearch and Assessment Center.
Schwartz, J. (1997, February 12). Policy brief: Class size reduction. Sacramento, CA:Legislative Analyst's Office (LAO).
Shields, P. M., David, J. L., Humphrey, D. C., & Young, V. M. (1999). Evaluation of the PewNetwork for Standards-Based Reform: Third year report. Menlo Park, CA: SRIInternational.
Shields, P. M., Marsh, J. M., Marder, C., & Wilson, C. L. (1998, March). A case study ofCalifornia's SSI (CAMS). Menlo Park, CA: SRI International.
Shields, P. M., Marsh, J. M., & Powell, J. (1998). An inventory of the status of teacherdevelopment in California. Menlo Park, CA: SRI International.
Smylie, M. (1994). Redesigning teachers' work: Connections to the classroom. In LindaDarling-Hammond, (Ed.). Review of research in education, volume 20. Washington, DC:American Educational Research. Association.
Sparks, J. (1999). Davis reforms. Education Beat, 9(5), 4-5.
State of California, Department of Finance. (1998, December). Historical state populationestimates with components of change and crude rates, July 1, 1941-1998. Sacramento,CA: Author.
State of California, Department of Finance. (1998). California public K-12 enrollmentprojections by ethnicity, 1998 series. Sacramento, CA: Author.
St. John, M. (1996). The California Subject Matter Projects. Summary of evaluation findings1993 to 1996. Inverness, CA: Inverness Research Associates.
Stoddart, T. (1998). California prepares teachers for diversity: The California Consortium forTeacher Development. Paper presented at the annual meeting of the American EducationalResearch Association. San Diego, CA.
Talbert, J.E. & McLaughlin, M. W. (1993). Understanding teaching in context. In Cohen, D.K.,McLaughlin, M.W. & Talbert, J.E. (1993). Teaching for understanding: Challenges forpolicy and practice. San Francisco, CA: Jossey Bass.
Tierney, D. (1994). A study of the employment patterns of graduates of California teachereducation programs and the employment decisions of a selected sample of Californiaschool districts. Sacramento, CA: CTC, Professional Services Division.
158 1 6 3
APPENDIX. DATA COLLECTION METHODS AND ANALYSES
This study was conducted in two phases. Phase I consisted of an inventory of secondary
data pertaining to teacher development in California. Phase II consisted of two primary data
collection activities: a teacher survey and a series of case studies.
Inventory
Phase I was designed to provide an "outside-in" view of the system of teacher
development, focused around the key topics of teacher supply and demand, preparation,
recruitment, induction, professional development, and compensation. Data collection methods
included review of previous studies and reports, analyses of available statewide databases,
review of legislation and program documents, and interviews with key actors throughout the
state.
The end product of Phase I, the Inventory of the Status of Teacher Development in
California, published in June 1998, provides a statistical portrait of the system of teacher
development, a description of relevant teacher development policies, and a review of evaluations
of programs aimed at strengthening the system of teacher development.
The supply and demand chapter of the Inventory was updated and reissued as a separate
draft report in April 1999. Specific new analyses included in this memo were estimated impacts
of two specific preparation and induction policies, the potential size of the retirement "bulge,"
and the growth of intern programs.
Statewide Teacher Survey
The purpose of the teacher survey was to capture teachers' perspectives on their own career
development. Based on a stratified random sample of 1,000 K-12 teachers across the state, it
was designed to provide a representative portrait of teachers' views about the extent, nature, and
effectiveness of various professional learning opportunities.
Teacher Survey Design
The survey asked teachers to report on a variety of topics, grouped into the following
sections:
Attitudes about teaching
Teaching assignment and preparation
A -1164

Job search and support for new teachers
Workplace support and professional development
Compensation
Standards
Teacher background.
The survey instrument included proportionately more items on topics for which we found
significant gaps in existing statewide data during our Phase I work. For example, given the
dearth of current information on teachers' ongoing support and professional development, we
made the professional development and workplace support section significantly more
comprehensive than other sections.
To improve the accuracy of survey responses, respondents were given specific instructions
about the time periods that each item referred to, and certain types of teachers were skipped out
of sections for which they were not appropriate respondents. Table A-1 describes the types of
respondents for each section and the time periods the items inquired about.
The survey was developed through an iterative process that incorporated input from the
research community, including Judith Warren Little at UC Berkeley and Joan Talbert at Stanford
University, and practitioners, many of whom are among the initiative's cosponsors and Task
Force members, as well as Bay Area teachers. The draft survey was piloted with 10 teachers to
assess completion time and the comprehensibility of each survey item.
Sampling Procedures
The optimum sampling strategy would have been a simple random sample of teachers
drawn from the full pool of the approximately 284,000 teachers in the state in 1998-99.
Unfortunately, an accurate and up-to-date list of practicing teachers was not available. Given
these constraints, we opted for a two-stage sampling approachfirst selecting a stratified
random sample of schools within California and then selecting teachers within those schools to
create a sample representative of the statewide population of teachers within each cell created by
the strata discussed below.
School Sample. The sampling frame for schools was developed by using the 1996-97 and
1997-98 California Basic Educational Data System (CBEDS) database. Eligible schools were
those schools identified in the CBEDS database as elementary, middle, junior, or high (we
excluded the less traditional schools, such as alternative high schools or community day schools,
to allow for a more focused analysis of the experiences of teachers within the most typical school
settings in the state). The 7,074 schools were stratified along two dimensions: the size of their
Af6 5
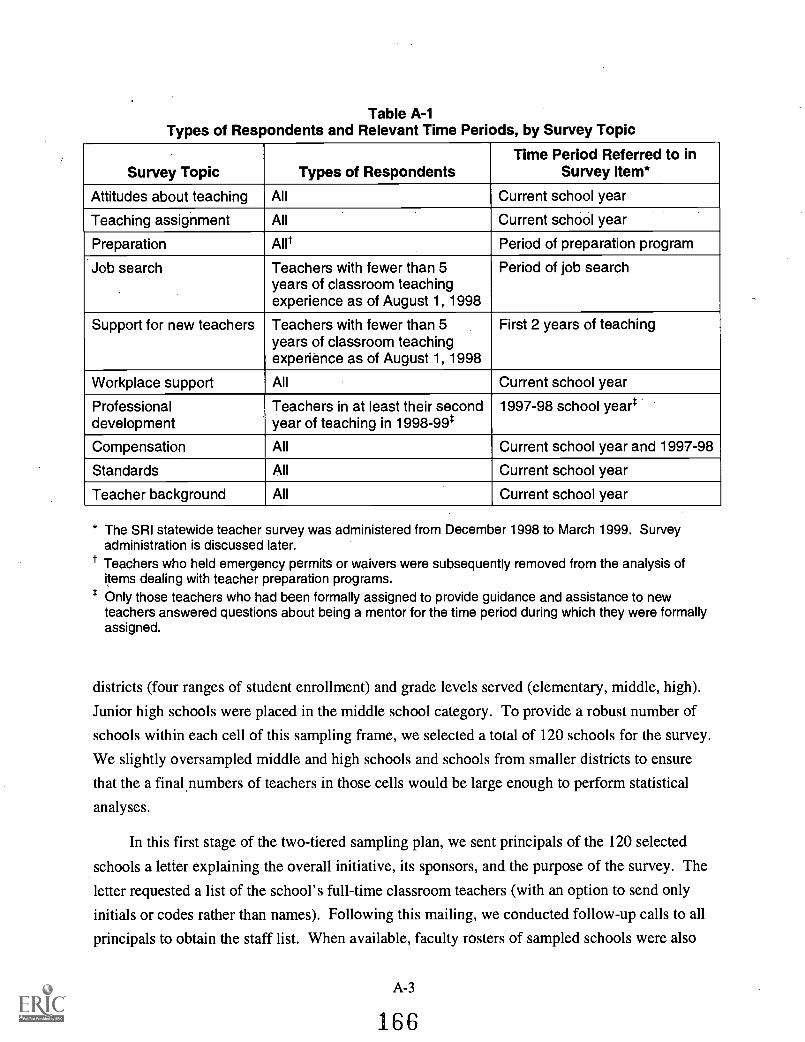
Table A-1Types of Respondents and Relevant Time Periods, by Survey Topic
Survey Topic Types of RespondentsTime Period Referred to in
Survey Item*
Attitudes about teaching All Current school year
Teaching assignment All Current school year
Preparation Alit Period of preparation program
Job search Teachers with fewer than 5years of classroom teachingexperience as of August 1, 1998
Period of job search
Support for new teachers Teachers with fewer than 5years of classroom teachingexperience as of August 1, 1998
First 2 years of teaching
Workplace support All Current school year
Professionaldevelopment
Teachers in at least their secondyear of teaching in 1998-99*
1997-98 school year*
Compensation All Current school year and 1997-98
Standards All Current school year
Teacher background All Current school year
* The SRI statewide teacher survey was administered from December 1998 to March 1999. Surveyadministration is discussed later.
t Teachers who held emergency permits or waivers were subsequently removed from the analysis ofitems dealing with teacher preparation programs.
t Only those teachers who had been formally assigned to provide guidance and assistance to newteachers answered questions about being a mentor for the time period during which they were formallyassigned.
districts (four ranges of student enrollment) and grade levels served (elementary, middle, high).
Junior high schools were placed in the middle school category. To provide a robust number of
schools within each cell of this sampling frame, we selected a total of 120 schools for the survey.
We slightly oversampled middle and high schools and schools from smaller districts to ensure
that the a final.numbers of teachers in those cells would be large enough to perform statistical
analyses.
In this first stage of the two-tiered sampling plan, we sent principals of the 120 selected
schools a letter explaining the overall initiative, its sponsors, and the purpose of the survey. The
letter requested a list of the school's full-time classroom teachers (with an option to send only
initials or codes rather than names). Following this mailing, we conducted follow-up calls to all
principals to obtain the staff list. When available, faculty rosters of sampled schools were also
A-3
166
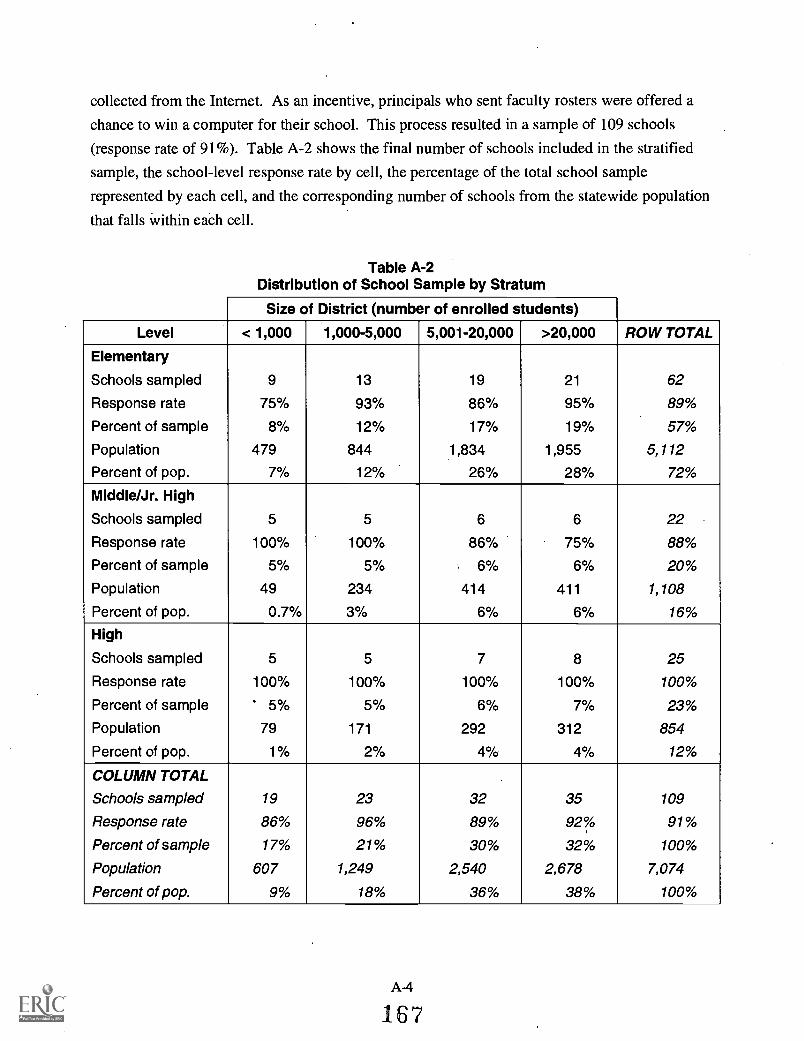
collected from the Internet. As an incentive, principals who sent faculty rosters were offered a
chance to win a computer for their school. This process resulted in a sample of 109 schools
(response rate of 91%). Table A-2 shows the final number of schools included in the stratified
sample, the school-level response rate by cell, the percentage of the total school sample
represented by each cell, and the corresponding number of schools from the statewide population
that falls within each cell.
Table A-2Distribution of School Sample by Stratum
Size of District (number of enrolled students)
Level < 1,000 1,000-5,000 5,001-20,000 >20,000 ROW TOTAL
Elementary
Schools sampled 9 13 19 21 62
Response rate 75% 93% 86% 95% 89%
Percent of sample 8% 12% 17% 19% 57%
Population 479 844 1,834 1,955 5,112
Percent of pop. 7% 12% 26% 28% 72%
Middle/Jr. High
Schools sampled 5 5 6 6 22
Response rate 100% 100% 86% 75% 88%
Percent of sample 5% 5% 6% 6% 20%
Population 49 234 414 411 1,108
Percent of pop. 0.7% 3% 6% 6% 16%
High
Schools sampled 5 5 7 8 25
Response rate 100% 100% 100% 100% 100%
Percent of sample . 5% 5% 6% 7% 23%
Population 79 171 292 312 854
Percent of pop. 1% 2% 4% 4% 12%
COLUMN TOTAL
Schools sampled 19 23 32 35 109
Response rate 86% 96% 89% 92% 91%
Percent of sample 17% 21% 30% 32% 100%
Population 607 1,249 2,540 2,678 7,074
Percent of pop. 9% 18% 36% 38% 100%
A-4
167
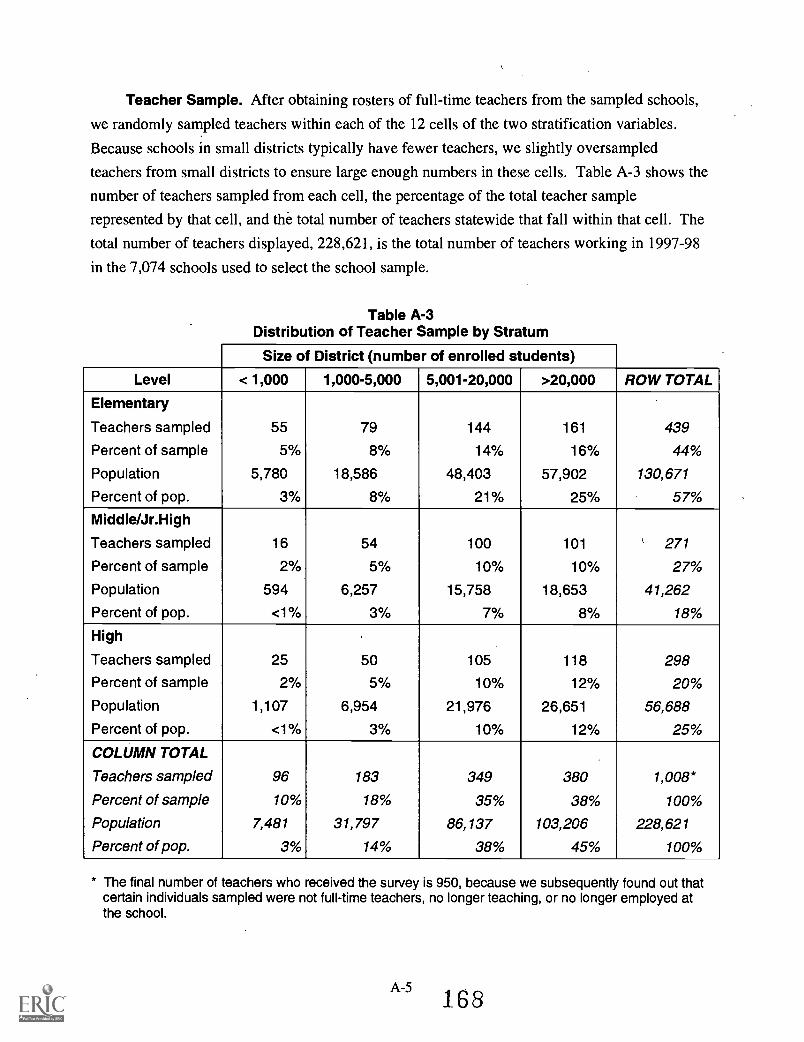
Teacher Sample. After obtaining rosters of full-time teachers from the sampled schools,
we randomly sampled teachers within each of the 12 cells of the two stratification variables.
Because schools in small districts typically have fewer teachers, we slightly oversampled
teachers from small districts to ensure large enough numbers in these cells. Table A-3 shows the
number of teachers sampled from each cell, the percentage of the total teacher sample
represented by that cell, and the total number of teachers statewide that fall within that cell. The
total number of teachers displayed, 228,621, is the total number of teachers working in 1997-98
in the 7,074 schools used to select the school sample.
Table A-3Distribution of Teacher Sample by Stratum
Size of District (number of enrolled students)
Level < 1,000 1,000-5,000 5,001-20,000 >20,000 ROW TOTAL
Elementary
Teachers sampled 55 79 144 161 439
Percent of sample 5% 8% 14% 16% 44%
Population 5,780 18,586 48,403 57,902 130,671
Percent of pop. 3% 8% 21% 25% 57%
Middle/Jr.High
Teachers sampled 16 54 100 101 ' 271
Percent of sample 2% 5% 10% 10% 27%
Population 594 6,257 15,758 18,653 41,262
Percent of pop. <1% 3% 7% 8% 18%
High
Teachers sampled 25 50 105 118 298Percent of sample 2% 5% 10% 12% 20%
Population 1,107 6,954 21,976 26,651 56,688
Percent of pop. <1% 3% 10% 12% 25%
COLUMN TOTAL
Teachers sampled 96 183 349 380 1,008*
Percent of sample 10% 18% 35% 38% 100%
Population 7,481 31,797 86,137 103,206 228,621
Percent of pop. 3% 14% 38% 45% 100%
* The final number of teachers who received the survey is 950, because we subsequently found out thatcertain individuals sampled were not full-time teachers, no longer teaching, or no longer employed atthe school.
A-5 ,
168

Survey Administration. The teacher mail survey was administered from December 1998
through February 1999. In the first mailing, we sent each teacher a packet containing an
explanatory letter signed by the Task Force cosponsors, a survey, a postage-paid reply envelope,
and $5 as a token of appreciation. To encourage teachers to respond promptly, we offered
teachers who returned their completed surveys a chance to win one of 10 computers. SRI logged
returned surveys by unique identification numbers in a response tracking system. Ten days after
the initial mailing, we sent reminder postcards to all nonrespondents. After another 2 weeks, we
sent nonrespondents a second survey.
To maximize the response rate, a market research firm specializing in phone surveys
conducted a telephone survey of nonrespondents after the second survey mailing. Trained
telephone interviewers administered the phone survey during a 4-week period in March 1999.
Teachers were telephoned regularly until they granted a phone interview, refused to participate,
or were determined ineligible. We directed the interviewers to expend particular effort on
raising response rates in cells that were relatively low. The phone survey was abbreviated to
include the most critical items on teacher development and teacher demographic data to enable
analysis of nonresponse bias. Because teachers who responded by telephone did not respond
initially by mail, the data retrieved through the phone survey was also used to determine whether
there was a nonresponse bias. We compared the survey responses of teachers who responded to
initial requests by mail and those who responded only when phoned. In doing so, we found no
evidence of differential response patterns between the two groups and therefore made no
adjustments to reflect a nonresponse bias.
Seventy-two percent of all teachers in the original sample responded by returning their mail
survey or participating in a telephone interview (Table A-4). However, many teachers who were
sent surveys were eventually determined to be ineligible, because it was learned that they were
no longer teaching, were not teaching at the same school, or were not teaching full-time. Taking
into account that many teachers were unavailable or ineligible to respond, the final response rate
for the teacher survey was 77%.
SRI statistical programmers reviewed returned questionnaires to resolve any invalid codes
and internal inconsistencies before data entry. A reliable data entry firm entered and 100% key
verified the questionnaire data. Data files were cleaned and phone and mail survey data were
merged before conducting any analyses.
A-6 169

Table A-4Teacher Survey Response Rates by Stratum
Size of District (number of enrolled students)
Level < 1,000 1,000-5,000 5,001-20,000 >20,000 ROW TOTAL
Elementary
Respondents 42 57 105 105 309
Response rate 79% 75% 76% 72% 75%
Middle/Jr. High
Respondents 12 39 82 71 204
Response rate 80% 76% 86% 76% 80%
High
Respondents 17 34 79 86 216
Response rate 77% 71% 78% 76% 76%
COLUMN TOTAL
Respondents 71 130 266 262 729
Response rate 79% 74% 80% 75% 77%
Survey Analysis
All survey analysis was conducted with the statistical software package SUDAAN. We
chose to use that software for its capability in weighting data from the complex multistage
sample of teachers. Using weighted data for all analyses, we conducted the following iterative
analytical steps:
We calculated means and frequencies for each item of the survey.
We developed cross-tabulations for independent variables of interest. Table A-5presents three key independent variables that were used in cross-tabulations of mostsurvey items.
Chi-square tests were used to determine statistical differences between the distributionof groups on categorical variables.
For analyses of Likert scales, F-tests were used to determine the overall significance ofan item for independent variables consisting of more than two groups (e.g., percentminority students in respondent's schools has four groups). Contrast tests on the meansthen determined the specific groups that explained the significance of the F-tests. Forindependent variables of two groups, we used independent t-tests on the means of theLikert scales to determine significance (e.g., elementary versus secondary schoollevels).
A-7 170

Table A-5Selected Key Independent Variables
Independent Variable Categories
Percent minority students in 0% - 30% minority studentsrespondent's school > 30% - 60%
> 60% - 90%
> 90% -100%
Percent students in respondent's 0% 25% students receiving free lunchschool receiving free lunch > 25% 50%
> 50% - 75%
> 75% -100%
Percent emergency teachers in 0% 10% emergency teachersrespondent's school > 10% 20%
> 20%
One key analysis is the impact of different stages of the teacher development continuum on
helping teachers master selected skills outlined in the California Standards for the Teaching
Profession (CSTP). Items 10, 20, and 29 in the survey are based on the CSTP and ask teachers
the degree to which their preparation programs, induction activities, and professional
development activities helped them gain the specific CSTP skills. To analyze these items, we
collapsed these 13 stem items into 6 groups, organized by topic, or skill, according to the CSTP.
Table A-6 shows which stems were used to create average means in each skill area.
Case Studies of Local Teacher Development Systems
To complement the breadth of statewide data gathered through both the Inventory and the
teacher survey, we conducted in-depth case studies of eight local systems of teacher
development. These case studies examined teachers' career decisions and learning opportunities,
the effectiveness of these opportunities, and the extent to which the current system of teacher
development is integrated and coherent. The cases allowed for exploration and, in some
instances, explanation of patterns that appeared in the statewide data.

Table A-6Detail on Analysis of Survey Items Based on the CSTP
CSTP Skill Area Stem(s) from Items 10, 20, and 29
Engaging all students b. Help students to connect classroom learning to their lifeexperiences and cultural understandings.
c. Use strategies that support subject-matter learning andlanguage development for second language learners.
d. Engage students in problem-solving activities that can besolved in multiple ways.
Creating effectiveenvironments
e. Help students accept and respect different experiences,ideas, backgrounds, feelings, and points of view.
f. Help students to internalize classroom rules, routines, andprocedures and to become self-directed learners.
Understanding subject matter a. Understand subject matter in sufficient depth and.communicate that understanding to my students.
g. Develop and use a repertoire of instructional strategies wellsuited to teaching a particular subject matter.
h. Select and use instructional materials and resources thatpromote students' understanding of subject matter.
i. Use educational technology (e.g., computers, multimedia) toconvey key concepts in the subject-matter area.
Planning Instruction j. Plan lesson content and instructional strategies that areappropriate to student learning needs.
Assessment k. Ensure that student learning goals reflect key subject-matterconcepts, skills, and applications.
I. Use assessment tools that are matched to and support mygoals for student learning.
Engaging with students'families*
m. Engage in positive dialogue and interactions with families,and respond to their concerns about student progress.
* Based on item from the "professional development" skill area in CSTP.
Sample of Local Systems. Each case captured a local system of teacher development.
Here we use the term "system" loosely to capture the constellation of teacher development
opportunities available to and used by teachers, as well as the set of local policies and practices
that support teachers' work and influence their decisions. We conceptualized each local system
by considering first the teacher who is working in a particular school contextthe norms,
policies, and practices of which go far to define learning opportunities and to influence decisions.
The school context is nested within the district, the resources, policies, and practices of which
influence what happens in the school. The district, in turn, is situated within the broader system
A -9 172

of teacher development opportunities and resources provided by the state and federal
governments.
We sampled eight local systems of teacher development, selected to reflect a range of
access to teacher development resources ("high" and "typical"), different levels of urbanicity,
and the many "Californias." By "high" access to teacher development resources, we mean
districts that have a tradition of strong relationships with local colleges and universities or where
there are significant external resources to support teacher development. "Typical" access refers
to cases in which the district and county provide most of the teacher development support
without significant help from external resources. Cases were selected on the basis of
nominations from the field and background screening by telephone. Table A-7 illustrates the
sampling frame for the case studies.
Table A-7Case Study Sampling Frame
Access to TeacherDevelopment Resources Urban Suburban Rural
High access Los Angeles
San Diego
Elk Grove
Santa Monica
Eureka
Typical access San Francisco Selma El Centro
School and Teacher Samples. Within each local system, we sampled four schools: two
elementary, one middle, and one high school. We chose schools that matched the demographics
of the district overall and, when possible, had higher test scores than other district schools.
Typically, all four schools were within a single district and the same feeder pattern. However, in
El Centro, we included two smaller districts in the sample, an elementary and a high school
district in the same feeder pattern.
Within each school, we sampled four teachers: two "new" teachers (defined as 5 or fewer
years of teaching experience) and two "experienced" teachers (more than 5 years of teaching
experience). Where possible, at the elementary level, we selected two primary grade teachers
and two upper elementary grade teachers; at the middle school level, two English/social studies
teachers and two math/science teachers; and at the high school level, two English and two math
teachers. Within this mix of teachers, we also included BTSA support providers, BTSA
participants, mentor teachers, emergency-permit teachers, newly credentialed teachers, district
interns, and teachers highly involved in professional development and those relatively
uninvolved.
A-10 173

This strategy provided a sample size of 9 districts, 32 schools, and 128 teachers, as shown
in Table A-8.
Table A-8Case Study Sample
Level Districts Schools Teachers
Elementary 2 16 64
Middle 0 8 32
High 1 8 32
Unified 6 N/A N/A
Total 9 32 128
Site Visits. Site visits to the eight systems were conducted during the 1998-99 school
year, and ranged from 5 to 12 person-days on-site in teams of 2 to 3 researchers, depending on
the complexity of the local system. In each system, we conducted in-depth interviews of
teachers, administrators, and district-level personnel. Table A-9 lists the types of interviewees.
We also conducted focus groups with teachers. Interviews and focus groups with newer teachers
emphasized teachers' preparation, recruitment, and induction experiences. Interviews and focus
groups with more experienced teachers focused on professional development, compensation, and
evaluation issues. Interviews and focus groups were semistructured, framed by interview topic
guides that were flexible enough to capture the respondents' unique stories but had sufficient
prompts to provide an acceptable level of data uniformity to permit cross-case comparisons.
Table A-9Case Study Interviewees
Level Types of Interviewees
School Teachers
Principals
Specialists with teacher support roles (e.g., reading specialist)
District Superintendent
Curriculum specialists, coaches, staff developers, professionaldevelopment coordinators, BTSA coordinator
Recruiting and hiring managers
District intern program administrators
External to district Teacher educators in partner programs
Teacher educators in local IHEs

Case Study Analysis. Detailed case study debriefing forms guided the preparation of
internal case study reports. Each site visiting team was responsible for analyzing the data
collected for its own site and synthesizing the data in the case study reports. Two analytic
meetings with all site visitors were held to discuss findings within and across cases, and to
develop cross-site themes for each major category of teacher development as reviewed in the
Inventory (i.e., supply and demand, recruitment, preparation, etc.). We analyzed case study data
according to various strata by which we sampled (i.e., access to teacher development resources
and urbanicity), as well as other variables that emerged as salient, particularly the percent
minority students in the school, student poverty, and school level.
Integrated Analysis. Teacher survey data analyses were compared with themes emerging
from case study data for each of the major categories of the teacher development continuum.
Case study data provided rich and textured examples of patterns found in the survey data.
Disconfirming survey and case study data were examined as to the causes of the discrepancy.
Projecting Supply and Demand
Using the best available historical data beginning with 1991-92, we projected the demand
for total teachers and the number of credentialed teachers employed in the teaching workforce
from 1999-2000 through 2007-08. The primary goals of the projections are to provide estimates
of the impact of two key state policiesthe expansion of BTSA and the expansion of CSU
credentials producedand to inform the question of whether and when the number of
credentialed teachers taking jobs in California will meet the demand for them. Although the
state has passed numerous other policies, as discussed in Chapter 2, the lack of solid empirical
data regarding their implementation precludes our ability to forecast, however crudely, their
potential effects. We recognize that, even for the projections that we did undertake, results vary
widely, depending on certain assumptions. Key assumptions have substantial impacts on the
projections, and thus we have used sensitivity analyses under multiple scenarios to provide the
range of potential impacts.
The method of calculating the projected supply and demand followed these general steps:
1 Total demand calculations
2. Status quo calculations (before BTSA and CSU expansion impacts)
3. Incremental impact of BTSA expansion
4. Incremental impact of CSU expansion
A-12 175

5. Calculation of remaining gap, i.e., emergency permit and waiver teachers.
Total Demand Calculations
Total demand for credentialed teachers is a function of projected student enrollment, pupil-
to-teacher ratio, and attrition and retirement rates. These assumptions are detailed in Table A-10
below.
Table A-10Demand Factors and Assumptions
Demand Factor Assumptions
Projected studentenrollment
Actual 1998-99 student enrollment from CDE plus annualgrowth rate of 1% from Department of Finance Projections,1998 Series'
Pupil-to-teacher ratio Actual 1998-99 statewide pupil-to-teacher ratio of 20.6calculated by dividing CDE-reported total enrollment byCDE-reported total teachers for 1998-99. Pupil-to-teacherratio held constant through 2007-08.
Attrition rate Estimated 6% of total teacher workforce annually2 heldconstant through 2007-08.
Retirement rate Estimated retirement rates using STRS membership datafrom the fiscal 1998 annual report.3 A retirement rate indexwas created based on total STRS membership data andapplied to estimated historical average K-12 teacherretirement rate of 2°/04 (see discussion of retirement bulgebelow).
Retirement Bulge. Rather than keeping a flat assumed retirement rate, we factored a
retirement bulge into the demand projections to account for the impending retirement of baby
boomers. Using data from the STRS fiscal year 1998 annual report,5 the total number of active
members was forecast by applying 10-year (1989-98) historical averages for the annual
percentage of members turning inactive and the annual percentage of members joining STRS.
The annual number of retiring members from 1999-2000 to 2007-08 was projected by using
actual age-based data. Members aged 51 to 59 in 1998-99 were assumed to retire at the STRS
members' average retirement rate of 60 from 1999-2000 through 2007-08. The number of
annual retired members was calculated as a percentage of total estimated members for that year.
The corresponding annual retirement rates were indexed to the 10-year (1989-98) average STRS
members' retirement rate. The resulting index begins at 125 in 1999-2000 and increases to 263
in 2007-08, which, when applied to the estimated historical average of 2% for K-12 teachers,
results in 2.5% retirement rate in 1999-2000, increasing to 5.3% in 2007-08.

Supply Calculations
The supply of credentialed teachers taking jobs in California includes veteran credentialed
teachers deciding to continue teaching, newly credentialed teachers, reentrants, and out-of-state
teachers. As we discuss in Chapter 2, "supply" refers to those who hold preliminary or
professional clear credentials as specified by California's Commission on Teacher Credentialing
(CTC) requirements and who are willing to take jobs for the salary, assignment, location, and
working conditions offered. Our supply count does not include those who are teaching with
emergency permits, waivers, or internship credentials from the CTC.
The larger supply pool of teachers qualified to teach but electing not to do so cannot be
estimated with the data available. Table A-11 details the assumptions underlying each
component of supply, before factoring in BTSA and CSU expansion policies.
Table A-11Supply Components and Assumptions
Supply Component Assumptions
Veteran credentialed teachers Estimated credentialed teachers from previous yearless the attrition and retirement rates.
New credentials issued Latest figures from CTC on First Time and New TypeMultiple and Single Subject teaching credentials plusFirst Time Special Education and First Time and NewType Education Specialist credentials from 1997-98,plus annual growth in credentials recommended byprivate institutions based on 5-year (1992-93 to 1996-97) average growth rate. (New Type includes thosewho previously held emergency permits.)6
Newly credentialed teacherstaking jobs (participation rate)
Range of 50% to 70% of new credentials issued eachyear, based on California-specific and nationalsources.7
Reentrants Five years (1992-93 to 1996-97) of historical numbersof reentrants estimated by subtracting the number ofnew teachers from the number of new hires.8 Five-year (1992-93 to 1996-97) average of the estimatednumber of reentrants as a percent of new hires (42%),held constant from 1999-2000 to 2007-08.
Out-of-state new hires Five-year (1993-94 to 1997-98) average number ofout-of-state new credentials of 2,888, held constantfrom 1999-2000 to 2007-08.
BTSA Expansion Calculations. School year 1998-99 was the first year of increased
BTSA funding intended to reach newly credentialed teachers in their first or second year of
A-14
177

teaching. As we point out in Chapter 5, districts began BTSA expansion at different stages,
depending on the induction support structures that they previous had in place. Thus, for these
projections, we assume that districts phase in BTSA over 2 years so that 1999-2000 is the first
year that all newly credentialed teachers receive BTSA.
BTSA is intended to improve retention rates of new teachers. Specifically, newly
credentialed teachers who take teaching jobs would receive BTSA support in their first 2 years of
teaching; consequently, the attrition rate among them would decrease. Under an optimistic
(high) scenario, BTSA would improve retention to 80% in the first 5 years, slightly lower than
the retention rate of 90% found in the pilot California New Teacher Project. The low scenario
uses a retention rate of 60% over the first 5 years, a slight improvement over historical attrition
of approximately 50% found in previous studies.9 Both high and low retention rates are applied
to the two participation rates of newly credentialed teachers, 50% and 70% (discussed in Table
A-11). Table A-12 details the four scenarios of BTSA expansion.
Table A-12Scenarios of Incremental Impact of BTSA Expansion
Five-Year Attrition Rate
Participation Rate of Newly Credentialed Teachers
50% 70%
60% Scenario 1 Scenario 3
80% Scenario 2 Scenario 4
For each scenario, we estimate the incremental BTSA impact by subtracting the number of
newly credentialed teachers who otherwise would have stayed in teaching (50% over the first 5
years) from the numbers of teachers retained at the improved BTSA retention rates. The
projections resulting from the low and high extremes (Scenarios 1 and 4), which bound the range
of projected incremental BTSA impacts, are included in Chapter 2.
CSU Expansion Calculations. Legislation funds CSU expansion up to a total credential
production of 15,000 per year (up from approximately 12,000 in 1996-97 and 13,800 in 1997-
98). Whereas total credential production includes renewals, first-time and new type credentials
recommended by CSU totaled 9,600 in 1997-98. We assume that the number of first-time and
new type credentials recommended by CSU will increase to meet the total credential production
target of 15,000 (as opposed to an increase in renewals).
The increased slots at CSU may be filled by entirely new teacher candidates, or they may
be filled by those who otherwise would have attended an independent teacher preparation
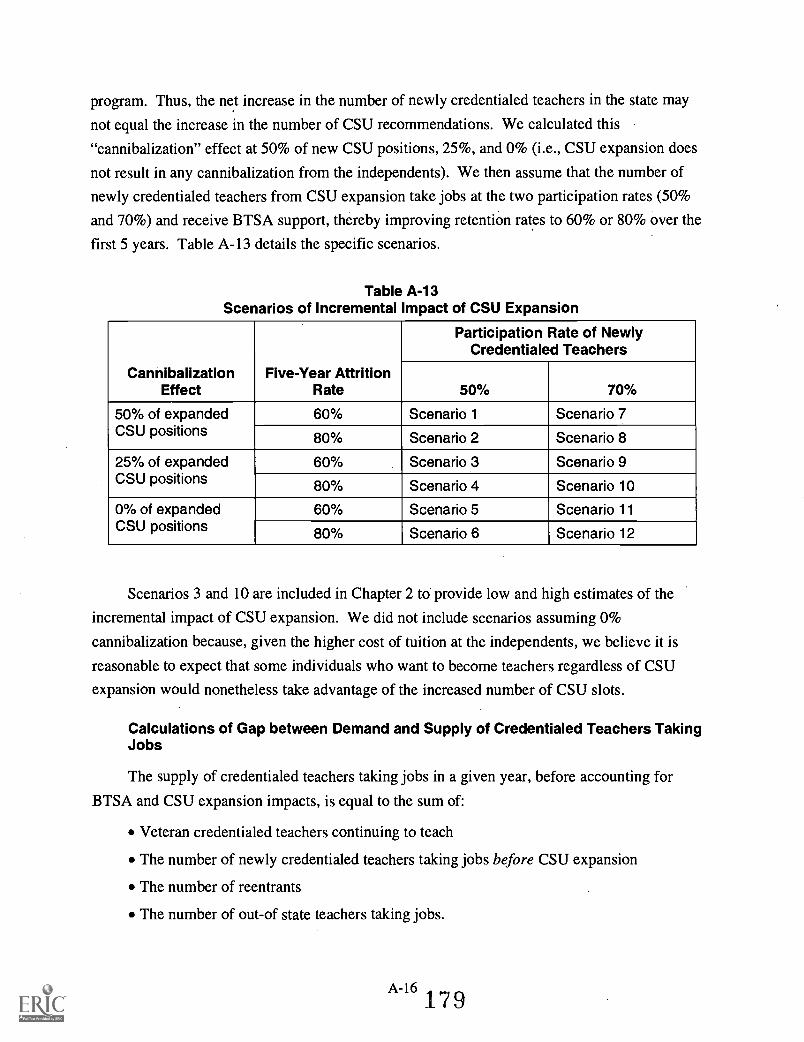
program. Thus, the net increase in the number of newly credentialed teachers in the state may
not equal the increase in the number of CSU recommendations. We calculated this
"cannibalization" effect at 50% of new CSU positions, 25%, and 0% (i.e., CSU expansion does
not result in any cannibalization from the independents). We then assume that the number of
newly credentialed teachers from CSU expansion take jobs at the two participation rates (50%
and 70%) and receive BTSA support, thereby improving retention rates to 60% or 80% over the
first 5 years. Table A-13 details the specific scenarios.
Table A-13Scenarios of Incremental Impact of CSU Expansion
CannibalizationEffect
Five-Year AttritionRate
Participation Rate of NewlyCredentialed Teachers
50% 70%
50% of expandedCSU positions
60% Scenario 1 Scenario 7
80% Scenario 2 Scenario 8
25% of expandedCSU positions
60% Scenario 3 Scenario 9
80% Scenario 4 Scenario 10
0% of expandedCSU positions
60% Scenario 5 Scenario 11
80% Scenario 6 Scenario 12
Scenarios 3 and 10 are included in Chapter 2 to provide low and high estimates of the
incremental impact of CSU expansion. We did not include scenarios assuming 0%
cannibalization because, given the higher cost of tuition at the independents, we believe it is
reasonable to expect that some individuals who want to become teachers regardless of CSU
expansion would nonetheless take advantage of the increased number of CSU slots.
Calculations of Gap between Demand and Supply of Credentialed Teachers TakingJobs
The supply of credentialed teachers taking jobs in a given year, before accounting for
BTSA and CSU expansion impacts, is equal to the sum of:
Veteran credentialed teachers continuing to teach
The number of newly credentialed teachers taking jobs before CSU expansion
The number of reentrants
The number of out-of state teachers taking jobs.
A-16

High projected impacts of BTSA and CSU expansion are combined, as are low projected
impacts to provide the high and low range displayed in Exhibit 2-7 in Chapter 2.
The difference between the total number of teachers required in the state and the projected
high and low supply of credentialed teachers taking jobs, after accounting for BTSA and CSU
expansion, represents the number of teaching positions unfilled by credentialed teachers.
Underqualified teachers would have to take those classrooms to maintain the current pupil-to-
teacher ratio.
Endnotes
2
3
4
5
6
7
8
9
CDE Educational Demographics Unit. (1999). Statewide Classroom Teacher Credential and Experience Reportfor the year 1998-99. Sacramento, CA: Author.
State of California, Department of Finance. (1998). California Public K-12 Enrollment Projections byEthnicity, 1998 Series. Sacramento, CA: Author.
Cohen, D. K., & Das, H. (July 1996). The Need for Teachers in California (Working paper series, PolicyAnalysis for California Education). Berkeley, CA: University of California at Berkeley
Fetler, M. (1997, January). Where have all the teachers gone? Education Policy Analysis Archives, 5(2).
California State Teachers' Retirement System (STRS). (1998). Population information for fiscal year 1997-1998. Sacramento, CA: Author.
Cohen & Das (1996) & Fetler (1997, January).
STRS (1998).
CTC. (1998). Credential profile for fiscal year 1996/97. Sacramento, CA: Author
CTC. (1999). 1997-1998 multiple and single subject teaching credentials. Sacramento, CA: Author.
See Gray, L., et al. (1993). New teachers in the job market. 1991 update. Washington, DC: U.S. Departmentof Education, Office of Educational Research and Improvement.
Choy, S. P., et al. (1993). Schools and staffing in the United States: A statistical profile, 1990-91. Washington,DC: National Center for Educational Statistics, U.S. Department of Education.
Fetler (1997, January).
Fetler (1997, January).
CTC & CDE. (1992). Success for beginning teachers: The California New Teacher Project. Sacramento, CA:Author.
180A-17

U.S. Department of EducationOffice of Educational Research and Improvement (OERI)
National Library of Education (NLE)Educational Resources Information Center (ERIC)
REPRODUCTION RELEASE
I. DOCUMENT IDENTIFICATION:
Title:
(Specific Document)
6/4-a (bc(5416Y1
SP0-bqo.4J
Author(s): P.1114.1 Lam.. 1Auuttfcores14 y7,44.4 U.1449 &irtsY) 1-64.AAk
Publication Date:
Det rrfiCorporate Source:
11V- &AN ((POLL- klit41AM--(3( riaati:Ort-4II. REPRODUCTION RELEASE:
In order to disseminate as widely as possible timely and significant materials of interest to the educational community, documents announced in themonthly abstract journal of the ERIC system, Resources in Education (RIE), are usually made available to users in microfiche, reproduced paper copy,and electronic media, and sold through the ERIC Document Reproduction Service (EDRS). Credit is given to the source of each document, and, ifreproduction release is granted, one of the following notices is affixed to the document.
If permission is granted to reproduce and disseminate the identified document, please CHECK ONE of the following three options and sign at the bottomof the page.
The sample sticker shown below will beaffixed to all Level 1 documents
I
PERMISSION TO REPRODUCE ANDDISSEMINATE THIS MATERIAL HAS
BEEN GRANTED BY
\e
Sad
TO THE EDUCATIONAL RESOURCESINFORMATION CENTER (ERIC)
Level 1
The sample sticker shown below will beaffixed to all Level 2A documents
PERMISSION TO REPRODUCE ANDDISSEMINATE THIS MATERIAL IN
MICROFICHE, AND IN ELECTRONIC MEDIAFOR ERIC COLLECTION SUBSCRIBERS ONLY,
HAS BEEN GRANTED BY
2A
\e
TO THE EDUCATIONAL RESOURCESINFORMATION CENTER (ERIC)
Level 2A
nCheck here for Level 1 release, permitting Check here for Level 2A release, permitting
reproduction and dissemination in microfiche or other reproduction and dissemination in microfiche and inERIC archival media (e.g., electronic) and paper electronic media for ERIC archival collection
copy. subscribers only
Signhere,-)please
The sample sticker shown below will beaffixed to all Level 2B documents
PERMISSION TO REPRODUCE ANDDISSEMINATE THIS MATERIAL IN
MICROFICHE ONLY HAS BEEN GRANTED BY
2B
TO THE EDUCATIONAL RESOURCESINFORMATION CENTER (ERIC)
Level 2B
Check here for Level 2B release, permittingreproduction and dissemination in microfiche only
Documents will be processed as Indicated provided reproduction quality permits.If permission to reproduce is granted, but no box is checked, documents will be processed at Level 1.
I hereby grant to the Educational Resources Information Center (ERIC) nonexclusive permission to reproduce and disseminate this documentas indicated above. Reproduction from the ERIC microfiche or electronic media by persons other than ERIC employees and its systemcontractors requires permission from the copyright holder. Exception is made for non-profit reproduction by libraries and other service agenciesto s 'sfy information needs of educators in response to discrete inquiries.
Org= ization/Address:
/2,3rms,414
rkv Akce -AAAL--Priqt91
lover)

III. DOCUMENT AVAILABILITY INFORMATION (FROM NON-ERIC SOURCE):
If permission to reproduce is not granted to ERIC, or, if you wish ERIC to cite the availability of the document from another source, pleaseprovide the following information regarding the availability of the document. (ERIC will not announce a document unless it is publiclyavailable, and a deperidable source can be specified. Contributors should also be aware that ERIC selection criteria are significantly morestringent for documents that cannot be made available through EDRS.)
Publisher/Distributor:
Address:
Price:
IV. REFERRAL OF ERIC TO COPYRIGHT/REPRODUCTION RIGHTS HOLDER:
If the right to grant this reproduction release is held by someone other than the addressee, please provide the appropriate name andaddress:
Name:
Address:
V. WHERE TO SEND THIS FORM:
Send this form to the following ERIC Clearinghouse:
ERIC CLEARINSriOUSE ON MAC:Tag-4AND TEACHER EDUCATION
1307 New York Avenue, NW, Suite 300Washington, DC 20005-4701
However, if solicited by the ERIC Facility, or if making an unsolicited contribution to ERIC, return this form (and the document beingcontributed) to:
EFF-088 (Rev. 2/2000)
ERIC Processing and Reference Facility4483-A Forbes BoulevardLanham, Maryland 20706
Telephone: 301-552-4200Toll Free: 800-799-3742
FAX: 301-552-4700e-mail: [email protected]
WWW: http://ericfac.piccard.csc.com
Top Related