


Languages
Pages
Legal


®
The contents of this report reflect the views of the authors, who are responsible for the facts and the accuracy of the information presented herein. This document is disseminated under the sponsorship of the Department of Transportation
University Transportation Centers Program, in the interest of information exchange. The U.S. Government assumes no liability for the contents or use thereof.
Evaluation of Work Zone Speed Limits: An Objective and Subjective Analysis of Work Zones in Missouri
Report # MATC-MST: 119 Final Report
Ghulam H. Bham, Ph.D.Assistant ProfessorDepartment of Civil, Architectural and Environmental EngineeringMissouri University of Science and Technology
Mojtaba Ale Mohammadi
2011
A Cooperative Research Project sponsored by the U.S. Department of Transportation Research and Innovative Technology Administration

i
Evaluation of Work Zone Speed Limits:
An Objective and Subjective Analysis of Work Zones in Missouri
Ghulam H. Bham, Ph.D.
Assistant Professor
Department of Civil, Architectural and Environmental Engineering
Missouri University of Science and Technology
Mojtaba Ale Mohammadi
Ph.D. Student, Transportation Engineering
Department Civil, Architectural and Environmental Engineering
Missouri University of Science and Technology
A Report on Research Sponsored By
Smart Work Zone Deployment Initiative
Iowa State University
Mid-America Transportation Center
University of Nebraska
February 2011
ii
Technical Report Documentation Page
1. Report No.
MATC REPORT # 25-1121-0001-
119
2. Government Accession No.
3. Recipient's Catalog No.
4. Title and Subtitle
Evaluation of Work Zone Speed Limits: An Objective and Subjective
Analysis of Work Zones in Missouri
5. Report Date
February, 2011
6. Performing Organization Code
7. Author(s)
Ghulam H. Bham, PhD, Mojtaba Ale Mohammadi 8. Performing Organization Report No.
9. Performing Organization Name and Address
Mid-America Transportation Center AND Missouri Science & Technology
2200 Vine St. 1401 North Pine St
PO Box 830851 Rolla, MO 65409
Lincoln, NE 68583-0851
10. Work Unit No. (TRAIS)
11. Contract or Grant No.
12. Sponsoring Agency Name and Address
USDOT RITA
1200 New Jersey Avenue, SE
Washington, DC 20590
13. Type of Report and Period Covered
Draft Report,
14. Sponsoring Agency Code
MATC TRB RiP No. 17144
15. Supplementary Notes
16. Abstract
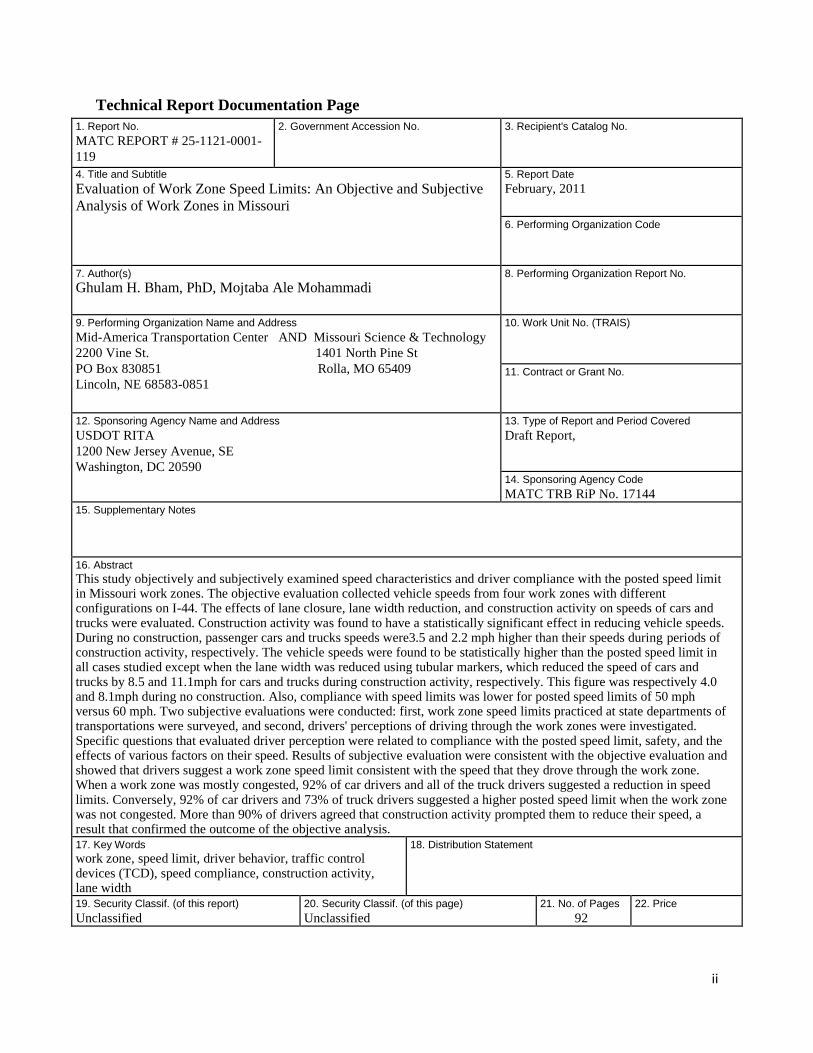
This study objectively and subjectively examined speed characteristics and driver compliance with the posted speed limit in Missouri work zones. The objective evaluation collected vehicle speeds from four work zones with different configurations on I-44. The effects of lane closure, lane width reduction, and construction activity on speeds of cars and trucks were evaluated. Construction activity was found to have a statistically significant effect in reducing vehicle speeds. During no construction, passenger cars and trucks speeds were3.5 and 2.2 mph higher than their speeds during periods of construction activity, respectively. The vehicle speeds were found to be statistically higher than the posted speed limit in all cases studied except when the lane width was reduced using tubular markers, which reduced the speed of cars and trucks by 8.5 and 11.1mph for cars and trucks during construction activity, respectively. This figure was respectively 4.0 and 8.1mph during no construction. Also, compliance with speed limits was lower for posted speed limits of 50 mph versus 60 mph. Two subjective evaluations were conducted: first, work zone speed limits practiced at state departments of transportations were surveyed, and second, drivers' perceptions of driving through the work zones were investigated. Specific questions that evaluated driver perception were related to compliance with the posted speed limit, safety, and the effects of various factors on their speed. Results of subjective evaluation were consistent with the objective evaluation and showed that drivers suggest a work zone speed limit consistent with the speed that they drove through the work zone. When a work zone was mostly congested, 92% of car drivers and all of the truck drivers suggested a reduction in speed limits. Conversely, 92% of car drivers and 73% of truck drivers suggested a higher posted speed limit when the work zone was not congested. More than 90% of drivers agreed that construction activity prompted them to reduce their speed, a result that confirmed the outcome of the objective analysis. 17. Key Words
work zone, speed limit, driver behavior, traffic control devices (TCD), speed compliance, construction activity, lane width
18. Distribution Statement
19. Security Classif. (of this report)
Unclassified
20. Security Classif. (of this page)
Unclassified
21. No. of Pages
92
22. Price

iii
Table of Contents
ACKNOWLEDGEMENTS ...................................................................................................... viii
ABSTRACT .......................................................................................................................... ix
CHAPTER 1 INTRODUCTION ...................................................................................................1
CHAPTER 2 LITERATURE REVIEW .........................................................................................4
2.1 Work Zone Speed Limit ...........................................................................................4
2.2 Factors Affecting Work Zone Speed Limits ............................................................7
2.3 Evaluation of Speed Limits in Work Zones ...........................................................11
2.3.1 Measures of Effectiveness ......................................................................11
2.3.2 Static Speed Limits .................................................................................13
2.3.3 Variable Speed Limits.............................................................................14
2.4 Enforcement ...........................................................................................................18
2.5 Safety .....................................................................................................................23
2.6 Speed Limit Compliance........................................................................................24
CHAPTER 3 FIELD DATA COLLECTION AND METHODOLOGY ..............................................27
CHAPTER 4 OBJECTIVE RESULTS ........................................................................................35
4.1 Speed Characteristics Analysis ..............................................................................35
4.1.1 Waynesville Site .....................................................................................35
4.1.2 Rolla Site .................................................................................................38
4.1.3 Cuba Site .................................................................................................41
4.1.4 Pacific Westbound Site ...........................................................................43
4.1.5 Pacific Eastbound Site ............................................................................46
4.2 Speed Compliance .................................................................................................49
CHAPTER 5 SUBJECTIVE EVALUATION ................................................................................53
5.1 Common Practices of States ..................................................................................53

iv
5.1.1 Policy on Reducing Speed Limits in Work Zones ..................................53
5.1.2 Work Activity in Locations that Warrant a Reduced Speed Limit .........54
5.1.3 Factors Determining the Reduced Speed Limits in Work Zones ...........55
5.1.4 Maximum Speed Reduction ....................................................................55
5.1.5 Devices Used to Alert Drivers to Reduced Speed Limits .......................55
5.1.6 Strategies Used to Encourage Compliance .............................................56
5.1.7 Measures of Effectiveness ......................................................................56
5.1.8 Adverse Effects of Reduced Speed Limits in Work Zones ....................57
5.2 Driver Survey .........................................................................................................57
5.2.1 Demographics .........................................................................................58
5.2.2 Driving Behavior ....................................................................................60
5.2.3 Speed-Related Questions ........................................................................63
CHAPTER 6 DISCUSSION OF RESULTS ..................................................................................67
CHAPTER 7 CONCLUSIONS AND RECOMMENDATIONS .........................................................71
REFERENCES .......................................................................................................................75
APPENDICES ........................................................................................................................79
Appendix A Aerial Views of Work Zone Sites ...........................................................80
Appendix B State DOT Survey Questionnaire ............................................................82
Appendix C Speed Distribution Curves for the Pacific Work Zone ............................86
Appendix D Driver Survey Questionnaire ...................................................................91

v
List of Figures
Figure 3.1 Screenshot of Autoscope Software Used to Extract the Speed and Count...........
Data ............................................................................................................................31
Figure 4.1 Percentages of Speeds Higher than Speed Limit by at least 0, 5, and 10 mph .....52
Figure 5.1 Percentages of States that Reduce the Speed Limits in Various Locations in .....
Work Zones ................................................................................................................54
Figure 5.2 Age Distribution of Surveyed Drivers ..................................................................59
Figure 5.3 Driving Experience of Participants (in years) ......................................................59
Figure 5.4 Types of Motor Vehicles ......................................................................................60
Figure 5.5 Drivers’ Preferences Regarding Location of Work Zone Signs ...........................61
Figure 5.6 Points Where Drivers Move Out of the Closed Lane ...........................................62
Figure 5.7 Car and Truck Drivers’ Opinions about the Speed Limit Compliance of ...........
Other Drivers: Did Other Drivers Follow the Speed Limit?......................................65
Figure 5.8 Drivers’ Speed While Traveling through the Work Zones ..................................66
Figure 5.9 Speed Limit Suggested by Surveyed Drivers .......................................................66
Figure A.1 Waynesville Work Zone Site, August 13, 2009 ..................................................80
Figure A.2 Rolla Work Zone Site, October 2, 2009 ..............................................................81
Figure A.3 Cuba Work Zone Site, August 13, 2009 ..............................................................81
Figure C.1 Car Speed Distribution in the Pacific WB Work Zone with No Construction ....86
Figure C.2 Truck Speed Distribution in Pacific WB Work Zone with No Construction ......87
Figure C.3 Car Speed Distribution in the Pacific WB Work Zone with Construction ..........87
Figure C.4 Truck Speed Distribution in the Pacific WB Work Zone with Construction ......88
Figure C.5 Car Speed Distribution in the Pacific EB Work Zone with No Construction .....88
Figure C.6 Truck Speed Distribution in the Pacific EB Work Zone with No Construction..89
Figure C.7 Car Speed Distribution in the Pacific EB Work Zone with Construction ...........89
Figure C.8 Truck Speed Distribution in Pacific WB Work Zone with No Construction ......90

vi
List of Tables
Table 3.1 Work Zones Studied ..............................................................................................29
Table 4.1 Speed Characteristics: Waynesville Site ................................................................36
Table 4.2 Anderson-Darling Normality Test for Speeds: Waynesville Site ..........................37
Table 4.3 T-Test Comparing Mean Speeds of Cars and Trucks: Waynesville Site ..............37
Table 4.4 T-Test Comparing Mean Speeds Construction and No Construction: .................
Waynesville Site ........................................................................................................38
Table 4.5 Speed Characteristics: Rolla Site ...........................................................................39
Table 4.6 Anderson-Darling Normality Test for Speeds: Rolla Site .....................................40
Table 4.7 T-Test Comparing Mean Speeds of Cars and Trucks: Rolla Site ..........................40
Table 4.8 T-Test Comparing Mean Speeds of Construction and No Construction: .............
Rolla Site ....................................................................................................................40
Table 4.9 Speed Characteristics: Cuba Site ...........................................................................42
Table 4.10 Anderson-Darling Normality Test for Speeds: Cuba Site ...................................42
Table 4.11 T-Test Comparing Mean Speeds of Cars and Trucks: Cuba Site ........................43
Table 4.12 Speed Characteristics: Pacific WB Site ...............................................................44
Table 4.13 Anderson-Darling Normality Test for Speeds: Pacific WB Site .........................44
Table 4.14 T-Test Comparing Mean Speeds of Cars and Trucks: Pacific WB Site ..............45
Table 4.15 T-Test Comparing Mean Speeds of Construction and No Construction: ...........
Pacific WB Site ..........................................................................................................46
Table 4.16 Speed Characteristics: Pacific EB Site ................................................................47
Table 4.17 Anderson-Darling Normality Tests for Speeds: Pacific EB Site .........................47
Table 4.18 T-Test Comparing Mean Speeds of Cars and Trucks: Pacific EB Site ...............48
Table 4.19 T-Test Comparing Mean Speeds of Construction and No Construction: ...........
Pacific EB Site ...........................................................................................................49
Table 4.20 Work Zone Characteristics, Speed Characteristics, and Speed Limit .................
Compliance ................................................................................................................51

vii
List of Abbreviations
ASE = Automated Speed Enforcement
CMS = Changeable Message Sign
DSMD = Dynamic Speed Monitoring Display
DOT = Department of Transportation
FFS = Free Flow Speed
HCM = Highway Capacity Manual
LIDAR = Light Detecting and Ranging
LOS = Level of Service
MoDOT = Missouri Department of Transportation
MOE = Measure of Effectiveness
MUTCD = Manual on Uniform Traffic Control Devices
NCHRP = National Cooperative Highway Research Program
PCMS = Portable Changeable Message Sign
POST = Portable Overhead Surveillance Trailer
RV = Recreational Vehicle
SUV = Sport Utility Vehicle
VMS = Variable Message Sign
VSL = Variable Speed Limit

viii
Acknowledgments
The authors acknowledge research grants from the Smart Work Zone Deployment
Initiative administered by the Iowa State University and the Mid-America Transportation Center
at the University of Nebraska. They also appreciate Ms. Victoria Woods, Mr. Tim Hellebusch,
and their staff at Missouri DOT in assisting with data collection. Finally, the authors thank Dr.
Praveen Edara from the University of Missouri at Columbia for providing the results of the state
DOT survey.

ix
Abstract
Many states have enacted temporary speed reduction regulations for work zones, and a
variety of speed limits are in place. The most commonly used speed reductions are 0, 5, 10, and
20 mph. The differences in speed limit have made enforcement difficult as motorists often do not
follow or fail to notice changes in speed limits. This study objectively and subjectively examined
characteristics of vehicle speeds and drivers’ compliance with the posted speed limit.
The objective evaluation extracted free flow speeds of vehicle from four work zones with
different configurations located on I-44 near the cities of Waynesville, Rolla, Cuba, and Pacific.
The free flowing speeds of cars and trucks were evaluated using statistical tests, and studied the
effects of lane closure, lane width reduction, and construction activity on vehicle speeds. The
objective evaluation found that passenger cars travel at significantly higher speeds than trucks.
The speed of cars was on average 1.2 and 1.8 mph higher than trucks during no construction and
construction periods, respectively. The effect of reduced lane width on vehicle speeds was higher
when tubular markers were used compared to lane markings. Construction activity had a
significant effect on reducing the speed of vehicles. With no construction activity, passenger car
and truck speeds were on average 3.5 mph and 2.2 mph higher, respectively, than speeds with
construction activity.
Vehicle speeds were statistically higher than the speed limit in all cases studied except
when the lane width was reduced using tubular markers. When lane width was reduced using
tubular markers, the speeds of cars and heavy vehicles were lower than the speed limit by 8.5
and 11.1 mph, respectively, with construction activity. This figure was 4.0 and 8.1 mph,
respectively, with no construction activity. Compliance with speed limits dropped with lower
speed limits, 50 mph versus 60 mph. The number of drivers traveling at least 5 or 10 mph above

x
the speed limit was considerably higher for sites with a 50-mph speed limit compared to those
with a 60-mph speed limit, during both periods of construction and no-construction activity. Less
than 10% of drivers exceeded the speed limit by more than 10 mph with construction. However,
this percentage increased to more than 25% and 17% for cars and trucks, respectively, with no
construction activity.
The subjective evaluation conducted two surveys. State departments of transportation
(DOTs) were surveyed about common practices in work zones and drivers’ perceptions of
traveling through a work zone were assessed. Twenty-seven states responded to the DOT survey.
The dominant factors that DOTs use to determine reduced speed limits are the presence of
workers, lane width, roadway alignment, and type of activity. Seventy percent of respondents
indicated a maximum speed limit reduction of 10 mph in work zones which is consistent with
MUTCD guidelines. Most DOTs rely primarily on static speed limit signs, but only 25% of the
respondents found such signs effective.
Questions on the driver survey addressed safety, speed in work zones, compliance with
the posted speed limit, and the effects of various factors on speed. More than 70% of drivers had
few safety concerns about driving among other types of vehicles. An analysis of the responses
determined that drivers prefer to be well informed more than a mile before a work zone where
workers are present. Though fourteen percent of drivers were found to be aggressive in terms of
lane changing behavior as they preferred to see the “Lane Closed Ahead” and “Reduced Speed
Limit” sign less than one mile before the work zone. A similar percentage of drivers were found
exceeding the speed limit by more than 10 mph in the objective analysis when there was no
construction. Most drivers indicated that they experienced delay in the work zone, and more than
90% agreed that construction activity reduced their speeds. The results were consistent with the
xi
objective evaluation and most drivers suggested a work zone speed limit consistent with their
own speed. When a work zone was mostly congested, 92% of car drivers and all of the truck
drivers suggested a reduction in speed limit. Conversely, an overwhelming number of
participants, 92% of car drivers and 73% of truck drivers, suggested a higher posted speed limit
when the work zone was not congested.

1
Chapter 1 Introduction
As the American highway network ages, federal and state government agencies are
allocating a greater portion of funds to reconstruction, maintenance, and rehabilitation of existing
highways. As a result, the traveling public encounters a higher number of work zones. The
Manual on Uniform Traffic Control Devices (MUTCD) divides work zones into four areas: the
advance warning area, the transition area, the activity area, and the termination area. Road users
traveling through a work zone are warned of the upcoming hazardous area in the advanced
warning area and then directed out of their normal path in the transition area. The transition area
frequently forms a bottleneck that can dramatically reduce the traffic throughput, which can slow
down the traffic and cause delay. Drivers encounter roadwork in the activity area, which again
affects their speed, and return to their normal path in the termination area.
Hazardous conditions for drivers and construction workers are common in work zones
because construction activities disturb normal traffic flow. The disturbances may introduce
severe traffic congestion and increase the risk of crashes. Ensuring safety in work zones while
maintaining highway capacity has become one of the most overwhelming challenges confronted
by traffic engineers and researchers.
Every year crashes in and near highway work zones cause property damage, injuries, and
death, not only among workers, but also among drivers. Thus traffic speeds adjacent to a work
zone are of great concern. The faster a vehicle is traveling, the less time a driver has to react, and
the less time workers have to get out of the way if a driver loses control. A faster moving vehicle
is also more likely to penetrate a barrier, and to penetrate farther, threatening more workers.
Experience has shown that the effectiveness of signs in reducing the speed of traffic through
work zones varies. Speed reduction signs posted for long work zones that have no evidence of

2
any activity are not only ineffective, but they can make drivers skeptical of the validity of signs
posted at other work zones.
In cooperation with the Missouri Department of Transportation (MoDOT), a research
team from the Missouri University of Science and Technology objectively investigated traffic
speeds and driver compliance with posted speed limits in work zones on I-44 to systematically
assess the impact of static speed limit signs. This project evaluated the impact of lane closure,
lane width reduction, and construction activity on vehicle speeds. This study also conducted
subjective evaluations of work zone practices common among state departments of
transportation (DOTs) and of drivers’ perceptions of driving through the work zones. A
questionnaire was distributed to randomly selected drivers of heavy trucks and passenger cars.
The results of the subjective and objective evaluations were compared to determine whether they
were consistent with one another. This effort provides a wider look at the state DOTs, drivers’
perspective, and evaluates the behavior of drivers in work zones. As part of this project, another
team from the University of Missouri-Columbia investigated the speeds of vehicles on I-70 work
zones. Another report details the results of that study.
This study investigated traffic speeds and driver compliance with the posted speed limits
in work zones and evaluated the impact of static speed limit signs in work zones. The study used
free flow speeds (FFS) of vehicles in evaluation of driver behavior. Speed characteristics were
also studied and the speeds of trucks and passenger cars were compared. The FFS within the
work zone activity areas were compared with the speed limits. In addition, it compared the
85th
percentile FFS of vehicles to the posted speed limit. The 85th percentile is a useful criterion
to evaluate speed limit compliance when a speed limit is enforced in the work zone.

3
This project surveyed fifty state DOTs about their common work zone practices. A
subjective evaluation surveyed drivers about the safety of traveling through the work zone, their
actual speeds, and the posted speed limit. It also sought drivers’ opinions about the effects of
construction activity on their speed and the speed limit compliance of other drivers.

4
Chapter 2 Literature Review
Agencies have adopted approaches such as variable speed limits and speed monitoring
and display to increase compliance and safety. These approaches are designed to reduce the
likelihood of crashes in work zones, and research has been performed to examine the efficiency
and effectiveness of these methods. The following is a review of projects, practices, and research
on speed limits, particularly in work zones. This review addresses factors affecting speed limits,
driver compliance with the speed limits, and enforcement and safety issues.
The safety and efficiency of work zones is of particular interest to the MoDOT. The
department is responsible for construction and maintenance on various types of highways. Their
responsibilities include speed limit determination in work zones, coordination with law
enforcement to establish fines in work zones, and implementation of intelligent transportation
systems to improve driver compliance with speed limits and other regulations. Proper
implementation of strategies should improve the safety of work zones for both workers and the
traveling public, as well as reduce delays and traffic congestion.
2.1 Work Zone Speed Limit
Fundamental to the reduction of speed limits in work zones is the hypothesis that if
motorists reduce their speeds then crashes will be fewer and less severe. State highway agencies
determine work zone speed limits based on one of three policies (MUTCD):
(a) Avoid speed limit reductions whenever possible.
(b) Impose speed limit reductions consistently in work zones.
(c) Establish work zone speed limits based on factors specific to individual projects.

5
NCHRP (National Cooperative Highway Research Program) Project 3-41 makes the
following recommendations regarding work zone speed limit implementation (Migletz et al.,
1998):
Reduced work zone speed limits should be used only during specific periods and only in
those portions of the work zone where the engineering factors identified in the speed limit
procedure are present.
Work zone speed limit reductions should be avoided whenever possible. This is
especially applicable when all activities are located on the shoulder or in roadside areas,
or when no work activities are in progress.
A 10-mph reduction below the normal speed limit is desirable in work zones when work
takes place on or near the road, particularly on rural freeways, or when personnel are
required to work for extended periods in an unprotected position within 10 ft of the edge
of the road.
Avoid blanket policies mandating the reduction of work zone speed limits to a fixed
value.
At locations where work activities are removed from the roadway by 10 ft or more, avoid
work zone speed limit reductions.
Reduced speed limits are generally most appropriate for projects that last at least 24
hours; however, reduced work zone speed limits may be established for projects of
shorter duration whenever it is appropriate.
Where work zone geometrics with reduced design speeds cannot be avoided, the work
zone speed limit should not exceed the design speed, even if the work zone speed limit
reduction would be greater than 10 mph.

6
Typically, where a speed limit reduction is called for, the normal posted speed is reduced
by 10 mph. Most transportation agencies use regulatory or advisory speed limit signs to convey
speed reduction information to the public. Where a reduced speed limit is imposed, the normal
limit should be restored during times when there is no work activity or no need for a reduced
speed limit.
Experience has shown that the use of signs to reduce the speed of traffic through work
zones has varying degrees of effectiveness. The effectiveness of signs may depend on the normal
posted speed limit, road geometry, and sight distance. In some cases, it may depend simply on
the location of the work zone. Speed reduction signs for long work zones that have no evidence
of any activity are not only ineffective, but also can make drivers skeptical of the validity of
signs posted at other work zones (Outcalt, 2009).
Long-term work zones with no activity or significant speed reductions and where workers
and equipment are far from traffic tend to make drivers doubt the validity of the reduced speed
limit. If such cases are frequent, drivers may lose respect for the posted speed limit in other work
zones. Speed reductions should be carefully evaluated, and work zone speed limits should be set
no lower than necessary and imposed no longer than necessary for the safety of workers and
drivers (Outcalt, 2009).
Migletz et al. (2005) developed a procedure to determine the work zone speed limits
appropriate during the design and construction phases of a roadway construction project.
Accident and speed studies showed that accident rates and speed variance increased only
minimally in work zones with a 10-mph reduction in speed limit. This work showed that drivers
reduce speeds in work zones, particularly when workers are present, independently of whether or

7
not speed limit reductions are posted. Motorists believe that when work is not adjacent to the
traveled way or when no work is being conducted, the speed limit should not be reduced.
Maze et al. (2000) examined speed reduction practices in work zones, and reviewed
speed control strategies ranging from posting regulatory and advisory speed limit signs to using
the latest radar technologies to reduce speeds at work zones. They conducted an extensive survey
of50 states, with a 62% response rate. The survey addressed seven distinctive work zone
scenarios and asked whether any speed reduction was implemented for each scenario. Most
participating state agencies reported reducing speed limits by 10 mph below the normal posted
speed during construction activities. A few agencies even consider reducing speed limits by 20
mph. Such additional speed limit reductions, however, generally require review and
recommendation by the appropriate engineering personnel. The majority of agencies reported
using regulatory rather than advisory signs to post reduced speed limits in work zones. A few
state agencies indicated that speed limit reductions in work zones are considered on a case-by-
case basis. The process requires a careful examination of each construction project to determine
whether speed reductionism warranted. A few respondents suggested that work zones should be
designed so that no speed limit reductions need be imposed. However, if conditions warrant,
realistic speed limit reductions should be maintained.
2.2 Factors Affecting Work Zone Speed Limits
State agencies have begun to implement static regulatory and advisory signage in work
zones, but research has shown that these do not effectively decrease the number of crashes
(Fontaine and Carlson, 2001). Such research has prompted enhancement of the signage system
and studies of speed control measures. Further, research has revealed a number of ways to
control the speed of vehicles in work zones. These methods include police presence, changeable

8
message signs (CMS), rumble strips, drone radar, radar-activated speed trailers, temporary traffic
control, increased fines, and detours or diversions.
Various factors affect the speed of vehicles passing through a work zone. These include
the geometric properties of the roadway, such as number of lanes, lane width, horizontal and
vertical curvature, lateral clearance; and traffic control devices and warning signs, such as
variable speed limit (VSL) signs, speed monitoring and display, flaggers, and law enforcement
(Noel et al. 1987).
Richards et al. (1985) conducted studies at four work zone sites: two on rural freeways,
one on an urban freeway, and one at an urban arterial site. They evaluated the following work
zone speed control strategies: (a) flagging, (b) law enforcement, (c) CMS, (d) effective lane
width reduction, (e) rumble strips, and (f) conventional regulatory and advisory speed signage.
Their studies suggested that an innovative flagging program, a police traffic controller, and a
stationary patrol car were most effective. Agencies used various methods and devices other than
law enforcement to motivate drivers to comply with work zone speed limits. The following are a
few of the more common speed reduction methods and some of the innovative strategies
examined in other recent studies:
1. CMS
2. Speed display trailers or CMS with radar
3. Innovative signs
4. Flagging treatments
5. Lane narrowing
6. Late merge (to avoid road rage due to queue jumping)
7. Transverse striping

9
8. Rumble strips
Chitturi and Benekohal (2005) investigated the effects of lane width and lateral clearance
on the speed of cars and heavy vehicles in work zones. They showed that speed reduction due to
the lack of a shoulder on either side was approximately 5.6 mph in a work zone with 12-ft wide
lanes. They found that the speed reductions in work zones are significantly greater than those
given in the Highway Capacity Manual (HCM) for a basic freeway section of identical lane
widths (HCM). The more narrow the lanes, the greater the speed reduction. For 11ft lanes,
speeds dropped by 133% more than the value of 1.9 mph recommended by the HCM for basic
freeways. For 10.5-ft lanes, the reduction was 69% greater than the HCM value for basic
freeways. Narrow lanes reduced the speeds of heavy vehicles more than those of passenger cars.
The investigators recommended work zone speed reductions of 10, 7, 4.4, and 2.1 mph for lane
widths of 10, 10.5, 11, and 11.5 ft, respectively.
Maze et al. (2000) identified 12 speed reduction strategies, among which regulatory
speed limit signs and police enforcement are the most common practices reported by agencies.
However, only 7% of the participating agencies consider regulatory signs an effective speed
reduction strategy, whereas 70% consider police enforcement engagement to be very effective.
Police enforcement, however, is costly and may, therefore, have only a short-term impact on
motorists.
A study in Missouri by Graham-Migletz Enterprises (1996) evaluated radar controlled
speed matrix signs and concluded that such signs produce modest speed reductions. They found
that the presence of law enforcement officers in work zones was more effective than any type of
sign available.

10
Benekohal et al., (1992) studied speed reduction patterns of vehicles in highway work
zones. Their studies suggested that drivers change their speeds at various locations within a work
zone in response to roadway geometry and traffic control devices. The researchers followed
vehicles from the time they entered a 1.5-mile long study section until they exited from it.
Automobiles and trucks showed similar speed-reduction patterns. They identified four categories
of drivers on the basis of these patterns: About 63% of drivers reduced their speeds considerably
after passing the first work zone speed-limit signs (category 1). Nearly 11% of drivers reduced
their speeds when they neared the location of construction activities (category 2). About 11% of
all drivers failed to reduce their high speeds (category 3). Among the remaining drivers, there
was no distinct pattern (category 4). Drivers in category 1 showed three distinct speed-reduction
patterns. The first group decreased their speeds near the first speed-limit signs and had further
speed reductions at the work space. The second group drove similarly to the first group, but
increased their speed between the two points. The third group reduced their speed near the first
speed-limit signs and maintained that speed until they passed the work space. The average speed
of the third group decreased as the vehicle approached the work space, but rapidly increased after
passing it. Even at the work space, about two-thirds of automobile drivers and more than half of
truck drivers exceeded the speed limit.
A study conducted by Benekohal et al. (2004) to develop a method to estimate operating
speed and capacity in work zones noted that the capacity at which a work zone operates is
affected by any reduction in operating speed in that work zone. The reduction in speed may be
due to less-than-desirable geometric conditions, work intensity, traffic flow breakdown, weather
conditions, local environmental conditions (dust, noise, distraction due to work activities, etc.),
pavement surface condition, work-zone layout, entering and exiting vehicles, and other factors.

11
Therefore, the relationship between these factors and the reduction in speed must be determined
to account for speed reductions. The data for many of these factors were insufficient to develop a
relationship between each factor and speed reduction; therefore, the study focused only on those
for which sufficient data existed and proposed the following relationship:
(2.1)
where:
= operating speed (mph);
= free-flow speed (assumed to be speed limit + 5 mph);
= reduction in speed (in mph) due to work intensity;
= reduction in speed (in mph) due to lane width, based on HCM 2000;
= reduction in speed (in mph) due to lateral clearance, based on HCM 2000; and
= reduction in speed (in mph) due to all other factors (however, if no information on
magnitude of speed reduction is available, this reduction should not be applied).
2.3 Evaluation of Speed Limits in Work Zones
This project also reviewed research on evaluation of speed limits in work zones. The
following begins with some common measures of effectiveness in this regard, then a review of
the evaluation of static and variable speed limits.
2.3.1 Measures of Effectiveness
The measures of effectiveness (MOE) used in the evaluation by Richards et al. (1985) of
speed control devices included four speed parameters: mean speed, standard deviation of speed,

12
85th percentile speed, and percentage of vehicles complying with the speed limit. Similarly, the
parameters used by Migletz et al. (1999) in determining appropriate work zone speeds usable
during the design or construction phases of a roadway construction project included mean speed,
85th percentile speed, speed limit compliance, and speed variance.
NCHRP Research Results Digest 192 (Graham-Migletz Enterprises, 1996) proposed a
uniform procedure for determining work zone speed limits. This project involved interviewing12
state and local highway officials about the procedure for establishing work zone speed limits and
the perceived effectiveness of various speed limit reduction policies. It asked about the attitudes
of motorists, construction contractors, and construction liability insurance carriers. The MOE
used in the analysis were:
mean traffic speed compared to posted speed;
85th percentile speed range over posted speed limit;
number of passenger cars traveling faster than the average truck speed; and
percentage of drivers exceeding the posted speed limit by more than 5 mph, 10 mph, and
15 mph.
Knodler et al. (2008) developed strategies to manage speed effectively and rational
criteria for setting speed limits. Specifically, they recorded the following speed data: 85th and
95th percentile speeds, median speeds, mean speeds, and speed variance. Their analysis focused
on free-flow speeds, which were identified by vehicle gaps greater than or equal to 6 s.
All of their speed data, including those for non-free-flow vehicles, were recorded to determine
the effect of gaps and free-flow definitions on observed vehicle speeds. Sandberg et al. (2001)
used the following as a function of time and location: average speed, 50th percentile speed
(median), 85th and 95th percentile speeds, and 10-mph pace.
13
2.3.2 Static Speed Limits
Regulatory and advisory speed limit signs alone do little to reduce traffic speeds in work
zones (Migletz et al., 1999), and drivers do not feel constrained to obey speed limits that they
consider unreasonable. If work zone speed limits are too low, drivers will lose respect for the
speed control effort, and even active control might not be enough to increase compliance with
the posted speed limit.
Agent et al. (2005) examined the criteria and procedures currently used to test speed
limits on public roads and recommended appropriate speed limits for various types of roadways
based on the data they collected. Using the moving radar mode, the data collected showed that
travel speeds for most types of highways are substantially above the posted speed limit. In
addition, car speeds are slightly above those of trucks. Using the 85th-percentile speed as a
standard, the operating speeds for most highway types should be increased for cars and trucks.
Data taken before and after speed limit changes indicate that operating speeds change
much less than the change in speed limit. The data support the conclusion that motorists will
operate their vehicles at a speed that they consider appropriate for the roadway geometrics and
environment, regardless of the speed limit. Therefore, assuming drivers have an understanding of
reasonable speeds; speed limits should reflect driver preferences.
The accident data collected by Lyles et al. (2004) did not show a large difference in the
average number of accidents at locations where the speed limit was increased or decreased. Their
study recommends that the 85th-percentile speed should be used as the standard method to
establish speed limits. This standard reflects actual operating speeds as determined by the overall
roadway environment. There are some conditions in which the speed limit should be decreased
or increased in work zones, and static speed limits cannot effectively account for these
14
variations. They found the variable speed limit (VSL) displays can change with changing
conditions and impose more credible limits on motorists. The same study showed that static
speed limit signs have less credibility than the VSL and variable message sign (VMS) systems.
Huebschman et al. (2004) concluded that fixed-panel signs (i.e. not dynamic signs
mounted on a trailer) are effective in the heart of a work zone, but have little impact prior to the
work zone. They expected that the fixed signs would result in lower mean speeds on the
approach to the work zone and inside it. However, they found no statistical evidence to support
that hypothesis, likely because motorists tend not to reduce their speeds until the work zone is in
sight.
The NCHRP Research Results Digest 192 included a comprehensive literature review on
the use of regulatory and advisory signs (Graham-Migletz Enterprises, 1996). That review
suggested that some studies determined that these signs were quite effective, but most showed
that they have a negligible effect on vehicle speeds.
2.3.3 Variable Speed Limits
According to a literature review conducted by Kang et al. (2004), most existing VSL
systems were designed in response to traffic safety concerns. They were not intended to improve
operational efficiency, for example, by maximizing the throughput from a work zone segment or
minimizing the average delay for vehicles traveling through the segment. Kang’s team proposed
a VSL system to maximize work zone throughput. The system computes a sequence of optimal
transition speeds based on the dynamic interaction between the work zone and the upstream
traffic flow, and adjusts the speed limit displayed based on the detected speed distribution and
flow rates. Thus, it responds effectively to demand variation and noncompliance.

15
Under normal traffic conditions, the model proposed by Kang et al. (2004) can increase
the throughput in the work zone and reduce the average delay in upstream segments of the lane-
closure location. Simulation results indicated that although average speeds under VSL control
vary little from those without VSL control, the speed variance among those vehicles traveling
through the work zone is substantially lower in VSL-controlled scenarios.
A study performed by the Virginia Transportation Research Council in 1994 evaluated
CMSs equipped with radar units as a means of reducing speeds in work zones (Garber and
Srinivasan, 1994). The radar unit was attached directly to the message sign to measure vehicle
speeds, which made the signs capable of displaying personalized warning messages. The study
concluded that a CMS equipped with a radar unit acts like a dynamic speed control measure.
Consequently, it is more effective than the static MUTCD signs in altering driver behavior in
work zones. Personalized messages to high-speed drivers improved safety by increasing the
probability that those drivers would reduce their speeds and by minimizing the overall speed
variance in work zones.
Lyles et al. (2004) used a field test to determine the effectiveness of VSLs in work zones;
however, their assessment was hampered by a lack of consistent and comprehensive data.
Nonetheless, they learned several things about the effectiveness of VSLs. First, in most
instances, speeds appeared to increase through the deployment areas when the VSL system was
operating. This was the case when other factors, such as ramps, did not add to congestion or
require that speed limits be kept low. As a corollary to the increase in average speed, the travel
time through the VSL deployment areas decreased. The study concluded that VSL systems are
more useful in longer and simpler work zones with short work areas. In addition, they can
present far more credible information to the motorist than can static speed limit signs.
16
Fontaine and Carlson (2001) reported the results of a field study conducted in a rural
highway work zone (US 36) to evaluate the effectiveness of portable changeable message signs
(PCMSs) as a speed control measure. Their study was conducted in four rural maintenance work
zones on low-volume two-lane roads with 70-mph (112.7-km/h) speed limits where work was
completed within a single day. Their study determined that the speed display was effective. In
the advanced warning area, car speeds were between 2 and 9 mph (3.2 and 14.5 km/h) lower than
with normal traffic control. Also, speed displays appeared to produce greater speed reduction in
commercial trucks than in passenger cars. Truck speeds were 3 to 10 mph (4.8 to 16.1 km/h)
lower with the speed display.
Garber and Srinivasan (1998) conducted research using a CMS equipped with a radar
unit on highways in Virginia. The CMS was placed within the work area at the beginning of the
lane taper. Four different messages were evaluated during the course of the study, and the
message “YOU ARE SPEEDING. SLOW DOWN” was the most effective. They concluded that
CMS with radar is effective for short periods (one week or less) and continues to be an effective
speed control technique for up to seven weeks.
Benekohal and Shu (1992) evaluated the effectiveness of placing a single CMS in
advance of work zones. Although the speed reductions were statistically significant, the
reduction in truck speeds was not practically significant in most cases. For some automobiles
exceeding the speed limit, the CMS did prompt speed reductions of 20%. Lee et al. (2004)
investigated the effectiveness of variable speed limits in reducing the potential for freeway
crashes. They used a real-time crash prediction model combined with a microscopic traffic
simulation model and estimated the changes in crash potential as an effect of speed limit
changes. They found that variable speed limits can reduce the average number of crashes by

17
approximately 25% by temporarily reducing speed limits during risky traffic conditions. This
study also concluded that the reduction in crash potential is greatest at sites of high traffic
turbulence, such as downstream of merging locations. Advanced warning to drivers who are
approaching these merging locations is likely to reduce the number of crashes.
The study by Lee et al. (2004) also examined the effect of duration of intervention on
changes in speed limits. It demonstrated that on average the total crash potential was
significantly lower at 5-minute intervals than at 2-minute intervals. Thus, speed limit reductions
that are too brief do not reduce crash potential and may, in fact, increase crash potential due to
unnecessarily frequent changes in speed limits. There was no significant difference, however, in
average total crash potential between 5-minute and 10-minute intervals. This suggests that these
intervals represent a reasonable amount of time for traffic to stabilize after a speed limit change.
On the other hand, total travel time was higher for interventions of short duration, perhaps
because such interventions cause more turbulence in traffic flow. Also, when an intervention is
imposed throughout a simulation, the study is actually examining the effect of fixed speed limits
on crash potential. As fixed speed limits decrease, average total crash potential also tends to
decrease, but total travel time dramatically increases. Total travel time through work zones with
fixed speed limits is significantly higher than that through work zones with variable speed limits.
Thus, lower speed limits are desirable from a safety perspective yet, there is an associated
penalty in increased travel time. The benefits of speed limit reduction (i.e., reduction in crash
potential), therefore, must be balanced with the additional cost of such a reduction (i.e., increase
in travel time) to find a cost-effective range of speed limits.
18
2.4 Enforcement
Ensuring compliance with the posted speed limit poses a challenge to agencies. Many
speeding drivers are local residents who are comfortable with the area. These motorists
frequently speed through their own neighborhoods. A static speed limit sign alone, although
helpful in many areas, is not always effective. Historically, engineers have looked to
enforcement tools, either active or passive, as a solution to speeding. Active enforcement entails
police vehicles patrolling the roadway and writing tickets to speeding motorists. Passive
enforcement relies on the motorists to correct their own driving behavior as a result of seeing a
police vehicle or a speed feedback trailer. A portable speed trailer placed along a roadway, for
example, can encourage drivers to reduce their speeds. Research has shown, however, that once
the police vehicle is out of sight or the speed trailer is removed, vehicle speeds return to their
previous levels (Pesti et al., 2001).
Benekohal et al. (1992) evaluated the impact of active enforcement on vehicle speeds in
rural interstate work zones in Illinois. The first part of the study measured average traffic speeds
while a marked police car circulated through the work zone for four hours. The second part
determined whether speeds would increase after the patrol car left the work zone at the end of
this period. The study found that the mean speeds of cars and trucks in the work zone were
reduced by about 4 and 5 mph, respectively, while a police car circulated through the area. The
number of cars and trucks exceeding the posted speed limit through the work zone was reduced
by 14 and 32 %, respectively. However, one hour after the police car had left the work zone, the
mean speed of cars and trucks increased by about 2.5 and 0.5 mph, respectively. This study
concluded that, at least for trucks, a lasting speed reduction could be obtained by periodically
assigning mobile police cars to work zones.
19
Police enforcement efforts generally involve the presence of officers, whether stationary
or mobile. An officer stationed at a specific location significantly increases speed limit
compliance in that immediate area (Benekohal et al., 1992). A circulating police vehicle can
cover a larger area but may be less effective at speed reduction. Richards et al. (1985) examined
the effectiveness of focused law enforcement using stationary and mobile applications in six
work zones on rural and urban highways in Texas. Their study indicated that a stationary patrol
car reduced mean speeds by 5-12 mph (6 to 22%), whereas a circulating patrol reduced speeds
by only 2-3 mph (3 to 5%).
In 1999, the Minnesota DOT examined the effectiveness of police enforcement in work
zones at three different sites: a rural interstate, an urban freeway, and a metro location
(Kamyabet al., 2003). Using a laser gun, speed data were collected with and without an
enforcement vehicle present. The patrol car was located approximately 500-600 ft upstream of
the work zones, with lights and flashers activated. The posted speed limit on the four-lane
divided interstate was 70 mph, but this was reduced to 40 mph in the work zone area during
construction. The study found that the 85th percentile speed was reduced from 51 to 43 mph
when a police vehicle was parked upstream of the work zone. Similarly, on the urban freeway
(with a posted speed limit of 55 mph) and the metro location (with a posted speed limit of 50
mph), the 85th
percentile speeds were reduced from 66 to 58 mph and from 58 to 47 mph,
respectively. These results confirmed that the presence of a law enforcement vehicle
considerably improves compliance with posted speed limits.
Police enforcement relies on personal observation supplemented with technology. In
1994-1995, Jones and Lacey (1997) conducted a study in Iowa to compare the effectiveness of
laser-based and radar speed enforcement programs. They found that the radar-based speed
20
enforcement program decreased the number of vehicles traveling more than 5 mph over the
posted speed limit by about 20%. They concluded that laser-based speed measuring devices
should supplement rather than replace existing radar measuring technology.
Another technology and strategy used in some work zones is real-time remote speed
enforcement. Due to the high speeds and traffic volumes in many work zones and limited space
to pull speeding drivers over, stopping drivers for traffic violations may be dangerous for both
motorists and officers. A remote speed enforcement program uses an automated speed
enforcement (ASE) system to detect violators and alert an officer located beyond the work zone
of the violation (Fontaine et al., 2002).
ASE can use a variety of technologies (e.g., radar, LIDAR, elapsed travel measurements,
and in-pavement sensors) to detect vehicle speeds. When a violation is detected, a photograph of
the vehicle license plate is taken and transmitted to officers stationed outside of the work area.
Once the violating vehicle has passed through the work area, the officer can safely stop the
motorist. ASE programs can also mail a ticket to a vehicle. In most states, criminal citations
cannot be issued based only on ASE evidence. A Texas Transportation Institute study (Fontaine
et al., 2002) examined the technical feasibility of a remote enforcement system, determined
whether vehicles could be correctly identified downstream, and surveyed the attitudes of law
enforcement agencies toward the system. The study found that a downstream observer could
correctly match about 84 to 88% of offending vehicles.
A study conducted by Knodler et al. (2008) to develop strategies on rational criteria for
setting speed limits recorded the 85th and 95th percentile speeds, median speeds, mean speeds,
and speed variance. They found that the baseline 85th and 95th percentile speeds and mean
speeds of 40, 38, and 33.5 mph were higher than all equivalent values during the enforcement

21
and public information and education campaigns. During the post-enforcement periods, four of
the eleven 24-hour periods had 95th percentile speeds equal to the baseline value, and one period
had speeds in excess of the baseline. Nevertheless, the 85th percentile and mean speeds remained
lower than the original baseline levels during the post-enforcement period. An analysis of
baseline data formed the basis for a rational speed limit for each of the project roadways. This
revision resulted in an increase of 5 mph and was reflective of the 85th percentile speed rounded
down to the nearest 5-mph increment. In general, the speed parameters tended to drop by 1 to 2
mph during the enforcement period and increase during the post-enforcement period when the
85th percentile speed increased, on average, by 0.3 mph.
Sandberg et al. (2001) conducted a study of locations where a rural highway transitions
into an urbanized area. The permanently installed dynamic speed monitoring display (DSMD)
sign, in conjunction with a standard static regulatory speed limit sign (MUTCD R2-1), indicated
to motorists the speed limit and the speed at which they were driving without causing distraction.
Sites with DSMDs experienced reductions in the 50th, 85th, and 95th percentile speeds
averaging 6.3, 6.9, and 7.0 mph, respectively. The 10-mph pace speeds also decreased at all the
DSMD locations. These results indicate the DSMDs shifted the entire speed distribution at the
transition zone. The data showed that the results were fairly consistent across all the DSMD sign
locations and all time frames.
Ullman (1991) evaluated the effectiveness of using radar transmissions to reduce speeds
without visible enforcement. Results showed that the radar signal, on average, reduced speeds by
3 mph (4.82 km/h) and had a greater effect on commercial trucks than on cars. Jackels and
Brannan (1998) conducted a similar study using a radar-controlled speed sign. The study
revealed that the 85th percentile speeds were reduced from 68 to 58 mph with the installation of

22
the static signs alone. The installation of the radar-controlled speed sign reduced the
85th
percentile further to 53 mph.
Firman et al. (2009) conducted experiments on the speed reduction effects of PCMSs on
a rural highway work zone in Seneca, Kansas. They measured vehicle speed using two Smart
Sensor HD (Model 125) radar sensor systems. The results showed that the PCMS was effective
in reducing vehicle speeds in two-lane work zones. The PCMS was significantly more effective
when turned on than when turned off. When turned on, it reduced vehicle speeds by 4.7 mph
over an average distance of 500 ft. When turned off, vehicle speeds decreased by 3.3 mph over
500 ft. Based on the results of data analyses, these researchers concluded that a visible and active
PCMS in a work zone significantly reduces the speed of vehicles approaching the work zone.
Reduced speed increases driver reaction time, which allows drivers to avoid crashes, and thus
creating a safer environment for drivers and construction workers.
Outcalt (2009) conducted a study on a divided four-lane highway with good sight
distance both in the work zone and upstream where the warning signs began. The normal posted
speed limit at the site was 75 mph. Changes in the work zone signs were made to establish speed
limits of 70, 65, 60, 55, 50, and 45 mph. Maintenance personnel throughout the state expressed
the opinion that the greater the speed limit reduction through the work zone, the more likely
drivers were to exceed the speed limit. On the second day, with no law enforcement present, the
percentage of speeders increased as the speed limit was lowered until, at 45 mph, nearly one in
three drivers was exceeding the posted limit. With speed reductions from the highway norm of
75 mph to 65 mph, 85% of drivers complied with the lower limit (within 2 mph). This
compliance rate represents a successful speed limit that drivers respect – less than 1 in 25 exceed
the limit by more than 5 mph. However, the number of drivers who exceeded the speed limit
23
increased from less than 1/17 with a 15-mph reduction to nearly 1/3 with a 30-mph reduction.
Based on the data used in that study, for a speed reduction of 10 mph or less the use of signs can
be expected to slow about 85% of traffic to the posted speed. For situations requiring speed
reductions of 15 mph or more, additional signs, including radar VMS, and law enforcement
vehicles and officers may be necessary. Speed reductions of more than 20 mph will probably
require the presence of law enforcement and may necessitate the use of pilot vehicles to force
traffic to slow to the posted speed.
The presence of law enforcement at work zone locations is recommended (Outcalt,
2009), especially for work zones requiring more than a 10-mph reduction in traffic speed. The
greater the reduction below the normal speed limit, the more important the presence of law
enforcement becomes. Speed reductions of more than 20 mph should be used only in extreme
cases. Speed limits through the work zone should be raised to the highest safe speed as soon as
practical. If possible, speed reduction signs for work zones should be removed when no activity
is underway.
Kamyab et al. (2003) investigated the effectiveness of extra enforcement in construction
and maintenance work zones based on a literature review and the results of surveys and
interviews of state agency representatives. Their investigation indicated general agreement that
law enforcement presence and activity in work zones is valuable; very few comments noted
negative effects, such as additional congestion.
2.5 Safety
Li and Bai (2008) conducted research on the characteristics of fatal and injury accidents
in Kansas highway construction zones between 1992 and 2004, examining them systematically
and comparing their major characteristics. The fatal and injury accident distributions for varying

24
speed limits reveal differences worthy of discussion. Those work zones with speed limits of 51–
60 mph had the highest proportion of both fatal and injury accidents. As speed limits decreased,
injury accidents became the larger proportion of the total; as they increased, the proportion of
fatal accidents grew. The greatest number of fatal crashes occurred on highways with speed
limits between 61 and 70 mph. This study thus confirmed that high speeds increase the severity
of accidents in construction zones.
Kamyab et el. (2000) conducted a study in order to develop better ways of controlling
traffic through work zones and thus improving traffic safety and traffic operation. They
compared three different traffic management strategies using three electronic devices: the
Wizard CB alert system, a safety warning system, and a speed display monitor. Of the three
devices tested, the Wizard CB alert system demonstrated the most promising results. Neither the
safety warning system nor the speed monitor display provided a statistically significant reduction
in average speed of vehicles approaching the work zone.
Bai and Li (2006) studied fatal crashes and associated risk factors in work zones to
develop effective safety measures for future implementation. The team used crash data from the
Kansas DOT’s accident database, along with original accident reports of 157 fatal crashes
between 1992 and 2004. These data were evaluated using descriptive and regression analysis.
Locations with the greatest risk for fatal accidents were work zones on rural roads with speed
limits from 51 to 70 mph or those located on complex geometric alignments.
2.6 Speed Limit Compliance
Huebschman et al. (2004) studied reduced speed limits in work zones and evaluated the
effectiveness of a combination of fixed and dynamic signs advising motorists of work zone fines
and enforcement activity. The study concluded that the dynamic signs had no significant effect.

25
It indicated that the “Construction Zone Traffic Fines” panel sign resulted in a statistically
significant reduction of the mean speeds of motorists in the heart of the work zone, where
construction activity was underway and workers were present. The study also indicated that the
VMSs displaying the number of traffic fines issued to date in the work zone, and updates to this
message, produced no meaningful reduction in the mean speeds of motorists. The authors had
hypothesized that motorists who traveled through the work zone on a regular basis would notice
the number of traffic fines had increased, and would decrease their speeds to avoid paying traffic
fines themselves.
Results of a study conducted by Migletz et al. (1999) suggest that average mean speeds
decreased by 5.1 mph in work zones where the speed limit was not reduced. In work zones with
reduced speed limit, the greater the reduction in speed limit, the greater the reduction in mean
speed. Compliance with work zone speed limits was generally greatest where the speed limit was
not reduced and decreased where the speed limit was reduced by more than 10 mph. For work
zones with speed limits that were not reduced, the speed variance in the work zone was 61%
higher than the upstream speed variance. For work zones with a speed limit reduction of 10 mph,
the increase in speed variance in the work zone was only 34%. Finally, for work zones with
speed limit reductions of 15 mph or more, the increases in the work zone speed variance above
the speed variance upstream of work zones ranged from 81% to 93%.
Speed limit reductions greater than 10 mph below the preconstruction speed limit result
in significant speed variance increases. To increase compliance with reduced work zone speed
limits, consideration should be given to speed control techniques other than regulatory or
advisory speed limits, for example police presence, drone radar, etc. (Migletz et al., 1999).
Richards et al. (1985) conducted research to identify effective measures to motivate and

26
encourage drivers to comply with posted speed limits in work zones. Findings from literature and
a survey of DOT personnel indicated that a wide variety of methods had been tested to improve
compliance. Methods for establishing work zone speed limits differed from state to state. Three
devices were tested in this project: a speed display trailer, a CMS with radar, and an orange-
border speed limit sign. Results indicated that devices that displayed drivers’ speeds significantly
improved compliance. A primary factor affecting compliance with work zone speed limits is the
risk of collision or injury (Richards et al., 1985). Elements contributing to this risk include:
traffic volume,
roadway cross-section (lane and shoulder widths),
road surface conditions,
weather conditions,
awareness of the posted speed limit,
awareness of workers and equipment present in the work zone and their proximity to
traffic, and
advance notification of the upcoming work zone.
Outside of enforcement efforts, agencies used several methods and devices to motivate
drivers to comply with work zone speed limits. Most of these were intended to increase driver
awareness of the work zone, the reduced speed limit, and/or the presence of workers. Other
methods used roadway design elements to encourage or force drivers to slow down as they
approached or traveled through a work zone. Outcalt (2009) conducted a study on work zone
speed control and found that the most dependable method of ensuring compliance with posted
work zone speed limits is the presence of law enforcement in the work zone.

27
Chapter 3 Field Data Collection and Methodology
The selection of an appropriate work zone for this study was crucial in evaluating the
drivers ‘preferred speeds. The work zones had to have free flow conditions throughout the data
collection period. Work zone sites were selected based on availability and in consultation with
MoDOT. All sites were located on four-lane sections of I-44 in Missouri. They included two
right-lane-closed work zones in the Waynesville and Rolla areas, one left-lane-closed work zone
near Cuba, and one left-lane-closed zone in the Pacific area. In total, nine different datasets were
collected for the periods of both construction activity and no construction activity. The data
collection locations were at or near work activity within the work zone. The data collection times
were determined based on the feasibility of collecting three to five hours of speed data. The
normal regulatory speed limit of the highway was 70 mph.
The data were collected during daytime using high-definition video cameras to capture
the traffic stream. The cameras were placed at locations where drivers would not spot them and
reduce their speeds accordingly. Speed, traffic volume, and time headway data were extracted
from the videos using Autoscope® software, a computer video processing program. This
software uses a video image processing system and detects the vehicle speeds by calibrating the
video snapshot of the location. The speeds are time mean speeds measured by placing a speed
detector on the calibrated snapshot. The extracted speeds were validated by the speeds that were
captured randomly using a laser speed gun at the time of video data collection. If the data
extracted from the videos were not statistically the same as those measured by laser speed gun,
an adjustment factor was used with the software to ensure statistically consistent data. The
modified file configuration was then used to extract the data.

28
From the video data, free flowing vehicles were identified based on 5 s of headway
(Benekohal and Shu, 1992; Bella, 2005; Wang et al., 2003) and extracted. FFS was used in this
study because it represents the desired speed of drivers not affected by the preceding vehicle, and
can be used in the evaluation of work zone speed limit compliance. The vehicles were classified
as either passenger cars or trucks. The extracted data included periods during which the
construction activity was atypical. The data were then classified as pertaining to periods of either
construction activity or no construction activity. The no-construction group was further
categorized into one lane open and two lanes open (with a reduced posted speed limit).
The work activity at the Rolla site did not allow removal of lane closures during the peak
hour or when queues were formed. At the Pacific site, the lane closures were removed when the
traffic was heavy and as queues began to form, however, the work zone signs were not removed.
For the Rolla work zone site, the lane width was reduced by tubular markers, which were a
contributing factor in the analyses. Conversely, the lane width in the Pacific work zone was
reduced by pavement markings, and the construction activity was not adjacent to the open lane,
that is, a lane was present between the activity area and the open lane. The minimum, mean, and
maximum speeds, standard deviation, frequency distribution, and percentage of vehicles
exceeding the speed limit by at least 5 mph, and 10 mph were then determined, and 95%
confidence intervals were established for the mean, median, and standard deviation. The lengths
of data collection periods varied by location, but enough speed values were extracted to allow
comparison. The 85th percentile of FFS values was also determined and used as a compliance
criterion to compare with the speed limit.
For the work zone near Rolla, the open lane width was reduced because tubular markers
were placed about 1.5 ft inside the open lane. The lane width in the Pacific work zone was

29
reduced by pavement markings. Table 3.1 presents the number of open lanes, the speed limit, the
percentage of trucks, the duration of the work zone, and the type of work activity at each work
zone.
Table 3.1 Work Zones Studied
† Reduced lane width by tubular marker; †† Reduced lane width by pavement marking;
††† Reduced lane width by pavement marking: construction not adjacent to open lane
^ One lane open = 1, Two lanes open = 2
* Duration of the work zone type
Δ Cuba work zone site was classified as no construction as rumble striping was a moving
operation
The determination of a work zone posted speed limit was not an issue in this study. The
speed limit for the Rolla, Waynesville, and Cuba site were reduced by 10 mph to 60 mph, and at
the Pacific site it was reduced by 20 mph to 50 mph. The construction activity at the Pacific site
was much heavier than the other sites; consequently, in addition to a reduction in lane width, it

30
required a higher reduction in speed limit. Also, at this site much of the construction was
conducted during the night, and a lower speed limit was more beneficial in terms of the safety of
drivers. The consideration of the intensity of the construction activity justifies the amount of
reduction in normal speed limit of the highway.
The nature of the activity at the Rolla site did not allow for the removal of lane closure
during peak hours and when queues formed. At the Pacific site, the lane closure was removed
when the traffic was heavy and queues began to form. Data were collected in both eastbound and
westbound directions at the Pacific site. These data were analyzed separately because i) traffic
conditions were different, and ii) the geometry of the highway was also different as the
eastbound highway beyond the data collection point was curved.
The data from the Pacific work zone were collected in both the westbound and eastbound
directions for three days, and they were combined for analysis. The total length of video data
collection for all sites was nearly 40 hours. Schematics of the work zone sites are presented in
the appendix.
Initially, speed data were extracted from those portions of video for which corresponding
laser gun data were available. Data were validated to determine whether the configuration file
was properly calibrated. Two sample t-tests and F-tests with a 95% confidence level were used to
test the mean and variance of extracted speeds, respectively. After the data were validated, the
configuration file was used for the total time of data collection. No significant difference was
found in terms of the mean speed and the variance between the extracted speed and the laser gun
speed.
Speed detectors were placed at an appropriate point in the video image. The angle from
which the video was taken at a work zone site meant that some vehicles coming from the other

31
side of the road also passed the speed detector, occluding the subject vehicles; therefore, the poll
data of the software were not used. In these cases, all the traffic characteristics were recorded
manually to exclude data on the occluding vehicles. The FFS data were read manually from the
software output on the screen, assuming a time headway of 5 s or more from the time stamp of
the video. Figure 3.1 shows a typical screen view of the Autoscope® software configuration.
Figure 3.1 Screenshot of Autoscope® Software Used to Extract the Speed and Count Data
In work zones with speed limits of 50 mph and 60 mph, vehicle speeds of less than 35
mph and45 mph, respectively, mostly as a result of stop-and-go conditions with time headway of
more than 5 s, were deemed too slow to represent FFS, and they were excluded from the
extracted data. FFS distributions were tested for normality using the Anderson-Darling test

32
(Stephens, 1974), which is used to determine whether a sample dataset comes from a population
with a certain distribution. It modifies the Kolmogorov-Smirnov (K-S) test and gives more
weight to the tail than does the K-S test. The K-S test is distribution free in the sense that the
critical values do not depend on the specific distribution being tested. The Anderson-Darling test,
which is an alternative to the K-S and Chi-Square goodness-of-fit tests, makes use of the specific
distribution (here, normal distribution) in calculating critical values. The Anderson-Darling
normality test was defined as: Ho: data follows the normal distribution, and Ha: data does not
follow the normal distribution. The Anderson-Darling test statistic is defined as:
(3.1)
where,
∑
[
(3.2)
where,
F is the cumulative distribution function of the specific distribution (here, normal
distribution) and s is the ordered data.
By comparing the test statistic with the normal distribution’s critical values, the null
hypothesis is evaluated. If the test statistic is smaller than the critical value, the null hypothesis is
rejected. In this instance, the datasets can be assumed to be normally distributed because of the
relative insensitivity of the t-test to normal distribution (Benekohal and Shu, 1992). The
Anderson-Darling normality test was carried out using Minitab® software that provides the test

33
statistic and the p-values. It should be noted that FFS may not necessarily follow the normal
distribution. Throughout the remainder of this report, all speeds are free-flowing speeds.
Speed data were used to study the compliance of cars and trucks with the posted speed
limit, and the effects of several variables. Various statistical analyses were performed. A t-test
was used to determine the significance of differences in the speeds of trucks and passenger cars
and to evaluate the effects of construction activity on speeds. Speed compliance was evaluated
based on the difference between the mean speed and the posted speed limit. This evaluation
identified statistically significant differences based on the vehicle type, lane width, lane closure
configuration, and presence of construction activity.
A two-sample t-test was used to determine any significant difference between the mean
value of the speed of cars and that of trucks. The null hypothesis was , where
indicates the mean speed of cars, and indicates the mean speed of trucks; and the alternative
hypothesis, was .
For work zones with construction activity, a two-sample t-test was performed to evaluate
the effect of construction activity on the speeds of cars and trucks. The null and alternate
hypotheses were
(3.3)
and
(3.4)
respectively, where is speed duringperiods of no activity and is speed during
periods of activity.

34
To evaluate the driver compliance with the work zone speed limits, a one-sample t-test was used.
For each vehicle type and level of construction activity, mean speeds were compared with the
posted speed limits of 50 and 60 mph in the work zones. The null and alternate hypotheses for
both cars and trucks, or 60 mph and or 60 mph, depending on the work zone speed
limit, where S indicates the mean speed of either cars or trucks.
Fifty DOTs were contacted to complete a survey on their current and previous work zone
practices out of which 27 responded. The DOTs were surveyed on factors used to determine the
posted speed limit, the type of signs used to post speeds, compliance, and the measures taken to
evaluate the effectiveness of these policies. In addition, as part of the subjective evaluation, a
driver survey was conducted. Questionnaires were handed to drivers near the data collection sites
over the course of the study, and the responses were recorded. Except for demographic
questions, all were multiple choice questions. Most of the speed-related questions asked drivers
to indicate their agreement or disagreement with various statements. Drivers were asked to take
the survey if they had traveled through the work zone. The responses were analyzed to determine
drivers’ perception of reduced work zone speed limits, their compliance, and any hazards present
within a work zone.
35
Chapter 4 Results: Objective Evaluation
The following section presents the results of objective evaluation and chapter 5 will
present the subjective evaluations. The objective evaluation determined the speed characteristics
of cars and trucks, and the effects of lane closure, lane width, construction, and speed
compliance. The results of the objective evaluation are presented by work zone sites.
4.1 Speed Characteristics Analysis
4.1.1 Waynesville Site
Speeds from the Waynesville work zone site were classified based on two criteria:
vehicle type and construction intensity. Table 4.1 summarizes the speed characteristics of each
group. The results of this analysis indicate that the mean speed for all vehicles, both cars and
trucks, was higher than the speed limit. However, only statistical tests can determine whether the
difference is significant. Furthermore, for both levels of construction activity, the mean speed of
cars was higher than that of trucks. Consideration of construction activity and its effects on the
free flow of vehicles demonstrates that when there was no construction activity in the work zone,
both the number of free flowing vehicles and their speeds increased. For example, when there
was no construction, the proportion of vehicles traveling at least 10 mph above the posted speed
limit of60 mph was greater than 10% of the total (29% for cars and 16% for trucks). On the other
hand, during periods of construction, this figure was lower (9% for cars and 7% for trucks).

36
Table 4.1 Speed Characteristics: Waynesville Site
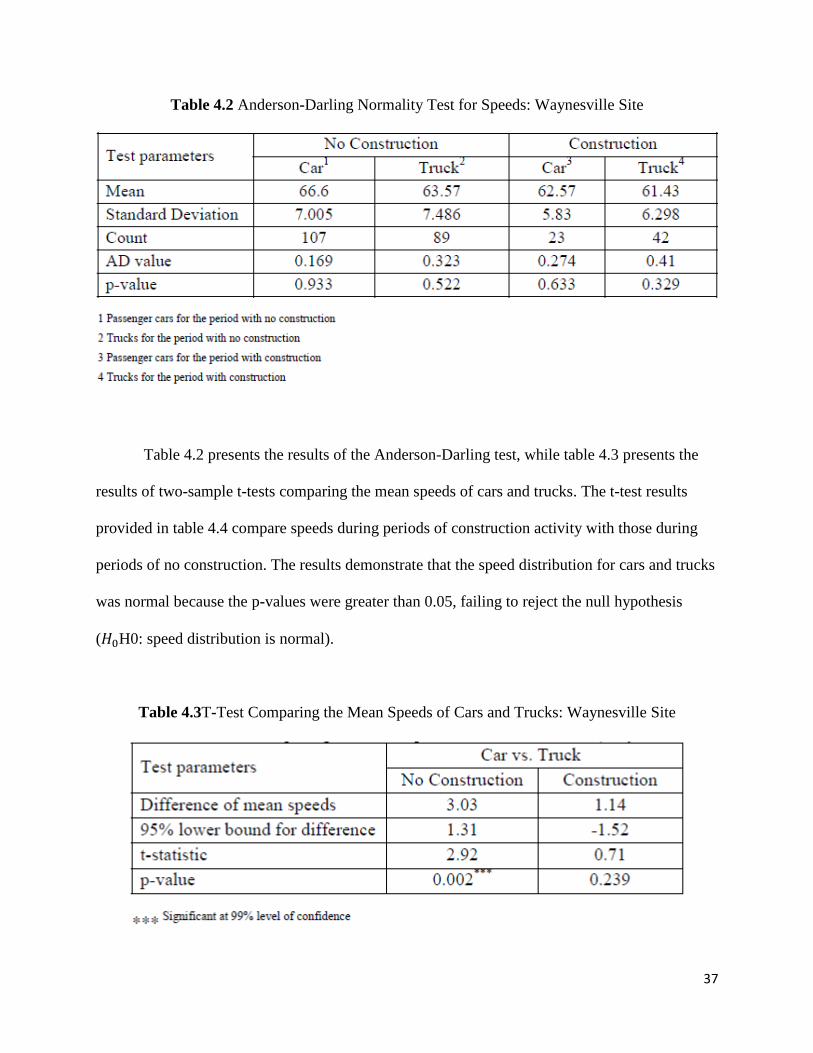
37
Table 4.2 Anderson-Darling Normality Test for Speeds: Waynesville Site
Table 4.2 presents the results of the Anderson-Darling test, while table 4.3 presents the
results of two-sample t-tests comparing the mean speeds of cars and trucks. The t-test results
provided in table 4.4 compare speeds during periods of construction activity with those during
periods of no construction. The results demonstrate that the speed distribution for cars and trucks
was normal because the p-values were greater than 0.05, failing to reject the null hypothesis
( H0: speed distribution is normal).
Table 4.3T-Test Comparing the Mean Speeds of Cars and Trucks: Waynesville Site
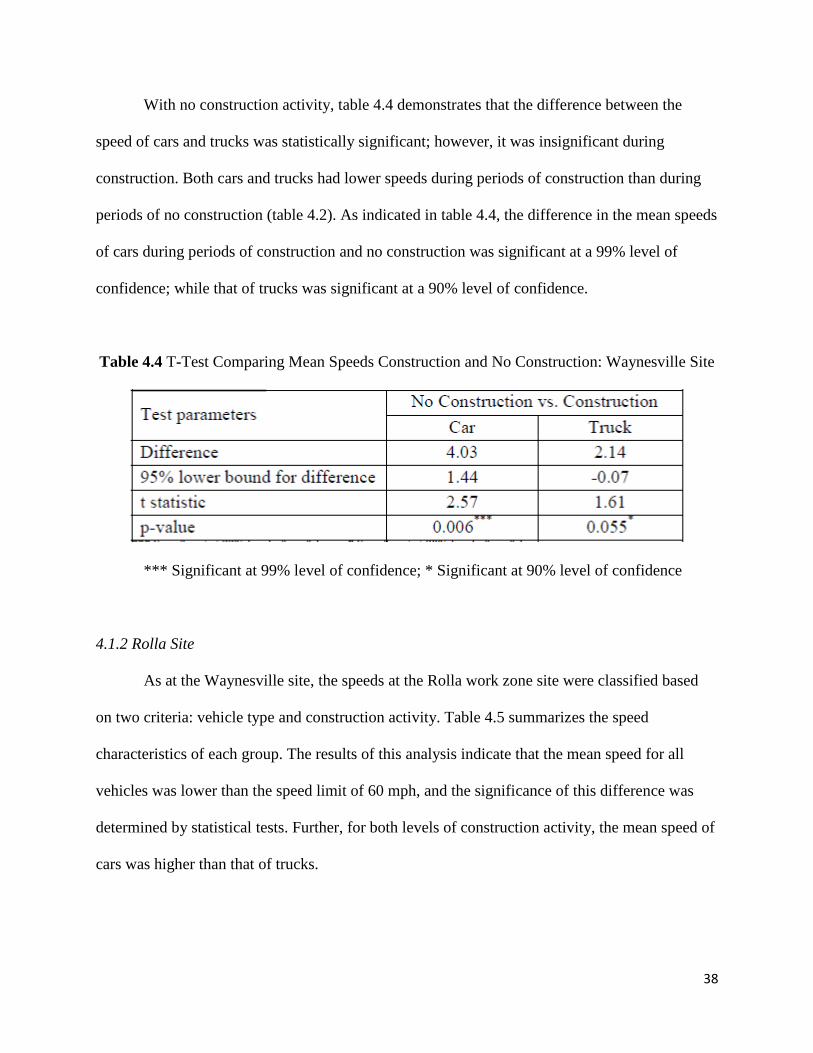
38
With no construction activity, table 4.4 demonstrates that the difference between the
speed of cars and trucks was statistically significant; however, it was insignificant during
construction. Both cars and trucks had lower speeds during periods of construction than during
periods of no construction (table 4.2). As indicated in table 4.4, the difference in the mean speeds
of cars during periods of construction and no construction was significant at a 99% level of
confidence; while that of trucks was significant at a 90% level of confidence.
Table 4.4 T-Test Comparing Mean Speeds Construction and No Construction: Waynesville Site
*** Significant at 99% level of confidence; * Significant at 90% level of confidence
4.1.2 Rolla Site
As at the Waynesville site, the speeds at the Rolla work zone site were classified based
on two criteria: vehicle type and construction activity. Table 4.5 summarizes the speed
characteristics of each group. The results of this analysis indicate that the mean speed for all
vehicles was lower than the speed limit of 60 mph, and the significance of this difference was
determined by statistical tests. Further, for both levels of construction activity, the mean speed of
cars was higher than that of trucks.

39
Table 4.5 Speed Characteristics: Rolla Site
Table 4.6 presents the results of the Anderson-Darling test, and the results of two sample
t-tests comparing the speeds of cars and trucks are shown in table 4.7. Table 4.8 provides the
results of another t-test comparing speeds during periods of construction activity with those
during periods of no construction. The results demonstrate that all of the speed distributions for
cars and trucks were normal because the p-values were greater than 0.05; thus, the null
hypothesis (H0: speed distribution is normal) is accepted. For both construction levels, the
difference between the speed of cars and trucks was statistically significant. The p-values
obtained from the two-sample t-tests show that construction activity had a significant effect on

40
the speed of vehicles at a 95% level of confidence. The speeds of both cars and trucks dropped
significantly when there was construction activity in the work zone.
Table 4.6 Anderson-Darling Normality Test for Speeds: Rolla Site
Table 4.7 T-Test Comparing the Mean Speeds of Cars and Trucks: Rolla Site
*** Significant at 99% level of confidence; ** Significant at 95% level of confidence
Table 4.8 T-Test Comparing Mean Speeds, Construction and No Construction: Rolla Site
*** Significant at 99% level of confidence; ** Significant at 95% level of confidence

41
4.1.3 Cuba Site
Construction activity at the Cuba site involved rumble striping, which is a moving
operation, and activity was minimal over the whole data collection period. Therefore, all the data
collected at this site were classified as no construction. Speeds were extracted from the data for
all vehicles and classified as either car or truck speeds. Table 4.9 presents the speed
characteristics of each class. The mean speeds of both cars and trucks were higher than the speed
limit; however, the significance of this difference must be determined statistically. Compared to
the Waynesville work zone, the number of free flowing vehicles was low because the Cuba work
zone was more congested. Table 4.10 presents the results of the Anderson-Darling normality test
for the data from the Cuba site. The distribution of free flowing cars and trucks was normal, as
indicated by p-values greater than 0.05 for both tests.

42
Table 4.9 Speed characteristics: Cuba site
Table 4.10 Anderson-Darling Normality Test for Speeds: Cuba site
* Significant at 90% level of confidence
Two-sample t-tests were performed to determine whether the difference between the
mean values of the speeds of cars and trucks was statistically significant. Table 4.11 presents the

43
results, indicating that the difference between the speeds of cars and trucks was statistically
significant. As in the Waynesville work zone during periods of no construction, the speed of cars
was significantly greater than the speed of trucks.
Table 4.11T-Test Comparing the Mean Speeds of Cars and Trucks: Cuba Site
*** Significant at 99% level of confidence
4.1.4 Pacific Westbound Site
Data for the westbound Pacific site were collected for three days. This data were
combined because the location and traffic flow states were almost the same in terms of
percentage of trucks, weather conditions, and congestion. During construction activity, only one
lane was open to traffic, but this lane closure was removed during peak-hour congestion, and
construction activity ceased. That is, for this work zone site, two lanes were open to traffic when
there was no construction activity. Speeds extracted from the data were classified as either car or
truck speeds. Table 4.12 presents the speed characteristics of each class. The results demonstrate
that the speeds of cars and trucks were above the speed limit, and vehicles traveled faster when
there was no construction in the work zone. These results seem reasonable, although the
significance of the differences must be statistically tested. Table 4.13 presents the results of the
Anderson-Darling normality test for the data from the Pacific westbound site.

44
Table 4.12 Speed Characteristics: Pacific WB Site
Table 4.13 Anderson-Darling Normality Test for Speeds: Pacific WB Site

45
The results indicate that the data did not follow the normal distribution. P-values are
smaller than 0.05; therefore, the null hypothesis must be rejected. When the number of data
points is large, normal probability tests are more powerful and detect even small deviations from
normal distribution. Appendix C presents the distribution of speeds at this site. The distribution
has an acceptable normal bell-shaped curve, although the normality test did not confirm that. For
the purposes of this study, the datasets were assumed to be normally distributed and the t-test
was used in speed evaluation due to its relative insensitivity to normal distribution (Benekohal
and Shu, 1992). Table 4.14 presents the results of the t-test comparing speeds during periods of
construction activity with those during periods of no construction. For both periods, the
difference between the speed of cars and trucks was statistically significant. Table 4.15 provides
the results of the t-test comparing speeds during construction activity with those during no
construction. The p-values obtained from the two-sample t-tests show that construction activity
had a significant effect on the speed of vehicles at a 99% level of confidence. The speeds of cars
and trucks dropped significantly when there was construction activity in the work zone.
Table 4.14T-Test Comparing Mean Speeds of Cars and Trucks: Pacific WB Site
*** Significant at 99% level of confidence
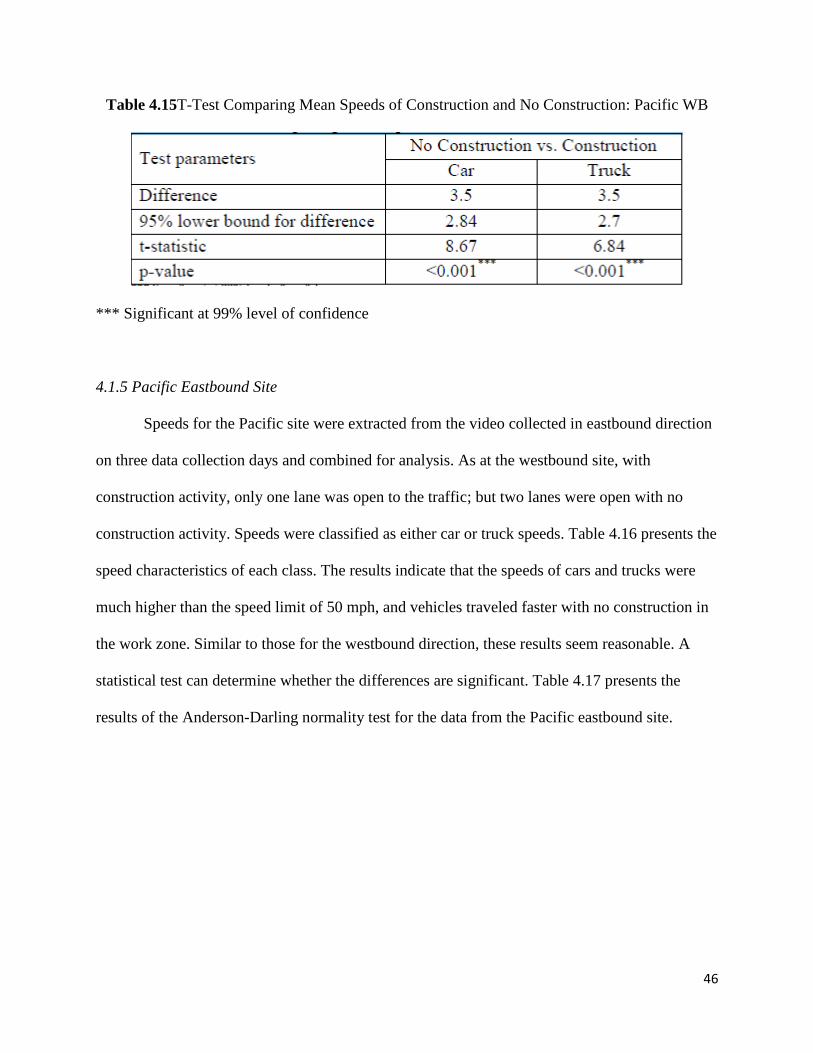
46
Table 4.15T-Test Comparing Mean Speeds of Construction and No Construction: Pacific WB
*** Significant at 99% level of confidence
4.1.5 Pacific Eastbound Site
Speeds for the Pacific site were extracted from the video collected in eastbound direction
on three data collection days and combined for analysis. As at the westbound site, with
construction activity, only one lane was open to the traffic; but two lanes were open with no
construction activity. Speeds were classified as either car or truck speeds. Table 4.16 presents the
speed characteristics of each class. The results indicate that the speeds of cars and trucks were
much higher than the speed limit of 50 mph, and vehicles traveled faster with no construction in
the work zone. Similar to those for the westbound direction, these results seem reasonable. A
statistical test can determine whether the differences are significant. Table 4.17 presents the
results of the Anderson-Darling normality test for the data from the Pacific eastbound site.

47
Table 4.16 Speed characteristics: Pacific EB Site
Table 4.17 Anderson-Darling Normality Test for Speeds: Pacific EB Site
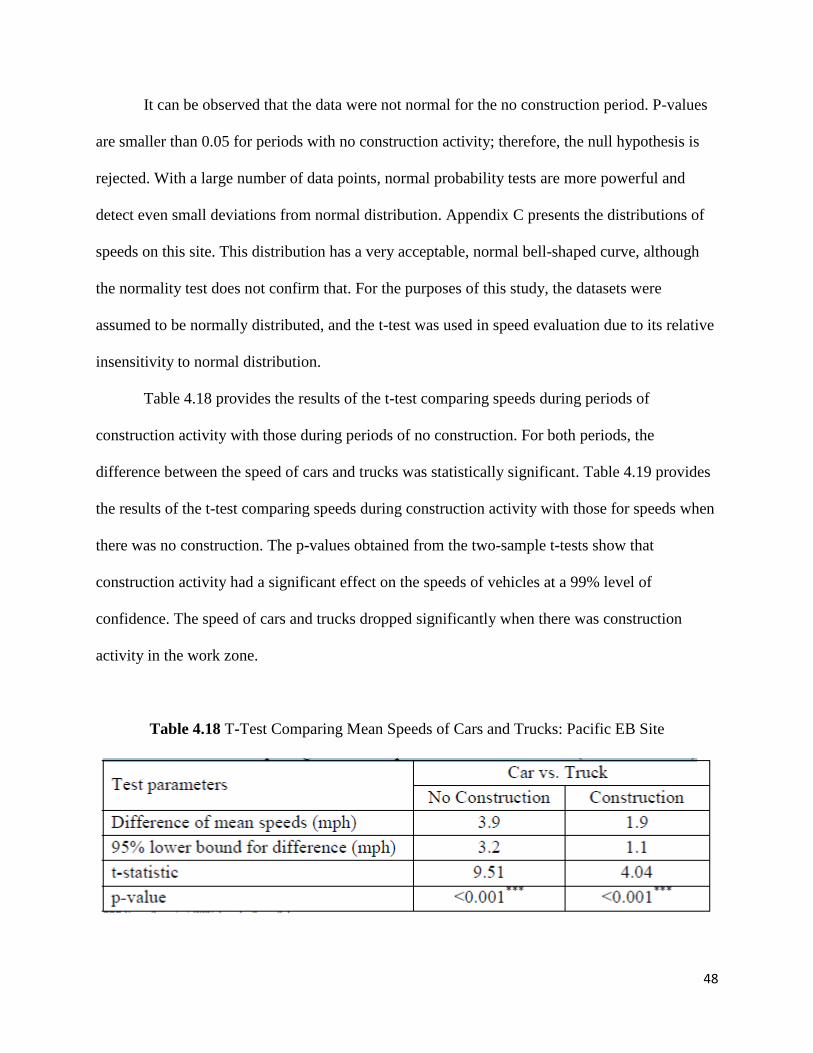
48
It can be observed that the data were not normal for the no construction period. P-values
are smaller than 0.05 for periods with no construction activity; therefore, the null hypothesis is
rejected. With a large number of data points, normal probability tests are more powerful and
detect even small deviations from normal distribution. Appendix C presents the distributions of
speeds on this site. This distribution has a very acceptable, normal bell-shaped curve, although
the normality test does not confirm that. For the purposes of this study, the datasets were
assumed to be normally distributed, and the t-test was used in speed evaluation due to its relative
insensitivity to normal distribution.
Table 4.18 provides the results of the t-test comparing speeds during periods of
construction activity with those during periods of no construction. For both periods, the
difference between the speed of cars and trucks was statistically significant. Table 4.19 provides
the results of the t-test comparing speeds during construction activity with those for speeds when
there was no construction. The p-values obtained from the two-sample t-tests show that
construction activity had a significant effect on the speeds of vehicles at a 99% level of
confidence. The speed of cars and trucks dropped significantly when there was construction
activity in the work zone.
Table 4.18 T-Test Comparing Mean Speeds of Cars and Trucks: Pacific EB Site

49
Table 4.19 T-Test Comparing Mean Speeds of Construction and No construction: Pacific EB
4.2 Speed Compliance
To evaluate driver compliance with work zone speed limits, speeds were statistically
compared with the posted speed limit, and the significance of the differences was determined.
The speed limit for the Waynesville, Rolla, and Cuba work zone sites was 60 mph and for the
Pacific site it was 50 mph. The speed data were subjected to t-tests, and the results were analyzed
based on the p-values obtained.
Table 4.20 presents the results of the t-tests. Those for the datasets from work zones with
a 60-mph speed limit and standard lane width (Waynesville and Cuba) demonstrate that during
periods of both construction and no construction, the speeds of cars and trucks were statistically
higher than the posted speed limit. Construction was not heavy enough to prompt vehicles to
travel below the speed limit. As noted above, construction prompted drivers to slow down
significantly, but not below the speed limit of 60 mph.
The results of the tests for the work zone with a 60-mph speed limit and reduced lane
width with tubular markers (Rolla) demonstrate that the speeds of cars and trucks were
statistically lower than the posted speed limit at a 99% confidence level. For the Rolla site, all
vehicle speeds, with or without construction, were significantly lower than the speed limit. A

50
comparison of these results with those for the Waynesville site demonstrates that the reduced
lane width reduced vehicle speeds more than the construction itself.
The results of the statistical tests for the Pacific work zone with a 50mph speed limit
indicate that when there were two open lanes, the speeds of both cars and trucks were
statistically higher than the speed limit (significant at 99% confidence level). Similarly, with
construction activity and only one lane open to traffic, the speeds were also statistically higher
than the speed limit. Here, however, lane width was reduced with pavement markings, and
construction activity was not adjacent to traffic. These results are similar to those for the
Waynesville site, which demonstrates that construction reduced the speed of the vehicles
significantly, but not to below the speed limit. They also suggest that reduced lane width is not a
significant factor in reducing speeds when it is applied by pavement marking and when
construction is not adjacent to traffic.
With the exception of the Rolla work zone, the mean speeds were statistically higher than
the speed limit. Thus, the 85th percentile speed of both cars and trucks was much higher than the
speed limit, and the difference is statistically significant. For the Rolla work zone with
construction, the 85th percentile speeds for cars and trucks were 57 and 55 mph, respectively;
and with no construction, they were 64 and 57 mph, respectively. When there was construction
activity in the work zone and the lane width was reduced with tubular markers, the 85th
percentile of the speed was less than the speed limit. When there was no construction, only the
85th percentile of the car speed was higher than the speed limit.

51
Table 4.20 Work Zones Characteristics, Speed Characteristics, and Speed Limit Compliance
To illustrate more clearly the number of vehicles traveling above the speed limit, figure
4.1 presents the percentages of vehicle speeds above the speed limit by at least 0, 5, and 10 mph.
Generally, when there was construction activity, the percentage of drivers traveling faster than
the speed limit was lower than when there was no construction. This observation corresponds
with the results of statistical tests addressing the effects of construction on speed. The width of
the open lane at the Rolla site was reduced using tubular markers; therefore, only a small

52
percentage of traffic exceeded the speed limit in the work zone during periods of construction
and no construction. Moreover, no vehicles traveled more than 10 mph above the speed limit.
Figure 4.1 Percentages of Speeds Higher than Speed Limit by at least 0, 5, and 10 mph
Figure 4.1 also demonstrates that the percentage of drivers traveling above the speed
limit, the percentage of drivers traveling more than 5 mph above the speed limit, and the
percentage of drivers traveling more than 10 mph above the speed limit were higher when the
speed limit was lower (50 mph rather 60 mph). This suggests drivers comply less readily with
the speed limit as the speed limit drops, and this was confirmed by t-statistics that show very
high values (table4.20). These statistics also confirm the results of Outcalt (2009) by showing
that drivers are more likely to exceed the speed limit in a work zone with a greater speed limit
reduction.
53
Chapter 5 Results: Subjective Evaluation
The subjective evaluation summarizes common practices in regard to work zone speed
limits based on the DOT survey. Additionally, it report drivers’ attention to the posted speed
limit and work zone signage such as “Road Work Ahead,” “Left/Right Lane Closed,” and
“Speed Limit.” Examining the effects of such alerts on drivers’ behavior and perceptions is
based on a driver survey. The survey is intended to aid in understanding driver perceptions of
delay, their own speed, the speeds of other drivers, speed limit compliance, and the effects of
construction activity. Accordingly, the subjective evaluation is divided in two sections: common
practices of state DOTs and driver survey.
5.1 Common Practices of States
A survey questionnaire was sent to 50 DOTs via email, and 27 responded. The complete
questionnaire is included in appendix B. It posed questions on work zone speed management
policies, the nature of work activities that warrant reduced speed limits, factors determining the
posted speed limit, the type of signs used to post speed limits, compliance levels, and the
measures taken to evaluate the effectiveness of these policies. The following summarizes the
responses to each question.
5.1.1 Policy on Reducing Speed Limits in Work Zones
DOTs were asked if their state has a policy on reducing traffic speeds in work zones.
Ninety percent of the states responding to the survey said that their agency does have such a
policy. There were 7 state DOTs (Illinois, Michigan, Montana, Washington, Nebraska,
Kentucky, and Oregon) that indicated that their policies had been established legislatively, and
17 indicated that this policy was determined by the transportation agency.

54
5.1.2 Work Activity Locations that Warrant a Reduced Speed Limit
The DOTs were asked what activities warrant work zone speed limit reductions. Figure
5.1shows the number of states that reduce speed limits at various locations in work zones.
Eighty-six percent responded that they reduce speed limits for activities within 2 ft of the road;
65%consider speed limit reductions for activities 2-10 ft from the road, and 28% consider a
reduction in speed limit for activities occurring more than 10 ft from the edge of the road. For
activities that occur between the centerline and the edge on the roadway, 26 out of 27 agencies
post reduced speed limits. Finally, for activities that require temporary detours, 80% of the
respondents would consider a reduction in the speed limit.
Figure 5.1 Percentages of States that Reduce the Speed Limits in Various Locations in Work
Zones

55
5.1.3 Factors Determining the Reduced Speed Limits in Work Zones
Agencies were asked about various factors that determine the magnitude of a speed limit
reduction for work zones. Respondents consider the following factors in determining the
magnitude of a speed limit reduction: presence of workers in the work area (93% of
respondents), lane width (87%), roadway alignment (87%), type of activity (87%), existing speed
limit (83%), sight distance (77%), presence of a barrier (77%), roadway type (77%), prevailing
speeds (70%), and traffic volume (70%). Accident history (46%) and percentage of trucks (40%)
are less commonly considered. It is clear that agencies share many common factors in
determining the speed limit in work zones.
5.1.4 Maximum Speed Reduction
The DOTs were surveyed about the maximum speed reduction in work zones. The
majority of the respondents (70%) impose a maximum speed limit reduction of 10 mph in work
zones. The remaining states allow for the possibility of reducing the speed limit more than 10
mph. Minnesota and West Virginia permit maximum reduction of 15 mph, Illinois and Colorado
a 20-mph reduction, and South Carolina a25-mph reduction. Oregon uses a 10-mph reduction for
freeways and a 20-mph reduction on other roads in two increments of 10 mph. The Michigan
DOT requires the approval of the chief operations officer to implement any speed reductions
greater than 10 mph. Indiana has a state statute that permits a reduction of 10 to 45 mph. Even
these exceptions show that the 10 mph reduction is seen as the most effective.
5.1.5 Devices Used to Alert Drivers to Reduced Speed Limits
The most common means of alerting drivers to reduced speed limits in work zones was
found to be static speed limit signs. There are some DOTs that also use a PCMS. The placement

56
of signs is commonly determined based on MUTCD guidelines (2003) or agency-specific policy
guidelines.
5.1.6 Strategies Used to Encourage Compliance
The DOTs were asked to indicate which of several strategies they currently use (or have
used) to control speed or improve compliance, and to estimate the effectiveness of each. Of the
27 states that responded, 24 or89%reported that police enforcement was the most effective
strategy. Regulatory signs were found to be effective by only 25% of respondents; and 72%
found them partially effective. Advisory speed limit signs were found to be partially effective by
77%of respondents; but 15% found them ineffective. Incremental speed limit reductions
upstream of the work zone and within the work zone are imposed by 13 states, and they have
proved partially effective. A CMS was deemed effective by 36% of respondents, partially
effective by 54%, and ineffective by 4%. Flagging operations have been effective for 27% of
respondents, and partially effective for 39%. Pilot vehicles have been used by 16 DOTs, of
which 56% found them effective and 44% found them partially effective. Increased fines for
infractions have been deemed effective by 33% of respondents, partially effective by 59%, and
ineffectively 7%. As expected, police enforcement was considered the most effective strategy by
nearly all DOTs, but the effectiveness of other strategies varied widely.
5.1.7 Measures of Effectiveness
The DOTs were surveyed about the measures they use (or have used) to evaluate the
effectiveness of speed control and/or compliance. The 85th percentile speed within the work
zone was found to be the most popular measure used by DOTs to determine the effectiveness of
speed reduction strategies. Other measures include mean speeds within work zones, speed
variance within a work zone, percentage compliance, and crash data. Some DOTs also use
57
citation data collected from law enforcement agencies. A few states indicated that they have
never formally evaluated the effectiveness of speed reduction strategies, and instead relied on
engineering judgment and personal perceptions. When asked if the work zone speed limit signs
are posted only when work is actually underway, 63% of respondents answered affirmatively.
Some DOTs indicated that movement of signs depends on the type of work activity, and thus
varies from one project to another.
5.1.8 Adverse Effects of Reduced Speed Limits in Work Zones
When asked about the adverse effects of work zone speed limit reductions in terms of
capacity, level of service (LOS), and user delays, the majority of survey respondents stated that
there have been no adverse effects. The Michigan DOT stated that traffic operations in work
zones have improved (i.e., delays have been reduced) as a result of reductions in speed limits.
However, reduced speed limits in work zones have had negative effects in some states. The
Illinois DOT reported a reduction in LOS and increased delays. The New York DOT has noted a
reduction in freeway capacity, and the Colorado DOT has observed that traffic slowdowns
resulted in user delays, especially during morning and evening peak periods. The Hawaii DOT
indicated that a reduction in speed limits usually has no adverse effects; however, a special
bridge project for which speed limits were reduced substantially below normal operating speeds
did result in a lower LOS.
5.2 Driver Survey
A survey was administered to study drivers’ perception of driving through work zones.
The survey questions covered three general areas: demographic information, driving behavior in
work zones, and drivers’ perception of speed limit compliance. Drivers were surveyed on type of
vehicle driven, driver’s attention to the posted speed limit, driver’s opinion regarding posted
58
speed limit, effects of work zone signage on driver behavior, perceived delay, and the effects of
construction activity on their own driving behavior. The questionnaire was distributed to drivers
near data collection sites over the course of the study. Drivers were asked to take the survey if
they had passed through the work zone. The responses were analyzed to determine drivers’
perceptions of reduced work zone speed limits, and speed limit compliance. The results were
divided into two categories: i) work zones with as speed limit of 60 mph near the Rolla site, and
ii) work zones with a speed limit of 50 mph near the Pacific site. A total of 118 drivers were
surveyed, 61 in the first category and 57 in the second. The categorization was used to analyze
the responses to the speed related questions and to compare them with the objective evaluation.
The first category was collected with the work zone in place, and the second was conducted after
the lane closure had been removed that day.
5.2.1 Demographics
Participants in the survey ranged from 18 to 81 years old (see figure 5.2); and 75% of
respondents were male and 25% were female. They had driving experience ranging from 1 year
to more than20 years (see figure 5.3). Vehicle types included passenger cars, both sedans and
SUVs, and trucks, including single-unit trucks, single and double trailer trucks, and RVs (see
figure 5.4). Sixty percent of the participants drove on the highway regularly or at least once a
week.

59
Figure 5.2 Age Distribution of Surveyed Drivers
Figure 5.3 Driving Experience of Participants (in years)
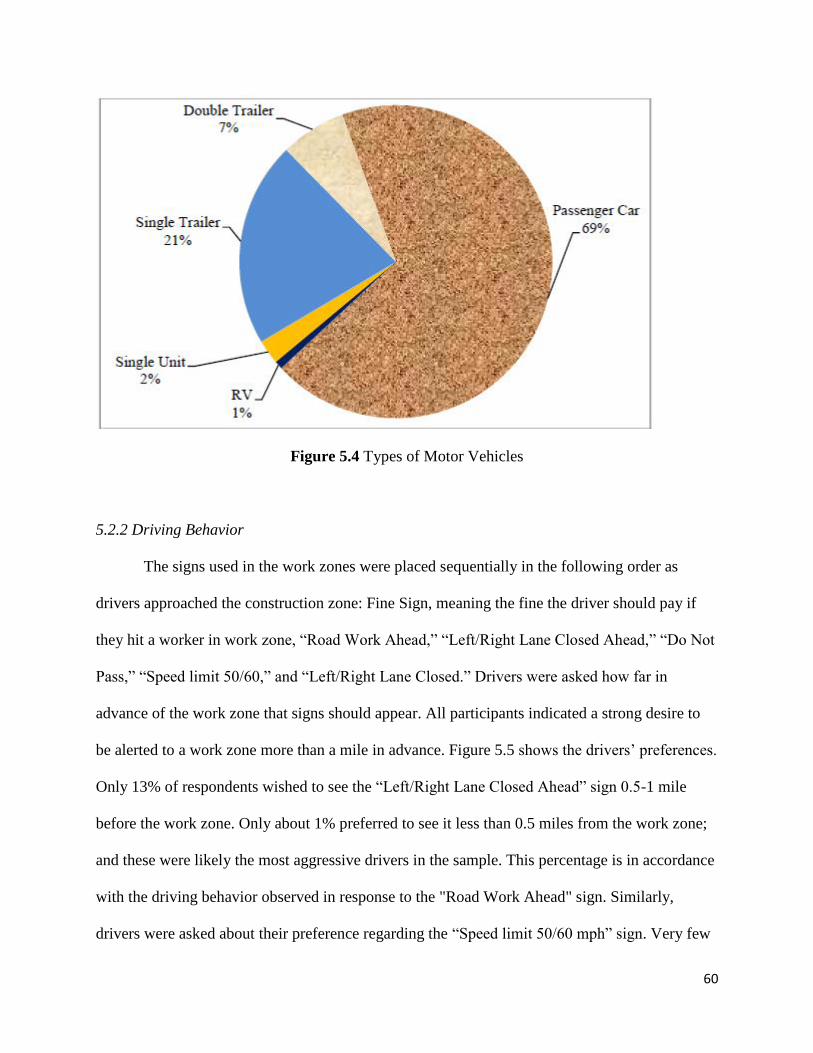
60
Figure 5.4 Types of Motor Vehicles
5.2.2 Driving Behavior
The signs used in the work zones were placed sequentially in the following order as
drivers approached the construction zone: Fine Sign, meaning the fine the driver should pay if
they hit a worker in work zone, “Road Work Ahead,” “Left/Right Lane Closed Ahead,” “Do Not
Pass,” “Speed limit 50/60,” and “Left/Right Lane Closed.” Drivers were asked how far in
advance of the work zone that signs should appear. All participants indicated a strong desire to
be alerted to a work zone more than a mile in advance. Figure 5.5 shows the drivers’ preferences.
Only 13% of respondents wished to see the “Left/Right Lane Closed Ahead” sign 0.5-1 mile
before the work zone. Only about 1% preferred to see it less than 0.5 miles from the work zone;
and these were likely the most aggressive drivers in the sample. This percentage is in accordance
with the driving behavior observed in response to the "Road Work Ahead" sign. Similarly,
drivers were asked about their preference regarding the “Speed limit 50/60 mph” sign. Very few

61
indicated a desire to see this sign less than 0.5 miles before the work zone, and more than 75%
preferred to see it more than a mile before the work zone.
Figure 5.5 Drivers’ Preference Regarding Location of Work Zone Signs
To evaluate lane change behavior, drivers were asked, “When do you move out of the
closed lane?” Figure 5.6 presents their responses. More than 87% of participants stated that they
move out of the closed lane “prior to when they actually see the work zone.” Of these, 62%
preferred to take action “immediately after the ‘Lane Closed Ahead’ sign,” indicating
conservative driving behavior. Of the remaining participants, 10% preferred to move out of the
closed lane “after they saw the work zone”, and 3% “immediately before the transition taper.”
These figures once again demonstrate that aggressive drivers are a small sample of the
population.

62
Figure 5.6 Points Where Drivers Move Out of the Closed Lane
When drivers were surveyed about the appropriateness of the speed limit, about 80% said
that they found the work zone speed limit safe. Drivers were asked about the delay experienced
while driving through the work zone; and about 70% indicated some delay. When surveyed
regarding the impact of construction activity on driving speed, 92% of respondents indicated that
they reduced their speed when there is construction activity. The high percentage of agreement
with this statement corresponds to the small percentage of aggressive behaviors as suggested by
responses to previous questions. The data show that this small portion of aggressive drivers
indicated that construction activities had no effect on their speed, and they preferred to change
lanes just before the taper area.

63
5.2.3 Speed-Related Questions
Drivers were asked if operating their vehicle among various types of vehicles posed any
safety risks. Seventy-five percent of drivers said that it did not. This statistic shows that the
majority of drivers (more than 70%) have few safety concerns about driving among other types
of vehicles. Although this question was not directly related to the speed limit in work zones,
answers to it can be considered a factor influencing driver behavior. Drivers whose answers were
positive may have reduced their speed because of reasons other than the reduced speed limit.
Since most of the drivers did not show concern about other vehicle types, speed reduction can be
assumed to be independent of vehicle composition in the traffic stream. To compare the results
of the subjective evaluation to those of the objective evaluation, the responses to speed related
survey questions were analyzed separately for passenger car drivers and truck drivers.
Passenger Car Driver Survey: Passenger car drivers constituted 64% and 74% of the
drivers surveyed from the first (60 mph speed limit) and second (50 mph speed limit) categories,
respectively. When asked their opinion of the speed limit compliance of other drivers, about 36%
from the first category and 40% from the second category disagreed that other drivers followed
the speed limit in the work zone. These answers should be interpreted in light of the responses
given when asked about vehicle speed and the posted speed limit, as discussed below. Figure 5.7
presents drivers’ opinions about the speed limit compliance of other drivers.
When drivers were surveyed regarding their own speed (see figure 5.8), 12% in the first
category and 53% in the second category indicated that they drove above the speed limit within
the work zone. The Rolla site which had a 60-mph speed limit, had congested conditions, and the
lane width was reduced. Compared to the other sites, speeds in that zone were, on average, below
the posted speed limit. The Rolla site was also permanent and long-term. For the second

64
category, the lane closures were removed when queues formed, and the speed limit was lower.
As a result, the speed limit compliance was lower, and the results of the subjective survey were
consistent with those of the objective survey. The t-statistics presented in table 4.20 confirm the
consistency of the subjective and objective evaluation of speed limit compliance at the Rolla and
Pacific sites.
Another multiple choice question asked drivers to indicate the speed they believed should
be posted as the speed limit. Their choices were 45, 50, 55, 60, 65, and 70 mph. Ninety-three
percent of participants in the first category suggested a speed limit less than or equal to 55 mph,
and the rest suggested 60 mph. Thus, all participants in the first category suggested a speed limit
equal to or below the posted speed limit. In the second category, about 93% of the participants
suggested a speed limit of above or equal to 55 mph, and the rest suggested 45 and 50 mph (see
figure 5.9). These responses indicate that drivers generally suggested a speed limit based on their
own traveling speed. This can be confirmed by comparing responses to the questions asking
about drivers’ own speeds and their suggestions for a speed limit. Most drivers in the first
category traveled below the actual speed limit, and most suggested a reduced speed limit.
Similarly, more than half of drivers in the second category were traveling faster than the actual
speed limit, and most suggested a limit higher than the actual speed limit. The speed limit in the
first category was 60 mph, however, and that in the second category was 50 mph. Therefore, the
results are consistent with the actual conditions.
Truck Driver Survey: Truck drivers comprised 36% and 26% in the first and second
categories, respectively. When surveyed about the speed limit compliance of other truck drivers,
about 16% in the first category (60 mph speed limit) and 20% in the second category (50 mph
speed limit) indicated that other drivers did not follow the speed limit in the work zone (see

65
figure 5.7).When drivers were surveyed regarding their own speed (see figure 5.8), all
participants in the first category indicated that they drove below the 60mph speed limit. About
73% of the drivers in the second category indicated that they drove below the 50-mph speed limit
within the work zone. When surveyed about their preferred speed limit (see figure 5.9), all truck
drivers in the first category suggested a speed limit between 45 and 55 mph as appropriate for
work zones. About 74% of the participants in the second category suggested a speed limit of
more than 50mph, and the rest suggested 45-50 mph. Similar to passenger car drivers, truck
drivers generally suggested a speed limit consistent with their own traveling speed.
Figure 5.7 Car and Truck Drivers’ Opinions about the Speed Limit Compliance of Other
Drivers: “Did Other Drivers Follow the Speed Limit?”

66
Figure 5.8 Drivers’ Speed While Traveling through the Work Zone
Figure 5.9 Speed Limit Suggested by Surveyed Drivers

67
Chapter 6 Discussion of Results
This section presents the results from the objective and subjective evaluation that require
further clarification. It includes a brief discussion on the DOT survey; comparisons of the effects
of reduced lane widths, construction, and lane closure on vehicle speed; and an evaluation of the
consistency of the results of the objective and subjective evaluations.
According to Outcalt and Agent et al., a 10mph reduction in the posted speed limit is
desirable in work zones when work activity is on or near the highway (2009; 2005). The survey
of DOT practices showed that most states impose a maximum speed limit reduction of 10 mph in
work zones, and this is based on the presence of workers, reduced lane width, roadway
alignment, type of activity, and the existing speed limit. The variables that prompt a 20mph
reduction in speed limit include all of these, plus narrower lanes and higher traffic volume. The
DOT survey indicated that regulatory static speed limit signs are considered effective by only
25% the respondents. Based on the results of the t-tests comparing the vehicle speeds for two
levels of construction activity (table 4.4, table 4.8, table 4.15, and table 4.19) the objective
evaluation indicated that the mean speed of passenger cars and trucks in work zones with no
construction activity was significantly higher than those with it. Static signs, therefore, were
ineffective at reducing speeds unless construction activity was in place. This observation
correlates with the results of the subjective evaluation, which indicated that more than 90% of
respondents agree that construction causes them to reduce their speeds.
The speed limit for the Rolla, Waynesville, and Cuba sites was 60 mph and at the Pacific
site it was 50 mph. The construction activity at the Pacific site, the addition of a new lane, was
heavier than the other sites and the lane width (10 ft) was reduced. These factors required a
higher reduction in speed limit, in addition to a reduction in lane width (10 ft). Much of the
68
construction at the Pacific site was performed at night and a lower speed limit was more
beneficial for the safety of travelers. Considering the type and intensity of the construction
activity, the amount of reduction in the normal speed limit of the highway was justified.
Lane width in the Rolla and Pacific work zones were reduced by tubular markers and
pavement markings, respectively. The mean speeds of vehicles (with or without construction) at
the Rolla site were below the speed limit. Conversely, those at the Pacific site were higher than
the speed limit. In both cases, the differences were statistically significant. These results indicate
that the effect of reduced lane width was much greater when tubular markers were used.
The number of vehicles traveling at least 5 mph or 10 mph above the speed limit was
considerably larger for periods of no construction activity in the work zone. If the work zone
signs were in place but drivers saw no worker or construction activity, then they sped up to their
desired speed. Yet, some drivers did comply with the speed limits. This caused higher speed
variation during no construction which increases the risk of crashes.
Passenger car speeds were generally higher than truck speeds except at the Waynesville
site with construction (table 4.3). At the Waynesville site, the mean speed of passenger cars
was1.14 mph higher than that of trucks, but the difference was not statistically significant.
However, for the Pacific WB site, either with or without construction, the small difference
between passenger car and truck speeds (1.7 mph for no construction and 1.8 mph for
construction) was statistically significant at a 99% level of confidence. These results should be
interpreted carefully because of the sample size, which has an important effect on the test results.
The larger the sample size, the higher the power of the test. A test with higher power detects
even very small differences as statistically significant. For the Waynesville site, with

69
construction, the sample size was about 10% of the sample size for the Pacific WB site, without
construction (table 4.1and table 4.12).
For the Rolla site, the reduced lane width indicated by tabular markers on the open lane
significantly affected the mean speeds of vehicles. This was true even with no construction,
reducing vehicle speed to much lower than the 60 mph speed limit, and this difference was
statistically significant at a 99% level of confidence. Further, construction activity significantly
reduced the speeds of both cars and trucks. This finding was echoed by the results of the
subjective evaluation, in which more than 90% of the respondents indicated that they would
reduce their speed if they observed construction activity.
The objective evaluation determined that, with no construction activity in the work zone,
or with construction activity not adjacent to the open lane, vehicles drove faster than the speed
limit. These results are in agreement with previous findings (Migletz et al, 1998; Migletz et al,
1999).Additionally, the objective results agree with those of the subjective analysis. The survey
for the Pacific work zone with a 50 mph speed limit was conducted when the lane closure had
been removed as a result of congestion and no construction was observed. As a result, most of
the passenger car and truck drivers were traveling faster than the speed limit. Only 40% of
drivers indicated that they drove below the speed limit under those conditions. On the contrary,
for work zones with a 60mph speed limit, the survey was conducted with one lane closed and on-
going construction. In this case, 95% of the participants indicated that they drove below the
speed limit. In addition, about 92% of all participants indicated that construction activity causes
them to reduce their speed.
Passenger car surveys conducted for work zones with 60mph and 50mph speed limits,
36% and 40% of car drivers, respectively, indicated that other drivers do not follow the speed
70
limit. On those same surveys, 5% and 60% of car drivers, respectively, indicated that they drove
faster than the speed limit. Thus, even when only a minority of drivers (5%) drove faster than the
speed limit, they overestimated the number of other drivers that travel faster than the speed limit
(36%). When an appreciable number of drivers (60%) traveled faster than the speed limit, they
underestimated the number of other drivers that they believed to be traveling faster than the
speed limit (40%). Furthermore, drivers generally suggest a speed limit higher than their actual
speed, regardless of the existing speed limit or of roadway or environmental conditions. This
result is expected because drivers are unlikely to suggest a speed limit that they violated. A
similar result was observed for the truck driver survey, which indicates that all the drivers behave
in a similar manner.
71
Chapter 7 Conclusions and Recommendations
This study analyzed the effects of lane closures, closed versus open lanes within the work
zone; construction activity; and lane width on free flow speeds of passenger cars and heavy
vehicles in work zones. Speeds referred to in this section and elsewhere in the report indicates
the free flow speeds unless otherwise stated. It also evaluated drivers’ compliance with the
posted speed limit, both objectively and based on drivers’ perceptions of their own speeds.
Moreover, it surveyed state DOTs to identify common work zone practices related to posted
speed limit.
From the objective evaluation, passenger cars were found to travel at significantly higher
speeds than trucks. For all work zone sites, the speed of cars was at least 1.2 and 1.8 mph higher
than trucks during no construction and construction, respectively. Construction activity
significantly reduced the speeds of passenger cars and heavy vehicles; however, their speeds
were still higher than the posted speed limit. During periods of no-construction, passenger car
speeds were at least 3.5 mph higher than during periods of construction. Truck speeds were also
found to be at least 2.2 mph higher during periods of no-construction compared to construction.
With no lane width reduction and no construction activity, drivers drove faster than the speed
limit. The mean speed of cars and trucks were found to be at least 2.8 and 0.6 mph higher than
the speed limit, respectively.
Reduced lane width as a result of tubular markers was the most effective factor in terms
of reducing the speeds of vehicles. It resulted in a mean speed for cars and trucks of4.0 and 8.1
mph less than the speed limit, respectively, during no-construction activity, and 8.5 and 11.1
mph less than the speed limit during construction activity. Based on the discussion in this report
concerning the safety risks of low speed limits with no work zone activity, the use of variable

72
speed limits is recommended since it adjusts the speed limit according to the state of traffic and
may reduce the risk of crashes in work zones.
Drivers’ compliance with the speed limit dropped with lower speed limits, 50 mph versus
60mph. The number of drivers traveling at a speed of at least 5 or 10 mph above the speed limit
was considerably higher for sites with a 50mph speed limit compared to those sites with a 60-
mph speed limit, during both periods of construction and no-construction activity. Drivers
exceeding the speed limit by more than 10 mph were found to be less than 10% with
construction. However, this percentage increased to more than 25% and 17% for cars and trucks,
respectively, with no construction activity.
From the state DOT survey, twenty seven responses were received. Of these, 86% of
DOTs reduce the speed limit for activities within 2 feet of the road edge. For activities between
the centerline and the edge, 26 out of 27 agencies reduce the speed limit. The dominant factors in
determining the reduced speed limit were presence of workers, lane width, roadway alignment,
and type of activity. Seventy percent of respondents indicated a maximum speed limit reduction
of 10 mph in work zones. Also, static speed limit signs are most commonly used. Most DOTs
agree that the best strategy to increase compliance with the speed limit in work zones is the use
of police patrol. Only 25% of respondents found regulatory signs effective and another 72%
indicated that the regulatory signs were partly effective.
The subjective evaluation determined that drivers prefer to be informed of an upcoming
work zone more than a mile in advance when workers are present. Fourteen percent of drivers,
however, were found to be aggressive in terms of lane changing behavior as they prefer to see
the “Lane Closed Ahead” and “Reduced Speed Limit” sign less than one mile before the work
zone. In the objective analysis with no construction, a similar percentage of drivers were
73
observed exceeding the speed limit by more than 10 mph. Most drivers indicated that they
experienced delay in the work zone. Likewise, more than 90% agreed that construction activity
reduced their speeds, which is also reflected in the results of the objective analysis. The
comparison of the responses to the survey questions on speed limit suggests that when most
drivers are traveling faster than the speed limit, they underestimate the number of other drivers
by 20% that do not comply with the speed limit. Conversely, when most drivers are traveling
below the speed limit, they overestimate the noncompliance by 31%. Also, drivers generally
suggest a speed limit consistent with their own speed, irrespective of the existing speed limit,
roadway or environmental factors. This is a predictable tendency of human behavior.
The survey results related to the posted speed limit are particularly important. An
overwhelming majority of drivers (92% of car drivers and all of the truck drivers) suggested a
reduction in speed limit during periods when the work zone is congested. Conversely, 92% of car
drivers and 73% of truck drivers suggested increasing the posted speed limit (from 50 mph)
when the work zone is not congested. A possible solution to this issue could be the use of a
variable speed limit system.
Therefore, the study recommends the use of tubular markers rather than pavement
markings for reducing the lane width, and separating the construction area from the open lanes.
When there is no construction activity in the work zone or there is no lane closure, a reduced
speed limit results in higher variance in the vehicle speeds. Consequently, this indicates higher
risk of crashes. This study strongly recommends the use of variable speed limit for work zones
with short-term construction periods. Speed limits can be adjusted in real time based on the
traffic speed and construction activity. This will help in the mobility and safety of traffic during
periods with no-construction activity.

74
Future studies should consider the effects of different lane widths, such as the use of
tubular markers, on vehicle speeds in work zones. Work zones on freeways with more than two
lanes in each direction, and the effects of different types of construction activities on vehicle
speeds should be studied as well. In terms of subjective analysis, the difference in the behavior of
male and female drivers should be investigated with a much larger database. As many drivers
travel across state boundaries, the results of a survey conducted over a region could reveal
interesting outcomes.

75
References
Agent, K. R., J. G. Pigman, and J. M. Weber. 2005. Evaluation of speed limits in Kentucky.
Transportation Research Record: Journal of the Transportation Research Board No.
1640,Paper No. 98-1542.
Autoscope® Software Suite Version 8.30 User Manual: Econolite Control Products.
2006.
Bai, Y., and Y. Li. 2006.Determining major causes of highway work zone accidents in
Kansas. Kansas Department of Transportation, Report No. K-TRAN: KU-05-1.
Bella, F. 2005. Driving simulator validation for work zone design. In CD ROM Proceedings of
the 84th
Annual Transportation Research Board Meeting, January 9-13.
Benekohal, R.F., L. M. Kastel, and M. Suhale. 1992. Evaluation and summary of studies in
Speed control methods in work zones. Publication FHWA-IL-UI-237.Illinois University,
Urbana-Champaign.
Benekohal, R.F., P.T.V. Resende, and R.L. Orloski. 1992. Effects of police presence on speed in
a highway work zone: circulating marked police car experiment. Publication FHWA-
ILUI-240.Illinois University, Urbana-Champaign.
Benekohal, R.F., L. Wang, R. Orloski, and L. M. Kastel. 1992. Speed-reduction patterns of
vehicles in a highway construction zone. Transportation Research Record: Journal of the
Transportation Research Board No. 1352: 35–45.
Benekohal, R. F., and J. Shu. 1992. Speed reduction effects of changeable message signs in a
construction zone. Publication FHWA/IL/UI-239.FHWA, U.S. Department of
Transportation.
Benekohal, R. F., A. Z. K. Mohideen, and M. V. Chitturi. 2004. Methodology for estimating
operating speed and capacity in work zones. Transportation Research Record: Journal of
the Transportation Research Board No. 1883: 103–111.
Chitturi, M. V., and R. F. Benekohal. 2005. Effect of lane width on speeds of cars and heavy
vehicles in work zones. Transportation Research Record: Journal of the Transportation
Research Board No. 1920: 41–48.
Firman, U., Y. Li, and Y. Bai. 2009. Determining the effectiveness of portable changeable
messagesigns in work zones. In Proceedings of the 2009 Mid-Continent Transportation
Research Symposium.
Fontaine, M. D., and P. J. Carlson. 2001. Evaluation of speed displays and rumble strips at rural
maintenance work zones. Transportation Research Record: Journal of the
Transportation Research Board No. 1754: 27–38.

76
Fontaine, M.D., S.D. Schrock, and G. Ullman. 2002. Feasibility of real-time remote speed
enforcement for work zones. Transportation Research Record: Journal of the
Transportation Research Board No. 1818: 25–31.
Garber, N. J., and S. Srinivasan.1998. Effectiveness of changeable message sign in controlling
vehicle speeds in work zones. Virginia Transportation Research Council.VTRC98-R10.
Garber, N. J., and S. Srinivasan.1998. Influence of exposure duration on the effectiveness of
changeable-messagesigns in controlling vehicle speeds at work zones. Transportation
Research Record: Journal of the Transportation Research Board No. 1650, Paper No.
98-0552.
Graham-Migletz Enterprises, Inc. 1996.Procedure for determining work zone speed limits.
NCHRP Research Results Digest, No. 192. Transportation Research Board, National
Research Council.
Huebschman, C. R., C. Garcia, D. Bullock, and D. Abraham. 2004. Compliance with reduced
speed limits in work zones. In CD ROM Proceedings of the 83th Annual Transportation
Research Board Meeting, January 11-15.
Jackels, J. and D. Brannan.1988. Work zone speed limit demonstration in District 1A.
Minnesota Department of Transportation.
Jones, R.K., and J.H. Lacey.1997. The effectiveness of laser- and radar-based enforcement
programs for deterrence of speeding. Report DOT-HS- 808-530. National Highway
Traffic Safety Administration, U.S. Department of Transportation.
Kamyab, A., T. H. Maze, S. Gent, and C. Poole. 2000. Evaluation of speed reduction techniques
at work zones. In Mid-Continent Transportation Symposium Proceedings.
Kamyab, A., T. McDonald, B. Storm, and M. A. Wilk. 2003.Effectiveness of extra
enforcementin construction and maintenance work zones. Center for Transportation
Research and Education, Report No.MwSWORK ZONEDI Year 4 Technology
Evaluation #1.
Kang, K., G. Chang, and N. Zou. 2004. Optimal dynamic speed-limitcontrol for highway work
zone operations. Transportation Research Record: Journal of the Transportation
Research Board No. 1877: 77–84.
KnodlerJr, M. A., D. S. Hurwitz, and H. Rothenberg. 2008. An evaluation of rationally
implemented speed limits on collector roadways. In CD ROM Proceedings of the 87th
Annual Transportation Research Board Meeting, January 13-17.

77
Lee, C., B. Hellinga, and F. Saccomanno. 2004. Assessing safety benefits of variable speed
limits. In CD ROM Proceedings of the 83th Annual Transportation Research Board
Meeting, Paper No. 04-4835, January 11-15.
Li, Y., and Y. Bai. 2008. Comparison of characteristics between fatal and injury accidents in the
highway construction zones. Journal of Safety Science46: 646-660.
Lyles, R. W., W. C. Taylor, D. Lavansiri, and J. Grossklaus. 2004. A field test and evaluation of
variable speed limits in work zones. In CD ROM Proceedings of the 83th Annual
Transportation Research Board Meeting, January 11-15.
Maze, T., A. Kamyab, and S. Schrock. 2000. Evaluation of work zone speed reduction measures.
Center for Transportation Research and Education, CTRE Management Project 99-44.
Migletz, J., J. Graham, B. Hess, I. Anderson, D. Harwood, and K. Bauer. 1998. Effectiveness and
implementability of procedures for setting work zone speed limits. Publication NCHRP
Project 3-41(2). Independence: MO: Graham–Migletz Enterprises.
Migletz, J., J. L. Graham, I. B. Anderson, D. W. Harwood, and K. M. Bauer. 1999. Work zone
speed limit procedure. Transportation Research Record: Journal of the Transportation
Research Board No. 1657, Paper No. 99-0920.
Minitab® Statistical Software version 15.Minitab Inc. 2007.
Noel, E., C. Dudek, O. Pendleton, H. McGee, and Z. Sabra. 1987. Speed control through work
zones: techniques evaluation and implementation guidelines. Publication FHWA-IP-87-.
FHWA, U.S. Department of Transportation.
Outcalt, W. 2009.Work zone speed control. Publication Colorado Department of Transportation,
CDOT-2009-3.
Richards, S. H., R. C. Wunderlich, and C. L. Dudek. 1985. Field evaluation of work zone speed
control techniques. Transportation Research Record: Journal of the Transportation
Research Board No. 1035: 66–78.
Sandberg, W., T. Schoenecker, K. Sebastian, and D. Soler. 2008. Long-term effectiveness of
Dynamic speed monitoring displays (DSMD) for speed management at speed limit
transitions. Paper presented at the 2006 ITE Annual Meeting and Exhibit Compendium of
Technical Papers, Washington, D.C.
Stephens, M. A. 1974. EDF statistics for goodness of fit and some comparisons. Journal of the
American Statistical Association 69: 730-737.
Sun, D., and R. F. Benekohal. 2004. Analysis of car following characteristics for estimating
work zone safety. In CD ROM Proceedings of the 83th Annual Transportation Research
Board Meeting Paper No. 04-4883, January 11-15.

78
Transportation Research Board. 2000. Highway Capacity Manual. 4th ed. Washington, DC:
Transportation Research Board, National Research Council.
Ullman, G. L. 1991. Effect of radar transmissions on traffic operations at highway work zones.
Transportation Research Record: Journal of the Transportation Research Board
No.1304:261–269.
U.S. Department of Transportation. 2003. Manual on uniform traffic control devices for streets
and highways. Revision 1. Washington, DC: FHWA, U.S. Department of Transportation.
Wang, C., K. K. Dixon, and D. Jared. 2003. Evaluating speed-reduction strategies for highway
work zones. Transportation Research Record: Journal of the Transportation Research
Board Paper No. 03-4099.

79
Appendices

80
Appendix A. Aerial Views of Work Zone Sites
The following are aerial views of video data collection sites in the work zones studied in
this report. The circle in figures A1-A3 shows where the camera was positioned.
Figure A.1 Waynesville Work Zone Site, August 13, 2009

81
Figure A.2 Rolla Work Zone Site, October 2, 2009
Figure A.3 Cuba Work Zone Site, August 13, 2009

82
Appendix B State DOT Survey Questionnaire
1. Please mention the name of your organization?
2. Does your state have a policy on reducing or managing traffic speeds in work zones?
Yes
No
If yes, please specify whether it is a legislative or transportation agency wide policy
3. Do you reduce speed limits for the following conditions? (Please choose all that apply)
Activities that are more than 10 ft from the edge of the traveled way
Activities that encroach on the area closer than 10 ft but not closer than 2 ft to the edge of
the traveled way
Activities that encroach on the area from the edge of the traveled way to 2 ft from the
edge of the traveled way
Activities that require an intermittent or moving operation on the shoulder
Activities that encroach on the area between the centerline and the edge of the traveled
way
Activities requiring temporary detour to be constructed
4. If you answered yes to any part of the above question, do you consider any of the following
factors before deciding on appropriate work zone speed limit?( please check all that apply)
Lane width
Alignment
Type of work zone
Sight distance
Prevailing speeds

83
Worker’s present
Accident experience
Presence of barrier
Roadway type
Traffic volume
Design speed
Engineering judgment
Duration of work
Existing speed limit
Vehicle mix (truck composition)
5. What is the maximum speed reduction you use for work zone? (Please mark beside the
appropriate option)
5 mph
10 mph
20 mph
Others (please specify)
6. What devices do you use to notify the driver of a lower work zone speed limit? At what
distance from work zone are these devices placed? If multiple devices are used, what is the
spacing between them? (These devices may include post-mounted static signs, portable
changeable message signs, speed display trailers, flashing beacons, and other devices.)
7. Which of the following strategies in work zone do you currently use (or have used in the past)
for speed control and/or improved compliance, and how effective are they, if used?
Please mark in the appropriate box.

84
Regulatory signs – Effective, Partially Effective, Not Effective
Advisory signs – Effective, Partially Effective, Not Effective
Staggered speed reduction* – Effective, Partially Effective, Not Effective
Changeable message signs – Effective, Partially Effective, Not Effective
Police Enforcement – Effective, Partially Effective, Not Effective
Flagging – Effective, Partially Effective, Not Effective
Pilot vehicle – Effective, Partially Effective, Not Effective
Flashing lights on signs – Effective, Partially Effective, Not Effective
Longer speed zone transition – Effective, Partially Effective, Not Effective
Increased fines for infraction – Effective, Partially Effective, Not Effective
Pavement markings – Effective, Partially Effective, Not Effective
Lane narrowing – Effective, Partially Effective, Not Effective
Rumble strips – Effective, Partially Effective, Not Effective
Any other combinations – Effective, Partially Effective, Not Effective
If any other combination, please specify
* Note: Staggered speed reduction means different speed reductions just upstream of the work
zone and within the work zone. (Example: 10mph reduction just u/s of work zone and 20 mph
reduction within the work zone)
8. Which of the following measures of effectiveness are used to determine the effectiveness of
the speed reduction strategy in the work zone? (Please choose all that apply)
Mean speed within the work zone
Speed variance within the work zone
85th percentile speed within the work zone
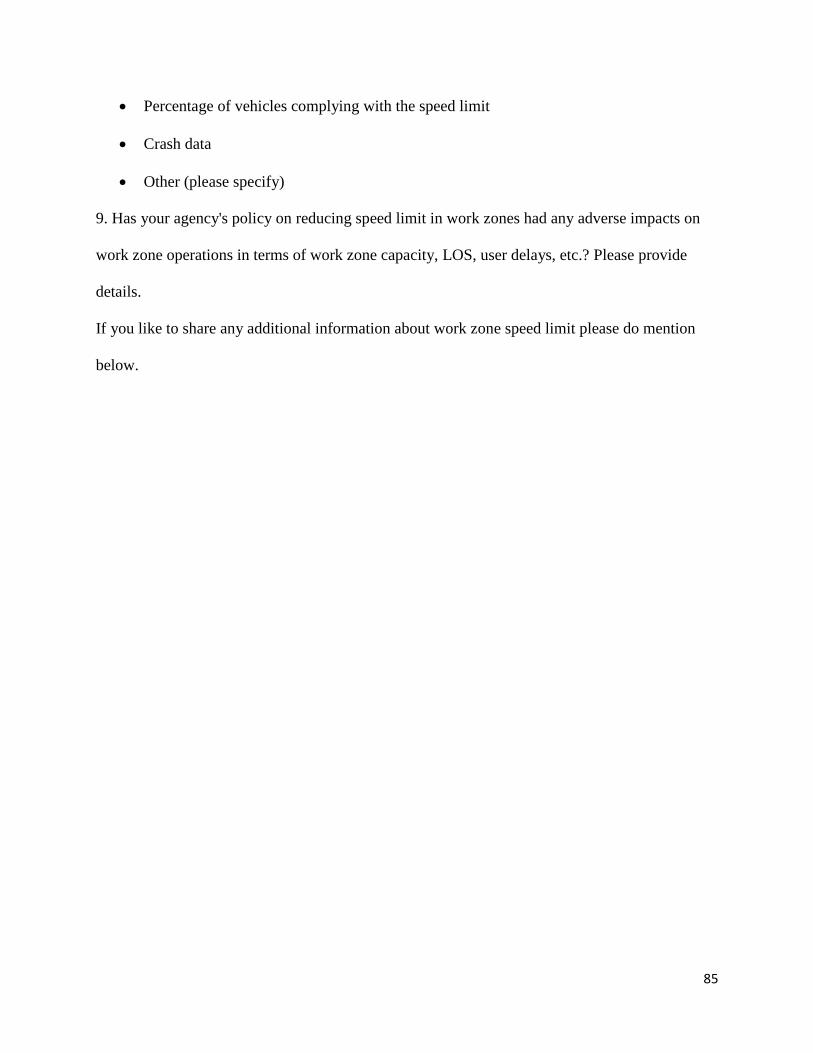
85
Percentage of vehicles complying with the speed limit
Crash data
Other (please specify)
9. Has your agency's policy on reducing speed limit in work zones had any adverse impacts on
work zone operations in terms of work zone capacity, LOS, user delays, etc.? Please provide
details.
If you like to share any additional information about work zone speed limit please do mention
below.
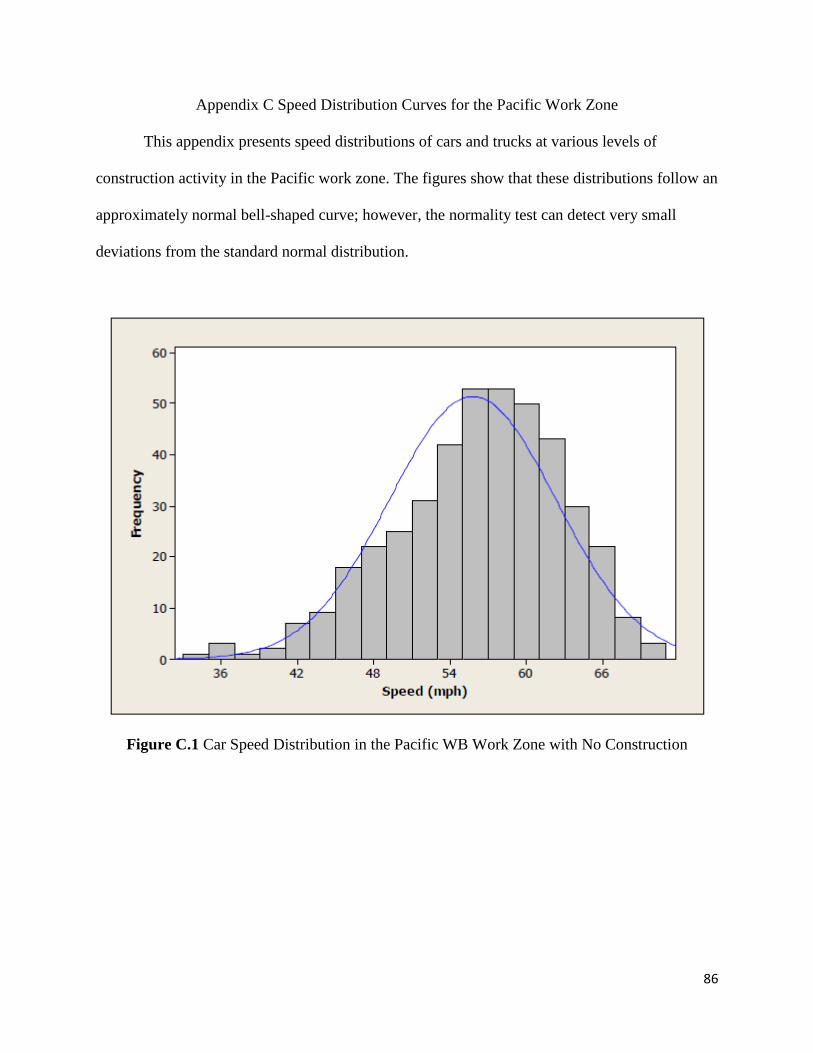
86
Appendix C Speed Distribution Curves for the Pacific Work Zone
This appendix presents speed distributions of cars and trucks at various levels of
construction activity in the Pacific work zone. The figures show that these distributions follow an
approximately normal bell-shaped curve; however, the normality test can detect very small
deviations from the standard normal distribution.
Figure C.1 Car Speed Distribution in the Pacific WB Work Zone with No Construction
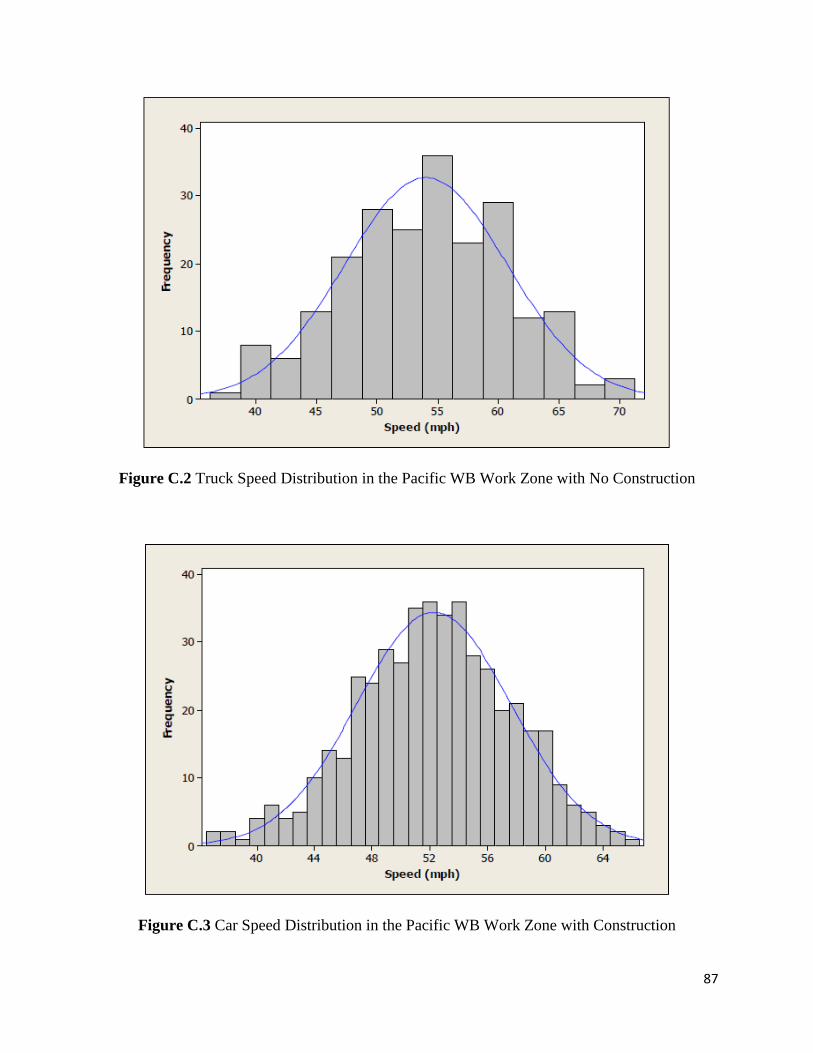
87
Figure C.2 Truck Speed Distribution in the Pacific WB Work Zone with No Construction
Figure C.3 Car Speed Distribution in the Pacific WB Work Zone with Construction
88
Figure C.4 Truck Speed Distribution in the Pacific WB Work Zone with Construction
Figure C.5 Car Speed Distribution in the Pacific EB Work Zone with No Construction

89
Figure C.6 Truck Speed Distribution in the Pacific EB Work Zone with No Construction
Figure C.7 Car Speed Distribution in the Pacific EB Work Zone with Construction
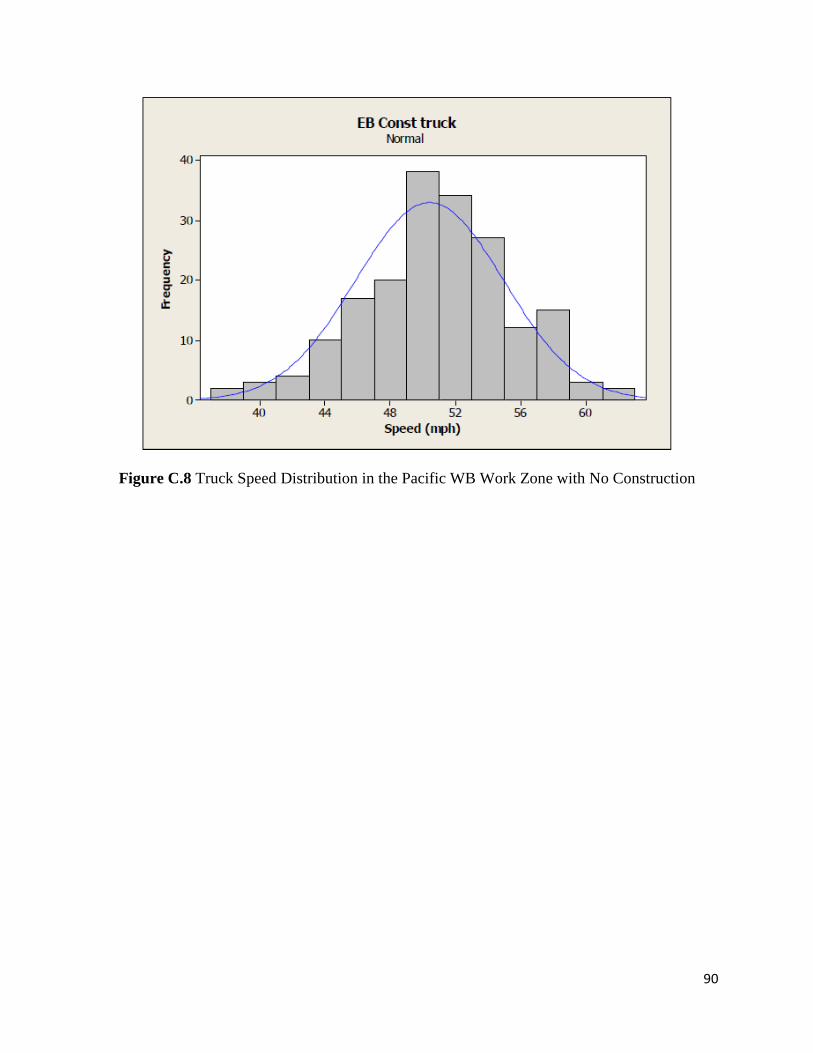
90
Figure C.8 Truck Speed Distribution in the Pacific WB Work Zone with No Construction

91
Appendix D Driver Survey Questionnaire
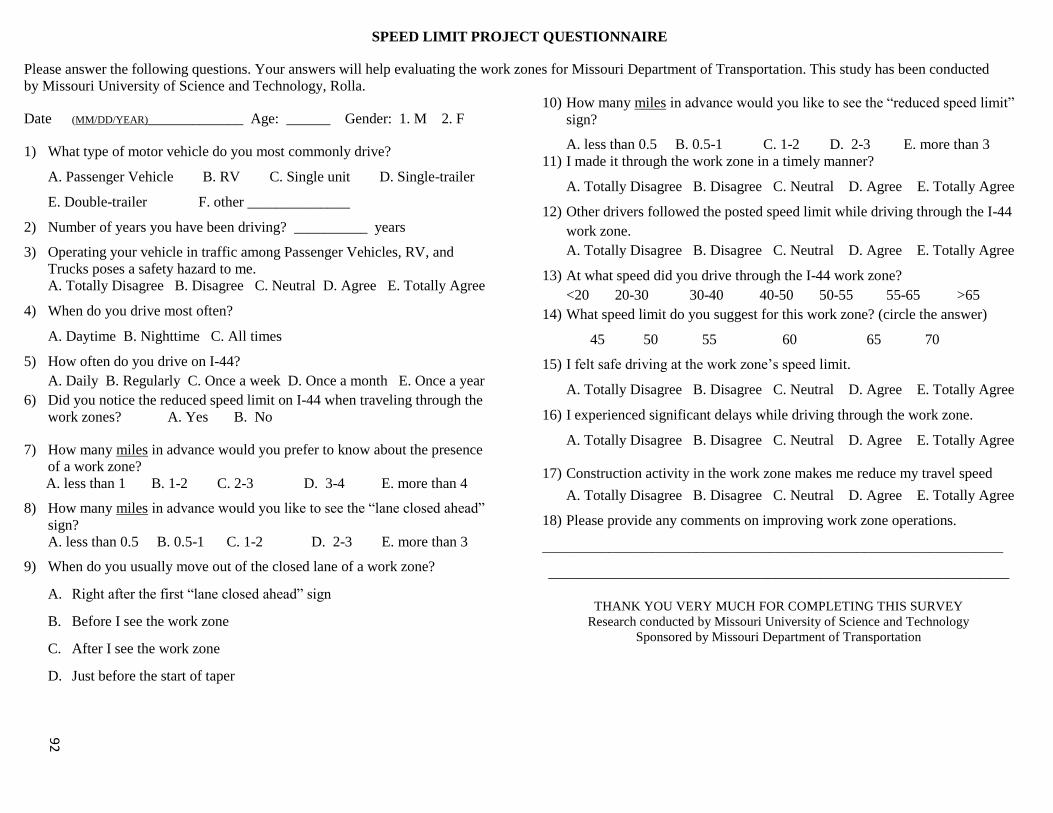
SPEED LIMIT PROJECT QUESTIONNAIRE
Please answer the following questions. Your answers will help evaluating the work zones for Missouri Department of Transportation. This study has been conducted
by Missouri University of Science and Technology, Rolla.
Date (MM/DD/YEAR)_____________ Age: ______ Gender: 1. M 2. F
1) What type of motor vehicle do you most commonly drive?
A. Passenger Vehicle B. RV C. Single unit D. Single-trailer
E. Double-trailer F. other ______________
2) Number of years you have been driving? __________ years
3) Operating your vehicle in traffic among Passenger Vehicles, RV, and
Trucks poses a safety hazard to me.
A. Totally Disagree B. Disagree C. Neutral D. Agree E. Totally Agree
4) When do you drive most often?
A. Daytime B. Nighttime C. All times
5) How often do you drive on I-44?
A. Daily B. Regularly C. Once a week D. Once a month E. Once a year
6) Did you notice the reduced speed limit on I-44 when traveling through the
work zones? A. Yes B. No
7) How many miles in advance would you prefer to know about the presence
of a work zone?
A. less than 1 B. 1-2 C. 2-3 D. 3-4 E. more than 4
8) How many miles in advance would you like to see the “lane closed ahead”
sign?
A. less than 0.5 B. 0.5-1 C. 1-2 D. 2-3 E. more than 3
9) When do you usually move out of the closed lane of a work zone?
A. Right after the first “lane closed ahead” sign
B. Before I see the work zone
C. After I see the work zone
D. Just before the start of taper
10) How many miles in advance would you like to see the “reduced speed limit”
sign?
A. less than 0.5 B. 0.5-1 C. 1-2 D. 2-3 E. more than 3
11) I made it through the work zone in a timely manner?
A. Totally Disagree B. Disagree C. Neutral D. Agree E. Totally Agree
12) Other drivers followed the posted speed limit while driving through the I-44
work zone.
A. Totally Disagree B. Disagree C. Neutral D. Agree E. Totally Agree
13) At what speed did you drive through the I-44 work zone?
<20 20-30 30-40 40-50 50-55 55-65 >65
14) What speed limit do you suggest for this work zone? (circle the answer)
45 50 55 60 65 70
15) I felt safe driving at the work zone’s speed limit.
A. Totally Disagree B. Disagree C. Neutral D. Agree E. Totally Agree
16) I experienced significant delays while driving through the work zone.
A. Totally Disagree B. Disagree C. Neutral D. Agree E. Totally Agree
17) Construction activity in the work zone makes me reduce my travel speed
A. Totally Disagree B. Disagree C. Neutral D. Agree E. Totally Agree
18) Please provide any comments on improving work zone operations.
_______________________________________________________________
_______________________________________________________________
THANK YOU VERY MUCH FOR COMPLETING THIS SURVEY
Research conducted by Missouri University of Science and Technology
Sponsored by Missouri Department of Transportation
92
Top Related