


Languages
Pages
Legal

i
An IPRF Research Report Innovative Pavement Research Foundation Airport Concrete Pavement Technology Program
Report IPRF-01-G-002-03-2 Mitigation of ASR In Concrete Pavement - Combined Materials Testing
Programs Management Office 5420 Old Orchard Road Skokie, IL 60077 December, 2009
% V
olu
me C
hange
Time (hrs)
Activation E
nerg
y
Alkalinity
Ln
(Rate
Consta
nts
)
1/Temperature
Ea / R
1

ii
An IPRF Research Report Innovative Pavement Research Foundation Airport Concrete Pavement Technology Program
Report IPRF-01-G-002-03-2 Mitigation of ASR In Concrete Pavement - Combined Materials Testing
Prepared by
Texas Transportation Institute Texas A&M University College Station, TX 77843
Principal Investigator
Dr. Dan G. Zollinger, P.E.
Contributing Authors
Dr. Anal K. Mukhopadhyay Dr. Hassan Ghanem
Dr. Chang-Seon Shon Dr. David Gress Dr. Doug Hooton
Programs Management Office 5420 Old Orchard Road Skokie, IL 60077

iii
This report has been prepared by the Innovative Pavement Research Foundation under the Airport Concrete Pavement Technology Program. Funding is provided by the Federal Aviation Administration under Cooperative Agreement Number 01-G-002. Dr. Satish Agrawal is the Manager of the FAA Airport Technology R&D Branch and the Technical Manager of the Cooperative Agreement. Mr. Jim Lafrenz, P.E. is the Program Director for the IPRF. The Innovative Pavement Research Foundation and the Federal Aviation Administration thanks the Technical Panel that willingly gave of their expertise and time for the development of this report. They were responsible for the oversight and the technical direction. The names of those individuals on the Technical Panel follow. Mr. Douglas B. Johnson, P.E. Federal Aviation Administration Ms. Marie Torres MRM Construction Services Mr. Norman R. Nelson Lyman-Richey Corporation Mr. Tim Smith, P.Eng. Cement Association of Canada Mr. Guy Geerdts, P.E. CH2M Hill Engineers
The contents of this report reflect the views of the authors who are responsible for the facts and the accuracy of the data presented within. The contents do not necessarily reflect the official views and policies of the Federal Aviation Administration. This report does not constitute a standard, specification, or regulation. Its contents are not intended for construction, bidding, or permit purposes. The use of names of specific products or manufacturers listed herein does not imply endorsement of those products or manufacturers.
iv
TABLE OF CONTENTS
LIST OF FIGURES ................................................................................................................. vii
LIST OF TABLES ..................................................................................................................... ix
CHAPTER 1- INTRODUCTION ............................................................................................... 1
1.1 GENERAL ................................................................................................................. 1
1.2 RESEARCH SIGNIFICANCE AND PROBLEM STATEMENT ............................ 2
1.3 OBJECTIVES ............................................................................................................ 3
1.4 ORGANIZATION OF THE REPORT ...................................................................... 3
CHAPTER 2 - LITERATURE REVIEW ................................................................................... 5
2.1 INTRODUCTION ..................................................................................................... 5
2.2 PRIMARY FACTORS INFLUENCING ALKALI-SILICA REACTION (ASR) .... 8
2.2.1 Sufficient Alkalis ....................................................................................................... 8
2.2.2 Reactive Silica ........................................................................................................ 12
2.2.3 Sufficient Moisture................................................................................................... 14
2.2.4 Environmental Effects .............................................................................................. 15
2.3 CHEMISTRY OF ALKALI-SILICA REACTION ................................................. 16
2.4 CURRENT MECHANISMS OF EXPANSION ...................................................... 19
2.4.1 Hansen Theory ......................................................................................................... 19
2.4.2 McGowan and Vivian Theory .................................................................................. 19
2.4.3 Powers and Steinour Theory .................................................................................... 19
2.4.4 Chatterjee Theory ..................................................................................................... 20
2.4.5 Diffuse Double Layer (DDL) Theory ...................................................................... 21
2.5 CURRENT TEST METHODS FOR ASSESSING ASR ........................................ 21
2.5.1 Aggregate Testing .................................................................................................... 21
2.5.1.1 ASTM C 289: Standard test method for potential alkali-silica reactivity
of aggregates (chemical method) ............................................................................. 22
2.5.1.2 ASTM C 295: Standard guide for petrographic examination of
aggregates for concrete............................................................................................ 23
2.5.1.3 Other Promising Aggregate Testing Methods ......................................................... 23
2.5.2 Mortar and Concrete Testing ................................................................................... 25
2.5.2.1 ASTM C 227: Standard test method for potential alkali reactivity of
cement-aggregate combinations (mortar-bar method) ............................................ 25
2.5.2.2 ASTM C 441: Standard test method for effectiveness of mineral
admixtures or slag in preventing excessive expansion of concrete
due to alkali-silica reaction ..................................................................................... 25
2.5.2.3 ASTM C 1260: Standard test method for potential alkali reactivity
of aggregates (mortar-bar method) ......................................................................... 26
2.5.2.4 ASTM C 1293: Standard test method for concrete aggregates by
determination of length change of concrete due to alkali silica reaction ................ 26

v
TABLE OF CONTENTS (CONTINUED)
CHAPTER 3 - DEVELOPMENT OF A PERFORMANCE-BASED ASR TEST
APPROACH ............................................................................................................................. 29
3.1 INTRODUCTION .................................................................................................. 29
3.2 ASR: A KINETIC TYPE CHEMICAL .................................................................. 29
3.2.1 Previous Kinetic Type Approaches and Applications ........................................... 32
3.3 DEVELOPMENT OF A PERFORMANCE-BASED APPROACH TO
ASSESS ASR....................................................................................................... ...33
3.3.1 Defining and Determination of Alkali Silica Reactivity of Aggregate .................. 34
3.3.1.1 Test Device to Measure Volume Change over Time due to ASR ............................ 35
3.3.1.2 Development of a Performance-Based Model to Assess ASR ................................. 35
3.3.1.3 Proposed Model to Determine Ea of Aggregate under Field Conditions ............... 38
CHAPTER 4 - TEST EQUIPMENT EVOLUTION AND PROTOCOL
VALIDATION .......................................................................................................................... 41
4.1 INTRODUCTION ................................................................................................... 41
4.2 DESCRIPTION OF THE DILATOMETER EQUIPMENT ................................... 41
4.3 PROCEDURE TO MEASURE ASR VOLUME EXPANSION
OF AGGREGATE ................................................................................................... 44
4.3.1 Preparation of Alkaline Solution .............................................................................. 44
4.3.2 Aggregate Sample Preparation ................................................................................. 44
4.3.3 Dilatometer Testing Procedure ................................................................................ 44
4.3.4 Calculation of ASR Expansion ................................................................................ 47
4.3.5 Data Analysis ........................................................................................................... 47
4.4 FIRST PHASE OF EVALUATION ........................................................................ 47
4.4.1 Identification of Sources of Errors ........................................................................... 49
4.4.1.1 Incidences of Float Leaking and sticking ................................................................ 50
4.4.1.2 Moisture Condensation ............................................................................................ 51
4.4.1.3 Vapor Pressure Loss ................................................................................................ 51
4.4.1.4 Aggregate Absorption of Moisture ........................................................................... 51
4.4.1.5 Modeling Data Trends ............................................................................................. 51
4.4.2 Measures to Minimize the Source of Errors ............................................................ 51
4.4.2.1 Float Leaking and Sticking ...................................................................................... 52
4.4.2.2 Moisture condensation ............................................................................................. 52
4.4.2.3 Vapor Pressure Loss ................................................................................................ 53
4.4.2.4 Improvement in Data Modeling ............................................................................... 53
4.5 SECOND PHASE OF EVALUATION ................................................................... 54
4.5.1 Source of Variance Associated With the Revised System ....................................... 54
4.5.2 Measures to Eliminate the Source of Variance in the Revised System ................... 55
4.5.2.1 Development of Dilatometer Calibration Procedure ............................................... 55
4.5.2.2 Chemical Shrinkage Testing .................................................................................... 56
4.6 TEST PROCEDURE VALIDATION...................................................................... 57

vi
TABLE OF CONTENTS (CONTINUED)
4.6.1 Intra-Laboratory Comparisons ................................................................................. 58
4.6.2 Inter-Laboratory Comparisons ................................................................................. 59
4.6.2.1 Hypothesis Testing ................................................................................................... 59
CHAPTER 5 - DETERMINATION OF KINETIC BASED AGGREGATE
ALKALI SILICA REACTIVITY USING DILATOMETRY .................................................. 63
5.1 INTRODUCTION ................................................................................................... 63
5.2 EXPERIEMENTAL DESIGN ................................................................................. 63
5.3 MATERIALS ........................................................................................................... 65
5.3.1 Aggregates ............................................................................................................... 65
5.3.2 Sodium Hydroxide ................................................................................................... 67
5.4 TEST RESULTS ...................................................................................................... 67
5.4.1 Expansion Characteristics and Activation Energy ................................................... 67
5.4.1.1 New Mexico Rhyolite (NMR) ................................................................................... 68
5.4.1.2 Spratt Limestone (SL) ............................................................................................... 73
5.4.1.3 Platt River Gravel (PRG) ......................................................................................... 75
5.4.1.4 Sudbury Gravel (SuG) .............................................................................................. 80
5.4.2 Effect of Test Condition on ASR Expansion Behavior ........................................... 86
5.4.2.1 Effect of Alkalinity .................................................................................................... 86
5.4.2.2 Effect of Temperature ............................................................................................... 87
5.4.2.3 Effect of Calcium Hydroxide .................................................................................... 91
5.4.3 Chemistry of Test Solution ...................................................................................... 93
5.4.4 Relating Activation Energy with Alkalinity ............................................................ 99
5.4.4.1 Ea vs. Alkalinity for NMR Aggregate ..................................................................... 100
5.4.4.2 Ea vs. Alkalinity for the Studied Aggregates .......................................................... 101
5.5 SUMMARY ........................................................................................................... 103
CHAPTER 6 - CONCLUSIONS AND RECOMMENDATIONS ......................................... 105
6.1 INTRODUCTION ................................................................................................. 105
6.2 CONCLUSIONS .................................................................................................... 105
6.3 RECOMMENDATION FOR FUTURE RESEARCH .......................................... 107
REFERENCES ....................................................................................................................... 109
APPENDIX A - EQUIPMENT PROTOCOL ....................................................................... A-1
APPENDIX B - EARLIER MODEL TO CALCULATE ACTIVATION ENERGY ............ B-1
APPENDIX C - CHEMICAL SHRINKAGE TEST .............................................................. C-1
APPENDIX D - UNH AGGREGATE EXPANSION CHARACTERISTICS AND
ACTIVATION ENERGY ........................................................................... D-1
APPENDIX E - DEVELOPMENT OF A REACTION SIGNATURE
FOR COMBINED CONCRETE MATERIALS ......................................... E-1

vii
LIST OF FIGURES
FIGURE Page
2-1 Schematic of Alkali Silica Reaction ......................................................................... 6
2-2 Map cracking, portion of an airfield concrete pavement .......................................... 7
2-3 Misalignment of adjacent sections of a parapet wall on a highway
bridge due to ASR ..................................................................................................... 7
2-4 Heaving in an airfield pavement ............................................................................... 8
2-5 Three essential factors for ASR-induced damage in concrete .................................. 9
2-6 The Periodic Table showing the position of alkalis .................................................. 9
2-7 Effects of alkali content on expansion of prisms stored over water at 38°C .......... 11
2-8 A silica tetrahedral structure ................................................................................... 12
2-9 Photomicrograph of a chalcedony (cryptocrystalline form of silica)
aggregate in concrete .............................................................................................. 13
2-10 Strained quartz exhibiting dark (a) and light bands (b) within a single
grain under transmitted light microscope of a concrete thin section ...................... 14
2-11 Effects of relative humidity on expansion using the ASTM C 1293 ...................... 15
2-12 Microstructure and mineralogy at aggregate-paste interface .................................. 17
2-13 Effects of pH on dissolution of amorphous silica ................................................... 18
2-14 Current test methods for assessing ASR ................................................................. 22
2-15 A schematic diagram of the osmotic cell ................................................................ 24
3-1 Effect of temperature and alkalinity on ASR expansion ........................................ 30
3-2 Effect of reactive particle size on the relationship between expansion and age
(w/c = 0.41 and aggregate to cement ratio = 0.3) ................................................... 30
3-3 Effect of pH on dissolution of amorphous silica .................................................... 31
3-4 Diagram of the kinetic test ...................................................................................... 33
3-5 Avrami exponent versus rate constant .................................................................... 33
3-6 Proposed ASR Model to fit the expansion data history of the dilatometer ............ 36
3-7 Linearization of the kinetic performance model ..................................................... 37
3-8 Determination of activation energy ........................................................................ 37
3-9 Activation energy vs. alkalinity .............................................................................. 39
4-1 Final version of the dilatometer with modified lid and tower ................................ 42
4-2 Stainless steel float system...................................................................................... 43
4-3 Dilatometer test setup ............................................................................................. 43
4-4 Dilatometer vacuuming under vibration ................................................................. 46
4-5 (a) Dilatometer placed in water bath after final vacuuming, (b) Dilatometer
tower is wrapped with insulating material .............................................................. 46
4-6 Expansion characteristics of PRG @ 1N NaOH and 60, 70, and 80°C at TTI ....... 48
4-7 Expansion characteristics of PRG @ 1N NaOH and 70, 80°C at UNH ................. 48
4-8 Expansion characteristics of PRG @ 1N NaOH and 60, 70°C at UT .................... 49
4-9 Plastic bottle float (a) at TTI, and (b) at UT ........................................................... 50
4-10 Modified tower in UNH equipment ........................................................................ 52

viii
LIST OF FIGURES
FIGURE Page
4-11 Dilatometer placements inside an oven (a) three finally assembled
Dilatometers inside UNH small oven, (b) six finally assembled
Dilatometers inside TTI big oven ........................................................................... 53
4-12 Comparison of NMR activation energy between linear and non-linear method….54
4-13 Displacement (inch.) over time for both aggregate-solution and
aggregate-water tests ............................................................................................... 56
4-14 Net displacement due to ASR after calibration ....................................................... 57
5-1 Gradation curves of the studied aggregates ............................................................ 66
5-2 Expansion characteristics of NMR @ 1N NaOH + CH ......................................... 70
5-3 Expansion characteristics of NMR @ 0.5N NaOH + CH ...................................... 71
5-4 Expansion characteristics of NMR @ 0.25N NaOH + CH .................................... 72
5-5 Spratt Limestone (SL) (1 NaOH) ............................................................................ 74
5-6 Platt River Gravel (PRG) characteristics (1 NaOH) ............................................... 76
5-7 Platt River Gravel (PRG) characteristics (0.5 NaOH) ............................................ 77
5-8 Platt River Gravel (PRG) characteristics (1 NaOH + CH) ..................................... 78
5-9 Platt River Gravel (PRG) characteristics (0.5 NaOH + CH) .................................. 79
5-10 Sudbury Gravel (PRG) characteristics (1 NaOH) ................................................... 82
5-11 Sudbury Gravel (PRG) characteristics (0.5 NaOH) ................................................ 83
5-12 Sudbury Gravel (PRG) characteristics (1 NaOH + CH) ......................................... 84
5-13 Sudbury Gravel (PRG) characteristics (0.5 NaOH + CH) ...................................... 85
5-14 Effect of temperature on the rate constant (Beta) ................................................... 89
5-15 Effect of temperature on the theoretical initial time (t0) ......................................... 90
5-16 Effect of Calcium Hydroxide (CH) on ultimate expansion .................................... 92
5-17 Effect of temperature and alkalinity on sodium concentration ............................... 98
5-18 Effect of alkalinity on the aE of NMR ................................................................. 101
5-19 Alkalinity versus Activation Energy for the studied three aggregates ................. 102

ix
LIST OF TABLES Table Page
2-1 Forms of reactive silica in rocks that can participate in
Alkali-Aggregate Reaction ..................................................................................... 13
4-1 Outline of the initial Dilatometer test procedure .................................................... 45
4-2 Comparison based on aggregate activation energy and absolute
expansion between the laboratories ........................................................................ 49
4-3 Intra-laboratory comparisons based on Ea (TTI ...................................................... 58
4-4 Intra-laboratory comparisons based on Ea (UNH .................................................... 58
4-5 Inter-Laboratory comparisons of Ea (TTI versus UNH .......................................... 59
4-6 Statistical (Hypothesis test) results for both inter and intra-laboratory
comparison using PRG and SL aggregate .............................................................. 61
5-1 Experimental design factors and levels for aggregate testing ................................. 63
5-2 Physical layout of the test runs ............................................................................... 64
5-3 Physical properties of the studied aggregates ......................................................... 66
5-4 Physical and chemical properties of sodium hydroxide (pellet) ............................. 67
5-5 The characteristics ASR parameters of New Mexico Rhyolite .............................. 69
5-6 Spratt Limestone characteristics ............................................................................. 73
5-7 Platt River Gravel characteristics ............................................................................ 80
5-8 Sudbury Gravel characteristics ............................................................................... 81
5-9 Percentage increase of ultimate expansion and β as a function of alkalinity.......... 87
5-10 Percentage increase of ultimate expansion and Beta as a function
of temperature ......................................................................................................... 88
5-11 Percentage change of ultimate expansion and Beta as a
function of Ca(OH)2 ................................................................................................ 93
5-12 Test Solution Chemistry before and after the test ................................................... 94
5-13 Percentage reduction in (OH)- and Na
+ ions after the test ..................................... 97

x
ACKNOWLEDGMENTS
This project was conducted in cooperation with IPRF and the FAA. The authors wish to
express their appreciation of the personnel of the Federal Aviation Administration and the
Innovative Pavement Research Foundation for their support throughout this project, as well as
the Program Director, James Lafrenz and members of the Technical Panel. Special thanks to Dr.
Robert L. Lytton, Texas A&M University, for his guidance and valuable suggestions in model
developments. The authors would also like to thank Mr. Douglas R. Pac, University of New
Hampshire and Mrs. Ursula Nytko, University of Toronto for their leading role in conducting the
laboratory testing program.

xi
EXECUTIVE SUMMARY
Although concrete is widely considered a very durable material, it can be if conditions are such,
vulnerable to deterioration and early distress development. Alkali silica reaction (ASR) is a
major durability problem in concrete structures. It is a chemical reaction between the reactive
silica phase(s) in certain aggregates and alkali hydroxides in concrete pore solution. The product
of this reaction is a gel that is hygroscopic in nature. When the gel absorbs moisture, it swells
leading to tensile stresses in concrete. When those stresses exceed the tensile strength of
concrete, cracks occur.
Current testing methodology apply to only a narrow band of conditions making the risk
associated with the use of a new source of untested aggregate unacceptably high. Better tools are
needed to evaluate concrete materials for ASR that are both robust and useful in the prediction of
field performance of concrete subjected to ASR and the research reported herein is a step in that
direction. The main objective of this study is to address a method of testing concrete materials as
a combination to assist engineers to effectively mitigate ASR in concrete. A test protocol has
been developed in this study, which is described stepwise below:
Conducting a comprehensive study on different types of aggregates of different reactivity to
formulate a robust approach that takes into account the factors affecting ASR such as
temperature, moisture, and alkalinity and calcium concentrations.
Development of a test protocol to measure ASR expansion in aggregate–solution tests using
dilatometry as a function of temperature, alkalinity, calcium concentrations
Developing a kinetic model and determining ASR parameters (ultimate ASR expansion,
theoretical initial time of ASR expansion, the rate constant and the time scale parameter)
characteristics of measured expansion over time at different levels of alkalinity and
temperatures.
Derivation of compound activation energy (Ea) based on rate theory. Ea is considered as a
single fundamental material property to represent aggregate alkali silica reactivity. The
studied aggregates are categorized based on Ea. The higher the energy the lower is the
reactivity or vice versa.
By comparing Ea at different alkalinities, it was also found that the Ea decreases when
alkalinity increases. This observation indicates the presence of a relationship between these
two parameters. A mathematical relationship between Ea and alkalinity is established which
become the basis to determine Ea under field levels of alkalinity.
The above procedures address the chemical aspects of ASR and predict the aggregate ASR
potential matching with field levels of alkalinity and temperature and defined as aggregate
reactivity signature. Intra and inter-laboratory comparisons were conducted for the test procedure
validation. Results are very promising as the COV was less than 7 percent (intra-lab
comparison) and 10 percent (inter-lab comparison) indicating that the results are highly
repeatable and reliable. It can be concluded that the Ea can serve as an overall indicator of ASR
potential and can be used as a potential screening parameter for ASR under field conditions.
To address the physical aspects of ASR (e.g., degree of expansive pressure, level of
distress/crack formation etc.) under field conditions, an attempt was made to (i) conduct limited
xii
concrete testing in the laboratory using the same device and measures some characteristic
physical material properties (e.g., rate of expansion, ultimate expansion etc.) as a function of
aggregate reactivity, w/cm, SCMs replacement levels and others, and (ii) develop a concrete
reactivity signature, i.e., a relationship between measured concrete ASR material properties of
physical aspects (e.g., concrete ultimate expansion) and aggregate chemical material properties
(e.g., aggregate activation energy). A combined plot of both aggregate and concrete reactivity
signature then became the basis to assign total threshold alkalinity for a concrete mix to be ASR
resistant. However, further work on (i) refinement of the calibration procedure using field
exposed concrete, (ii) round robin concrete testing using a variety of coarse aggregates and
performance, are recommended in order to validate this combined approach.
It is expected that the knowledge gained through this work will eventually assist government
agencies, contractors and material engineers select the optimum mixture combinations that fits
best their needs or type of applications, and predict their effects on the concrete performance in
the field.
1
CHAPTER I
INTRODUCTION
1.1 GENERAL
Portland cement concrete is being used in almost every structure, ranging from
commercial buildings, bridges and pavements is considered a very important structural
material. Unfortunately, concrete like any other material is subjected to environmental
conditions that make it vulnerable to deterioration, potentially reducing significantly its
service life. As the cost of demolishing and reconstructing concrete structures
continually increase, concrete durability becomes a key issue among engineers, owners,
and government agencies.
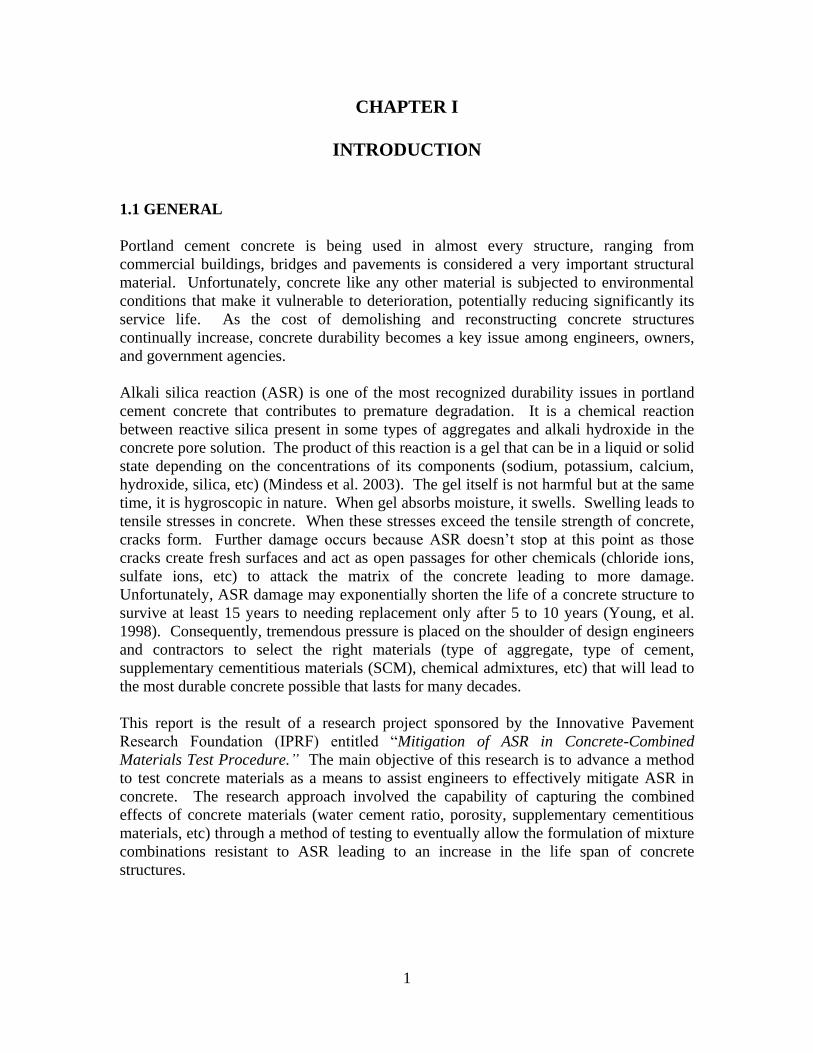
Alkali silica reaction (ASR) is one of the most recognized durability issues in portland
cement concrete that contributes to premature degradation. It is a chemical reaction
between reactive silica present in some types of aggregates and alkali hydroxide in the
concrete pore solution. The product of this reaction is a gel that can be in a liquid or solid
state depending on the concentrations of its components (sodium, potassium, calcium,
hydroxide, silica, etc) (Mindess et al. 2003). The gel itself is not harmful but at the same
time, it is hygroscopic in nature. When gel absorbs moisture, it swells. Swelling leads to
tensile stresses in concrete. When these stresses exceed the tensile strength of concrete,
cracks form. Further damage occurs because ASR doesn‘t stop at this point as those
cracks create fresh surfaces and act as open passages for other chemicals (chloride ions,
sulfate ions, etc) to attack the matrix of the concrete leading to more damage.
Unfortunately, ASR damage may exponentially shorten the life of a concrete structure to
survive at least 15 years to needing replacement only after 5 to 10 years (Young, et al.
1998). Consequently, tremendous pressure is placed on the shoulder of design engineers
and contractors to select the right materials (type of aggregate, type of cement,
supplementary cementitious materials (SCM), chemical admixtures, etc) that will lead to
the most durable concrete possible that lasts for many decades.
This report is the result of a research project sponsored by the Innovative Pavement
Research Foundation (IPRF) entitled ―Mitigation of ASR in Concrete-Combined
Materials Test Procedure.” The main objective of this research is to advance a method
to test concrete materials as a means to assist engineers to effectively mitigate ASR in
concrete. The research approach involved the capability of capturing the combined
effects of concrete materials (water cement ratio, porosity, supplementary cementitious
materials, etc) through a method of testing to eventually allow the formulation of mixture
combinations resistant to ASR leading to an increase in the life span of concrete
structures.

2
1.2 RESEARCH SIGNIFICANCE AND PROBLEM STATEMENT
As mentioned above, ASR is a major issue of worldwide interest. Consequently, many
researchers and agencies have invested significant amount of time and energy to develop
test procedures and approaches to mitigate this chemical reaction.
One technique was to use non-reactive aggregate removing a key component deemed
necessary to initiate the ASR reaction. This solution is perhaps ideal, as long as
non-reactive aggregate are available however, the majority of rocks contain some forms
of reactive silica in different forms and structure (Swamy 1992).
Another approach has been to use low alkali cement in concrete mixtures leading to a
decrease of ASR potential. However, this may not be achievable as alkali may come
from outside sources such as deicers used during winter seasons to remove ice formed at
the top of the pavement. A study conducted by Rangaraju et al. in 2007 indicated that the
use of low alkali cement in concrete specimens subjected to deicers only delays ASR
expansion and does not prevent it.
A third approach is the introduction of supplementary cementitious materials (SCM) like
fly ash, slag and silica fume in the mixtures to minimize the incidence of ASR. The
results are promising although it is mentioned in the literature that SCM‘s sometimes
contribute to the total amount of alkali in the concrete matrix. The addition of lithium
recently was seen as an important tool in mitigating ASR (Folliard et al. 2003).
Most of the available laboratory test methods are focused on aggregate reactivity. The
most common procedure is ASTM C 1260 ―Standard Test Method for Potential Alkali
Reactivity of Aggregates (Mortar-Bar Method).‖ However, results obtained from this
test have had little correlation to field performance. Most of the ASR research conducted
using ASTM C 1260 has involved some form of modification (i.e., increasing the testing
duration) in order to predict the behavior of the tested aggregate under field conditions.
The result of this method of testing often only provides a clue as whether the aggregate is
reactive or not.
An alternative to ASTM C 1260 is ASTM C1293 ―Standard Test Method for Concrete
Aggregate by Determination of Length Change of Concrete Due to Alkali-Silica
Reaction.‖ It is considered a good index of field performance however the duration of
the test extends to one year and this is considered a major drawback.
Clearly, these short comings warrant a different approach to ASR testing. Current testing
methodology apply to only a narrow band of conditions making the risk associated with
the use of a new source of untested aggregate unacceptably high. Better tools are needed
to evaluate concrete materials for ASR that are both robust and useful in the prediction of
field performance of concrete subjected to ASR and the research reported herein is a step
in that direction. The major outcome of this research is to provide an approach in which
to develop recommendations for ultimately using combined concrete materials while
keeping ASR in check.

3
1.3 OBJECTIVES
The ultimate objective of this study was to develop a method of testing to assist in the
mitigation of ASR. The intent was to develop a robust and reliable test protocol that can
be performed within a reasonably short period of time and have the capability of
capturing the effect of combined concrete materials on ASR potential. The proposed
protocol would assist pavement engineers, owners and government agencies to quantify
the potential for concrete degradation as a consequence of ASR. To this end, the
following steps are accomplished:
Development of a test protocol to measure ASR expansion using dilatometry.
Determining key parameters (e.g., rate constants, ultimate expansion etc.)
characteristics of measured expansion over time at different levels of alkalinity and
temperatures.
Derivation of compound activation energy based on rate theory. Compound
activation energy is considered as a single fundamental material property to represent
aggregate alkali silica reactivity.
Determining aggregate ASR activation energy under field levels of alkalinity.
Determination of an alkali threshold for design that will lead eventually to the
development of concrete mixtures resistant to ASR.
1.4 ORGANIZATION OF THE REPORT
This report consists of six chapters. Each chapter is briefly summarized below:
Chapter 1 is an introduction addressing a statement of the research followed by a
description of project objectives and report organization.
Chapter 2 presents a review of the available literature relevant to the study of ASR. The
first part describes reaction chemistry and essential conditions needed to initiate ASR
followed by a discussion on the current mechanisms of ASR expansion. The last part of
this chapter summarizes a complete review of the current test methods for assessing ASR.
Chapter 3 highlights the limitations of the current test methods and explains the need of a
kinetic type performance-based combined materials approach and applications. The
development of a performance based ASR test approach is presented through
(i) development of kinetic type model to calculate ASR activation energy (as a single
parameter to represent aggregate reactivity) from aggregate ASR expansion over time,
and (ii) establishing a relation between activation energy and alkalinity.
Chapter 4 describes the evolution of test equipment and protocol validation for a new
ASR testing methodology. The chapter provides a description of dilatometer equipment
and test procedure to measure ASR volume expansion over time. The different stages of
equipment and protocol validation are presented subsequently addressing (i) early

4
procedure of dilatometer testing, (ii) identification of sources of errors followed by
equipment, procedure, and model improvement, and (iii) validation of the revised system.
Determination of kinetic based aggregate ASR reactivity using the revised dilatometer
based test protocol is presented in Chapter 5. It includes (i) a description of the materials
and their properties, (ii) the experimental and testing program to measure ASR volume
expansion for all the selected aggregates as a function of time, temperature and alkalinity,
(iii) activation energy calculations, (iv) the effect of test conditions (e.g., alkalinity,
temperature and calcium) on the ultimate expansion, rate constant, and activation energy,
(v) analysis and interpretation of test solution chemistry, and finally, (vi) modeling the
relationship between activation energy and alkalinity and determining a threshold
alkalinity.
Finally, Chapter 6 presents the research findings from this project as conclusions and
potential recommendations for future research. Development of a combined materials
approach for ASR mitigation and investigating the role of Li-compounds and deicers on
ASR mechanisms are the main proposed items for future research. TTI has already
explored an approach of combined materials test procedure based on both aggregate and
limited concrete testing and a new model, which is presented in a form of an Appendix.
5
CHAPTER II
LITERATURE REVIEW
This chapter provides in four parts a comprehensive literature review of alkali silica
reaction (ASR) in concrete. The first part defines and introduces the nature of ASR in
concrete and the primary factors needed for the ASR chemical reaction to initiate and
spread. The second part deals specifically with the chemistry of the alkali ASR and
current theories of ASR expansion. The third part provides a comprehensive review of
the current test methods for assessing ASR along with some discussions on usefulness
and limitations of these test methods in assessing ASR potential under field conditions.
2.1 INTRODUCTION
In California, late 1930‘s, it was observed that relatively new concrete structures began
developing severe cracking, although these new structures met the standard of
construction at that time. It was Stanton in 1940 that established the existence of the
alkali-silica-reaction as an internal deleterious process within the structure of concrete.
Since ASR-related problems were first identified in the early 1940s, research studies
progressed rapidly in different directions including (i) better understanding of the
mechanisms of ASR leading to the development of test methods to assess the potential
alkali-reactivity of aggregates, (ii) development of specifications for preventing ASR in
new concrete, and (iii) management guidelines for existing ASR-induced damaged
concrete structures.
Alkali silica reaction (ASR) is a chemical reaction between alkali hydroxides in pore
solution and the reactive form of silica in aggregates. The product of this reaction is a gel
known as ―ASR gel.‖ However, this gel has a tendency to absorb moisture and swell,
causing internal stresses within the concrete. These swelling pressures depend on many
factors: availability of sufficient moisture, gel composition, temperature, type and
composition of reacting materials. With further absorption of moisture, these pressures
increase and become high enough to induce the development of microcracks in the
concrete and eventually leading to its failure. A schematic drawing of ASR is shown in
Figure 2-1

6
Figure 2-1 Schematic of alkali silica reaction (modified from Thomas, et al. 2007).

7
Typical visual manifestation of ASR includes map-cracking (Figure 2-2), misalignment
of structural elements (Figure 2-3), and expansive features such as joint closure and
heaving / blows up etc (Figure 2-4).
Figure 2-2 Map cracking, portion of an airfield concrete pavement (Sarkar, Zollinger, and
Mukhopadhyay, 2004).
Figure 2-3 Misalignment of adjacent sections of a parapet wall on a highway bridge due
to ASR (Strategic Highway Research Program (SHRP)-315, 1991).

8
Figure 2-4 Heaving in an airfield pavement (Sarkar, Zollinger, and
Mukhopadhyay, 2004).
2.2 PRIMARY FACTORS INFLUENCING ALKALI-SILICA REACTION (ASR)
The mechanisms governing ASR and expansion are quite complex. It is widely accepted
that three essential conditions necessary for ASR-induced damage in concrete structures
(Figure 2-5) are (i) sufficient availability of OH- ions and alkalis (Na and/or K),
(ii) reactive form of silica or silicate in the aggregates, and (iii) sufficient moisture
(> 80% RH). The optimum combination of conditions (i) and (ii) is essential to initiate
ASR whereas condition (iii) is essential to make ASR expansive (i.e., deleterious).
2.2.1 Sufficient Alkalis
In chemistry, an alkali is a basic, ionic salt of an alkali metal or alkaline earth metal
element. In the Periodic Table (Figure 2-6), the alkalis are represented by the second to
the seventh elements in group I and II. Alkalis are known for being bases when dissolved
in water and their pH values are above 7. The alkali compounds (e.g., alkali salts) easily
dissolve in water and produce alkali hydroxides: lithium hydroxide, sodium hydroxide,
potassium hydroxide and so on.
Concrete consists of innumerable pores that are filled with solution containing alkalis
(Na+, K
+, and Ca
2+) and hydroxyl (OH
-) ions. The concentration of OH
-, Na
+, and K
+ in a
matured cement paste (w/cm = 0.5, Type I cement with 0.91% Na2Oe) were reported as
0.8 N, 0.2 N, and 0.4 N respectively with negligible concentration of
Ca2+
(Diamond 1983).

9
Figure 2-5 Three essential factors for ASR-induced damage in concrete.
Figure 2-6 The Periodic Table showing the position of alkalis (McCutchen‘s web site).
ASR
Damage
Reactive Minerals
Amorphous silica
Cryptocrystalline quartz
Strained quartz
Tridymite
Crisobalite
Opal
Volcanic glass
Sufficient Alkalies
Portland cement
SCMs
Aggregate
Chemical admixtures
External sources
(seawater & de-icing
salt)
Sufficient Moisture
RH > 80%
External sources
Sufficient
Moisture
Sufficient
Alkalies
Reactive
Silica
Temperature

10
The alkalinity (i.e., hydroxyl ion concentration) of the pore solution is primarily
influenced by the sodium and potassium contributions from the cement used in the
concrete mixture. Alkalis primarily present in cement clinker as alkali-sulfates (which
release alkalis immediately in pore solution) with minor bounded alkalis in the crystal
structure of hydrated cement phases (release alkalis slowly in pore solution). Other
sources, such as supplementary cementitious materials (SCMs), certain aggregates,
chemical admixtures (e.g., superplasticizers), seawater, and de-icing chemicals can also
contribute additional alkalis other than cement alkalis and enhance the pH of the pore
solution.
The total alkali content of concrete must be determined as a summation of all the alkalis
contributed from all possible sources:
concreteAlkalis = ([ ] [ ] [ ] [ ] )
SCMs aggregates external sourcescementa a a a (2-1)
where,
concreteAlkalis = alkali content of concrete (e.g., kg/m
3)
[ ]cement
a = [% Na2Oequivalent of cement) × cement content] / 100
[ ]SCMs
a = [%Na2Oequivalent of SCMs × SCMs content / 100]
[ ]aggregate
a = [ ]fine aggregate
a + [ ]coarse aggregate
a
[ ]external sources
a = [ ]seawater
a + [ ]de icing salts
a + [ ]sulphate bearing groundwater
a , and
[ ]a = amount alkalis.
The % Na2Oequivalent value is calculated by using the following equation:
Na2Oequivalent = Na2O + 0.658K2O (2-2)
where, Na2Oequivalent is the total sodium oxide equivalent in percent by weight of cement;
Na2O is the sodium oxide content in percent; K2O is the potassium oxide content in
percent; and 0.658 is the weight ratio of Na2O to K2O.
According to the ASTM C 150, cement having a Na2Oe of less than 0.6 percent is
generally considered as low-alkali cement. However, it is reported that even this value
may be high when used with reactive aggregate. Although a combination of low alkali
cement (≤ 0.6 percent) and a potentially reactive aggregate is considered to be safe (i.e.,
no deleterious expansion due to ASR), it should be noted that the approach of using low
alkali cement does not necessarily prevent ASR-induced damage because this value
doesn‘t consider the contribution of alkali from other sources. Therefore, the focus
should rather be to control the total amount of alkali in concrete mixtures. Many
agencies and countries specified that total permissible alkali to be between 2.5 and
4.5 kg/m3. They also stated that the previous boundaries are not rigid but depends on the
aggregate reactivity (Nixon and Sims (1992)). A value of 3.0 kg/m3 was reported as
threshold Na2Oequivalent based on a relationship between the alkali content in concrete and
the percent expansion at 2 years (Figure 2-7). However, others have reported continuing

11
expansion even with the total alkali content less than 3 kg/m3 (Swamy 1992). It is
interesting to notice that the curve (Figure 2-7) follows an S-shape pattern.
In general, SCMs such as fly ash, ground granulated blastfurnace slag (GGBS), and
condensed silica fume are all used to reduce abnormal expansion caused by ASR. The
mechanisms are not well understood, but it is agreed that the reactive silica in SCMs
combines with the cement alkalis (that is, NaOH and KOH) more readily through
pozzolanic reaction than the siliceous phase(s) in aggregate. Therefore, alkalis are
rapidly consumed and the level of hydroxyl ions is reduced to a level at which aggregates
react very slowly or not at all (Carrasquillo and Farbiaz 1988; Diamond and Penko 1992).
Furthermore, the pozzolanic reaction results in the formation of alkali-calcium-
silicate-hydrates which is non-expansive, unlike the water absorbing expansive gels
produced by ASR. However, not all SCMs increase ASR resistance. Some SCMs can be
a source of additional alkalis. Diamond (1981) reported that Class F fly ash is more
effective in controlling ASR than Class C fly ash. Shehata et al. (2000) and Shon et al.
(2003; 2004) supported that Class C fly ashes are less effective than Class F fly ashes in
controlling ASR because some Class C fly ashes (those with Na2Oequivalent greater than the
cement) actually enhance alkali ions (e.g., Na+, K
+) and OH
- in pore solution.
Figure 2-7 Effects of alkali content on expansion of prisms stored over water at 38°C
(Folliard et al. 2007).
Some aggregates themselves may be a potential source of alkalis. For example,
sea-dredged aggregates would be obvious source of sodium chloride. Poulsen et al.
(2000) reported potential problems with release of alkalis from feldspar in feldspar
containing aggregates (e.g., weathered granite and other feldspathic igneous rocks).
Stark and Bhatty (1986) and Thomas et al. (1992) reported that certain aggregates can
release alkalis equivalent to 10 percent of the portland cement content under extreme
conditions, thereby increasing the alkali content of the mixture. Furthermore, when
12
recycled concrete coarse aggregates (RCA) are used, the alkali contribution from the
adhered cement mortar fractions with the RCAs needs to be considered in estimating the
total alkalis in concrete. Typically, alkalis are slowly released when the aggregate‘s
lattice structure begins to break down during ASR. These alkalis later provide an
additional source for further ASR expansion.
Nixon et al. (1987) and Hobbs (1988) described a variety of external sources for alkalis
introduced into concrete. Sources of external alkalis include road de-icing salts, seawater,
and industrial alkalis.
2.2.2 Reactive Silica
Many of the coarse and fine aggregates used in concrete mixtures consist of siliceous
phases, i.e., different forms of silica mineral. For example, quartz and chalcedony are
crystalline forms of silica while opal is an amorphous form of silica mineral.
Nonetheless, not all forms of silica are ASR reactive. For example, well-crystallized
quartz is not considered susceptible to ASR whereas opal is very reactive. The basic
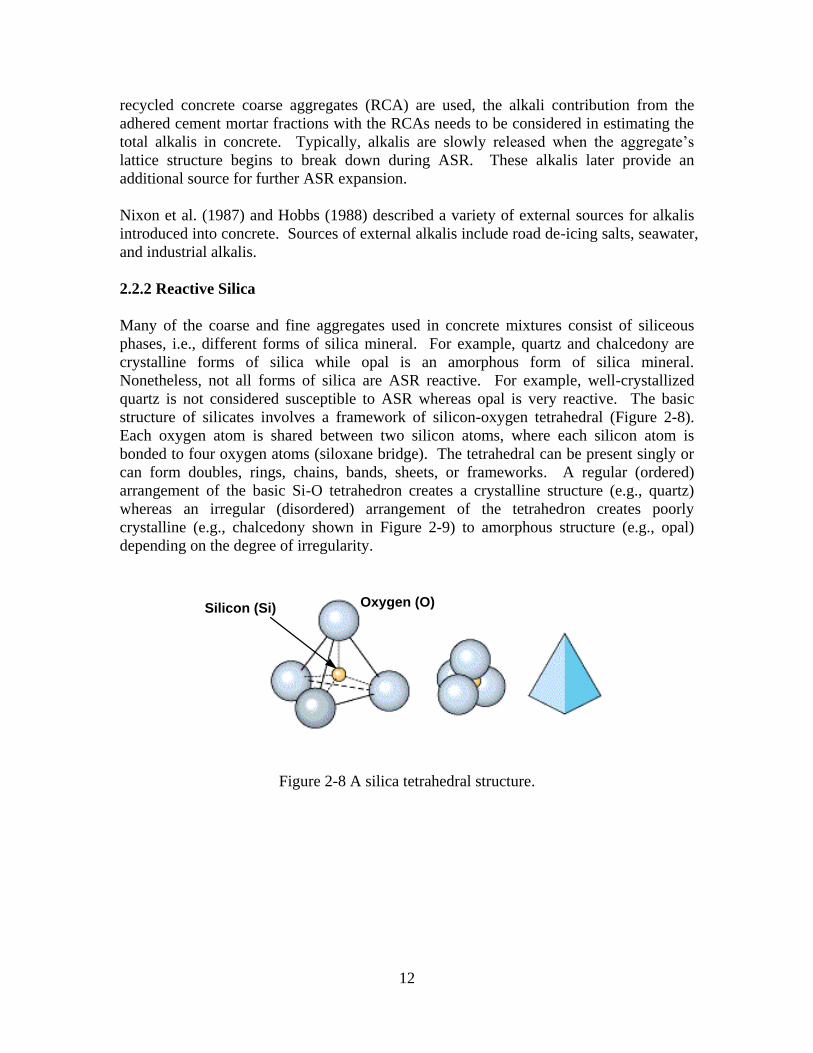
structure of silicates involves a framework of silicon-oxygen tetrahedral (Figure 2-8).
Each oxygen atom is shared between two silicon atoms, where each silicon atom is
bonded to four oxygen atoms (siloxane bridge). The tetrahedral can be present singly or
can form doubles, rings, chains, bands, sheets, or frameworks. A regular (ordered)
arrangement of the basic Si-O tetrahedron creates a crystalline structure (e.g., quartz)
whereas an irregular (disordered) arrangement of the tetrahedron creates poorly
crystalline (e.g., chalcedony shown in Figure 2-9) to amorphous structure (e.g., opal)
depending on the degree of irregularity.
Figure 2-8 A silica tetrahedral structure.
Oxygen (O)Silicon (Si)

13
Figure 2-9 Photomicrograph of a chalcedony (cryptocrystalline form of silica) aggregate
in concrete. Note the characteristic acicular crystals of chalcedony shown by the arrow.
With parameters such as alkali content and moisture content being constant, the degree of
reactivity of siliceous aggregates mainly depends on the degree of the disordered crystal
structures, grain size of the reactive particle, and the proportion of these reactive phases
within the reactive aggregate. The more disordered the structure the greater the surface
area available for reaction. Amorphous, crypto-crystalline, and microcrystalline silica
structures are particularly susceptible to ASR (Table 2-1). Diamond (1976), Tatematsu
and Sasaki (1989), and Mehta and Monteiro (1992) have designated the degree of
reactivity of these reactive forms of silica with decreasing order as follows: opal,
crystobalite, tridymite, microcrystalline quartz, cryptocrystalline quartz, chalcedony,
chert, volcanic glass, and strained quartz. Quartz is practically non-reactive but strained
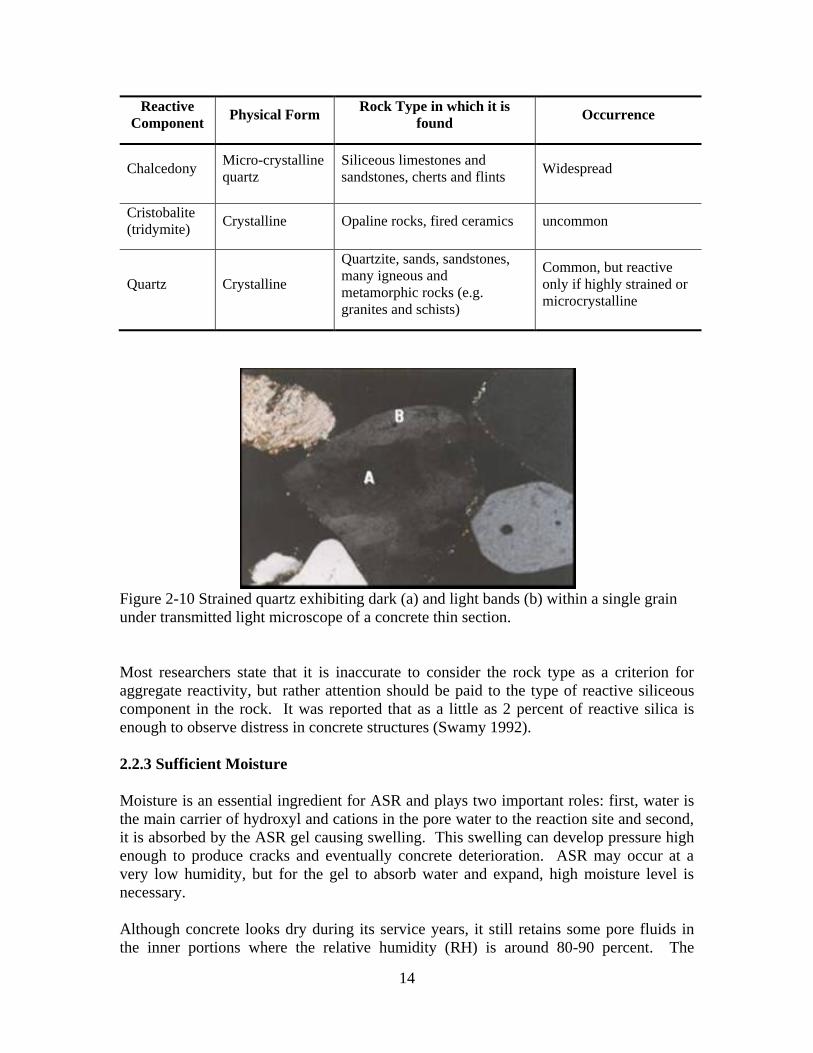
quartz is reactive. Quartz exhibiting undulatory extinction is considered as criterion to
identify stained quartz in aggregate (Figure 2-10).
Table 2-1 Forms of reactive silica in rocks that can participate in Alkali-Aggregate
Reaction (Mindess et al. 2003).
Reactive
Component Physical Form
Rock Type in which it is
found Occurrence
Opal Amorphous Opaline limestone (e.g., Spratt
limestone), chert, shale, flint
Common as a minor
constituent in
sedimentary rocks
Silicate glass Amorphous Volcanic glasses (rhyolite,
andesite, dacite) and tuffs;
synthetic glasses
Regions of volcanic
origin; river gravels
originating in volcanic
areas; container glass
14
Reactive
Component Physical Form
Rock Type in which it is
found Occurrence
Chalcedony Micro-crystalline
quartz Siliceous limestones and
sandstones, cherts and flints Widespread
Cristobalite
(tridymite) Crystalline Opaline rocks, fired ceramics uncommon
Quartz Crystalline
Quartzite, sands, sandstones,
many igneous and
metamorphic rocks (e.g.
granites and schists)
Common, but reactive
only if highly strained or
microcrystalline
Figure 2-10 Strained quartz exhibiting dark (a) and light bands (b) within a single grain
under transmitted light microscope of a concrete thin section.
Most researchers state that it is inaccurate to consider the rock type as a criterion for
aggregate reactivity, but rather attention should be paid to the type of reactive siliceous
component in the rock. It was reported that as a little as 2 percent of reactive silica is
enough to observe distress in concrete structures (Swamy 1992).
2.2.3 Sufficient Moisture
Moisture is an essential ingredient for ASR and plays two important roles: first, water is
the main carrier of hydroxyl and cations in the pore water to the reaction site and second,
it is absorbed by the ASR gel causing swelling. This swelling can develop pressure high
enough to produce cracks and eventually concrete deterioration. ASR may occur at a
very low humidity, but for the gel to absorb water and expand, high moisture level is
necessary.
Although concrete looks dry during its service years, it still retains some pore fluids in
the inner portions where the relative humidity (RH) is around 80-90 percent. The

15
importance of moisture on expansion is graphically presented in Figure 2-11. As it can
be seen from the plot, concrete made with four different types of aggregates displayed
very small expansion at a relative humidity less than 80 percent. When RH increases
above 80 percent, expansion increases exponentially, emphasizing the enormous effect of
RH on expansion.
Some of the possible ways to reduce the moisture level below 80 percent in concrete are
(i) reducing the exposure of concrete structures to moisture, or (ii) use of low
permeability concrete. Improving drainage conditions may also be an effective measure
to reduce moisture levels. A higher water to cement ratio (w/c) of concrete could lead to
higher expansion in ASR due to (i) higher porosity/permeability causing higher ionic
mobility and more reaction, and (ii) greater availability of free (capillary) water to make
the gel more expansive.
Figure 2-11 Effects of relative humidity on expansion using the ASTM C 1293
(Pedneault 1996).
2.2.4 Environmental Effects
The major environmental effects on ASR are (i) variation of moisture content and
temperature and re-distribution of alkalis inside concrete due to seasonal climatic
variations, and (ii) penetration of soluble salts (e.g., deicers) into concrete which can
enhance the pH of the pore solution. The interaction between such environmental effects
and ASR is not well understood. Wetting and drying cycles can enhance the ASR in the
following way:
Drying concentrates alkali hydroxides in pore solutions and increases pore
solution pH.
-0.1
0.0
0.1
0.2
0.3
0.4
0.5
0.6
70 80 90 100
Relative Humidity (%)
Ex
pan
sio
n a
t 2
Years
(%
)
Siliceous Limestone
Potsdam Sandstone
Spratt Limestone
Rhyolitic Tuff
CSA Limit

16
Higher concentration of alkalis occurs locally even with low alkali cement.
Rewetting dilutes the solutions, but create favorable situation for swelling of gels.
It is reported that concrete slabs submitted to outdoor conditions (e.g., natural wetting and
drying cycles and heating and cooling cycles) present more expansion than the laboratory
samples maintained under constant humidity and temperature conditions. Research data
show that RH values higher than 80 percent are able to sustain expansive ASR in most of
the pavement below the top surface layer, even in the summer in a hot desert climate
(SHRP-C-342, 1993). Data also show that humidity conditions are sufficiently moist to
support expansive ASR in much of the concrete in pavements and structures for at least
part of each year in most of the continental United States.
Many experiments have established that higher temperature accelerates the reaction
although the ultimate expansion is not necessarily greater in the long term. Hobbs (1992)
found that the reaction occurred seven times faster for specimens stored at 38°C than for
those stored externally at an average temperature of 9°C. The rate was four times faster
than for samples stored at 20°C. The reaction generally tends to mature and cease in
about twenty years but longer periods may be expected in colder climates and shorter in
hot climate.
2.3 CHEMISTRY OF ALKALI-SILICA REACTION
The previous section covered the primary factors responsible for creating ASR i.e.,
reactive silica, (b) sufficient alkali and (c) sufficient moisture. This section will cover in
detail the reaction mechanisms of ASR (dissolution of silica, formation of gel etc.) and
the current proposed mechanisms of expansion.
It is worth mentioning that alkali silica reaction is not a reaction between the alkalis (i.e.,
sodium, potassium and calcium) and the reactive siliceous component(s) in certain
aggregates. The fact is that the main reaction is between the hydroxyl (OH-) ions present
in pore solution and reactive siliceous component(s) in aggregates. The alkali metal
cations are important because their presence in high concentration leads to an equally
high concentration of hydroxyl to maintain equilibrium in the pore solution. The role of
alkali becomes relevant when they are incorporated into the gel.
Mass transport is also a prominent aspect of ASR with respect to the concentration of the
hydroxyl (OH-) ions. Studies have shown that aggregates containing reactive siliceous
phase(s) are considered within the concrete environment to be ―thermodynamically
unstable‖ (Swamy 1992). When ASR begins, the free energy of the system decreases
which may be accompanied by transport of alkali and hydroxyl ions via the water
comprising the fluid in the pores of the concrete which maybe in direct contact with
aggregates and any alkali-bearing components combined in the products of hydration
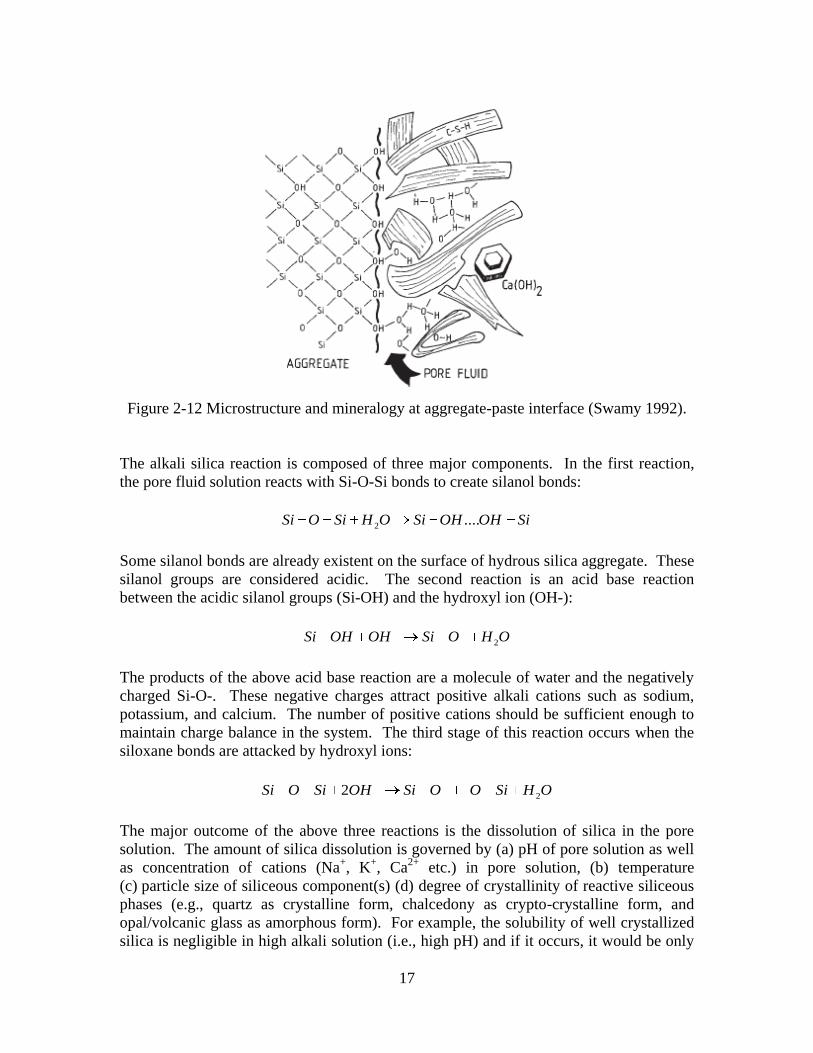
(Figure 2-12). Figure 2-12 displays that the pore volume (i.e., meso- and micro-pores) in
cement paste near aggregate-paste interface is partially filled by pore fluid.
17
Figure 2-12 Microstructure and mineralogy at aggregate-paste interface (Swamy 1992).
The alkali silica reaction is composed of three major components. In the first reaction,
the pore fluid solution reacts with Si-O-Si bonds to create silanol bonds:
2....Si O Si H O Si OH OH Si
Some silanol bonds are already existent on the surface of hydrous silica aggregate. These
silanol groups are considered acidic. The second reaction is an acid base reaction
between the acidic silanol groups (Si-OH) and the hydroxyl ion (OH-):
2Si OH OH Si O H O
The products of the above acid base reaction are a molecule of water and the negatively
charged Si-O-. These negative charges attract positive alkali cations such as sodium,
potassium, and calcium. The number of positive cations should be sufficient enough to
maintain charge balance in the system. The third stage of this reaction occurs when the
siloxane bonds are attacked by hydroxyl ions:
22Si O Si OH Si O O Si H O
The major outcome of the above three reactions is the dissolution of silica in the pore
solution. The amount of silica dissolution is governed by (a) pH of pore solution as well
as concentration of cations (Na+, K
+, Ca
2+ etc.) in pore solution, (b) temperature
(c) particle size of siliceous component(s) (d) degree of crystallinity of reactive siliceous
phases (e.g., quartz as crystalline form, chalcedony as crypto-crystalline form, and
opal/volcanic glass as amorphous form). For example, the solubility of well crystallized
silica is negligible in high alkali solution (i.e., high pH) and if it occurs, it would be only

18
at the surface of the aggregate while the solubility of amorphous silica increases
exponentially with pH (Figure 2-13).
Figure 2-13 Effects of pH on dissolution of amorphous silica (Tang and Su-Fen, 1980).
As the Si O are generated and to achieve balance, these negative charges begin
attracting positive alkali cations such as sodium, potassium, etc to form ASR gel. The
entire ASR chemical reaction was summarized by Dent-Glasser and Kataoka (1981) as:
0.38 2.19 2 0.38 2.19 20.38 0.38H SiO Na O Na SiO H O
As shown in the above equation, sodium was involved to achieve charge balance, but in
reality other cations (e.g., K+, Ca
2+) also participate in charge balancing. The product of
the above reaction is called ASR gel and composed of SiO2, Na2O, K2O, CaO, and water.
According to many researchers, ASR may take the form of either a gel or poorly
crystalline material (Stewart 2005). The ASR product by itself is not deleterious,
however the problem occurs when this gel absorbs water, resulting in greater volume than
the one that it replaces, creating high swelling pressure and expansion. Studies have
shown these gels maintained quasi-state equilibrium with water. During drying cycles,
the alkali concentration increases and therefore the ionic content of the gel increases. On
the other side, during wetter cycles, the reverse reaction happens. Since these gels have
different chemical composition and different densities at different periodic cycles, the
amount of swelling is extremely difficult to predict (Swamy 1992).
0
10
20
30
40
50
60
70
8 9 10 11 12 13
pH
Dis
solv
ed
Sil
ica (
mM
/L)
.
0
10
20
30
40
50
60
70
8 9 10 11 12 13
pH
Dis
solv
ed
Sil
ica (
mM
/L)
.
19
2.4 CURRENT MECHANISMS OF EXPANSION
The main chemical reactions that govern ASR are well accepted and understood by the
majority of researchers. However, the mechanism of expansion is a point of controversy.
The five most common and circulated theories in the literature regarding the mechanism
of expansion are subsequently described.
2.4.1 Hansen Theory
Hansen (1944) proposed that the cracking that occurred in the concrete was due to the
formation of an osmotic pressure cell surrounding the aggregate. In this theory, hardened
cement paste act as a semi-permeable membrane on silicate ions passage. The membrane
allows water molecules and alkali hydroxides to ―diffuse in,‖ but prevents silicate ions to
―diffuse out.‖ The alkali-silicate that formed on the surface on an aggregate surface
would draw solution from the cement paste to form a liquid-filled pocket. The liquid that
was drawn in would then exert an osmotic pressure against the confining cement paste
leading to cracking.
2.4.2 McGowan and Vivian Theory
McGowan and Vivian (1952) challenged Hanson‘s theory of expansion mechanism on
the basis that cracking in concrete should relieve the osmotic pressure and prevent any
further expansion. Instead, they proposed the ―Swelling theory‖ in which alkali silica gel,
product of reacted aggregates‖ absorb water, leading to swelling in the gel which causes
expansive pressure and eventually cracking. Tang (1981) also mentioned that he is in
agreement with the above theory.
2.4.3 Powers and Steinour Theory
Powers and Steinour (1955) believed that the theories proposed by both Hansen and
McGowan and Vivian were fundamentally similar. They thought that the primary
damage mechanism was swelling of the solid reaction product as controlled by the
amount of lime it contained, but that osmotic pressure might also develop. Their theories
for both mechanisms are explained below.
When a silica particle is exposed to a strong base, the hydroxyl ions attack the surface
and gradually penetrate the particle. If the attack occurs in the presence of excess lime,
then a non-swelling lime-alkali-silica complex is formed when chemical equilibrium with
the lime is reached. However, if the alkali-silica complex is not in equilibrium with the
lime, then swelling will occur. When the alkali-silica complex imbibes water, they felt
the swelling is due to displacement of colloidal units with respect to one another. One
cause of insufficient lime is that lime is depressed by alkalis in the solution so not enough
lime may be available at the reaction site to form the non-expansive gel. Another cause
is that the lime-alkali-silica complex can hinder the diffusion of the calcium ion to the
reaction site while allowing the other ions to diffuse to form additional gel that can swell.

20
This also explains the persistence of the swelling gel long after its formation even though
lime is present in the concrete.
For the osmotic pressure to buildup, they explained that water within concrete would tend
to move to regions where it has the lowest free energy. The water held by the
alkali-silica complex has lower free energy than water external to the complex. As the
strength of the solution within the alkali-silica complex increases, greater osmotic
pressure is required to prevent the entry of additional water into the complex. If the
alkali-silica complex is fluid and confined, then osmotic pressure may be generated. If
the alkali-silica complex is solid, pressure may still be generated by the swelling of the
reaction rim.
2.4.4 Chatterjee Theory
The mechanism of ASR expansion proposed by Chatterji et al. (1979, 1986, 1988, 1989,
1989b) is summarized as follows:
Step 1: When placed in a solution with a pH of 7 or greater, hydroxyl ions
penetrate reactive siliceous particles, in amounts increasing with solution pH and
ionic strength. At a constant solution pH and ionic strength, the absorption of
OH- decreases with the increasing size of the associated hydrated cation (OH
-
absorption decreases in the series K+, Na
+, Li
+, Ca
2+).
Step 2: In a pore solution with mixed ionic species (e.g. Ca(OH)2 and NaCl), the
cations will penetrate into the reactive silica grain following the penetrating OH-
ions, however, more of the smaller hydrated cations will do so than the larger
ones (in this example, hydrated Na+).
Step 3: Penetrating OH- ions attack siloxane bonds according the following
equation:
Si–O–Si + OH- = Si–OH + Si–O
-
The reactive silica grain is further opened up to attack by this reaction. Silica ions
are liberated from their original sites enabling them to diffuse out of the reactive
grains.
Step 4: The rate of silica diffusing out of reacting grains is controlled by Ca2+
in
the immediate vicinity. A higher Ca2+
ion concentration lowers or impedes silica
diffusion away from the reactive grains.
Step 5: When the net amount of materials (Na+, K
+, Ca
2+, OH
-, and H2O) entering
a reactive silica grain exceeds the amount of materials leaving (SiO22-
), expansion
occurs.
Chatterji‘s theory draws upon diffuse double layer (DDL) phenomena to explain ionic
mass transport, and the effect of ion-ion interactions on ionic diffusion.

21
2.4.5 Diffuse Double Layer (DDL) Theory
In 1999, a third theory was proposed citing electrostatic repulsion between DDLs as
responsible for generating expansive forces (Prezzi 1997; Rodrigues et al. 1999). Very
high negative charges are observed at the surface of the silica grains (Bolt 1957;
Rodrigues et al. 1999). To counterbalance the negative silica charges, an electric double
layer of positive charges (cations) develop and adsorb around the silica surface. Two
layers defined as the Gouy-Chapman layer or the Stern layer has a collective thickness of
a few nanometers that can be calculated from the ionic strength of the pore solution
electrolyte. The double layers are composed of calcium, potassium and sodium and some
other anions, but the net charge of the whole system (sum of negative charges of silica +
anions + sum of all cations) is equal to zero. This system will form a colloidal
suspension and then conglomerate into a gel (Prezzi 1997). The chemistry of this gel
depends on the chemistry of the pore solution, pore structure in the concrete and
environmental condition.
The amount of repulsive forces and the thickness of the electric double layer depend on
the valence of the cations in the gel and their concentration in the double layer (Prezzi
1997; Rodrigues et al. 2001). Consequently, bivalent ions (Ca++
) will generate more
repulsive forces and a larger electric double layer thickness than monovalent ions (Na+).
Therefore gels with high concentration of calcium will produce lower expansive forces
than those containing high amount of sodium and vice versa (Rodrigues et al. 1999).
Diamond (1989) indicated that the expansive pressures because of gel swelling are in the
range 6-7 MPa, but expansive pressure of 10.3 MPa was calculated using conventional
double layer equations (Rodrigues et al. 1999).
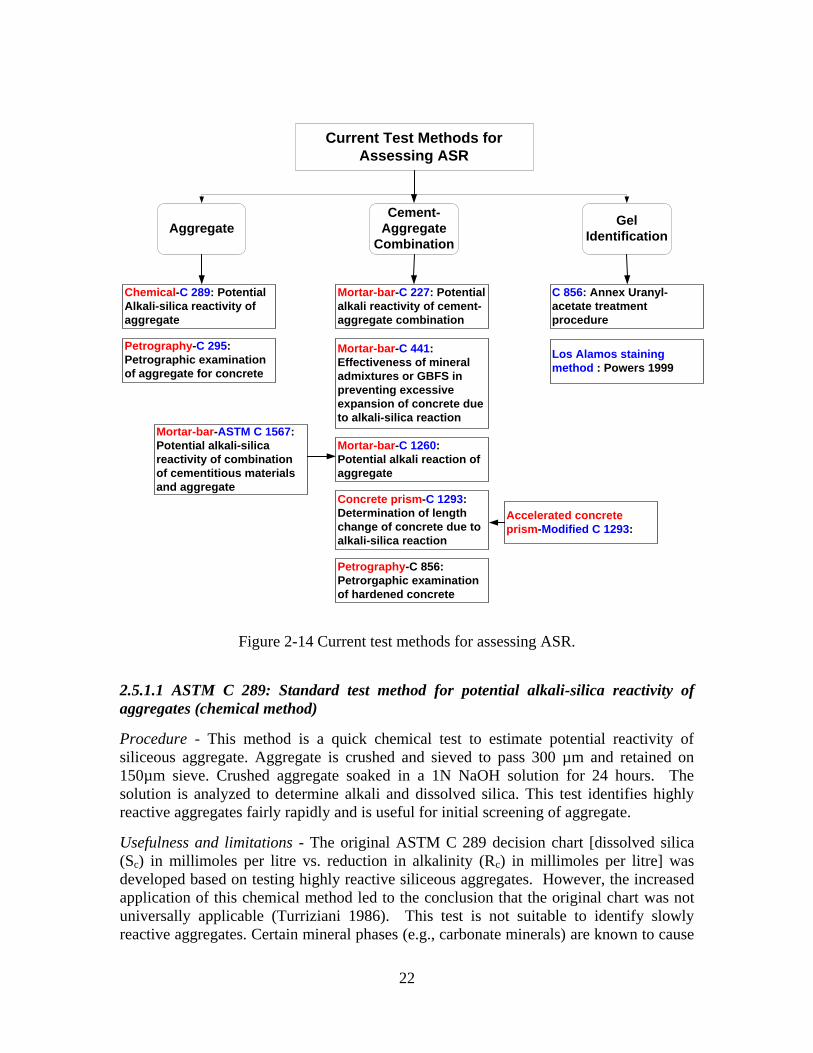
2.5 CURRENT TEST METHODS FOR ASSESSING ASR
The following discussion provides an overview of the main laboratory test methods that
are currently used to evaluate alkali silica reactivity of aggregates. Since many
aggregates are by nature heterogeneous, laboratory test methods of aggregate and/or
cement aggregate-combinations are the only possible ways to measure aggregate
reactivity prior to their use in concrete structures. Figure 2-14 shows several of the most
commonly used standard test methods to assess ASR. Basically, current test methods are
classified into three categories: aggregate testing, cement-aggregate combination testing,
and gel identification testing. For each test, a brief description of the procedure along
with its usefulness and limitations are summarized as follows.
2.5.1 Aggregate Testing
The commonly used standard methods as well as other promising methods of aggregate
testing are summarized below.
22
Figure 2-14 Current test methods for assessing ASR.
2.5.1.1 ASTM C 289: Standard test method for potential alkali-silica reactivity of
aggregates (chemical method)
Procedure - This method is a quick chemical test to estimate potential reactivity of
siliceous aggregate. Aggregate is crushed and sieved to pass 300 µm and retained on
150µm sieve. Crushed aggregate soaked in a 1N NaOH solution for 24 hours. The
solution is analyzed to determine alkali and dissolved silica. This test identifies highly
reactive aggregates fairly rapidly and is useful for initial screening of aggregate.
Usefulness and limitations - The original ASTM C 289 decision chart [dissolved silica
(Sc) in millimoles per litre vs. reduction in alkalinity (Rc) in millimoles per litre] was
developed based on testing highly reactive siliceous aggregates. However, the increased
application of this chemical method led to the conclusion that the original chart was not
universally applicable (Turriziani 1986). This test is not suitable to identify slowly
reactive aggregates. Certain mineral phases (e.g., carbonate minerals) are known to cause
Current Test Methods for
Assessing ASR
AggregateGel
Identification
Chemical-C 289: Potential
Alkali-silica reactivity of
aggregate
Cement-
Aggregate
Combination
Petrography-C 295:
Petrographic examination
of aggregate for concrete
Petrography-C 856:
Petrorgaphic examination
of hardened concrete
Mortar-bar-C 227: Potential
alkali reactivity of cement-
aggregate combination
Mortar-bar-C 441:
Effectiveness of mineral
admixtures or GBFS in
preventing excessive
expansion of concrete due
to alkali-silica reaction
Mortar-bar-C 1260:
Potential alkali reaction of
aggregate
Concrete prism-C 1293:
Determination of length
change of concrete due to
alkali-silica reaction
Accelerated concrete
prism-Modified C 1293:
C 856: Annex Uranyl-
acetate treatment
procedure
Los Alamos staining
method : Powers 1999
Mortar-bar-ASTM C 1567:
Potential alkali-silica
reactivity of combination
of cementitious materials
and aggregate
23
interference, which underestimates the amount of dissolved silica. This may leads to a
false diagnosis of aggregate reactivity, i.e., a reactive aggregate may pass by this test. As
a result, this test can‘t be used to test carbonate rocks containing siliceous impurity.
Furthermore, crushing and sieving of the aggregate can sometimes cause removal of
reactive constituents as well as alteration of aggregate reactivity. Certain aggregates may
produce a high amount of soluble silica in this test but do not necessarily produce
expansion in service. However, Vivian (1981) suggested that aggregate producing
dissolved silica in excess of 100 millimoles per litre according to ASTM C 289 test
method should produce sufficient quantity of reaction products that can cause expansion
in concrete. Olafsson and Thaulow (1983) also found this value useful for predicting
potential alkali reactivity of some Scandinavian sands. Brandt and Oberholster (1983)
suggested that increasing the test duration from three to seven days gives more
representative values. Therefore, evaluation of aggregate reactivity by this test method
needs additional information such as petrography and chemical composition of
aggregates being tested.
2.5.1.2 ASTM C 295: Standard guide for petrographic examination of aggregates for
concrete
Procedure - This method is a comparatively quick way to predict aggregate reactivity
based on microscopic examination of aggregate samples. The siliceous phases (both
reactive and non-reactive constituents) in aggregate are identified based on characteristics
optical properties under optical microscope. Aggregate reactivity is then determined
based on identified siliceous phases. This method is used as a screening method for
aggregates.
Usefulness and limitations - The Petrographic techniques (ASTM C 295) identify the
possible reactive constituents in a given aggregate source. Correlating petrographic
analysis of aggregate with service record in concrete can derive useful information.
However, there is no guarantee whether an aggregate identified as reactive by this test
method can actually cause deleterious expansion in concrete. Other important
characteristics of the aggregates such as particle size distribution, porosity, amount of
reactive minerals along with sufficient alkali concentration, and environmental effects
play significant role in manifesting deleterious expansion for an aggregate.
2.5.1.3 Other Promising Aggregate Testing Methods
Strunge and Chatterji (1991) used a chemical method to detect alkali-silica reactivity of
sand. In this method, the sand is digested in a mixture of Ca(OH)2 and KCl for 24 hours.
The OH- concentration is determined from titration. The difference in OH
- concentration
between control and tested samples is used as a measure of alkali-silica reactivity.
Strunge and Chatterji found reproducibility of the method to be fairly high.
An osmotic cell was developed by Verbeck and Gramlich in 1955 to study the
mechanism of expansion resulting from ASR and to identify factors that determine
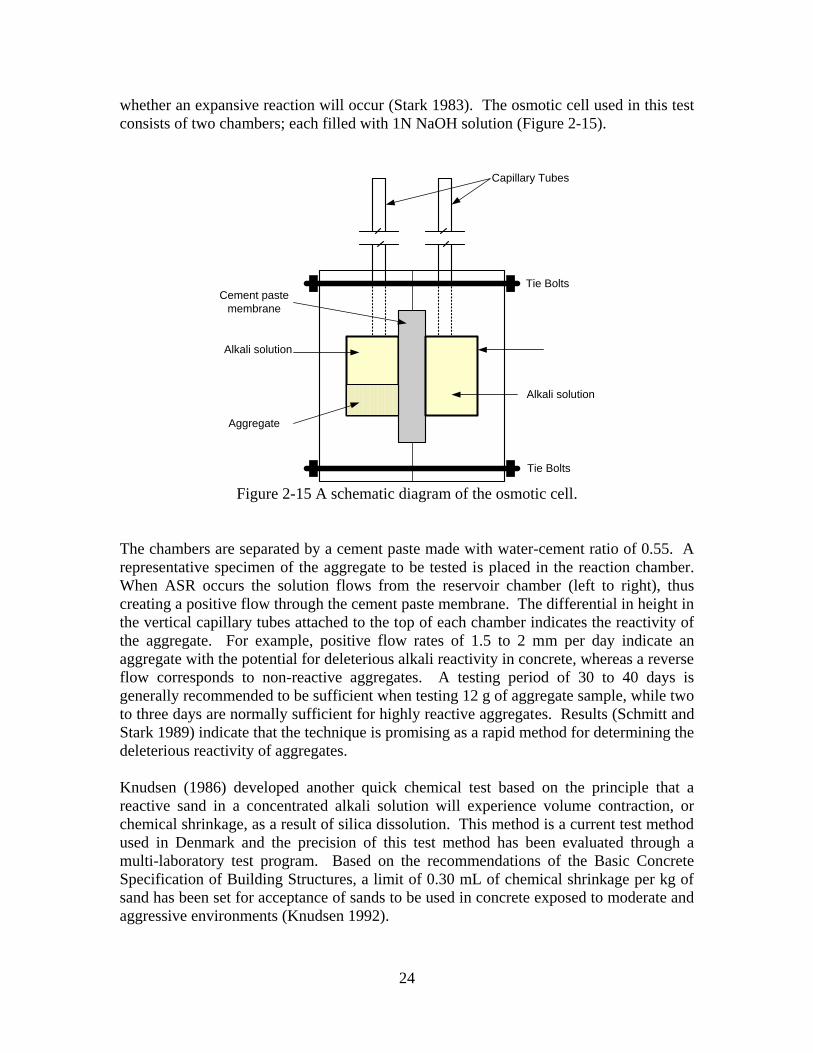
24
whether an expansive reaction will occur (Stark 1983). The osmotic cell used in this test
consists of two chambers; each filled with 1N NaOH solution (Figure 2-15).
Figure 2-15 A schematic diagram of the osmotic cell.
The chambers are separated by a cement paste made with water-cement ratio of 0.55. A
representative specimen of the aggregate to be tested is placed in the reaction chamber.
When ASR occurs the solution flows from the reservoir chamber (left to right), thus
creating a positive flow through the cement paste membrane. The differential in height in
the vertical capillary tubes attached to the top of each chamber indicates the reactivity of
the aggregate. For example, positive flow rates of 1.5 to 2 mm per day indicate an
aggregate with the potential for deleterious alkali reactivity in concrete, whereas a reverse
flow corresponds to non-reactive aggregates. A testing period of 30 to 40 days is
generally recommended to be sufficient when testing 12 g of aggregate sample, while two
to three days are normally sufficient for highly reactive aggregates. Results (Schmitt and
Stark 1989) indicate that the technique is promising as a rapid method for determining the
deleterious reactivity of aggregates.
Knudsen (1986) developed another quick chemical test based on the principle that a
reactive sand in a concentrated alkali solution will experience volume contraction, or
chemical shrinkage, as a result of silica dissolution. This method is a current test method
used in Denmark and the precision of this test method has been evaluated through a
multi-laboratory test program. Based on the recommendations of the Basic Concrete
Specification of Building Structures, a limit of 0.30 mL of chemical shrinkage per kg of
sand has been set for acceptance of sands to be used in concrete exposed to moderate and
aggressive environments (Knudsen 1992).
Capillary Tubes
Tie Bolts
Tie Bolts
Alkali solution
Alkali solution
Aggregate
Cement paste
membrane
25
2.5.2 Mortar and Concrete Testing
The commonly used mortar bar and concrete prism testing and concrete petrography are
categorized as cement-aggregate combination testing which are summarized below:
2.5.2.1 ASTM C 227: Standard test method for potential alkali reactivity of
cement-aggregate combinations (mortar-bar method)
Procedure - This is a useful method for testing ASR susceptibility of cement-aggregate
combinations. This test method provides information about the probability that a
cement-aggregate combination will produce deleterious ASR expansion in concrete. It
measures expansion of mortar bars made with the test aggregate and cement. The
aggregate needs to be crushed to satisfy certain grading requirements. Mortar bars in
ASTM C 227 method are stored in closed containers above water at 38°C. Longer testing
periods (one year or more) are preferred for differentiating aggregates based on reactivity.
Usefulness and limitations - Unless highly reactive aggregates are tested, meaningful
results require one year or more. Even after a long testing period, not all deleterious
aggregates exhibit expansive behavior. Sometimes this method fails to distinguish
between slowly reacting and innocuous aggregates. The reliability of the ASTM C 227
method is questionable in the opinion of some researchers (Grattan-Bellew, P.E, 1989).
Storage containers with efficient wick systems were found to cause excessive leaching of
alkali out of the mortar bar and consequently, the reduction in measured expansion is
observed. However, bars sealed in plastic bags have displayed higher expansion (Roger
and Hooton, 1989). As a result, several modifications to the test procedure have been
proposed by different researchers and agencies over the years.
2.5.2.2 ASTM C 441: Standard test method for effectiveness of mineral admixtures or
slag in preventing excessive expansion of concrete due to alkali-silica reaction
Procedure - This method is based on expansion developed in prepared mortar bars and
uses a combination of cement, mineral admixtures, and a reactive crushed Pyrex glass.
Mortar bars are stored in closed containers above water at 38°C. The method can be used
for screening to evaluate the relative effectiveness of different mineral admixtures used to
prevent excessive expansion due to ASR.
Usefulness and limitations - This method is considered unsatisfactory because Pyrex is
highly reactive and contain significant amount of alkalis. The alkalis from pyrex are
released during the test (Hooton 1986) and contribute the chemical reaction and therefore
lead to higher expansion. Moreover, it is not adaptable for testing aggregates from
different sources, since it is mainly a test for effectiveness of mineral admixture in
preventing ASR expansion in concrete.

26
2.5.2.3 ASTM C 1260: Standard test method for potential alkali reactivity of aggregates
(mortar-bar method)
Procedure - This is one of the most commonly used test methods for assessing the
potential reactivity of aggregates. Aggregates are crushed to meet specific grading
requirements. Prepared mortars bars are soaked in 1N NaOH solution at 80°C for
14 days. The use of severe test conditions such as high level of alkalinity and temperature
along with crushed aggregate is to accelerate the alkali silica reaction in mortar bar. As a
result expansion data of mortar is obtained within as little as 16 days. The test method
was developed because of the shortcomings of ASTM C 227 and ASTM C 289. ASTM C
1260 method is also referred as accelerated mortar bar test (AMBT) method by several
researchers and agencies.
Usefulness and limitations - Earlier research indicates that the AMBT method should be
used with caution when rejecting aggregates. The test conditions (i.e., 1N NaOH and
80°C) are severe and the test results are unrelated to field performance. Aggregates with
a good field track record in terms of ASR can sometimes be classified as reactive when
tested according to this method. This is supported by the observation that some
aggregates passed by the concrete prism test (ASTM C 1293-subsequently explained) but
not passed by the ASTM C 1260 test. A heterogeneous distribution of reactive
constituents within the aggregate is common for certain aggregates (e.g., reactive
cementing materials in sandstone, reactive siliceous impurity in limestone, etc). Losing
the reactive phases during crushing and sieving of these aggregates sometimes results
aggregates being passed by ASTM C 1260 but rejected by ASTM C 1293.
2.5.2.4 ASTM C 1293: Standard test method for concrete aggregates by determination
of length change of concrete due to alkali silica reaction
Procedure - This method measures length change of concrete prisms made with the
coarse and fine aggregates in question. Total alkali content of concrete should be
5.25 kg/m3. Prisms are stored above water at 38°C.
Usefulness and limitations - Test method ASTM C 1293 is considered as the best index
for field performance but at the same time, the length of the procedure (12 months)
represents a major drawback. Experience has shown that a higher level of alkali is
required to initiate expansion in the concrete prism test (CPT) than in field concrete
produced with the same aggregate. Quick reduction in pH of the pore solution as a result
of significant alkali leaching is reported in the CPT than it does in actual field concrete.
Moreover, no wetting or drying takes place in this test method. As a result, this test tends
to underestimate the extent of the reaction that would take place in a field concrete made
with the same mix as the test. On the other hand, Berube et al. (2000) suggested that the
test conditions are too severe as some aggregates with generally good field performance
may be identified as being potentially reactive by the concrete prism test.
Both the CPT and the AMBT tests are conducted at one alkali level only, that is quite
high compared to what most concretes experience in the field. Also, only a single mix

27
design is proscribed by the tests; actual mix designs are not evaluated. Similarly, there
are no provisions to test differently, or to use different limits for different exposure or
service conditions. And thus for many situations, the level of prevention that will satisfy
the test may be overly conservative. It can be generalized that the AMBT is harsher than
field service, while the CPT is milder than field service.
The primary requirements for any accelerated ASR test method are (i) it should be able to
predict correctly the potential reactivity of aggregate in over 95 percent of the cases
(Grattan-Bellew 1989, 1997), and (ii) inter-laboratory coefficient of variation should be
low, preferably less than 12 percent. Owing to the complexity and variability in
composition and grain size of aggregates, it is unlikely that a single test method can
evaluate all types of aggregates correctly. Some of the new methods or modifications of
existing methods have been proposed by researchers and agencies worldwide to
overcome some of the limitations associated with aggregate crushing, alkali content,
storage conditions (alkalinity of test solution and temperature) and leaching. However,
current test procedures are largely empirical and yield test results that are applicable to a
narrow band of conditions.


29
CHAPTER 3
DEVELOPMENT OF A PERFORMANCE-BASED
ASR TEST APPROACH
3.1 INTRODUCTION
Despite a wealth of data that exists on alkali reactivity of aggregates from different
sources, doubts remain as to whether current tests used to assess ASR potential are
realistic under field conditions. It is clear that there is a lack of a unified approach to
address how different combinations of concrete materials may interact to affect ASR
behavior. An ideal test method should be reliable in terms of predicting how the
combinations of materials will behave under field conditions. A much more versatile
testing protocol (i.e., combined materials test procedure) needs to be developed which
provides a means to incorporate the effect of aggregate reactivity, w/cm, porosity,
supplementary cementitous materials (SCM) and lithium compounds on ASR in order to
formulate job specific ASR resistant mixtures matching with alkali levels and
temperatures representative of field conditions.
3.2 ASR: A KINETIC TYPE CHEMICAL REACTION
ASR is a chemical reaction that integrates the combined effects of temperature, alkalinity,
moisture and time relative to the kinetics of ASR expansion. Increasing the temperature
at early age increases the rate of chemical reaction that occurs between the alkalis and
reactive silica in the aggregate and as a result higher expansions takes place during the
early life of the concrete, but lower at later age (Diamond et al. 1981, Figure 3-1). The
fact that ASR reaction is a thermally activated process has been taken into consideration
in existing tests such as ASTM C 1260/1567 and 1293. Similarly, past work has focused
on increasing the level of OH- by increasing pH as in the ASTM C 1260/1567 test as
well as spiking the alkali level in the ASTM C 1293 test. Ludwig (1981) studied the
effect of humidity and temperature on mortar bars cured for 3 years and found the critical
humidity required to prevent ASR damage is less than 85 percent.
Aggregate alkali silica reactivity is a function of form/degree of crystallinity, grain size,
and the proportion of the reactive silica within the reactive aggregate (Stanton 1940;
Mindess, 2003) as well as alkalinity and temperature. Hobbs (1988) reported the
expansion increases as particle size decreases, which means the particle size of reactive
material is also an important factor (Figure 3-2).
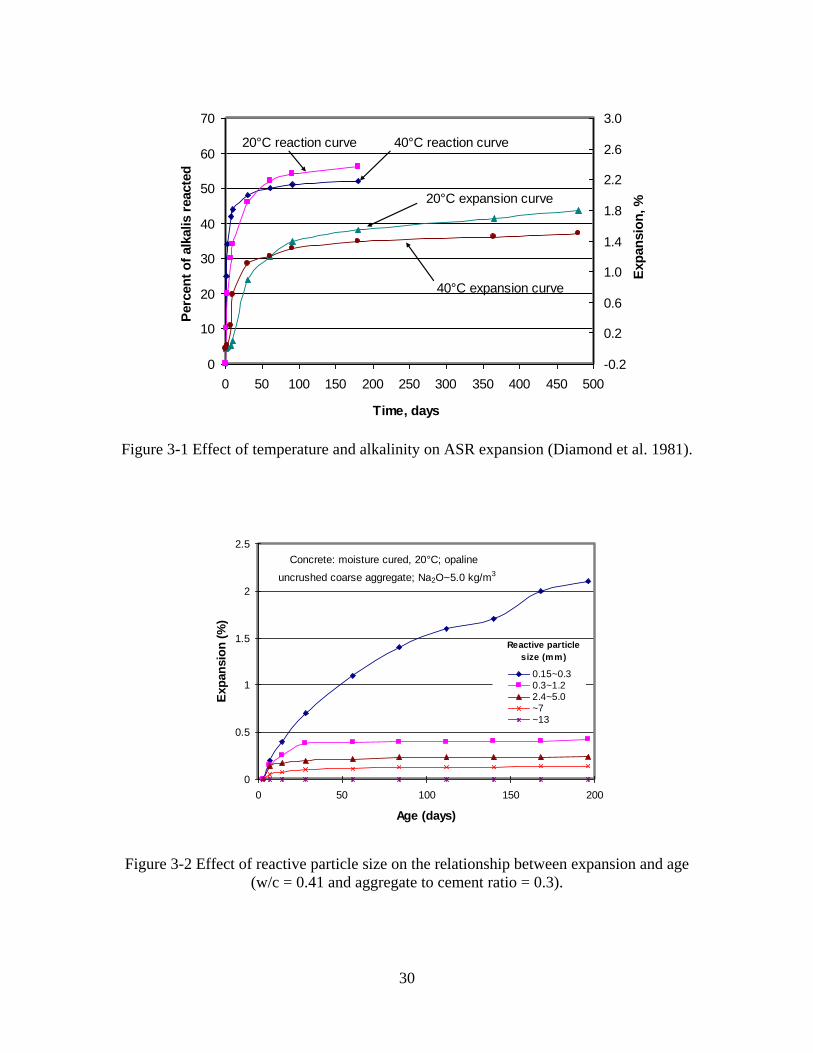
30
Figure 3-1 Effect of temperature and alkalinity on ASR expansion (Diamond et al. 1981).
0
10
20
30
40
50
60
70
0 50 100 150 200 250 300 350 400 450 500
Time, days
Exp
an
sio
n, %
-0.2
0.2
0.6
1.0
1.4
1.8
2.2
2.6
3.0
Perc
en
t o
f alk
alis r
eacte
d
20°C reaction curve 40°C reaction curve
40°C expansion curve
20°C expansion curve
0
0.5
1
1.5
2
2.5
0 50 100 150 200
Age (days)
Exp
an
sio
n (
%)
0.15~0.30.3~1.22.4~5.0~7~13
Reactive particle
size (mm)
Concrete: moisture cured, 20°C; opaline
uncrushed coarse aggregate; Na2O~5.0 kg/m3
Figure 3-2 Effect of reactive particle size on the relationship between expansion and age
(w/c = 0.41 and aggregate to cement ratio = 0.3).

31
Diamond (1983) and Kolleck et al. (1986) suggests that a threshold concentration
required to initiate and sustain ASR is 0.25M (pH=13.4) and 0.2M (pH=13.3),
respectively. Below the threshold concentration (i.e., low pH solution), a reactive
aggregate may not react (or have low potential to react) and can show good field
performance (Figure 3-3). Kawamura and Iwahori (2004) observed that the expansive
pressure is approximately proportional to the amount of ASR gel formed provided the
alkali content of ASR gel is less than a critical value. However, mortars containing ASR
gel with higher alkali content (similar to ASTM C 1260) than the critical value showed
extremely low expansive pressure, even when they greatly expanded in tests without
restraint. Therefore, in existing ASR affected concrete structures containing gels with
higher alkali content than a critical value, damages due to the secondary stresses caused
by restraint might not be so significant, even if reactive aggregates used in the concrete
have showed greater expansions in mortar bar test in the laboratory (Kawamura and
Iwahori 2004). This knowledge allows for greater understanding of the kinetics involved
with the formation of gel and its subsequent expansion.
Figure 3-3 Effect of pH on dissolution of amorphous silica.
It is clear from the above discussion that ASR is a kinetic type chemical reaction.
Therefore, kinetic type model can be used to derive characteristic material properties and
assess ASR fundamentally. In the past, researchers have investigated the use of a kinetic
type ASR model for either the prediction of mortar bar expansion (T. Uomoto,
Y. Furusawa, and H. A. Ohga, 1992) or for better interpretation of the existing test
methods (Johnston et al. 2000). A brief discussion on previous kinetic type approaches
and applications is as follows:
0
10
20
30
40
50
60
70
80
8.5 9 9.5 10 10.5 11 11.5 12 12.5 13
pH
Dis
olv
ed
sil
ica (
mM
/L)
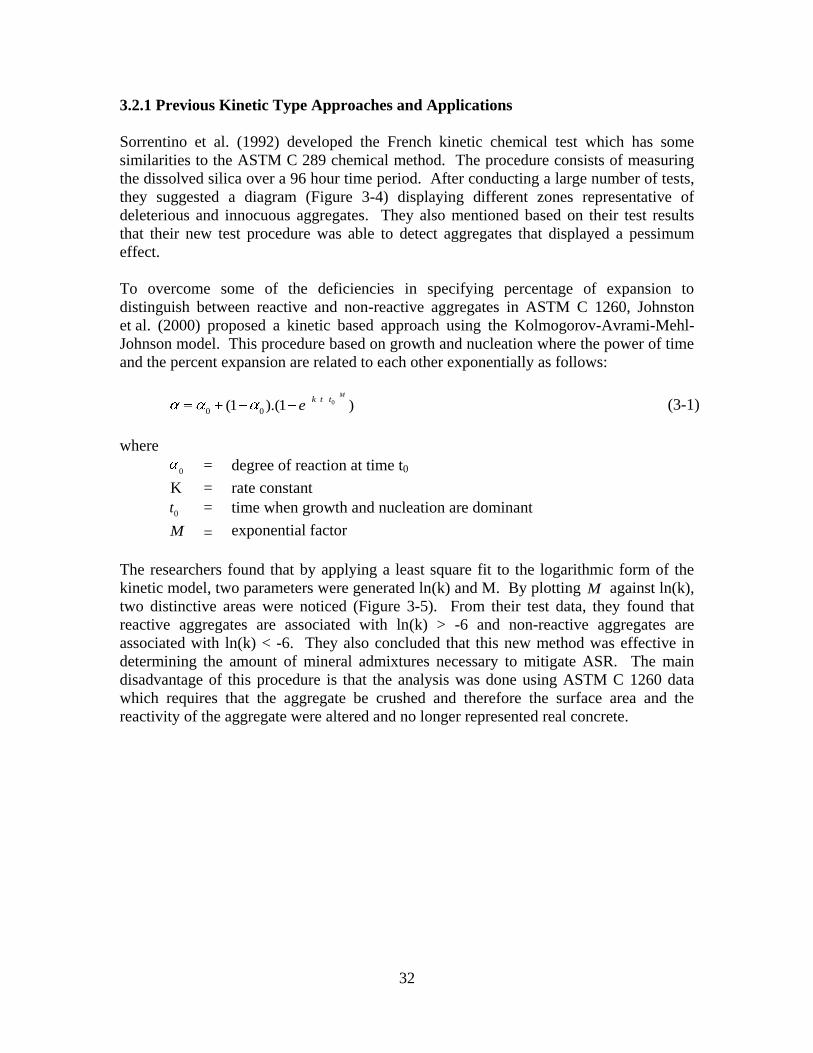
32
3.2.1 Previous Kinetic Type Approaches and Applications
Sorrentino et al. (1992) developed the French kinetic chemical test which has some
similarities to the ASTM C 289 chemical method. The procedure consists of measuring
the dissolved silica over a 96 hour time period. After conducting a large number of tests,
they suggested a diagram (Figure 3-4) displaying different zones representative of
deleterious and innocuous aggregates. They also mentioned based on their test results
that their new test procedure was able to detect aggregates that displayed a pessimum
effect.
To overcome some of the deficiencies in specifying percentage of expansion to
distinguish between reactive and non-reactive aggregates in ASTM C 1260, Johnston
et al. (2000) proposed a kinetic based approach using the Kolmogorov-Avrami-Mehl-
Johnson model. This procedure based on growth and nucleation where the power of time
and the percent expansion are related to each other exponentially as follows:
0
0 0(1 ).(1 )
Mk t t
e
(3-1)
where
0 = degree of reaction at time t0
K = rate constant
0t = time when growth and nucleation are dominant
M = exponential factor
The researchers found that by applying a least square fit to the logarithmic form of the
kinetic model, two parameters were generated ln(k) and M. By plotting M against ln(k),
two distinctive areas were noticed (Figure 3-5). From their test data, they found that
reactive aggregates are associated with ln(k) > -6 and non-reactive aggregates are
associated with ln(k) < -6. They also concluded that this new method was effective in
determining the amount of mineral admixtures necessary to mitigate ASR. The main
disadvantage of this procedure is that the analysis was done using ASTM C 1260 data
which requires that the aggregate be crushed and therefore the surface area and the
reactivity of the aggregate were altered and no longer represented real concrete.
33
Figure 3-4 Diagram of the kinetic test.
Figure 3-5 Avrami exponent versus rate constant.
3.3 DEVELOPMENT OF A PERFORMANCE-BASED APPROACH TO ASSESS
ASR
From the foregoing discussion it is clear that the current tests have little relevance to
concrete ASR behavior under field conditions. The potential of ASR varies according to
combinations of all the following factors:
0
0.5
1
1.5
2
2.5
0 24 48 72 96
Time (hrs)
SiO
2/N
a2O
Innocuous when constituting the entirely
of one aggregate
Deleterious aggregate
Innocuous aggregate
0
0.5
1
1.5
2
2.5
-9 -8 -7 -6 -5 -4 -3 -2 -1 0
Ln (Avrami Rate Constant k)
Av
ram
i E
xp
on
en
t M
Reactive aggregateNon Reactive
aggregate

34
, , , , RHASR f A a t T (3-2)
where, A = alkalinity; a = reactivity of aggregate; t = time; T = temperature, and RH =
relative humidity
A performance-based approach that can incorporate the effects of aggregate reactivity,
alkalinity, w/cm, porosity, supplementary cementitious materials (SCMs) and lithium
compounds on ASR is necessary in order to formulate job specific ASR resistant
mixtures. The approach should be based on measuring some fundamental ASR material
properties of both aggregate and concrete testing under accelerated laboratory conditions
and relate those properties to field conditions through kinetic type modeling and
numerical simulation, which is described below.
3.3.1 Defining and Determination of Alkali Silica Reactivity of Aggregate
The fundamental understandings of ASR mechanisms along with the foregoing
discussion suggest a simple chemical test method for the evaluation of aggregate
reactivity alone. Aggregate alkali silica reactivity can be determined chemically by
simulating aggregate–pore solution reaction that may exist in concrete. As-received
aggregate can be tested in alkaline solutions of varying concentration (similar to and
higher/lower than concrete pore solution concentrations) and at different temperatures
within a short period of time. By selecting relatively higher testing temperatures (e.g., 60,
70 and 80°C) the reaction can be accelerated as ASR is dominantly thermally activated
reaction. The test device that will be used to simulate the aggregate-pore solution
reaction should be capable to measure free volume change due to ASR over time. A
simple chemical test of this nature will be rapid in nature and allow for the determination
of the fundamental material properties of aggregate unimpeded by an external diffusion
process. The approach for determination of aggregate alkali silica reactivity is described
stepwise below:
1. Measure volume change over time as a function of temperature, alkalinity
2. Formulation of performance-based model–characterizes the measured
time-expansion and derives a characteristic reactivity parameter (e.g. rate of
expansion, ultimate expansion, activation energy). From the foregoing discussion,
it is clear that some initial conditions related to alkalinity, aggregate reactivity,
moisture, and temperature conditions that must be met to initiate ASR. Activation
energy can serve as a single chemical material parameter to represent this
kinetic-type combined effect of temperature, alkalinity, and time to evaluate ASR
susceptibility of aggregate.
3. Predicting aggregate reactivity matching with field level of alkalinity through
establishing a relation between chemical reactivity parameter (item 2) and
alkalinity.
The above steps involved in determination of aggregate alkali silica reactivity are
described in details below:
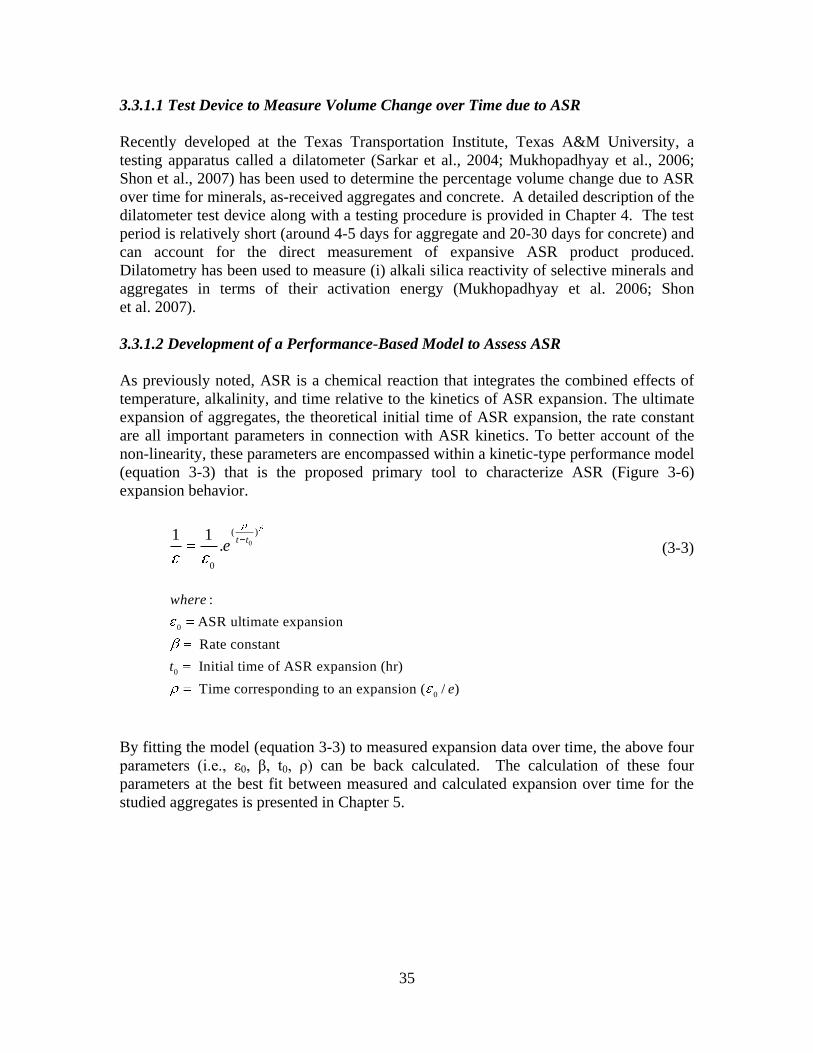
35
3.3.1.1 Test Device to Measure Volume Change over Time due to ASR
Recently developed at the Texas Transportation Institute, Texas A&M University, a
testing apparatus called a dilatometer (Sarkar et al., 2004; Mukhopadhyay et al., 2006;
Shon et al., 2007) has been used to determine the percentage volume change due to ASR
over time for minerals, as-received aggregates and concrete. A detailed description of the
dilatometer test device along with a testing procedure is provided in Chapter 4. The test
period is relatively short (around 4-5 days for aggregate and 20-30 days for concrete) and
can account for the direct measurement of expansive ASR product produced.
Dilatometry has been used to measure (i) alkali silica reactivity of selective minerals and
aggregates in terms of their activation energy (Mukhopadhyay et al. 2006; Shon
et al. 2007).
3.3.1.2 Development of a Performance-Based Model to Assess ASR
As previously noted, ASR is a chemical reaction that integrates the combined effects of
temperature, alkalinity, and time relative to the kinetics of ASR expansion. The ultimate
expansion of aggregates, the theoretical initial time of ASR expansion, the rate constant
are all important parameters in connection with ASR kinetics. To better account of the
non-linearity, these parameters are encompassed within a kinetic-type performance model
(equation 3-3) that is the proposed primary tool to characterize ASR (Figure 3-6)
expansion behavior.
0
( )
0
1 1.
t te (3-3)
0
0
0
:
ASR ultimate expansion
Rate constant
Initial time of ASR expansion (hr)
Time corresponding to an expansion ( / )
where
t
e
By fitting the model (equation 3-3) to measured expansion data over time, the above four
parameters (i.e., ε0, β, t0, ρ) can be back calculated. The calculation of these four
parameters at the best fit between measured and calculated expansion over time for the
studied aggregates is presented in Chapter 5.

36
0( )t t
0
0t
i
0( )it t
0
Figure 3-6 Proposed ASR Model to fit the expansion data history of the dilatometer.
3.3.1.2.1 Predicting Potential Aggregate Alkali Silica Reactivity in Terms of Activation
Energy
Equation (3-3) can be transformed into a linear form to facilitate the evaluation of the β
parameter (which is. equivalent to the rate constant) by taking the double natural
logarithm.
0
0
ε( )
εLn Ln Ln Ln t t (3-4)
Figure 3-7 display the ideal linear relationship between 0
ε/εLn Ln and 0( )Ln t t .
The β is calculated from the slope of the regression line (as in Figure 3-7). The β values
at multiple temperatures (minimum 3 temperatures) are then determined and activation
energy is calculated by plotting ln(β) versus (1/T) (as in Figure 3-8). Based on rate
theory (Callister 2007), the slope of the linear regression (Figure 3-8) is equal to (-Ea/R)
where R is the universal gas constant and Ea is the activation energy.
In analytical chemistry, activation energy (Ea) is defined as the minimum energy required
for a chemical reaction to proceed (Ebbing et al. 2005). Consequently, it can be
considered as an energy barrier. For ASR, Ea is considered as the minimum energy
required initiating ASR taking into account the combined effect of alkalinity, temperature
and time. It is important here to mention that the ASR Ea should be considered as a

37
1
0
ln ln( )
0ln( )t t
Figure 3-7 Linearization of the kinetic performance model.
ln
1
T
1
aE
R
Figure 3-8. Determination of activation energy.

38
compound activation energy as aggregate is a heterogeneous material that is often
composed of different mineral phases, i.e., reactive phases (one or more phases) and
non-reactive phases (crystalline minerals). The concept of ASR activation energy was
introduced as a representative single parameter of alkali silica reactivity of minerals and
aggregates earlier (Mukhopadhyay et al., 2006).
3.3.1.3 Proposed Model to Determine Ea of Aggregate under Field Conditions
The results of the studied aggregates (details in Chapter 5) indicated that compound
activation energy (Ea) is a function of concentration (e.g., alkalinity). Ideally, activation
energy of any pure phase shouldn‘t change with concentration. The apparent relationship
between aggregate Ea and alkalinity is possibly due to (i) complex unknown interference
of non-reactive phase(s) and (ii) inhomogeneous distribution of the reactive constituents
in aggregates.
The amount of alkali necessary (i.e., threshold alkali) to initiate expansion is expected to
be different for each aggregate or aggregate type depending on the form/crystallinity and
particle size and distribution of the reactive silica phase as well as the porosity, texture
and surface characteristics of the aggregate. Therefore, characterization of aggregate
reactivity at different alkali levels is necessary in order to quantify the level of alkali
necessary to initiate expansion as well as achieving a greater insight into the kinetics of
ASR reactions. In general, the pH of concrete is approximately 12.4. If the cement
contains a high amount of alkali and/or potential source(s) of external alkalis exist, the
concentration of sodium and potassium hydroxide in the pore solution will be high and
the pH may reach well above 13. An increase in pH will increase the rate of ASR. The
normality of sodium hydroxide in this study is 0.5 and 1 N corresponding to a pH of 13.7
and 14 respectively, well above the pH of concrete in field concrete. Therefore, it is
important to determine the activation energy of the aggregate covering the whole pH
spectrum that the concrete will be subjected to.
The following model is used to determine Ea at different levels of alkalinity and found to
be reasonable to establish a mathematical relationship between Ea and alkalinity
(Figure 3-9):
0
1
a aE E
n
C
C (3-5)
where:
Ea = Activation energy
Eao = Activation energy–threshold
C1 = Activation energy curvature coefficient
N = Activation energy curvature exponent
C = Alkalinity

39
aE
( NaOH)C Normality0.5 1
0aE
2aE
1aE
Figure 3-9 Activation energy vs. alkalinity.
The coefficients 0 1, C , n
aE
are determined using a numerical analysis and the trend
between compound activation energy and alkalinity as in Figure 3-9 is obtained. The
characteristic trend between Ea and alkalinity can be obtained for each aggregate and a
threshold alkalinity can be assigned based on the trend. A reactive aggregate may
potentially behave practically as non-reactive provided the alkalinity in concrete can be
maintained below the threshold alkalinity.
This relationship defines how the reactivity of a given aggregate source varies with the
degree of alkalinity as a fundamental material property (i.e., compound activation energy)
that will serve a key function matching with field level of alkalinity. An additional
benefit of the above approach is its overall comprehensiveness that inherently includes
the effects of temperature following a procedure conducted in relatively short period of
time using aggregates in an as received condition.


41
CHAPTER 4
TEST EQUIPMENT EVOLUTION AND PROTOCOL VALIDATION
4.1 INTRODUCTION
This chapter describes the evolution of the dilatometer-related test equipment and
protocol development as it took place over the course of the project. The different stages
of equipment and protocol development are presented addressing (i) initial dilatometer
testing procedures, (ii) identification of sources of testing errors through the joint efforts
of the research participants, (iii) resulting equipment and procedure improvement,
(iv) data analysis and material characterization, (v) equipment calibration to compensate
for aggregate absorption effects and vapor pressure losses, (vi) applicability of chemical
shrinkage phenomena (if any), and (vii) assessment of repeatability.
Aggregate materials were tested in alkaline solution with varying levels of concentration
(similar to and higher/lower than concrete pore solution concentrations) at different
temperatures. In other words, aggregate testing of this nature at least chemically
simulates the aggregate-pore solution reaction as may exist in concrete. Four coarse
aggregates (New Mexico Rhyolite (NMR), Platt River Gravel (PRG), Spratt Limestone
(SL), and Sudbury Gravel (SuG)) with varying reactive constituents were used in this
study. Since these aggregates have a well documented record of ASR reactivity via
existing ASTM ASR test methodologies, they were used in the protocol development. In
fact, the PRG and SL aggregates were used in all the stages of the equipment and
protocol evaluation. The other two aggregates, i.e., NMR and SuG were used in later
stages of the project focused on evaluation. The detailed description of the individual
aggregate in terms of mineralogy/reactive constituents, gradation, physical properties etc.
is provided in Chapter 5.
4.2 DESCRIPTION OF THE DILATOMETER EQUIPMENT
A detailed description of the apparatus and accessories used in the test protocol to
measure ASR expansion of aggregate and concrete is presented in Appendix A in its final
form. The different stages of equipment development in reaching a final configuration
are described in subsequent sections of this chapter. A brief description of the equipment
and its operation is given below.
The device used in this study to measure ASR expansion was the dilatometer which has
been used previously to measure volumetric thermal and ASR expansion of aggregate
and concrete (Shon et al. 2002; Mukhopadhyay et al., 2004; Sarkar et al., 2004;
Mukhopadhyay et al., 2006; Shon et al., 2007; and Mukhopadhyay and Zollinger, 2009).
The dilatometer (Figure 4-1) consists of a pot, a teflon-coated brass lid, a hollow tower,
and a steel float (Figure 4-2). The pot and tower are made of stainless steel whereas the
lid is made of naval brass. At the top of the tower, a casing is installed to ensure proper
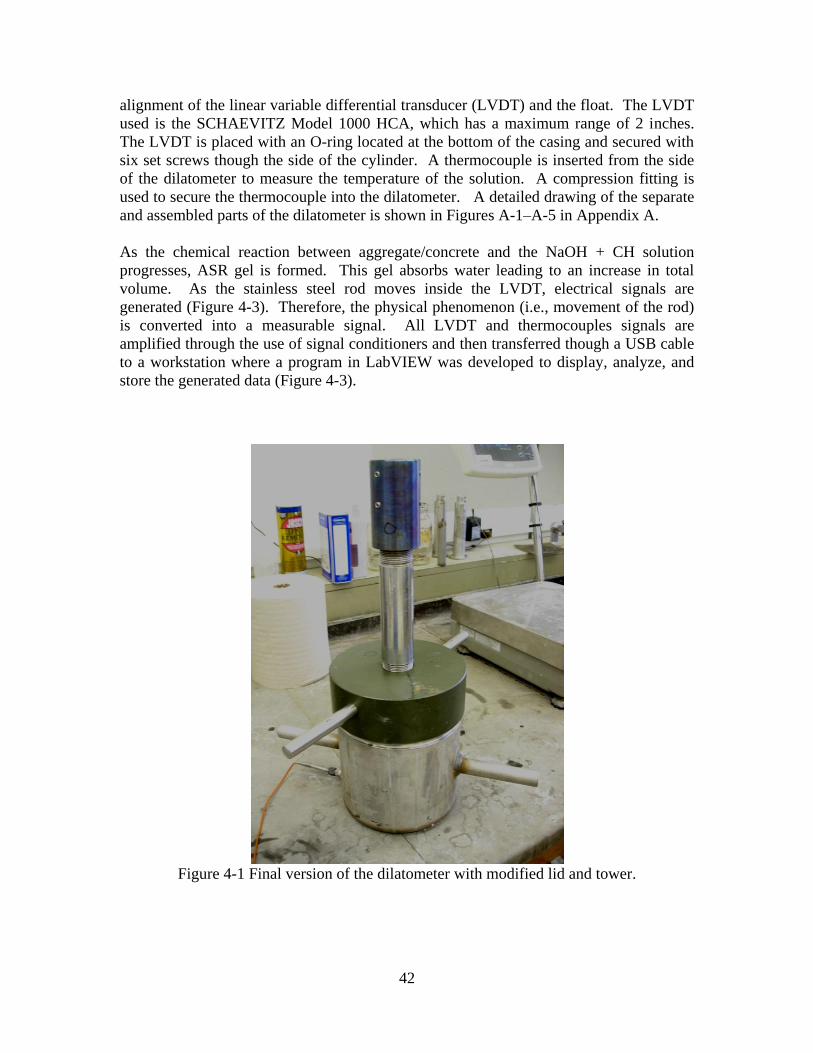
42
alignment of the linear variable differential transducer (LVDT) and the float. The LVDT
used is the SCHAEVITZ Model 1000 HCA, which has a maximum range of 2 inches.
The LVDT is placed with an O-ring located at the bottom of the casing and secured with
six set screws though the side of the cylinder. A thermocouple is inserted from the side
of the dilatometer to measure the temperature of the solution. A compression fitting is
used to secure the thermocouple into the dilatometer. A detailed drawing of the separate
and assembled parts of the dilatometer is shown in Figures A-1–A-5 in Appendix A.
As the chemical reaction between aggregate/concrete and the NaOH + CH solution
progresses, ASR gel is formed. This gel absorbs water leading to an increase in total
volume. As the stainless steel rod moves inside the LVDT, electrical signals are
generated (Figure 4-3). Therefore, the physical phenomenon (i.e., movement of the rod)
is converted into a measurable signal. All LVDT and thermocouples signals are
amplified through the use of signal conditioners and then transferred though a USB cable
to a workstation where a program in LabVIEW was developed to display, analyze, and
store the generated data (Figure 4-3).
Figure 4-1 Final version of the dilatometer with modified lid and tower.

43
Figure 4-2 Stainless steel float system.
Figure 4-3 Dilatometer test setup.
LVDT Rod
Threaded steel
rod
Float

44
4.3 PROCEDURE TO MEASURE ASR VOLUME EXPANSION OF
AGGREGATE
This section covers the preparation of the test solution of different alkalinities, the
dilatometer testing procedure, and the calculation of ASR expansion related parameters.
4.3.1 Preparation of Alkaline Solution
The 1 N, 0.5N and 0.25N NaOH solutions, referred in the description of experimental
designs provided in chapter 5, are prepared by diluting 40, 20 and 10g of sodium
hydroxide crystals into 0.9 liter of distilled water. Water is added to raise the total
volume of solution to 1 liter. To prepare calcium hydroxide saturated solutions, Ca(OH)2
(CH) crystals are added to the above alkalinity solutions slightly above saturation.
Addition of CH crystals slightly above saturation point ensures presence of undissolved
CH crystals, which represents situation similar to concrete pore solution. Homogeneity
of all the prepared solutions is ensured by thorough mixing.
4.3.2 Aggregate Sample Preparation
The four selected aggregates used in this study were tested using the as-received particle
sizes (without any crushing) in the dilatometer. Testing uncrushed, as-received
aggregates yields reactivity more representative of the reactivity in actual concrete
mixtures. The amount retained on each sieve was kept constant for all the three coarse
aggregates to make the gradation as consistent as possible. The purpose of keeping the
gradation uniform was to maintain surface area uniformly in the comparison of the
measured reactivity (e.g., activation energy) between different aggregates and rank them
based on reactivity. It is to be noted that the gradation of the Platte River Gravel was
different (i.e., finer) than the other 3 coarse aggregates and that one should keep this in
mind when making a direct comparison between the aggregates. The aggregate sample
size is approximately 80 percent by volume of the dilatometer pot. The solution level
was maintained at a fixed level as a standard for the solid/solution volume ratio.
4.3.3 Dilatometer Testing Procedure
The initial procedure for dilatometer testing is summarized in Table 4-1 and briefly
described below:
a) The weight of the oven dried aggregate to fill 80 percent of the pot volume is
measured and then placed in the dilatometer.
b) The aggregate is soaked for 12-14 hours into the selected alkaline solution at
room temperature (23°C).
c) The lid and the tower is placed on the pot with the plastic float (attached to the
threaded steel and LVDT rod) pre-placed inside the tower. The tower is
screwed to the lid.
d) The dilatometer is subjected to 2-3 hours of vacuuming and vibration at room
temperature (Figure 4-4) to remove air bubbles from solution. The entrapped

45
air during aggregate immersion in alkaline solution (step ―b‖) and air that
released due to aggregate absorption stay in the solution as air bubbles. To
facilitate removal of air bubbles, the inner surface of the lid is designed at a
specific slope.
e) The dilatometer is then placed in a water bath to raise the temperature to the
selected target temperature.
f) The dilatometer is removed from the water bath and subjected to a second
round of vacuuming and vibration for an additional hour to remove any
remaining or dissolved air bubbles from the solution.
g) The dilatometer is placed back inside the water bath (Figure 4-5a) at the target
temperature
h) The tower is wrapped with insulation in order to minimize condensation effects
inside the tower (Figure 4-5b).
i) LVDT movement due to initial thermal expansion followed by ASR is recorded
by a data acquisition system.
Table 4-1 Outline of the initial Dilatometer test procedure.
Step Time
(hours) Temp. Purpose/Process
Aggregate (oven dry)
immersion in selected
alkaline solution
12-14 23°C Saturation of aggregate pore system
(easily accessible pores)
First Vacuum (Aggregate +
solution) under vibration 2-3 23°C
Removing air bubbles from solution
as well as saturation of unsaturated
pores (hard to saturate by immersion
alone in the previous step)
Preheating dilatometer in
water bath 1.5-2 Target
Heat the dilatometer to target
temperature
Second vacuum (Aggregate +
solution) under vibration 1 Target
Further pore saturation due to
thermal expansion effects
The LVDT movement due to
thermal expansion 3-4 Target
Assigning a reference LVDT
reading at stable target temperature
LVDT movement due to
ASR 55-60 Target
Recording volume change due to
ASR

46
Figure 4-4 Dilatometer vacuuming under vibration.
Figure 4-5 (a) Dilatometer placed in water bath after final vacuuming,
(b) Dilatometer tower is wrapped with insulating material.

47
4.3.4 Calculation of ASR Expansion
The calculation of volume change of the tested aggregate because of ASR is as follows:
(4-1)
(4-2)
where:
= Percent expansion at n hours
= Initial volume of aggregate
= Volume change of aggregate due to ASR at n hours
= Surface area of the dilatometer tower
= Net displacement due to ASR
4.3.5 Data Analysis
The data is analyzed to determine fundamental material properties based on the degree of
fit of known trends of ASR expansion over time. This known trend was modeled using
appropriate mathematical expressions to achieve the best fit possible. The rate of
expansion (which leads to the determination of rate constant, kT) was represented linearly
over time. For the studied aggregates, 2-3 days test duration was found to be adequate to
obtain representative ASR material properties (e.g., ultimate expansion, activation energy
etc.). The model and procedure to calculate ultimate expansion and activation energy are
presented in Appendix B.
4.4 FIRST PHASE OF EVALUATION
A test program coordinated among the three universities was carried out using the above
procedure and two aggregates (i.e., Platt River Gravel (PRG) and Spratt Limestone (SL))
in a 1N NaOH solution and three levels of temperature (60, 70, and 80°C). Some of the
PRG expansion-time data are presented in Figures 4-6 – 4-8 to show the expansion
characteristics. The expansion-time data was analyzed to calculate the ultimate
expansion and activation energy and are presented in Table 4-2. Activation energy
values between the laboratories compare reasonably well (Table 4-2). Coefficient of
variation (COV) based on activation energy results is 11 percent for PRG whereas it is
20 percent for SL. However, the absolute volume expansion values (Table 4-2) at a
specified period (i.e., 51 hours) differs significantly (COV > 20 percent) between the
laboratories.

48
Figure 4-6 Expansion characteristics of PRG @ 1N NaOH and 60, 70,
and 80°C at TTI.
0.000
0.005
0.010
0.015
0.020
0.025
0.030
0.035
0.040
0.045
0.050
0 10 20 30 40 50 60
Time (hours)
Exp
an
sio
n (
%)
1N Gravel @80°C 1N Gravel @70°C 1N Gravel @60°C
Figure 4-7 Expansion characteristics of PRG @ 1N NaOH and 70, 80°C at UNH.
0.000
0.020
0.040
0.060
0.080
0.100
0.120
0.140
0.160
0 10 20 30 40 50 60 70
Time (hours)
Exp
an
sio
n (
%)
1N Gravel @80°C 1N Gravel @70°C

49
Table 4-2 Comparison based on aggregate activation energy and absolute expansion
between the laboratories.
Aggr.
Type
Temp.
(°C)
Activation Energy (KJ/mol) Absolute Volume
Expansion% at 51 hours
TTI UNH UT TTI UNH UT
PRG 80
67.6
76.9
83.7
0.026 0.127 -
70 0.021 0.044 0.116
60 0.021 - 0.033
SL 80
31.0
-
43.5
0.069 - 0.142
70 0.059 - 0.112
60 0.044 - -
4.4.1 Identification of Sources of Errors
The sources of errors that were identified in the first phase of evaluation are listed and
discussed as follows:
1. Incidences of float leaking and sticking
2. Moisture condensation
3. Vapor pressure loss
4. Aggregate absorption of moisture
5. Modeling data trends
Figure 4-8 Expansion characteristics of PRG @ 1N NaOH and 60, 70°C at UT.
0.000
0.020
0.040
0.060
0.080
0.100
0.120
0.140
0 10 20 30 40 50 60 70
Time (hours)
Exp
an
sio
n (
%)
1N Gravel @70°C 1N Gravel @60°C
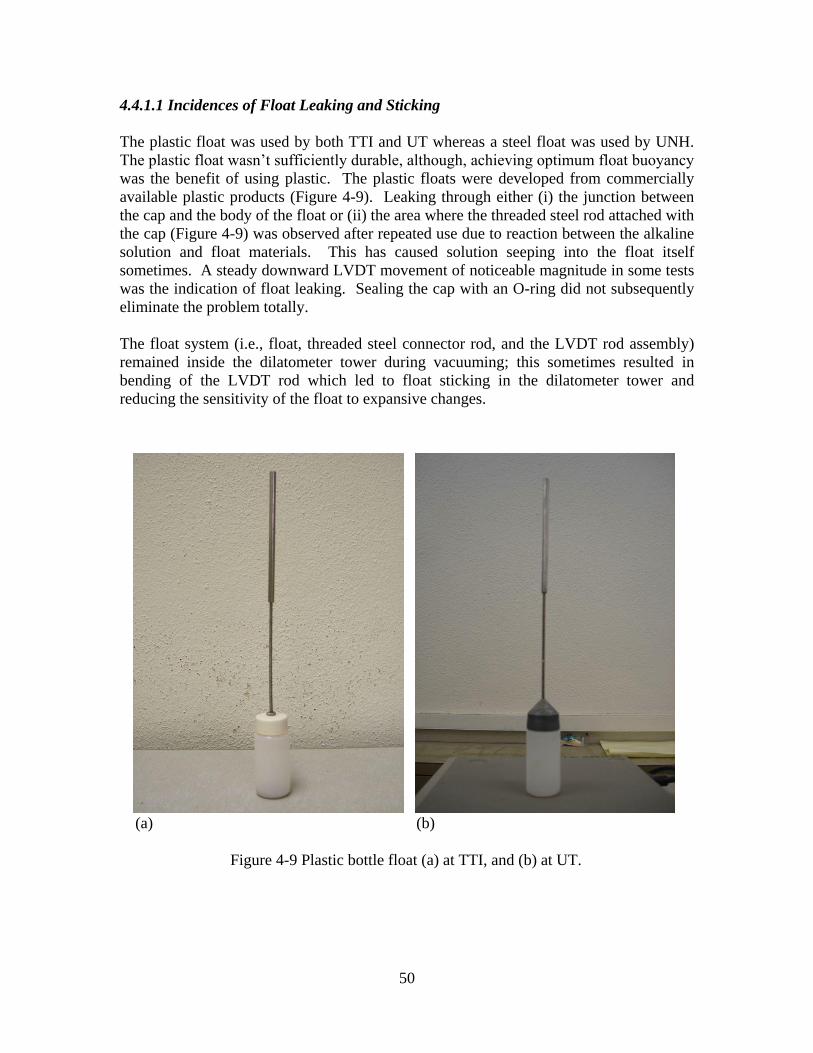
50
4.4.1.1 Incidences of Float Leaking and Sticking
The plastic float was used by both TTI and UT whereas a steel float was used by UNH.
The plastic float wasn‘t sufficiently durable, although, achieving optimum float buoyancy
was the benefit of using plastic. The plastic floats were developed from commercially
available plastic products (Figure 4-9). Leaking through either (i) the junction between
the cap and the body of the float or (ii) the area where the threaded steel rod attached with
the cap (Figure 4-9) was observed after repeated use due to reaction between the alkaline
solution and float materials. This has caused solution seeping into the float itself
sometimes. A steady downward LVDT movement of noticeable magnitude in some tests
was the indication of float leaking. Sealing the cap with an O-ring did not subsequently
eliminate the problem totally.
The float system (i.e., float, threaded steel connector rod, and the LVDT rod assembly)
remained inside the dilatometer tower during vacuuming; this sometimes resulted in
bending of the LVDT rod which led to float sticking in the dilatometer tower and
reducing the sensitivity of the float to expansive changes.
(a) (b)
Figure 4-9 Plastic bottle float (a) at TTI, and (b) at UT.

51
4.4.1.2 Moisture Condensation
Moisture condensation may have occurred on the top surface of the float during testing
due to the differences in temperature of the tower and the solution in the pot. Even
though the tower was wrapped with insulation (Figure 4-5b) to minimize the temperature
difference but some condensation may have still occurred. Due to the stepwise nature of
the float movement (some plots in Figures 4-6 and 4-8), condensation was suspected in
some test results. UNH used oven heating instead of water bath heating which
effectively eliminated the stepwise float movement due to moisture condensation
(Figure 4-7).
4.4.1.3 Vapor Pressure Loss
The lid-pot junction was threaded and sealed with an O-ring whereas the tower was
permanently screwed to the lid. To arrest evaporation through the junction between
LVDT housing and top of the tower, wrapping the junction with a duck tape was the
common practice. The above measures were eliminated vapor pressure loss to a large
extent but were not sufficient to eliminate it. This resulted underestimation of absolute
expansion in some tests. The degree of underestimation of expansion depends on the
degree of vapor loss through the LVDT-tower and other similar junctions.
4.4.1.4 Aggregate Absorption of Moisture
Ideally, the aggregate should be completely saturated prior to expansion testing.
However, it is practically impossible to achieve total saturation of the aggregate pore
system by the alkaline solution even with the use of vacuum saturation. Any incomplete
aggregate absorption during testing (degree may vary depending on the efficiency of the
vacuum system used) may create some additional underestimation of expansion.
4.4.1.5 Modeling Data Trends
The use of linear regression to fit non-linear expansion data from the dilatometer has
caused inadequate data fit for some aggregates. This has caused error in the
determination of rate constant for some tests.
The above listed errors were the main reasons for the difference in absolute expansion
that was observed between the laboratories (Table 4-2). It is to be noted that aggregate
heterogeneity (especially for Spratt limestone) also played a role in creating some of the
difference in absolute expansion. The interesting point is however, although there was a
variation in absolute expansion for some tests, the activation energy was similar (Ea COV
was less than 20 percent).
4.4.2 Measures to Minimize the Source of Errors
The research team undertook the equipment and procedure improvement as remedial
measures to eliminate or reduce the above mentioned errors, which are described below.

52
4.4.2.1 Float Leaking and Sticking
A new steel float was manufactured to eliminate the float leaking problem. The use of
steel instead of plastic products has the following merits to overcome the problem
1. It improved the float durability as steel doesn‘t react with alkaline solution at the
tested temperatures.
2. Designing a float with a single piece of material (i.e., steel) without any junction
(e.g. float with cap in case of plastic float) was achieved.
3. Float movements were improved and buoyancy at optimum level was achieved.
A permanent leak-proof steel float was developed after several trials by both UNH and
TTI.
UNH made a tower modification (i.e., making a detachable tower top as in Figure 4-10)
in order to insert the float system into the dilatometer tower after the vacuum saturation is
completed. TTI subsequently adopted the modification in the tower (Figure 4-1).
4.4.2.2 Moisture Condensation
Wrapping the tower with insulating material (earlier practice with water bath heating)
was not effective in eliminating condensation. Use of oven heating avoided condensation
inside the tower. TTI obtained a new oven (Figure 4-11, similar to the one used at UNH)
in order to eliminate condensation effects in the collected data.
Figure 4-10 Modified tower in UNH equipment.

53
4.4.2.3 Vapor Pressure Loss
Two additional threaded junctions with O-rings, i.e., between two halves of the tower,
and top of the tower-LVDT housing (detailed in Appendix A) were introduced in order to
minimize vapor loss.
4.4.2.4 Improvement in Data Modeling
Initially, the rate of expansion was represented linearly over time, which caused error in
the rate constant determination for some test results due to inadequate fitting of the
collected data. To overcome this limitation, model improvement was undertaken to
ensure adequate fitting of the data and determination of the rate constant with sufficient
accuracy. As a result, a modified expression for the rate of growth was subsequently
devised (in the form of a new model) to calculate the rate of reaction using a non-linear
growth trend over time. Linear and non-linear fitting of the Ea vs. alkalinity relationship
for the NMR aggregate is presented in Figure 4-12 as an example of the improved fitting.
Although, the absolute values of Ea shifted, the relationship between Ea vs. alkalinity
remained the same (Figure 4-12). In fact, the Ea values @ 3 levels of alkalinity are well
separated in the non-linear fitting. Therefore, the non-linear trend with time was adopted
to calculate the rate constant and ultimately the Ea as a standard practice of data analysis
(elaborated in Chapter 3). The new model was found to be satisfactory in establishing a
reasonably good fit between the calculated and measured expansion trends up till
100 hours (further details provided in Chapter 5). It appears that 100 hours should be the
standard testing period but shorter times may be possible after further development.
(a) (b)
Figure 4-11 Dilatometer placements inside an oven (a) three finally assembled
Dilatometers inside UNH small oven, (b) six finally assembled Dilatometers inside TTI
big oven.
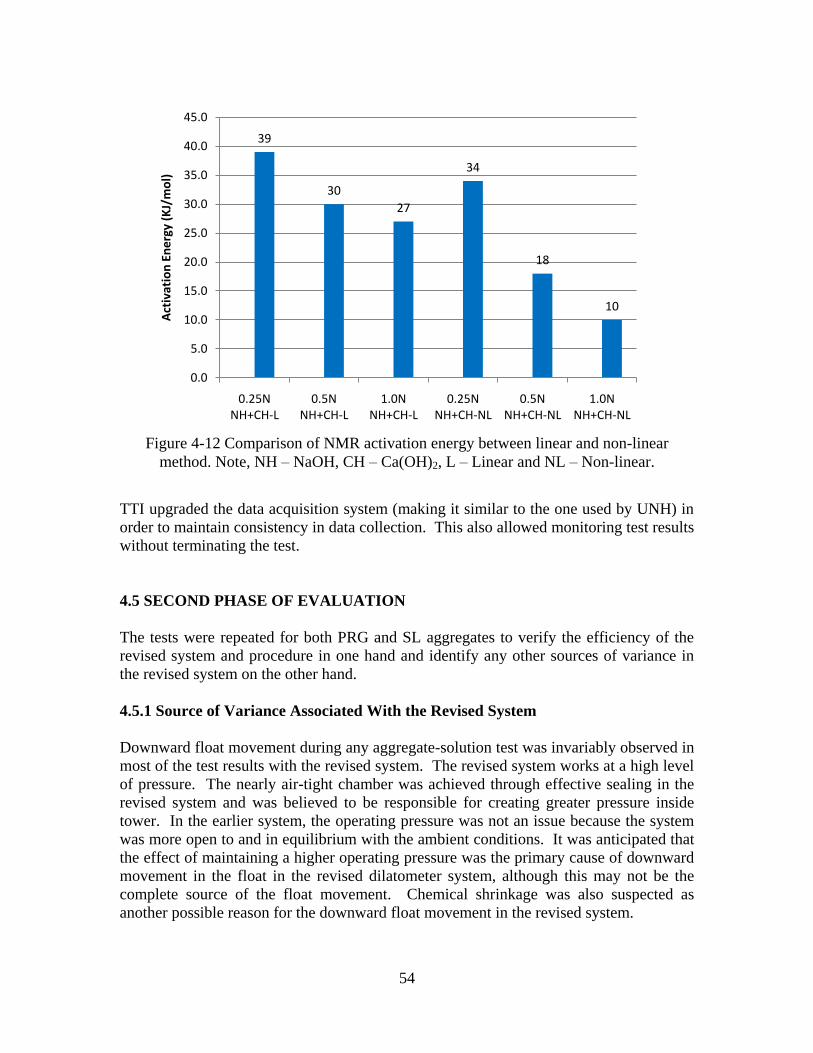
54
TTI upgraded the data acquisition system (making it similar to the one used by UNH) in
order to maintain consistency in data collection. This also allowed monitoring test results
without terminating the test.
4.5 SECOND PHASE OF EVALUATION
The tests were repeated for both PRG and SL aggregates to verify the efficiency of the
revised system and procedure in one hand and identify any other sources of variance in
the revised system on the other hand.
4.5.1 Source of Variance Associated With the Revised System
Downward float movement during any aggregate-solution test was invariably observed in
most of the test results with the revised system. The revised system works at a high level
of pressure. The nearly air-tight chamber was achieved through effective sealing in the
revised system and was believed to be responsible for creating greater pressure inside
tower. In the earlier system, the operating pressure was not an issue because the system
was more open to and in equilibrium with the ambient conditions. It was anticipated that
the effect of maintaining a higher operating pressure was the primary cause of downward
movement in the float in the revised dilatometer system, although this may not be the
complete source of the float movement. Chemical shrinkage was also suspected as
another possible reason for the downward float movement in the revised system.
Figure 4-12 Comparison of NMR activation energy between linear and non-linear
method. Note, NH – NaOH, CH – Ca(OH)2, L – Linear and NL – Non-linear.
39
30
27
34
18
10
0.0
5.0
10.0
15.0
20.0
25.0
30.0
35.0
40.0
45.0
0.25N NH+CH-L
0.5N NH+CH-L
1.0N NH+CH-L
0.25N NH+CH-NL
0.5N NH+CH-NL
1.0N NH+CH-NL
Act
ivat
ion
En
erg
y (K
J/m
ol)

55
4.5.2 Measures to Eliminate the Source of Variance in the Revised System
Efforts were undertaken to identify suitable corrective measures for the downward float
movement in the revised system. TTI and UNH concentrated on finding out suitable
measures to correct downward float movements in the dilatometer while UT investigated
the chemical shrinkage phenomenon using equipment similar to that used in cement paste
shrinkage studies.
A calibration procedure was developed in order to compensate the effect of downward
movement due to the higher operating pressure and any incomplete aggregate absorption
on the dilatometer expansion measurements. The calibration procedure and chemical
shrinkage test procedure and results are discussed below.
4.5.2.1 Development of Dilatometer Calibration Procedure
This section covers the development of a calibration procedure to avoid any errors
associated with higher operating pressures, aggregate absorption, and any other (factors
affecting expansion). In the earlier procedure, the effect of evaporation loss and
incomplete aggregate absorption was inherited in the expansion measurement which may
have caused underestimation of expansion and it was not possible to totally quantify or
separate these effects from the total expansion measurement. However, in the revised
system, it was possible to quantify and separate these effects from the total displacement
through the use of aggregate-water calibration test. The float movement in the
aggregate-water test represents the effects of pressure as well as any incomplete
aggregate absorption. On the other hand, the float movement in the aggregate-solution
test represent in some form of ASR expansion in addition to the above two effects. The
deduction of aggregate-water displacement from the aggregate-solution displacement
eliminates the effects of pressure/aggregate absorption and determines the net
displacement due to ASR. The detailed step-wise description of the calibration procedure
is as follows:
a) Conduct two dilatometer tests: the first is with aggregate soaked at a specific
alkaline solution and the second with aggregate soaked in water at the same
temperature.
b) Record LVDT readings for at least 4-5 days.
c) Plot LVDT readings vs. time–these LVDT readings are sum of an initial thermal
movement followed by movements due to ASR, pressure, and incomplete
aggregate absorption.
d) Assign the time when the dilatometer reached a stable target temperature from the
temperature-time plot for both aggregate-water and aggregate-solution tests.
e) Chose a reference LVDT reading for both aggregate-water and aggregate-solution
plots at the time determined in step ―d‖.
f) Subtract all subsequent LVDT readings from the reference reading to assign the
displacement over time for both aggregate-solution and aggregate-water tests
(Figure 4-13)–this eliminates the effects of initial thermal expansion from the
measured displacement.
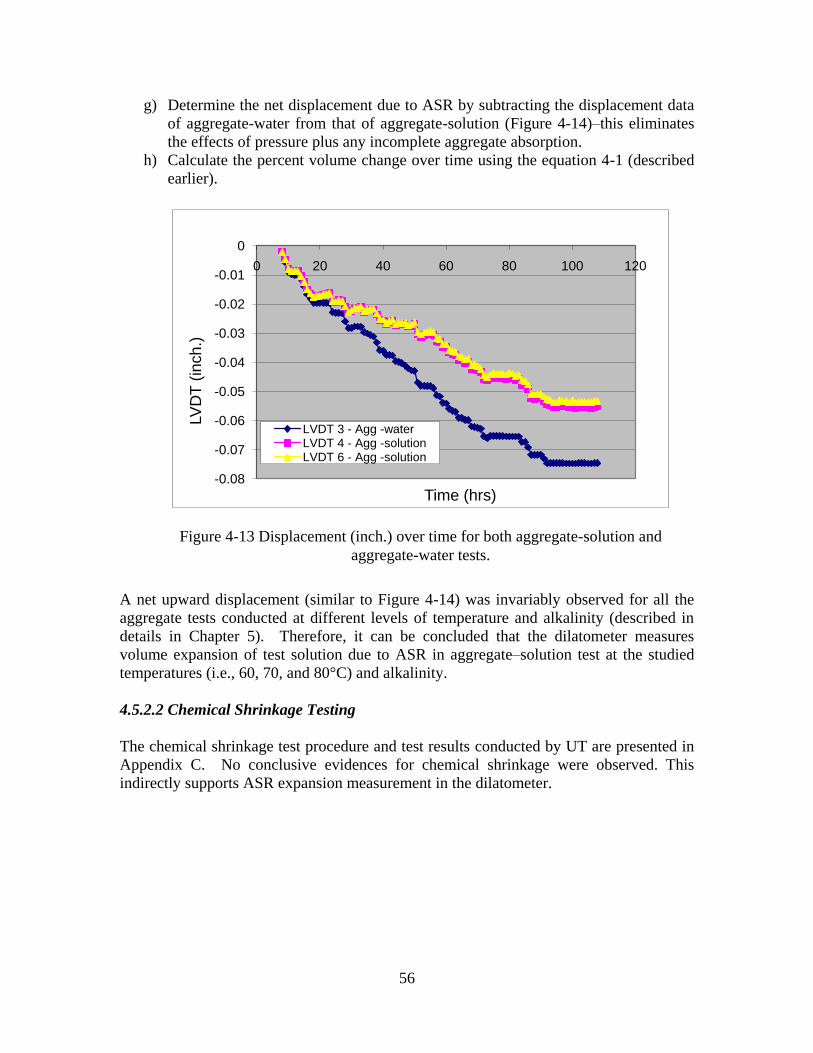
56
g) Determine the net displacement due to ASR by subtracting the displacement data
of aggregate-water from that of aggregate-solution (Figure 4-14)–this eliminates
the effects of pressure plus any incomplete aggregate absorption.
h) Calculate the percent volume change over time using the equation 4-1 (described
earlier).
A net upward displacement (similar to Figure 4-14) was invariably observed for all the
aggregate tests conducted at different levels of temperature and alkalinity (described in
details in Chapter 5). Therefore, it can be concluded that the dilatometer measures
volume expansion of test solution due to ASR in aggregate–solution test at the studied
temperatures (i.e., 60, 70, and 80°C) and alkalinity.
4.5.2.2 Chemical Shrinkage Testing
The chemical shrinkage test procedure and test results conducted by UT are presented in
Appendix C. No conclusive evidences for chemical shrinkage were observed. This
indirectly supports ASR expansion measurement in the dilatometer.
Figure 4-13 Displacement (inch.) over time for both aggregate-solution and
aggregate-water tests.
-0.08
-0.07
-0.06
-0.05
-0.04
-0.03
-0.02
-0.01
0
0 20 40 60 80 100 120
LV
DT
(in
ch.)
Time (hrs)
LVDT 3 - Agg -waterLVDT 4 - Agg -solutionLVDT 6 - Agg -solution
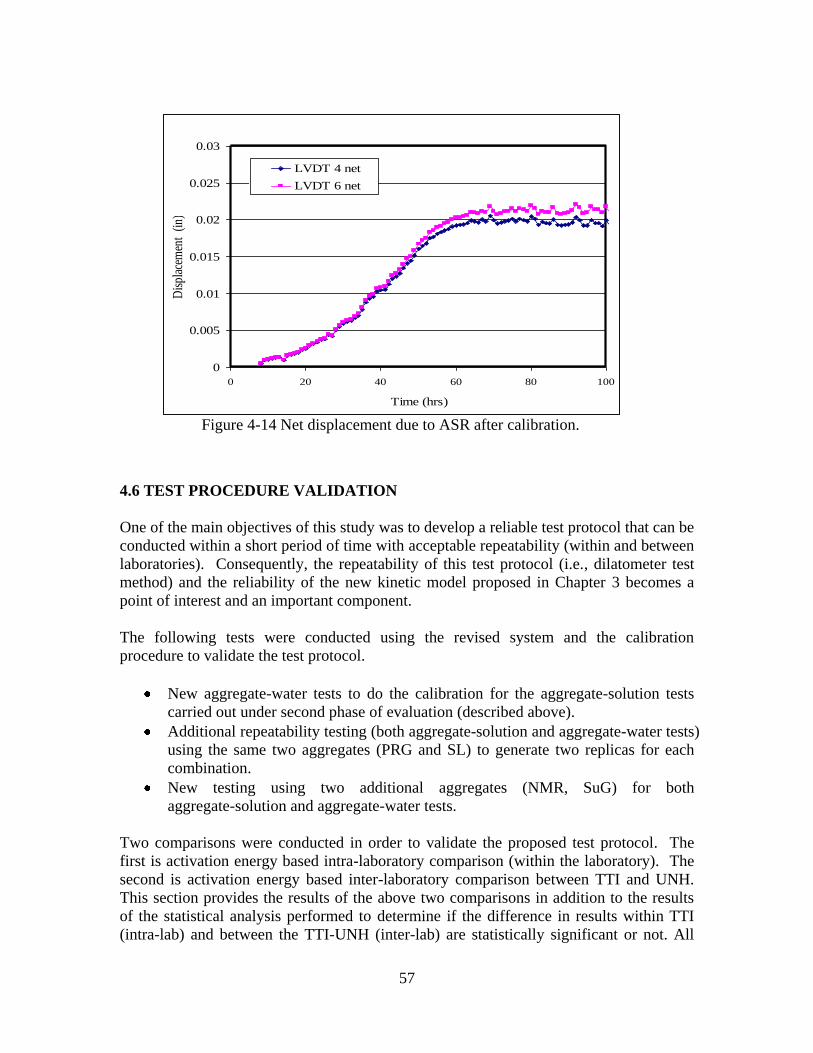
57
4.6 TEST PROCEDURE VALIDATION
One of the main objectives of this study was to develop a reliable test protocol that can be
conducted within a short period of time with acceptable repeatability (within and between
laboratories). Consequently, the repeatability of this test protocol (i.e., dilatometer test
method) and the reliability of the new kinetic model proposed in Chapter 3 becomes a
point of interest and an important component.
The following tests were conducted using the revised system and the calibration
procedure to validate the test protocol.
New aggregate-water tests to do the calibration for the aggregate-solution tests
carried out under second phase of evaluation (described above).
Additional repeatability testing (both aggregate-solution and aggregate-water tests)
using the same two aggregates (PRG and SL) to generate two replicas for each
combination.
New testing using two additional aggregates (NMR, SuG) for both
aggregate-solution and aggregate-water tests.
Two comparisons were conducted in order to validate the proposed test protocol. The
first is activation energy based intra-laboratory comparison (within the laboratory). The
second is activation energy based inter-laboratory comparison between TTI and UNH.
This section provides the results of the above two comparisons in addition to the results
of the statistical analysis performed to determine if the difference in results within TTI
(intra-lab) and between the TTI-UNH (inter-lab) are statistically significant or not. All
Figure 4-14 Net displacement due to ASR after calibration.
0
0.005
0.01
0.015
0.02
0.025
0.03
0 20 40 60 80 100
Time (hrs)
Dis
plac
emen
t (i
n)LVDT 4 net
LVDT 6 net

58
analysis was conducted using the Microsoft Excel software packages. The data for the
repeatability analysis is further elaborated in greater detail in discussion under Chapter 5.
4.6.1 Intra-Laboratory Comparisons
As mentioned previously in the experimental design, selected tests with different types of
aggregates were replicated twice to check the within laboratory repeatability. Average,
standard deviation, and coefficient of variation of Ea were determined for all the repeated
tests using SL, SuG and PRG aggregates at TTI (Table 4-3) and using SL and PRG at
UNH (Table 4-4). It can be seen from both TTI and UNH test results that the COV was
within 7 percent indicating that the results are highly repeatable. The detailed TTI test
results (expansion characteristics, activation energy calculation etc.) along with solution
chemistry results and interpretation are presented in Chapter 5. The UNH test data is
presented in Appendix D.
Table 4-3 Intra-laboratory comparisons based on Ea (TTI).
Aggregate
Type
Alkalinity
(NaOH)
Activation
Energy Average
( ) SD
( ) COV(%) =
Platt
River
Gravel (PRG)
1N 60.8, 55.3 58.08 3.90 6.72
0.5N 74.5, 79.5 77.04 3.52 4.57
1N + CH* 46.4, 44.8 45.64 1.15 2.52
0.5N +CH 56.6, 55.7 56.22 0.64 1.14
Sudbury Gravel
(SuG)
1N 44.6, 42.8 43.71 1.28 2.94
0.5N 48.4, 45.9 47.17 1.79 3.80
1N + CH 35.4, 32.7 34.09 1.97 5.78
0.5N +CH 38.4, 39.3 38.86 0.62 1.60
Spratt
Limestone (SL) 1 N
53.9, 52.5 53.2 1.01 1.9
ASTM C 1260 14 days expansion: SL – 0.35%, SuG – 0.30%, PRG – 0.28%
* CH = calcium hydroxide, SD = Standard deviation,
Table 4-4 Intra-laboratory comparisons based on Ea (UNH).*
Aggregate
Type
Alkalinity
(NaOH)
Activation
Energy
Average
( ) SD
( ) COV(%) =
PRG 1N 63.7, 69.0 66.4 3.74 5.65
Spratt
Limestone (SL) 1 N 55.6, 53.0 54.3 1.83 3.40
ASTM C 1260 14 days expansion: SL – 0.35%, PRG – 0.28%
SD = Standard deviation, * The UNH test data is shown in Appendix D

59
4.6.2 Inter-Laboratory Comparisons
To establish the inter-laboratory comparisons, UNH conducted the dilatometer test under
the same conditions as TTI for Platt River Gravel and Spratt Limestone using a 1N
NaOH test solution. The dilatometer test was conducted with air tight conditions.
Initially, there was a slight difference in the time of initiating air tight condition in the
system between TTI and UNH procedures. In the TTI procedure, airtight condition (i.e.,
closing all the junctions with O-rings) was established before placing the dilatometers
inside oven (i.e., before temperature stabilization) whereas airtight conditions were
established after the temperature stabilization (i.e., after 8-12 hours) in the UNH
procedure. Calibration was considered (discussed earlier) in order to remove the effect of
higher operating pressures (as a result of creating airtight conditions) as well as any
incomplete aggregate absorption. The advantage of the TTI procedure was not to disturb
the system after placing it inside the oven and recorded data. In the UNH procedure, it is
anticipated that the effect of the higher operating pressure was either removed or greatly
reduced and therefore, a calibration procedure was not needed. Expansion is measured in
both procedures with nearly similar trend (i.e., similar rate of expansion) with only slight
differences in the absolute expansion. It is observed that the effect of the higher operating
pressure was not consistently removed in UNH procedure which created some
inconsistency in the data. In order to establish an inter-laboratory comparison, a
concerted effort was undertaken to use the TTI procedure at both laboratories. A
summary of this comparison is presented in Table 4-5. As shown, the average activation
energy based coefficient of variation between two the laboratories for Platt River gravel
is within 10 percent. Therefore, this test procedure, although conducted in different
laboratories by different personnel, can produce reproducible results of activation energy.
Table 4-5 Inter-Laboratory comparisons of Ea (TTI versus UNH).*
Type of Aggregate Alkalinity
(NaOH)
Ea
TTI
Ea
UNH
Ea
Average
Standard
Deviation
Ea
COV
Platt River Gravel (PRG) 1N 58.08 66.4 62.24 5.88 9.45
Spratt Limestone (SL) 1N 53.2 54.3 53.75 0.78 2.00
* The UNH test data is shown in Appendix D.
4.6.2.1 Hypothesis Testing
A statistical analysis utilizing a hypothesis test using a student-t distribution (Gossett
1908) defining two populations between the TTI and UNH test data on PRG was
conducted to justify whether these means are similar or different. A ‗t‘ distribution is
used whenever there is insufficient sampling data to carry the analysis. The method
provided by Montgomery & Runger (2002) was used to analyze the results. The level of
significance ( ) for all hypothesis testing was 0.05 where is designated the Type 1
error probability. The Null hypothesis (Ho) assumes that the mean (Ea) for PRG at TTI is
equal to mean (Ea) of PRG at UNH and the alternate hypothesis (Ha) assumes that both
the means of PRG are different. If the t value obtained from statistical tables
(Montgomery & Runger, 2002) is less than the test statistics (T0), the null hypothesis
statement is rejected. On the other hand, if it is greater than or equal to T0, it can be

60
postulated that there is not enough evidence to reject the (Ho). The above statistical
procedure is outlined below in a step by step approach:
a
0 1 2 1 a
1 2 2 a
1. The parameter of interest is E , the activation energy of the aggregate
2. : ( is the population mean of E - TTI)
3. : ( is the population mean of E - UNH)
4. Significance le
a
H
H
1 2
02 2
1 2
1 2
0 a
( /2, ) 0 ( /2, )
( /2, )
vel (i.e. 5%)
X5. The Test Statistic is: T =
6. Reject H that the means of (E ) are equal if:
-t < T <t
:
t is the critical value of the t distrib
X
s s
n n
Where
2 221 2
1 2
2 2 2 2
1 1 2 2
1 2
ution and is the number of degrees of freedom
( )
= ( / ) ( / )
1 1
s s
n n
s n s n
n n
Results of the analysis are presented in Table 4-6. For the inter-laboratory comparison, it
can be seen from the hypothesis testing that there was not enough evidence to reject the
Ho since –t = -4.3 < T0 = -2.1 < t = 4.3. Since T0 falls within the acceptance region, it can
be concluded from a statistical point of view that activation energies determined by TTI
and UNH for PRG are equal.
The hypothesis tests were also conducted using the activation energies of PRG at
different alkalinities generated in a single laboratory (TTI) and included in Table 4-6.
The purpose was to check whether the activation energies at different alkalis are
significantly different from each other or not. The results show that for all the three cases,
the Ho was rejected (T0 falls within the rejection region), indicating that the means are
significantly different. Thus, it can be deduced that the new proposed protocol can
distinguish the aggregate based on their reactivity and can capture the effect of alkalinity
and CH on Ea. From the statistical analysis conducted on the mean Ea, this new test
protocol is seen to be highly repeatable and reliable.
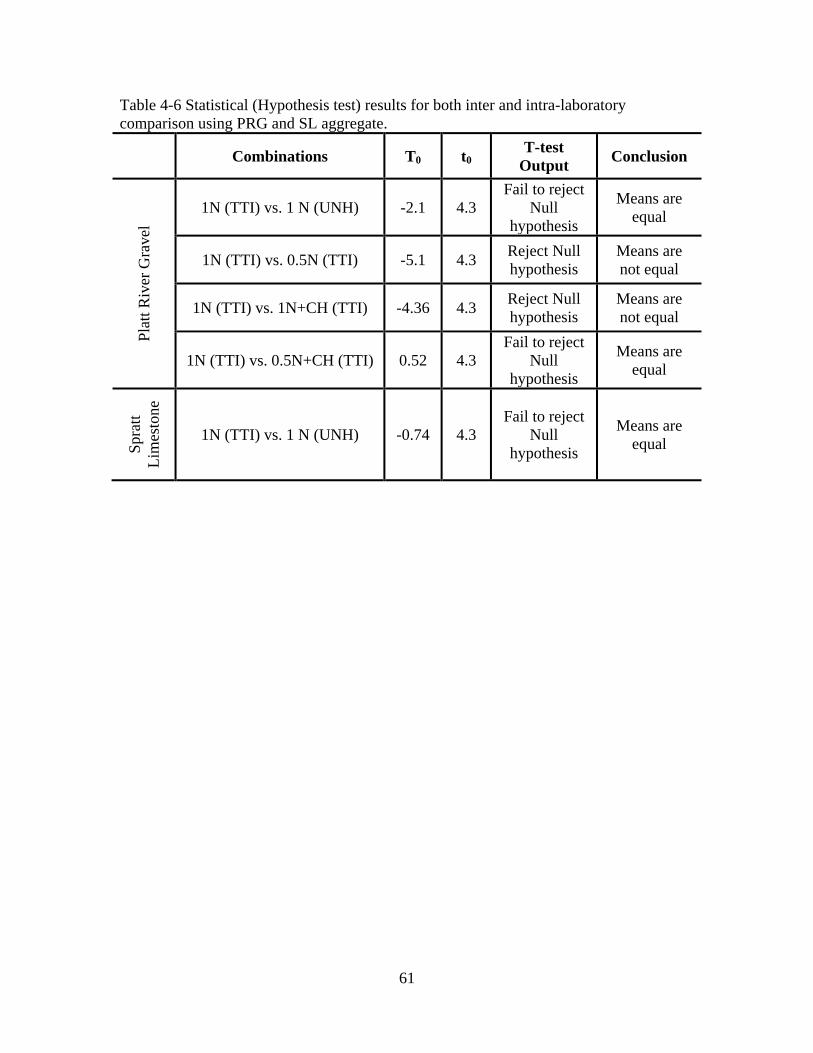
61
Table 4-6 Statistical (Hypothesis test) results for both inter and intra-laboratory
comparison using PRG and SL aggregate.
Combinations T0 t0 T-test
Output Conclusion
Pla
tt R
iver
Gra
vel
1N (TTI) vs. 1 N (UNH) -2.1 4.3
Fail to reject
Null
hypothesis
Means are
equal
1N (TTI) vs. 0.5N (TTI) -5.1 4.3 Reject Null
hypothesis
Means are
not equal
1N (TTI) vs. 1N+CH (TTI) -4.36 4.3 Reject Null
hypothesis
Means are
not equal
1N (TTI) vs. 0.5N+CH (TTI) 0.52 4.3
Fail to reject
Null
hypothesis
Means are
equal
Spra
tt
Lim
esto
ne
1N (TTI) vs. 1 N (UNH) -0.74 4.3
Fail to reject
Null
hypothesis
Means are
equal


63
CHAPTER 5
DETERMINATION OF KINETIC BASED AGGREGATE ALKALI
SILICA REACTIVITY USING DILATOMETRY
5.1 INTRODUCTION
As discussed in Chapter 2, the three basic criteria that needs to be satisfied in concrete for
ASR to occur and eventually become expansive are: a) presence of reactive siliceous
components (e.g., amorphous silica (e.g., opal), cryptocrystalline silica (e.g., chert, flint
etc.), strained quartz, volcanic glass etc.) in aggregate, b) sufficient alkalis–it is believed
that each aggregate has a characteristic level of alkalinity to initiate ASR or show
maximum ASR expansion (e.g., threshold alkalinity), and c) sufficient moisture–the RH
should be above 80 percent in order to make ASR expansive. Temperature is an
additional factor as the ASR reaction becomes faster (i.e., higher reaction rate) with
increasing temperature. Since the main objective of this research is to develop a
combined materials test procedure to mitigate ASR in concrete, the above factors with
their suitable levels were chosen in the experimental program to study their effect on
ASR.
5.2 EXPERIEMENTAL DESIGN
The effect of reactive silica was taken into account using the four different types of
aggregates previously mentioned in Chapter 4 which manifest a range of reactivity, i.e.,
New Mexico Rhyolite (NMR), Spratt Limestone (SL), Platt River Gravel (PRG) and
Sudbury Gravel (SuG). Alkaline solutions of three different levels of alkali concentration
(0.25 N NaOH, 0.5N NaOH and 1N NaOH) with and without Ca(OH)2 were selected to
cover both above and below the threshold alkalinity level. Calcium hydroxide (CH) was
added to the proposed NaOH solutions in order to simulate concrete pore solution
alkalinity as well as to consider effects of CH on ASR. To accelerate the development of
ASR, three levels of temperatures were chosen, i.e., 60°C, 70°C and 80°C. The design
factors and levels for aggregate testing are presented in Table 5-1. Physical layout of the
test runs are listed in Table 5-2.
Table 5-1 Experimental design factors and levels for aggregate testing.
Factors Levels Comments
Aggregate type 4 New Mexico Rhyolite (NMR), Platt River Gravel
(PRG), Spratt Limestone (SL), Sudbury Gravel (SuG)
Temperature 3 60, 70 and 80°C
Solution normality 3 0.25, 0.5, and 1N (with and without Ca(OH)2) Note-0.25N and 0.5N is slightly below and above pore
solution alkalinity respectively

64
Table 5-2 Physical layout of the test runs.
Tests Aggregate type Temperature
(°C)
Normality of
NaOH Solution
Ca(OH)2
1
NMR
60 1
With
2 70
3 80
4 60
0.5 5 70
6 80
7 60
0.25 8 70
9 80
10
PRG
60
1
Without
11 70
12 80
13 60
0.5 14 70
15 80
16
PRG
60
1
With
17 70
18 80
19 60
0.5 20 70
21 80
22 SuG 60 1
Without
23 70
24 80
25 60 0.5 26 70
27 80
28 SuG 60 1
With
29 70
30 80
31 60 0.5 32 70
33 80
34
SL
60
1 Without 35 70
36 80
* All tests were repeated twice to establish intra-laboratory comparison. Total 72
aggregate-solution test runs and 24 aggregate-water (calibration) test runs were conducted.
65
5.3 MATERIALS
A description of the individual aggregate in terms of mineralogy/reactive constituents,
gradation, and physical properties and relevant information pertaining to the chemicals
used, is provided below:
5.3.1 Aggregates
The four aggregates were selected from available record of alkali silica reactivity based
on ASTM C 1260/1293. A brief description of each aggregate is given below:
(a) New Mexico Rhyolite (NMR). This reactive aggregate was from the Las Placitas
Gravel Pit located in Bernalillo County in New Mexico. The major reactive
component of this aggregate is an acid volcanic glass that is highly reactive
(Barringer 2000). The 14 days ASTM C 1260 expansion is reported as
1.3 percent.
(b) Platt River Gravel (PRG). This aggregate was from Nebraska. The main reactive
constituent in this aggregate is strained quartz. The 14 days ASTM C 1260
expansion is reported as 0.28 percent.
(c) Spratt Limestone (SL). This aggregate came from the Spratt quarry in Ontario,
Canada. Like all sedimentary rocks, Spratt limestone is mainly composed of
calcite with small amount of dolomite. The microscopic chalcedony, and black
chert, present as minor constitutes (3-4 percent) in the matrix, are the reactive
constituent of this aggregate (Rogers 1999). The 14 days ASTM C 1260
expansion is reported as 0.38 percent.
(d) Sudbury Gravel (SuG). This aggregate is obtained from the Sudbury area of
Ontario, Canada. It is considered a slow/late reactive aggregate. The major
reactive component is microcrystalline quartz (Gillott et al. 1973). The 14 days
ASTM C 1260 expansion is reported as 0.3 percent.
To check if the aggregates selected meets ASTM C33 specification, a sieve analysis was
conducted on the four aggregates. The results are presented in Figure 5-1. As shown
from the gradation curves, NMR, SL and SuG falls within the limits specified by ASTM
C33 for coarse aggregate, while the PRG fall out of the specifications indicating the Platt
River Gravel is finer than conventional coarse aggregate and slightly coarser than sand.
The related physical properties (specific gravity, absorption capacity, unit weight) of the
four studied aggregates are measured and summarized in Table 5-3.

66
Figure 5-1 Gradation curves of the studied aggregates.
Table 5-3 Physical properties of the studied aggregates.
Aggregate
Property New Mexico
Rhyolite Platt River
Gravel Sudbury Gravel
Spratt
Limestone
Water absorption
(%) 1.06 0.72 0.50 0.64
Bulk specific
gravity (OD) 2.54 2.47 2.62 2.67
Bulk specific
gravity (SSD) 2.56 2.48 2.63 2.68
Dry Rodded Unit
Weight, lb/ft3 99.45 129.4 99.09 98.54
0
20
40
60
80
100
0.075 0.15 0.3 0.6 1.18 2.36 4.75 12.5 25.4 37.7 75
Sieve Size (mm)
% C
um
ula
tiv
e P
assi
ng
.
Spratt
Limestone
New Mexico
Rheolyte
Sudbury
Gravel
Fine Agg. Lower limit
(ASTM C33)
Fine Agg. Upper limit
(ASTM C33)
Sandy Gravel
Coarse Agg. Lower
limit (ASTM C33)
Coarse Agg.
Upper limit
(ASTM C33)
67
5.3.2 Sodium Hydroxide
The sodium hydroxide used in this project was obtained from Mallinckrodt Baker, Inc.,
Phillipburg, NJ. It is a white, high purity pellet with 99 to 100 weight percent NaOH
(Table 5-4).
Table 5-4 Physical and chemical properties of sodium hydroxide (pellet).
Property Description
Appearance White, deliquescent pellets or flakes
Odor Odorless
Solubility 111 g/100 g of water
Specific Gravity 2.13
pH 13 - 14 (0.5% soln.)
% Volatiles by volume @ 21C (70F) 0
Boiling Point 1390° C (25340 F)
Melting Point 318°C (6040 F)
Vapor Density (Air=1) > 1.0
Vapor Pressure (mm Hg) Negligible
5.4 TEST RESULTS
The four aggregates were tested using the dilatometer according to the physical layout in
Table 5-2 and characteristics ASR free volume expansion over time were measured. The
test results, analysis and interpretation from testing the four aggregates are presented in
this section. For each aggregate, the description begins with presenting ASR free volume
expansion as a function of time at different temperatures and alkalinities, followed by
presenting activation energy calculation and lastly, a discussion of the effect of test
conditions (calcium hydroxide, temperature and alkalinity) on the expansion behavior
and activation energy. Using the approach previously outlined, a compound ASR
activation energy of the aggregate was determined for each aggregate as a function of test
solution alkalinity. The results of the test solution chemistry before and after each test
and specific microstructures showing the reaction products in some selected specimens
are also included. Activation energy based aggregate ranking system was developed and
is also presented.
5.4.1 Expansion Characteristics and Activation Energy
This section presents the expansion characteristics followed by determination of rate
constants and activation energy for the four aggregates.
68
5.4.1.1 New Mexico Rhyolite (NMR)
For the NMR aggregate, the tests were conducted at three different alkalinities
(1N NaOH + CH, 0.5N NaOH + CH, and 0.25N NaOH + CH) to illustrate the effect of
alkalinity on ASR expansion. For each alkalinity, three tests were conducted at three
different temperatures (60, 70 and 80°C) to determine the rate constants and consequently
the compound activation energy of the NMR aggregate. Also, it should be stated here
that the addition of calcium hydroxide (CH) to the alkaline solution of NaOH was to
simulate the pore solution of the concrete and to study the effect (if any) of CH on the
ASR expansion since the role of CH is a point of controversy among researchers in the
field.
The measured time-expansion data of NMR are shown in Figures 5-2, 5-3 and 5-4. The
modeled volumetric expansions (based on the proposed model in Chapter 3) are
superimposed on the measured expansions in Figures 5-2–5-4. A reasonably good fit
between the measured and predicted expansion is manifested (Figures 5-2–5.4) and this
validates the applicability of the proposed model. As shown in Figures 5-2 through 5-4,
almost no expansion was measured till 10-12 hours. This was followed by a rapid
increase in volume expansion up to 40-60 hours and a slower increase thereafter. For
example, in 1N NaOH + CH solution at 80°C, the expansion was negligible in the first
5-7 hrs, followed by a sharp increase of expansion between 10-50 hrs, and then the
expansion curve followed a slow increase until 100 hours of testing. To illustrate the
effect of both temperature and alkalinity on NMR ASR, the characteristics ASR
parameters as a function of alkalinity and temperature were determined using equation
3-5 described in Chapter 3. All four parameters, i.e., the ultimate expansion ( 0 ), the
time scale parameter ( ), the theoretical initial time ( 0t ) and the rate constant ( ) as a
function of alkalinity and temperature are presented in Table 5-5.
Table 5-5 shows that the ultimate expansion increases with the increase of test solution
alkalinity. As for example, the ultimate expansion ( 0 ) at 60°C increases from
0.0418 percent at 0.25N + CH to 0.1030 percent at 1N + CH through 0.0695 percent at
0.5N + CH.
The effect of temperature on ASR characteristics is also clearly evident in Table 5-5. As
temperature increases, the ultimate expansions corresponding to all three levels of
alkalinity (e.g., 1N NaOH + CH, 0.5N NaOH + CH, 0.25N NaOH + CH) increase. This
is an indication that ASR is a thermally activated process. As a result, the rate of
reaction/rate constant should increase with temperature. Results in Table 5-5 are
consistent with this expectation. For example, the rate constants ( ) of NMR tested at
0.5N+CH are 0.87, 1.23 and 1.75 corresponding to temperature 60, 70 and 80°C
respectively.
The Ea was determined from the slope of the plot of Ln ( ) versus 1/T, i.e., by
multiplying the slope of the regression line by the gas constant. As shown from the three
plots of Ln ( ) versus 1/T (Figures 5-2d, 5-3d, 5-4d), the correlation coefficient (R2) is
69
around 0.99 for all the three tests conducted at three levels of alkalinities. This is an
indication that the procedure to determine rate constant based on the new model is very
effective. As a result, a clear linear dependency of the rate constant ( ) on temperature
is manifested.
The activation energy results are presented in Table 5-5. The Ea values are 34.28, 18.09
and 10.72 (KJ/mol) corresponding to 0.25N+CH, 0.5N+CH, and 1N+CH levels of
alkalinity. As alkalinity of the solution increases, the Ea decreases. Aggregate tests
conducted at high alkalinity (i.e., 1N+CH) needs less energy (10.72 KJ/mol) to initiate
ASR due to high concentration of hydroxyl ions in the solution. On the other hand, at
low alkalinity solution (i.e., 0.25N+CH) it needs high energy for ASR to occur (i.e.,
34.28 KJ/mol). From a practical point of view, it is important to determine the activation
energy corresponding to field level of alkalinity. These results indicate that the activation
energy of aggregate is a function of alkalinity. A procedure through the development of a
relationship between activation energy and alkalinity is developed in this direction and
presented later.
Table 5-5 The characteristics ASR parameters of New Mexico Rhyolite.
Aggregate Type
Alkalinity (NaOH)
Temp (C)
ASR Aggregate Parameters
0 (%) 0
t Ea
(KJ/mol)
New Mexico Rhyolite
0.25N + CH
60 0.0418 16.8 5.43 0.87
34.28 70 0.0537 12.6 5.40 1.23
80 0.0625 12.9 3.52 1.75
0.5N + CH
60 0.0695 21.8 0.52 1.82
18.09 70 0.1023 20.5 0.68 2.14
80 0.1070 13.3 1.85 2.64
1N + CH
60 0.1030 20.1 3.04 1.90
10.72 70 0.1134 16.4 1.65 2.13
80 0.1190 11.5 4.41 2.36
* CH = calcium hydroxide

70
(a) NMR expansion at 60°C (b) NMR expansion at 70°C
(c) NMR expansion at 80°C (d) Determination of activation energy
Figure 5-2 Expansion characteristics of NMR @ 1N NaOH + CH.
NMR
T = 60 C
1 N NaOH+CH
0
0.02
0.04
0.06
0.08
0.1
0.12
0.14
0.16
0 20 40 60 80 100
Time (hrs)
AS
R E
xp
ansi
on
(%
) .
Measured Exp Data
Calculated Exp Data
NMR
T = 70 C
1 N NaOH+CH
0
0.02
0.04
0.06
0.08
0.1
0.12
0.14
0.16
0 20 40 60 80 100
Time (hrs)
AS
R E
xp
an
sio
n (
%)
.
Measured Exp Data
Calculated Exp Data
NMR
T = 80 C
1 N NaOH+CH
0
0.02
0.04
0.06
0.08
0.1
0.12
0.14
0.16
0 20 40 60 80 100
Time (hrs)
AS
R E
xp
an
sio
n (
%)
.
Measured Exp Data
Calculated Exp Datay = -1289.5x + 4.5156
R2 = 0.9999
Ea = 10.72 KJ/mol
0.4
0.6
0.8
1.0
1.2
0.0028 0.0029 0.0029 0.0030 0.0030 0.0031
1/Temp
Ln (
Bet
a) .

71
(a) NMR expansion at 60°C (b) NMR expansion at 70°C
(c) NMR expansion at 80°C (d) Determination of activation energy
Figure 5-3 Expansion characteristics of NMR @ 0.5 N NaOH + CH.
NMR
T = 60 C
0.5 N NaOH+CH
0
0.02
0.04
0.06
0.08
0.1
0.12
0.14
0.16
0 20 40 60 80 100
Time (hrs)
AS
R E
xp
ansi
on
(%
) .
Measured Exp Data
Calculated Exp Data
NMR
T = 70 C
0.5 N NaOH+CH
0
0.02
0.04
0.06
0.08
0.1
0.12
0.14
0.16
0 20 40 60 80 100
Time (hrs)
AS
R E
xp
ansi
on
(%
) .
Measured Exp Data
Calculated Exp Data
NMR
T = 80 C
0.5 N NaOH+CH
0
0.02
0.04
0.06
0.08
0.1
0.12
0.14
0.16
0 20 40 60 80 100
Time (hrs)
AS
R E
xp
ansi
on
(%
) .
Measured Exp Data
Calculated Exp Datay = -2175.5x + 7.1249
R2 = 0.9902
Ea = 18.08 KJ/mol
0.4
0.6
0.8
1.0
1.2
0.0028 0.0029 0.0029 0.0030 0.0030 0.0031
1/Temp
Ln
(B
eta)
.

72
(a) NMR expansion at 60°C (b) NMR expansion at 70°C
(c) NMR expansion at 80°C (d) Determination of activation energy
Figure 5-4 Expansion characteristics of NMR @ 0.25N NaOH + CH.
NMR
T = 60 C
0.25 N NaOH+CH
0
0.02
0.04
0.06
0.08
0.1
0.12
0.14
0.16
0 20 40 60 80 100
Time (hrs)
AS
R E
xp
ansi
on
(%
) .
Measured Exp Data
Calculated Exp Data
NMR
T = 70 C
0.25 N NaOH+CH
0
0.02
0.04
0.06
0.08
0.1
0.12
0.14
0.16
0 20 40 60 80 100
Time (hrs)
AS
R E
xp
ansi
on
(%
) .
Measured Exp Data
Calculated Exp Data
NMR
T = 80 C
0.25 N NaOH+CH
0
0.02
0.04
0.06
0.08
0.1
0.12
0.14
0.16
0 20 40 60 80 100
Time (hrs)
AS
R E
xp
ansi
on
(%
) .
Measured Exp Data
Calculated Exp Data y = -4123x + 12.24
R2 = 0.9998
Ea = 34.28 KJ/mol
-0.4
-0.2
0.0
0.2
0.4
0.6
0.8
0.0028 0.0029 0.0029 0.0030 0.0030 0.0031
1/Temp
Ln
(B
eta)
.

73
5.4.1.2 Spratt Limestone (SL)
For the Spratt limestone, the tests were conducted at three different temperatures (60, 70
and 80°) and 1 N sodium hydroxide solution. Figure 5-5 shows the time expansion
history up to 100 hrs for SL. As shown in the figure, the plots at the beginning for all
three temperatures display similar trend, i.e., a small amount of chemical shrinkage may
have been detected initially (typically within the first 10-20 hr) but it is very quickly
dissipated by a sharp increase (especially at 80 and 70°C) up to 80 hrs due to the ASR gel
formation. The readings were almost stabilized at around 90-100 hrs for 60 and 70°C but
the increasing trend of expansion continued for 80°C beyond 90 hours. In general, an
irregular/step-wise LVDT movement was noticed with SL aggregate and this can
possibly be related with the inhomogeneous distribution of the reactive component in the
SL. It is reported that the reactive components (i.e., 3 to 4 percent of microscopic
chalcedony and black chert) are inhomogeneously distributed within the rock matrix of
SL (Rogers 1999). The calculated ASR expansion curves using the kinetic model are
superimposed on the measured expansion curves in Figure 5-5. It can be seen from the
plots that the model and measured pattern fit is reasonable but not as good as it is evident
with NMR aggregate.
The calculated ASR aggregate parameters at different temperatures based on the
modeling are presented in Table 5-6. The effect of temperature on the rate constant ( )
is clearly manifested. As shown in Table 5-6, the shows an increasing trend with
increasing temperature. The results are in accordance with our previous conclusion that
ASR is a thermally activated process in addition to alkalinity. The activation energy is
calculated from the linear relationship (R2
= 93.5 percent) between log ( ) and 1/T
(Figure 5-5d) and found to be 53.46 KJ/mol.
Table 5-6 Spratt Limestone characteristics.
Aggregate Type
Alkalinity (NaOH)
Temp
(°C)
ASR Aggregate Parameters
0 (%) 0
t Ea
(KJ/mol)
Spratt Limestone
1 N
60 0.033 51.5 7.16 0.98
53.46 70 0.032 31.8 4.21 2.21
80 0.039 45.2 3.12 2.92

74
(a) SL expansion at 60°C (b) SL expansion at 70°C
(c) SL expansion at 80°C (d) Determination of activation energy
Figure 5-5 Spratt Limestone (SL) (1 NaOH).
SL
T = 60 C
1 N NaOH
0
0.01
0.02
0.03
0.04
0.05
0.06
0 20 40 60 80 100
Time (hrs)
AS
R E
xp
ansi
on
(%
) .
Measured Exp Data
Calculated Exp Data
SL
T = 70 C
1 N NaOH
0
0.01
0.02
0.03
0.04
0.05
0.06
0 20 40 60 80 100
Time (hrs)
AS
R E
xp
ansi
on
(%
) .
Measured Exp Data
Calculated Exp Data
SL
T = 80 C
1 N NaOH
0
0.01
0.02
0.03
0.04
0.05
0.06
0 20 40 60 80 100
Time (hrs)
AS
R E
xp
ansi
on
(%
) .
Measured Exp Data
Calculated Exp Data
y = -6430.9x + 19.377
R2 = 0.935
Ea = 53.46 KJ/mol
-0.4
0.0
0.4
0.8
1.2
1.6
0.0028 0.0029 0.0029 0.0030 0.0030 0.0031
1/Temp
Ln
(B
eta
) .

75
5.4.1.3 Platt River Gravel (PRG)
For the PRG aggregate, tests were conducted at four different levels of alkalinities, i.e.,
(i) 1 N NaOH + CH, (ii) 1 N NaOH, (iii) 0.5 N NaOH + CH and (iv) 0.5 N NaOH. For
each alkalinity, three tests were conducted at three different temperatures (60, 70 and
80°C) to determine the activation energy. As mentioned earlier, strained quartz is the
reactive component in PRG. Figures 5-6–5.9 show the measured as well as calculated
volumetric expansion of Platt river gravel as a function of time. A good fit between
calculated and measured expansion for all the combinations of four levels of alkalinity
and 3 levels of temperature is strongly evident. The modeled aggregate ASR parameters
are presented in Table 5-7. The following observations are made after analyzing the
results:
The ultimate measured expansion is a function of both alkalinity of the test
solution as well as its temperature. In general, the higher the
alkalinity/temperature the higher is the ultimate expansion, which is in accordance
with the observation made with NMR aggregate (described earlier). Both 0
(percent) and increase with increasing temperature and vice versa.
Another important general observation is that the presence of Ca(OH)2 makes the
ultimate expansion higher than that without Ca(OH)2. It is to be noted that
expansion without CH (tests with only NaOH solutions) was also measured. This
is an indication that CH can aggravate the expansion conditions but it‘s not a
primary factor to initiate ASR. This may be the same effect deicers have on ASR
in concrete.
To determine the Ea of PRG, the rate constant was plotted against (1/T), and linear
regression analysis was carried out (Figure 5-6d, 5-7d, 5-8d and 5-9d). The coefficient of
regression (R2) was 0.99 meaning the proposed rate function for ASR expansion
represents the data trends well. As shown in Table 5-7, the Ea for PRG was equal to
60.84, 74.55, 46.46, and 56.68 KJ/mol corresponding to 1N NaOH, 0.5N NaOH, 1N
NaOH + CH and 0.5N NaOH + CH respectively. It can be seen from the results that the
Ea decreases as the alkalinity of solution increases for both with and without CH. The
results are reasonable and suggest that less energy (46.46 KJ/mol) is required at higher
alkalinity (1N+CH) to overcome the barrier to initiate ASR. On the other hand, at lower
alkalinity (0.5N+CH), the system needs more energy to overcome the barrier and thus the
Ea is higher (56.68 kJ/mol). Therefore, a relationship exists between the alkalinity of test
solution and Ea of the aggregate. The effect of CH is reflected in the compound
activation energy. An increase in expansion due to the presence of CH is manifested as a
reduction in compound activation energy.
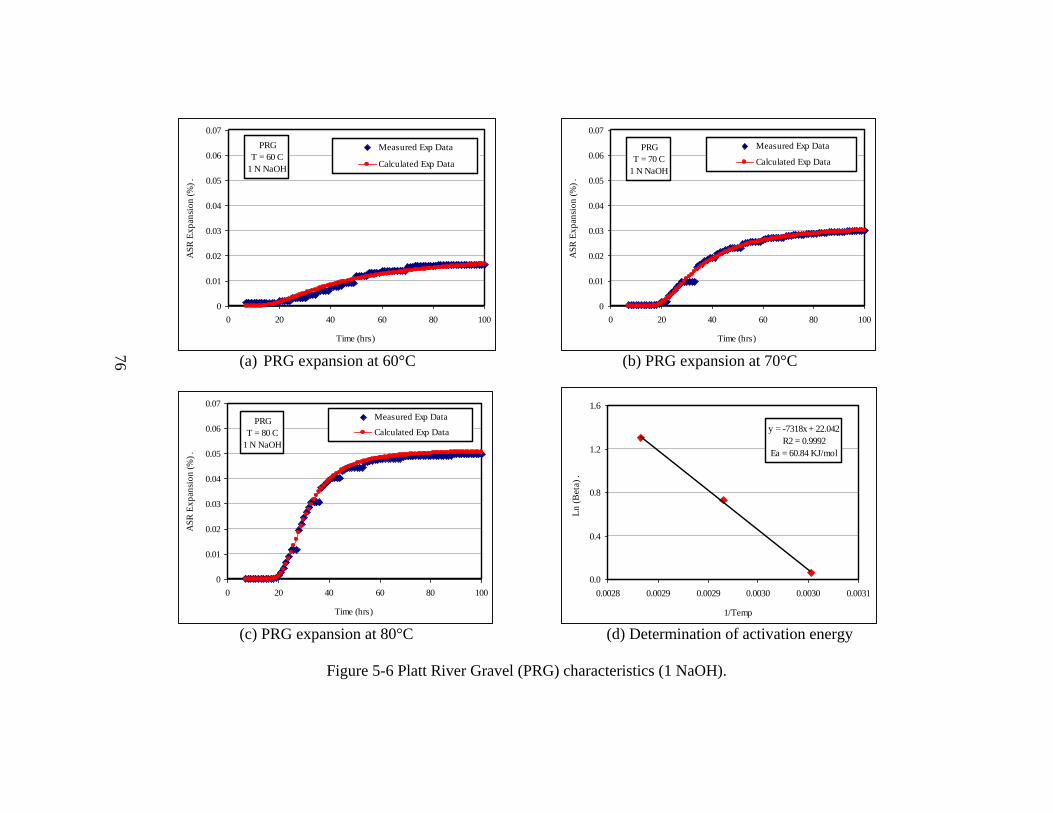
76
(a) PRG expansion at 60°C (b) PRG expansion at 70°C
(c) PRG expansion at 80°C (d) Determination of activation energy
Figure 5-6 Platt River Gravel (PRG) characteristics (1 NaOH).
PRG
T = 60 C
1 N NaOH
0
0.01
0.02
0.03
0.04
0.05
0.06
0.07
0 20 40 60 80 100
Time (hrs)
AS
R E
xp
ansi
on
(%
) .
Measured Exp Data
Calculated Exp Data
PRG
T = 70 C
1 N NaOH
0
0.01
0.02
0.03
0.04
0.05
0.06
0.07
0 20 40 60 80 100
Time (hrs)
AS
R E
xp
ansi
on
(%
) .
Measured Exp Data
Calculated Exp Data
PRG
T = 80 C
1 N NaOH
0
0.01
0.02
0.03
0.04
0.05
0.06
0.07
0 20 40 60 80 100
Time (hrs)
AS
R E
xp
ansi
on
(%
) .
Measured Exp Data
Calculated Exp Data y = -7318x + 22.042
R2 = 0.9992
Ea = 60.84 KJ/mol
0.0
0.4
0.8
1.2
1.6
0.0028 0.0029 0.0029 0.0030 0.0030 0.0031
1/Temp
Ln
(B
eta
) .

77
(a) PRG expansion at 60°C (b) PRG expansion at 70°C
(c) PRG expansion at 80°C (d) Determination of activation energy
Figure 5-7 Platt River Gravel (PRG) characteristics (0.5 NaOH).
PRG
T = 60 C
0.5 N NaOH
0
0.01
0.02
0.03
0.04
0.05
0.06
0.07
0 20 40 60 80 100
Time (hrs)
AS
R E
xp
ansi
on
(%
) .
Measured Exp Data
Calculated Exp Data
PRG
T = 70 C
0.5N NaOH
0
0.01
0.02
0.03
0.04
0.05
0.06
0.07
0 20 40 60 80 100
Time (hrs)
AS
R E
xp
ansi
on
(%
) .
Measured Exp Data
Calculated Exp Data
PRG
T = 80 C
0.5 N NaOH
0
0.01
0.02
0.03
0.04
0.05
0.06
0.07
0 20 40 60 80 100
Time (hrs)
AS
R E
xp
ansi
on
(%
) .
Measured Exp Data
Calculated Exp Datay = -8966.5x + 26.937
R2 = 0.9999
Ea = 74.54 KJ/mol
-0.4
0.0
0.4
0.8
1.2
1.6
2.0
0.0028 0.0029 0.0029 0.0030 0.0030 0.0031
1/Temp
Ln
(B
eta
) .

78
(a) PRG expansion at 60°C (b) PRG expansion at 70°C
(c) PRG expansion at 80°C (d) Determination of activation energy
Figure 5-8 Platt River Gravel (PRG) characteristics (1 NaOH + CH).
PRG
T = 60 C
1 N NaOH+CH
0
0.01
0.02
0.03
0.04
0.05
0.06
0.07
0 20 40 60 80 100
Time (hrs)
AS
R E
xp
ansi
on
(%
) .
Measured Exp Data
Calculated Exp Data
PRG
T = 70 C
1 N NaOH+CH
0
0.01
0.02
0.03
0.04
0.05
0.06
0.07
0 20 40 60 80 100
Time (hrs)
AS
R E
xp
ansi
on
(%
) .
Measured Exp Data
Calculated Exp Data
PRG
T = 80 C
1 N NaOH+CH
0
0.01
0.02
0.03
0.04
0.05
0.06
0.07
0 20 40 60 80 100
Time (hrs)
AS
R E
xp
ansi
on
(%
) .
Measured Exp Data
Calculated Exp Data
y = -5588.3x + 17.066
R2 = 0.9865
Ea = 46.46 KJ/mol
0.0
0.4
0.8
1.2
1.6
0.0028 0.0029 0.0029 0.0030 0.0030 0.0031
1/Temp
Ln
(B
eta
) .
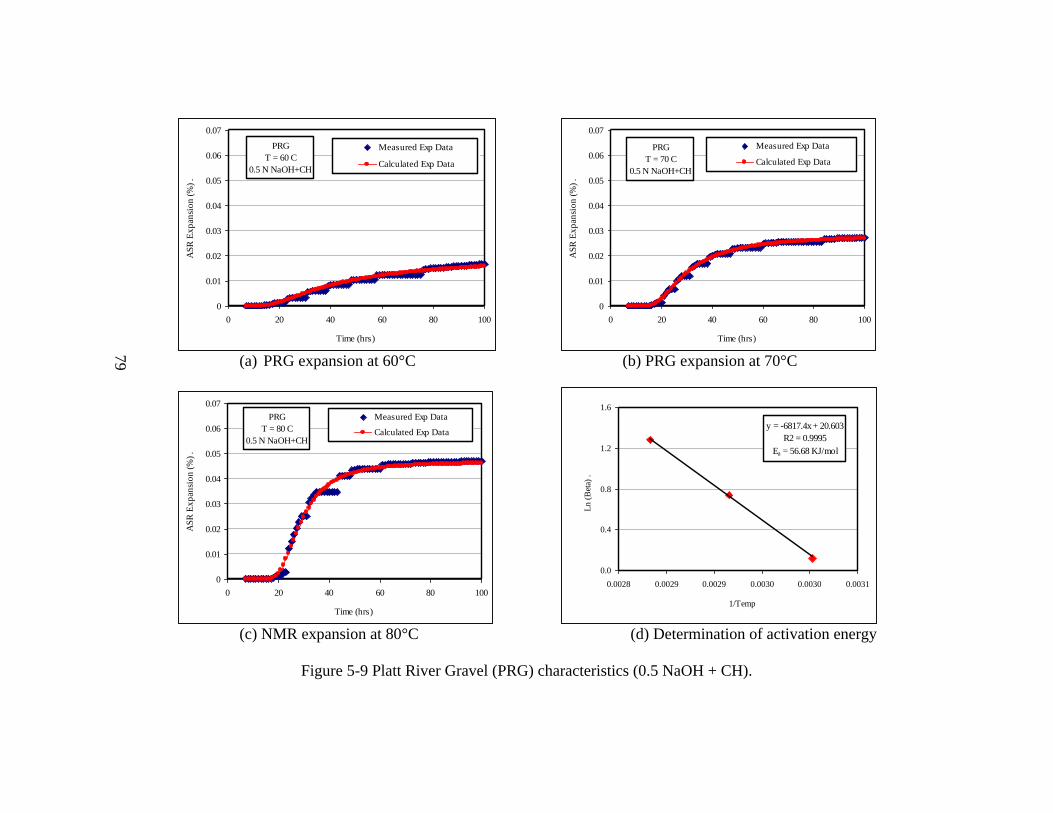
79
(a) PRG expansion at 60°C (b) PRG expansion at 70°C
(c) NMR expansion at 80°C (d) Determination of activation energy
Figure 5-9 Platt River Gravel (PRG) characteristics (0.5 NaOH + CH).
PRG
T = 60 C
0.5 N NaOH+CH
0
0.01
0.02
0.03
0.04
0.05
0.06
0.07
0 20 40 60 80 100
Time (hrs)
AS
R E
xp
ansi
on
(%
) .
Measured Exp Data
Calculated Exp Data
PRG
T = 70 C
0.5 N NaOH+CH
0
0.01
0.02
0.03
0.04
0.05
0.06
0.07
0 20 40 60 80 100
Time (hrs)
AS
R E
xp
ansi
on
(%
) .
Measured Exp Data
Calculated Exp Data
PRG
T = 80 C
0.5 N NaOH+CH
0
0.01
0.02
0.03
0.04
0.05
0.06
0.07
0 20 40 60 80 100
Time (hrs)
AS
R E
xp
ansi
on
(%
) .
Measured Exp Data
Calculated Exp Datay = -6817.4x + 20.603
R2 = 0.9995
Ea = 56.68 KJ/mol
0.0
0.4
0.8
1.2
1.6
0.0028 0.0029 0.0029 0.0030 0.0030 0.0031
1/Temp
Ln (
Bet
a) .

80
Table 5-7 Platt River Gravel characteristics.
Aggregate Type
Alkalinity (NaOH)
Temp
(°C)
ASR Aggregate Parameters
0 (%) 0
t Ea
(KJ/mol)
Platt River
Gravel
1N
60 0.024 37.6 5.33 1.05
60.84 70 0.031 24.2 5.88 2.06
80 0.049 25.4 2.01 3.67
0.5N
60 0.027 45.1 5.21 1.00
74.55 70 0.024 18.0 5.85 2.23
80 0.041 23.5 1.13 4.63
1N + CH
60 0.030 33.2 4.30 1.37
46.46 70 0.036 25.0 5.91 2.03
80 0.053 25.9 2.20 3.55
0.5N + CH
60 0.022 35.8 5.02 1.13
56.68 70 0.027 20.4 5.86 2.10
80 0.045 24.0 2.16 3.60
* CH = calcium hydroxide
5.4.1.4 Sudbury Gravel (SuG)
The SuG was also tested at four levels of alkalinity (1 NaOH + CH, 0.5 NaOH + CH, 1
NaOH, 0.5 NaOH) and three temperatures (60°C, 70°C and 80°C) in order to determine
activation energy at different levels of alkalinity. The reactive component in SuG is
mainly microcrystalline quartz (Gillott et al. 1973).
The expansion data as a function of time for SuG are presented in Figures 5-10–5-13
corresponding to tests conducted at 1 NaOH, 0.5 NaOH, 1 NaOH + CH and 0.5 NaOH +
CH respectively. All tests were conducted for a period of four days. It can be seen from
the figures that all the expansion curves follow an S-shape pattern (similar to NMR, SL,
PRG aggregates), i.e., very low or negligible expansion at the initial hours (0-15 hrs)
followed by a steep rise in expansion between 20-70 hrs and a slow increase in expansion
thereafter.
The modeled aggregate ASR parameters are presented in Table 5-8. The same general
observation, i.e., the higher the alkalinity/temperature the higher is the ultimate expansion,
is observed in SuG aggregate. The presence of Ca(OH)2 makes the ultimate expansion
higher than without Ca(OH)2, which is similar to the observation made with PRG
previously.
The activation energy for SuG was calculated from ln( ) versus (1/T) plots
corresponding to all four levels of alkalinity (Figures 5-10d, 5-11d, 5-12d and 5-13d).
The coefficient of regression (R2) varies from 0.95-0.99, which once again indicates that
the new proposed kinetic model is very effective approach to derive rate constants from

81
dilatometer measured expansion data. As shown from Table 5-8, the Ea for SuG was
equal to 44.62, 48.44, 35.49 and 38.42 KJ/mol corresponding to the 1N NaOH, 0.5N
NaOH, 1N NaOH + CH and 0.5N NaOH + CH solutions respectively. The results
indicate that the activation energy of aggregate is inversely proportional to alkalinity of
the test solution, i.e., the higher the alkalinity the lower is the activation energy. This
suggests that a relationship between the two parameters can be established, which will be
very useful in detecting the reactivity of aggregate in concrete subjected to different level
of alkalinity. The effect of CH is manifested indirectly as reduction in activation energy
(same as PRG).
Table 5-8 Sudbury Gravel characteristics.
Aggregate Type
Alkalinity (NaOH)
Temp
(°C)
ASR Aggregate Parameters
0 (%) 0
t Ea
(KJ/mol)
Sudbury Gravel
1N
60 0.019 31.2 3.70 1.57
44.62 70 0.029 22.2 5.61 2.2
80 0.054 27.5 1.29 3.94
0.5N
60 0.016 32.7 4.59 1.32
48.44 70 0.030 24.5 5.89 2.05
80 0.048 24.3 2.17 3.57
1N + CH
60 0.025 30.7 3.31 1.67
35.49 70 0.034 23.6 5.85 2.10
80 0.059 25.4 2.75 3.47
0.5N + CH
60 0.020 32.1 4.14 1.44
38.42 70 0.036 24.2 5.88 2.07
80 0.057 27.1 3.20 3.17
* CH = calcium hydroxide

82
(a) SuG expansion at 60°C (b) SuG expansion at 70°C
(c) SuG expansion at 80°C (d) Determination of activation energy
Figure 5-10 Sudbury Gravel (SuG) characteristics (1 NaOH).
SuG
T = 60 C
1 N NaOH
0
0.01
0.02
0.03
0.04
0.05
0.06
0.07
0 20 40 60 80 100
Time (hrs)
AS
R E
xp
ansi
on
(%
) .
Measured Exp Data
Calculated Exp Data
SuG
T = 70 C
1 N NaOH
0
0.01
0.02
0.03
0.04
0.05
0.06
0.07
0 20 40 60 80 100
Time (hrs)
AS
R E
xp
ansi
on
(%
) .
Measured Exp Data
Calculated Exp Data
SuG
T = 80 C
1 N NaOH
0
0.01
0.02
0.03
0.04
0.05
0.06
0.07
0 20 40 60 80 100
Time (hrs)
AS
R E
xp
ansi
on
(%
) .
Measured Exp Data
Calculated Exp Data
y = -5367.7x + 16.538
R2 = 0.9779
Ea = 44.63 KJ/mol
0.0
0.4
0.8
1.2
1.6
0.0028 0.0029 0.0029 0.0030 0.0030 0.0031
1/Temp
Ln
(B
eta
) .
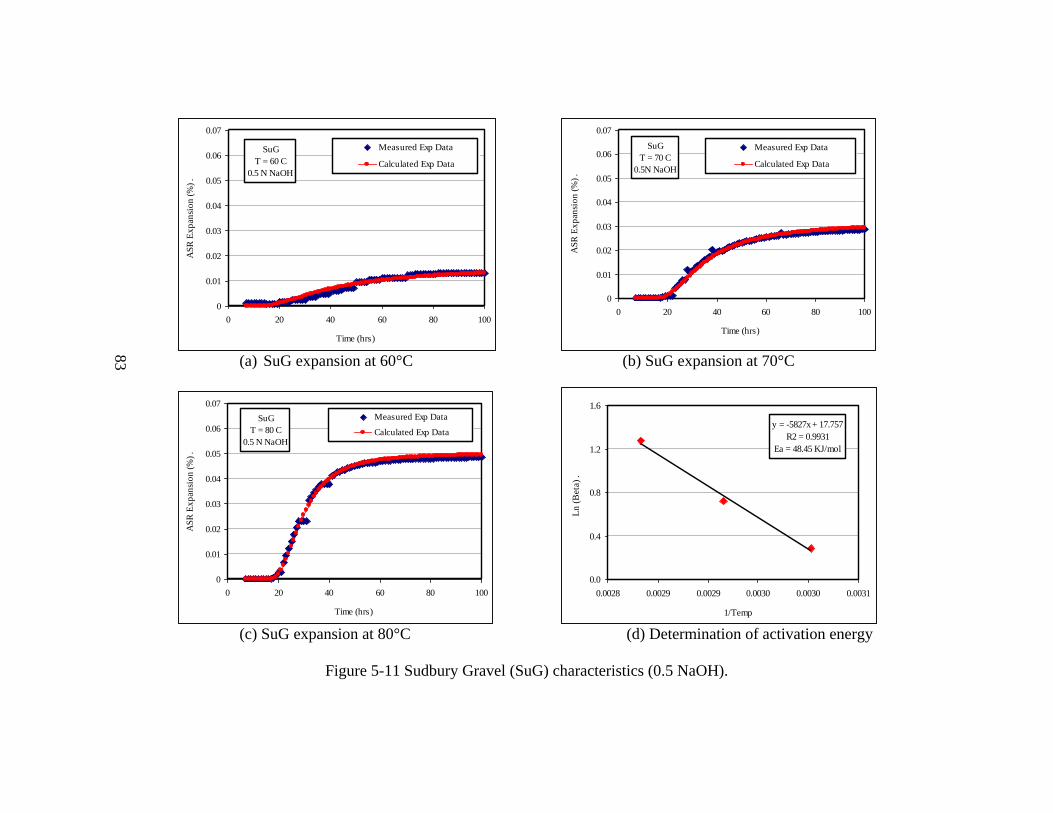
83
(a) SuG expansion at 60°C (b) SuG expansion at 70°C
(c) SuG expansion at 80°C (d) Determination of activation energy
Figure 5-11 Sudbury Gravel (SuG) characteristics (0.5 NaOH).
SuG
T = 60 C
0.5 N NaOH
0
0.01
0.02
0.03
0.04
0.05
0.06
0.07
0 20 40 60 80 100
Time (hrs)
AS
R E
xp
ansi
on
(%
) .
Measured Exp Data
Calculated Exp Data
SuG
T = 70 C
0.5N NaOH
0
0.01
0.02
0.03
0.04
0.05
0.06
0.07
0 20 40 60 80 100
Time (hrs)
AS
R E
xp
ansi
on
(%
) .
Measured Exp Data
Calculated Exp Data
SuG
T = 80 C
0.5 N NaOH
0
0.01
0.02
0.03
0.04
0.05
0.06
0.07
0 20 40 60 80 100
Time (hrs)
AS
R E
xp
ansi
on
(%
) .
Measured Exp Data
Calculated Exp Datay = -5827x + 17.757
R2 = 0.9931
Ea = 48.45 KJ/mol
0.0
0.4
0.8
1.2
1.6
0.0028 0.0029 0.0029 0.0030 0.0030 0.0031
1/Temp
Ln
(B
eta
) .

84
(a) SuG expansion at 60°C (b) SuG expansion at 70°C
(c) SuG expansion at 80°C (d) Determination of activation energy
Figure 5-12 Sudbury Gravel (SuG) characteristics (1 NaOH + CH).
SuG
T = 60 C
1 N NaOH+CH
0
0.01
0.02
0.03
0.04
0.05
0.06
0.07
0 20 40 60 80 100
Time (hrs)
AS
R E
xp
ansi
on
(%
) .
Measured Exp Data
Calculated Exp Data
SuG
T = 70 C
1 N NaOH+CH
0
0.01
0.02
0.03
0.04
0.05
0.06
0.07
0 20 40 60 80 100
Time (hrs)
AS
R E
xp
ansi
on
(%
) .
Measured Exp Data
Calculated Exp Data
SuG
T = 80 C
1 N NaOH+CH
0
0.01
0.02
0.03
0.04
0.05
0.06
0.07
0 20 40 60 80 100
Time (hrs)
AS
R E
xp
ansi
on
(%
) .
Measured Exp Data
Calculated Exp Data
y = -4269.3x + 13.289
R2 = 0.9468
Ea = 35.5 KJ/mol
0.0
0.4
0.8
1.2
1.6
0.0028 0.0029 0.0029 0.0030 0.0030 0.0031
1/Temp
Ln
(B
eta
) .

85
(a) SuG expansion at 60°C (b) SuG expansion at 70°C
(c) SuG expansion at 80°C (d) Determination of activation energy
Figure 5-13 Sudbury Gravel (SuG) characteristics (0.5 NaOH + CH).
SuG
T = 60 C
0.5 N NaOH+CH
0
0.01
0.02
0.03
0.04
0.05
0.06
0.07
0 20 40 60 80 100
Time (hrs)
AS
R E
xp
ansi
on
(%
) .
Measured Exp Data
Calculated Exp Data
SuG
T = 70 C
0.5 N NaOH+CH
0
0.01
0.02
0.03
0.04
0.05
0.06
0.07
0 20 40 60 80 100
Time (hrs)
AS
R E
xp
ansi
on
(%
) .
Measured Exp Data
Calculated Exp Data
SuG
T = 80 C
0.5 N NaOH+CH
0
0.01
0.02
0.03
0.04
0.05
0.06
0.07
0 20 40 60 80 100
Time (hrs)
AS
R E
xp
ansi
on
(%
) .
Measured Exp Data
Calculated Exp Data
y = -1289.5x + 4.5156
R2 = 0.9999
Ea = 38.43 KJ/mol
0.0
0.4
0.8
1.2
1.6
0.0028 0.0029 0.0029 0.0030 0.0030 0.0031
1/Temp
Ln
(B
eta
) .

86
In general, all the studied aggregates showed an increase in volumetric expansion with an
S-shaped pattern as a function of time.
5.4.2 Effect of Test Condition on ASR Expansion Behavior
The effect of test conditions (e.g., temperature, alkalinity, CH) on the modeled ASR
parameters is discussed below in terms of alkalinity, temperature, CH, and chemistry of
the test solution.
5.4.2.1 Effect of Alkalinity
The increase in volumetric expansion with increasing alkalinity is observed for all the
four tested aggregates. The higher the alkalinity the higher is the hydroxyl ion
concentrations in the solution. For example, the amount of hydroxyl ions in 1N + CH
solution is almost double than that at 0.5N + CH solution. As more OH- ions are
available, the reaction sites around the aggregates increase leading to a quicker chemical
reaction and this in turn leads to the formation to a large quantity of gel, and thus higher
expansion. The degree of heterogeneity and the nature of distribution of the reactive
constituent(s) in aggregate sometimes may cause some deviation from the above
explanation.
The percentage increase of ultimate expansion and rate constant ( ) with increasing
alkalinity is presented in Table 5-9. In general, the higher the alkalinity the higher is the
ultimate expansion. The ultimate expansion shows higher percentage increase
(66-91 percent, Table 5-9) with increasing alkalinity from 0.25N NaOH +CH to 0.5N
NaOH + CH whereas it shows relatively lower percentage increase (11-48 percent) when
alkalinity increases from 0.5N NaOH + CH to 1N NaOH + CH in NMR. The same lower
percentage increase of ultimate expansion is also evident in PRG (15-29 percent) and
SuG (4-25 percent) when alkalinity increases from 0.5 N NaOH to 1N NaOH with and
without CH. This possibly indicates that each aggregate has a specific level of alkalinity
(e.g., threshold alkalinity) where it shows the maximum reaction and alkali level above
the threshold level doesn‘t necessarily ensure a proportional increase of
reaction/expansion.
Similar to the ultimate expansion, is more sensitive when alkalinity changes from low
to intermediate concentration but become less sensitive (lesser than ultimate expansion)
when alkalinity changes from intermediate (0.5N NaOH + CH) to high concentration (1N
NaOH + CH). Therefore, the relationship between and alkalinity is not strong enough
to serve as a meaningful ASR related parameter. In other words, ASR is more
accelerated by thermal activation rather than alkali activation as in other chemical
reactions.

87
Table 5-9 Percentage increase of ultimate expansion and β as a function of alkalinity.
From 0.25N to
0.5N (NaOH+CH) From 0.5N to
1N (NaOH+CH) From 0.25N to
1N (NaOH+CH) From 0.5N to
1N NaOH Aggr.
Type Temp
(°C) Ult. Exp Ult. Exp Ult. Exp Ult. Exp
NMR 60 66 109 48 4 146 118
70 91 74 11 -1 111 73
80 71 51 11 -11 90 35 PRG 60 27 18 -11 5
70 25 -3 29 -7
80 15 -2 20 -
21 SuG 60 25 16 19 19
70 -6 2 -3 7
80 4 10 13
10
5.4.2.2 Effect of Temperature
It is known that the rate of reaction depends on the temperature. The rate of reaction and
the rate constant ( ) are essentially directly related. The effect of temperature on and
on the theoretical initiation time of ASR ( 0t ) is presented in Figures 5-14 and 5-15
respectively. As shown in Figure 5-14, for all the four tested aggregates at different
levels of alkalinity obeys an increasing trend with increasing temperature. The
dependence of on temperature can be explained by the collision theory (Ebbings et al.
2005). The percentage increase of and ultimate expansion with increasing temperature
is presented in Table 5-10. The Table 5-10 shows that proportionally increases with
temperature for all the studied aggregates. NMR aggregate shows relatively lower
percentage increase of in comparison with other 3 aggregates when temperatures
increase from 60 to 80°C. A higher percentage increase of with temperature increase
(60 to 80°C) provides larger slope in 1/T vs. plot (discussed in the previous section)
and hence give rise to higher activation energy. Similarly, a lower percentage increase of
is related to lower activation energy and higher reactivity. The percentage increase of
and activation energy (discussed earlier) both rank the tested aggregates in the same
order, i.e., New Mexico Rhyolite is the most reactive among all aggregates tested,
followed by Spratt Limestone, Sudbury Gravel and then Platt River Gravel.
The ultimate expansion also increases with increasing temperatures for all the tested
mixtures (Table 5-10). However, the percentage increase of ultimate expansion is not
useful to rank the tested aggregates in the same order determined by percentage increase
of (or activation energy) above. It is interesting here to mention here that a decision
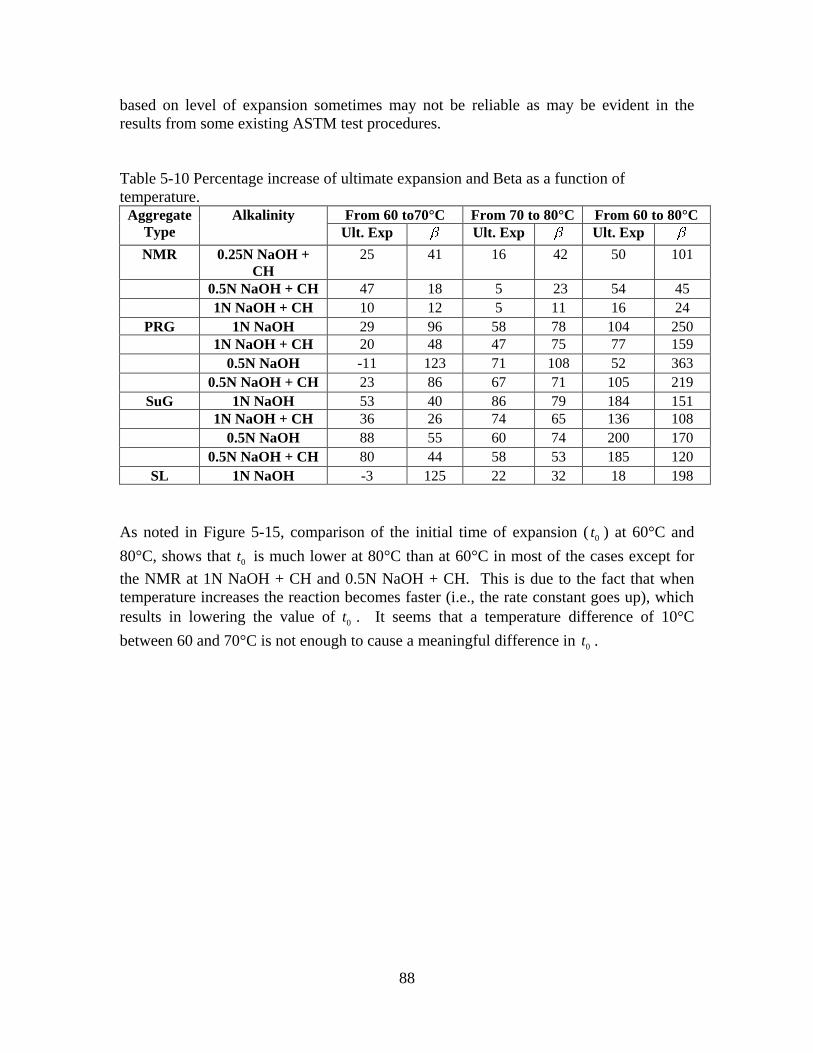
88
based on level of expansion sometimes may not be reliable as may be evident in the
results from some existing ASTM test procedures.
Table 5-10 Percentage increase of ultimate expansion and Beta as a function of
temperature. Aggregate
Type Alkalinity From 60 to70°C From 70 to 80°C From 60 to 80°C
Ult. Exp Ult. Exp Ult. Exp
NMR 0.25N NaOH +
CH 25 41 16 42 50 101
0.5N NaOH + CH 47 18 5 23 54 45
1N NaOH + CH 10 12 5 11 16 24
PRG 1N NaOH 29 96 58 78 104 250
1N NaOH + CH 20 48 47 75 77 159
0.5N NaOH -11 123 71 108 52 363
0.5N NaOH + CH 23 86 67 71 105 219
SuG 1N NaOH 53 40 86 79 184 151
1N NaOH + CH 36 26 74 65 136 108
0.5N NaOH 88 55 60 74 200 170
0.5N NaOH + CH 80 44 58 53 185 120
SL 1N NaOH -3 125 22 32 18 198
As noted in Figure 5-15, comparison of the initial time of expansion ( 0t ) at 60°C and
80°C, shows that 0t is much lower at 80°C than at 60°C in most of the cases except for
the NMR at 1N NaOH + CH and 0.5N NaOH + CH. This is due to the fact that when
temperature increases the reaction becomes faster (i.e., the rate constant goes up), which
results in lowering the value of 0t . It seems that a temperature difference of 10°C
between 60 and 70°C is not enough to cause a meaningful difference in 0t .

89
(a) New Mexico Rhyolite (b) Platt River Gravel
(c) Sudbury Gravel (d) Spratt Limestone
Figure 5-14 Effect of temperature on the rate constant (Beta).
New Mexico Rhyolite
1.9 1.8
0.9
2.1 2.1
1.2
2.42.6
1.8
0
1
2
3
4
1 N NaOH+CH 0.5 N NaOH+CH 0.25 N NaOH+CH
Alkalinity
Rat
e C
on
stan
t (B
eta)
.
T = 60C
T = 70C
T = 80C
Platt River Gravel
1.1 1.01.4 1.1
2.1 2.2 2.0 2.1
3.7
4.6
3.6 3.6
0
2
4
6
1 N NaOH 0.5 N NaOH 1N NaOH+CH 0.5N NaOH+CH
Alkalinity
Rate
Co
nst
an
t (B
eta
).
T = 60C
T = 70C
T = 80C
Sudbury Gravel
1.6 1.31.7 1.4
2.2 2.1 2.1 2.1
3.93.6 3.5
3.2
0
2
4
6
1 N NaOH 0.5 N NaOH 1N NaOH+CH 0.5N NaOH+CH
Alkalinity
Rate
Co
nst
an
t (B
eta
).
T = 60C
T = 70C
T = 80C
Spratt Limestone
1.0
2.2
2.9
0
2
4
6
1 N NaOH
Alkalinity
Rate
Co
nst
an
t (B
eta
).
T = 60C
T = 70C
T = 80C
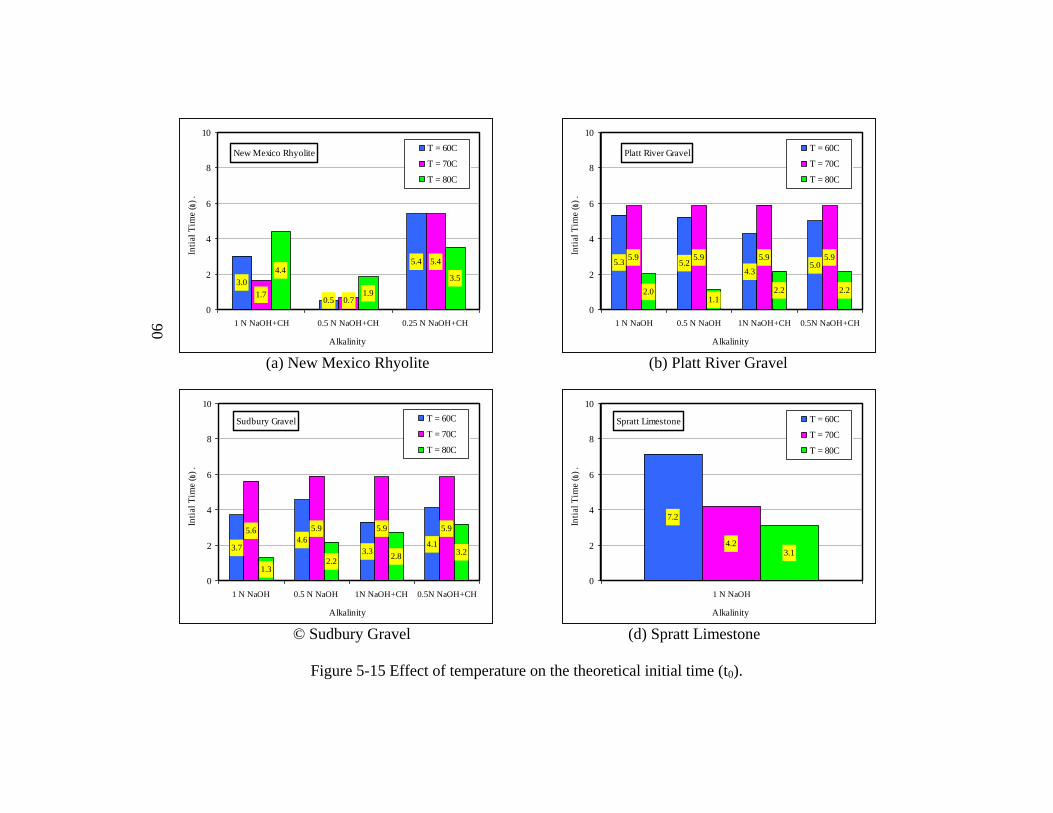
90
(a) New Mexico Rhyolite (b) Platt River Gravel
© Sudbury Gravel (d) Spratt Limestone
Figure 5-15 Effect of temperature on the theoretical initial time (t0).
New Mexico Rhyolite
3.0
0.5
5.4
1.70.7
5.44.4
1.9
3.5
0
2
4
6
8
10
1 N NaOH+CH 0.5 N NaOH+CH 0.25 N NaOH+CH
Alkalinity
Inti
al
Tim
e (
t 0) .
T = 60C
T = 70C
T = 80C
Platt River Gravel
5.3 5.24.3
5.05.9 5.9 5.9 5.9
2.01.1
2.2 2.2
0
2
4
6
8
10
1 N NaOH 0.5 N NaOH 1N NaOH+CH 0.5N NaOH+CH
Alkalinity
Inti
al
Tim
e (
t 0) .
T = 60C
T = 70C
T = 80C
Sudbury Gravel
3.74.6
3.34.1
5.6 5.9 5.9 5.9
1.32.2
2.83.2
0
2
4
6
8
10
1 N NaOH 0.5 N NaOH 1N NaOH+CH 0.5N NaOH+CH
Alkalinity
Inti
al
Tim
e (
t 0) .
T = 60C
T = 70C
T = 80C
Spratt Limestone
7.2
4.23.1
0
2
4
6
8
10
1 N NaOH
Alkalinity
Inti
al
Tim
e (
t 0) .
T = 60C
T = 70C
T = 80C
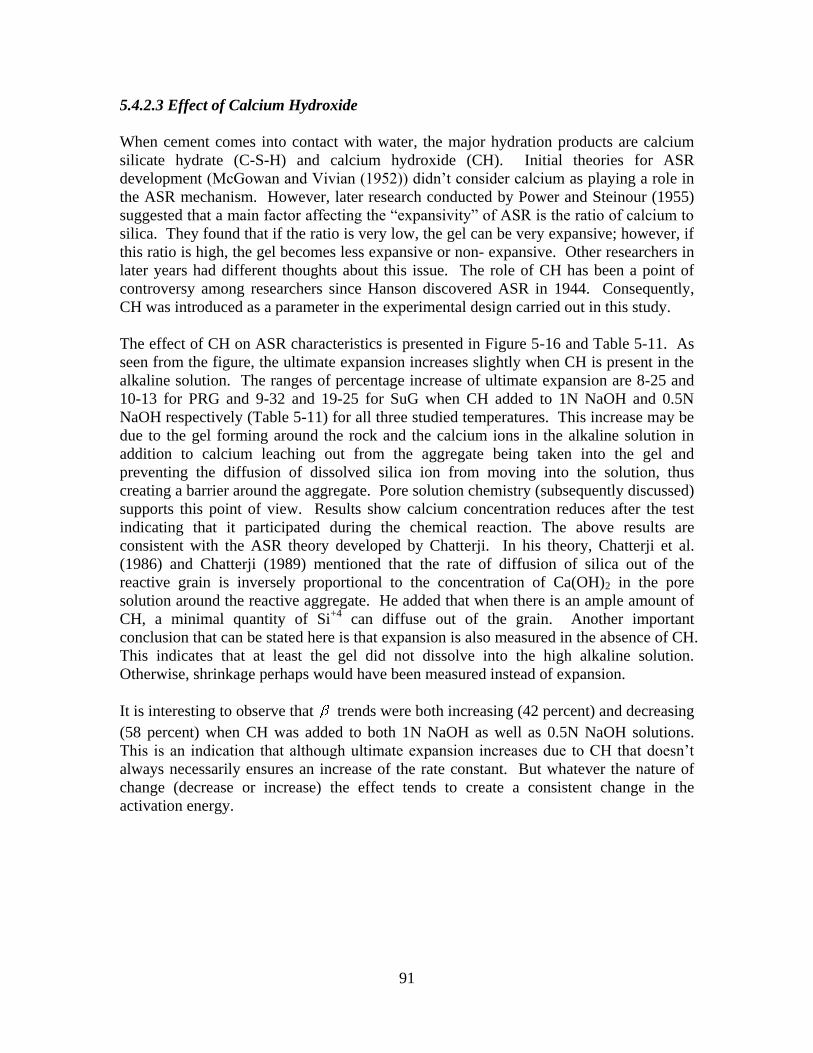
91
5.4.2.3 Effect of Calcium Hydroxide
When cement comes into contact with water, the major hydration products are calcium
silicate hydrate (C-S-H) and calcium hydroxide (CH). Initial theories for ASR
development (McGowan and Vivian (1952)) didn‘t consider calcium as playing a role in
the ASR mechanism. However, later research conducted by Power and Steinour (1955)
suggested that a main factor affecting the ―expansivity‖ of ASR is the ratio of calcium to
silica. They found that if the ratio is very low, the gel can be very expansive; however, if
this ratio is high, the gel becomes less expansive or non- expansive. Other researchers in
later years had different thoughts about this issue. The role of CH has been a point of
controversy among researchers since Hanson discovered ASR in 1944. Consequently,
CH was introduced as a parameter in the experimental design carried out in this study.
The effect of CH on ASR characteristics is presented in Figure 5-16 and Table 5-11. As
seen from the figure, the ultimate expansion increases slightly when CH is present in the
alkaline solution. The ranges of percentage increase of ultimate expansion are 8-25 and
10-13 for PRG and 9-32 and 19-25 for SuG when CH added to 1N NaOH and 0.5N
NaOH respectively (Table 5-11) for all three studied temperatures. This increase may be
due to the gel forming around the rock and the calcium ions in the alkaline solution in
addition to calcium leaching out from the aggregate being taken into the gel and
preventing the diffusion of dissolved silica ion from moving into the solution, thus
creating a barrier around the aggregate. Pore solution chemistry (subsequently discussed)
supports this point of view. Results show calcium concentration reduces after the test
indicating that it participated during the chemical reaction. The above results are
consistent with the ASR theory developed by Chatterji. In his theory, Chatterji et al.
(1986) and Chatterji (1989) mentioned that the rate of diffusion of silica out of the
reactive grain is inversely proportional to the concentration of Ca(OH)2 in the pore
solution around the reactive aggregate. He added that when there is an ample amount of
CH, a minimal quantity of Si+4
can diffuse out of the grain. Another important
conclusion that can be stated here is that expansion is also measured in the absence of CH.
This indicates that at least the gel did not dissolve into the high alkaline solution.
Otherwise, shrinkage perhaps would have been measured instead of expansion.
It is interesting to observe that trends were both increasing (42 percent) and decreasing
(58 percent) when CH was added to both 1N NaOH as well as 0.5N NaOH solutions.
This is an indication that although ultimate expansion increases due to CH that doesn‘t
always necessarily ensures an increase of the rate constant. But whatever the nature of
change (decrease or increase) the effect tends to create a consistent change in the
activation energy.

92
(a) Platt River Gravel
(b) Sudbury Gravel
Figure 5-16 Effect of Calcium Hydroxide (CH) on ultimate expansion.
Platt River Gravel
0.0310.037
0.054
0.0240.031
0.049
0.00
0.02
0.04
0.06
0.08
T = 60 C T = 70 C T = 80 C
Temperature (C)
Ult
imate
Ex
pan
sio
n (
%)
1 N NaOH + CH
1 N NaOH
Platt River Gravel
0.0220.027
0.045
0.028 0.025
0.042
0.00
0.02
0.04
0.06
0.08
T = 60 C T = 70 C T = 80 C
Temperature (C)
Ult
imate
Ex
pan
sio
n (
%)
0.5 N NaOH + CH
0.5 N NaOH
Sudbury Gravel
0.025
0.035
0.060
0.019
0.029
0.054
0.00
0.02
0.04
0.06
0.08
T = 60 C T = 70 C T = 80 C
Temperature (C)
Ult
imat
e E
xp
ansi
on
(%
)
1 N NaOH + CH
1N NaOH
Sudbury Gravel
0.020
0.037
0.057
0.016
0.031
0.049
0.00
0.02
0.04
0.06
0.08
T = 60 C T = 70 C T = 80 C
Temperature (C)
Ult
imat
e E
xp
ansi
on
(%
)
0.5 N NaOH + CH
0.5N NaOH

93
Table 5-11 Percentage change of ultimate expansion and Beta as a function of Ca(OH)2.
From 1N NaOH to 1N
NaOH +CH From 0.5N NaOH to
0.5 N NaOH+CH Aggregate
Type Temp (
°C) Ult. Exp Ult. Exp
PRG 60 25 31 -18 13
70 16 -2 13 -6
80 8 -3 10 -22
SuG 60 32 6 25 9
70 17 -5 20 1
80 9 -12 19 -11 Positive values indicates % increase and negative values indicates % decrease
5.4.3 Chemistry of Test Solution
As mentioned in Chapter 2, to initiate ASR, a high pH environment is necessary. The
selection of solution alkalinity in the experimental program of 1, 0.5 and 0.25 N NaOH
provides a highly alkaline environment (pH between 13 and 14). To check if any drastic
change in hydroxyl ions occurs from the interaction of alkaline solution and the aggregate
and concrete samples, it is vital to measure the pH of solution before and after conducting
the dilatometer test to see if there is any correlation between the expected expansion
observed during the test and pH. The pH of all soaked solutions was determined using a
Fisher Scientific Accumet Excel XL25 pH meter, calibrated to buffer solutions 12 and 14
levels of pH. pH 14 was prepared by diluting 40 gm of NaOH into 1 Liter of distilled
water and pH 12 buffer solutions was prepared by taking 1 mL of the above solution
using a micropipette and then diluted it 100 times in a volumetric flask. It is also known
that the presence of alkali ions is mandatory for ASR gel development; consequently, it is
vital to study the change in alkali concentration after the dilatometer test. Sodium (Na+),
potassium (K+) and calcium (Ca
+2) of the test solution were measured before and after
each test run using a four element flame photometer. This section presents the results and
discussion of the pH and of the chemistry of the test solution before and after testing
(Table 5-12).
As shown in the Table 5-12, the pH values of all the test runs decrease regardless of the
alkalinity and temperature of the test solutions. This is a clear indication that hydroxyl
ions were consumed in the chemical reaction as decrease in pH means reduction in
hydroxyl ions. However, the degree of decrease of pH value varies with aggregate types.
For example, the pH value for New Mexico Rhyolite at 1N NaOH+CH at 80C was
measured to be 14.009 before testing. Then it dropped significantly to 13.087. One has
to mention here that 1N NaOH yields a pH 14 and 0.1 N NaOH gives a pH of 13. Thus,
from NMR pH results, this drop in pH values is equivalent to 87.7 percent reduction in
hydroxyl ions concentration (Table 5-13). On the other hand, for Platt River Gravel, the
pH values at 1 N NaOH+CH at 80°C dropped from 14.009 to 13.514. This is equal to a
67.7 percent decrease in OH-. Based on the above pH measurements, it can be seen that
(OH-) ions were consumed more during the chemical reaction in the dilatometer test
where NMR is the aggregate. Consequently, more gel is expected to be formed in the

94
Table 5-12 Test Solution Chemistry before and after the test.
Aggregate
Type
Alkalinity
N = NaOH
Temp
(C)
Alkali Concentration (ppm) before
Testing Alkali Concentration (ppm) after Testing
pH Na+ K
+ pH Na
+ K
+ Ca
+2
New
Mexico
Rhyolite
1N + CH
60 14.009 23605 0 13.141 16068 52.8 68.7
70 14.009 23605 0 13.135 14481 55.9 59.5
80 14.009 23605 0 13.087 13438 51.7 51.4
0.5N + CH
60 13.708 11755 0 13.319 8911 62.8 106.2
70 13.708 11755 0 13.271 7916 54.5 93.4
80 13.708 11755 0 13.201 7394 62.6 85.8
0.25N + CH
60 13.399 5877 0 13.291 5124 12.0 137.5
70 13.399 5877 0 13.277 4982 13.7 119.0
80 13.399 5877 0 13.189 4674 35.6 102.9
Platt
River
Gravel
1N
60 14.004 23605 0 13.778 22183 5.1 1.3
70 14.004 23605 0 13.687 21804 5.8 1.6
80 14.004 23605 0 13.652 20666 5.6 2.9
0.5N
60 13.701 11755 0 13.356 11329 1.3 1.7
70 13.701 11755 0 13.381 11080 1.3 1.6
80 13.701 11755 0 13.369 10475 1.2 1.5
1N + CH
60 14.009 23605 0 13.71 21377 3.7 339.9
70 14.009 23605 0 13.617 19813 3.9 285.3
80 14.009 23605 0 13.514 19244 3.6 276.8
0.5N + CH
60 13.708 11755 0 13.303 11092 1.5 374.5
70 13.708 11755 0 13.354 10582 1.3 311.4
80 13.708 11755 0 13.305 10215 1.5 291.5
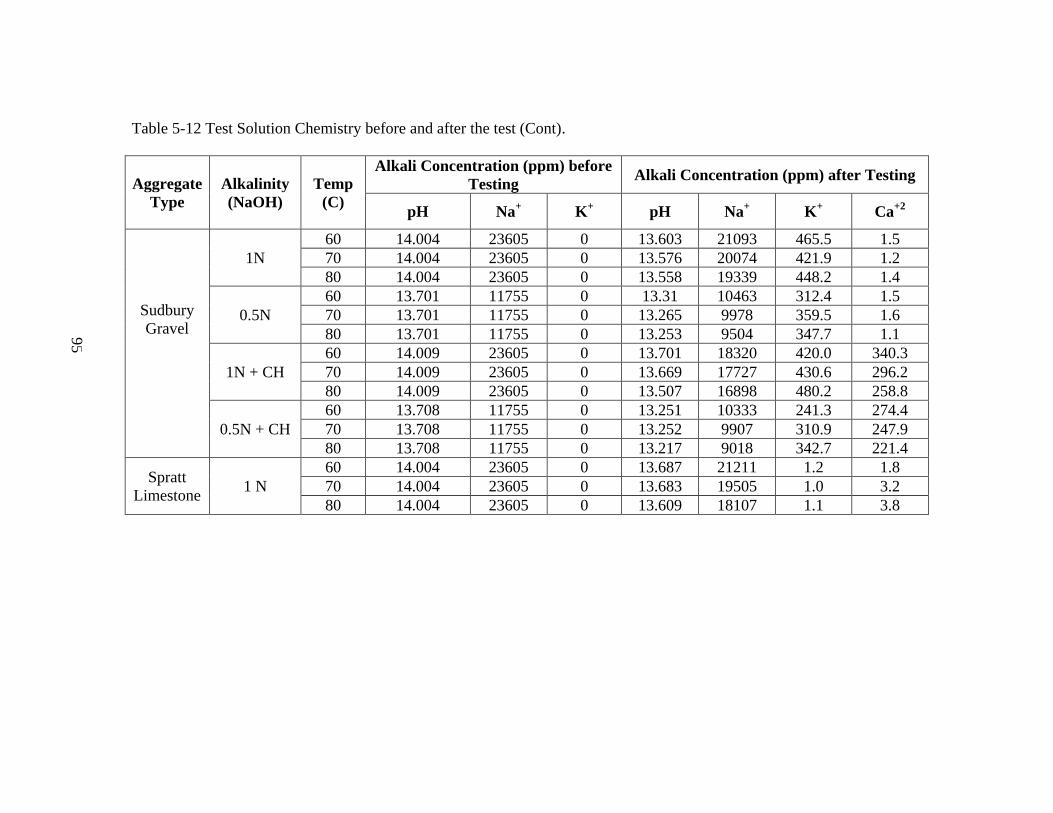
95
Table 5-12 Test Solution Chemistry before and after the test (Cont).
Aggregate
Type
Alkalinity
(NaOH)
Temp
(C)
Alkali Concentration (ppm) before
Testing Alkali Concentration (ppm) after Testing
pH Na+ K
+ pH Na
+ K
+ Ca
+2
Sudbury
Gravel
1N
60 14.004 23605 0 13.603 21093 465.5 1.5
70 14.004 23605 0 13.576 20074 421.9 1.2
80 14.004 23605 0 13.558 19339 448.2 1.4
0.5N
60 13.701 11755 0 13.31 10463 312.4 1.5
70 13.701 11755 0 13.265 9978 359.5 1.6
80 13.701 11755 0 13.253 9504 347.7 1.1
1N + CH
60 14.009 23605 0 13.701 18320 420.0 340.3
70 14.009 23605 0 13.669 17727 430.6 296.2
80 14.009 23605 0 13.507 16898 480.2 258.8
0.5N + CH
60 13.708 11755 0 13.251 10333 241.3 274.4
70 13.708 11755 0 13.252 9907 310.9 247.9
80 13.708 11755 0 13.217 9018 342.7 221.4
Spratt
Limestone 1 N
60 14.004 23605 0 13.687 21211 1.2 1.8
70 14.004 23605 0 13.683 19505 1.0 3.2
80 14.004 23605 0 13.609 18107 1.1 3.8
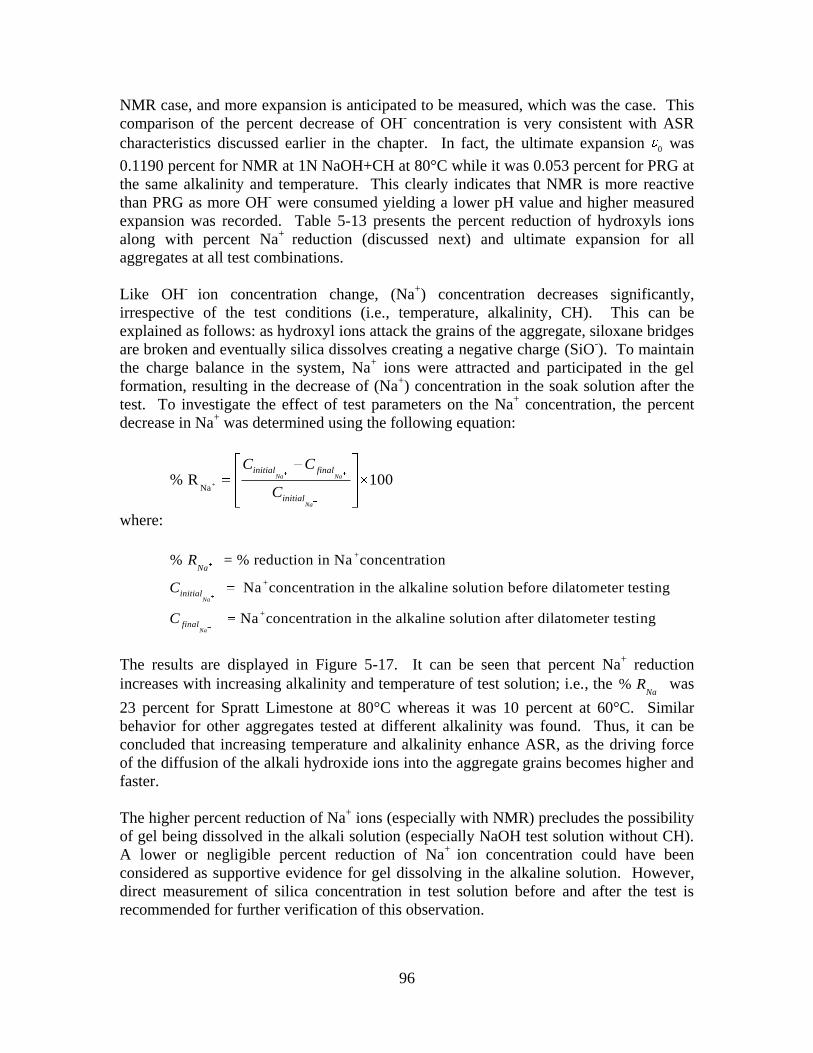
96
NMR case, and more expansion is anticipated to be measured, which was the case. This
comparison of the percent decrease of OH- concentration is very consistent with ASR
characteristics discussed earlier in the chapter. In fact, the ultimate expansion 0 was
0.1190 percent for NMR at 1N NaOH+CH at 80°C while it was 0.053 percent for PRG at
the same alkalinity and temperature. This clearly indicates that NMR is more reactive
than PRG as more OH- were consumed yielding a lower pH value and higher measured
expansion was recorded. Table 5-13 presents the percent reduction of hydroxyls ions
along with percent Na+
reduction (discussed next) and ultimate expansion for all
aggregates at all test combinations.
Like OH-
ion concentration change, (Na+) concentration decreases significantly,
irrespective of the test conditions (i.e., temperature, alkalinity, CH). This can be
explained as follows: as hydroxyl ions attack the grains of the aggregate, siloxane bridges
are broken and eventually silica dissolves creating a negative charge (SiO-). To maintain
the charge balance in the system, Na+ ions were attracted and participated in the gel
formation, resulting in the decrease of (Na+) concentration in the soak solution after the
test. To investigate the effect of test parameters on the Na+ concentration, the percent
decrease in Na+ was determined using the following equation:
+Na
% R 100Na Na
Na
initial final
initial
C C
C
where:
+
+
+
% = % reduction in Na concentration
Na concentration in the alkaline solution before dilatometer testing
Na concentration in the alkaline solution after dilatometer testi
Na
Na
Na
initial
final
R
C
C ng
The results are displayed in Figure 5-17. It can be seen that percent Na+ reduction
increases with increasing alkalinity and temperature of test solution; i.e., the % Na
R was
23 percent for Spratt Limestone at 80°C whereas it was 10 percent at 60°C. Similar
behavior for other aggregates tested at different alkalinity was found. Thus, it can be
concluded that increasing temperature and alkalinity enhance ASR, as the driving force
of the diffusion of the alkali hydroxide ions into the aggregate grains becomes higher and
faster.
The higher percent reduction of Na+ ions (especially with NMR) precludes the possibility
of gel being dissolved in the alkali solution (especially NaOH test solution without CH).
A lower or negligible percent reduction of Na+
ion concentration could have been
considered as supportive evidence for gel dissolving in the alkaline solution. However,
direct measurement of silica concentration in test solution before and after the test is
recommended for further verification of this observation.

97
Table 5-13 Percentage reduction in (OH)- and Na
+ ions after the test.
Aggregate
Type
Alkalinity
N = NaOH
Temp
°C
%
Reduction
in Na+
% Reduction
(OH-)
Ultimate
Expansion
(%)
New
Mexico
Rhyolite
1N + CH
60 32 86.16 0.1030
70 39 86.35 0.1134
80 43 87.78 0.1190
0.5N + CH
60 24 58.22 0.0695
70 33 62.59 0.1023
80 37 68.16 0.1070
0.25N + CH
60 13 21.66 0.0418
70 15 24.14 0.0537
80 20 38.06 0.0625
Platt
River
Gravel
1N
60 6 40.02 0.024
70 8 51.36 0.031
80 12 55.13 0.049
0.5N
60 4 54.50 0.027
70 6 51.81 0.024
80 11 53.12 0.041
1N + CH
60 7 48.71 0.030
70 14 58.60 0.036
80 16 67.34 0.053
0.5N + CH
60 6 59.73 0.022
70 10 54.71 0.027
80 13 59.54 0.045
Sudbury
Gravel
1N
60 11 59.91 0.019
70 15 62.33 0.029
80 18 63.86 0.054
0.5N
60 11 59.07 0.016
70 15 63.10 0.030
80 19 64.11 0.048
1N + CH
60 22 49.77 0.025
70 25 53.33 0.034
80 28 67.86 0.059
0.5N + CH
60 12 64.27 0.020
70 16 64.19 0.036
80 23 66.96 0.057
Spratt
Limestone 1 N
60 10 51.36 0.033
70 17 51.81 0.032
80 23 59.36 0.039
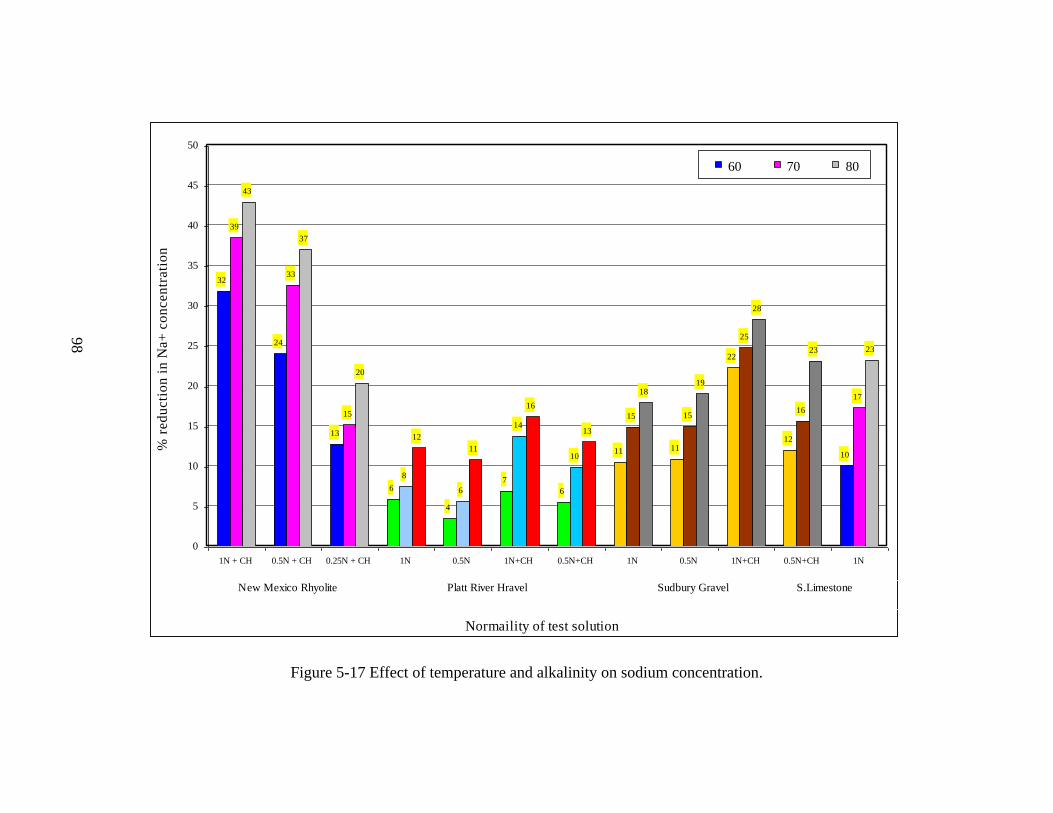
98
Figure 5-17 Effect of temperature and alkalinity on sodium concentration.
32
24
13
6
4
7
6
11 11
22
12
10
39
33
15
8
6
14
10
15 15
25
16
17
43
37
20
12
11
16
13
1819
28
23 23
0
5
10
15
20
25
30
35
40
45
50
1N + CH 0.5N + CH 0.25N + CH 1N 0.5N 1N+CH 0.5N+CH 1N 0.5N 1N+CH 0.5N+CH 1N
Normaility of test solution
% r
ed
ucti
on
in
Na+
co
ncen
trati
on
.60 70 80
New Mexico Rhyolite Platt River Hravel Sudbury Gravel S.Limestone

99
Ca(OH)2 was added to the NaOH solutions of respective strengths (e.g., 1N, 0.5N, and
0.25N) at room temperature. It is known that CH solubility is very low in water (i.e.,
around 1gm/liter) which matches with concrete pore solution. A comparison is
conducted between the amount of calcium measured after the test for NMR at 1N
NaOH+CH at 60, 70 and 80°C. Results indicate that Ca+2
ions concentrations decrease as
temperature increases. This is an indication that more Ca+2
ions have participated in the
reaction. The results are consistent with pH values obtained at 60°C (pH = 13.087) and
80°C (pH = 13.141). This indicates that more OH- ions were consumed and more gel
was formed. Therefore, one can conclude that the presence of CH enhances ASR
expansion slightly. But this increase is not significant. Results of ASR characteristics
support this point of view. It is also interesting to notice that higher Ca+2
ions
concentration are measured in PRG than NMR. Consequently, it can be concluded that
more calcium has participated in the case of NMR. Therefore, it can be concluded from
this observation that NMR is more reactive than PRG (pH values after the test supports
this conclusion).
It is interesting to observe that K+
was measured in the soak solutions of NMR and SuG
after the test (Table 5-12), although the respective soak solutions didn‘t contain any (K+)
ions before the test. This is an indication that those ions were leached out from the
aggregate during testing. This finding is consistent with a previous study by Berube et al.
2002 that shows that some types of aggregate (i.e., volcanic glass, micas, altered
feldspars, etc.) can supply a substantial amount of alkalis into the pore solution of
concrete.
5.4.4 Relating Activation Energy with Alkalinity
An apparent relationship between compound activation energy (Ea) and concentration
(e.g., alkalinity) is evident from the results of the studied aggregates. The higher the
alkalinity the lower is the Ea.
Aggregates were tested at different level of alkalinities (e.g., 1 NaOH + CH, 0.5 NaOH +
CH, 0.25 NaOH + CH). This corresponds to pH values between 13.39 and 14. The pH of
conventional concrete pore solution generally remain in an around 13. The pH of
concrete pore solution can go well above 13 provided the availability of total alkalis (both
cement and external alkalis) is high. On the other hand, the presence of supplementary
cementitious materials in concrete can make the pH of the solution goes down.
Dilatometer test is unlikely to be conducted at a very low alkalinity (i.e., less than 0.1N
NaOH or pH =13) because no measurable expansion can be recorded within a short
period of time. Consequently, it becomes vital to predict the activation energy needed to
initiate ASR at lower pH values. To achieve this objective, the following model
(presented earlier in Chapter 3) is used to establish a relationship between Ea and
alkalinity:
0
1
a aE E
n
C
C (5-1)

100
where:
Ea = Activation energy (KJ/mol)
Eao = Activation energy – threshold (KJ/mol)
C1 = Activation energy curvature coefficient (KJ/(mol)1-n
N = Activation energy curvature exponent
C = Alkalinity (mol)
5.4.4.1 Ea vs. Alkalinity for NMR Aggregate
The procedure to determine the relationship between Ea and alkalinity is described below
in details using NMR aggregate data.
As shown from the proposed model, the and Ca
E are known values and those
correspond to the activation energy of the aggregate at a specific levels of alkalinity.
Those were determined previously and presented in section 5.4.1 of this chapter. The
parameters to be determined are Ea, C1, n and quantified using numerical analysis. For this
reason, the sensitivity matrix, change vector and residual vectors were defined and set up.
Since the process of determining those parameters is an iteration process, a MATLAB
routine was developed for that purpose. The results obtained are presented below:
0 15.956, 4.821, 1.327
aE C n
By substituting the above calculated parameters in the model, Equation 5-1 becomes as
follows:
a 1.33
4.82E 5.95
C (5-2)
To demonstrate the accuracy of the proposed model, the measured Ea is plotted on the
predicted curve of Ea vs. alkalinity based on equation (5-2) (Figure 5-18). As shown from
the plot, the model fit to the measured data is appropriate and accurate. The shape of the
curve is important and illustrates the effect of alkalinity on Ea. As shown, the alkalinity
and the aE have an inversely proportional relationship. For example, the Ea is 34.2
kJ/mol at 0.25 N NaOH+CH whereas it is 10.7 KJ/mol at 1 N NaOH+CH. Two important
observations can be made by examining the relationship between Ea and alkalinity:
Ea values decrease slightly once the alkalinity reaches above 1N as it approaches
the threshold value of 5.95 KJ/mol. For example, at the 1N levels, the Ea is 10.7
KJ/mol while it is 7.9 KJ/mol at 2N from the predicted model. Therefore,
increasing the alkalinity beyond a specific amount will not decrease Ea
significantly since the reaction sites on the surface of the aggregate were fully
saturated by the hydroxyl ions present in the soak solutions. Thus, increasing
alkalinity beyond certain value will induce only minimal change on the Ea values.
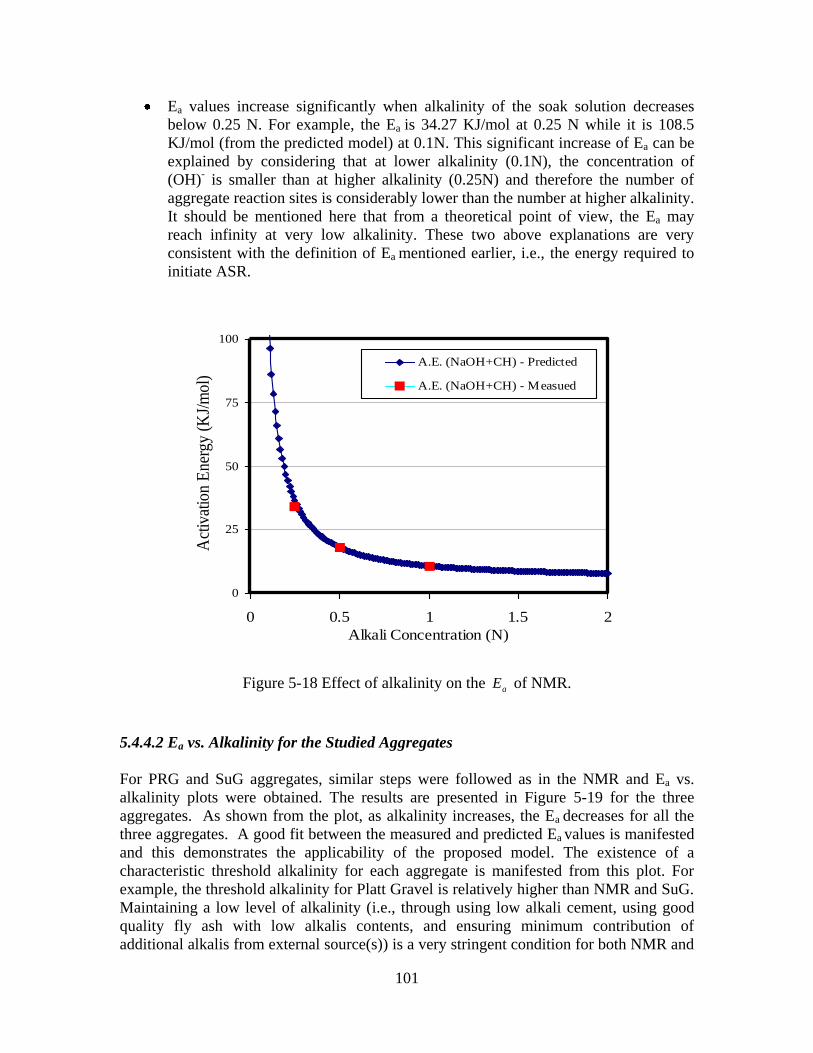
101
Ea values increase significantly when alkalinity of the soak solution decreases
below 0.25 N. For example, the Ea is 34.27 KJ/mol at 0.25 N while it is 108.5
KJ/mol (from the predicted model) at 0.1N. This significant increase of Ea can be
explained by considering that at lower alkalinity (0.1N), the concentration of
(OH)- is smaller than at higher alkalinity (0.25N) and therefore the number of
aggregate reaction sites is considerably lower than the number at higher alkalinity.
It should be mentioned here that from a theoretical point of view, the Ea may
reach infinity at very low alkalinity. These two above explanations are very
consistent with the definition of Ea mentioned earlier, i.e., the energy required to
initiate ASR.
Figure 5-18 Effect of alkalinity on the aE of NMR.
5.4.4.2 Ea vs. Alkalinity for the Studied Aggregates
For PRG and SuG aggregates, similar steps were followed as in the NMR and Ea vs.
alkalinity plots were obtained. The results are presented in Figure 5-19 for the three
aggregates. As shown from the plot, as alkalinity increases, the Ea decreases for all the
three aggregates. A good fit between the measured and predicted Ea values is manifested
and this demonstrates the applicability of the proposed model. The existence of a
characteristic threshold alkalinity for each aggregate is manifested from this plot. For
example, the threshold alkalinity for Platt Gravel is relatively higher than NMR and SuG.
Maintaining a low level of alkalinity (i.e., through using low alkali cement, using good
quality fly ash with low alkalis contents, and ensuring minimum contribution of
additional alkalis from external source(s)) is a very stringent condition for both NMR and
0
25
50
75
100
0 0.5 1 1.5 2
Alkali Concentration (N)
Act
ivat
ion
Ene
rgy
(KJ/
mol
) . A.E. (NaOH+CH) - Predicted
A.E. (NaOH+CH) - Measued

102
SuG. However, as Ea of SuG is slightly higher than NMR, the tolerance level of alkali for
SuG will be more than NMR. A reactive aggregate can practically behave as
non-reactive or very slow reactive provided the alkalinity can be maintained below the
threshold level of alkalinity.
Figure 5-19 Alkalinity versus Activation Energy for the studied three aggregates.
The procedures described in section 5.4.4 address the chemical aspects of ASR and
predict the aggregate ASR potential matching with field levels of alkalinity and
temperature and defined as aggregate reactivity signature (Figure 5-19). However, this
kind of chemical aspects can‘t address the physical aspects such as (i) amount of gel
formed, (ii) degree of expansive pressure and (iii) the effects of expansive pressure (i.e.,
level of distress) under field conditions. To address these physical aspects, it is necessary
(i) to conduct direct concrete testing in the laboratory using the same device and
measures some characteristic physical material properties (e.g., rate of expansion,
ultimate expansion etc.) as a function of w/c, SCMs replacement levels and others,
(ii) develop a mathematical relationship between measured concrete ASR material
properties of physical aspects (e.g., concrete ultimate expansion) and aggregate chemical
properties (e.g., aggregate activation energy) and establish a concrete reactivity signature.
Limited concrete testing was conducted in order to develop some example concrete
reactivity signature plots. An attempt was then made to explore combined materials
approach after combing the aggregate and concrete reactivity signature which is
presented in Appendix E. This type of combined materials approach can be the basis for
determining total threshold alkalinity in order to develop ASR resistant concrete mixture.
0
30
60
90
120
150
0 0.5 1 1.5 2 2.5 3
Alkali Cocentration (N)
Act
ivat
ion
En
erg
y (
KJ/
mo
l)
. Plat t River Gravel- Predicted
Sud Gravel - Predicted
NMR - Predicted
Plat t River Gravel - Measued
Sud Gravel - Measued
NMR - Measured

103
However, further work on (i) refinement of the calibration procedure using field exposed
concrete, (ii) round robin concrete testing using a variety of coarse aggregates and
performance, are recommended in order to validate this combined approach.
5.5 SUMMARY
This chapter presents the analysis and the interpretation of four aggregates (NMR, PRG,
SuG, SL) tested in the dilatometer device at different temperatures under different alkali
levels with and without calcium hydroxide. A new kinetic model was introduced and
used to rank the aggregates based on their reactivity using the activation energy concept
(Ea). The latter is the energy necessary to initiate ASR. The following conclusions can
be made:
a) Results indicate that ASR expansion increases with alkalinity of test solutions and
time and this gain was attributed to the formation and then growth of ASR gel.
b) Increasing the temperature leads to an increase in the rate constant. This indicates
that ASR is a thermally activated process.
c) From ASR characteristics and from the chemistry of the test solution, ASR was
found to be expansive without the presence of calcium hydroxide, as the major ions
(sodium and hydroxyls) were consumed during the chemical reaction. It should be
noted that the presence of CH in the solution increases slightly the ASR expansion.
d) The relationship between Ea and alkalinity can be used as a means to adjust the
laboratory measured Ea with respect to field level of alkalinity and characterize the
threshold alkali requirements of aggregate.
e) The Ea of ASR could be a potential screening parameter to categorize aggregates
based on their reactivity.


105
CHAPTER 6
CONCLUSIONS AND RECOMMENDATIONS
6.1 INTRODUCTION
Alkali silica reaction in concrete structures (pavement, bridges, dams, etc) has become a
growing concern for engineers, contractors and government agencies. As mentioned in
Chapter 2, the presence of reactive siliceous component in some types of aggregate, high
alkali content in the concrete matrix and sufficient amount of moisture are the three major
requirements needed for the ASR to initiate and spread. Therefore, the current logical
approaches to tackle the problem were to use non-reactive aggregate, low alkali cement
and adding sufficient amount of supplementary cementitious materials (fly ash, etc) based
on empirical history.
Among the current laboratory standard tests for ASR assessment, the two most
recognized tests are ASTM C 1260 (mortar bar test) and ASTM C 1293 (concrete prism
test). The mortar bar method is relatively a procedure with short duration and can be
conducted within 16 days. But it is considered an aggregate test and results obtained at
severe test conditions (i.e., aggregate crushing, high temperature and alkalinity etc.) have
very limited relevance to field conditions. The concrete prism method is very popular
and widely considered a good index of field performance. However, the minimum one
year test duration is considered a serious drawback. Consequently, a completely different
approach; preferably a performance based- is necessary.
To achieve this ultimate objective, a research project was conducted to develop a reliable
test protocol that will assist the engineers, contractors and owners to identify ASR
potential based on combined materials approach. Hence a comprehensive study on
different types of aggregates of different reactivity was conducted to formulate a robust
approach that potentially incorporates the effects of the factors affecting ASR such as
temperature, calcium concentration and alkalinity. Presented below are the conclusions
of this study based on the analysis of the results and discussions previously noted. In
addition, some recommendations for further research and putting this research into
practical use are also provided.
6.2 CONCLUSIONS
Different series of expansions measurements were conducted on different types of
aggregates (New Mexico Rhyolite, Platt River Gravel, Spratt Limestone, Sudbury Gravel)
using dilatometry. A new model was proposed to determine ASR characteristics
(ultimate ASR expansion, theoretical initial time of ASR expansion, the rate constant and
the time scale parameter). The parameters were determined using numerical analysis.
The ASR aggregates reactivity was predicted in terms of their activation energy. Some
of the main findings from this part are:
106
a) All expansion-time plots display similar characteristics patterns. Almost no
expansion was recordable in the initial hours (0-15 hrs). This was followed by a
rapid increase in expansion up to 60-75 hrs. Then the expansion was stabilized
around the four days period.
b) Results indicate that alkalinity of the soak solution is a major factor that affect
ASR expansion. An increase in alkalinity yields an increase in ASR expansion.
c) The effect of temperature on ASR characteristics is very important to notice. It
was observed that rate constant increases with increasing temperature for all the
studied aggregates. This indicates that ASR is a thermally activated process
which is further evidenced by the observed effect on the theoretical initial time of
expansion (t0). As temperature increases, the amount of additional energy needed
to initiate ASR decreases because the energy barrier that the system has to
overcome is much smaller at a higher temperature and therefore the time
necessary that it takes for ASR to initiate and develop is shorter.
d) Experimental results indicate that the addition of calcium hydroxide (CH) to the
alkaline solution enhances ASR as more volumetric expansion was recorded
during testing. The previous is confirmed by the chemistry of the test solution
where a sharp decline of sodium and hydroxyls ions with CH was observed
compared to the level of reduction that observed with only sodium hydroxide
solution.
e) From the analysis, it can be stated that ASR was found to be expansive without
the presence of calcium hydroxide. Otherwise, shrinkage would have taken place
and an increase in alkali ions in test solution would have been measured, which
was not the case. Chemistry of the alkali solution supports this point of view.
f) To compare the reactivity of the aggregates in this study, the compound activation
energy (Ea) of the aggregates, determined using rate theory. From this
comparison, it can be concluded that NMR is the most reactive aggregate tested in
this research, followed by SL, SuG and then PRG. By comparing the Ea at
different alkalinities, it was also found that the Ea decreases when alkalinity
increases. This observation indicates the presence of a relationship between these
two parameters.
g) To check the procedure validation and the laboratory proficiency, intra and
inter-laboratory comparisons were conducted. Results are very promising as the
COV was less than 7 percent (intra-lab comparison) and 10 percent (inter-lab
comparison) indicating that the results are highly repeatable and reliable. To
check the capability of the new proposed kinetic model of distinguishing
aggregate with different reactivity, hypothesis tests on the mean Ea of each type of
aggregate at different alkalinity is conducted. Statistical results indicate that the
means are different. Therefore, it can be concluded that the Ea can serve as an
overall indicator of ASR potential and can be used as a potential screening
parameter for ASR under field conditions.
107
6.3 RECOMMENDATION FOR FUTURE RESEARCH
Based on the knowledge gained from this research project, it is recommended that the
following steps be taken to broaden the applicability of the developed protocols to
mitigate ASR:
a) This work was based on limited number of reactive aggregates. Additional sources of
aggregates should be investigated thoroughly before the protocols are generalized on
a broader scale.
b) Implementation through round-robin aggregate testing.
c) Normalization of aggregate reactivity according to size distribution and other related
factors
d) Validation of combined materials approach–a combined materials approach i.e.,
combining laboratory measured aggregate and concrete material properties through
performance based modeling. Based on aggregate testing (aggregate-solution tests)
and limited concrete testing (concrete-solution tests), a combined materials test
procedure has been explored and presented in Appendix E. Further work on
(i) refinement of the calibration procedure using field exposed concrete, (ii) round
robin concrete testing using a variety of coarse aggregates and performance, are
recommended in order to validate this combined approach.
e) Although the mechanisms are not fully understood, current research indicates that the
use of lithium compounds suppress ASR expansion. Research is suggested to
determine the effect of lithium compounds on the activation energy of aggregate and
consequently on the ultimate expansion of concrete in terms of mixture proportioning.
Since the exact amount of lithium needed to mitigate ASR varies from aggregate
sources to aggregate source, it would be beneficial to conduct concrete tests treated
with lithium products in the dilatometer and determine the minimum amount of
lithium requited to reduce the alkalinity of the pore solution below the threshold level.
f) Using data from field tested concrete to validate predictions of residual expansion as
well as service life prediction is recommended
g) The relationship between deicers and ASR can be systematically evaluated in
dilatometer by testing aggregate, paste, mortar, and concrete separately with different
combinations of deicing chemicals and artificial pore solution.

109
REFERENCES
ASTM (2007). ASTM C 1608, ―Standard Test Method for Chemical Shrinkage of
Hydraulic Cement Paste,‖ ASTM International, Annual Book of ASTM Standards,
American Society for Testing Materials, West Conshohocken, Pennsylvania, DOI:
10.1520/C1608-07, pp. 667-670.
ASTM (2007). ASTM C 1567: ―Standard Test Method for Determining the Potential
Alkali-Silica Reactivity of Combinations of Cementitious Materials and Aggregate
(Accelerated Mortar-Bar Method),‖ ASTM International, Annual Book of ASTM
Standards, American Society for Testing Materials, West Conshohocken, Pennsylvania,
DOI: 10.1520/C1567-07, pp. 776-781.
ASTM, (2000). ―ASTM C 1293-95: Standard Test Method for Concrete Aggregates by
Determination of Length Change of Concrete Due to Alkali-Silica Reaction.‖ Annual
Book of ASTM Standards, American Society for Testing Materials, West Conshohocken,
Pennsylvania, pp. 673-678.
ASTM, (2000). ―ASTM C 1260-94: Standard Test Method for Potential Alkali Reactivity
of Aggregate (Mortar-Bar Method).‖ Annual Book of ASTM Standards, American
Society for Testing Materials, West Conshohocken, Pennsylvania, pp. 669-672.
ASTM, (2000). ―ASTM C 856-95, Standard Practice for Petrographic Examination of
Hardened Concrete.‖ Annual Book of ASTM Standards, American Society for Testing
Materials, West Conshohocken, Pennsylvania, pp. 424-439.
ASTM, (2000). ―ASTM C 441-97, Standard Test Method for Effectiveness of Mineral
Admixture or Ground Blast-Furnace Slag in Preventing Excessive Expansion of Concrete
Due to the Alkali-Silica Reaction.‖ Annual Book of ASTM Standards, American Society
for Testing Materials, West Conshohocken, Pennsylvania, pp. 225-227.
ASTM, (2000). ―ASTM C 295-98: Standard Guide for Petrographic Examination of
Aggregate for Concrete.‖ Annual Book of ASTM Standards, American Society for
Testing Materials, West Conshohocken, Pennsylvania, pp. 173-180.
ASTM, (2000). ―ASTM C 289-94: Standard Test Method for Potential Alkali Reactivity
of Aggregate (Chemical Method).‖ Annual Book of ASTM Standards, American Society
for Testing Materials, West Conshohocken, Pennsylvania, pp. 154-160.
ASTM, (2000). ―ASTM C 227-97a: Standard Test Method for Potential Alkali Reactivity
of Cement-Aggregate Combinations (Mortar-Bar Method).‖ Annual Book of ASTM
Standards, American Society for Testing Materials, West Conshohocken, Pennsylvania,
pp. 127-131.

110
ASTM (2007). ASTM C 150,‖Standard Specification for Portland Cement‖, ASTM
International, Annual Book of ASTM Standards, American Society for Testing Materials,
West Conshohocken, Pennsylvania, DOI: 10.1520/C0150-07, pp. 105-157.
ASTM, (2000). ―ASTM C 33-99a, Standard Specification for Concrete Aggregates‖
Annual Book of ASTM Standards, American Society for Testing Materials, West
Conshohocken, Pennsylvania, pp. 10-17.
Badillo, J.E., (1981). General Compressibility Equation for Soils. Tenth International
Conference on Soil Mechanics and Foundation Engineering, Stockholm, Sweden, pp.
171-178.
Barringer, W.L. (June 2000). Application of Accelerated Mortar Bar Tests to New
Mexico Aggregates, Proceedings of 11th International Conference on Alkali-Aggregate
Reactions in Concrete, Quebec City, Quebec, Canada, pp. 563-572.
Berube, M.-A., A.J. Duchesnea, J.F. Doriona, M. Rivest, (2002). ―Laboratory
Assessment of Alkali Contribution by Aggregates to Concrete and Application to
Concrete Structures Affected by Alkali–Silica Reactivity,‖ Cement and Concrete
Research Vol. 32 pp. 1215-1227.
Berube, M-A., B. Durand, D. Vezina, B. Fournier, (2000). Alkali-Aggregate Reactivity in
Quebec, Canada, Journal of Civil Engineering, Vol. 27 No. 2, pp. 226-45.
Bolt, G.H. (1957). ―Determination of the Charge Density of Silica Sols.‖ Journal of
Physical Chemistry, 61, pp. 1166-1169.
Brandt, M.P. and R.E. Oberholster (1983). Study of Tygerberg Formation Aggregate for
Potential Alkali-Reactivity, Implications of Test Methods and Applications of the
Findings in Practice. SCIR Research Report No. 580, pp. 96.
Callister (Jr.), W.D. (2007). ―Materials Science and Engineering An Introduction.‖ John
Wiley & Sons, Inc., York, Pennsylvania, pp. 721.
Carino, N.J (1984). ―Maturity Method: Theory and Application,‖ Cement, Concrete, and
Aggregate, Vol. 6, No. 2, pp. 61-73.
Carrasquillo, R.L. and J. Farbiaz, (1988). ―Alkali-Aggregate Reaction in Concrete
Containing Fly Ash: Final Report,‖ Center of Transportation Research, Research Report
# 450-3F.
Chatterji, S., N. Thaulow, and A.D. Jensen, (1989). ―Studies of Alkali-Silica Reaction.
Part 5. Verification of a Newly Proposed Reaction Mechanisms‖ Cement and Concrete
Research, Vol. 19, pp. 177-183.

111
Chatterji, S. (1989b). ―Mechanisms of Alkali-Silica Reaction and Expansion‖
Proceedings 8th International Conference on Alkali-Aggregate Reaction in Concrete,
Kyoto, Japan, pp. 101-105.
Chatterji, S., N. Thaulow, and A.D. Jensen, (1988). ―Studies of Alkali-Silica Reaction.
Part 6. Practical Implications of a Proposed Reaction Mechanisms‖ Cement and Concrete
Research, Vol. 18, pp. 363-366.
Chatterji, S, N. Thaulow, A.D. Jensen, and P. Christensen, (1986). ―Mechanisms of
Accelerating Effects of NaCl and Ca(OH)2 on Alkali-Silica Reaction.‖ Proceedings 7th
International Conference on Alkali-Aggregate Reaction in Concrete, Ottawa, Canada,
pp. 115-119.
Chatterji, S. (1979) .―The Role of Ca(OH)2 in the Breakdown of Portland Cement
Concrete Due to Alkali-Silica Reaction.‖ Cement Concrete Research, Vol. 9 No. 2,
pp. 185-188.
Dent-Glasser, L.S. and N. Kataoka, (1981). The Chemistry of Alkali-Aggregate
Reactions. Proceedings of the Fifth International Conference on Alkali-Aggregate
Reactions, S252/23, pp. 66.
Diamond, S. and M. Penko, (1992). Proceedings G.M. Idorn International. Symposium.
Durability of Concrete, ACI SP-131, pp. 153.
Diamond, S., (1989). ―ASR—Another Look at Mechanisms,‖ Proceedings of the 8th
International Conference on Alkali-Aggregate Reaction, (Eds. K. Okada, S. Nishibayashi,
and M. Kawamura), Kyoto, Japan, pp. 83–94.
Diamond, S., (1983). Alkali-Reactions in Concrete-Pore Solution Effects. Proceedings of
the Sixth International Conference on Alkalis in Concrete, pp. 155–166.
Diamond, S., (1981). ―Effect of Two Danish Fly Ashes on Alkali Contents of Pore
Solutions of Cement-Fly Ash Pastes.‖ Cement Concrete and Research, Vol. 11, No. 3,
pp. 383-394.
Diamond, S., (1976). ―A Review of Alkali-Silica and Expansion Mechanisms 2. Reactive
Aggregate.‖ Cement Concrete and Research, Vol. 6, No. 4, pp. 549-560.
Ebbing, D.D. and S.D. Gammon, (2005). General Chemistry: Media Enhanced Edition,‖
8th Edition, Houghton Mifflin; Eighth Media Enhanced Edition.
Folliard K.J., M.D.A. Thomas, B. Fournier, K.E. Kurtis, J.H. Ideker, (2007). The Use of
Lithium to Prevent or Mitigate Alkali-Silica Reaction in Concrete Pavements and
Structures, Publication No. FHWA-HRT-06-133, Office of Infrastructure Research and
Development, Federal Highway Administration: pp. 47.

112
Folliard, K.J., M.D.A. Thomas, and K.E. Kurtis, (2003). ―Guidelines for the Use of
Lithium to Mitigate or Prevent Alkali-Silica Reaction (ASR),‖ Publication No.
FHWA-RD-03-047, Federal Highway Administration.
Geiker, M. and T. Knudsen, (1985). ―Chemical Shrinkage,‖ Proceedings, Research on
the Manufacture and Use of Cements, Engineering Foundation, pp. 99-107.
Gillott, J.E., M.A.G. Duncan, and E.G. Swenson, (1973). Alkali-Aggregate Reaction in
Nova Scotia. IV. Character of the Reaction. Cement Concrete Research, Vol. 3,
pp. 521-535.
Gosset W.S. (1908). ―The Probable Error of a Mean‖. Biometrika Vol. 6 No. 1 pp. 1–25,
doi:10.1093/biomet/6.1.1, http://www.york.ac.uk/depts/maths/histstat/student.pdf.
Grattan-Bellew, P.E., (1997). A Critical Review of Ultra-Accelerated Tests for
Alkali-Silica Reactivity, Cement and Concrete Composites, Vol. 19, pp. 403-414.
Grattan-Bellew, P.E., (1989). Test Methods and Criteria for Evaluating the Potential
Reactivity of Aggregates. Proceedings of the Eighth International Conference on
Alkali-Aggregate Reaction in Concrete, Kyoto, Japan, pp. 279-294.
Hansen, W.C., (1944). ―Studies Relating to the Mechanism by Which the
Alkali-Aggregate Reaction Proceeds in Concrete,‖ Journal of the American Concrete
Institute, Vol. 15, No. 3, pp. 213–227.
Hobbs, D. (1992). Deleterious Alkali-Silica Reactivity of a Number of UK Aggregates,
Concrete Vol. 26, No. 3, pp.64-70.
Hobbs, D.W., (1988). Alkali-Silica Reaction in Concrete, Thomas Telford, London,
England.
Hooton, R.D., (1986). Effect of Containers on ASTM C 441—Pyrex Mortar Bar
Expansions. Proceedings of the Seventh International Conference on Alkali-Aggregate
Reaction in Concrete, pp. 351–357.
Johnston, D.P, D. Stokes, and R. Surdahl, (2000). ―A Kinetic-Based Method for
Interpreting ASTM C 1260.‖ Cement Concrete Aggregate, Vol. 22, No. 2, pp. 142-149.
Kawamura M. and K. Iwahori, (2004). ASR Gel Composition and Expansive Pressure in
Mortars Under Restraint, Cement and Concrete Research, Vol. 26, pp. 47-56
Knudsen, T.A., (1992). ―The Chemical Shrinkage Test: Some Corollaries.‖ Proceedings,
7th International Conference on Alkali-Aggregate Reaction in Concrete, London,
pp. 543-549.
113
Knudsen, T., (1986). ―A Continuous, Quick Chemical Method for the Characterization of
the Alkali-Silica Reactivity of Aggregates,‖ Proceedings, 7th
International Conference on
Concrete Alkali-Aggregate Reactions, Ottawa, Canada, pp. 289-293.
Kolleck J.J., S.P. Varma, and C. Zaris, (1986). Measurement of OH- Concentrations of
Pore Fluids and Expansion Due to Alkali-Silica Reaction in Composite Chemistry of
Cement Mortars. Proceedings 8th International Congress On Chemistry of Cement, 3,
Rio de Janeiro, Brazil, pp. 183-189.
Ludwig, U, (1981). Effects of Environmental Conditions on Alkali-Aggregate Reaction
and Preventive Measures. Proceedings, 8th International Conference. on
Alkali-Aggregate Reaction in Concrete, Kyoto, Japan, pp. 583-596.
McGowan, J.K. and H.E. Vivian, (1952). ―Studies in Cement-Aggregate Reaction:
Correlation between Crack Development and Expansion of Mortars,‖ Australian Journal
of Applied Science, Vol. 3, pp. 228–232.
Mehta, P.K. and P.J.M. Monteiro, (1992). Concrete: Structure, Properties, and Materials
(2nd Edition.). Prentice Hall, Upper Saddle River, New Jersey.
Mindess, S., J.F. Young, and D. Darwin, (2003). Concrete, Prentice Hall, Upper Saddle
River, New Jersey.
Montgomery, D.C. and G.C. Runger (2002). ―Applied Statistics and Probability for
Engineers,‖ Wiley, 3rd
.
Mukhopadhyay, A.K. and D.G. Zollinger, (2009). ―Development of Dilatometer Test
Method to Measure Coefficient of Thermal Expansion (CoTE) of Aggregates,‖ Journal
of Materials in Civil Engineering, Vol. 21, Issue 12, Dec.
Mukhopadhyay, A.K., C.S. Shon, and D.G. Zollinger, (2006). ―Activation Energy of
Alkali-Silica Reaction and Dilatometer Method‖ Journal of the Transportation Research
Board, No. 1979, pp. 1-11, Washington D.C.
Mukhopadhyay A.K., S. Neekhra and D.G. Zollinger, (2004). New Mineralogical
Approach to Predict Aggregate and Concrete Coefficient of Thermal Expansion (CoTE),
Presented (04-4167, Compendium of papers CD-ROM) in Transportation Research
Board, Washington D.C.
Nixon, P.J. and I. Sims, (1992). ―RILEM TC106 Alkali Aggregate Reaction–Accelerated
Tests Interim Report and Summary of Survey of National Specifications,‖ Proceedings of
the Ninth International Conference on Alkali-Aggregate Reaction in Concrete, Concrete
Society, Slough, England, Vol. 2, pp. 731–738.

114
Nixon, P., I. Canham, C. Page, and R. Bollinghaus, (1987). ―Sodium Chloride and
Alkali-Aggregate Reaction, Concrete Alkali-Aggregate Reactions.‖ Proceedings 7th
International Conference on Alkali-Aggregate Reaction, Ottawa, Canada, pp. 110.
Olafsson H. and N. Thaulow, (1983). Alkali-Silica Reactivity of Sands, Comparison of
Various Test Methods, Proceedings of the 6th
International Conference on Alkalis in
Concrete.
Pedneault, A., (1996). ―Development of Testing and Analytical Procedures for the
Evaluation of the Residual Potential of Reaction, Expansion, and Deterioration of
Concrete Affected by ASR,‖ M.Sc. Memoir, Laval University, Québec City, Canada,
pp. 133.
Poulsen, E., T. Hansen, and H. Sorensen, (2000). ―Release of Alkalies from Feldspar in
Concrete and Mortar.‖ Proceedings 5th
International Conference on Durability of
Concrete, Barcelona, Spain, pp. 807-824.
Powers, T.C. and H.H. Steinour, (1955). ―An Investigation of Some Published
Researches on Alkali-Aggregate Reaction: I. The Chemical Reactions and Mechanism of
Expansion,‖ Journal of the American Concrete Institute, Vol. 26, No. 6, pp. 497–516.
Prezzi, M. P.J.M. Monteiro, and G. Sposito, (1997). Alkali-Silica Reaction - Part 1: Use
of the Double-Layer Theory to Explain the Behavior of the Reaction Product Gels, ACI
Journal, Vol. 94, pp. 10.
Rangaraju, P.R., J. Olek, (2007). "Potential for Acceleration of ASR in Presence of
Pavement Deicing Chemicals." Research Report, IPRF 01-G-002-03-9, Innovative
Pavement Research Foundation, Skokie, Illinois, pp. 123.
Rogers, C., (1999). ―Multi-Laboratory Study of Accelerated Mortar Bar Test (ASTM C
1260) for Alkali-Silica Reaction‖ Cement, Concrete and Aggregates, CCAGDP, Vol. 21
No. 2, pp.191-200.
Rogers, C.A. and R.D. Hooton, (1989). Leaching of Alkalis in Alkali-Aggregate Reaction
Testing. Proceedings of the Eight International Conference on Alkali-Aggregate Reaction,
pp. 327–332.
Rodrigues, F.A., P.J.M. Monteiro, and G. Sposito, (2001), ―The Alkali–Silica Reaction
The Effect of Monovalent and Bivalent Cations on the Surface Charge of Opal‖
Cement and Concrete Research Vol. 31, No. 11, pp. 1549–1552.
Rodrigues, F. A., P.J.M. Monteiro, and G. Sposito, (1999). The Alkali-Aggregate
Reaction: The Surface Charge Density of Silica and Its Effect on the Expansive Pressure,
Cement and Concrete Research, Vol. 29, pp. 527.

115
Sarkar, S.L., D.G. Zollinger, A.K. Mukhopadhyay and L. Seungwook, (2004).
Appendix 1—Handbook for Identification of Alkali-Silica Reactivity, Airfield Pavement,
Advisory Circular No. 150/5380-8, U.S. Department of Transportation Federal Aviation
Administration.
Schmitt, J.W. and D.C. Stark, (1989). Recent Progress in Development of the Osmotic
Cell to Determine Potential for Alkali-Silica Reactivity of Aggregates. Proceedings of the
8th International Conference on Alkali-Aggregate Reaction in Concrete, Kyoto, Japan,
pp. 423-431.
Shehata, M.H. and M.D.A. Thomas, (2000). ―The Effect of Fly Ash Composition on the
Expansion of Concrete Due to Alkali Silica Reaction,‖ Cement and Concrete Research,
Vol. 60, No. 7, pp. 1063-1072.
Shon, C.-S., A.K. Mukhopadhyay, and D.G. Zollinger, (2007). ―Alkali-Silica Reactivity
of Aggregate and Concrete Evaluated by Dilatometer Method: Performance-Based
Approach‖ Journal of the Transportation Research Board, No. 2020, pp 10-19,
Washington D.C.
Shon, C.-S., S.L. Sarkar, D.G. Zollinger, (2004). ―Testing the Effectiveness of Class C
and Class F Fly Ash in Controlling Expansion due to Alkali-Silica Reaction Using
Modified ASTM C 1260 Test Method,‖ Journal of Materials in Civil Engineering Vol.
16, No. 1, pp. 20-27.
Shon, C.-S., D.G. Zollinger, and S.L. Sarkar, (2003). Application of Modified ASTM C
1260 Test for Fly Ash-Cement Mixtures, Journal of the Transportation Research Board
1834, pp. 93-106.
Shon, C.-S., S. Lim, A.K. Mukhopadhyay, D.G. Zollinger. and S.L. Sarkar, (2002). New
Aggregate Characterization Tests for Thermal and ASR Reactivity Properties.
Proceedings, 10th
International Conference for Aggregates Research (ICAR) Annual
Symposium.
SHRP - Strategic Highway Research Program, (1993). ―Alkali-Silica Reactivity: an
Overview of Research, SHRP C-342, National Research Council, Washington, D.C.
SHRP - Strategic Highway Research Program, (1991). Handbook for the Identification of
Alkali-Silica Reactivity in Highway Structures, SHRP C-315, National Research Council,
Washington, D.C.
Sorrentino, D., J.Y. Clement, and J.M. Golberg, (1992). ―A New Approach to
Characterize the Chemical Reactivity of the Aggregates.‖ Proceedings, 9th International
Conference on Alkali-Aggregate Reaction in Concrete, Slough, England, pp. 1009-1016.
Stanton, T.E., (1940). Expansion of Concrete through Reaction between Cement and
Aggregate. Proceedings ASCE Vol. 66, pp. 1781–1811.

116
Stark, D., J.S.Y. Bhatty, (1986). ―Alkali-Silica Reactivity: Effect of Alkali in Aggregate
on Expansion,‖ Alkalies in Concrete, ASTM STP 930, American Society for Testing and
Materials, Philadelphia, Pennsylvania, pp. 16–30.
Stark, D., (1983). Osmotic Cell Test to Identify Potential for Alkali-Aggregate Reactivity,
Proceedings of the 6th International Conference on Alkali-Aggregate Reaction in
Concrete, Copenhagen, Denmark, pp. 351-357.
Stewart, Randall, (2005). ―Characterization of an Alkali-Silica-Reaction System,‖
Unpublished paper.
Strunge, H. and S. Chatterji, (1991). Studies of Alkali Silica Reaction: Part 8. Correlation
Between Mortar-Bar Expansion and Values, Cement and Concrete Research, Vol. 21,
pp. 61-65.
Swamy, R.N.,(1992). ―Testing for Alkali-Silica Reaction, The Alkali Silica Reaction in
Concrete,‖ Blackie and Sons, Glasgow, pp. 54-95.
Tang, M.S. and H. Su-Fen, (1980). ―Effect of Ca(OH)2 on Alkali-Silica Reaction,‖
Proceedings of the Eight International Congress of Cement Chemistry, Paris, France,
Vol. 2, pp. 94–99.
Tang, M., (1981). ―Some Remarks About Alkali-Silica Reactions,‖ Cement and Concrete
Research, Vol. 33, No. 117, pp. 208–219.
Tatematsu, H. and T. Sasaki, (1989). ―Proposal of a New Index for a Modified Chemical
Method.‖ Proceedings, 8th International Conference on Alkali-Aggregate Reaction in
Concrete, Kyoto, Japan, pp. 333-338.
Thomas, M.D.A., B.Q. Blackwell, and K. Pettifer, (1992).―Suppression of Damage from
Alkali Silica Reaction by Fly Ash in Concrete Dams.‖ Proceedings of the 9th
International Conference on Alkali-Aggregate Reaction in Concrete, Vol. 2, Slough,
England, 1059-1066.
Turriziani, R., (1986). Internal Degradation of Concrete: Alkali Aggregate Reaction,
Reinforcement Steel Corrosion, Proceedings of the 8th
International Congress on the
Chemistry of Cement, Rio de Janeiro, Brazil, September, Vol. I, pp. 388-442.
Uomoto, T., Y. Furusawa, and H. Ohga, (1992). A Simple Kinetics Based Model for
Predicting Alkali Silica Reaction, Proceedings, 9th
International Conference on
Alkali-Aggregate Reaction in Concrete, London, England, Vol. 2, pp. 1077-1084.
Verbeck, G.J. and C. Gramlich, (1955). Osmotic Studies and Hypotheses Concerning
Alkali-Aggregate Reaction. ASTM Proceedings, Vol. 55, pp. 1110-1128.

117
Vivian, H.E., (1981). A Working Appraisal of Alkali-Aggregate Reaction in Concrete.
Proceedings of the 5th International Conference on Alkali-Aggregate Reaction in
Concrete, Cape Town, South Africa, Paper S252/14.
Young, J.F., S. Mindess, R.J. Gray, A. Bentur, (1998). The Science and Technology of
Civil Engineering Materials. Prentice Hall.

A-1
APPENDIX A - EQUIPMENT PROTOCOL A.1. SCOPE This section provides a description of the apparatus and accessories used in the test program to measure ASR expansion of aggregate and concrete. A.2. APPARATUS The device used in this study to measure ASR expansion is called “the dilatometer”. It was originally developed at Texas Transportation Institute and has shown great potential to be a successful and a rapid method for assessing aggregate reactivity. The dilatometer consists of a stainless steel cylinder, a Teflon-coated brass (Figure A-1), a stainless steel hollow tower (Figure A-2) and a steel float. The pot is made of Stainless steel: “1.4401 X5CrNiMo17-12-2 316 S31600”. The type of brass used for the lid is the Naval brass; similar to admiralty brass; is a 40 percent zinc brass and 1 percent tin. The tower was made from Stainless steel S31600. At the top of the tower, a casing is installed to ensure proper alignment of the Linear variable differential transducer (LVDT) and the float (Figure A-3). The LVDT used is the SCHAEVITZ Model 1000 HCA, which has a maximum range of 2 inch. The LVDT is then pushed into O-ring (2-112 buna-n) located at the bottom of the casing (Figure A-4) and then secured with six set screws that come though the side of the cylinder. A thermocouple is inserted from the side of the dilatometer to measure the temperature of the solution. The TJ36-CPSS-18G-6 T/C Assembly w/trans joint is used and it is tied to the dilatometer using the SSLK -18-18 1/8*1/8 Compression Fitting. A detailed drawing of the assembled parts of the dilatometer is shown in Figure A-5. As chemical reaction between the aggregate and the NaOH solution is in progress, ASR gel is formed. This gel absorbs water leading to an increase in total volume. Therefore, the rod connected to the float moves upwards and electrical signals are generated. The signals generated are so small in magnitude that the Analog-to-Digital converter (ADC) of SCXI-1600, USB Data Acquisition and Control Module can’t process them. Therefore, signal conditioners are needed to a) Amplify the current, b) Filter and/or remove the noise of a signal) and c) Make the sensor output available for reading by computer boards. The signal conditioners for the thermocouple and LVDT used are the SCXI-1102 32-Channel Thermocouple Amplifier and the SCXI-1540 8-Channel LVDT Input Module respectively. All signal conditioner and the DAQ card are hold together in the SCXI-1000 4-Slot Chassis. The use of Chassis is to provide power to the signal conditioner and to hold the terminal block, the DAQ card and the SCXI’s tight together.

A-2
7.000"
6.500"
6.500"
6.000"
0.250"
1.270"
0.500"
0.550"
0.500"
0.563"2.325"
0.712"
Figure A-1 Stainless steel pot + Brass lid.
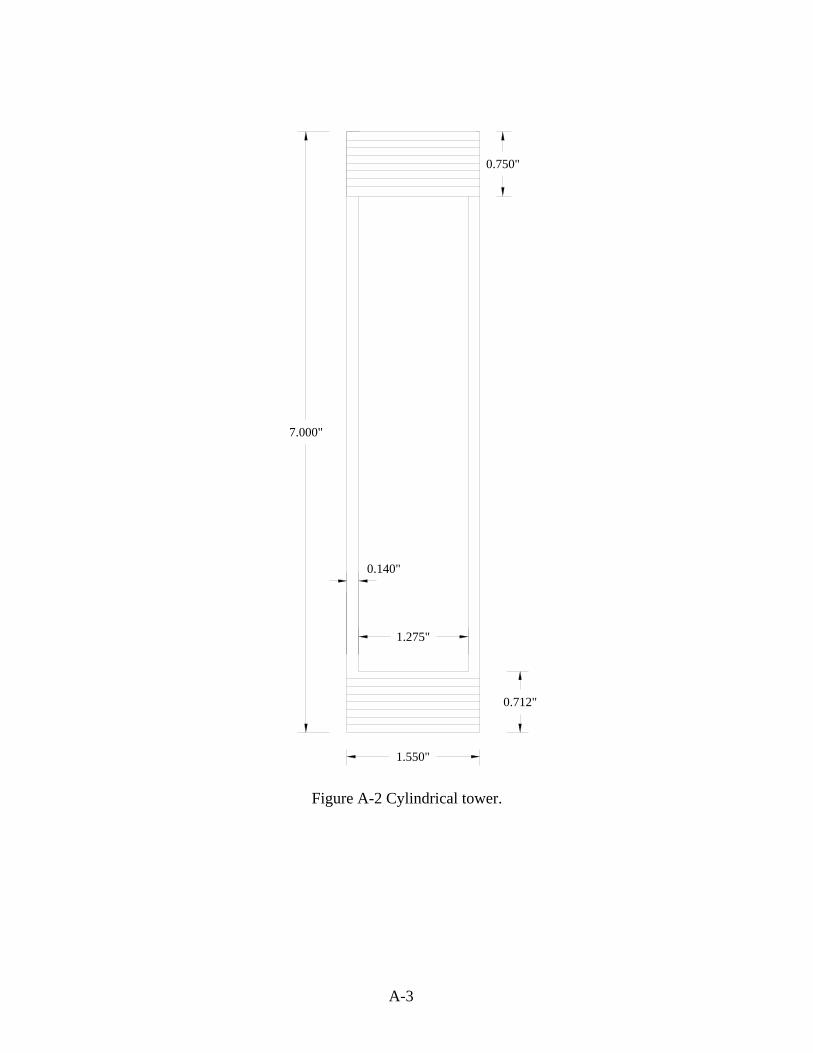
A-3
7.000"
0.712"
1.275"
1.550"
0.140"
0.750"
Figure A-2 Cylindrical tower.
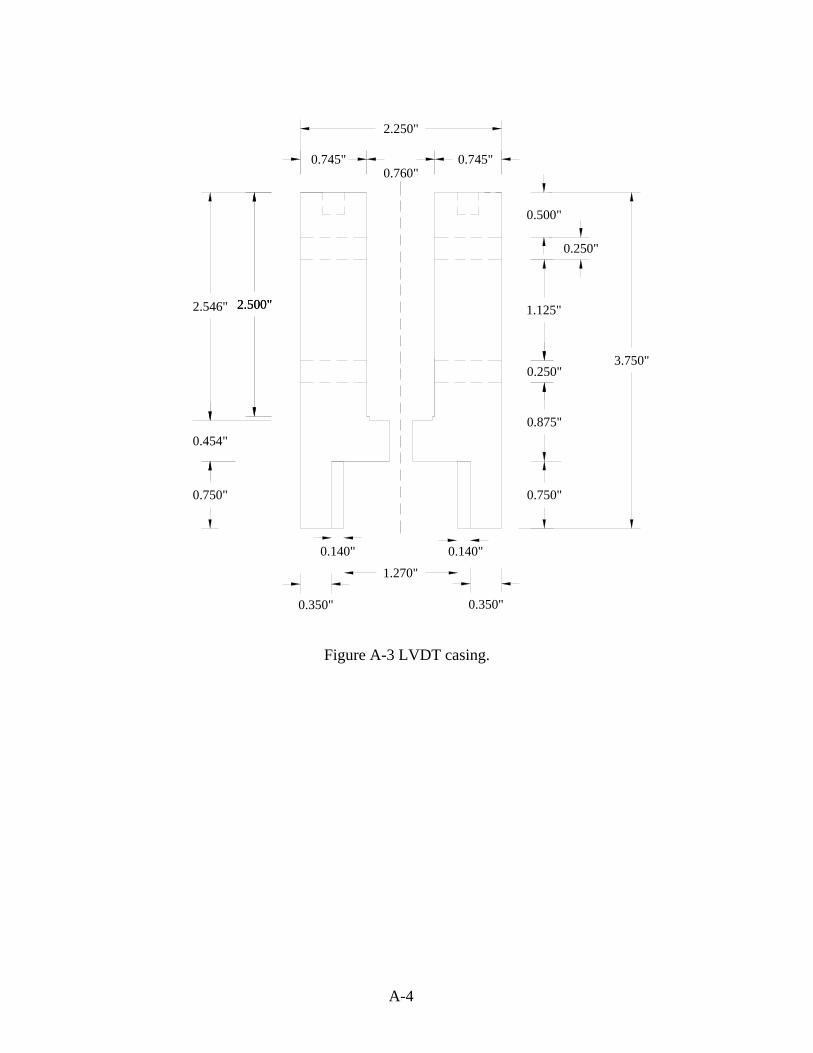
A-4
0.750"0.750"
0.454"
3.750"
0.350"
1.270"
0.140"
0.350"
0.140"
2.546" 2.500"2.500"
0.760"
2.250"
0.500"
1.125"
0.875"
0.250"
0.250"
0.745"0.745"
Figure A-3 LVDT casing.

A-5
0.028"
0.046"
0.222"
0.500"
0.260"
0.222"
0.028"
Figure A-4 Detailed drawings of the central part of the casing.
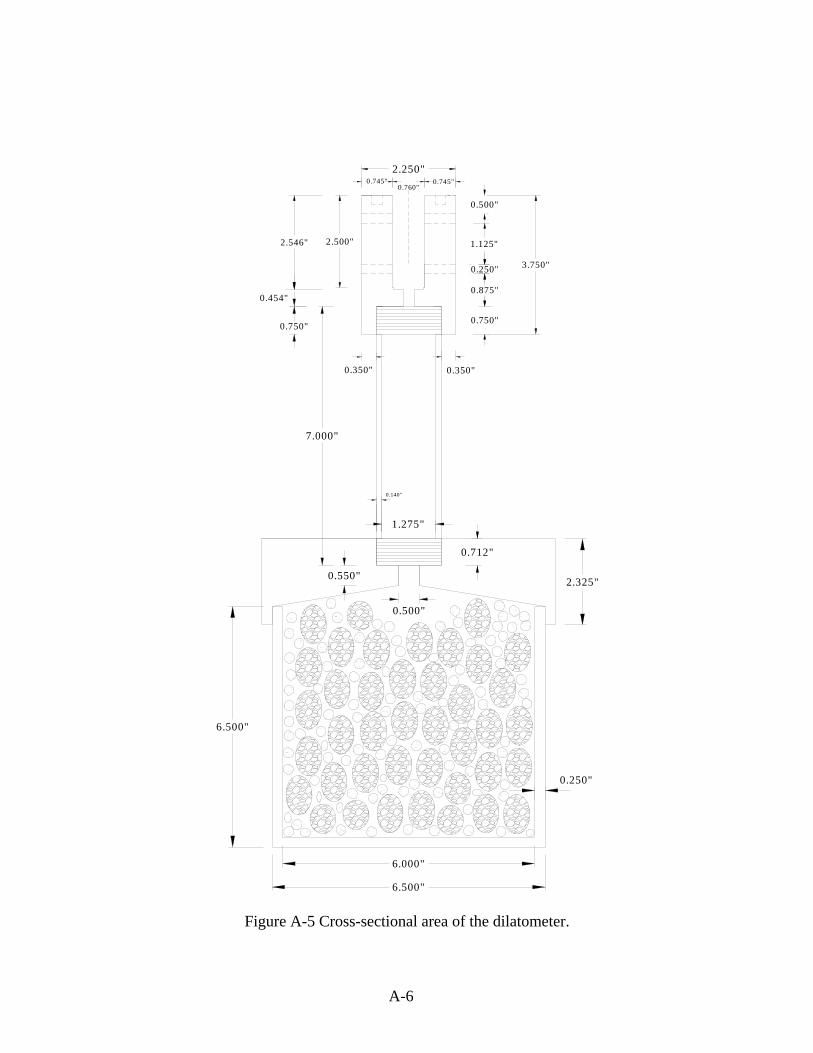
A-6
7.000"
0.550"
6.000"
6.500"
6.500"
0.250"
2.325"
0.712"
0.500"
1.275"
0.350"
2.546" 2.500"
0.750"
0.454"
0.250"
1.125"
3.750"
0.140"
0.350"
0.750"
0.875"
0.760"
2.250"0.745" 0.745"
0.500"
Figure A-5 Cross-sectional area of the dilatometer.

B-1
APPENDIX B – EARLIER MODEL TO CALCULATE ACTIVATION ENERGY
The determination of the ASR activation energy (Ea) of aggregates is accomplished through a series of steps. First, the rate constant and ultimate expansion is determined. This is done by analyzing the expansion data at a constant temperature using the following equation (Carino 1984):
T 0
0T 0
K (t t )1 K (t t )
−ε = ε
+ − (B-1)
where ε = Expansion
0ε = Ultimate expansion of the aggregate
TK = Rate constant at temperature T (1/day) t = Actual reactive age at temperature T (day), and
0t = Theoretical initial reaction time (day).
Transforming equation (B-1) into a linear format, 0ε and TK can be evaluated using,
0 0 T 0
1 1 1K (t t )
= +ε ε ε −
(B-2)
and using linear regression analysis, by plotting 1/ ε vs. 1/( 0t t− ) as shown in Figure B-1. The trend line is used to evaluate TK and reveals that the inverse of the intercept value is the ultimate expansion of aggregate. The rate constant and the ultimate expansion at three different temperatures from the above model are determined using linear regression. The second step is to determine the activation energy (Ea) which characterizes the ASR susceptibility of aggregate. Activation energy is related to rate theory in terms of the Arrhenius function. The Arrhenius function is based on the law of acceleration due to a series of simple chemical reactions that integrate the combined effects of temperature and time relative to the kinetics of aggregate expansion into a single parameter. To use the Arrhenius equation, the natural log of the rate constant (KT) for a given temperature is plotted against 1/Temperature (Figure B-2). The negative of the slope of the straight line is equal to the activation energy divided by the gas constant and can be evaluated again from the use of linear regression. This approach provides a means for activation energy to be used to characterize the ASR susceptibility of aggregate. Even though the alkali-silica reaction implies several simultaneous and coupled chemical reactions, this methodology lays the groundwork to possibly describe the coupled effects of normality and time relative to the kinetics of ASR expansion into a single parameter.

B-2
Figure B-1 Reciprocal of expansion versus reciprocal of age.
TLn K
1T
aER
Figure B-2 Determination of activation energy.
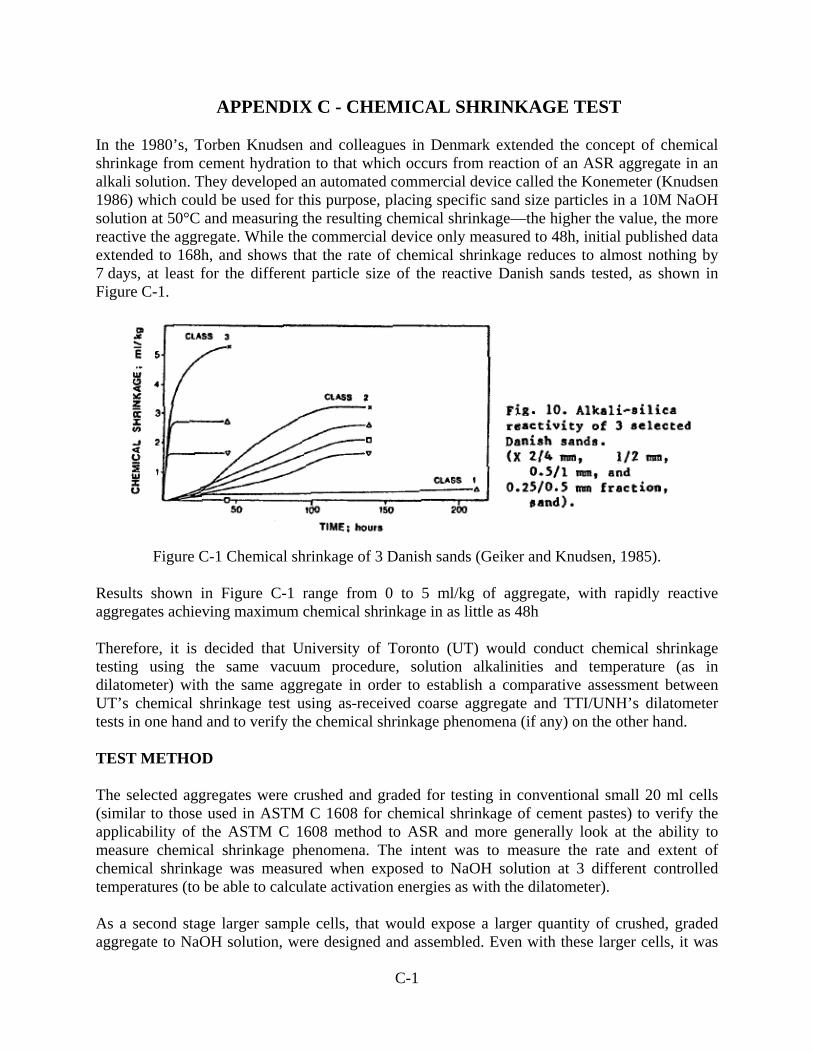
C-1
APPENDIX C - CHEMICAL SHRINKAGE TEST
In the 1980’s, Torben Knudsen and colleagues in Denmark extended the concept of chemical shrinkage from cement hydration to that which occurs from reaction of an ASR aggregate in an alkali solution. They developed an automated commercial device called the Konemeter (Knudsen 1986) which could be used for this purpose, placing specific sand size particles in a 10M NaOH solution at 50°C and measuring the resulting chemical shrinkage—the higher the value, the more reactive the aggregate. While the commercial device only measured to 48h, initial published data extended to 168h, and shows that the rate of chemical shrinkage reduces to almost nothing by 7 days, at least for the different particle size of the reactive Danish sands tested, as shown in Figure C-1.
Figure C-1 Chemical shrinkage of 3 Danish sands (Geiker and Knudsen, 1985).
Results shown in Figure C-1 range from 0 to 5 ml/kg of aggregate, with rapidly reactive aggregates achieving maximum chemical shrinkage in as little as 48h Therefore, it is decided that University of Toronto (UT) would conduct chemical shrinkage testing using the same vacuum procedure, solution alkalinities and temperature (as in dilatometer) with the same aggregate in order to establish a comparative assessment between UT’s chemical shrinkage test using as-received coarse aggregate and TTI/UNH’s dilatometer tests in one hand and to verify the chemical shrinkage phenomena (if any) on the other hand. TEST METHOD The selected aggregates were crushed and graded for testing in conventional small 20 ml cells (similar to those used in ASTM C 1608 for chemical shrinkage of cement pastes) to verify the applicability of the ASTM C 1608 method to ASR and more generally look at the ability to measure chemical shrinkage phenomena. The intent was to measure the rate and extent of chemical shrinkage was measured when exposed to NaOH solution at 3 different controlled temperatures (to be able to calculate activation energies as with the dilatometer).
As a second stage larger sample cells, that would expose a larger quantity of crushed, graded aggregate to NaOH solution, were designed and assembled. Even with these larger cells, it was
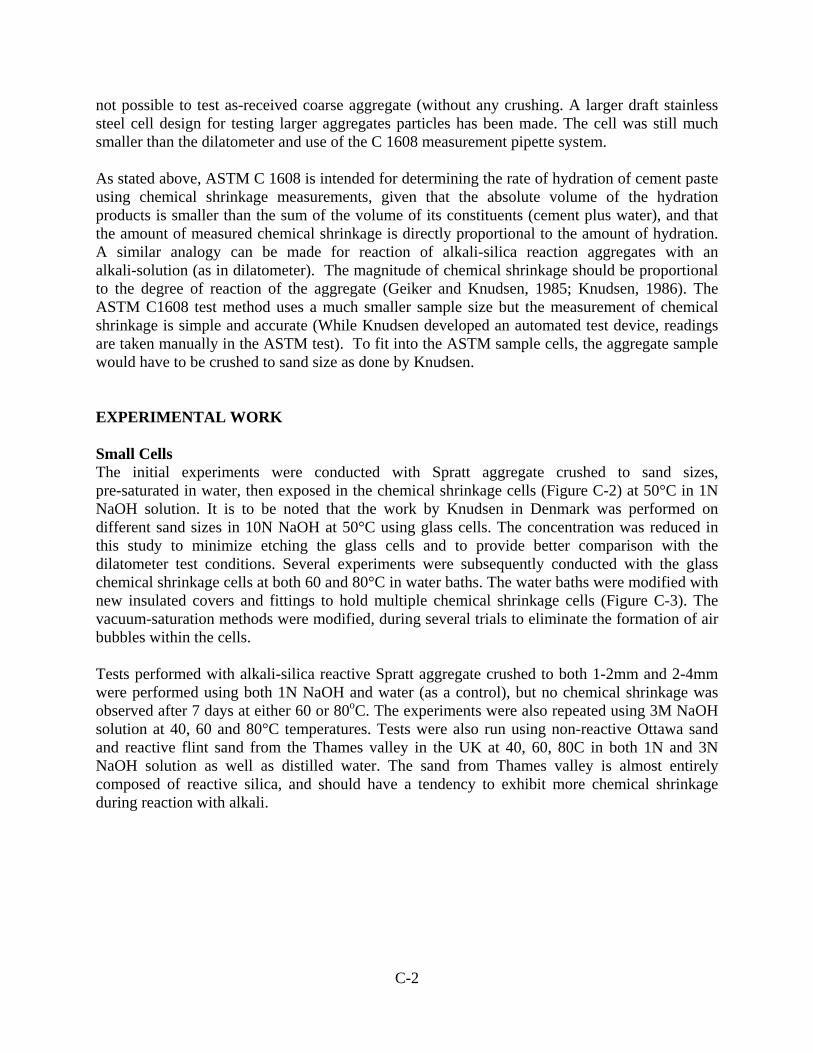
C-2
not possible to test as-received coarse aggregate (without any crushing. A larger draft stainless steel cell design for testing larger aggregates particles has been made. The cell was still much smaller than the dilatometer and use of the C 1608 measurement pipette system.
As stated above, ASTM C 1608 is intended for determining the rate of hydration of cement paste using chemical shrinkage measurements, given that the absolute volume of the hydration products is smaller than the sum of the volume of its constituents (cement plus water), and that the amount of measured chemical shrinkage is directly proportional to the amount of hydration. A similar analogy can be made for reaction of alkali-silica reaction aggregates with an alkali-solution (as in dilatometer). The magnitude of chemical shrinkage should be proportional to the degree of reaction of the aggregate (Geiker and Knudsen, 1985; Knudsen, 1986). The ASTM C1608 test method uses a much smaller sample size but the measurement of chemical shrinkage is simple and accurate (While Knudsen developed an automated test device, readings are taken manually in the ASTM test). To fit into the ASTM sample cells, the aggregate sample would have to be crushed to sand size as done by Knudsen.
EXPERIMENTAL WORK
Small Cells The initial experiments were conducted with Spratt aggregate crushed to sand sizes, pre-saturated in water, then exposed in the chemical shrinkage cells (Figure C-2) at 50°C in 1N NaOH solution. It is to be noted that the work by Knudsen in Denmark was performed on different sand sizes in 10N NaOH at 50°C using glass cells. The concentration was reduced in this study to minimize etching the glass cells and to provide better comparison with the dilatometer test conditions. Several experiments were subsequently conducted with the glass chemical shrinkage cells at both 60 and 80°C in water baths. The water baths were modified with new insulated covers and fittings to hold multiple chemical shrinkage cells (Figure C-3). The vacuum-saturation methods were modified, during several trials to eliminate the formation of air bubbles within the cells. Tests performed with alkali-silica reactive Spratt aggregate crushed to both 1-2mm and 2-4mm were performed using both 1N NaOH and water (as a control), but no chemical shrinkage was observed after 7 days at either 60 or 80oC. The experiments were also repeated using 3M NaOH solution at 40, 60 and 80°C temperatures. Tests were also run using non-reactive Ottawa sand and reactive flint sand from the Thames valley in the UK at 40, 60, 80C in both 1N and 3N NaOH solution as well as distilled water. The sand from Thames valley is almost entirely composed of reactive silica, and should have a tendency to exhibit more chemical shrinkage during reaction with alkali.
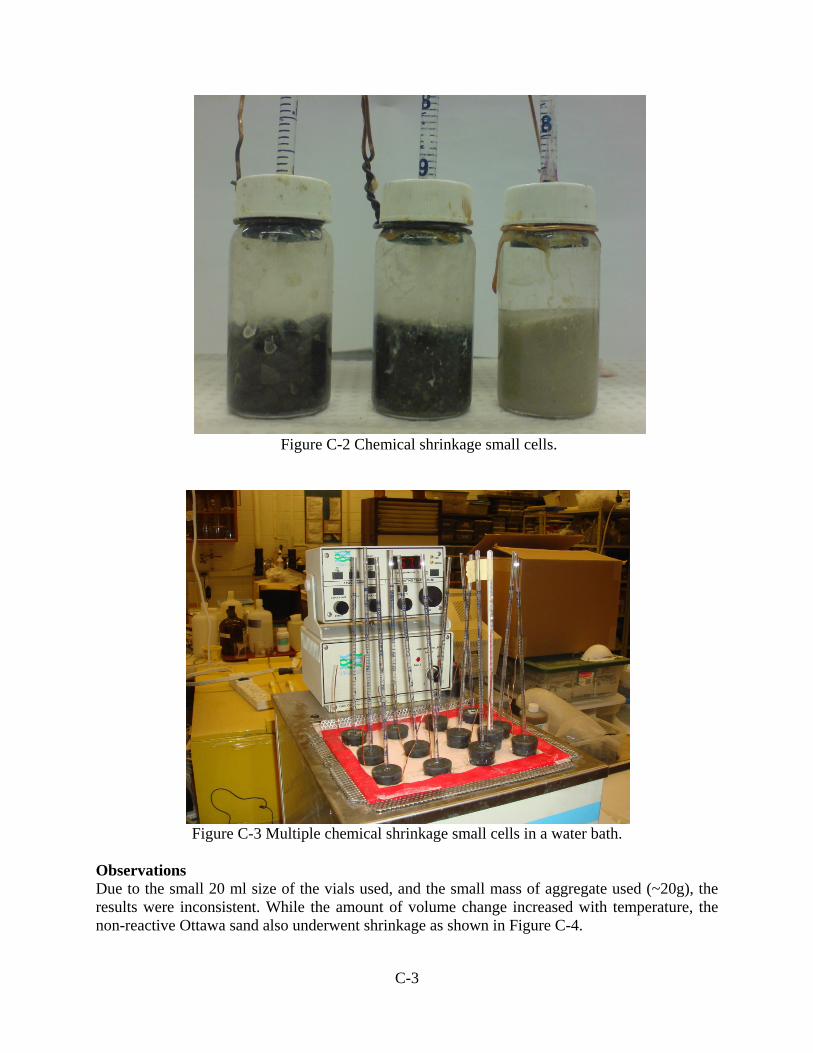
C-3
Figure C-2 Chemical shrinkage small cells.
Figure C-3 Multiple chemical shrinkage small cells in a water bath.
Observations Due to the small 20 ml size of the vials used, and the small mass of aggregate used (~20g), the results were inconsistent. While the amount of volume change increased with temperature, the non-reactive Ottawa sand also underwent shrinkage as shown in Figure C-4.

C-4
Figure C-4 Shrinakge of non-reactive Ottawa sand in 1N NaOH at 3 temperatures.
Larger Cell Test Procedures Three samples of the crushed aggregate were tested using the gradation of ASTM C1260, with the exception that the smallest sand fraction (retained on No.100) was not used, and was replaced by the sand fraction retained on the No.50 sieve to prevent loss of small particles. Due to the exploratory nature of these tests, the aggregates were crushed to expose more surface area and accelerate any chemical shrinkage. The samples (dry sand) were placed in the 1.0L stainless steel desiccator jar under vacuum for 3 hours to remove any air. Distilled water and 10 molar sodium hydroxide solution were also placed under vacuum with the samples. After 3 hours, the samples were saturated with de-aired water; while maintaining the vacuum for 1 hour. Saturated samples were left overnight under atmospheric conditions. The next day, water was decanted from the flasks and exchanged with the de-aired 10 molar sodium hydroxide solution by repeated mixing and decanting (twice). Saturated with solution, the samples were separately placed into the desiccator under vacuum for 45 minutes, and using a vibration table to remove any remaining trapped air. The sample cells were topped up with NaOH solution, the lids were fixed, and then immediately placed in a preheated water bath at 60ºC. The bath was covered with rigid foam insulation, with holes cut for the pipette measuring devices (Figure C-5). An initial measurement was recorded, and any expansion experienced due to the temperature adjustment was measured. Once thermal equilibrium was achieved, a drop of paraffin oil was syringed into each pipette to prevent evaporation of the alkali solution.
0
0.1
0.2
0.3
0.4
0.5
0.6
0 2 4 6 8
Time(days)
Vol.
Cha
nge
(mL)
80C60C40C

C-5
Figure C-5 large cells in water bath with pipettes exposed.
Observations Triplicate tests of 1700g Spratt aggregate were performed in 10N NaOH solution at 60ºC for 116 hours. Three sets of tests were performed, but only the chemical shrinkage from the third set is shown in Figures C-6. Maximum chemical shrinkage values of 7 to 9.5 ml/kg were measured, which is more than those of the reactive Danish sands shown in Figure C-1.
Chemical Shrinkage of Spratt
0
0.002
0.004
0.006
0.008
0.01
0.012
0 20 40 60 80 100 120
Time (hrs)
Volu
me
(mL/
g)
Sample 1Sample 2Sample 3

C-6
Figure C-6 Chemical shrinkage of crushed Spratt aggregate in 10N NaOH solution at 60ºC, (a) with linear time scale, and (b) in log time scale.
However, when the crushed Nebraska gravel was tested, as shown in Figure C-7, after an initial shrinkage of about 2.5 ml/kg, a slow continuous expansion was observed. This was repeated in all 3 trials.
Figure C-7 Chemical shrinkage of crushed Nebraska gravel in 10N NaOH solution at 60ºC.
Chemical Shrinkage of Spratt
0
0.002
0.004
0.006
0.008
0.01
0.012
0 1 10 100 1000
Log Time (hrs)
Volu
me
(mL/
g)
Sample 1Sample 2Sample 3
Nebraska gravel Trial 3
0
0.5
1
1.5
2
2.5
3
3.5
0 50 100 150
Time (Hours)
Volu
me
Cha
nge
(mL/
kg)
Sample 1Sample 2Sample 3

C-7
The reason for this behaviour is not clear. The effect of evaporation, aggregate absorption needs to be taken into account in order to have a better interpretation of those results. Unfortunately, the student performing the work was unable to continue the experiments further. The chemical shrinkage obviously needs further development before it could be considered seriously.


D-1
APPENIX D – UNH AGGREGATE EXPANSION CHARACTERISTICS AND ACTIVATION ENERGY
PLATTE RIVER GRAVEL DATA Table D-1 ASR material parameters for Platte River Gravel (PRG).
Aggregate Type
Alkalinity (NaOH)
Temp (°C)
ASR Aggregate Parameters
0ε (%) ρ 0t β Ea
(KJ/mol)
Spratt Limestone 1 N
60 0.0265 124.9 6.78 0.23 66.4 70 0.0441 15.8 3.49 1.41
80 0.1304 14.8 5.66 0.90

D-2
PRGT = 60 C
1 N NaOH
0
0.01
0.02
0.03
0.04
0.05
0.06
0.07
0.08
0.09
0.1
0 20 40 60 80 100
Time (hrs)
ASR
Exp
ansi
on (%
) .
Measured Exp Data
Calculated Exp Data
PRGT = 70 C
1 N NaOH
0
0.02
0.04
0.06
0.08
0.1
0.12
0.14
0 20 40 60 80 100
Time (hrs)
ASR
Exp
ansi
on (%
) .
Measured Exp Data
Calculated Exp Data
(a) PRG expansion at 60°C (b) PRG expansion at 70°C
PRGT = 80 C
1 N NaOH
0
0.02
0.04
0.06
0.08
0.1
0.12
0.14
0 20 40 60 80 100
Time (hrs)
ASR
Exp
ansi
on (%
) .
Measured Exp Data
Calculated Exp Data
y = -7986.7x + 22.902R2 = 0.537
Ea = 66.4 KJ/mol
-2.0
-1.0
0.0
1.0
2.0
0.003 0.003 0.003 0.003 0.003 0.003
1/Temp
Ln (B
eta)
.
(c) PRG expansion at 80°C (d) Determination of activation energy
Figure D-1 Expansion Characteristics of PRG aggregate at 1 NaOH.

D-3
SPRATT LIMESTONE Table D-2 ASR material parameters for Spratt Limestone (SL).
Aggregate Type
Alkalinity (NaOH)
Temp (°C)
ASR Aggregate Parameters
0ε (%) ρ 0t β Ea
(KJ/mol)
Spratt Limestone 1 N
60 0.064 37.0 15.5 0.68 53.0 70 0.077 13.5 14.6 0.86
80 0.138 19.0 10.9 2.04

D-4
S.L.T = 60 C
1 N NaOH
0
0.04
0.08
0.12
0.16
0.2
0 10 20 30 40 50 60 70 80
Time (hrs)
ASR
Exp
ansi
on (%
) .
Measured Exp Data
Calculated Exp Data
S.L.T = 70 C
1 N NaOH
0
0.05
0.1
0.15
0.2
0 10 20 30 40 50 60 70 80
Time (hrs)
ASR
Exp
ansi
on (%
) .
Measured Exp Data
Calculated Exp Data
(a) SL expansion at 60°C (b) SL expansion at 70°C
S.L.T = 80 C
1 N NaOH
0
0.05
0.1
0.15
0.2
0 10 20 30 40 50 60 70 80
Time (hrs)
ASR
Exp
ansi
on (%
) .
Measured Exp Data
Calculated Exp Data
y = -6384.3x + 18.68R2 = 0.88
Ea = 53.0 KJ/mol
-1.5
-0.5
0.5
1.5
0.003 0.003 0.003 0.003 0.003 0.003
1/Temp
Ln (B
eta)
.
(c) SL expansion at 80°C (d) Determination of activation energy
Figure D-2 Expansion characteristics of SL aggregate at 1 NaOH.

E-1
APPENDIX E - DEVELOPMENT OF A REACTION SIGNATURE FOR COMBINED CONCRETE MATERIALS
1. SCOPE This section covers the determination of threshold amount of total alkalis to be allowed in concrete mixture for controlling ASR based on a performance assessment of a given combination of materials. 2. APPARATUS Dilatometer device (detailed description is given in Chapter 4) is used to conduct necessary concrete testing to develop the protocol for combined concrete materials. 3. PREPARATION OF ALKALINE SOLUTION The 1.5N, 1.0 N, 0.5N and 0.3N NaOH solutions are prepared by diluting 60, 40, 20, and 12g of sodium hydroxide crystals into 0.9 Liter of distilled water. Then water is added to raise the total volume of solution to 1 liter. Ca(OH)2 is then added to each solution till saturation. 4. CONCRETE SPECIMEN PREPARATION AND TEST PROCEDURE A step by step concrete specimen preparation is described below:
4.1. A special concrete specimen (4 inch dia. and 5.5 inch height with a central hole of 1 inch dia.) is cast and cured in moist room for 24 hours
4.2. Concrete specimen is demolded after 24 hours and immersed in lime saturated water and cured for 14 days
4.3. The specimen is then transferred to dilatometer and filled up with the selected alkaline solution (e.g., 1.5N, 1N, 0.5N (NaOH + Ca(OH)2))
4.4. The dilatometer is subjected to 3 hrs vacuuming to remove entrapped air 4.5. The dilatometer is then placed in a water bath to raise the temperature to the
target temperature. 4.6. A second round of vacuuming at target temperature is then applied for 1 hr. 4.7. The stainless steel float is inserted into the tower and the casing is securely
placed at the top of the tower. An airtight situation is ensured through the use of O-rings in all the three junctions (lid-tower, tower-casing, casing-LVDT housing etc.) in the dilatometer system
4.8. The dilatometer is then placed in the oven. It takes around 4-5 hrs for the alkaline solution to be equilibrated with the temperature of the oven.
4.9. LVD movement after the stabilizing period represent movement due to ASR 4.10. LVDT movement and temperature are continuously recorded through data
acquisition system till 10-15 days with 1 hour data interval.
E-2
5. CALIBRATION PROCEDURE A calibration procedure is developed in order to determine the net LVDT displacement due to ASR. The steps of the calibration procedure are described below
5.1. Four dilatometer tests (according to the procedure in item 4), i.e., two with concrete-solution and two with concrete-lime saturated water (LSW) are conducted at the selected target temperature (inside oven) for a concrete mixture. The results of the two concrete-solution tests and two concrete–LSW test are used to verify the repeatability (discussed later). The data are recorded and monitored for 10-15 days.
5.2. After terminating the test, the LVDT movement (inch) and temperature are plotted as a function of time (hours) for both concrete-solution and concrete-LSW tests.
5.3. A reference time on the LVDT movement (y-axis)-time (x-axis) plot is then chosen based on the amount of time for the dilatometer temperature to reach the target temperature and stabilize at a constant LVDT displacement. It generally takes around 4-5 hours after beginning the test at oven. The selection of reference time by this procedure is conducted for both the concrete-solution and concrete-LSW tests.
5.4. All subsequent LVDT readings after the reference time are subtracted from the LVDT reading at the reference time (item 5.3) for both the concrete-solution and concrete–LSW tests.
5.5. The difference in the magnitude between the LVDT movements of concrete-solution and concrete-LSW test determined in item 5.4 represents the LVDT displacement due to ASR. An upward displacement is a measure of expansion due to ASR.
5.6. The percent expansion due to ASR is then calculated based on the same procedure as described in aggregate reactivity protocol for both the concrete solution tests
5.7. Volume expansion percent of the tested concrete as a function of time is then reported
6. DETERMINATION OF CHARACTERISTIC CONCRETE ASR
PARAMETERS The measured expansion–time data is then modeled using the same model as used in aggregate reactivity protocol to calculate the ultimate ASR expansion (εu) of the tested concrete. 7. PROCEDURE TO DETERMINE THRESHOLD TOTAL ALKALIS IN
CONCRETE Six samples from a single concrete mixture need to be tested at six different levels of test solution alkalinity (e.g., 1.5N, 1N, 0.5N, and 0.3N (NaOH + Ca(OH)2)) and temperatures. Ultimate expansion (εu) corresponding to different levels of alkalinity and temperature for
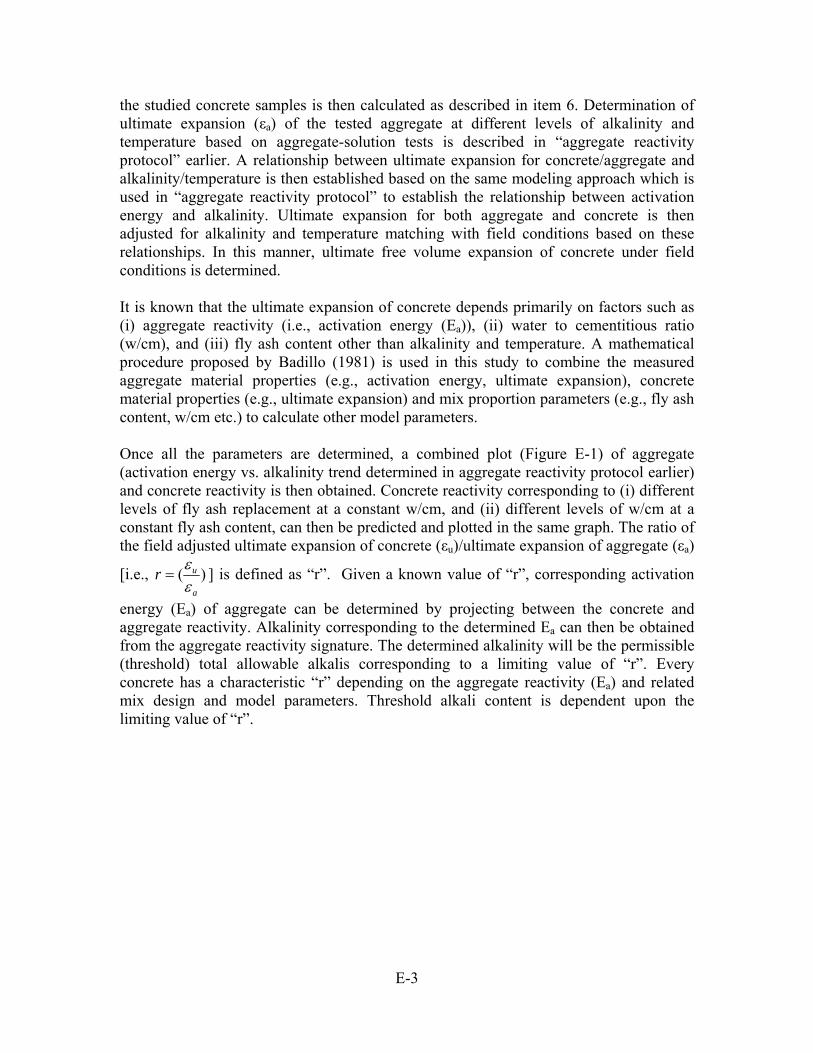
E-3
the studied concrete samples is then calculated as described in item 6. Determination of ultimate expansion (εa) of the tested aggregate at different levels of alkalinity and temperature based on aggregate-solution tests is described in “aggregate reactivity protocol” earlier. A relationship between ultimate expansion for concrete/aggregate and alkalinity/temperature is then established based on the same modeling approach which is used in “aggregate reactivity protocol” to establish the relationship between activation energy and alkalinity. Ultimate expansion for both aggregate and concrete is then adjusted for alkalinity and temperature matching with field conditions based on these relationships. In this manner, ultimate free volume expansion of concrete under field conditions is determined. It is known that the ultimate expansion of concrete depends primarily on factors such as (i) aggregate reactivity (i.e., activation energy (Ea)), (ii) water to cementitious ratio (w/cm), and (iii) fly ash content other than alkalinity and temperature. A mathematical procedure proposed by Badillo (1981) is used in this study to combine the measured aggregate material properties (e.g., activation energy, ultimate expansion), concrete material properties (e.g., ultimate expansion) and mix proportion parameters (e.g., fly ash content, w/cm etc.) to calculate other model parameters. Once all the parameters are determined, a combined plot (Figure E-1) of aggregate (activation energy vs. alkalinity trend determined in aggregate reactivity protocol earlier) and concrete reactivity is then obtained. Concrete reactivity corresponding to (i) different levels of fly ash replacement at a constant w/cm, and (ii) different levels of w/cm at a constant fly ash content, can then be predicted and plotted in the same graph. The ratio of the field adjusted ultimate expansion of concrete (εu)/ultimate expansion of aggregate (εa)
[i.e., ( )u
a
r εε
= ] is defined as “r”. Given a known value of “r”, corresponding activation
energy (Ea) of aggregate can be determined by projecting between the concrete and aggregate reactivity. Alkalinity corresponding to the determined Ea can then be obtained from the aggregate reactivity signature. The determined alkalinity will be the permissible (threshold) total allowable alkalis corresponding to a limiting value of “r”. Every concrete has a characteristic “r” depending on the aggregate reactivity (Ea) and related mix design and model parameters. Threshold alkali content is dependent upon the limiting value of “r”.
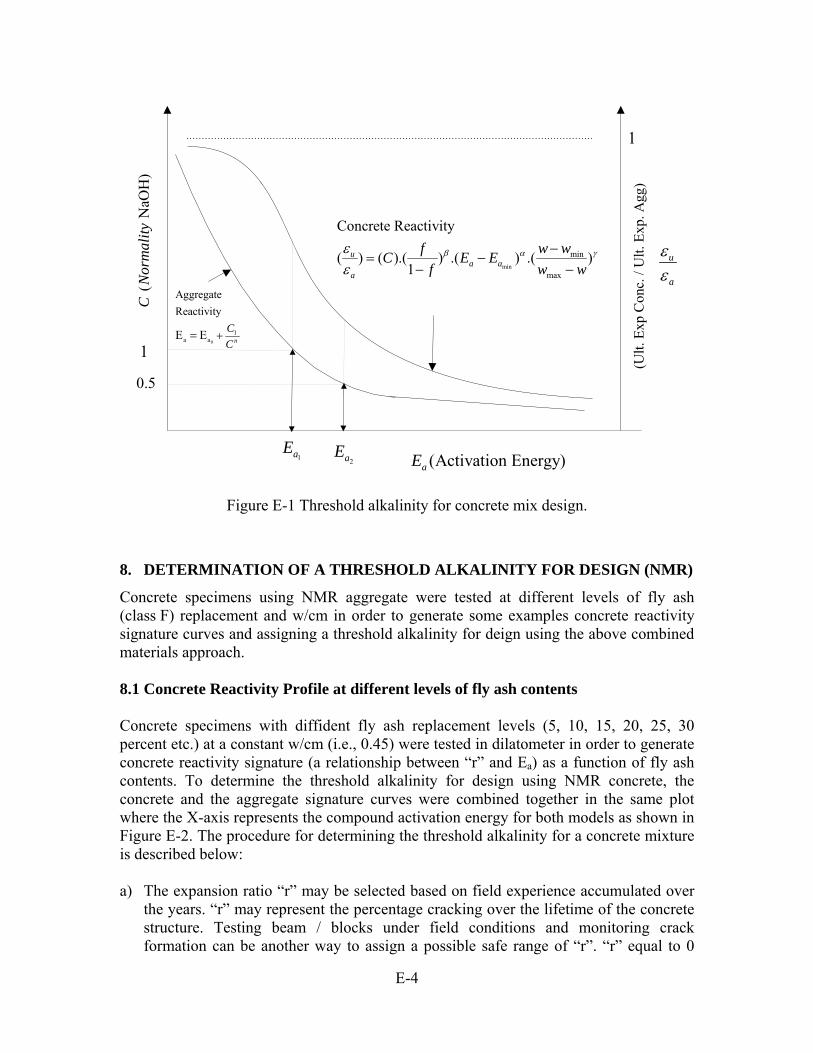
E-4
(Activation Energy)aE
( N
aOH
)C
Nor
mal
ity
0.5
1
1aE2aE
u
a
εε
1
0
1a a
Aggregate Reactivity
E E n
CC
+=
min
min
max
Concrete Reactivity
( ) ( ).( ) .( ) .( )1
ua a
a
w wfC E Ef w w
β α γεε
−= −
− −
(Ult.
Exp
Con
c. /
Ult.
Exp
. Agg
)
Figure E-1 Threshold alkalinity for concrete mix design.
8. DETERMINATION OF A THRESHOLD ALKALINITY FOR DESIGN (NMR)
Concrete specimens using NMR aggregate were tested at different levels of fly ash (class F) replacement and w/cm in order to generate some examples concrete reactivity signature curves and assigning a threshold alkalinity for deign using the above combined materials approach. 8.1 Concrete Reactivity Profile at different levels of fly ash contents Concrete specimens with diffident fly ash replacement levels (5, 10, 15, 20, 25, 30 percent etc.) at a constant w/cm (i.e., 0.45) were tested in dilatometer in order to generate concrete reactivity signature (a relationship between “r” and Ea) as a function of fly ash contents. To determine the threshold alkalinity for design using NMR concrete, the concrete and the aggregate signature curves were combined together in the same plot where the X-axis represents the compound activation energy for both models as shown in Figure E-2. The procedure for determining the threshold alkalinity for a concrete mixture is described below: a) The expansion ratio “r” may be selected based on field experience accumulated over
the years. “r” may represent the percentage cracking over the lifetime of the concrete structure. Testing beam / blocks under field conditions and monitoring crack formation can be another way to assign a possible safe range of “r”. “r” equal to 0

E-5
corresponds to no cracking in concrete due to ASR whereas “r” equal to 1 represents situation of extensive cracking. For demonstration purposes, r is selected in this case to be equal to 0.4. A dotted horizontal line is drawn at r = 0.4 (Figure E-2). The points where this line crosses the curves (r vs. Ea) at different levels of fly ash contents are indicated as 1.1, 2.1, 3.1, 4.1, and 5.1. From each of the five points, a vertical dotted line was drawn to meet the aggregate reactivity curve (Ea vs. alkalinity) at five different points. The Ea values corresponding to these five points are 367 (1.2), 277 (2.2), 156 (3.2), 70 (4.2), 29 (5.2) KJ/mol respectively. The alkalinity values corresponding to these five points are 0.04N (1.3), 0.05N (2.3). 0.075N (3.3), 0.14N (4.3), 0.31N (5.3) respectively
b) Since the total amount of cement alkali is generally expressed in terms of “sodium equivalent”, the determined threshold alkalinities for different fly ash content were converted to percent Na2Oequivalent. The results are as follows: for concrete mixtures with a w/cm equal to 0.45, the percent Na2Oequivalent is equal to 0.046 percent, 0.0575 percent, 0.086 percent, 0.161 percent and 1.18 percent for mixtures containing 10 percent, 15 percent, 20 percent, 25 percent, 30 percent class F fly ash respectively. The higher the fly ash content the higher is the threshold alkalinity. For example, the threshold alkalinity is 0.31N (1.18 percent Na2Oeq.) with fly ash content 30 percent whereas it is 0.04N (0.046 percent Na2Oeq.) with fly ash content 10 percent. It is important to mention that the threshold alkali content, above which ASR expansion occurs, is a function of aggregate reactivity as well as fly ash contents and not a fixed value.
c) Practically, the designer will select one optimum percent of fly ash content needed to control the alkalinity of the pore solution of the concrete.
One has to state that the type I/II cement used in this research program contains 0.54 percent Na2Oequivalent. This number is well above the threshold alkalinities mentioned above without fly ash. Since alkalis can come from many sources, like cement, SCM’s, aggregate, etc, achieving a total threshold alkalinity below 0.28 percent is not possible. From practical point of view it is better to select the type of cement that contains the minimum amount of alkali (Type I/II) or select the total allowed alkalinity of the pore solution and determine the percent of fly ash required to keep r values minimum. Lab tests have shown that although limited expansion is possible using total alkali content below 3 kg/m3, concrete structures in the field have displayed damage at lower alkali values, especially when aggregate and other sources (i.e. deicing salts) has contributed to the total alkali of the mixtures (Folliard et al, 2007). Therefore, there is interest in keeping the total alkali content below the 3 kg/m3 (5 lb/yd3). The procedure to determine the percent fly ash replacement to keep r values minimum based on selected threshold total alkalinity is presented in Figures E-3 and E-4 and described below:
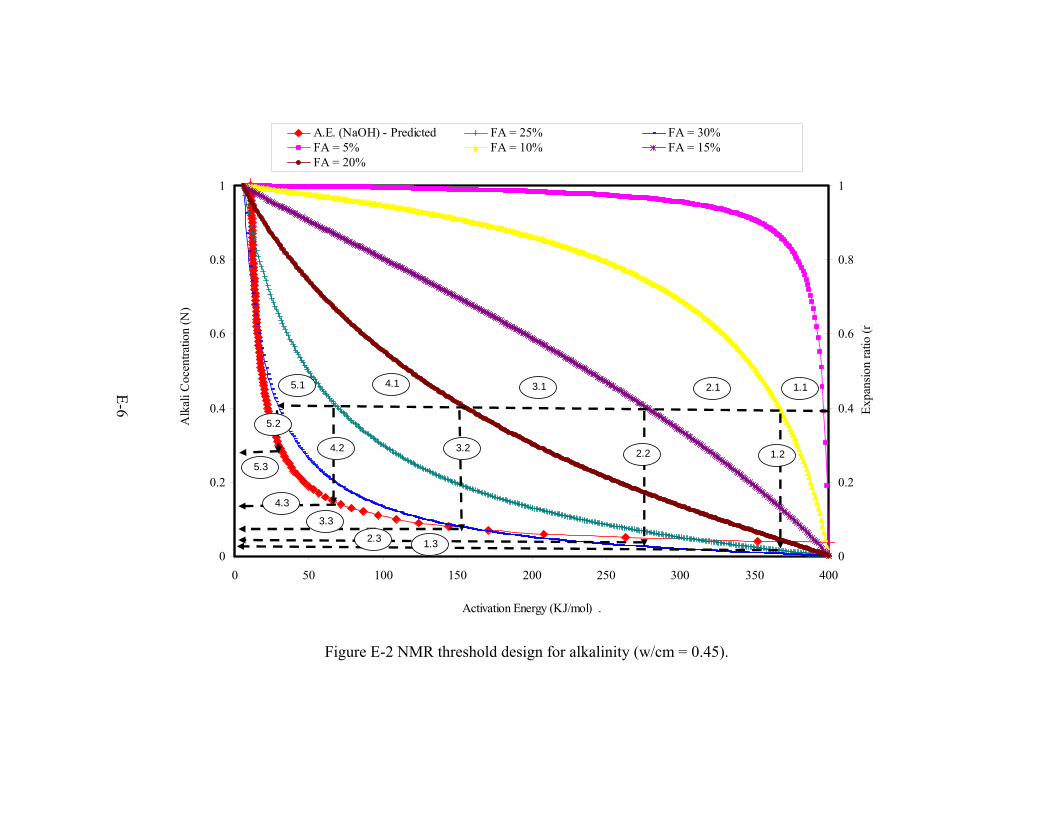
Figure E-2 NMR threshold design for alkalinity (w/cm = 0.45).
0
0.2
0.4
0.6
0.8
1
0 50 100 150 200 250 300 350 400
Activation Energy (KJ/mol) .
Alk
ali C
ocen
tratio
n (N
)
0
0.2
0.4
0.6
0.8
1
Expa
nsio
n ra
tio (r
)
A.E. (NaOH) - Predicted FA = 25% FA = 30%FA = 5% FA = 10% FA = 15%FA = 20%
1.1
1.2
2.13.14.15.1
2.23.24.2
5.3
4.3
3.3
2.3 1.3
5.2
E-6

E-7
The total alkali is chosen to be equal to 0.648 lb/yd3 as an example. Assuming a cement factor equal to 6, this corresponds to a 0.1N NaOH pore solution and a pH of 13. Therefore, a horizontal dotted line is drawn (Figure E-3) at 0.1 N alkalinity. The designer will have the option to choose the minimum percent of fly ash to obtain safe r values. The r values determined from the concrete reactivity curves at different fly ash levels are as follows: 0.993, 0.941, 0.786, 0.528, 0.278, 0.12, and 0.045 for NMR concrete mixtures with 5 percent, 10, 15, 20, 25, 30 and 35 percent fly ash contents respectively. The results indicate the importance of fly ash to mitigate ASR as “r” values decrease significantly above 15 percent replacement levels. Depending on the requirement of r values, the fly ash replacement levels can be assigned in order to make ASR resistant mix. Although, the higher the % of fly ash the lower is the r values, the designer while making his selection should take into consideration some possible construction related issues (e.g., opening time of concrete structures such as pavement, bridge deck etc. to traffic because of low early strength) of using high fly ash replacement. American Standard of Testing and Materials (ASTM) C150 specifications limits is 0.6 percent Na2Oequivalent for low alkali cement (type I/II). Assuming that cement with 0.6 percent Na2Oequivalent is used, this is equivalent to 0.26 N alkaline solutions. Therefore the same steps outlined above were followed to generate Figure E-4 with respect to 0.26N alkalinity (0.6 percent Na2Oeq.). The r values obtained are as follows: 0.98, 0.93, 0.81, 0.60, 0.35, 0.15, and 0.05 for NMR concrete mixtures with 5, 10, 15, 20, 25, 30, 35 and 40 percent fly ash content respectively. As evident for the Figure E-4, 35 percent fly ash is needed to bring the expansion ratio to very safe level (r = 0.15). Again, determination of specific level of fly ash replacement needs specific knowledge of r requirement for specific application.
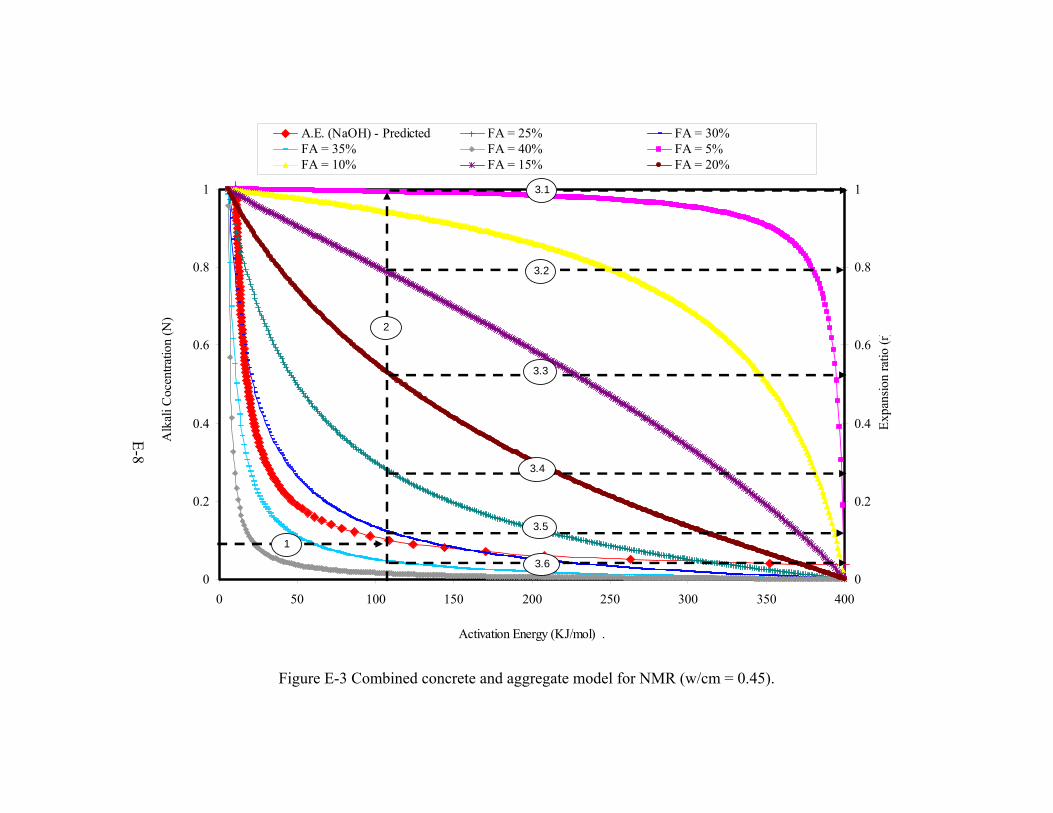
Figure E-3 Combined concrete and aggregate model for NMR (w/cm = 0.45).
0
0.2
0.4
0.6
0.8
1
0 50 100 150 200 250 300 350 400
Activation Energy (KJ/mol) .
Alk
ali C
ocen
tratio
n (N
)
0
0.2
0.4
0.6
0.8
1
Expa
nsio
n ra
tio (r
)
A.E. (NaOH) - Predicted FA = 25% FA = 30%FA = 35% FA = 40% FA = 5%FA = 10% FA = 15% FA = 20%
1
3.1
3.2
3.3
3.4
3.5
3.6
2
E-8

Figure E-4 Design procedure for NMR using ASTM C150 alkali limits (w/mc = 0.45).
0
0.2
0.4
0.6
0.8
1
0 50 100 150 200 250 300 350 400
Activation Energy (KJ/mol) .
Alk
ali C
ocen
tratio
n (N
)
0
0.2
0.4
0.6
0.8
1
Expa
nsio
n ra
tio (r
)
A.E. (NaOH) - Predicted FA = 25% FA = 30%FA = 35% FA = 5% FA = 10%FA = 15% FA = 20%
1
3.1
2
3.3
3.4
3.5
3.6
3.2
E-9

E-10
The similar calculation can be formed to generate concrete reactivity signature curves as a function of different type of SCMS, W/cm and other related factors. Concrete reactivity curves as a function of W/cm with a fixed fly ash replacement of 25 percent is explained in Figure E-5. The threshold alkalinity is determined as follows: a) For illustration propose, r was selected equal to 0.4. A dotted horizontal line is drawn
at r = 0.4 (Figure E-5). The line crosses the (r vs. aE ) curves at three points (1.1, 2.1, and 3.1) corresponding to w/cm = 0.49, 0.47, and 0.45. The aE values corresponding to these three points are 394, 317, and 69 KJ/mol respectively.
b) The designer selects among one the above w/cm. Theoretically, he can select the minimum water cement ratio (i.e. 0.43 in this case) and determine its threshold total alkalinity. Low w/cm will reduce the permeability of the concrete and impede the movement of the moisture inside the concrete and consequently, mitigating ASR. However, selecting low w/cm will decrease the workability of the concrete and therefore its placement. Thus, it may be more appropriate to select the max water cement ratio possible while satisfying the alkalinity of the pore solution and workability requirements by using suitable fly ash content.
c) The threshold level alkalinities for concrete mixtures with a w/cm of 0.49, 0.47 and 0.45 are 0.035N (1.3), 0.045N (2.3), and 0.145N (3.3) respectively determined from aggregate reactivity signature curve (Ea vs. alkalinity). Those values are equivalent to 0.04, 0.05, and 0.166 Na2Oeq. Those values are below the threshold values (3 kg/m3) mentioned by researchers that expansion is unlikely to occur below this value. Therefore, the user can chose any w/cm values between 0.4 and 0.5 with 25 percent class F fly ash. A comparison among the threshold alkalinities indicate that lower w/cm is associated with higher threshold. In other words, there is more tolerance concerning the level of alkalinity in the solution when low w/cm is used in the mixture, as low w/cm values yield concrete with low permeability and therefore the movement of alkali ions even in high concentrations is impeded by the denser concrete matrix.
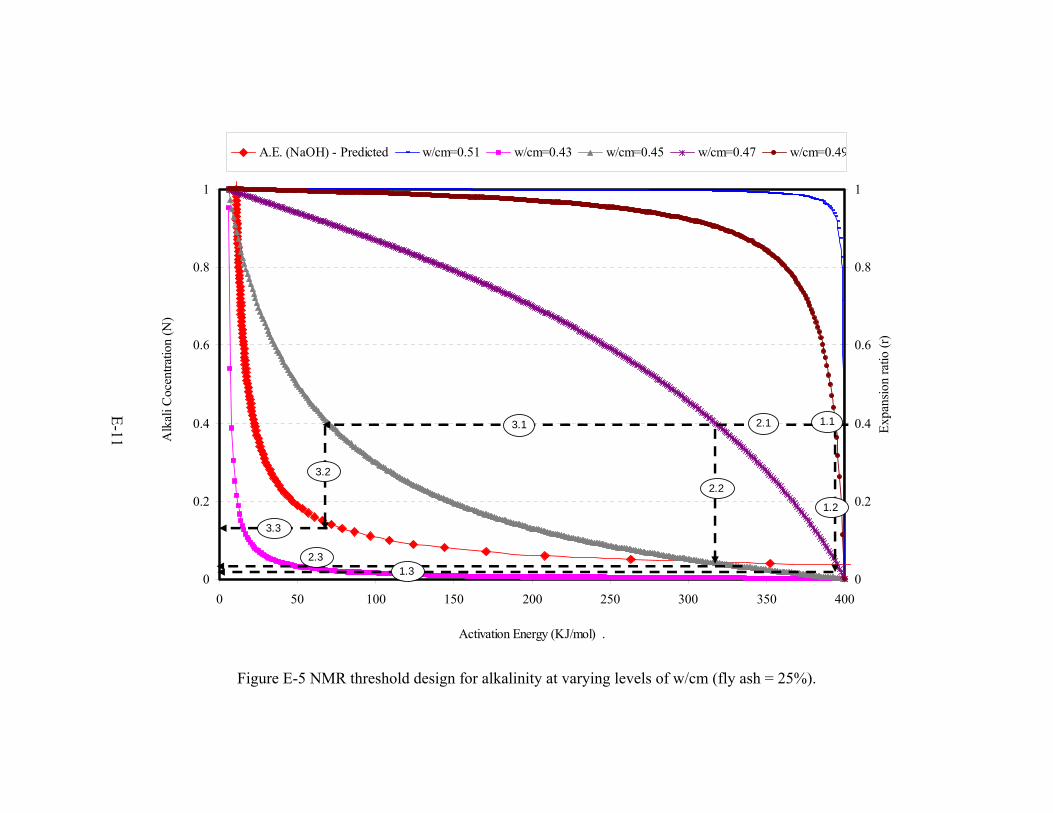
Figure E-5 NMR threshold design for alkalinity at varying levels of w/cm (fly ash = 25%).
0
0.2
0.4
0.6
0.8
1
0 50 100 150 200 250 300 350 400
Activation Energy (KJ/mol) .
Alk
ali C
ocen
tratio
n (N
)
0
0.2
0.4
0.6
0.8
1
Expa
nsio
n ra
tio (r
)
A.E. (NaOH) - Predicted w/cm=0.51 w/cm=0.43 w/cm=0.45 w/cm=0.47 w/cm=0.49
3.2
3.1
3.3
2.2
2.1
2.3
1.2
1.1
1.3
E-11

Top Related