


Languages
Pages
Legal

Hoover's Online Report BuilderHollywood Entertainment Corporation (NASDAQ: HLYW)
Copyright 2004, Hoover's, Inc.
Table of ContentsThe Basics...............................................................................................................................................................................1
Key Numbers.............................................................................................................................................................1Financial Overview....................................................................................................................................................1Officers & Employees................................................................................................................................................2Board Members..........................................................................................................................................................2Industry Information..................................................................................................................................................2SIC Codes...................................................................................................................................................................2NAICS Codes.............................................................................................................................................................2Top Competitors.........................................................................................................................................................3All Competitors..........................................................................................................................................................3
Biographies............................................................................................................................................................................4 Mark J. Wattles, Age 43............................................................................................................................................4 F. Bruce Giesbrecht, Age 44.....................................................................................................................................4 Timothy R. (Tim) Price, Age 45...............................................................................................................................5 Roger J. Osborne, Age 51.........................................................................................................................................5 Donald J. Ekman, Age 50.........................................................................................................................................5 James N. Cutler Jr., Age 51.......................................................................................................................................6 S. Douglas Glendenning, Age 46..............................................................................................................................6 William P. Zebe, Age 44...........................................................................................................................................6
Overview................................................................................................................................................................................8
History....................................................................................................................................................................................9
Products/Operations...........................................................................................................................................................10
Other Resources Available On Hoover's Online..............................................................................................................14Other Resources.......................................................................................................................................................14Related Products From Our Trusted Partners..........................................................................................................14
Annual Financials................................................................................................................................................................15
Quarterly Financials...........................................................................................................................................................17
Historical Financials & Employees....................................................................................................................................20
Market Data.........................................................................................................................................................................22
Comparison Data.................................................................................................................................................................23
Competitive Landscape.......................................................................................................................................................25
Report Builder − Hollywood Entertainment Corporation − Hoover's Online
i
The Basics
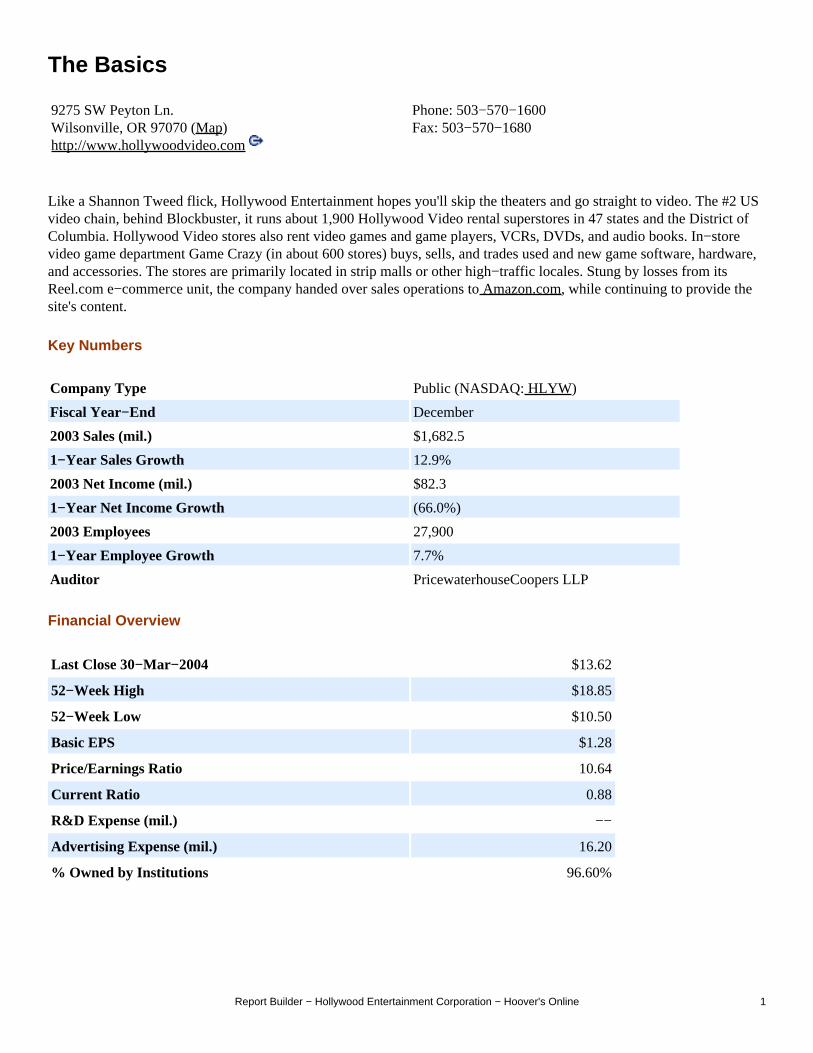
9275 SW Peyton Ln.Wilsonville, OR 97070 (Map)http://www.hollywoodvideo.com
Phone: 503−570−1600Fax: 503−570−1680
Like a Shannon Tweed flick, Hollywood Entertainment hopes you'll skip the theaters and go straight to video. The #2 USvideo chain, behind Blockbuster, it runs about 1,900 Hollywood Video rental superstores in 47 states and the District ofColumbia. Hollywood Video stores also rent video games and game players, VCRs, DVDs, and audio books. In−storevideo game department Game Crazy (in about 600 stores) buys, sells, and trades used and new game software, hardware,and accessories. The stores are primarily located in strip malls or other high−traffic locales. Stung by losses from itsReel.com e−commerce unit, the company handed over sales operations to Amazon.com, while continuing to provide thesite's content.
Key Numbers
Company Type Public (NASDAQ: HLYW)
Fiscal Year−End December
2003 Sales (mil.) $1,682.5
1−Year Sales Growth 12.9%
2003 Net Income (mil.) $82.3
1−Year Net Income Growth (66.0%)
2003 Employees 27,900
1−Year Employee Growth 7.7%
Auditor PricewaterhouseCoopers LLP
Financial Overview
Last Close 30−Mar−2004 $13.62
52−Week High $18.85
52−Week Low $10.50
Basic EPS $1.28
Price/Earnings Ratio 10.64
Current Ratio 0.88
R&D Expense (mil.) −−
Advertising Expense (mil.) 16.20
% Owned by Institutions 96.60%
Report Builder − Hollywood Entertainment Corporation − Hoover's Online 1
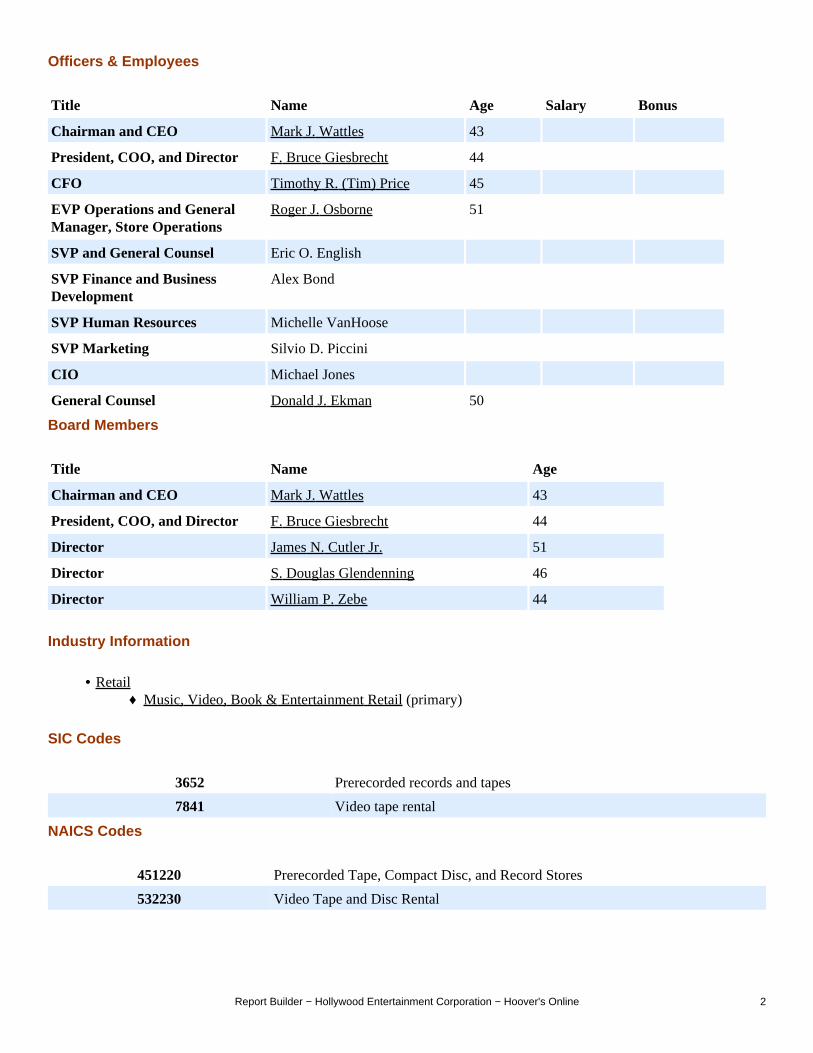
Officers & Employees
Title Name Age Salary Bonus
Chairman and CEO Mark J. Wattles 43
President, COO, and Director F. Bruce Giesbrecht 44
CFO Timothy R. (Tim) Price 45
EVP Operations and GeneralManager, Store Operations
Roger J. Osborne 51
SVP and General Counsel Eric O. English
SVP Finance and BusinessDevelopment
Alex Bond
SVP Human Resources Michelle VanHoose
SVP Marketing Silvio D. Piccini
CIO Michael Jones
General Counsel Donald J. Ekman 50
Board Members
Title Name Age
Chairman and CEO Mark J. Wattles 43
President, COO, and Director F. Bruce Giesbrecht 44
Director James N. Cutler Jr. 51
Director S. Douglas Glendenning 46
Director William P. Zebe 44
Industry Information
RetailMusic, Video, Book & Entertainment Retail (primary)♦
•
SIC Codes
3652 Prerecorded records and tapes
7841 Video tape rental
NAICS Codes
451220 Prerecorded Tape, Compact Disc, and Record Stores
532230 Video Tape and Disc Rental
Report Builder − Hollywood Entertainment Corporation − Hoover's Online 2

Top Competitors
Blockbuster• Movie Gallery• Netflix•
All Competitors
Albertson's• Amazon.com• Barnes & Noble• Best Buy• Blockbuster• Borders• Cox Communications• Hastings Entertainment• Kroger• Movie Gallery• MTS• Musicland• Netflix• Starz Encore Group• Target• Trans World Entertainment• Wal−Mart• Wherehouse Entertainment•
Report Builder − Hollywood Entertainment Corporation − Hoover's Online 3
Biographies
Mark J. Wattles, Age 43
Chairman and CEO
Recent Work Highlights
Hollywood Entertainment Corporation2002: Chairman, President, and CEO, $975,000 salary, $713,340 bonus♦ 2001: Chairman, President, and CEO, $945,814 salary, $3,960,368 bonus♦ 2000: Chairman, President, and CEO, $433,237 salary♦ Title held until 2004: Chairman, President, and CEO♦
•
Biography
Mark J. Wattles founded the Company in June 1988 and has served as a director, Chairman of the Board, and ChiefExecutive Officer since that time. From June 1988 through September 1998, Mr. Wattles also served as President of theCompany. From August 1998 through June 2000, Mr. Wattles left his full time position at the Company and served asChief Executive Officer of Reel.com, then a wholly owned subsidiary of the Company. In August 2000, Mr. Wattlesreturned full time to the Company and in January 2001 was re−appointed President by the Board. Mr. Wattles has been anowner and operator in the video rental industry since 1985. In 2001, Mr. Wattles was appointed to the National AdvisoryCouncil of the Marriot Business School at Brigham Young University. He has been a participant and key speaker inseveral entertainment industry panels and conferences.
Source: Company Web Site, 2004
F. Bruce Giesbrecht, Age 44
President, COO, and Director
Recent Work Highlights
Hollywood Entertainment Corporation2002: EVP Business Development and Director, $300,000 salary, $245,810 bonus♦ 2001: EVP Business Development and Director, $296,875 salary, $116,817 bonus♦ 2000: EVP Business Development and Director, $236,250 salary, $103,742 bonus♦ Title held until 2004: EVP Business Development and Director♦
•
Biography
F. Bruce Giesbrecht was announced as the Company's President and Chief Operating Officer on January 29, 2004. Mr.Giesbrecht was named Executive Vice President of Business Development in March 2000 and became General Managerof Corporate Operations in July 2003. Mr. Giesbrecht joined Hollywood in May 1993 as Vice President of CorporateInformation Systems and Chief Information Officer, was named Senior Vice President of Product Management in January1996 and became Senior Vice President of Strategic Planning in January 1998. Prior to joining Hollywood Mr. Giesbrechtwas a founder of RamSoft, Inc., a software development company specializing in management systems for the videoindustry, and served as its President.
Report Builder − Hollywood Entertainment Corporation − Hoover's Online 4
Source: 10K, March 15, 2004
Timothy R. (Tim) Price, Age 45
CFO
Biography
Timothy R. Price joined Hollywood in January 2003 as Senior Vice President of Finance and was named Chief FinancialOfficer in July 2003. Prior to joining Hollywood, Mr. Price was with May Company for four years holding the positionsof Chief Financial Officer for Robinson's−May from 2000 to 2002 and Vice President and Controller of Hecht's from1998 to 2000. Prior to the May Company, Mr. Price served as Vice President and Controller of Kohl's from 1996 to 1998and held a variety of financial executive positions at the Limited from 1988 to 1996.
Source: 10K, March 15, 2004
Roger J. Osborne, Age 51
EVP Operations and General Manager, Store Operations
Recent Work Highlights
Hollywood Entertainment Corporation2002: EVP Operations, $340,094 salary, $260,755 bonus♦ 2001: EVP Operations, $357,494 salary, $99,317 bonus♦
•
Biography
Roger J. Osborne was named Executive Vice President of Operations in October 2000 and became General Manager ofStore Operations in July 2003. Prior to being named Senior Vice President of Operations at Hollywood in January 1999,he was the Executive Vice President of J. Baker, Corporation, a major apparel and footwear retailer, and President of itsWork `N Gear Division since June 1997. Before rejoining J. Baker Corporation, Mr. Osborne was Senior Vice Presidentand Zone Director for Mid−West and East coast markets for Hollywood from November 1996 until May of 1997. From1993 until 1996, Mr. Osborne worked for J. Baker, Corporation, serving as Senior Vice President and Director of itslicensed shoe department business from January 1995 to November 1996. Mr. Osborne served in executive capacitieswith Bata Shoe Company from 1988 until 1993 and with the Payless Shoe Store division of May Company from 1975until 1988.
Source: 10K, March 15, 2004
Donald J. Ekman, Age 50
General Counsel
Recent Work Highlights
Hollywood Entertainment Corporation2002: EVP Legal Affairs, Secretary, and Director, $383,286 salary, $245,810 bonus♦
•
Report Builder − Hollywood Entertainment Corporation − Hoover's Online 5
2001: EVP Legal Affairs, Secretary, and Director, $295,833 salary, $110,567 bonus♦ Title held until 2003: EVP Legal Affairs, Secretary, and Director♦
Biography
Donald J. Ekman was a director of Hollywood from July 1993 to March 2003 and has been the Executive Vice Presidentof Legal Affairs since August 2000. Before the appointment to his current position, Mr. Ekman served as the GeneralCounsel of Hollywood beginning in March 1994 and as a Vice President from 1994 until he became a Senior VicePresident in May 1996. Before joining Hollywood, Mr. Ekman was in the private practice of law.
Source: Proxy, April 29, 2003
James N. Cutler Jr., Age 51
Director
Biography
James N. Cutler, Jr. became a director of the Company in October 2000. Mr. Cutler has been President and ChiefExecutive Officer of The Cutler Corporation, a private holding company for various private businesses, since 1980. Mr.Cutler also serves as an officer or director of a number of private corporations including Rol−Away Truck ManufacturingCompany Inc. and R & K Industrial Products. Mr. Cutler previously served as director of the Company from July 1993until May 1999, at which time he did not stand for reelection.
Source: Proxy, April 29, 2003
S. Douglas Glendenning, Age 46
Director
Biography
S. Douglas Glendenning became a director of the Company in December 2000. Mr. Glendenning is the owner of SDGInvestments, a private holding company with investments in restaurants, real estate, lending and publicly traded securities.Mr. Glendenning served as a Director, Chief Operating Officer and President of Lone Star Steakhouse & Saloon Inc. fromJanuary 1991 until April 1996. From 1980 until 1991, Mr. Glendenning served in various capacities at CoulterEnterprises, Inc., a large Pizza Hut franchisee. The majority of his tenure there was as Senior Vice President ofOperations.
Source: Proxy, April 29, 2003
William P. Zebe, Age 44
Director
Report Builder − Hollywood Entertainment Corporation − Hoover's Online 6

Biography
William P. Zebe became a director of the Company in July 1998. Mr. Zebe is the President and principal shareholder ofBardo Equities LLC, a real estate development company. Previously, Mr. Zebe was employed by the Company asNational Vice President of Real Estate in May 1994 and, subsequently, as Senior Vice President of Development fromJanuary 1996 until his departure in June 1998. Before he joined the Company, Mr. Zebe worked from June 1992 to April1994 at Blockbuster Entertainment, most recently as the Real Estate Manager for the Western Zone.
Source: Proxy, April 29, 2003
Report Builder − Hollywood Entertainment Corporation − Hoover's Online 7
Overview
Like a Shannon Tweed flick, Hollywood Entertainment hopes you'll skip the theaters and go straight to video. The #2 USvideo chain, behind Blockbuster, it runs about 1,900 Hollywood Video rental superstores in 47 states and the District ofColumbia. Hollywood Video stores also rent video games and game players, VCRs, DVDs, and audio books. In−storevideo game department Game Crazy (in about 600 stores) buys, sells, and trades used and new game software, hardware,and accessories. The stores are primarily located in strip malls or other high−traffic locales. Stung by losses from itsReel.com e−commerce unit, the company handed over sales operations to Amazon.com, while continuing to provide thesite's content.
At an average of 6,800 sq. ft. per store, Hollywood Video stores typically dwarf the competition. Most stores stock about10,000 titles and allow renters to keep videos and DVDs for five days. Game Crazy departments are typically 800 sq. ft.and stock over 2,500 video game titles.
The company has halted its expansion efforts (in the late 1990s it opened hundreds of stores each year) and is insteadfocusing on improving existing−store operations including adding Game Crazy departments (almost 320 were added in2003 and 150 are planned for 2004). Hollywood is also testing a DVD−only store format. It has also been testing anin−store subscription−based membership in about 10 of its stores. The program allows members to check out 2 movies ata time with no return due date for about $20 a month.
Hollywood Entertainment has been hurt by the price−cutting efforts of other online video sellers and mass merchandisersthat sell videos and DVDs at a loss in order to increase traffic.
With the help of investment banking firm Leonard Green & Partners, Hollywood is going private. The transaction shouldbe completed sometime after the summer, 2004.
Report Builder − Hollywood Entertainment Corporation − Hoover's Online 8
History
Mark Wattles founded two video ventures before opening what would be the beginning of Hollywood Entertainment. Thefirst was a store in Portland, Oregon, called Downtown Video (founded in 1985 and sold the next year). The other wasConvenience Video Rentals, which set up video sections in convenience stores. After failing to convince fellowConvenience Video Rentals investors to open video superstores, Wattles quit the venture and launched the Home TheaterVideo Superstore in 1988.
Wattle changed the name of the store to Hollywood Video in 1989 and opened about five new stores a year until 1993,when it went public. It expanded rapidly to more than 110 stores in eight states by the end of 1994.
Hollywood Entertainment's spectacular early growth (192 units added in 1995; 250 in 1996) was fueled by the opening ofnew stores and the acquisition of regional chains, including 14 Title Wave Video stores and 42 Video Watch stores, bothin the Midwest (1995).
To handle its rapid growth, the company reorganized in 1996, decentralizing by setting up four regional zones overseenby its SVPs. The rapid growth continued in 1997 when it opened 356 stores. Moving into a new realm, in 1998Hollywood Entertainment paid $90 million for Reel.com, an online retailer of videos. (The company had passed up acheaper acquisition of Reel.com in 1997.) The deal made Reel.com shareholder CMGI a major owner of HollywoodEntertainment's stock. A change in accounting contributed to a loss for the year.
The company opened 353 stores in 1998, 355 in 1999, and 208 in 2000 before scaling back its expansion plans to about adozen per year. In June 2000 Hollywood Entertainment gave up on Reel.com, whose marketing costs and price discountshad plunged the parent company into the red.
In 2002 the company opened around 35 stores mainly in California and Texas, and opened almost 90 in 2003.
Report Builder − Hollywood Entertainment Corporation − Hoover's Online 9
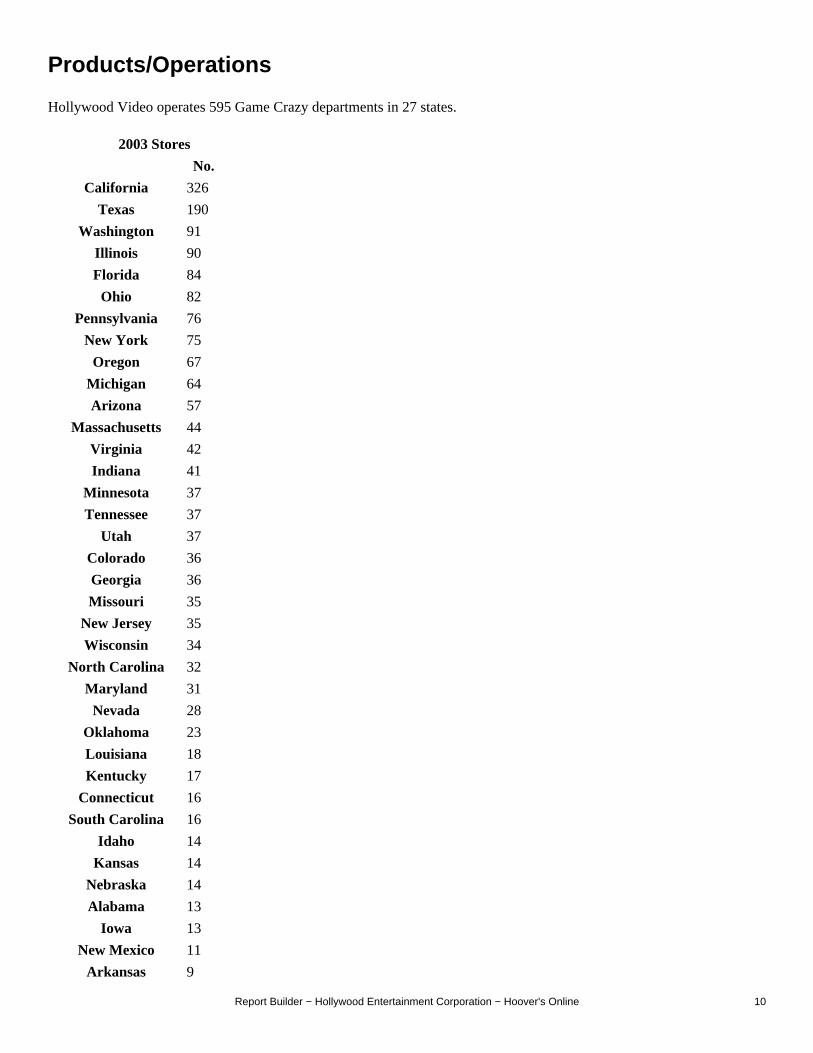
Products/Operations
Hollywood Video operates 595 Game Crazy departments in 27 states.
2003 Stores
No.
California 326
Texas 190
Washington 91
Illinois 90
Florida 84
Ohio 82
Pennsylvania 76
New York 75
Oregon 67
Michigan 64
Arizona 57
Massachusetts 44
Virginia 42
Indiana 41
Minnesota 37
Tennessee 37
Utah 37
Colorado 36
Georgia 36
Missouri 35
New Jersey 35
Wisconsin 34
North Carolina 32
Maryland 31
Nevada 28
Oklahoma 23
Louisiana 18
Kentucky 17
Connecticut 16
South Carolina 16
Idaho 14
Kansas 14
Nebraska 14
Alabama 13
Iowa 13
New Mexico 11
Arkansas 9
Report Builder − Hollywood Entertainment Corporation − Hoover's Online 10
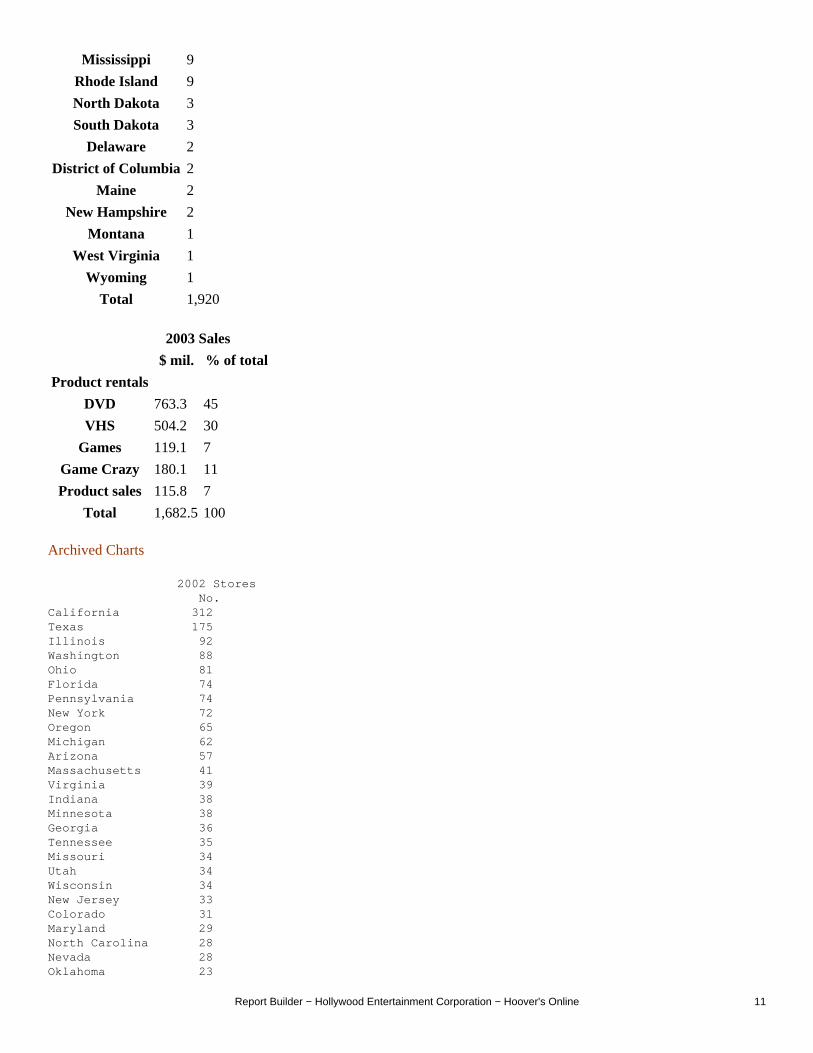
Mississippi 9
Rhode Island 9
North Dakota 3
South Dakota 3
Delaware 2
District of Columbia 2
Maine 2
New Hampshire 2
Montana 1
West Virginia 1
Wyoming 1
Total 1,920
2003 Sales
$ mil. % of total
Product rentals
DVD 763.3 45
VHS 504.2 30
Games 119.1 7
Game Crazy 180.1 11
Product sales 115.8 7
Total 1,682.5100
Archived Charts
2002 Stores No.California 312Texas 175Illinois 92Washington 88Ohio 81Florida 74Pennsylvania 74New York 72Oregon 65Michigan 62Arizona 57Massachusetts 41Virginia 39Indiana 38Minnesota 38Georgia 36Tennessee 35Missouri 34Utah 34Wisconsin 34New Jersey 33Colorado 31Maryland 29North Carolina 28Nevada 28Oklahoma 23
Report Builder − Hollywood Entertainment Corporation − Hoover's Online 11
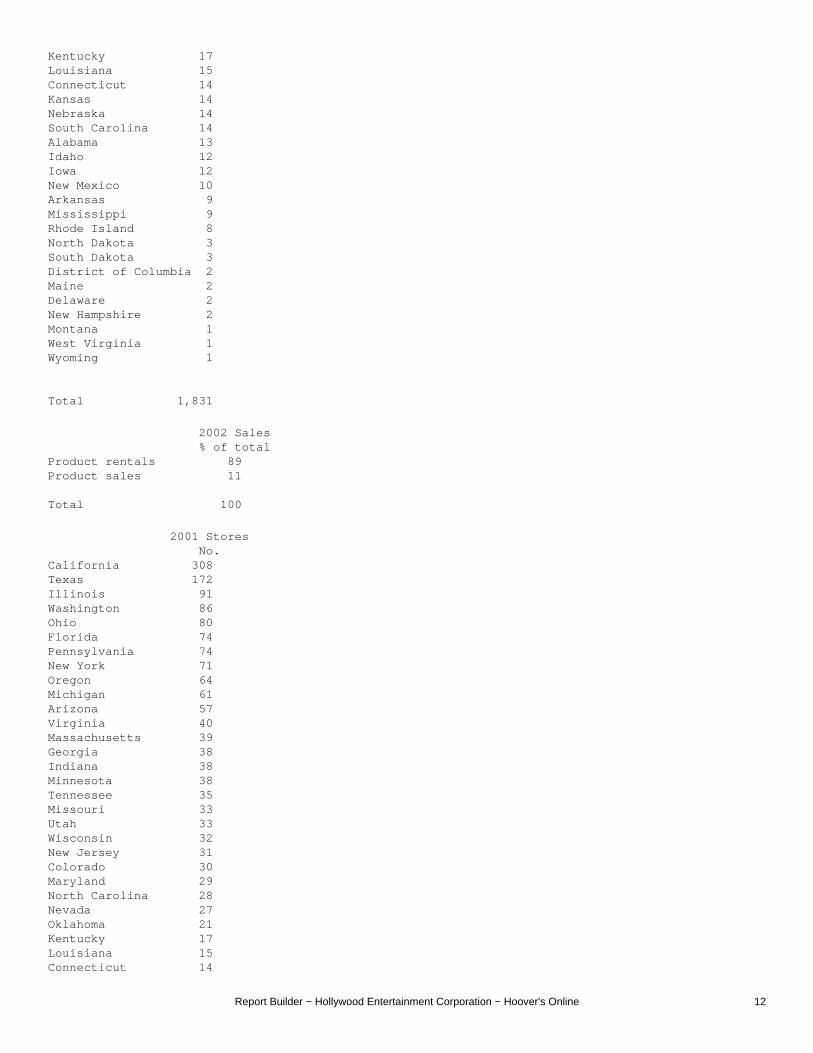
Kentucky 17Louisiana 15Connecticut 14Kansas 14Nebraska 14 South Carolina 14Alabama 13Idaho 12Iowa 12New Mexico 10Arkansas 9Mississippi 9Rhode Island 8North Dakota 3South Dakota 3District of Columbia 2Maine 2Delaware 2New Hampshire 2Montana 1West Virginia 1Wyoming 1
Total 1,831
2002 Sales % of totalProduct rentals 89Product sales 11
Total 100
2001 Stores No.California 308Texas 172Illinois 91Washington 86Ohio 80Florida 74Pennsylvania 74New York 71Oregon 64Michigan 61Arizona 57Virginia 40Massachusetts 39Georgia 38Indiana 38Minnesota 38Tennessee 35Missouri 33Utah 33Wisconsin 32New Jersey 31Colorado 30Maryland 29North Carolina 28Nevada 27Oklahoma 21Kentucky 17Louisiana 15Connecticut 14
Report Builder − Hollywood Entertainment Corporation − Hoover's Online 12
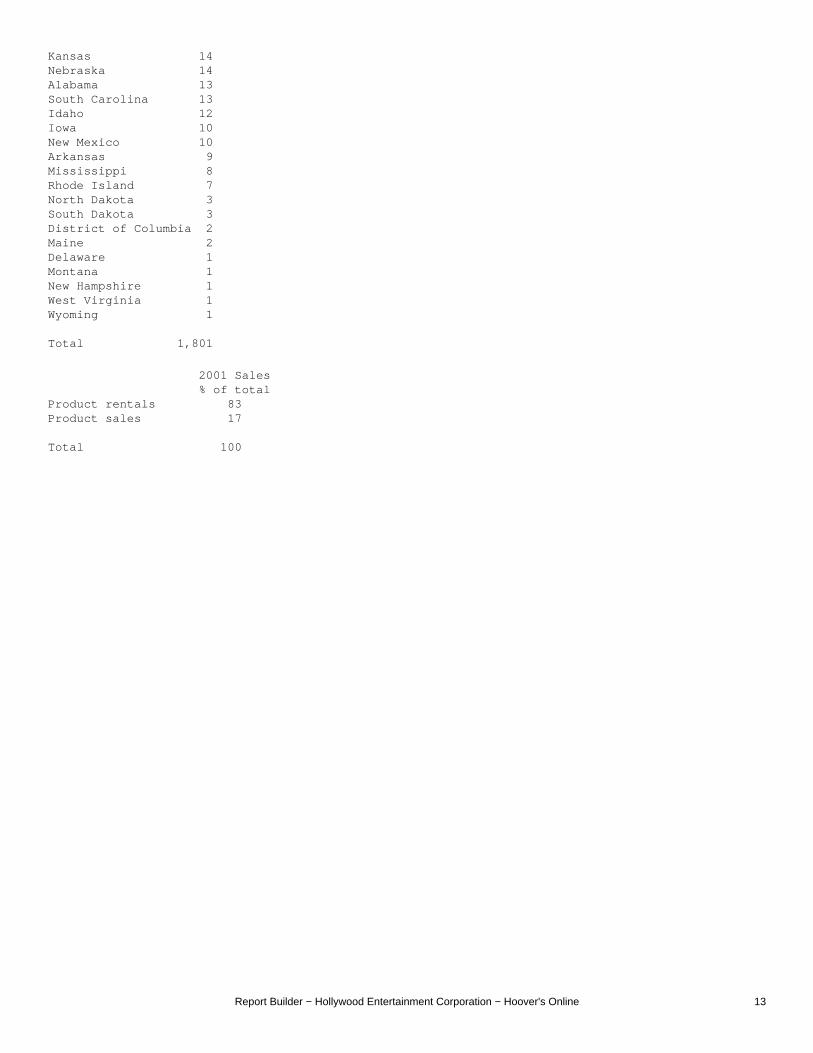
Kansas 14Nebraska 14 Alabama 13South Carolina 13Idaho 12Iowa 10New Mexico 10Arkansas 9Mississippi 8Rhode Island 7North Dakota 3South Dakota 3District of Columbia 2Maine 2Delaware 1Montana 1New Hampshire 1West Virginia 1Wyoming 1
Total 1,801
2001 Sales % of totalProduct rentals 83Product sales 17
Total 100
Report Builder − Hollywood Entertainment Corporation − Hoover's Online 13
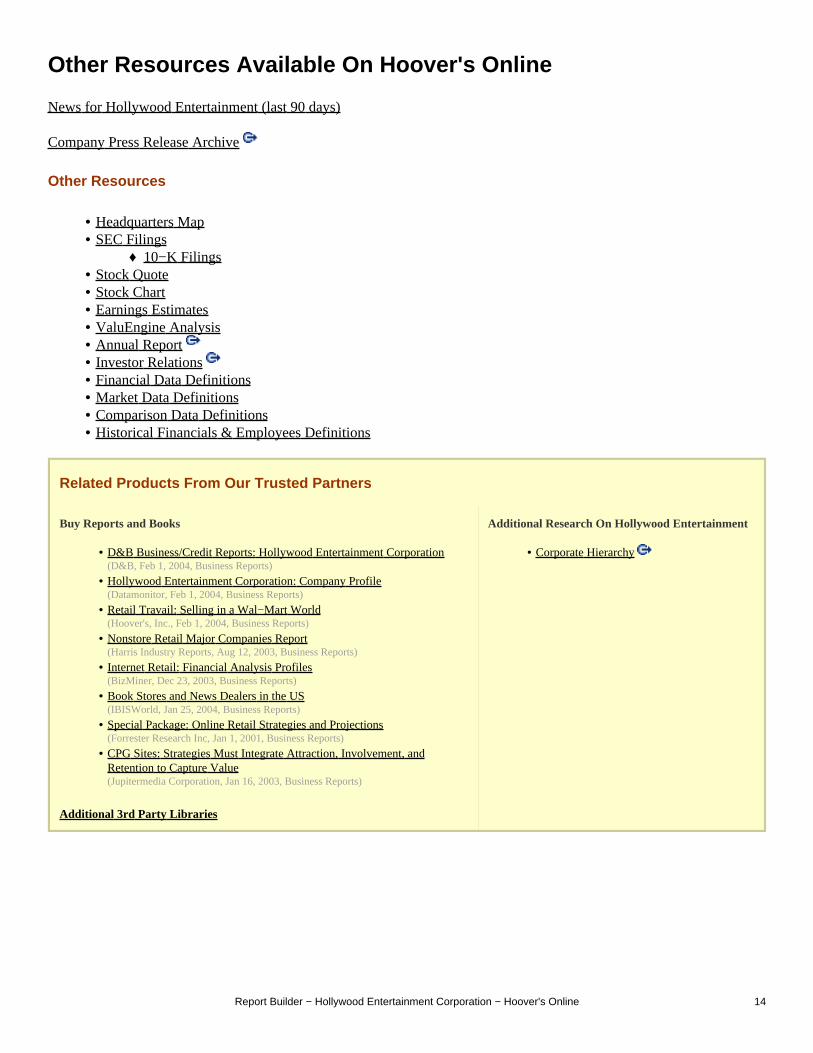
Other Resources Available On Hoover's Online
News for Hollywood Entertainment (last 90 days)
Company Press Release Archive
Other Resources
Headquarters Map• SEC Filings
10−K Filings♦ •
Stock Quote• Stock Chart• Earnings Estimates• ValuEngine Analysis• Annual Report • Investor Relations • Financial Data Definitions• Market Data Definitions• Comparison Data Definitions• Historical Financials & Employees Definitions•
Related Products From Our Trusted Partners
Buy Reports and Books
D&B Business/Credit Reports: Hollywood Entertainment Corporation(D&B, Feb 1, 2004, Business Reports)
•
Hollywood Entertainment Corporation: Company Profile(Datamonitor, Feb 1, 2004, Business Reports)
•
Retail Travail: Selling in a Wal−Mart World(Hoover's, Inc., Feb 1, 2004, Business Reports)
•
Nonstore Retail Major Companies Report(Harris Industry Reports, Aug 12, 2003, Business Reports)
•
Internet Retail: Financial Analysis Profiles(BizMiner, Dec 23, 2003, Business Reports)
•
Book Stores and News Dealers in the US(IBISWorld, Jan 25, 2004, Business Reports)
•
Special Package: Online Retail Strategies and Projections(Forrester Research Inc, Jan 1, 2001, Business Reports)
•
CPG Sites: Strategies Must Integrate Attraction, Involvement, andRetention to Capture Value(Jupitermedia Corporation, Jan 16, 2003, Business Reports)
•
Additional 3rd Party Libraries
Additional Research On Hollywood Entertainment
Corporate Hierarchy •
Report Builder − Hollywood Entertainment Corporation − Hoover's Online 14
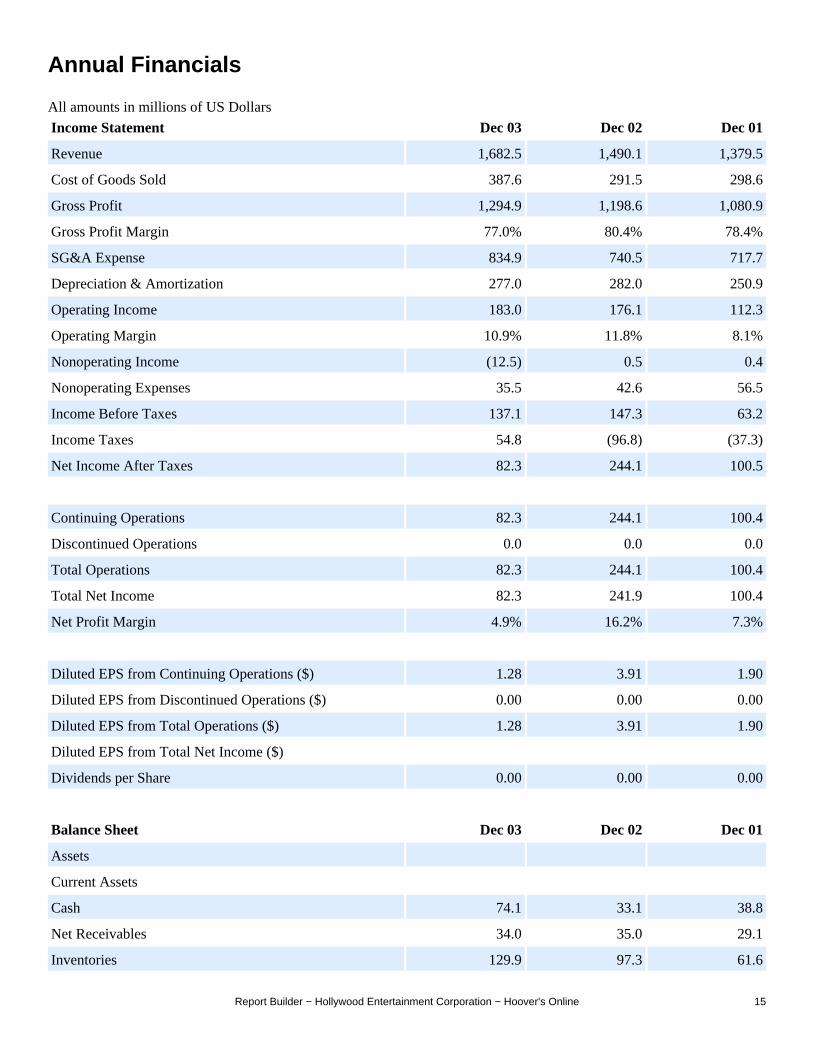
Annual Financials
All amounts in millions of US Dollars
Income Statement Dec 03 Dec 02 Dec 01
Revenue 1,682.5 1,490.1 1,379.5
Cost of Goods Sold 387.6 291.5 298.6
Gross Profit 1,294.9 1,198.6 1,080.9
Gross Profit Margin 77.0% 80.4% 78.4%
SG&A Expense 834.9 740.5 717.7
Depreciation & Amortization 277.0 282.0 250.9
Operating Income 183.0 176.1 112.3
Operating Margin 10.9% 11.8% 8.1%
Nonoperating Income (12.5) 0.5 0.4
Nonoperating Expenses 35.5 42.6 56.5
Income Before Taxes 137.1 147.3 63.2
Income Taxes 54.8 (96.8) (37.3)
Net Income After Taxes 82.3 244.1 100.5
Continuing Operations 82.3 244.1 100.4
Discontinued Operations 0.0 0.0 0.0
Total Operations 82.3 244.1 100.4
Total Net Income 82.3 241.9 100.4
Net Profit Margin 4.9% 16.2% 7.3%
Diluted EPS from Continuing Operations ($) 1.28 3.91 1.90
Diluted EPS from Discontinued Operations ($) 0.00 0.00 0.00
Diluted EPS from Total Operations ($) 1.28 3.91 1.90
Diluted EPS from Total Net Income ($)
Dividends per Share 0.00 0.00 0.00
Balance Sheet Dec 03 Dec 02 Dec 01
Assets
Current Assets
Cash 74.1 33.1 38.8
Net Receivables 34.0 35.0 29.1
Inventories 129.9 97.3 61.6
Report Builder − Hollywood Entertainment Corporation − Hoover's Online 15
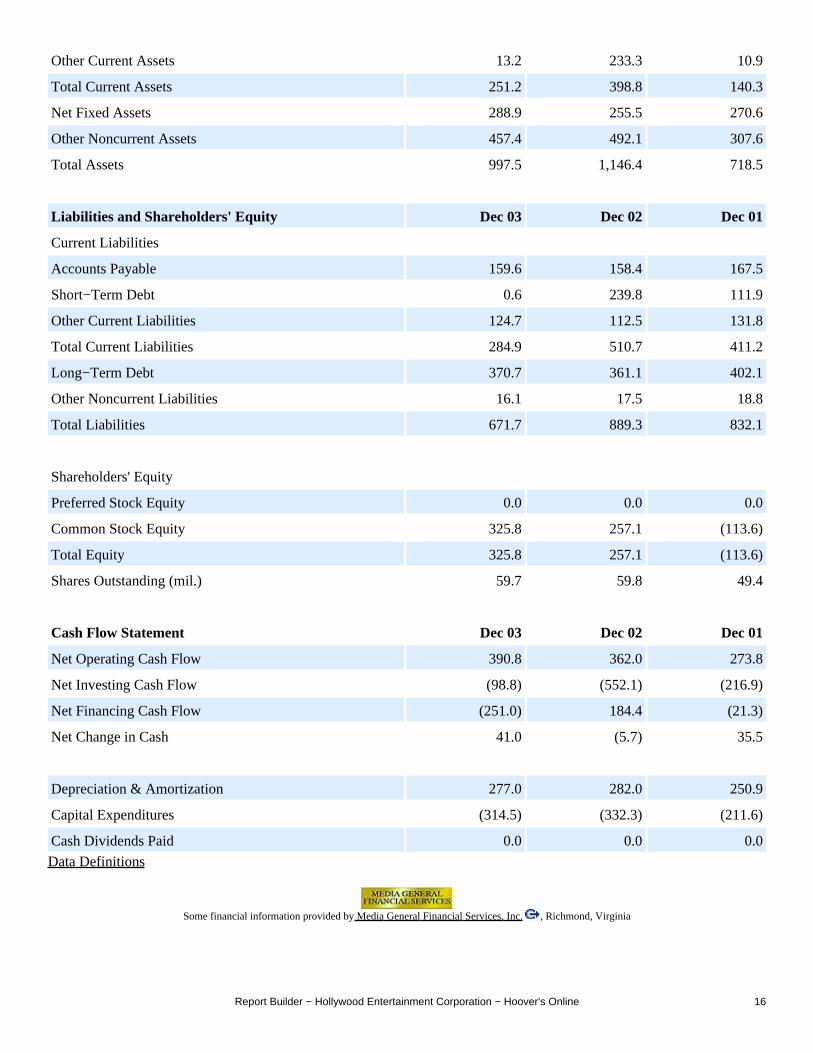
Other Current Assets 13.2 233.3 10.9
Total Current Assets 251.2 398.8 140.3
Net Fixed Assets 288.9 255.5 270.6
Other Noncurrent Assets 457.4 492.1 307.6
Total Assets 997.5 1,146.4 718.5
Liabilities and Shareholders' Equity Dec 03 Dec 02 Dec 01
Current Liabilities
Accounts Payable 159.6 158.4 167.5
Short−Term Debt 0.6 239.8 111.9
Other Current Liabilities 124.7 112.5 131.8
Total Current Liabilities 284.9 510.7 411.2
Long−Term Debt 370.7 361.1 402.1
Other Noncurrent Liabilities 16.1 17.5 18.8
Total Liabilities 671.7 889.3 832.1
Shareholders' Equity
Preferred Stock Equity 0.0 0.0 0.0
Common Stock Equity 325.8 257.1 (113.6)
Total Equity 325.8 257.1 (113.6)
Shares Outstanding (mil.) 59.7 59.8 49.4
Cash Flow Statement Dec 03 Dec 02 Dec 01
Net Operating Cash Flow 390.8 362.0 273.8
Net Investing Cash Flow (98.8) (552.1) (216.9)
Net Financing Cash Flow (251.0) 184.4 (21.3)
Net Change in Cash 41.0 (5.7) 35.5
Depreciation & Amortization 277.0 282.0 250.9
Capital Expenditures (314.5) (332.3) (211.6)
Cash Dividends Paid 0.0 0.0 0.0
Data Definitions
Some financial information provided by Media General Financial Services, Inc. , Richmond, Virginia
Report Builder − Hollywood Entertainment Corporation − Hoover's Online 16
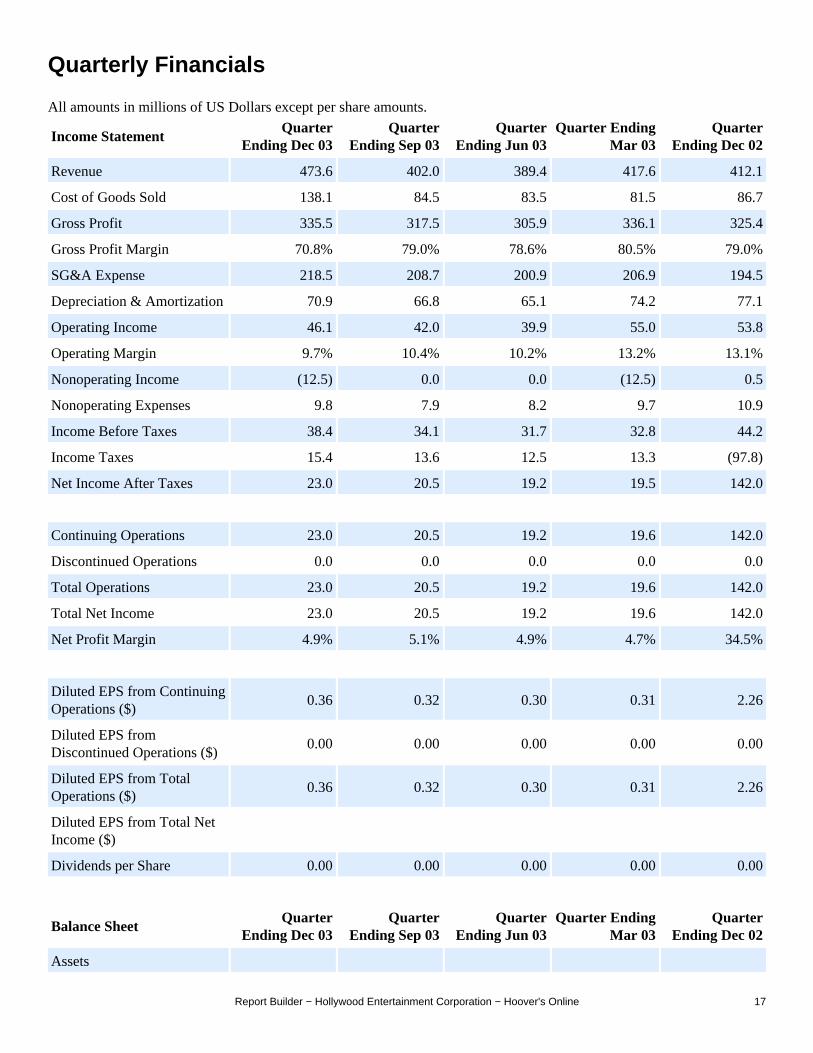
Quarterly Financials
All amounts in millions of US Dollars except per share amounts.
Income StatementQuarter
Ending Dec 03Quarter
Ending Sep 03Quarter
Ending Jun 03Quarter Ending
Mar 03Quarter
Ending Dec 02
Revenue 473.6 402.0 389.4 417.6 412.1
Cost of Goods Sold 138.1 84.5 83.5 81.5 86.7
Gross Profit 335.5 317.5 305.9 336.1 325.4
Gross Profit Margin 70.8% 79.0% 78.6% 80.5% 79.0%
SG&A Expense 218.5 208.7 200.9 206.9 194.5
Depreciation & Amortization 70.9 66.8 65.1 74.2 77.1
Operating Income 46.1 42.0 39.9 55.0 53.8
Operating Margin 9.7% 10.4% 10.2% 13.2% 13.1%
Nonoperating Income (12.5) 0.0 0.0 (12.5) 0.5
Nonoperating Expenses 9.8 7.9 8.2 9.7 10.9
Income Before Taxes 38.4 34.1 31.7 32.8 44.2
Income Taxes 15.4 13.6 12.5 13.3 (97.8)
Net Income After Taxes 23.0 20.5 19.2 19.5 142.0
Continuing Operations 23.0 20.5 19.2 19.6 142.0
Discontinued Operations 0.0 0.0 0.0 0.0 0.0
Total Operations 23.0 20.5 19.2 19.6 142.0
Total Net Income 23.0 20.5 19.2 19.6 142.0
Net Profit Margin 4.9% 5.1% 4.9% 4.7% 34.5%
Diluted EPS from ContinuingOperations ($)
0.36 0.32 0.30 0.31 2.26
Diluted EPS fromDiscontinued Operations ($)
0.00 0.00 0.00 0.00 0.00
Diluted EPS from TotalOperations ($)
0.36 0.32 0.30 0.31 2.26
Diluted EPS from Total NetIncome ($)
Dividends per Share 0.00 0.00 0.00 0.00 0.00
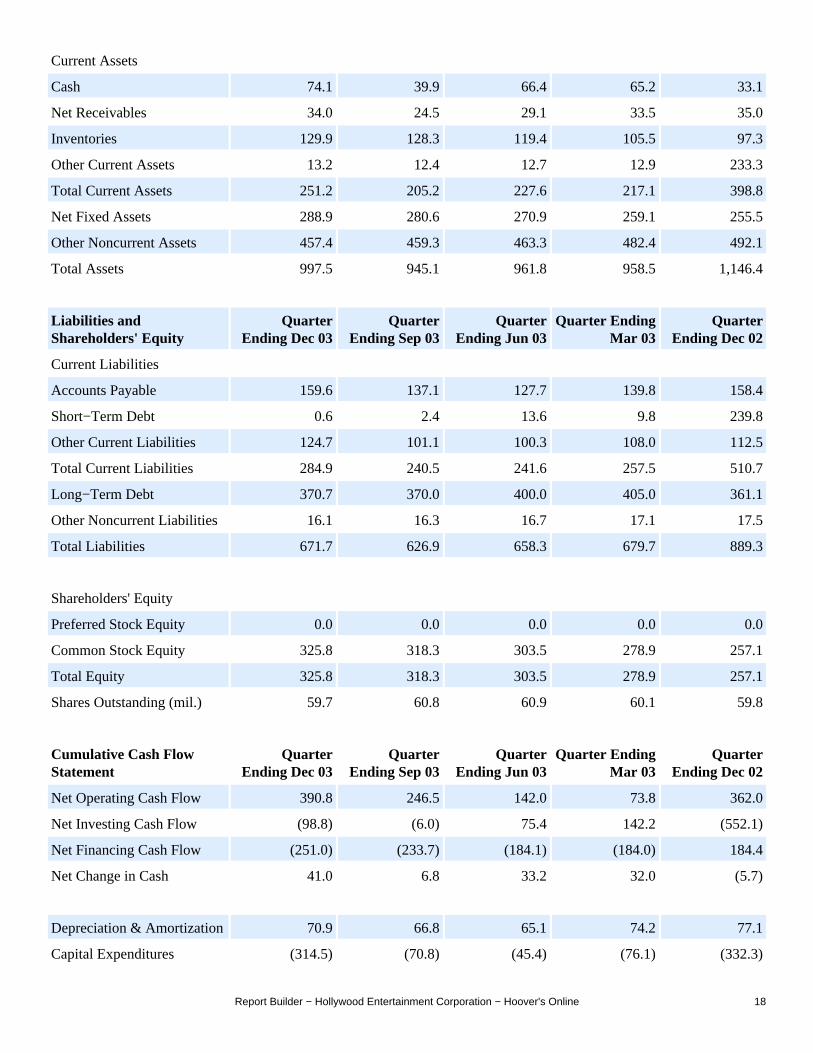
Balance SheetQuarter
Ending Dec 03Quarter
Ending Sep 03Quarter
Ending Jun 03Quarter Ending
Mar 03Quarter
Ending Dec 02
Assets
Report Builder − Hollywood Entertainment Corporation − Hoover's Online 17
Current Assets
Cash 74.1 39.9 66.4 65.2 33.1
Net Receivables 34.0 24.5 29.1 33.5 35.0
Inventories 129.9 128.3 119.4 105.5 97.3
Other Current Assets 13.2 12.4 12.7 12.9 233.3
Total Current Assets 251.2 205.2 227.6 217.1 398.8
Net Fixed Assets 288.9 280.6 270.9 259.1 255.5
Other Noncurrent Assets 457.4 459.3 463.3 482.4 492.1
Total Assets 997.5 945.1 961.8 958.5 1,146.4
Liabilities andShareholders' Equity
QuarterEnding Dec 03
QuarterEnding Sep 03
QuarterEnding Jun 03
Quarter EndingMar 03
QuarterEnding Dec 02
Current Liabilities
Accounts Payable 159.6 137.1 127.7 139.8 158.4
Short−Term Debt 0.6 2.4 13.6 9.8 239.8
Other Current Liabilities 124.7 101.1 100.3 108.0 112.5
Total Current Liabilities 284.9 240.5 241.6 257.5 510.7
Long−Term Debt 370.7 370.0 400.0 405.0 361.1
Other Noncurrent Liabilities 16.1 16.3 16.7 17.1 17.5
Total Liabilities 671.7 626.9 658.3 679.7 889.3
Shareholders' Equity
Preferred Stock Equity 0.0 0.0 0.0 0.0 0.0
Common Stock Equity 325.8 318.3 303.5 278.9 257.1
Total Equity 325.8 318.3 303.5 278.9 257.1
Shares Outstanding (mil.) 59.7 60.8 60.9 60.1 59.8
Cumulative Cash FlowStatement
QuarterEnding Dec 03
QuarterEnding Sep 03
QuarterEnding Jun 03
Quarter EndingMar 03
QuarterEnding Dec 02
Net Operating Cash Flow 390.8 246.5 142.0 73.8 362.0
Net Investing Cash Flow (98.8) (6.0) 75.4 142.2 (552.1)
Net Financing Cash Flow (251.0) (233.7) (184.1) (184.0) 184.4
Net Change in Cash 41.0 6.8 33.2 32.0 (5.7)
Depreciation & Amortization 70.9 66.8 65.1 74.2 77.1
Capital Expenditures (314.5) (70.8) (45.4) (76.1) (332.3)
Report Builder − Hollywood Entertainment Corporation − Hoover's Online 18

Cash Dividends Paid 0.0 0.0 0.0 0.0 0.0
Data Definitions
Some financial information provided by Media General Financial Services, Inc. , Richmond, Virginia
Report Builder − Hollywood Entertainment Corporation − Hoover's Online 19
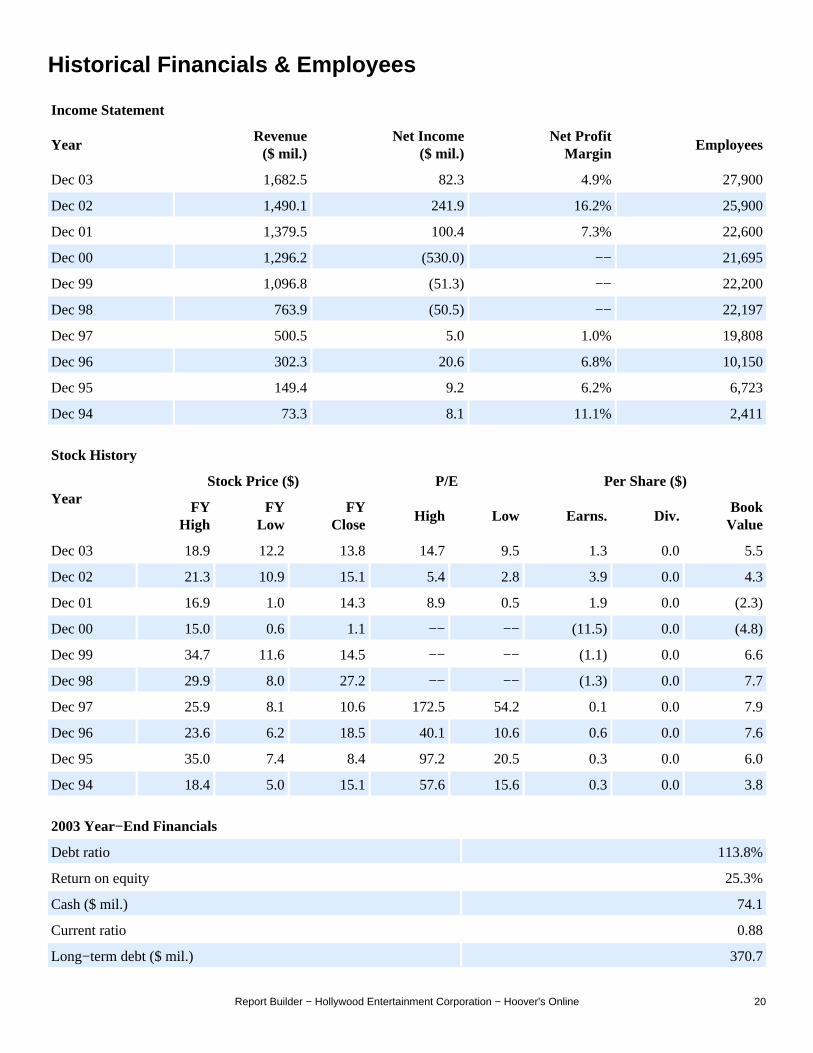
Historical Financials & Employees
Income Statement
YearRevenue
($ mil.)Net Income
($ mil.)Net Profit
MarginEmployees
Dec 03 1,682.5 82.3 4.9% 27,900
Dec 02 1,490.1 241.9 16.2% 25,900
Dec 01 1,379.5 100.4 7.3% 22,600
Dec 00 1,296.2 (530.0) −− 21,695
Dec 99 1,096.8 (51.3) −− 22,200
Dec 98 763.9 (50.5) −− 22,197
Dec 97 500.5 5.0 1.0% 19,808
Dec 96 302.3 20.6 6.8% 10,150
Dec 95 149.4 9.2 6.2% 6,723
Dec 94 73.3 8.1 11.1% 2,411
Stock History
YearStock Price ($) P/E Per Share ($)
FYHigh
FYLow
FYClose
High Low Earns. Div.BookValue
Dec 03 18.9 12.2 13.8 14.7 9.5 1.3 0.0 5.5
Dec 02 21.3 10.9 15.1 5.4 2.8 3.9 0.0 4.3
Dec 01 16.9 1.0 14.3 8.9 0.5 1.9 0.0 (2.3)
Dec 00 15.0 0.6 1.1 −− −− (11.5) 0.0 (4.8)
Dec 99 34.7 11.6 14.5 −− −− (1.1) 0.0 6.6
Dec 98 29.9 8.0 27.2 −− −− (1.3) 0.0 7.7
Dec 97 25.9 8.1 10.6 172.5 54.2 0.1 0.0 7.9
Dec 96 23.6 6.2 18.5 40.1 10.6 0.6 0.0 7.6
Dec 95 35.0 7.4 8.4 97.2 20.5 0.3 0.0 6.0
Dec 94 18.4 5.0 15.1 57.6 15.6 0.3 0.0 3.8
2003 Year−End Financials
Debt ratio 113.8%
Return on equity 25.3%
Cash ($ mil.) 74.1
Current ratio 0.88
Long−term debt ($ mil.) 370.7
Report Builder − Hollywood Entertainment Corporation − Hoover's Online 20

Shares Outstanding (mil.) 59.7
Dividend yield 0.0%
Dividend payout 0.0%
Market Cap ($ mil.) 820.4
Data Definitions
Some financial information provided by Media General Financial Services, Inc. , Richmond, Virginia
Report Builder − Hollywood Entertainment Corporation − Hoover's Online 21
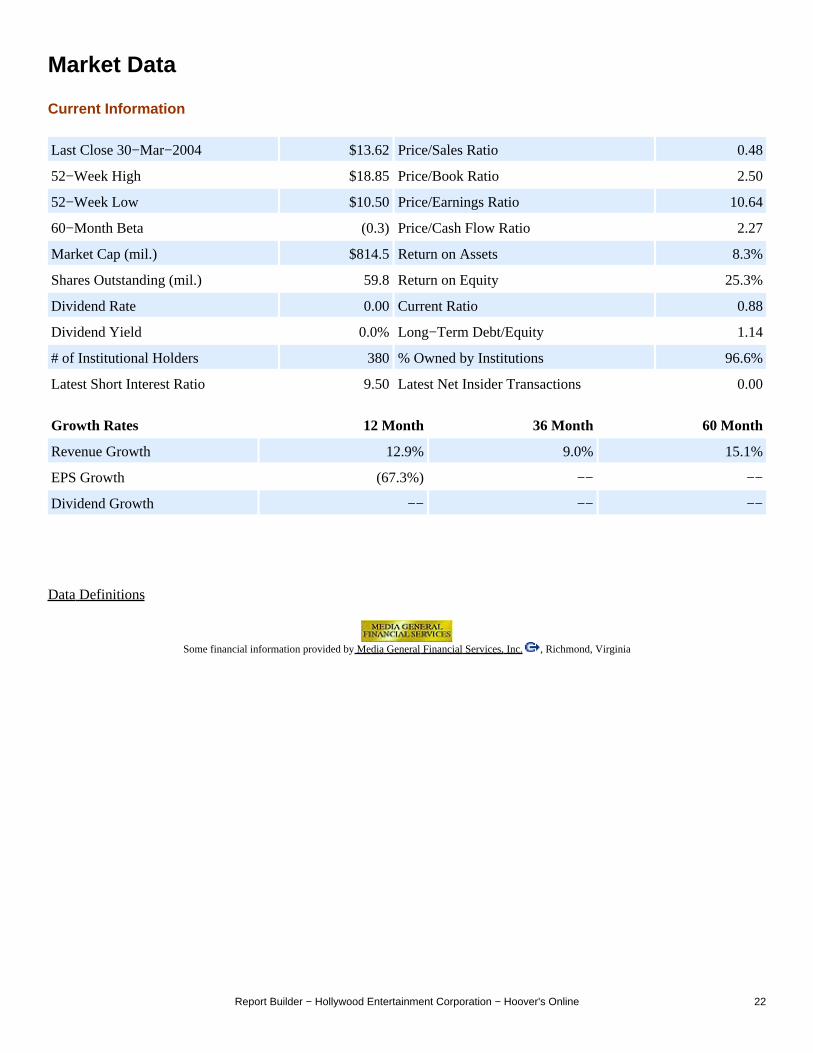
Market Data
Current Information
Last Close 30−Mar−2004 $13.62 Price/Sales Ratio 0.48
52−Week High $18.85 Price/Book Ratio 2.50
52−Week Low $10.50 Price/Earnings Ratio 10.64
60−Month Beta (0.3) Price/Cash Flow Ratio 2.27
Market Cap (mil.) $814.5 Return on Assets 8.3%
Shares Outstanding (mil.) 59.8 Return on Equity 25.3%
Dividend Rate 0.00 Current Ratio 0.88
Dividend Yield 0.0% Long−Term Debt/Equity 1.14
# of Institutional Holders 380 % Owned by Institutions 96.6%
Latest Short Interest Ratio 9.50 Latest Net Insider Transactions 0.00
Growth Rates 12 Month 36 Month 60 Month
Revenue Growth 12.9% 9.0% 15.1%
EPS Growth (67.3%) −− −−
Dividend Growth −− −− −−
Data Definitions
Some financial information provided by Media General Financial Services, Inc. , Richmond, Virginia
Report Builder − Hollywood Entertainment Corporation − Hoover's Online 22
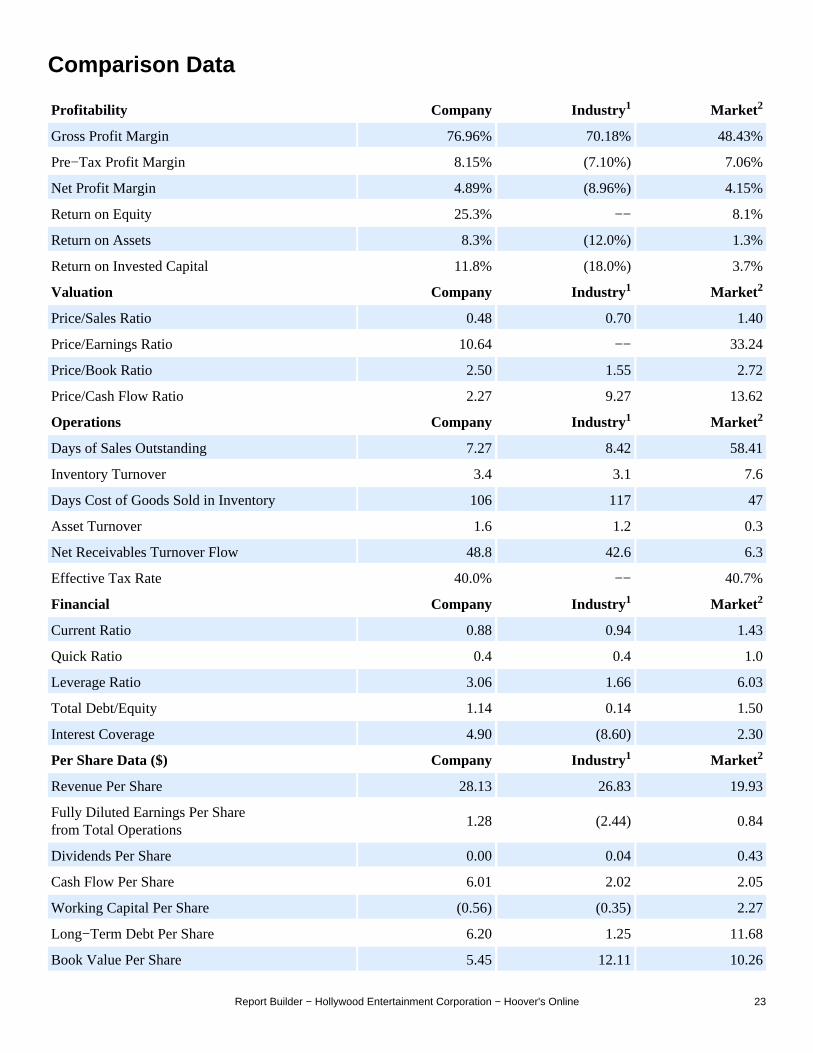
Comparison Data
Profitability Company Industry 1 Market 2
Gross Profit Margin 76.96% 70.18% 48.43%
Pre−Tax Profit Margin 8.15% (7.10%) 7.06%
Net Profit Margin 4.89% (8.96%) 4.15%
Return on Equity 25.3% −− 8.1%
Return on Assets 8.3% (12.0%) 1.3%
Return on Invested Capital 11.8% (18.0%) 3.7%
Valuation Company Industry 1 Market 2
Price/Sales Ratio 0.48 0.70 1.40
Price/Earnings Ratio 10.64 −− 33.24
Price/Book Ratio 2.50 1.55 2.72
Price/Cash Flow Ratio 2.27 9.27 13.62
Operations Company Industry 1 Market 2
Days of Sales Outstanding 7.27 8.42 58.41
Inventory Turnover 3.4 3.1 7.6
Days Cost of Goods Sold in Inventory 106 117 47
Asset Turnover 1.6 1.2 0.3
Net Receivables Turnover Flow 48.8 42.6 6.3
Effective Tax Rate 40.0% −− 40.7%
Financial Company Industry 1 Market 2
Current Ratio 0.88 0.94 1.43
Quick Ratio 0.4 0.4 1.0
Leverage Ratio 3.06 1.66 6.03
Total Debt/Equity 1.14 0.14 1.50
Interest Coverage 4.90 (8.60) 2.30
Per Share Data ($) Company Industry 1 Market 2
Revenue Per Share 28.13 26.83 19.93
Fully Diluted Earnings Per Sharefrom Total Operations
1.28 (2.44) 0.84
Dividends Per Share 0.00 0.04 0.43
Cash Flow Per Share 6.01 2.02 2.05
Working Capital Per Share (0.56) (0.35) 2.27
Long−Term Debt Per Share 6.20 1.25 11.68
Book Value Per Share 5.45 12.11 10.26
Report Builder − Hollywood Entertainment Corporation − Hoover's Online 23
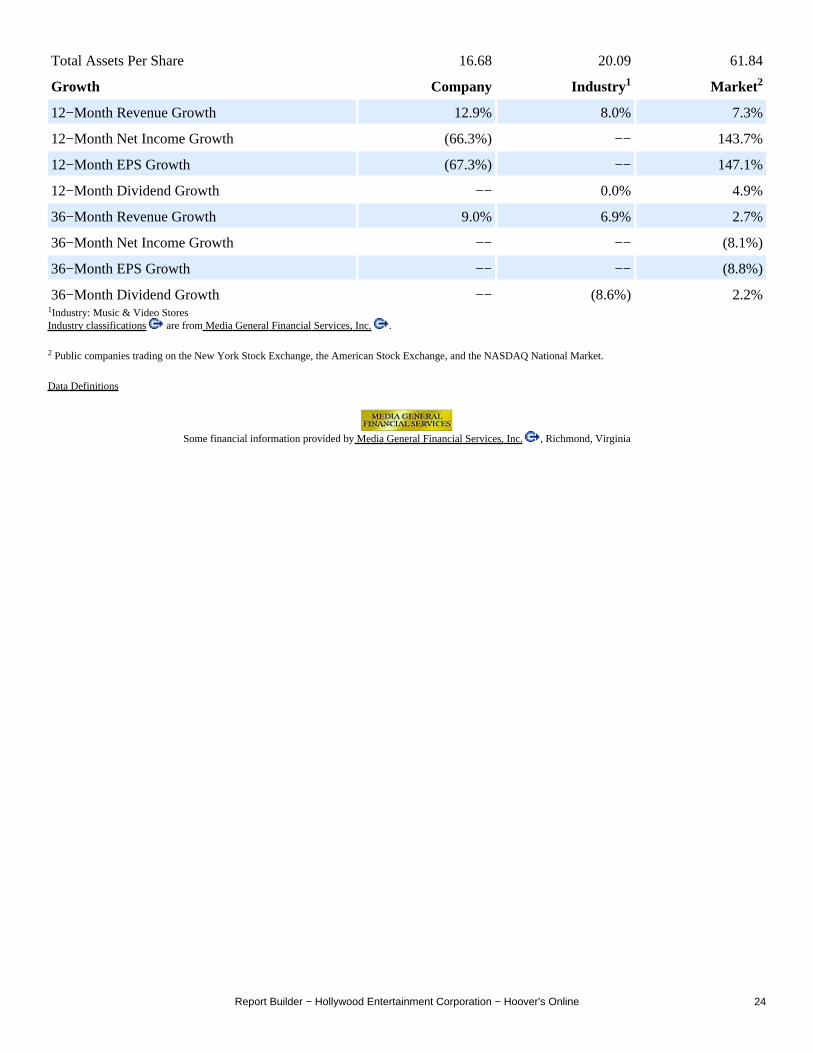
Total Assets Per Share 16.68 20.09 61.84
Growth Company Industry 1 Market 2
12−Month Revenue Growth 12.9% 8.0% 7.3%
12−Month Net Income Growth (66.3%) −− 143.7%
12−Month EPS Growth (67.3%) −− 147.1%
12−Month Dividend Growth −− 0.0% 4.9%
36−Month Revenue Growth 9.0% 6.9% 2.7%
36−Month Net Income Growth −− −− (8.1%)
36−Month EPS Growth −− −− (8.8%)
36−Month Dividend Growth −− (8.6%) 2.2%1Industry: Music & Video StoresIndustry classifications are from Media General Financial Services, Inc. .
2 Public companies trading on the New York Stock Exchange, the American Stock Exchange, and the NASDAQ National Market.
Data Definitions
Some financial information provided by Media General Financial Services, Inc. , Richmond, Virginia
Report Builder − Hollywood Entertainment Corporation − Hoover's Online 24
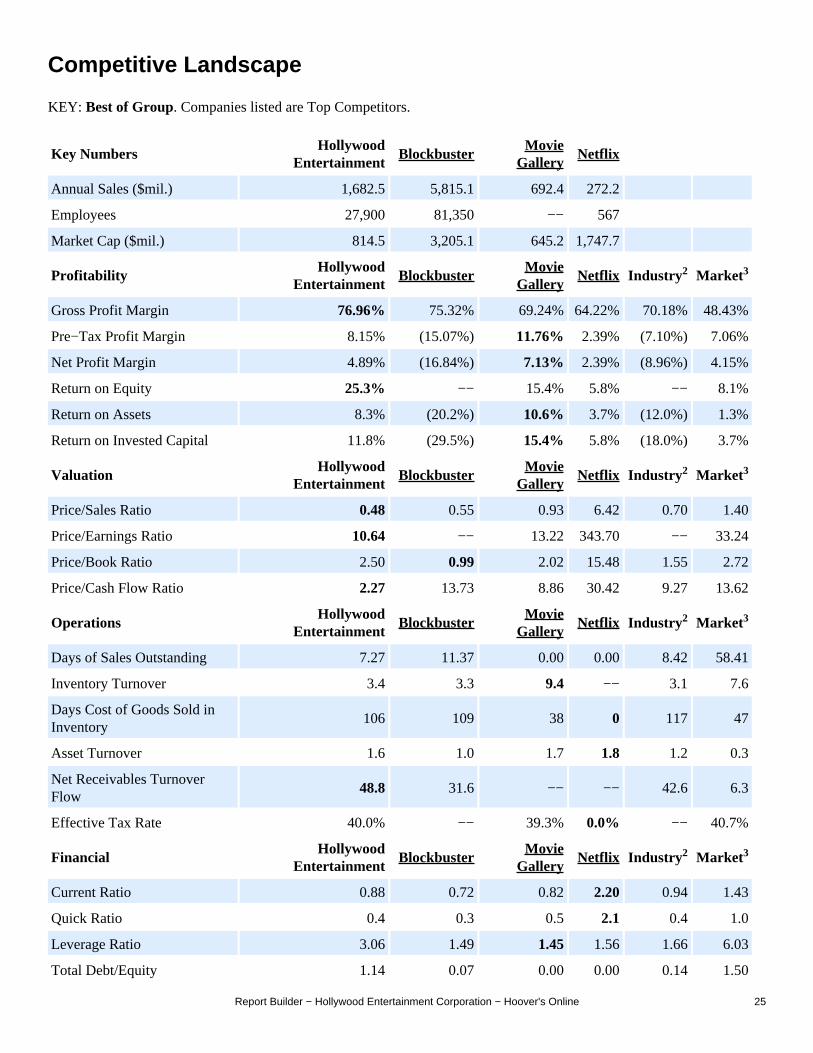
Competitive Landscape
KEY: Best of Group. Companies listed are Top Competitors.
Key NumbersHollywood
EntertainmentBlockbuster
MovieGallery
Netflix
Annual Sales ($mil.) 1,682.5 5,815.1 692.4 272.2
Employees 27,900 81,350 −− 567
Market Cap ($mil.) 814.5 3,205.1 645.2 1,747.7
ProfitabilityHollywood
EntertainmentBlockbuster
MovieGallery
Netflix Industry 2 Market 3
Gross Profit Margin 76.96% 75.32% 69.24% 64.22% 70.18% 48.43%
Pre−Tax Profit Margin 8.15% (15.07%) 11.76% 2.39% (7.10%) 7.06%
Net Profit Margin 4.89% (16.84%) 7.13% 2.39% (8.96%) 4.15%
Return on Equity 25.3% −− 15.4% 5.8% −− 8.1%
Return on Assets 8.3% (20.2%) 10.6% 3.7% (12.0%) 1.3%
Return on Invested Capital 11.8% (29.5%) 15.4% 5.8% (18.0%) 3.7%
ValuationHollywood
EntertainmentBlockbuster
MovieGallery
Netflix Industry 2 Market 3
Price/Sales Ratio 0.48 0.55 0.93 6.42 0.70 1.40
Price/Earnings Ratio 10.64 −− 13.22 343.70 −− 33.24
Price/Book Ratio 2.50 0.99 2.02 15.48 1.55 2.72
Price/Cash Flow Ratio 2.27 13.73 8.86 30.42 9.27 13.62
OperationsHollywood
EntertainmentBlockbuster
MovieGallery
Netflix Industry 2 Market 3
Days of Sales Outstanding 7.27 11.37 0.00 0.00 8.42 58.41
Inventory Turnover 3.4 3.3 9.4 −− 3.1 7.6
Days Cost of Goods Sold inInventory
106 109 38 0 117 47
Asset Turnover 1.6 1.0 1.7 1.8 1.2 0.3
Net Receivables TurnoverFlow
48.8 31.6 −− −− 42.6 6.3
Effective Tax Rate 40.0% −− 39.3% 0.0% −− 40.7%
FinancialHollywood
EntertainmentBlockbuster
MovieGallery
Netflix Industry 2 Market 3
Current Ratio 0.88 0.72 0.82 2.20 0.94 1.43
Quick Ratio 0.4 0.3 0.5 2.1 0.4 1.0
Leverage Ratio 3.06 1.49 1.45 1.56 1.66 6.03
Total Debt/Equity 1.14 0.07 0.00 0.00 0.14 1.50
Report Builder − Hollywood Entertainment Corporation − Hoover's Online 25
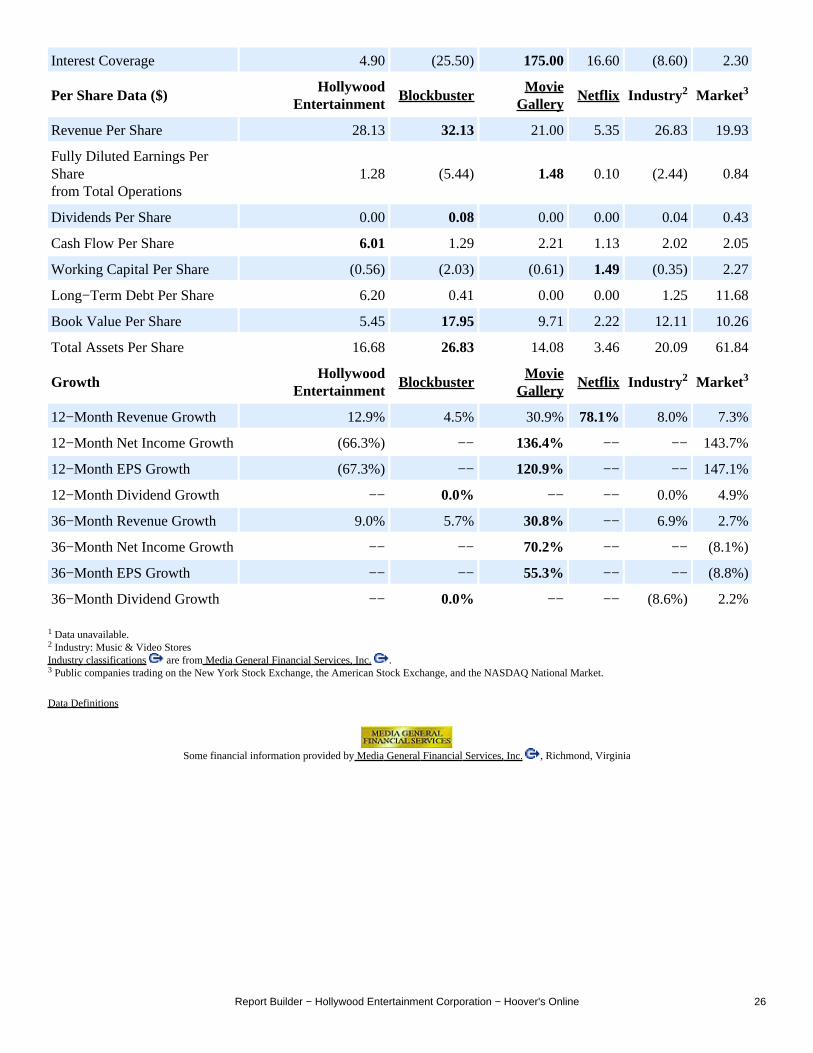
Interest Coverage 4.90 (25.50) 175.00 16.60 (8.60) 2.30
Per Share Data ($)Hollywood
EntertainmentBlockbuster
MovieGallery
Netflix Industry 2 Market 3
Revenue Per Share 28.13 32.13 21.00 5.35 26.83 19.93
Fully Diluted Earnings PerSharefrom Total Operations
1.28 (5.44) 1.48 0.10 (2.44) 0.84
Dividends Per Share 0.00 0.08 0.00 0.00 0.04 0.43
Cash Flow Per Share 6.01 1.29 2.21 1.13 2.02 2.05
Working Capital Per Share (0.56) (2.03) (0.61) 1.49 (0.35) 2.27
Long−Term Debt Per Share 6.20 0.41 0.00 0.00 1.25 11.68
Book Value Per Share 5.45 17.95 9.71 2.22 12.11 10.26
Total Assets Per Share 16.68 26.83 14.08 3.46 20.09 61.84
GrowthHollywood
EntertainmentBlockbuster
MovieGallery
Netflix Industry 2 Market 3
12−Month Revenue Growth 12.9% 4.5% 30.9% 78.1% 8.0% 7.3%
12−Month Net Income Growth (66.3%) −− 136.4% −− −− 143.7%
12−Month EPS Growth (67.3%) −− 120.9% −− −− 147.1%
12−Month Dividend Growth −− 0.0% −− −− 0.0% 4.9%
36−Month Revenue Growth 9.0% 5.7% 30.8% −− 6.9% 2.7%
36−Month Net Income Growth −− −− 70.2% −− −− (8.1%)
36−Month EPS Growth −− −− 55.3% −− −− (8.8%)
36−Month Dividend Growth −− 0.0% −− −− (8.6%) 2.2%
1 Data unavailable.2 Industry: Music & Video StoresIndustry classifications are from Media General Financial Services, Inc. .3 Public companies trading on the New York Stock Exchange, the American Stock Exchange, and the NASDAQ National Market.
Data Definitions
Some financial information provided by Media General Financial Services, Inc. , Richmond, Virginia
Report Builder − Hollywood Entertainment Corporation − Hoover's Online 26

Copyright 2004, Hoover's, Inc.
Report Builder − Hollywood Entertainment Corporation − Hoover's Online 27
Top Related