


Languages
Pages
Legal


Characteristics of wind Power Systems
Yahia Baghzouz
UNLV
Las Vegas, NV, USA
Overview
– Wind power history and trends
– Wind turbine designs
– Wind generator types
– Wind power efficiency
– Wind power equation/curve
– Wind spilling methods
– Characteristics of wind variability
– Wind forecasting
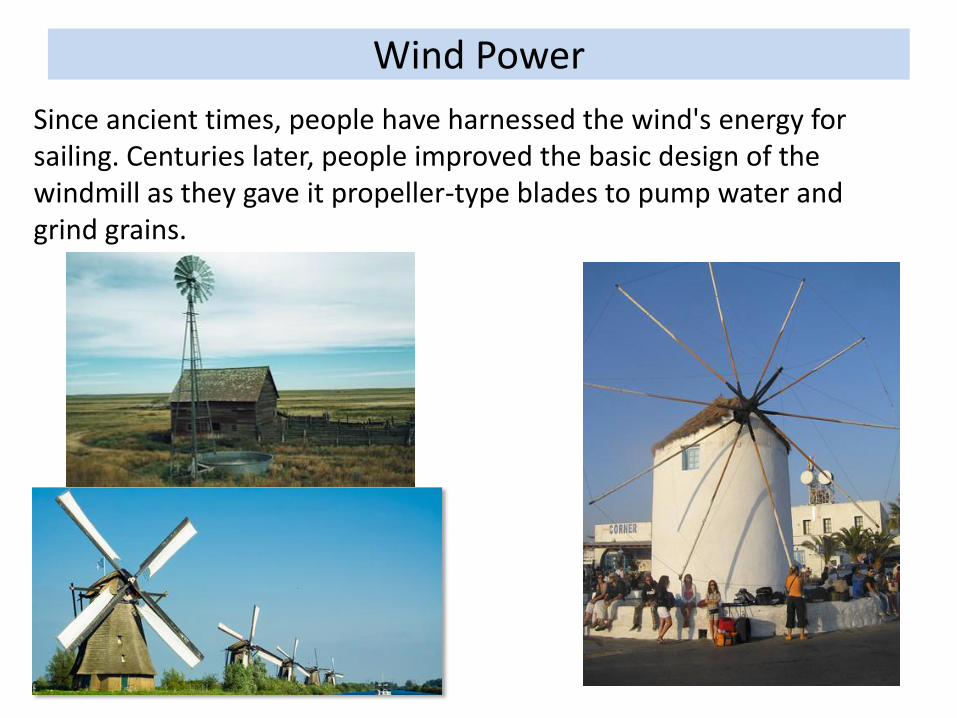
Wind Power
Since ancient times, people have harnessed the wind's energy for sailing. Centuries later, people improved the basic design of the windmill as they gave it propeller-type blades to pump water and grind grains.

Wind power – brief history
Source: Robert W. Righter, Wind Energy in America: A History
• First wind mill used to generate electricity (year: 1888, rated power: 12 kW)
• Death to this industry by rural electrification.
• Renewed interest in US in the 1970’s due the oil shock, followed government incentives.
• US stopped installations in the late 1980’s due to expiration of tax credits, but wind turbine technology continued in Europe.
• World-wide boom began in the mid 1990’s.

Drivers of Wind Energy
Declining Wind Generator Costs - Fuel Price Uncertainty - Federal and State Policies - Economic Development - Green Power Marketing.

Wind turbine Designs
• Horizontal axis wind turbines (HAWT) are the most popular - compared to vertical axis wind turbines (VAWT).
– Advantages of VAWT: (a) automatically faces the wind, (b) the heavy machinery can be located on the ground, (c) lightweight.
– Disadvantages of VAWT: (a) the blades are close to the ground (low speed, turbulent wind), (b) hard to spill the wind.
HAWT VAWT

Upwind versus Downwind HAWT
• Downwind: the wind controls the yaw (left– right motion), i.e., it orients itself with respect wind direction. But the shadowing effects of the tower causes the blade to flex, thus resulting in fatigue, noise and reduces power output.
• Upwind: requires a complex yaw control systems to keep the blades facing into the wind, but operates more smoothly and deliver more power. Most modern wind turbines are of the upwind type.

Specific wind turbine performance
• The blades convert the kinetic energy in the wind into rotating shaft power to spin a generator that produces electric power.
• The rotor blades extract energy from the wind based on Bernoulli’s principle to obtain lift (i.e., due to pressure difference).
• Since the blade is moving much faster at the tip than near the hub, the blade must be twisted along its length to keep the angles right.
• Increasing the angle of attack too much can result in a stall. When a wing stalls, the airflow over the top no longer sticks to the surface and the resulting turbulence destroys lift.
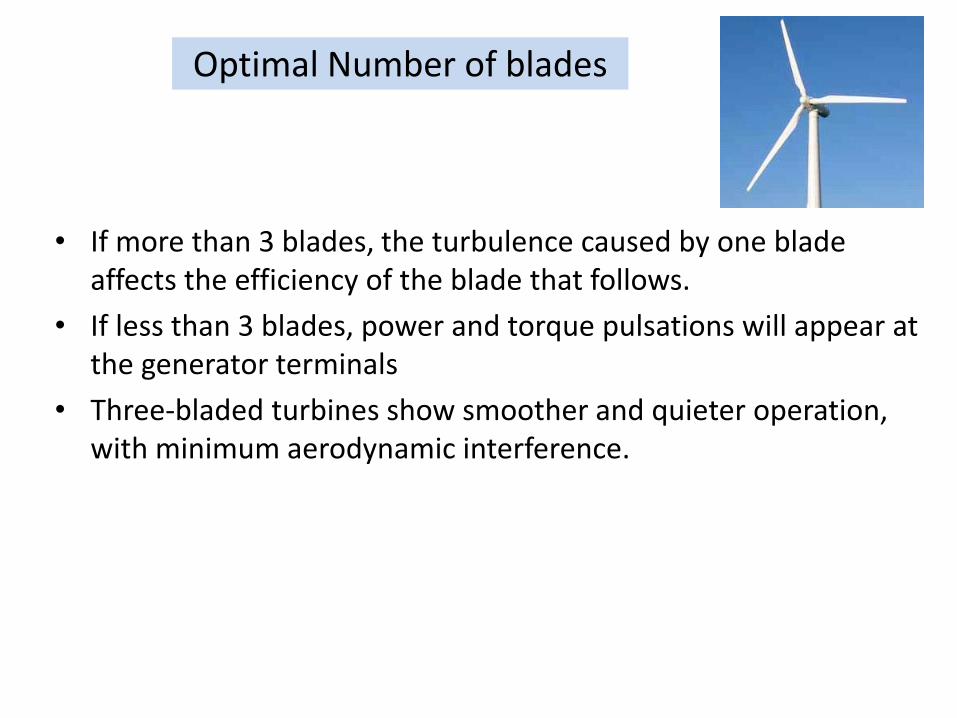
Optimal Number of blades
• If more than 3 blades, the turbulence caused by one blade affects the efficiency of the blade that follows.
• If less than 3 blades, power and torque pulsations will appear at the generator terminals
• Three-bladed turbines show smoother and quieter operation, with minimum aerodynamic interference.

Components of a wind mill

Capacitor Factor
• Capacity factor of a wind power generator is defined as
for a site with an average wind speed of 7 m/s, cf is about 30%.
for a site with an average wind speed of 5 m/s, cf is about 12%.

Rotating machine-based interconnection
• There are four types of utility-scale wind turbine generators (WTG) in the market, based on the generator topology and grid interface:
– Type 1: squirrel cage induction generator
– Type 2: wound-rotor induction generator with adjustable external rotor resistance
– Type 3: doubly-fed induction generator
– Type 4: induction generator with full converter interface

3-Phase induction machine construction
• 3 stator windings (uniformly distributed as in a synchronous generator)
• Two types of rotor:
– Squirrel cage
– Wound rotor (with slip rings)

Induction motor equivalent circuit
s
ms
n
nns
Motor slip:
• Induction always run at a mechanical nm speed below the synchronous speed ns. • The relative difference between the synchronous speed and mechanical speed is Described by the motor slip (s).

Torque-speed curve of induction machine
• Mechanical power delivered to the shaft:
• Mechanical torque:
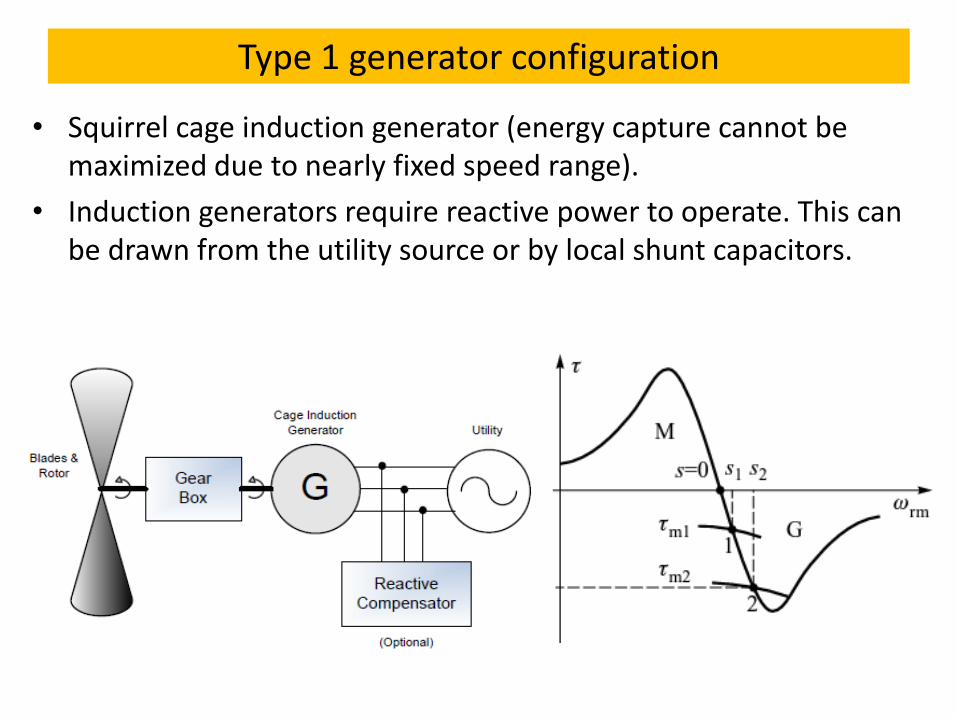
Type 1 generator configuration
• Squirrel cage induction generator (energy capture cannot be maximized due to nearly fixed speed range).
• Induction generators require reactive power to operate. This can be drawn from the utility source or by local shunt capacitors.

Type 2 generator configuration
• Wound rotor induction generator with external resistance (limited speed range, i.e., around 10%)
The gain in energy by allowing more speed variation should be balanced against reduced efficiency.

Type 3 generator configuration
• Doubly-fed induction generator (partially rated converter), speed limit ≈ 30%
– The grid-side inverter is controlled to maintain constant DC link voltage
– The rotor-side inverter inject a voltage into the rotor winding (at slip frequency) that is controlled in both magnitude and phase. If the injected voltage is in phase with the rotor current, this is equivalent to adding a resistance R’ext to the rotor.

Type 4 generator configuration
• Connection through a fully rated power converter provides a wide range of speed.
– The machine-side converter is operated to control the generator torque loading at a particular speed (for max power), while the grid-side inverter is operated to maintain constant DC bus voltage.
• The electric machine used can be an induction machine, wound field or permanent magnet synchronous machine. The latter is often found in relatively small wind generators (up to 50 kW) which use a permanent magnet (PM).
Synchronous or Induction machine
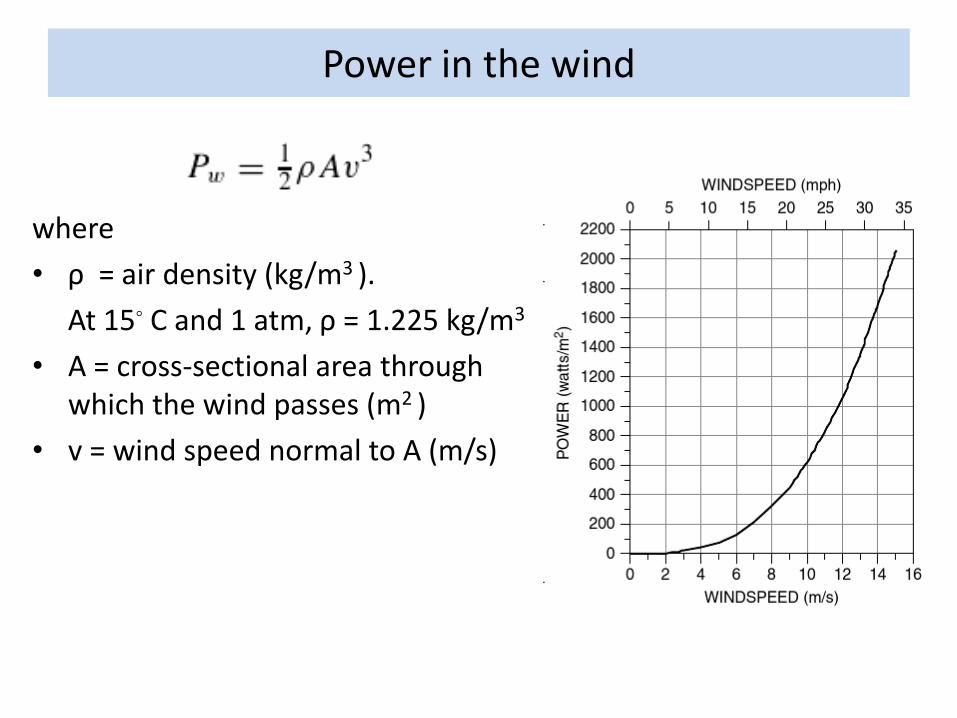
Power in the wind
where
• ρ = air density (kg/m3 ).
At 15◦ C and 1 atm, ρ = 1.225 kg/m3
• A = cross-sectional area through which the wind passes (m2 )
• v = wind speed normal to A (m/s)

Be careful when using average wind speed!
• Compare the energy at 15o C, 1 atm. pressure, contained in 1 m2 for the following wind regimes:
(A) 100 hours of 6-m/s winds
Answer: 13.23 kWh
(B) 50 hours at 3 m/s plus 50 hours at 9 m/s
Answer: 23.15 kWh → 75% more energy in (B) than (A)!
Time (h)
Speed (m/s)
50 100
3
6
9
A
B
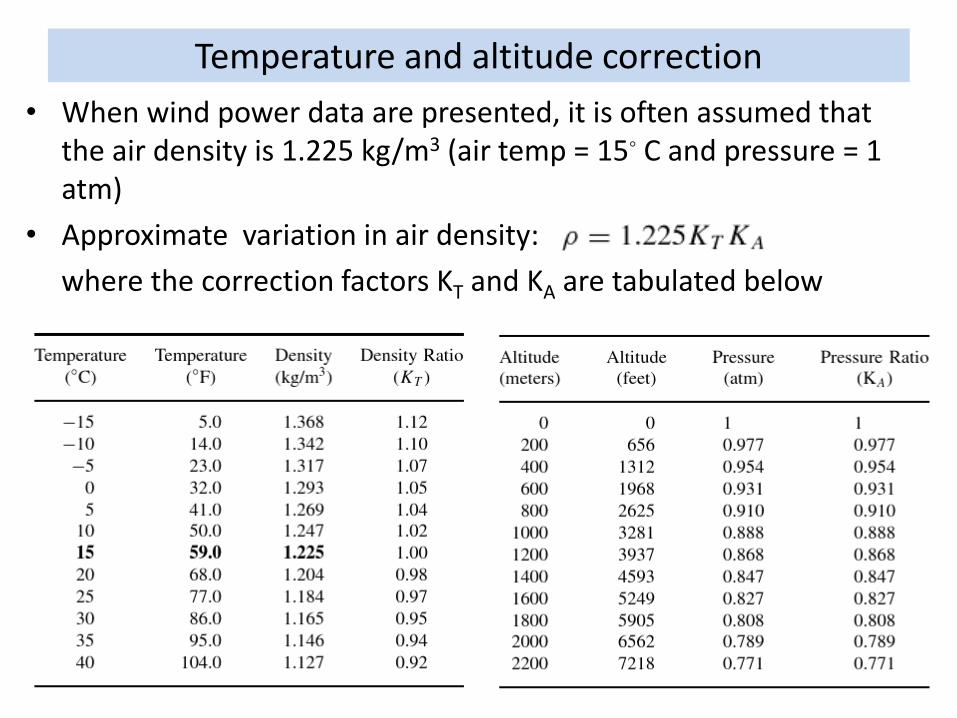
Temperature and altitude correction
• When wind power data are presented, it is often assumed that the air density is 1.225 kg/m3 (air temp = 15◦ C and pressure = 1 atm)
• Approximate variation in air density:
where the correction factors KT and KA are tabulated below

Impact of tower height
• Smooth surfaces, such as a calm sea, offer very little resistance to wind, and the variation of speed with elevation is only modest.
• At the other extreme, surface winds are slowed considerably by high irregularities such as forests and buildings.
• One expression that is often used to characterize the impact of the roughness of the earth’s surface on wind speed is the following: - first approximation
where v is the wind speed at height H , v0 is the wind speed at height H0 - typically a reference height of 10 m), and α is the friction coefficient.

Wind power classification
• Based on average wind speed (using an anemometer 10 m above ground), estimates of power density at a height of 50 m above ground are listed below.
50
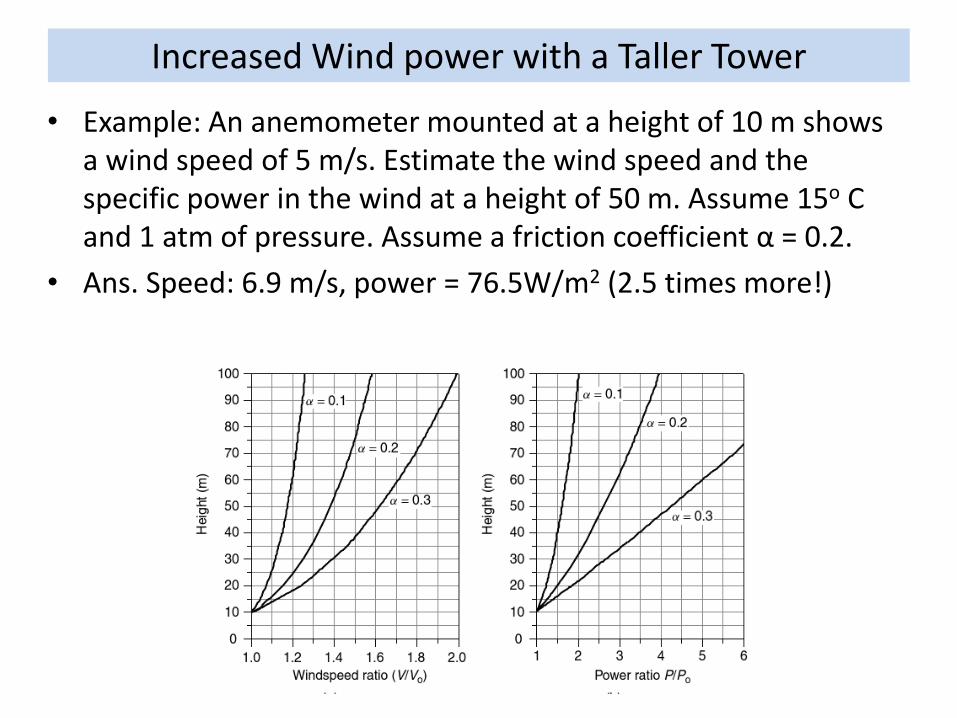
Increased Wind power with a Taller Tower
• Example: An anemometer mounted at a height of 10 m shows a wind speed of 5 m/s. Estimate the wind speed and the specific power in the wind at a height of 50 m. Assume 15o C and 1 atm of pressure. Assume a friction coefficient α = 0.2.
• Ans. Speed: 6.9 m/s, power = 76.5W/m2 (2.5 times more!)

Maximum rotor efficiency
• Betz’s law (1919): The wind turbine blade efficiency is maximum when it slows the wind to one-third of its original velocity.
• → Maximum theoretical rotor efficiency = 59.3%
• Modern wind turbine blades can approach 80 percent of the above limit, i.e., 45% - 50% efficiency in converting the power in the wind into the power of a rotating generator shaft.
• For a given wind speed, rotor efficiency is a function of the rate at which the rotor turns. A common way to illustrate rotor efficiency is to present it as a function of the tip-speed-ratio:
where rpm is the rotor speed, D is the rotor diameter (m); and v is the wind speed (m/s) upwind of the turbine.
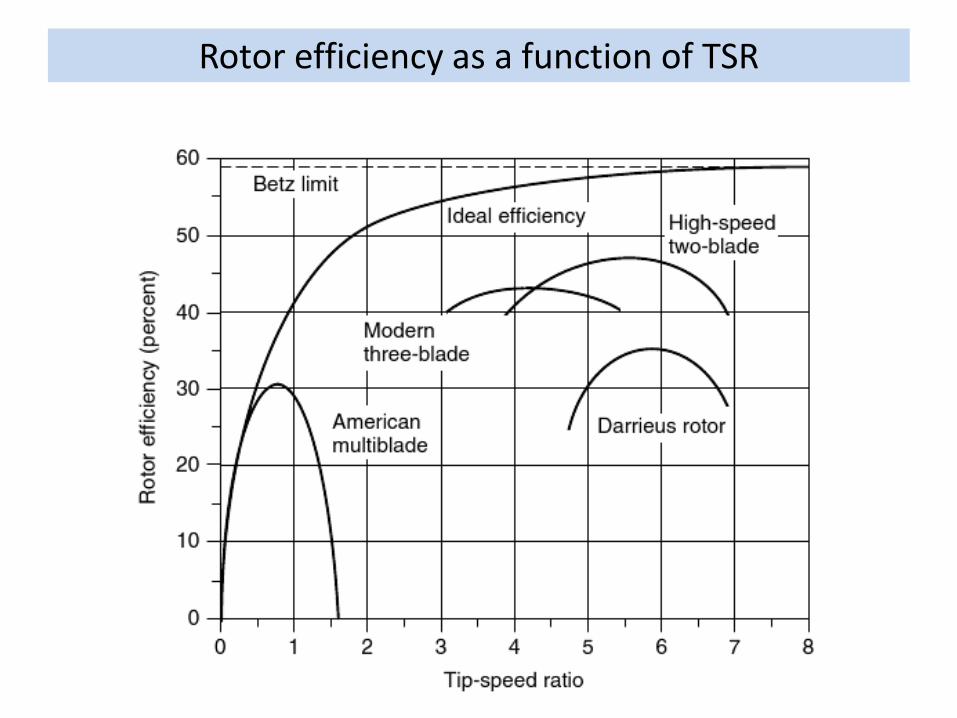
Rotor efficiency as a function of TSR

Wind turbine generators
• Since the blade efficiency depends the TSR, the turbine blades should change their speed as the wind speed changes.

Desire for both constant as variable rotor speed
• The impact on power produced (assuming generator & gear box efficiency of 70%) is shown below.
• For grid-connected turbines, the challenge is to design machines that can somehow accommodate variable rotor speed and somewhat fixed generator speed.

Average power in the wind
To determine the average power, we need to find the average value of the cube of velocity. To do so will require that we
introduce some statistics.
Pavg = 400 W/m2
P(Vavg) = 210 W/m2
The curve can often be approximated By a Rayleigh probability density function with scale parameter c:

• If we assume Rayleigh statistics then the average of the cube of wind speed is 1.91 times the average wind speed cubed.
• Therefore, we can rewrite the fundamental relationship for average power in the wind as
→ the average power in the wind is equal to the power found at the average wind speed multiplied by 6/π or 1.91.
Average power in the wind

Wind Turbine Power Equation
• ρ: The density of the air measure in kg/m3
• A : The area swept by the turbine
• VWind : The wind speed in meters per second
• CP: Turbine power coefficient
Turbine Power = pWind CAV )5.0( 3
Wind
TurbineP
P
PC

Idealized wind turbine Power Curve
• Cut-in wind speed: barely enough to overcome friction and generate net power.
• Rated wind speed: where the generator delivers rated power. Above this, wind power shedding is necessary to avoid damage to the generator (see approaches in next slide).
• Cut-out or furling wind speed: speed at which the machine must be shut down to avoid damage to the turbine. This is achieved by rotating the blades 90 degrees away from the wind direction.

Common methods to spill wind power
• Stall-controlled machines: the aerodynamics of the blades, specially their twist as a function of distance from the hub, are carefully designed to automatically reduce efficiency under excessive wind speed. The majority of modern large wind turbines use this passive approach.
• Pitch-controlled turbines: reduce the blade angle of attack by rotating the blades about their axis few degrees at a time (with a hydraulic system).
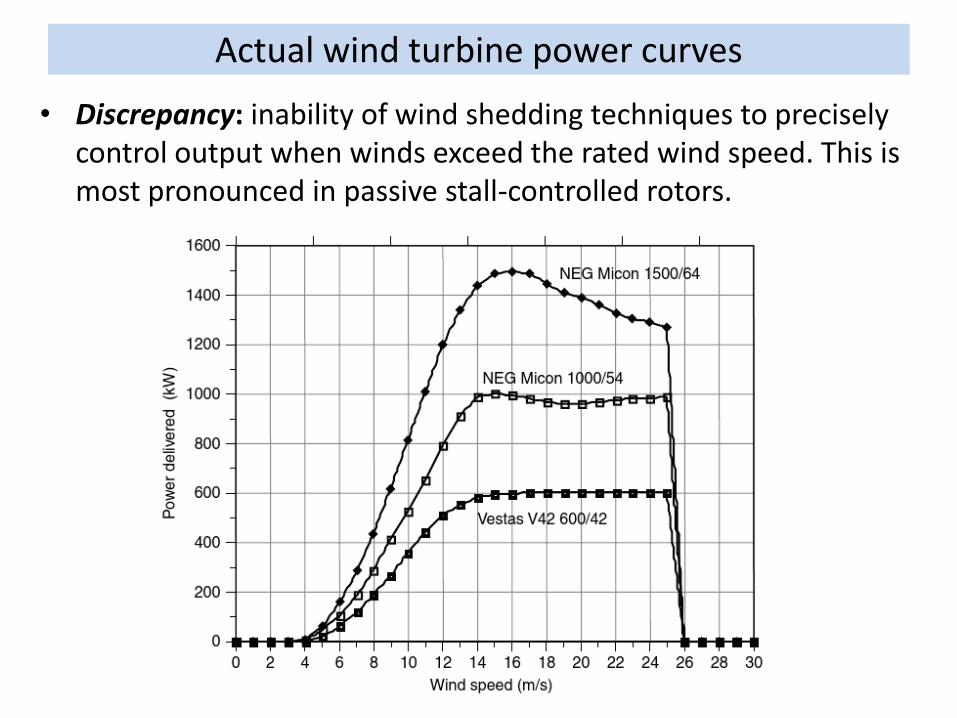
Actual wind turbine power curves
• Discrepancy: inability of wind shedding techniques to precisely control output when winds exceed the rated wind speed. This is most pronounced in passive stall-controlled rotors.

Estimating the annual energy production
• With the power curve in hand, we can combine the power at any wind speed with the hours the wind blows at that speed to come up with the total kWh of energy produced.
• If the site has data (hours at each wind speed), those would be used to calculate the energy delivered. If only the average wind speed is known, we can use the Rayleigh statistical distribution.
• The graph below corresponds to a NEG Micon (1000/60) turbine and Rayleigh winds with average speed 7 m/s.

Wind Data http://mercator.nrel.gov/wwsi/
• Wind data is available for a 3 year period (10 min interval) at nearly 35,000 locations in the USA.

Variability and Uncertainty of Wind Power
Like solar resources, wind power can be highly variable due to sudden changes in wind speed, and uncertain as timing of this variable generation is less predictable.
Source: NREL
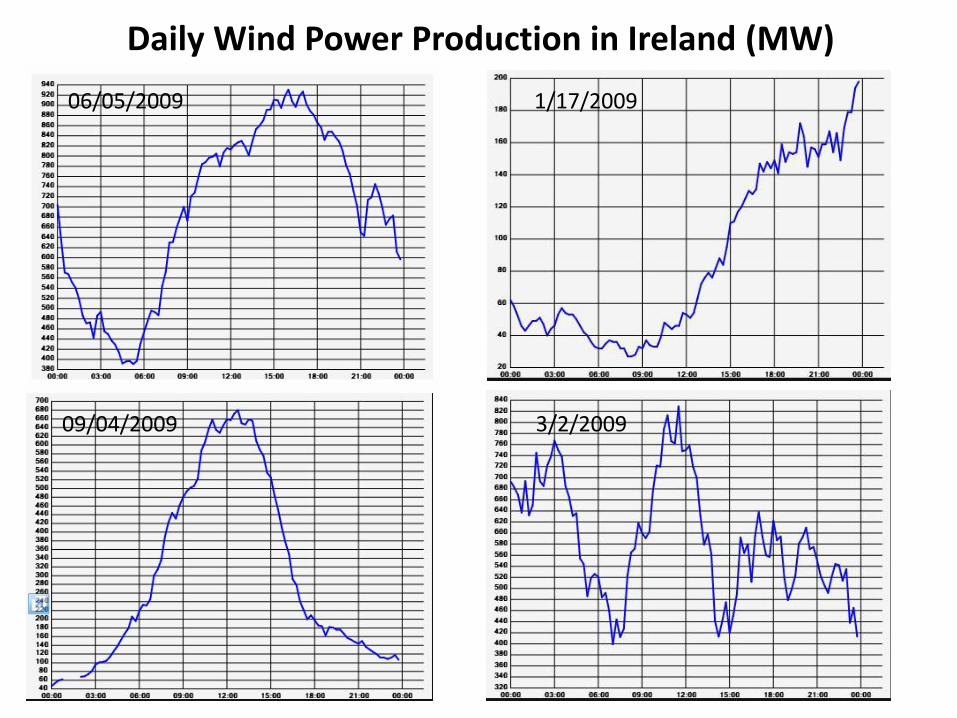
Daily Wind Power Production in Ireland (MW)
06/05/2009
09/04/2009
1/17/2009
3/2/2009
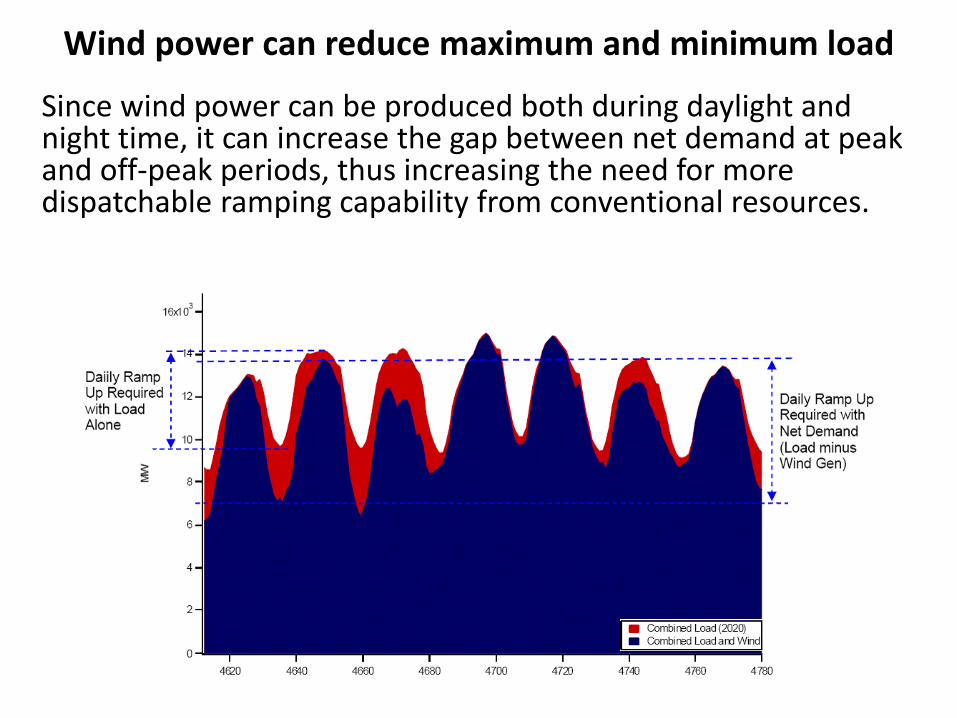
Wind power can reduce maximum and minimum load
Since wind power can be produced both during daylight and night time, it can increase the gap between net demand at peak and off-peak periods, thus increasing the need for more dispatchable ramping capability from conventional resources.

Timing of wind power generation
In some cases, due to diurnal heating and cooling patterns, wind generation output tends to peak during daily off-peak periods. The figure below shows the California Independent System Operator (CAISO) aggregate wind generation output over the ten-day July 2006 heat-wave

Timing of wind power generation
• Variable generation can ramp-up in unison with demand, easing ramping requirements from conventional generators.
• It can also ramp in opposition to demand, increasing system ramping requirements and thereby creating operational challenges.
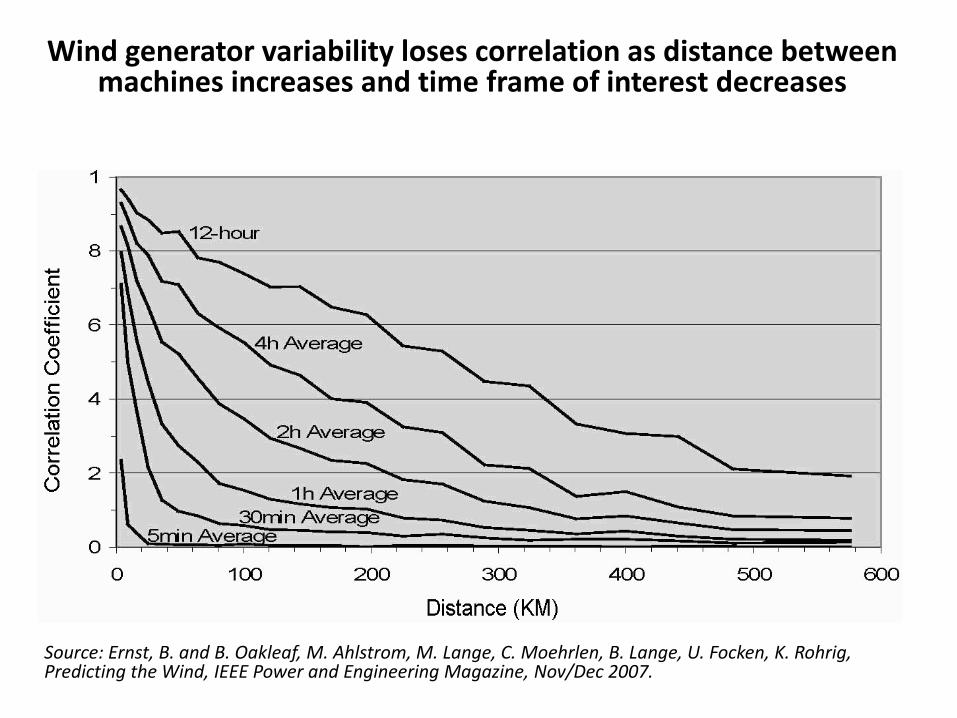
Wind generator variability loses correlation as distance between machines increases and time frame of interest decreases
Source: Ernst, B. and B. Oakleaf, M. Ahlstrom, M. Lange, C. Moehrlen, B. Lange, U. Focken, K. Rohrig, Predicting the Wind, IEEE Power and Engineering Magazine, Nov/Dec 2007.
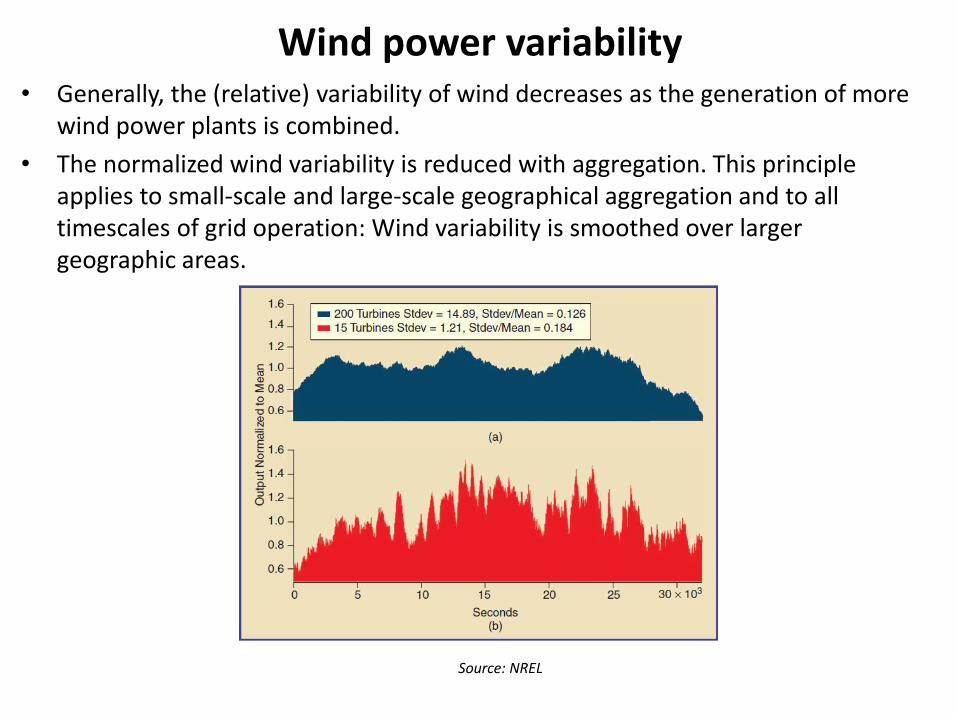
Wind power variability • Generally, the (relative) variability of wind decreases as the generation of more
wind power plants is combined.
• The normalized wind variability is reduced with aggregation. This principle applies to small-scale and large-scale geographical aggregation and to all timescales of grid operation: Wind variability is smoothed over larger geographic areas.
Source: NREL

California wind power ramps from diverse locations
• Like PV power plants, there is considerable diversity among wind plants dispersed over a wider geographic area. Such spatial variation in wind speed makes the combined output from many turbines significantly less variable than that of a single turbine.
• The aggregate energy output from wind plants spread over a reasonably large area tends to remain relatively constant on a minute-to-minute time frame, with changes in output tending to occur gradually over an hour or more.
Source: California ISO

Aggregation benefits large and rare events
• For a single wind turbine, generation can decrease from full power to zero very rapidly. The aggregation of wind capacity, however, turns the sudden interruption of power into a multi-hour downward ramp.
• The figure below illustrates how the output from a single wind plant in Texas dropped by 170 MW over approximately 15 minutes. Over all wind projects, the aggregate wind capacity decrease was much greater, at 1,500 MW, but it took two hours to occur.

Case of high wind penetration
The figure below shows one week of the actual load and the net load in West Denmark. Higher wind production drove net load near zero in some hours.
Source: Energinet.dk
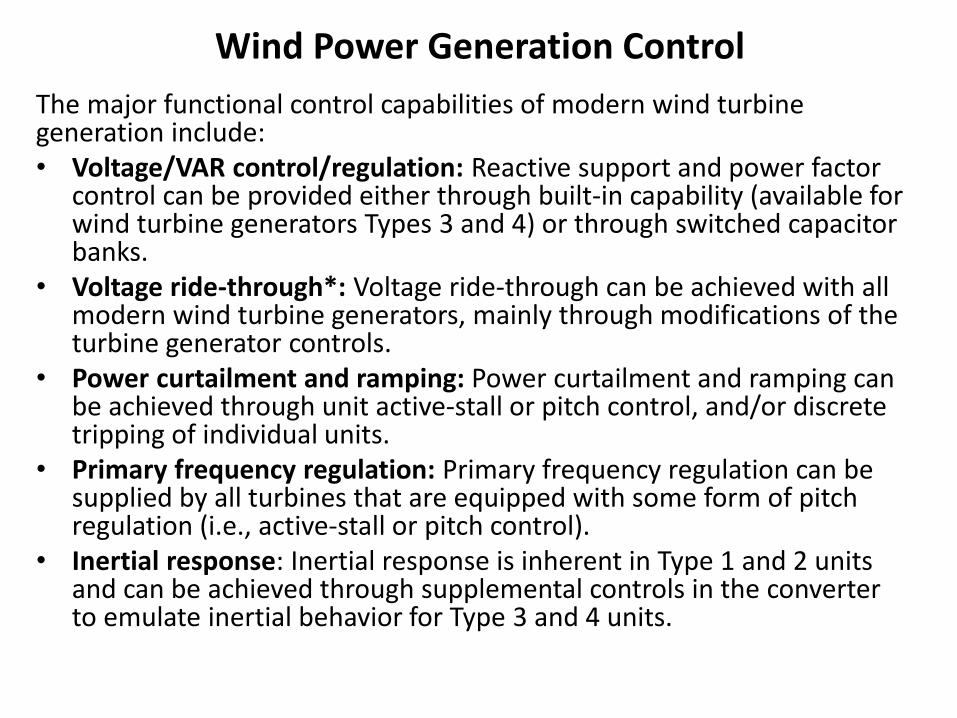
Wind Power Generation Control
The major functional control capabilities of modern wind turbine generation include: • Voltage/VAR control/regulation: Reactive support and power factor
control can be provided either through built-in capability (available for wind turbine generators Types 3 and 4) or through switched capacitor banks.
• Voltage ride-through*: Voltage ride-through can be achieved with all modern wind turbine generators, mainly through modifications of the turbine generator controls.
• Power curtailment and ramping: Power curtailment and ramping can be achieved through unit active-stall or pitch control, and/or discrete tripping of individual units.
• Primary frequency regulation: Primary frequency regulation can be supplied by all turbines that are equipped with some form of pitch regulation (i.e., active-stall or pitch control).
• Inertial response: Inertial response is inherent in Type 1 and 2 units and can be achieved through supplemental controls in the converter to emulate inertial behavior for Type 3 and 4 units.

FERC Order 661A • The order states that wind generating plants are required to remain in service
during three-phase faults with normal clearing (which is a time period of approximately four to nine cycles) and single line-to-ground faults with delayed clearing, and subsequent post-fault voltage recovery to pre-fault voltage unless clearing the fault effectively disconnects the generator from the system.
• Additionally, the required reactive power range for wind plants is specified, and some relatively nonspecific language about requirements for supervisory control and data acquisition (SCADA) and interoperability with the network is also included.
Source: http://www.ferc.gov/EventCalendar/Files/20051212171744-RM05-4-001.pdf
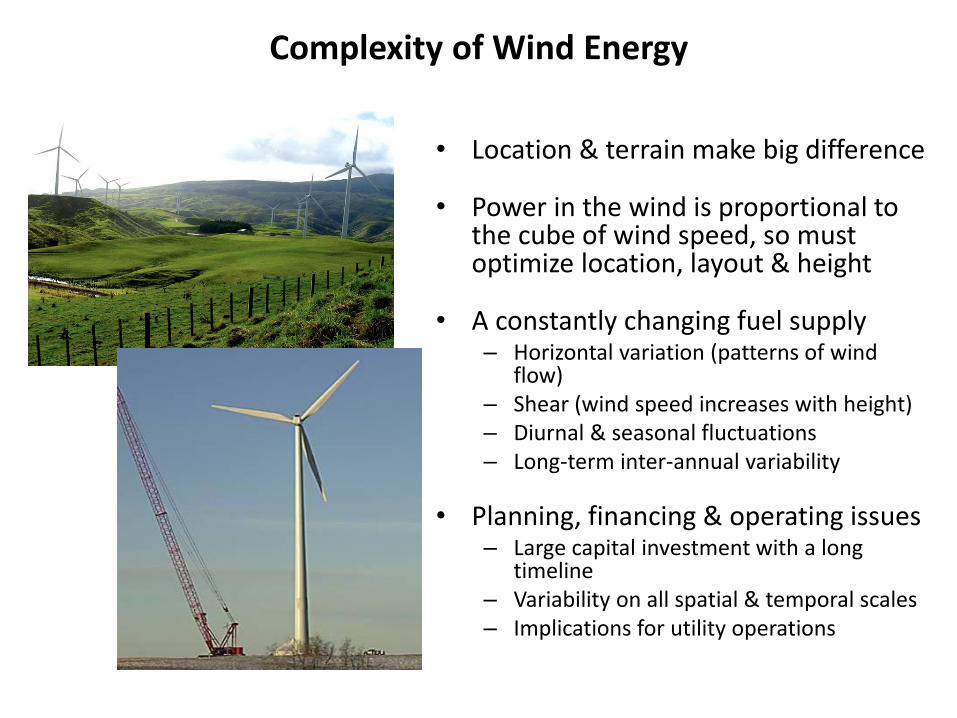
• Location & terrain make big difference
• Power in the wind is proportional to the cube of wind speed, so must optimize location, layout & height
• A constantly changing fuel supply – Horizontal variation (patterns of wind
flow) – Shear (wind speed increases with height) – Diurnal & seasonal fluctuations – Long-term inter-annual variability
• Planning, financing & operating issues – Large capital investment with a long
timeline – Variability on all spatial & temporal scales – Implications for utility operations
Complexity of Wind Energy
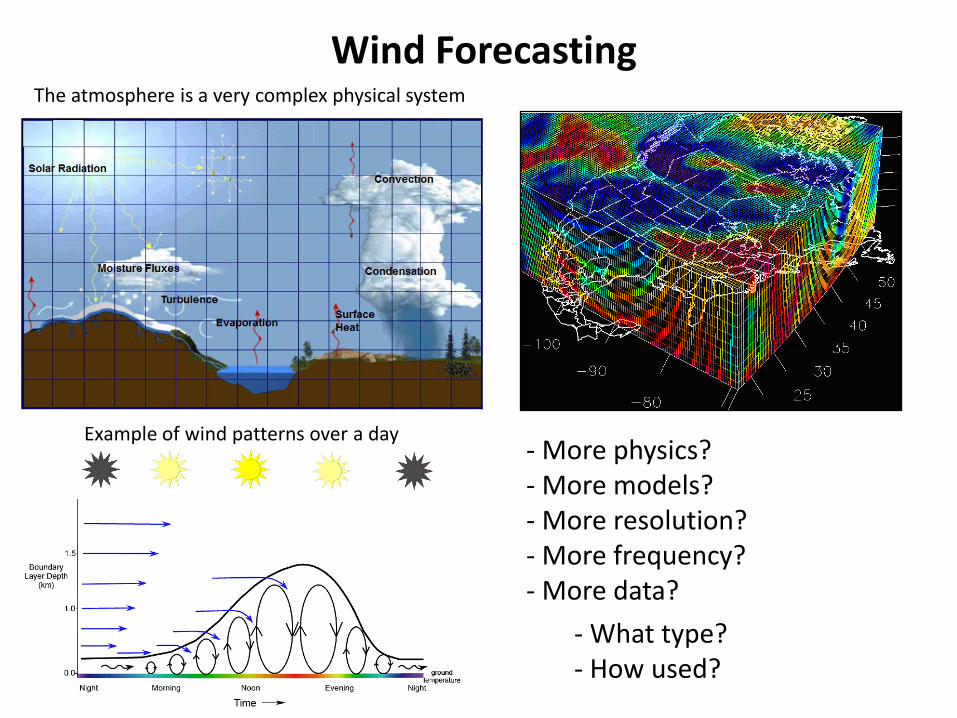
Wind Forecasting
Example of wind patterns over a day
The atmosphere is a very complex physical system
- More physics? - More models? - More resolution? - More frequency? - More data?
- What type? - How used?

Accuracy of wind forecasting • The figure below shows that there can be significant variations in the
amplitude and phase (i.e. timing) between the actual and the forecast wind generation output. Improvements to short term forecasting techniques are necessary to provide the system operator with the needed tool for the reliable operation of the system.
Source: Alberta Electric System Operator (AESO)
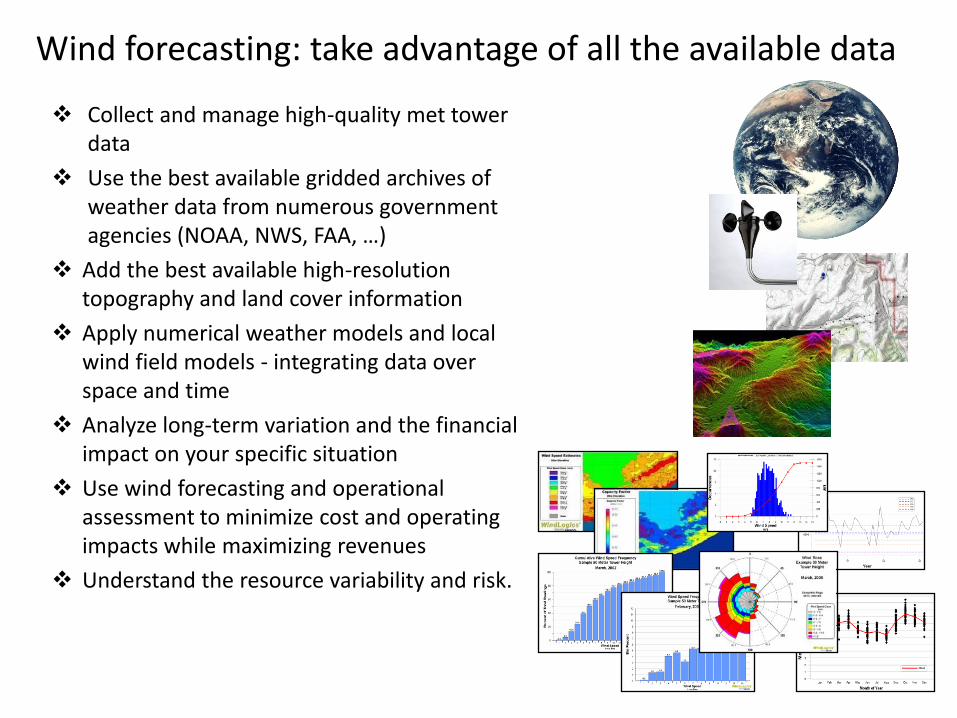
Wind forecasting: take advantage of all the available data
Collect and manage high-quality met tower data
Use the best available gridded archives of weather data from numerous government agencies (NOAA, NWS, FAA, …)
Add the best available high-resolution topography and land cover information
Apply numerical weather models and local wind field models - integrating data over space and time
Analyze long-term variation and the financial impact on your specific situation
Use wind forecasting and operational assessment to minimize cost and operating impacts while maximizing revenues
Understand the resource variability and risk.

Wind turbines do require maintenance and do fail

BREAK!
Top Related