

Languages
Pages
Legal

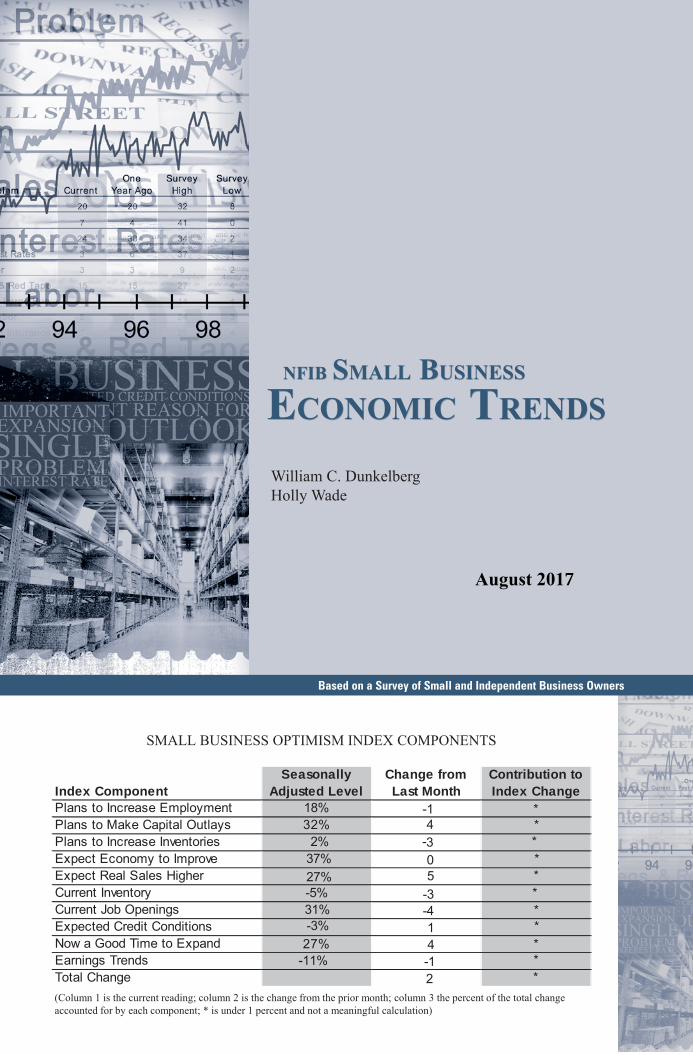
SMALL BUSINESS OPTIMISM INDEX COMPONENTS
Index ComponentSeasonally
Adjusted LevelChange from Last Month
Contribution to Index Change
Plans to Increase Employment 18% -1 *Plans to Make Capital Outlays 32% 4 *Plans to Increase Inventories 2% -3
0 5
*Expect Economy to Improve 37%
*Expect Real Sales Higher 27%
-3 *
Current Inventory -5% *Current Job Openings 31% -4 *Expected Credit Conditions -3% 1
4 -1
*Now a Good Time to Expand 27% *Earnings Trends -11%
2 *
Total Change *(Column 1 is the current reading; column 2 is the change from the prior month; column 3 the percent of the total change accounted for by each component; * is under 1 percent and not a meaningful calculation)
1201 “F” Street NW
Suite 200W
ashington, DC
20004 nfib.com
Based on a Survey of Small and Independent Business Owners
NFIB SMALL BUSINESS
ECONOMIC TRENDS NFIB SMALL BUSINESS
ECONOMIC TRENDS
NFIBS
MA
LL B
USIN
ESS
EC
ON
OM
IC TR
EN
DS
NFIBS
MA
LL B
USIN
ESS
EC
ON
OM
IC TR
EN
DS
William C. DunkelbergHolly Wade
SBET_CVR_2012.indd 1-2SBET_CVR_2012.indd 1-2 3/30/2012 11:27:49 AM3/30/2012 11:27:49 AM
August 2017
NFIB SMALL BUSINESS
ECONOMIC TRENDS
_____________________NFIB Research Center has collected SmallBusiness Economic Trends Data with Quarterlysurveys since 1973 and monthly surveys since1986. The sample is drawn from the membershipfiles of the National Federation of IndependentBusiness (NFIB). Each was mailed a questionnaireand one reminder. Subscriptions for twelvemonthly SBET issues are $250. Historical andunadjusted data are available, along with a copyof the questionnaire, from the NFIB ResearchCenter. You may reproduce Small BusinessEconomic Trends items if you cite the publicationname and date and note it is a copyright of theNFIB Research Center. © NFIB Research Center.ISBS #0940791-24-2. Chief Economist William C.Dunkelberg and Director of Research and PolicyAnalysis Holly Wade are responsible for thereport.
IN THIS ISSUE
_____________________Summary . . . . . . . . . . . . . . . . . . . . . . . . . . . . . . 1
Commentary. . . . . . . . . . . . . . . . . . . . . . . . . . . . 3
Optimism . . . . . . . . . . . . . . . . . . . . . . . . . . . . . . 4
Outlook . . . . . . . . . . . . . . . . . . . . . . . . . . . . . . . . 4
Earnings . . . . . . . . . . . . . . . . . . . . . . . . . . . . . . . 6
Sales . . . . . . . . . . . . . . . . . . . . . . . . . . . . . . . . . 7
Prices . . . . . . . . . . . . . . . . . . . . . . . . . . . . . . . . . 8
Employment. . . . . . . . . . . . . . . . . . . . . . . . . . . 9
Compensation . . . . . . . . . . . . . . . . . . . . . . . . . 10
Credit Conditions . . . . . . . . . . . . . . . . . . . . . . 12
Inventories . . . . . . . . . . . . . . . . . . . . . . . . . . . . 14
Capital Outlays. . . . . . . . . . . . . . . . . . . . . . . . . 16
Most Important Problem . . . . . . . . . . . . . . . . 18
Survey Profile . . . . . . . . . . . . . . . . . . . . . . . . . 19
Economic Survey. . . . . . . . . . . . . . . . . . . . . . . 20
1 |
NFI
B S
mal
l Bus
ines
s Eco
nom
ic T
rend
s M
on
thly
Rep
ort
SUMMARY
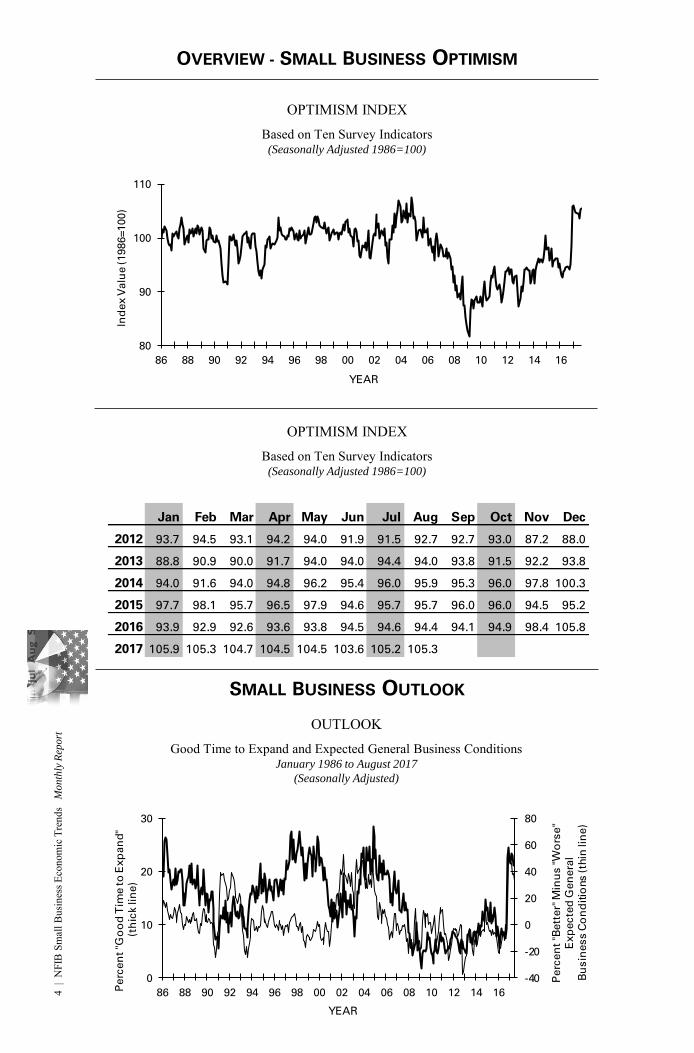
OPTIMISM INDEXThe Index of Small Business Optimism rose 0.1 points to 105.3 in August,
basically unchanged from July. Five of the 10 Index components posted a
gain and five declined. The Index peaked for this recovery at 105.9 in
January, just 0.6 points above the August reading. It is unlikely that
progress in Washington D.C. is the source of continued owner optimism
because there isn’t any on the major issues of health care and tax reform.
So owner optimism is more like a “relief rally”, relief that they did not get
another four years of costly federal regulations which increased the hold of
government on the private sector. The Congressional Record is nearly
empty compared to years of record new and changed regulations posted for
the past eight years.
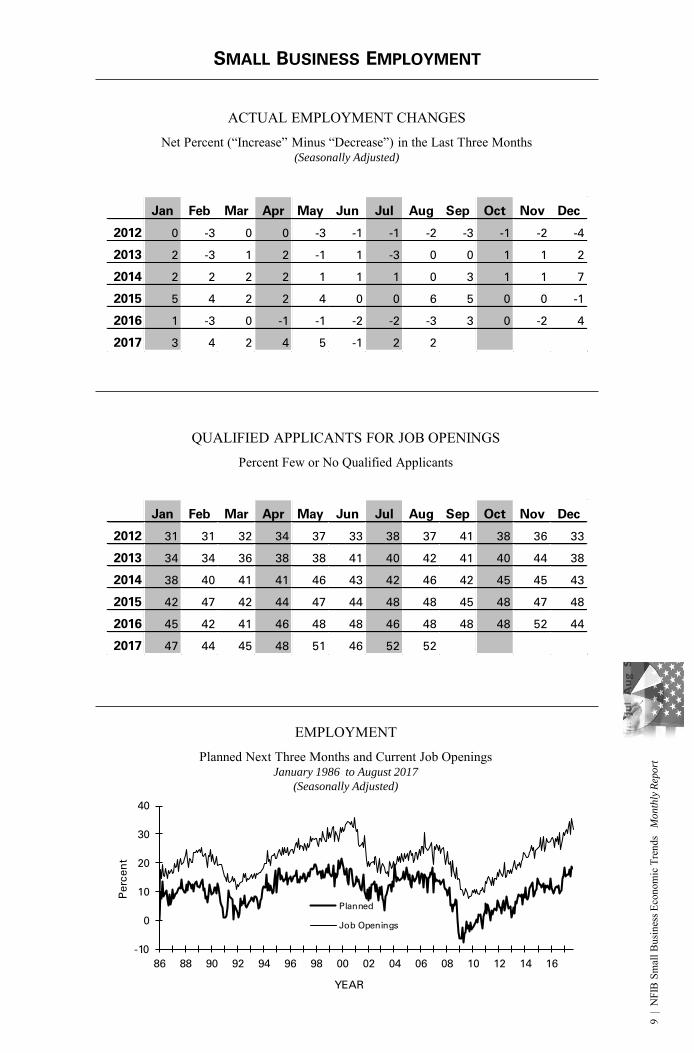
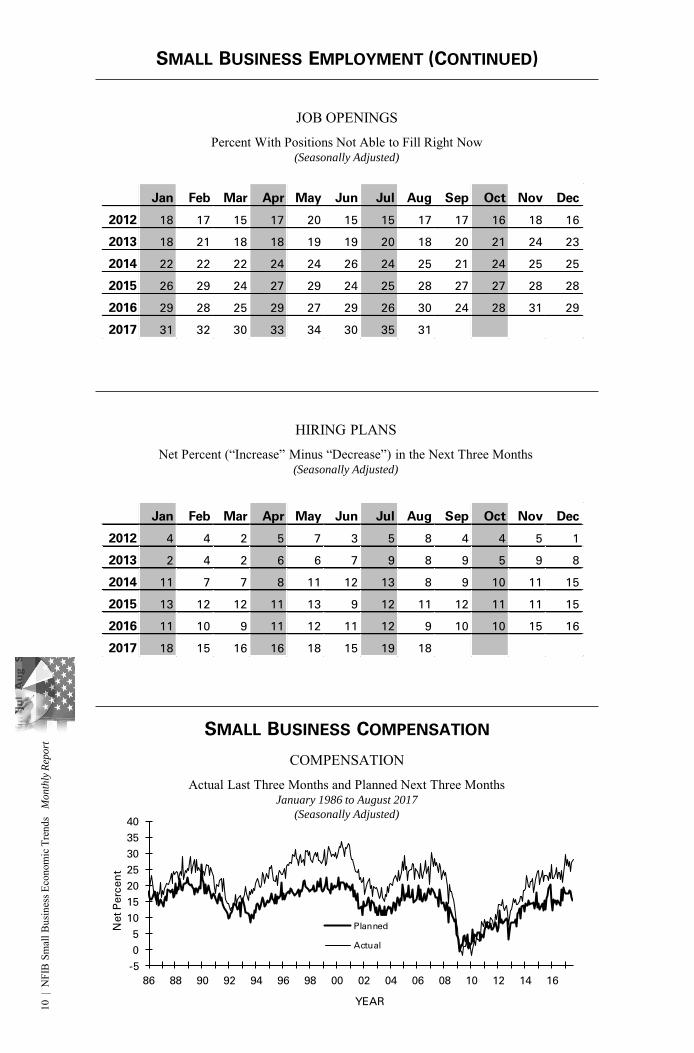
LABOR MARKETSSmall business owners reported a seasonally adjusted average employment change per firm of 0.18 workers per firm over the past three months, virtually unchanged from July. Fourteen percent (up 1 point) reported increasing employment an average of 4.4 workers per firm and 12 percent (up 1 point) reported reducing employment an average of 2.4 workers per firm (seasonally adjusted). Fifty-nine percent reported hiring or trying to hire (down 1 point), but 52 percent (88 percent of those hiring or trying to hire) reported few or no qualified applicants for the positions they were trying to fill. Nineteen percent of owners cited the difficulty of finding qualified workers as their Single Most Important Business Problem (unchanged), second only to taxes. Labor quality is the top ranked problem in Construction (33 percent) and Manufacturing (25 percent), receiving more votes than taxes and regulatory costs. Thirty-one percent of all owners reported at least one job opening they could not fill in the current period, down 4 points but a very high reading. A seasonally adjusted net 18 percent of owners plan to create new jobs, off 1 point from July but historically very strong.
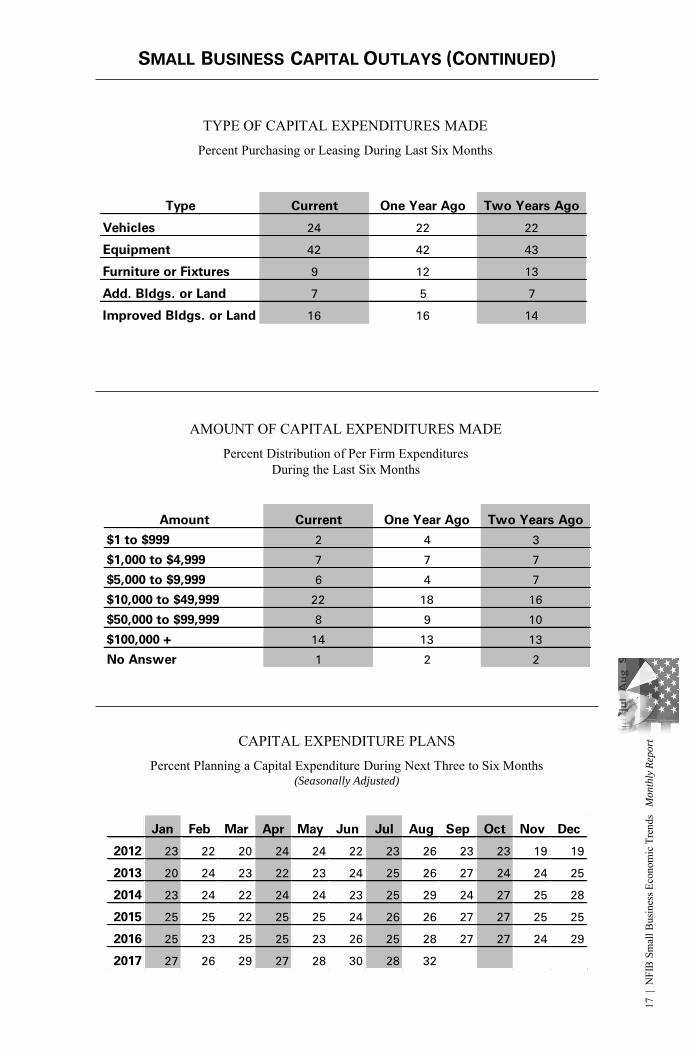
CAPITAL SPENDINGSixty percent reported capital outlays, up 3 points. Of those making expenditures, 42 percent reported spending on new equipment (up 4 points), 24 percent acquired vehicles (unchanged), and 16 percent improved or expanded facilities (down 1 point). Seven percent acquired new buildings or land for expansion (up 2 points) and 9 percent spent money for new fixtures and furniture (down 4 points). Solid numbers, but not enough for a significant improvement in GDP growth or productivity. The percent of owners planning capital outlays in the next 3 to 6 months increased to 32 percent, the strongest reading since 2006. Investment plans were most frequent in Professional Services (46 percent), Agriculture (33 percent), the Wholesale Trades (36 percent), Manufacturing (38 percent each) and Construction (33 percent).
This survey was conducted in August 2017. A sample of 5,000 small-business owners/members was drawn. Seven hundred and thirteen (713) usable responses were received – a response rate of 14 percent.
2 |
NFI
B S
mal
l Bus
ines
s Eco
nom
ic T
rend
s M
on
thly
Rep
ort
SALES AND INVENTORIESThe net percent of all owners (seasonally adjusted) reporting higher nominal sales in the past three months compared to the prior three months was a net 3 percent, a 3-point improvement over July. Seasonally adjusted, the net percent of owners expecting higher real sales volumes gained 5 points, rising to a net 27 percent of owners, this on top of a 5-point jump in July. Stronger sales expectations are very supportive of the historically high hiring plans and strong inventory investment plans.
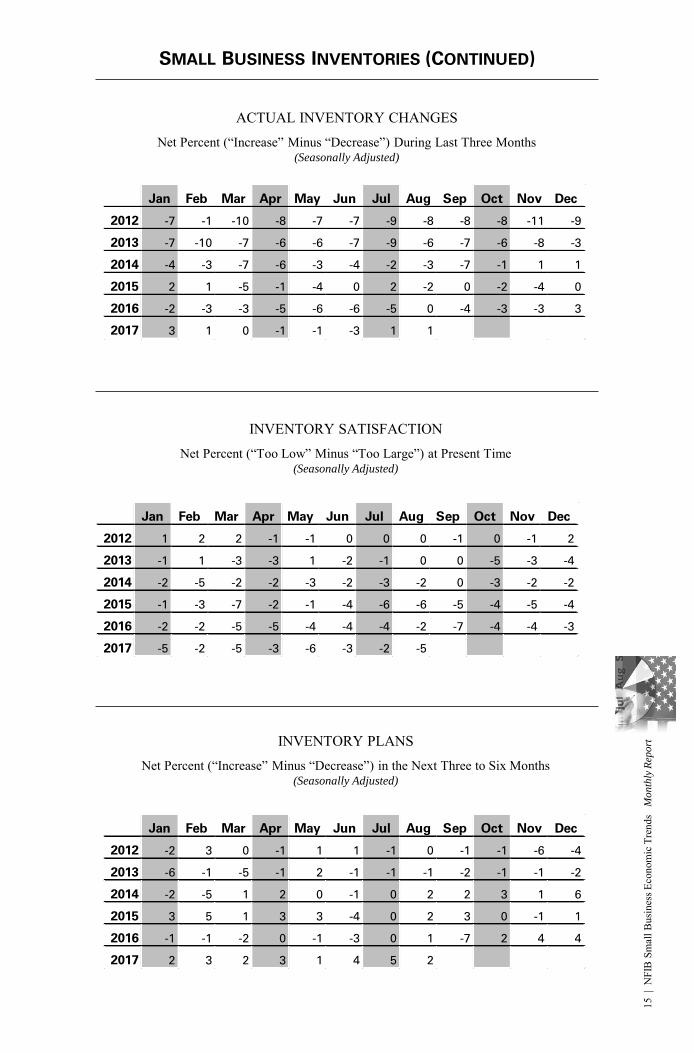
The net percent of owners reporting net inventory increases was unchanged at a net 1 percent (seasonally adjusted), reversing months of inventory stock reductions that were generated by solid consumer spending in the second quarter. The net percent of owners viewing current inventory stocks as “too low” deteriorated 3 points to a net negative 5 percent. The net percent of owners planning to add to inventory fell 3 points to a net 2 percent. Although lower than July’s reading, this is a positive indicator for second half growth and consistent with the improvement in real sales expectations and future business conditions.
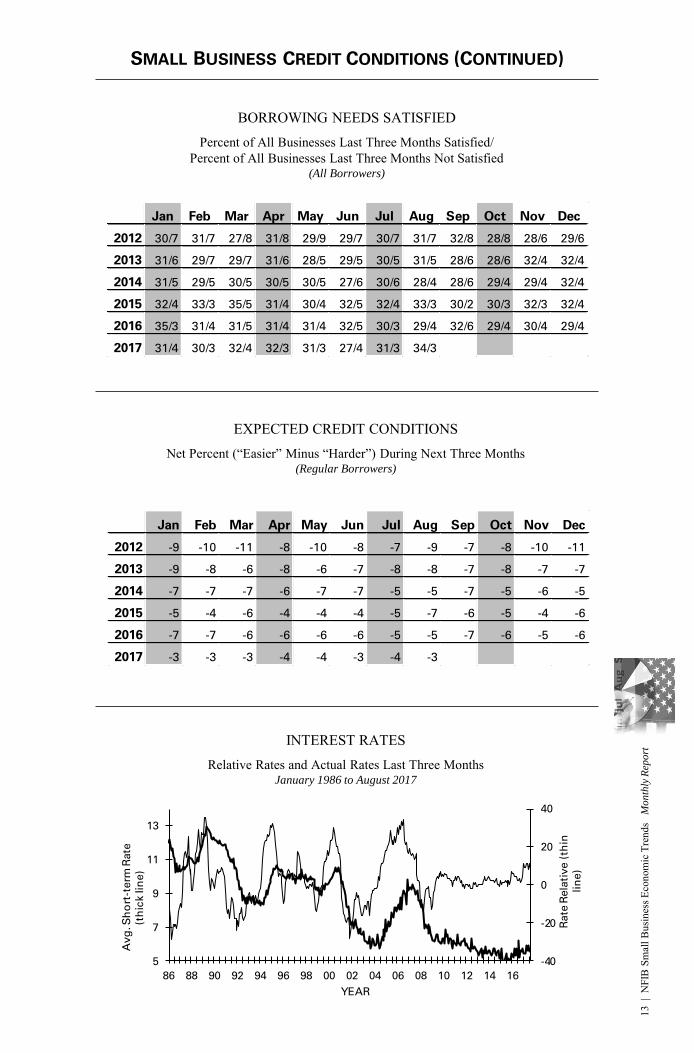
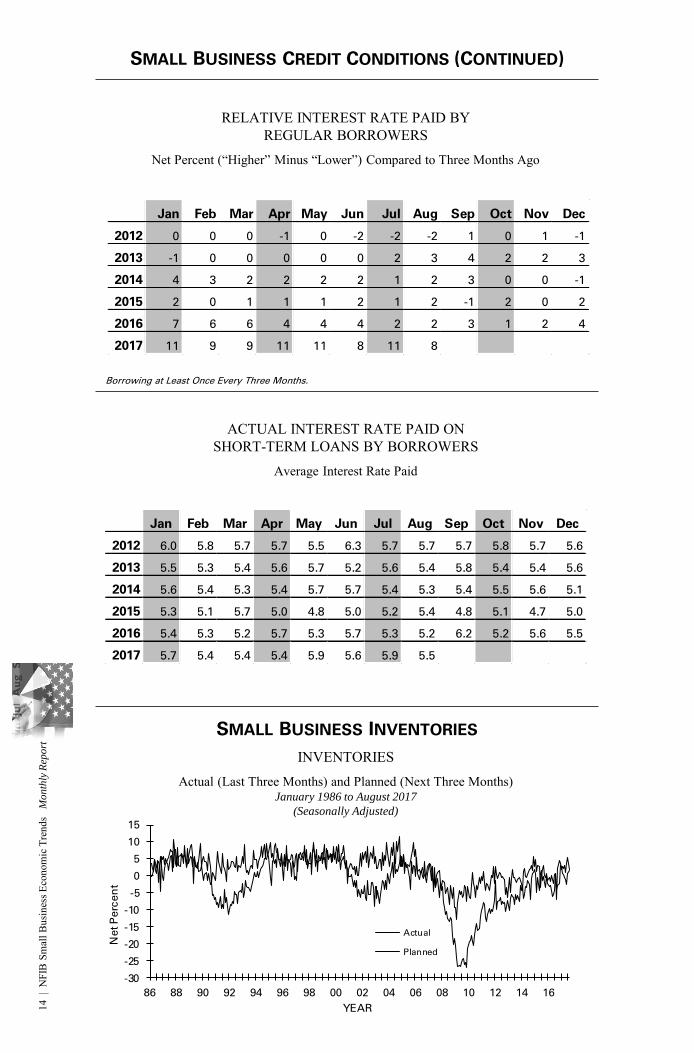
CREDIT MARKETS Three percent of owners reported that all their borrowing needs were not satisfied, unchanged and historically very low. Thirty-four percent reported all credit needs met (up 3 points) and 49 percent explicitly said they were not interested in a loan, down 2 points. Including those who did not answer the question, 63 percent of owners have no interest in borrowing, down 3 points. Thirty-one percent of all owners reported borrowing on a regular basis (up 1 point). The average rate paid on short maturity loans was down 40 basis points at 5.5 percent, little changed even as the Federal Reserve raises rates.
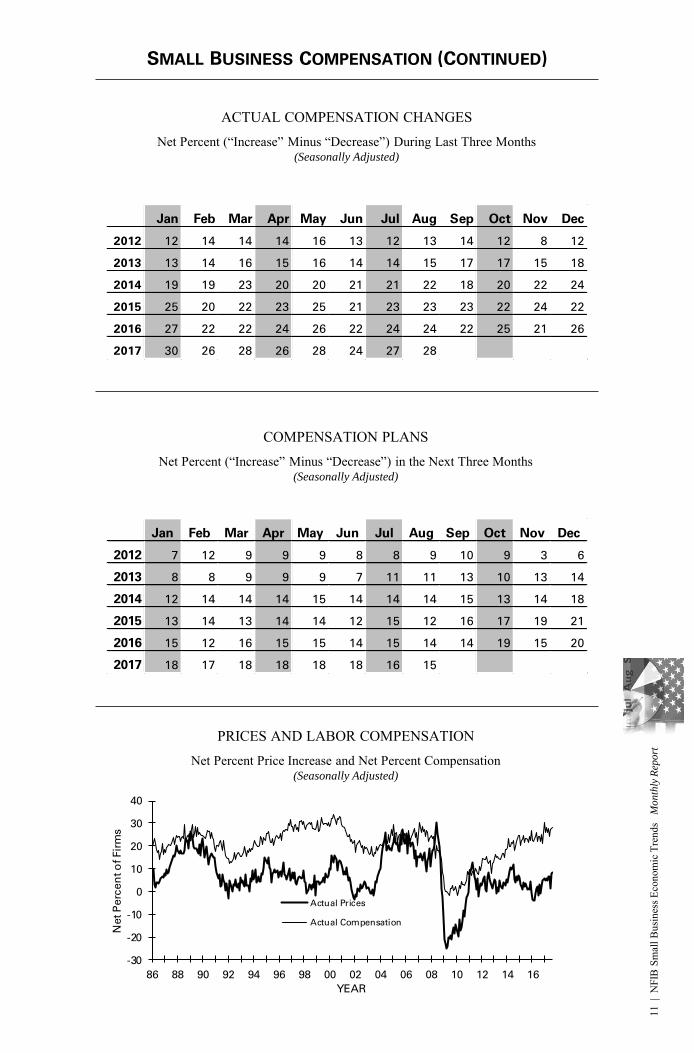
COMPENSATION AND EARNINGSReports of higher worker compensation continue to be strong, consistent with the tight labor markets indicated by the job openings and complaints about labor quality. Reports of increased compensation rose 1 point to a net 28 percent. Plans to raise compensation fell 1 point to a net 15 percent, the lowest reading this year. But labor market conditions will result in many more actually raising compensation, to keep or attract the employees they need. The frequency of reports of improved profit trends declined 1 point to a net negative 11 percent reporting quarter on quarter profit improvements, historically a solid reading and one of the best readings in this expansion. Most of those reporting higher profits credit improved sales, just 14 percent said higher selling prices improved the bottom line.
INFLATIONThe net percent of owners raising average selling prices increased 1 point, rising to a net 9 percent. This is the highest reading since 2014, good news for the Federal Reserve which is trying to generate more inflation. Nine percent of owners reported reducing their average selling prices in the past three months (unchanged), and 17 percent reported price increases (down 1 point). Seasonally adjusted, a net 20 percent plan price hikes.
COMMENTARY
“Productivity” increased 0.1% in the first quarter and 0.9% in the second quarter (annual rates). Did workers get that much better in three months? Not likely. Defined as a change in “output per hour worked,” its measurement has occupied economists for decades. Consider the productivity of an employee at a burger joint. The number of burgers served per hour measures productivity. But this varies with the economy; in good times, there are more customers and in bad time fewer. But the fundamental skills of the burger server do not change. These “skills” and the available capital equipment will determine over the long run what the worker’s productivity CAN be. What it WILL be depends on how many customers actually buy a burger. There was no amazing improvement in worker skills from the first quarter to the second, just a change in demand which resulted in more sales per hour for the existing employees.
Some argue that sluggish productivity growth can slow economic growth and prevent wages from rising much. For the burger worker, it is slow economic growth that reduces the number of burgers purchased per hour, it is not the employee’s ability to deliver burgers. Only if the demand for burgers reaches the limits of the worker to deliver them could the employee’s productivity limit growth, a “supply” problem that can be alleviated by hiring another worker or getting a machine or a reorganization of the burger production line (management skills).
Strong demand results in better utilization of capacity and creates new jobs, all of which comes about through higher wages paid to attract applicants and keep good employees. The reverse is not true. Mandating a $15 minimum wage will not increase the number of burgers served per hour by the employee to cover the higher wage cost. That will only raise costs for the business which will have to raise prices to recover those costs or fire an employee if burger demand falls due to higher prices.
One simple fact holds true: employee compensation can rise in real terms over time only if employees produce more stuff per hour e.g. productivity rises. This depends on both supply and demand factors. To make sure that the employee CAN produce more if asked, we invest in training, research, technology, improved equipment, all to increase the capacity to produce. However, demand plays an important role. The employee can’t produce more burgers per hour unless there are sufficient customers to make it happen. Thus, the need for pro-growth policies which will help finance the capital investments needed to improve long-run productivity.
Second quarter GDP growth was revised up to 3 percent (annual rate) revealing stronger consumer and private sector spending which raises the odds that the Federal Reserve will raise rates again. With little good news from Washington D.C., it appears that owner optimism is holding at record levels because of private sector activity on Main Street, a reason to hire and build inventories and make capital purchases. Eventually, something will happen to taxes and health care, presumably improving on the current situation, so at least the outcome will not be a negative for owners.
3 |
NFI
B S
mal
l Bus
ines
s Eco
nom
ic T
rend
s M
on
thly
Rep
ort
OVERVIEW - SMALL BUSINESS OPTIMISM
OPTIMISM INDEXBased on Ten Survey Indicators
(Seasonally Adjusted 1986=100)
Jan Feb Mar Apr May Jun Jul Aug Sep Oct Nov Dec
2012 93.7 94.5 93.1 94.2 94.0 91.9 91.5 92.7 92.7 93.0 87.2 88.0
2013 88.8 90.9 90.0 91.7 94.0 94.0 94.4 94.0 93.8 91.5 92.2 93.8
2014 94.0 91.6 94.0 94.8 96.2 95.4 96.0 95.9 95.3 96.0 97.8 100.3
2015 97.7 98.1 95.7 96.5 97.9 94.6 95.7 95.7 96.0 96.0 94.5 95.2
2016 93.9 92.9 92.6 93.6 93.8 94.5 94.6 94.4 94.1 94.9 98.4 105.8
2017 105.9 105.3 104.7 104.5 104.5 103.6 105.2 105.3
OPTIMISM INDEXBased on Ten Survey Indicators
(Seasonally Adjusted 1986=100)
OUTLOOKGood Time to Expand and Expected General Business Conditions
January 1986 to August 2017
(Seasonally Adjusted)
SMALL BUSINESS OUTLOOK
80
90
100
110
86 88 90 92 94 96 98 00 02 04 06 08 10 12 14 16
Ind
ex V
alu
e (1986=100)
YEAR
-40
-20
0
20
40
60
80
0
10
20
30
86 88 90 92 94 96 98 00 02 04 06 08 10 12 14 16Perc
en
t "G
oo
d T
ime to
Exp
an
d"
(th
ick li
ne)
Perc
en
t "B
ett
er"
Min
us "W
ors
e"
Exp
ecte
d G
en
era
l
Bu
sin
ess C
on
ditio
ns (th
in li
ne)
YEAR
4 |
NFI
B S
mal
l Bus
ines
s Eco
nom
ic T
rend
s M
on
thly
Rep
ort
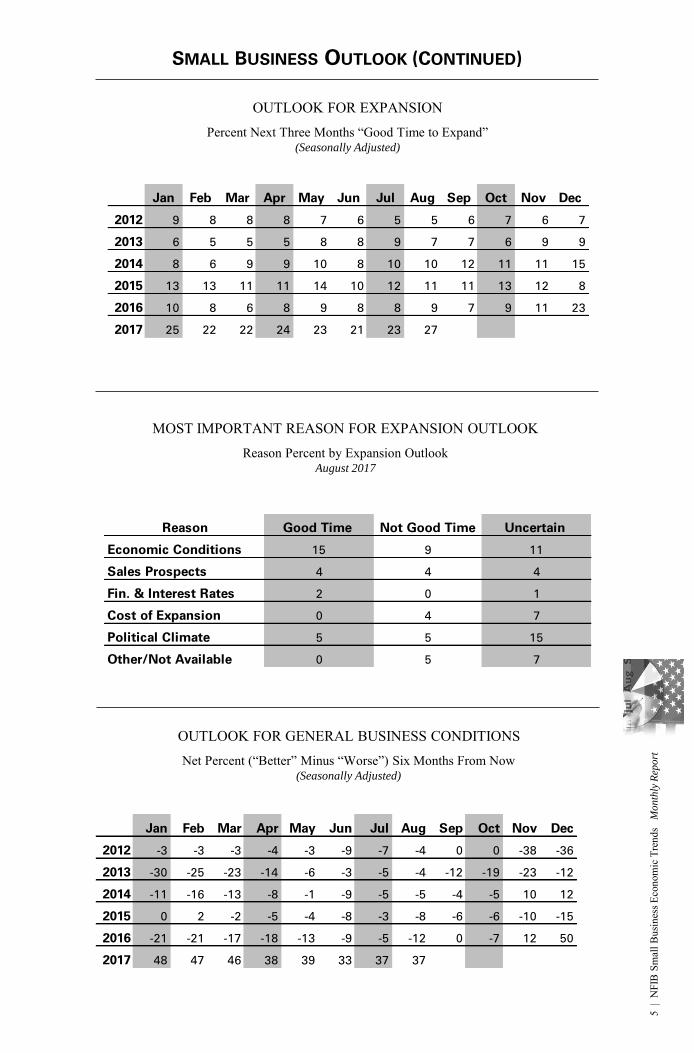
SMALL BUSINESS OUTLOOK (CONTINUED)
Jan Feb Mar Apr May Jun Jul Aug Sep Oct Nov Dec
2012 9 8 8 8 7 6 5 5 6 7 6 7
2013 6 5 5 5 8 8 9 7 7 6 9 9
2014 8 6 9 9 10 8 10 10 12 11 11 15
2015 13 13 11 11 14 10 12 11 11 13 12 8
2016 10 8 6 8 9 8 8 9 7 9 11 23
2017 25 22 22 24 23 21 23 27
OUTLOOK FOR EXPANSIONPercent Next Three Months “Good Time to Expand”
(Seasonally Adjusted)
MOST IMPORTANT REASON FOR EXPANSION OUTLOOKReason Percent by Expansion Outlook
August 2017
Reason Good Time Not Good Time Uncertain
Economic Conditions 15 9 11
Sales Prospects 4 4 4
Fin. & Interest Rates 2 0 1
Cost of Expansion 0 4 7
Political Climate 5 5 15
Other/Not Available 0 5 7
OUTLOOK FOR GENERAL BUSINESS CONDITIONSNet Percent (“Better” Minus “Worse”) Six Months From Now
(Seasonally Adjusted)
Jan Feb Mar Apr May Jun Jul Aug Sep Oct Nov Dec
2012 -3 -3 -3 -4 -3 -9 -7 -4 0 0 -38 -36
2013 -30 -25 -23 -14 -6 -3 -5 -4 -12 -19 -23 -12
2014 -11 -16 -13 -8 -1 -9 -5 -5 -4 -5 10 12
2015 0 2 -2 -5 -4 -8 -3 -8 -6 -6 -10 -15
2016 -21 -21 -17 -18 -13 -9 -5 -12 0 -7 12 50
2017 48 47 46 38 39 33 37 37
5 |
NFI
B S
mal
l Bus
ines
s Eco
nom
ic T
rend
s M
on
thly
Rep
ort
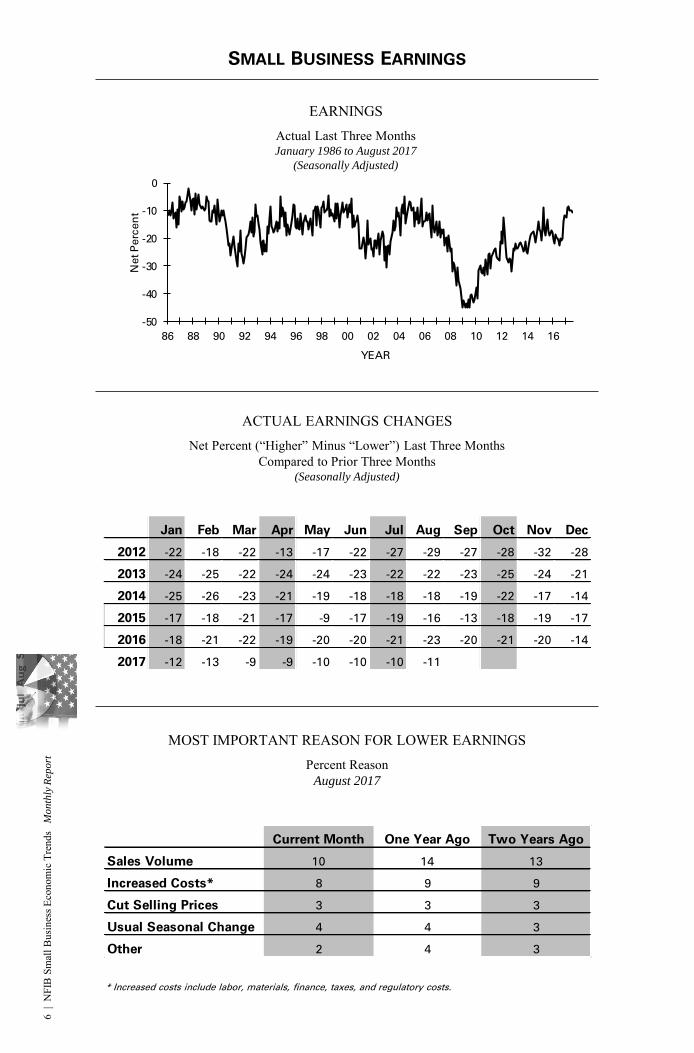
SMALL BUSINESS EARNINGS
EARNINGSActual Last Three MonthsJanuary 1986 to August 2017
(Seasonally Adjusted)
ACTUAL EARNINGS CHANGESNet Percent (“Higher” Minus “Lower”) Last Three Months
Compared to Prior Three Months (Seasonally Adjusted)
MOST IMPORTANT REASON FOR LOWER EARNINGSPercent Reason
August 2017
Current Month One Year Ago Two Years Ago
Sales Volume 10 14 13
Increased Costs* 8 9 9
Cut Selling Prices 3 3 3
Usual Seasonal Change 4 4 3
Other 2 4 3
Jan Feb Mar Apr May Jun Jul Aug Sep Oct Nov Dec
2012 -22 -18 -22 -13 -17 -22 -27 -29 -27 -28 -32 -28
2013 -24 -25 -22 -24 -24 -23 -22 -22 -23 -25 -24 -21
2014 -25 -26 -23 -21 -19 -18 -18 -18 -19 -22 -17 -14
2015 -17 -18 -21 -17 -9 -17 -19 -16 -13 -18 -19 -17
2016 -18 -21 -22 -19 -20 -20 -21 -23 -20 -21 -20 -14
2017 -12 -13 -9 -9 -10 -10 -10 -11
* Increased costs include labor, materials, finance, taxes, and regulatory costs.
-50
-40
-30
-20
-10
0
86 88 90 92 94 96 98 00 02 04 06 08 10 12 14 16
Net P
erc
en
t
YEAR
6 |
NFI
B S
mal
l Bus
ines
s Eco
nom
ic T
rend
s M
on
thly
Rep
ort
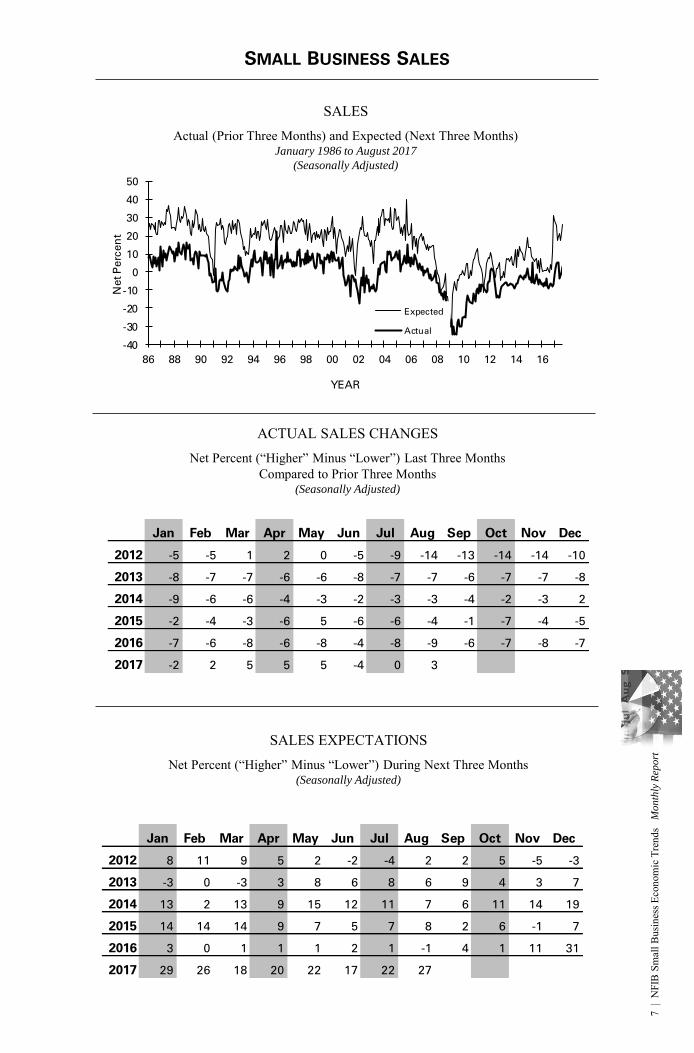
SMALL BUSINESS SALES
SALES EXPECTATIONSNet Percent (“Higher” Minus “Lower”) During Next Three Months
(Seasonally Adjusted)
ACTUAL SALES CHANGESNet Percent (“Higher” Minus “Lower”) Last Three Months
Compared to Prior Three Months(Seasonally Adjusted)
SALESActual (Prior Three Months) and Expected (Next Three Months)
January 1986 to August 2017
(Seasonally Adjusted)
Jan Feb Mar Apr May Jun Jul Aug Sep Oct Nov Dec
2012 -5 -5 1 2 0 -5 -9 -14 -13 -14 -14 -10
2013 -8 -7 -7 -6 -6 -8 -7 -7 -6 -7 -7 -8
2014 -9 -6 -6 -4 -3 -2 -3 -3 -4 -2 -3 2
2015 -2 -4 -3 -6 5 -6 -6 -4 -1 -7 -4 -5
2016 -7 -6 -8 -6 -8 -4 -8 -9 -6 -7 -8 -7
2017 -2 2 5 5 5 -4 0 3
Jan Feb Mar Apr May Jun Jul Aug Sep Oct Nov Dec
2012 8 11 9 5 2 -2 -4 2 2 5 -5 -3
2013 -3 0 -3 3 8 6 8 6 9 4 3 7
2014 13 2 13 9 15 12 11 7 6 11 14 19
2015 14 14 14 9 7 5 7 8 2 6 -1 7
2016 3 0 1 1 1 2 1 -1 4 1 11 31
2017 29 26 18 20 22 17 22 27
-40
-30
-20
-10
0
10
20
30
40
50
86 88 90 92 94 96 98 00 02 04 06 08 10 12 14 16
Expected
Actual
Net P
erc
en
t
YEAR
7 |
NFI
B S
mal
l Bus
ines
s Eco
nom
ic T
rend
s M
on
thly
Rep
ort
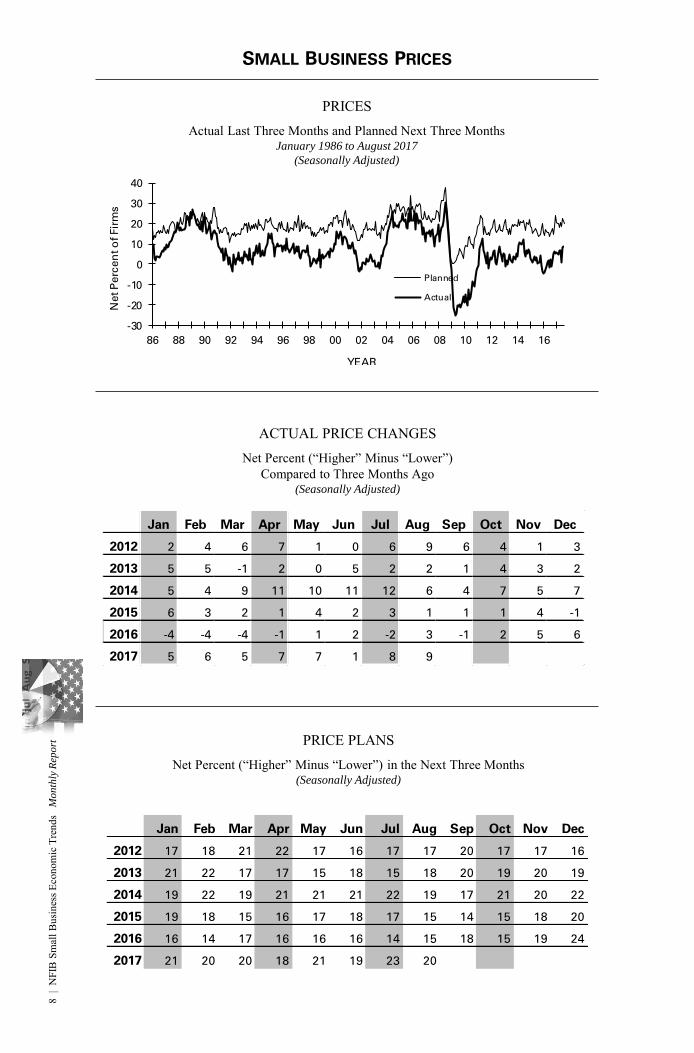
SMALL BUSINESS PRICES
PRICE PLANSNet Percent (“Higher” Minus “Lower”) in the Next Three Months
(Seasonally Adjusted)
ACTUAL PRICE CHANGESNet Percent (“Higher” Minus “Lower”)
Compared to Three Months Ago(Seasonally Adjusted)
PRICESActual Last Three Months and Planned Next Three Months
January 1986 to August 2017
(Seasonally Adjusted)
Jan Feb Mar Apr May Jun Jul Aug Sep Oct Nov Dec
2012 2 4 6 7 1 0 6 9 6 4 1 3
2013 5 5 -1 2 0 5 2 2 1 4 3 2
2014 5 4 9 11 10 11 12 6 4 7 5 7
2015 6 3 2 1 4 2 3 1 1 1 4 -1
2016 -4 -4 -4 -1 1 2 -2 3 -1 2 5 6
2017 5 6 5 7 7 1 8 9
Jan Feb Mar Apr May Jun Jul Aug Sep Oct Nov Dec
2012 17 18 21 22 17 16 17 17 20 17 17 16
2013 21 22 17 17 15 18 15 18 20 19 20 19
2014 19 22 19 21 21 21 22 19 17 21 20 22
2015 19 18 15 16 17 18 17 15 14 15 18 20
2016 16 14 17 16 16 16 14 15 18 15 19 24
2017 21 20 20 18 21 19 23 20
-30
-20
-10
0
10
20
30
40
86 88 90 92 94 96 98 00 02 04 06 08 10 12 14 16
Planned
Actual
Net P
erc
en
t o
f Fir
ms
YEAR
8 |
NFI
B S
mal
l Bus
ines
s Eco
nom
ic T
rend
s M
on
thly
Rep
ort
SMALL BUSINESS EMPLOYMENT
Jan Feb Mar Apr May Jun Jul Aug Sep Oct Nov Dec
2012 0 -3 0 0 -3 -1 -1 -2 -3 -1 -2 -4
2013 2 -3 1 2 -1 1 -3 0 0 1 1 2
2014 2 2 2 2 1 1 1 0 3 1 1 7
2015 5 4 2 2 4 0 0 6 5 0 0 -1
2016 1 -3 0 -1 -1 -2 -2 -3 3 0 -2 4
2017 3 4 2 4 5 -1 2 2
ACTUAL EMPLOYMENT CHANGESNet Percent (“Increase” Minus “Decrease”) in the Last Three Months
(Seasonally Adjusted)
QUALIFIED APPLICANTS FOR JOB OPENINGSPercent Few or No Qualified Applicants
EMPLOYMENTPlanned Next Three Months and Current Job Openings
January 1986 to August 2017
(Seasonally Adjusted)
-10
0
10
20
30
40
86 88 90 92 94 96 98 00 02 04 06 08 10 12 14 16
Planned
Job Openings
YEAR
Perc
en
t
Jan Feb Mar Apr May Jun Jul Aug Sep Oct Nov Dec
2012 31 31 32 34 37 33 38 37 41 38 36 33
2013 34 34 36 38 38 41 40 42 41 40 44 38
2014 38 40 41 41 46 43 42 46 42 45 45 43
2015 42 47 42 44 47 44 48 48 45 48 47 48
2016 45 42 41 46 48 48 46 48 48 48 52 44
2017 47 44 45 48 51 46 52 529
| N
FIB
Sm
all B
usin
ess E
cono
mic
Tre
nds
Mo
nth
ly R
epo
rt
SMALL BUSINESS EMPLOYMENT (CONTINUED)
JOB OPENINGSPercent With Positions Not Able to Fill Right Now
(Seasonally Adjusted)
HIRING PLANSNet Percent (“Increase” Minus “Decrease”) in the Next Three Months
(Seasonally Adjusted)
Jan Feb Mar Apr May Jun Jul Aug Sep Oct Nov Dec
2012 4 4 2 5 7 3 5 8 4 4 5 1
2013 2 4 2 6 6 7 9 8 9 5 9 8
2014 11 7 7 8 11 12 13 8 9 10 11 15
2015 13 12 12 11 13 9 12 11 12 11 11 15
2016 11 10 9 11 12 11 12 9 10 10 15 16
2017 18 15 16 16 18 15 19 18
SMALL BUSINESS COMPENSATION
COMPENSATIONActual Last Three Months and Planned Next Three Months
January 1986 to August 2017
(Seasonally Adjusted)
-5
0
5
10
15
20
25
30
35
40
86 88 90 92 94 96 98 00 02 04 06 08 10 12 14 16
Net P
erc
en
t
YEAR
Planned
Actual
Jan Feb Mar Apr May Jun Jul Aug Sep Oct Nov Dec
2012 18 17 15 17 20 15 15 17 17 16 18 16
2013 18 21 18 18 19 19 20 18 20 21 24 23
2014 22 22 22 24 24 26 24 25 21 24 25 25
2015 26 29 24 27 29 24 25 28 27 27 28 28
2016 29 28 25 29 27 29 26 30 24 28 31 29
2017 31 32 30 33 34 30 35 31
10 |
NFI
B S
mal
l Bus
ines
s Eco
nom
ic T
rend
s M
on
thly
Rep
ort
SMALL BUSINESS COMPENSATION (CONTINUED)
ACTUAL COMPENSATION CHANGESNet Percent (“Increase” Minus “Decrease”) During Last Three Months
(Seasonally Adjusted)
Jan Feb Mar Apr May Jun Jul Aug Sep Oct Nov Dec
2012 12 14 14 14 16 13 12 13 14 12 8 12
2013 13 14 16 15 16 14 14 15 17 17 15 18
2014 19 19 23 20 20 21 21 22 18 20 22 24
2015 25 20 22 23 25 21 23 23 23 22 24 22
2016 27 22 22 24 26 22 24 24 22 25 21 26
2017 30 26 28 26 28 24 27 28
Jan Feb Mar Apr May Jun Jul Aug Sep Oct Nov Dec
2012 7 12 9 9 9 8 8 9 10 9 3 6
2013 8 8 9 9 9 7 11 11 13 10 13 14
2014 12 14 14 14 15 14 14 14 15 13 14 18
2015 13 14 13 14 14 12 15 12 16 17 19 21
2016 15 12 16 15 15 14 15 14 14 19 15 20
2017 18 17 18 18 18 18 16 15
COMPENSATION PLANSNet Percent (“Increase” Minus “Decrease”) in the Next Three Months
(Seasonally Adjusted)
PRICES AND LABOR COMPENSATIONNet Percent Price Increase and Net Percent Compensation
(Seasonally Adjusted)
-30
-20
-10
0
10
20
30
40
86 88 90 92 94 96 98 00 02 04 06 08 10 12 14 16
Net P
erc
en
t o
f Fir
ms
Actual Prices
Actual Compensation
YEAR
11 |
NFI
B S
mal
l Bus
ines
s Eco
nom
ic T
rend
s M
on
thly
Rep
ort
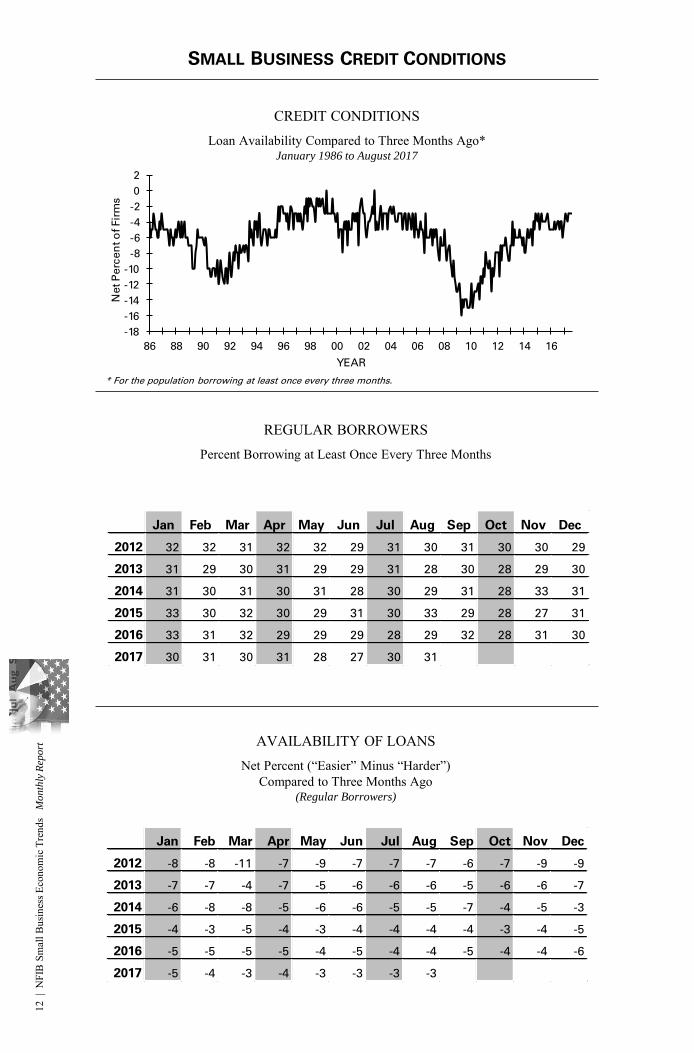
SMALL BUSINESS CREDIT CONDITIONS
CREDIT CONDITIONSLoan Availability Compared to Three Months Ago*
January 1986 to August 2017
* For the population borrowing at least once every three months.
REGULAR BORROWERSPercent Borrowing at Least Once Every Three Months
Jan Feb Mar Apr May Jun Jul Aug Sep Oct Nov Dec
2012 32 32 31 32 32 29 31 30 31 30 30 29
2013 31 29 30 31 29 29 31 28 30 28 29 30
2014 31 30 31 30 31 28 30 29 31 28 33 31
2015 33 30 32 30 29 31 30 33 29 28 27 31
2016 33 31 32 29 29 29 28 29 32 28 31 30
2017 30 31 30 31 28 27 30 31
AVAILABILITY OF LOANSNet Percent (“Easier” Minus “Harder”)
Compared to Three Months Ago(Regular Borrowers)
Jan Feb Mar Apr May Jun Jul Aug Sep Oct Nov Dec
2012 -8 -8 -11 -7 -9 -7 -7 -7 -6 -7 -9 -9
2013 -7 -7 -4 -7 -5 -6 -6 -6 -5 -6 -6 -7
2014 -6 -8 -8 -5 -6 -6 -5 -5 -7 -4 -5 -3
2015 -4 -3 -5 -4 -3 -4 -4 -4 -4 -3 -4 -5
2016 -5 -5 -5 -5 -4 -5 -4 -4 -5 -4 -4 -6
2017 -5 -4 -3 -4 -3 -3 -3 -3
-18
-16
-14
-12
-10
-8
-6
-4
-2
0
2
86 88 90 92 94 96 98 00 02 04 06 08 10 12 14 16
Net P
erc
en
t o
f Fir
ms
YEAR
12 |
NFI
B S
mal
l Bus
ines
s Eco
nom
ic T
rend
s M
on
thly
Rep
ort
SMALL BUSINESS CREDIT CONDITIONS (CONTINUED)
BORROWING NEEDS SATISFIEDPercent of All Businesses Last Three Months Satisfied/
Percent of All Businesses Last Three Months Not Satisfied(All Borrowers)
Jan Feb Mar Apr May Jun Jul Aug Sep Oct Nov Dec
2012 -9 -10 -11 -8 -10 -8 -7 -9 -7 -8 -10 -11
2013 -9 -8 -6 -8 -6 -7 -8 -8 -7 -8 -7 -7
2014 -7 -7 -7 -6 -7 -7 -5 -5 -7 -5 -6 -5
2015 -5 -4 -6 -4 -4 -4 -5 -7 -6 -5 -4 -6
2016 -7 -7 -6 -6 -6 -6 -5 -5 -7 -6 -5 -6
2017 -3 -3 -3 -4 -4 -3 -4 -3
EXPECTED CREDIT CONDITIONSNet Percent (“Easier” Minus “Harder”) During Next Three Months
(Regular Borrowers)
INTEREST RATESRelative Rates and Actual Rates Last Three Months
January 1986 to August 2017
-40
-20
0
20
40
5
7
9
11
13
86 88 90 92 94 96 98 00 02 04 06 08 10 12 14 16
YEAR
Avg
. Sh
ort
-term
Rate
(th
ick li
ne)
Rate
Rela
tive (
thin
lin
e)
Jan Feb Mar Apr May Jun Jul Aug Sep Oct Nov Dec
2012 30/7 31/7 27/8 31/8 29/9 29/7 30/7 31/7 32/8 28/8 28/6 29/6
2013 31/6 29/7 29/7 31/6 28/5 29/5 30/5 31/5 28/6 28/6 32/4 32/4
2014 31/5 29/5 30/5 30/5 30/5 27/6 30/6 28/4 28/6 29/4 29/4 32/4
2015 32/4 33/3 35/5 31/4 30/4 32/5 32/4 33/3 30/2 30/3 32/3 32/4
2016 35/3 31/4 31/5 31/4 31/4 32/5 30/3 29/4 32/6 29/4 30/4 29/4
2017 31/4 30/3 32/4 32/3 31/3 27/4 31/3 34/3
13 |
NFI
B S
mal
l Bus
ines
s Eco
nom
ic T
rend
s M
on
thly
Rep
ort
SMALL BUSINESS CREDIT CONDITIONS (CONTINUED)
Jan Feb Mar Apr May Jun Jul Aug Sep Oct Nov Dec
2012 0 0 0 -1 0 -2 -2 -2 1 0 1 -1
2013 -1 0 0 0 0 0 2 3 4 2 2 3
2014 4 3 2 2 2 2 1 2 3 0 0 -1
2015 2 0 1 1 1 2 1 2 -1 2 0 2
2016 7 6 6 4 4 4 2 2 3 1 2 4
2017 11 9 9 11 11 8 11 8
RELATIVE INTEREST RATE PAID BY REGULAR BORROWERS
Net Percent (“Higher” Minus “Lower”) Compared to Three Months Ago
Borrowing at Least Once Every Three Months.
ACTUAL INTEREST RATE PAID ON SHORT-TERM LOANS BY BORROWERS
Average Interest Rate Paid
SMALL BUSINESS INVENTORIES
INVENTORIESActual (Last Three Months) and Planned (Next Three Months)
January 1986 to August 2017
(Seasonally Adjusted)
-30
-25
-20
-15
-10
-5
0
5
10
15
86 88 90 92 94 96 98 00 02 04 06 08 10 12 14 16
Actual
Planned
Net P
erc
en
t
YEAR
Jan Feb Mar Apr May Jun Jul Aug Sep Oct Nov Dec
2012 6.0 5.8 5.7 5.7 5.5 6.3 5.7 5.7 5.7 5.8 5.7 5.6
2013 5.5 5.3 5.4 5.6 5.7 5.2 5.6 5.4 5.8 5.4 5.4 5.6
2014 5.6 5.4 5.3 5.4 5.7 5.7 5.4 5.3 5.4 5.5 5.6 5.1
2015 5.3 5.1 5.7 5.0 4.8 5.0 5.2 5.4 4.8 5.1 4.7 5.0
2016 5.4 5.3 5.2 5.7 5.3 5.7 5.3 5.2 6.2 5.2 5.6 5.5
2017 5.7 5.4 5.4 5.4 5.9 5.6 5.9 5.5
14 |
NFI
B S
mal
l Bus
ines
s Eco
nom
ic T
rend
s M
on
thly
Rep
ort
SMALL BUSINESS INVENTORIES (CONTINUED)
ACTUAL INVENTORY CHANGESNet Percent (“Increase” Minus “Decrease”) During Last Three Months
(Seasonally Adjusted)
INVENTORY SATISFACTIONNet Percent (“Too Low” Minus “Too Large”) at Present Time
(Seasonally Adjusted)
INVENTORY PLANSNet Percent (“Increase” Minus “Decrease”) in the Next Three to Six Months
(Seasonally Adjusted)
Jan Feb Mar Apr May Jun Jul Aug Sep Oct Nov Dec
2012 -2 3 0 -1 1 1 -1 0 -1 -1 -6 -4
2013 -6 -1 -5 -1 2 -1 -1 -1 -2 -1 -1 -2
2014 -2 -5 1 2 0 -1 0 2 2 3 1 6
2015 3 5 1 3 3 -4 0 2 3 0 -1 1
2016 -1 -1 -2 0 -1 -3 0 1 -7 2 4 4
2017 2 3 2 3 1 4 5 2
Jan Feb Mar Apr May Jun Jul Aug Sep Oct Nov Dec
2012 -7 -1 -10 -8 -7 -7 -9 -8 -8 -8 -11 -9
2013 -7 -10 -7 -6 -6 -7 -9 -6 -7 -6 -8 -3
2014 -4 -3 -7 -6 -3 -4 -2 -3 -7 -1 1 1
2015 2 1 -5 -1 -4 0 2 -2 0 -2 -4 0
2016 -2 -3 -3 -5 -6 -6 -5 0 -4 -3 -3 3
2017 3 1 0 -1 -1 -3 1 1
Jan Feb Mar Apr May Jun Jul Aug Sep Oct Nov Dec
2012 1 2 2 -1 -1 0 0 0 -1 0 -1 2
2013 -1 1 -3 -3 1 -2 -1 0 0 -5 -3 -4
2014 -2 -5 -2 -2 -3 -2 -3 -2 0 -3 -2 -2
2015 -1 -3 -7 -2 -1 -4 -6 -6 -5 -4 -5 -4
2016 -2 -2 -5 -5 -4 -4 -4 -2 -7 -4 -4 -3
2017 -5 -2 -5 -3 -6 -3 -2 -515
| N
FIB
Sm
all B
usin
ess E
cono
mic
Tre
nds
Mo
nth
ly R
epo
rt
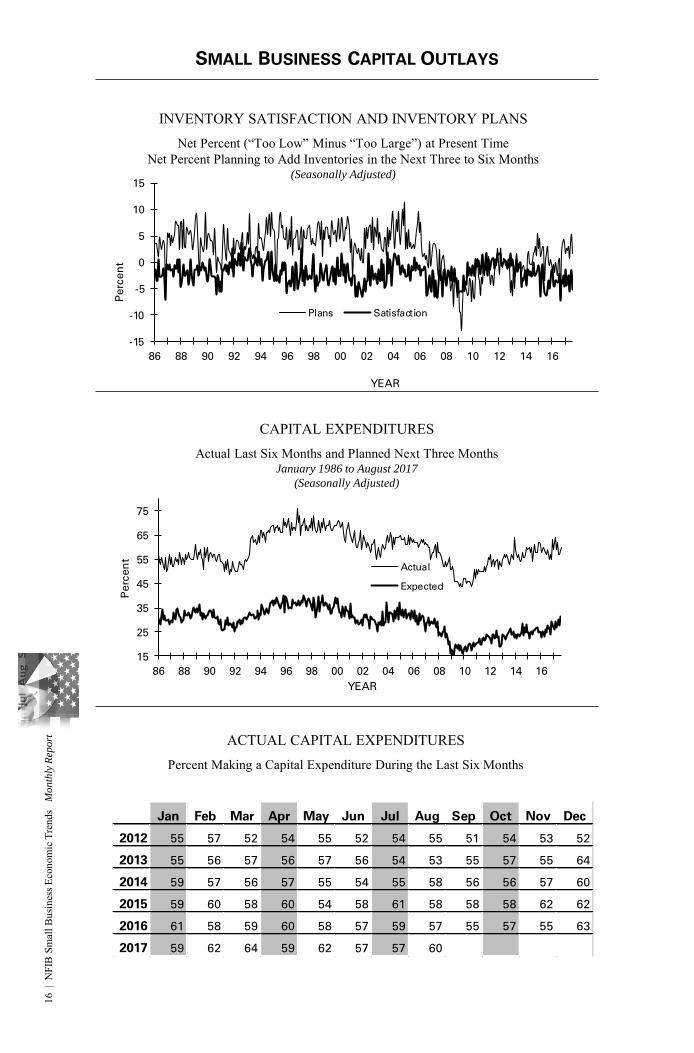
SMALL BUSINESS CAPITAL OUTLAYS
CAPITAL EXPENDITURESActual Last Six Months and Planned Next Three Months
January 1986 to August 2017
(Seasonally Adjusted)
ACTUAL CAPITAL EXPENDITURESPercent Making a Capital Expenditure During the Last Six Months
INVENTORY SATISFACTION AND INVENTORY PLANSNet Percent (“Too Low” Minus “Too Large”) at Present Time
Net Percent Planning to Add Inventories in the Next Three to Six Months(Seasonally Adjusted)
-15
-10
-5
0
5
10
15
86 88 90 92 94 96 98 00 02 04 06 08 10 12 14 16
Plans Satisfaction
Perc
en
t
YEAR
15
25
35
45
55
65
75
86 88 90 92 94 96 98 00 02 04 06 08 10 12 14 16
Perc
en
t
YEAR
Actual
Expected
Jan Feb Mar Apr May Jun Jul Aug Sep Oct Nov Dec
2012 55 57 52 54 55 52 54 55 51 54 53 52
2013 55 56 57 56 57 56 54 53 55 57 55 64
2014 59 57 56 57 55 54 55 58 56 56 57 60
2015 59 60 58 60 54 58 61 58 58 58 62 62
2016 61 58 59 60 58 57 59 57 55 57 55 63
2017 59 62 64 59 62 57 57 60
16 |
NFI
B S
mal
l Bus
ines
s Eco
nom
ic T
rend
s M
on
thly
Rep
ort
SMALL BUSINESS CAPITAL OUTLAYS (CONTINUED)
AMOUNT OF CAPITAL EXPENDITURES MADEPercent Distribution of Per Firm Expenditures
During the Last Six Months
Amount Current One Year Ago Two Years Ago
$1 to $999 2 4 3
$1,000 to $4,999 7 7 7
$5,000 to $9,999 6 4 7
$10,000 to $49,999 22 18 16
$50,000 to $99,999 8 9 10
$100,000 + 14 13 13
No Answer 1 2 2
CAPITAL EXPENDITURE PLANSPercent Planning a Capital Expenditure During Next Three to Six Months
(Seasonally Adjusted)
Jan Feb Mar Apr May Jun Jul Aug Sep Oct Nov Dec
2012 23 22 20 24 24 22 23 26 23 23 19 19
2013 20 24 23 22 23 24 25 26 27 24 24 25
2014 23 24 22 24 24 23 25 29 24 27 25 28
2015 25 25 22 25 25 24 26 26 27 27 25 25
2016 25 23 25 25 23 26 25 28 27 27 24 29
2017 27 26 29 27 28 30 28 32
TYPE OF CAPITAL EXPENDITURES MADEPercent Purchasing or Leasing During Last Six Months
Type Current One Year Ago Two Years Ago
Vehicles 24 22 22
Equipment 42 42 43
Furniture or Fixtures 9 12 13
Add. Bldgs. or Land 7 5 7
Improved Bldgs. or Land 16 16 14
17 |
NFI
B S
mal
l Bus
ines
s Eco
nom
ic T
rend
s M
on
thly
Rep
ort
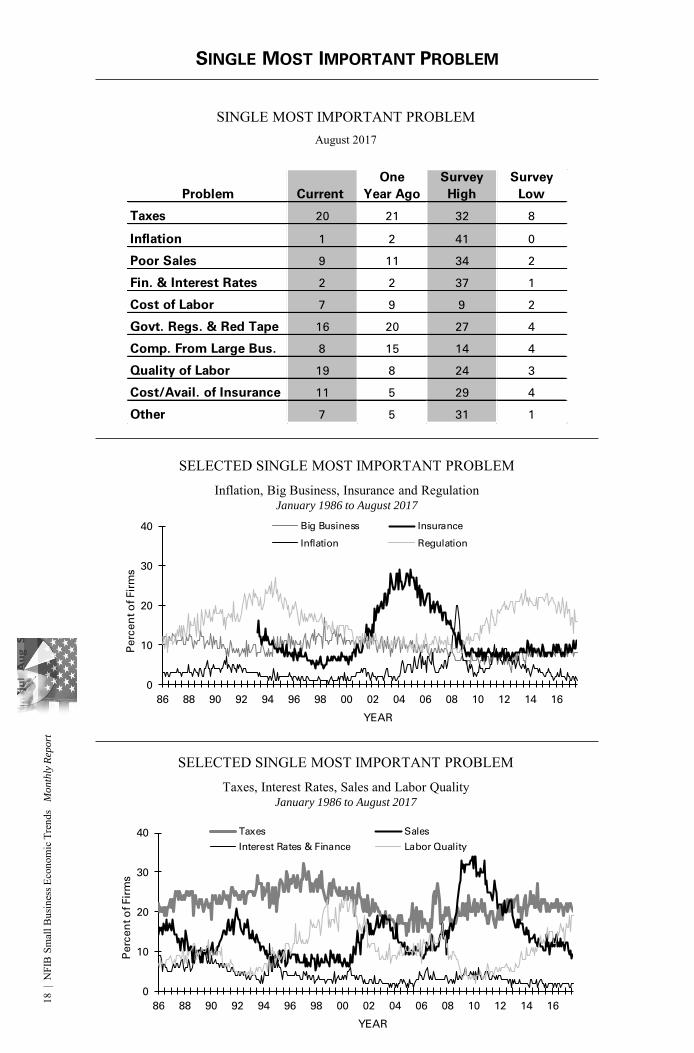
SINGLE MOST IMPORTANT PROBLEM
SINGLE MOST IMPORTANT PROBLEMAugust 2017
Problem Current
One
Year Ago
Survey
High
Survey
Low
Taxes 20 21 32 8
Inflation 1 2 41 0
Poor Sales 9 11 34 2
Fin. & Interest Rates 2 2 37 1
Cost of Labor 7 9 9 2
Govt. Regs. & Red Tape 16 20 27 4
Comp. From Large Bus. 8 15 14 4
Quality of Labor 19 8 24 3
Cost/Avail. of Insurance 11 5 29 4
Other 7 5 31 1
SELECTED SINGLE MOST IMPORTANT PROBLEMInflation, Big Business, Insurance and Regulation
January 1986 to August 2017
0
10
20
30
40
86 88 90 92 94 96 98 00 02 04 06 08 10 12 14 16
Big Business Insurance
Inflation Regulation
Perc
en
t o
f Fir
ms
YEAR
SELECTED SINGLE MOST IMPORTANT PROBLEMTaxes, Interest Rates, Sales and Labor Quality
January 1986 to August 2017
0
10
20
30
40
86 88 90 92 94 96 98 00 02 04 06 08 10 12 14 16
Taxes Sales
Interest Rates & Finance Labor Quality
Perc
en
t o
f Fir
ms
YEAR
18 |
NFI
B S
mal
l Bus
ines
s Eco
nom
ic T
rend
s M
on
thly
Rep
ort
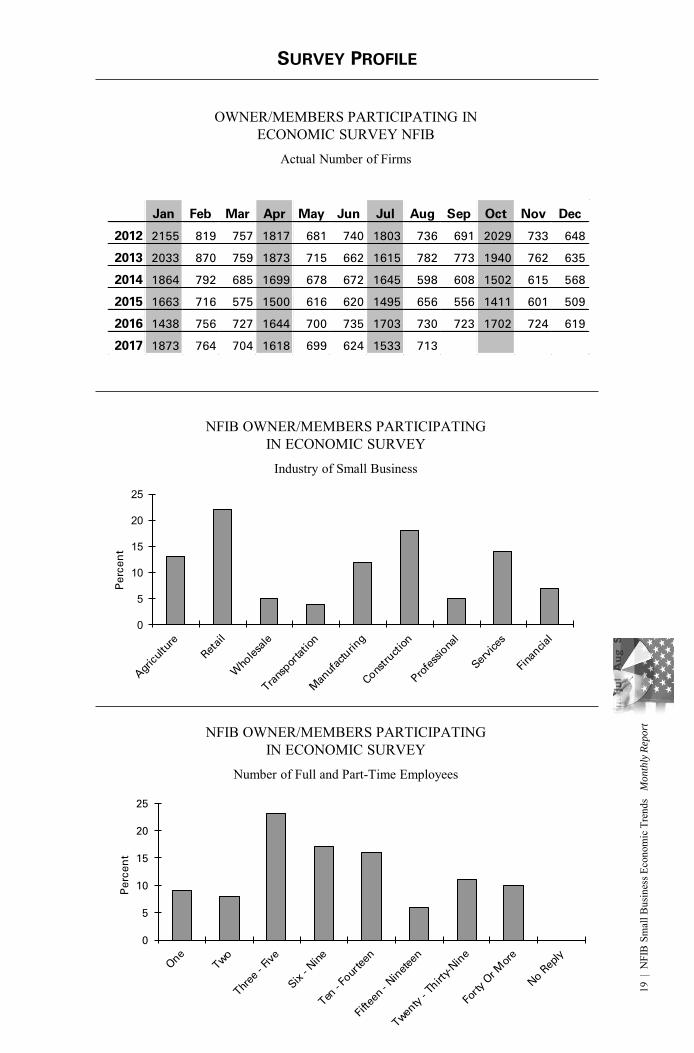
SURVEY PROFILE
OWNER/MEMBERS PARTICIPATING IN ECONOMIC SURVEY NFIB
Actual Number of Firms
NFIB OWNER/MEMBERS PARTICIPATING IN ECONOMIC SURVEY
Industry of Small Business
Jan Feb Mar Apr May Jun Jul Aug Sep Oct Nov Dec
2012 2155 819 757 1817 681 740 1803 736 691 2029 733 648
2013 2033 870 759 1873 715 662 1615 782 773 1940 762 635
2014 1864 792 685 1699 678 672 1645 598 608 1502 615 568
2015 1663 716 575 1500 616 620 1495 656 556 1411 601 509
2016 1438 756 727 1644 700 735 1703 730 723 1702 724 619
2017 1873 764 704 1618 699 624 1533 713
NFIB OWNER/MEMBERS PARTICIPATING IN ECONOMIC SURVEY
Number of Full and Part-Time Employees
0
5
10
15
20
25
Perc
en
t
0
5
10
15
20
25
Perc
en
t
19 |
NFI
B S
mal
l Bus
ines
s Eco
nom
ic T
rend
s M
on
thly
Rep
ort
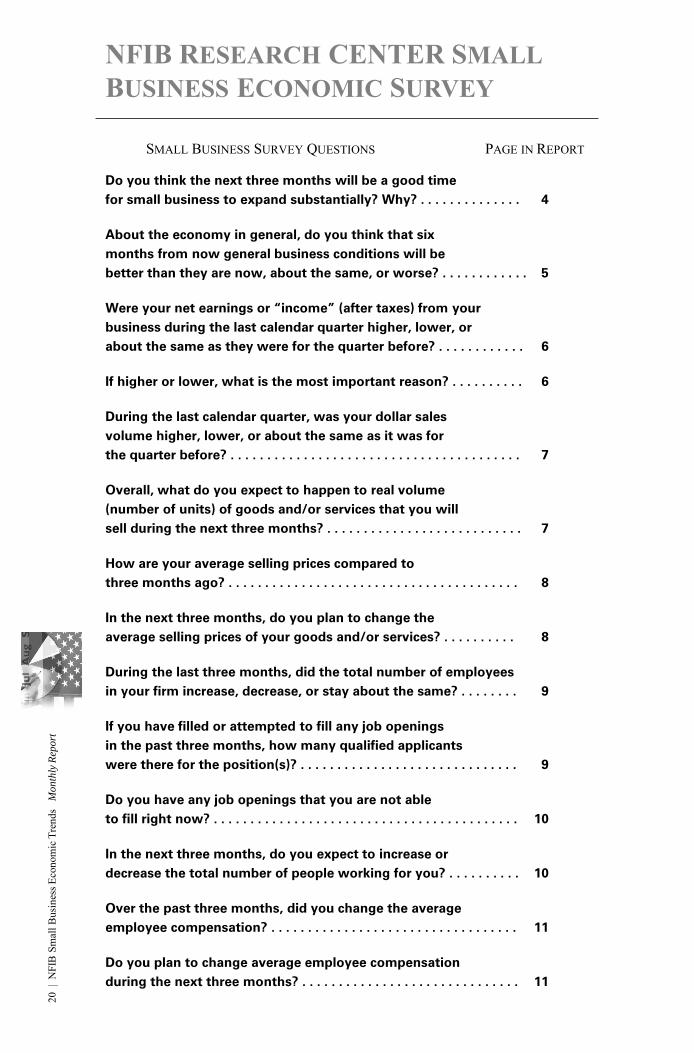
NFIB RESEARCH CENTER SMALL
BUSINESS ECONOMIC SURVEY
SMALL BUSINESS SURVEY QUESTIONS PAGE IN REPORT
Do you think the next three months will be a good time
for small business to expand substantially? Why? . . . . . . . . . . . . . . 4
About the economy in general, do you think that six
months from now general business conditions will be
better than they are now, about the same, or worse? . . . . . . . . . . . . 5
Were your net earnings or “income” (after taxes) from your
business during the last calendar quarter higher, lower, or
about the same as they were for the quarter before? . . . . . . . . . . . . 6
If higher or lower, what is the most important reason? . . . . . . . . . . 6
During the last calendar quarter, was your dollar sales
volume higher, lower, or about the same as it was for
the quarter before? . . . . . . . . . . . . . . . . . . . . . . . . . . . . . . . . . . . . . . . . 7
Overall, what do you expect to happen to real volume
(number of units) of goods and/or services that you will
sell during the next three months? . . . . . . . . . . . . . . . . . . . . . . . . . . . 7
How are your average selling prices compared to
three months ago? . . . . . . . . . . . . . . . . . . . . . . . . . . . . . . . . . . . . . . . . 8
In the next three months, do you plan to change the
average selling prices of your goods and/or services? . . . . . . . . . . 8
During the last three months, did the total number of employees
in your firm increase, decrease, or stay about the same? . . . . . . . . 9
If you have filled or attempted to fill any job openings
in the past three months, how many qualified applicants
were there for the position(s)? . . . . . . . . . . . . . . . . . . . . . . . . . . . . . . 9
Do you have any job openings that you are not able
to fill right now? . . . . . . . . . . . . . . . . . . . . . . . . . . . . . . . . . . . . . . . . . . 10
In the next three months, do you expect to increase or
decrease the total number of people working for you? . . . . . . . . . . 10
Over the past three months, did you change the average
employee compensation? . . . . . . . . . . . . . . . . . . . . . . . . . . . . . . . . . . 11
Do you plan to change average employee compensation
during the next three months? . . . . . . . . . . . . . . . . . . . . . . . . . . . . . . 11
20 |
NFI
B S
mal
l Bus
ines
s Eco
nom
ic T
rend
s M
on
thly
Rep
ort
SMALL BUSINESS SURVEY QUESTIONS PAGE IN REPORT
Are…loans easier or harder to get than they were
three months ago? . . . . . . . . . . . . . . . . . . . . . . . . . . . . . . . . . . . . . . . 12
During the last three months, was your firm able to
satisfy its borrowing needs? . . . . . . . . . . . . . . . . . . . . . . . . . . . . . . . 13
Do you expect to find it easier or harder to obtain your
required financing during the next three months? . . . . . . . . . . . . . 13
If you borrow money regularly (at least once every three
months) as part of your business activity, how does the
rate of interest payable on your most recent loan compare
with that paid three months ago? . . . . . . . . . . . . . . . . . . . . . . . . . . . 14
If you borrowed within the last three months for business
purposes, and the loan maturity (pay back period) was 1
year or less, what interest rate did you pay? . . . . . . . . . . . . . . . . . . 14
During the last three months, did you increase or decrease
your inventories? . . . . . . . . . . . . . . . . . . . . . . . . . . . . . . . . . . . . . . . . . 15
At the present time, do you feel your inventories are too
large, about right, or inadequate? . . . . . . . . . . . . . . . . . . . . . . . . . . 15
Looking ahead to the next three months to six months,
do you expect, on balance, to add to your inventories,
keep them about the same, or decrease them? . . . . . . . . . . . . . . . 15
During the last six months, has your firm made any capital
expenditures to improve or purchase equipment, buildings,
or land? . . . . . . . . . . . . . . . . . . . . . . . . . . . . . . . . . . . . . . . . . . . . . . . 16
If [your firm made any capital expenditures], what was
the total cost of all these projects? . . . . . . . . . . . . . . . . . . . . . . . . 17
Looking ahead to the next three to six months, do you
expect to make any capital expenditures for plant
and/or physical equipment? . . . . . . . . . . . . . . . . . . . . . . . . . . . . . . 17
What is the single most important problem facing your
business today? . . . . . . . . . . . . . . . . . . . . . . . . . . . . . . . . . . . . . . . . 18
Please classify your major business activity, using one
of the categories of example below . . . . . . . . . . . . . . . . . . . . . . . . 19
How many employees do you have full and part-time,
including yourself? . . . . . . . . . . . . . . . . . . . . . . . . . . . . . . . . . . . . . 19
21 |
NFI
B S
mal
l Bus
ines
s Eco
nom
ic T
rend
s M
on
thly
Rep
ort
Top Related