


Languages
Pages
Legal


REGIME MAP DEVELOPMENT FOR CO-ROTATING TWIN
SCREW GRANULATION
by
WEI-DA TU
A thesis submitted to The University of Birmingham for the
degree of MASTER OF PHILOSOPHY
Department of Chemical Engineering School of Engineering
The University of Birmingham May 2009

University of Birmingham Research Archive
e-theses repository This unpublished thesis/dissertation is copyright of the author and/or third parties. The intellectual property rights of the author or third parties in respect of this work are as defined by The Copyright Designs and Patents Act 1988 or as modified by any successor legislation. Any use made of information contained in this thesis/dissertation must be in accordance with that legislation and must be properly acknowledged. Further distribution or reproduction in any format is prohibited without the permission of the copyright holder.
Abstract
Continuous granulation is an important process for the future PAT (Processes
analytical technology) initiative for the FDA. Therefore it is important to investigate the
relationship between operating conditions and the granules. This thesis focused on one of
the main equipments – twin screw extruder and attempted to develop the regime maps and
the granulation hypothesis for twin screw granulation. In order to compare the mechanism
with high-shear granulation that has been studied [1], the same materials were chosen
(MCC (Microcrystalline cellulose) 102 and aqueous Polyethylene Glycol (PEG) 6000) and
the regime maps were plotted by following similar operating conditions with reference [1].
One regime (granulation behaviour) was recognised for the short mixing geometry (16 mm,
30°), while three regimes (granulation, extrudates and blocked behaviours) were recognised
for the long mixing geometry (64 mm, 30°). The regime maps suggested that the optimal
granulation (narrow GSD (granule size distribution) and large mean granule size) can be
achieved with a higher LS (Liquid-to-solid) ratio and a higher screw speed. The GSD was
found further improved by reprocessing the same granules and/or manufacturing with
aggressive mixing conditions.
Keywords: twin screw extruder, granulation, high shear granulation, regime map,
granule size distribution, GSD

Acknowledgements
I would like to express the great thank to my supervisor – Professor Jonathan Seville
for your supervision and encouragement. Maybe you don’t know that accepting me as your
student two years ago, your decision has dramatically and positively changed my life and
the way I see the world! Just like being upgraded on the flight to Puerto Rico, I truly thank
you again for upgrading me from inside out! Also, I am so grateful to work with Dr. Andy
Ingram. Your delightful supervision (and your great patience as well) does improve my
work a lot in every aspect. Except for working, you are more like a full time mentor to me
than a co-advisor. It is indeed my great pleasure to work and learn from you! I also want to
thank all the colleagues from particle technology group as well as the friends in office 106
and this Department. Thank you for sharing your insights and I will never forget the
wonderful time we had! Finally I want to thank my family and my girl friend Pi-Mei for
your endless supports. I am proud that you are proud of me.

Content
CHAPTER ONE Introduction .......................................................................................... 1 1.1 Definition of agglomeration/granulation .......................................................... 1 1.2 Application ....................................................................................................... 1 1.3 Classification of size enlargement processes ................................................... 3
1.3.1 Growth/tumble agglomeration ............................................................. 4 1.3.2 Coating/Layering .................................................................................. 4 1.3.3 Agglomeration using pressure .............................................................. 4 1.3.4 Thermal effects ..................................................................................... 5 1.3.5 Drop formation ..................................................................................... 5
CHAPTER TWO Theories and mechanisms .................................................................... 6 2.1 Granulation processes (wet granulation) .......................................................... 6
2.1.1 Overview .............................................................................................. 6 2.1.2 Macroscopic point of view ................................................................. 11 2.1.3 Microscopic point of view .................................................................. 15
2.2 Agglomeration equipments ............................................................................ 19 2.2.1 Batch-wise equipments ...................................................................... 19 2.2.2 Semi-continuous equipments ............................................................. 22 2.2.3 Continuous equipments ...................................................................... 22 2.2.4 Motives of the thesis .......................................................................... 26
CHAPTER THREE Methodology ...................................................................................... 33 3.1 Equipment ...................................................................................................... 33
3.1.1 Co-rotating twin screw extruder ......................................................... 33 3.1.2 Basic measurements ........................................................................... 37
3.2 Materials ......................................................................................................... 40 3.3 Experimental processes .................................................................................. 42
CHAPTER FOUR Results and discussion ........................................................................ 45 4.1 GSD and the growth regime map ................................................................... 45 4.2 Further analysis of the GSD ........................................................................... 48 4.3 The effects of screw speed, LS ratio and binder viscosity on torque ............. 49 4.4 Improving the GSD ........................................................................................ 53
4.4.1 Looping experiment ........................................................................... 53 4.4.2 Long single mixing section ................................................................ 59 4.4.3 Staggered mixing sections .................................................................. 69
CHAPTER FIVE Conclusions and comments ................................................................ 76 CHAPTER SIX Future works ....................................................................................... 78

List of figures Fig. 1-1 Classification of size enlargement processes [9] ............................................... 3 Fig. 1-2 Basic concept for wet granulation [11] ............................................................. 4 Fig. 2-1 Modern granulation process description [12] .................................................... 6 Fig. 2-2 Different saturation states of liquid-bounded granules [12] .............................. 7 Fig. 2-3 The growth regime map proposed by Iveson and Litster in 2001 [18] ........... 11 Fig. 2-4 Schematic drawing of a pair of colliding particles .......................................... 16 Fig. 2-5 Batch-wise granulation equipments. (a) Typical high-shear mixer granulator
[25]; (b) Typical fluidized bed (in the picture: Wurster coater) ...................... 21 Fig. 2-6 Glatt multicell GMC 30 [58] ........................................................................... 22 Fig. 2-7 Schematic drawing of extrusion ...................................................................... 23 Fig. 3-1 HAAKE PolyLab System® .............................................................................. 35 Fig. 3-2 Schematic cross section of the co-rotating twin screw extruder ..................... 35 Fig. 3-3 The screws and the composing sections .......................................................... 37 Fig. 3-4 Basic measurements for the co-rotating twin screw extruder ......................... 39 Fig. 3-5 Size measurement of MCC 102 ....................................................................... 41 Fig. 3-6 Working matrix for the extruder ...................................................................... 43 Fig. 3-7 Working matrix for the high shear mixer granulator [1] ................................. 43 Fig. 3-8 Liquid injection ports ...................................................................................... 44 Fig. 4-1 The growth regime map for the extruder with a short single mixing section.
Powder: MCC PH 102, Binder: aqueous PEG 6k 33% ................................... 47 Fig. 4-2 The irregular and big shreds ............................................................................ 48 Fig. 4-3 Further analysis of the GSD ............................................................................ 49 Fig. 4-4 Torque analyses ............................................................................................... 52 Fig. 4-5 The extrudates ................................................................................................. 53 Fig. 4-6 Looping experiments ....................................................................................... 57 Fig. 4-7 The change of the mean granule size and each size frequency ....................... 58 Fig. 4-8 The work exerted on the granules with the short single mixing section ......... 59 Fig. 4-9 The growth regime map for the extruder with a long single mixing section.
Powder: MCC PH 102, Binder: aqueous PEG 6k 33% ................................... 62 Fig. 4-10 Torque measurements with the long single mixing section. PEG 6k 33%, dry
powder feed rate: 20 g/min .............................................................................. 63 Fig. 4-11 Further analysis of the GSD ............................................................................ 64 Fig. 4-12 Looping experiments ....................................................................................... 67 Fig. 4-13 The change of the mean granule size and each size frequency ....................... 68 Fig. 4-14 The work exerted on the granules with a long single mixing section ............. 69 Fig. 4-15 The growth regime map for the extruder with staggered mixing sections.
Powder: MCC PH 102, Binder: aqueous PEG 6k 33% ................................... 71 Fig. 4-16 Further analysis of the GSD ............................................................................ 73 Fig. 4-17 Comparisons between short, long single mixing section and staggered mixing
section .............................................................................................................. 75 Fig. 6-1 The Freezing method ....................................................................................... 79

List of tables Table 2-1 Estimates of Uc for different granulation processes [21] ................................ 10 Table 2-2 A list of granule property measurements with twin screw extruders and the
comments ........................................................................................................ 28
1
CHAPTER ONE INTRODUCTION
1.1 Definition of agglomeration/granulation
Agglomeration/granulation is a process in which small particles are combined and
become a larger entity whilst the individual and primary particles are still distinguishable
[2]. The process can be achieved by either dry or wet methods. Liquid materials are used as
a linking substance between the particles in wet agglomeration/granulation (usually in a
high shear mixer), while dry agglomeration/granulation can be used to produce larger
granules through heat treatment (sintering), pressurisation (compaction and extrusion) or by
utilizing the cohesive characteristics of the material (tumbling and fluidizing).
Agglomeration and granulation are used interchangeably for the same meaning across this
thesis.
1.2 Applications
The application of granulation technique is commonly seen in nature, for example
the birds’ nests are made of mud (solid) and bird’s saliva (binder). In industry, it is also a
fundamental and widely adopted process ranging from pharmaceutical and food (e.g.
cereal bar, cubed bouillon) manufacture, mining and manufacture of agriculture products
(e.g. fertilizer). By using specific well-designed techniques, material characteristics can be
modified to help produce more easily handled materials. Some advantages that
granulation provides are listed below:

2
• Product design:
With a proper granulation technique, the granule properties such as surface area,
hardness, bulk density, morphology, size distribution etc. can be modified, achieving
a more accurate manufacturing. It is especially very critical for improving modern
treatments as the dissolution characteristics of medicines, delivery rates or even taste
could be controlled.
• Reducing dustiness:
Dustiness could cause waste of materials, dust explosion [3] or even a major
threat to the operators who expose themselves to the dusty air. Despite of the filtration
techniques, this problem can be reduced by incorporating the dust into larger particles.
• Flow properties improvement:
Fine particles are easily affected by high moisture as well as having high Van der
Waal’s forces; therefore stagnant flowing zones might be formed in some
circumstances. It can be avoided by using granulation techniques where particulate
materials are “designed” in terms of shape, surface roughness, average size and density.
Furthermore, narrower granule size distribution (GSD) can result in less segregation
too. For instance, when two or more different size ingredients are mixed,
agglomeration can prevent the mixture from segregating and achieve a uniform
material distribution.
• Soil remediation
In the soil remediation industry, some patterns (Aglofloat® and Aglotherm®
technology) based on this technology has also been used to clean up coal fines in the
3
products [4-6]. Chemicals are added into tailing ponds where the particles settle out of
the water, to absorb the mineral matter that had been mined together with coal from
coal carbons.
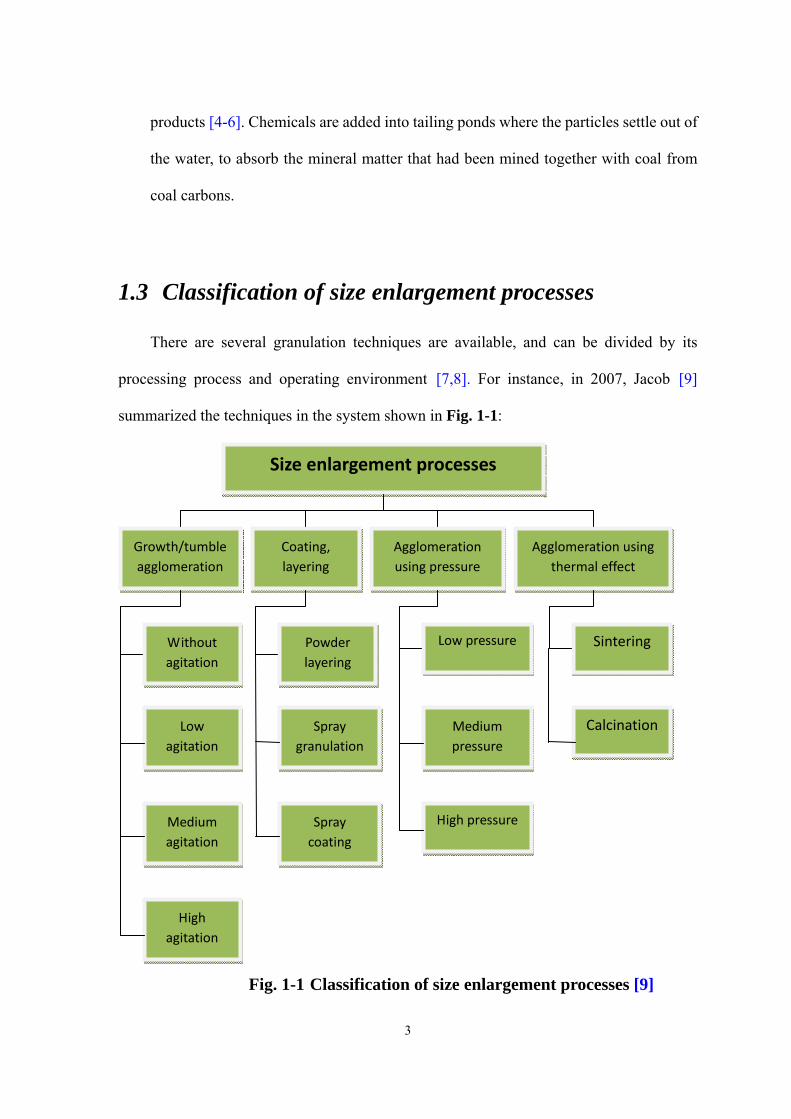
1.3 Classification of size enlargement processes
There are several granulation techniques are available, and can be divided by its
processing process and operating environment [7,8]. For instance, in 2007, Jacob [9]
summarized the techniques in the system shown in Fig. 1-1:
Fig. 1-1 Classification of size enlargement processes [9]
Size enlargement processes
Growth/tumble agglomeration
Coating, layering
Agglomeration using pressure
Agglomeration using thermal effect
Without agitation
Low agitation
Medium agitation
High agitation
Spray coating
Spray granulation
Powder layering
High pressure
Medium pressure
Low pressure
Calcination
Sintering

4
1.3.1 Growth/tumble agglomeration As shown in Fig. 1-2 [10], wet granulation is a process in which small primary
particles are brought together and combined with each other by adding certain amount of
liquid agents and then becomes larger entities gradually. In some cases where continuous
agitation is applied, the granule structure can be either staying constant, consolidated or
being broken, depending on the magnitude of external impact force, e.g. rotating drum is
used to provide low shear forces while high shear mixer granulation features the high shear
forces.
Fig. 1-2 Basic concept for wet granulation [10]
1.3.2 Coating/Layering This technique is usually seen in rotating drums or coaters (Wurster coater, fluidised
bed). While the materials are mixed during the rotation or suspension process, hot air or a
liquid spray enters the vessel and covers the particulate raw material. Liquid film will be
formed and then it will be dried out by subsequent processes to leave a solid layer on the
surface of the raw materials.
1.3.3 Agglomeration using pressure This technique, including compaction and extrusion is performed via a mechanical
5
pressurizing process to squeeze particles together. The particles bind to each other by
mechanical forces (interlocking) or chemical reactions. They can be achieved with bulk
powders containing very small amounts and sometimes even no lubricant or binder
additions, unless it is necessary to reduce the friction forces between the particle themselves
or between the particles and the die walls.
1.3.4 Thermal effects Sintering and calcination have been extensively used in metal metallurgy or ceramic
manufacturing industries. This method is generally based on heating the component to a
temperature above the melting point of at least one of the constituting powders, therefore
the composing particles (or grains) can be melted and adhere each other.
1.3.5 Drop formation In addition to the categories above, Sherrington and Oliver [7] identified another
technique – drop formation, or “prilling”. Prilling is commonly seen in fertilizer industries.
It produces granules in a process where liquid is sprayed from the prilling wheel installed at
the top of a hot-air circulated channel. The droplet fall vertically down to a conveyer in the
bottom of the channel. By which time, the circulating hot air should have dried out the
liquid to leave the solidified particles, known as prills.
6
CHAPTER TWO
THEORIES AND MECHANISMS
2.1 Granulation processes (wet granulation) 2.1.1 Overview
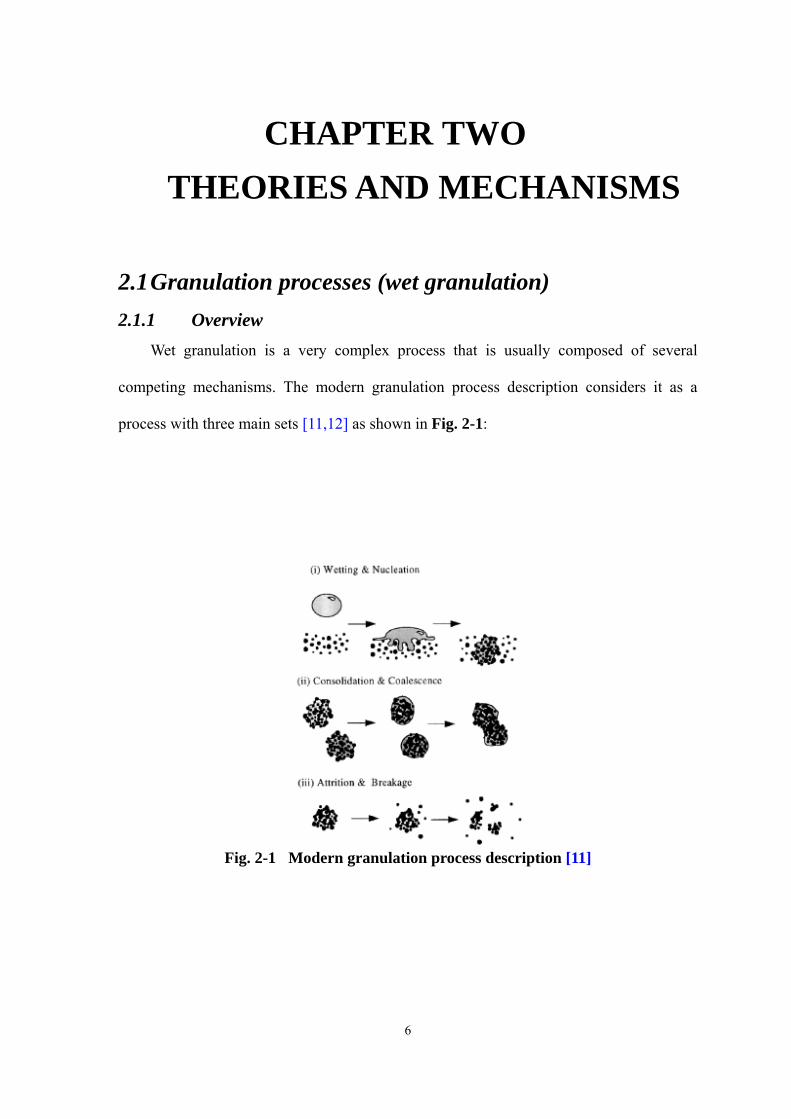
Wet granulation is a very complex process that is usually composed of several
competing mechanisms. The modern granulation process description considers it as a
process with three main sets [11,12] as shown in Fig. 2-1:
Fig. 2-1 Modern granulation process description [11]
7
Wetting, nucleation and binder dispersion
This first stage of the process is the contact between the liquid and dry powder.
There are two nuclei formation mechanisms [13]: distribution or immersion,
depending on the relative size of the droplet to the primary particles. Distribution
occurs when binder droplets are smaller than the primary particle and are distributed
on the surface of it. These droplet-coated particles are then ready to coalesce. When
the particles are far smaller than the droplets, then they will likely to be immersed by
the droplets if the surface tension is smaller.
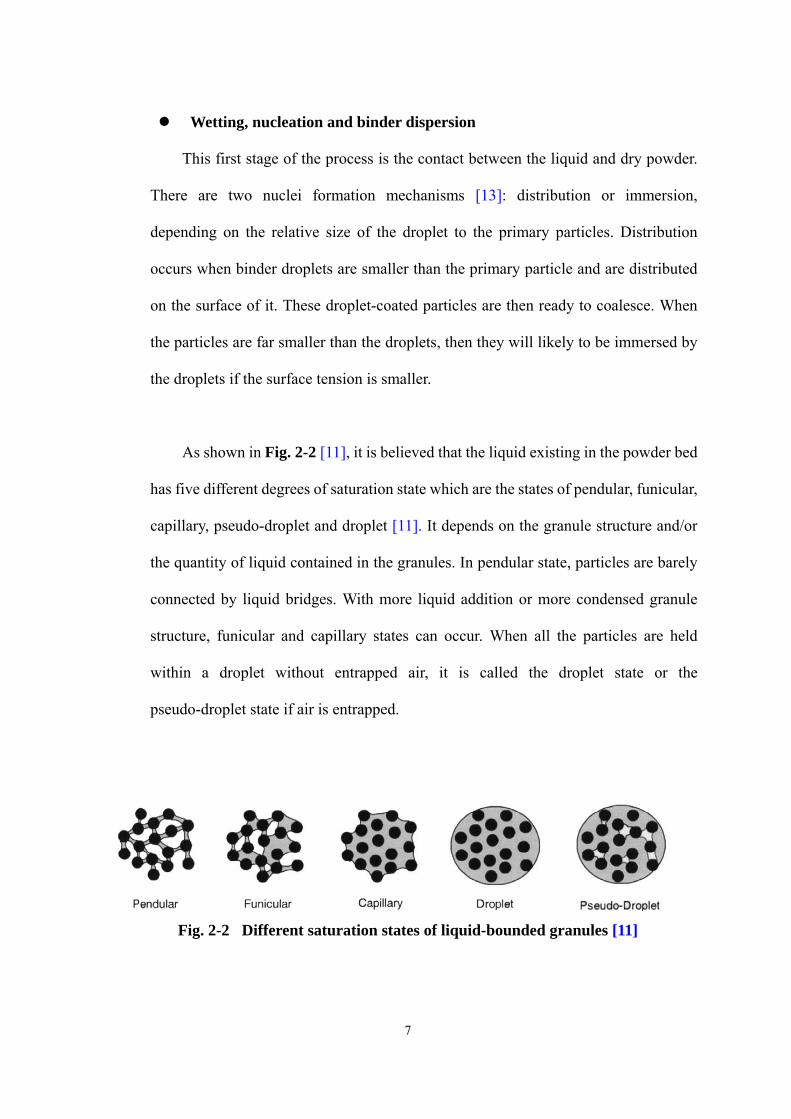
As shown in Fig. 2-2 [11], it is believed that the liquid existing in the powder bed
has five different degrees of saturation state which are the states of pendular, funicular,
capillary, pseudo-droplet and droplet [11]. It depends on the granule structure and/or
the quantity of liquid contained in the granules. In pendular state, particles are barely
connected by liquid bridges. With more liquid addition or more condensed granule
structure, funicular and capillary states can occur. When all the particles are held
within a droplet without entrapped air, it is called the droplet state or the
pseudo-droplet state if air is entrapped.
Fig. 2-2 Different saturation states of liquid-bounded granules [11]
8
It is important to note that the change of saturation state can result in a change of
granulation process. For instance, when the primary particles are further impacted, the
granule porosity will be decreased and the entrapped liquid and air would be pushed to
the surface, thereby the granule could successfully adhere onto other granules, leading
to further growth.
Consolidation and growth
When continuous collision between granules takes place, this will reduce the
granule size and consequently squeeze the inner liquid and air from the interior to the
surface and then form a liquid film. During which, the granule saturation state can be a
helpful character for describing this process. In the mean time, granule porosity will be
decreased and granules will become more robust due to consolidation. The decrease in
granule porosity has been measured and described by an exponential relationship with
time that shows a rapid drop at the beginning and then followed by a steady state
[14,15]. When the liquid that has been squeezed to the surface becomes thick enough
to absorb impact forces from other granules, these granules coalesce and grow.
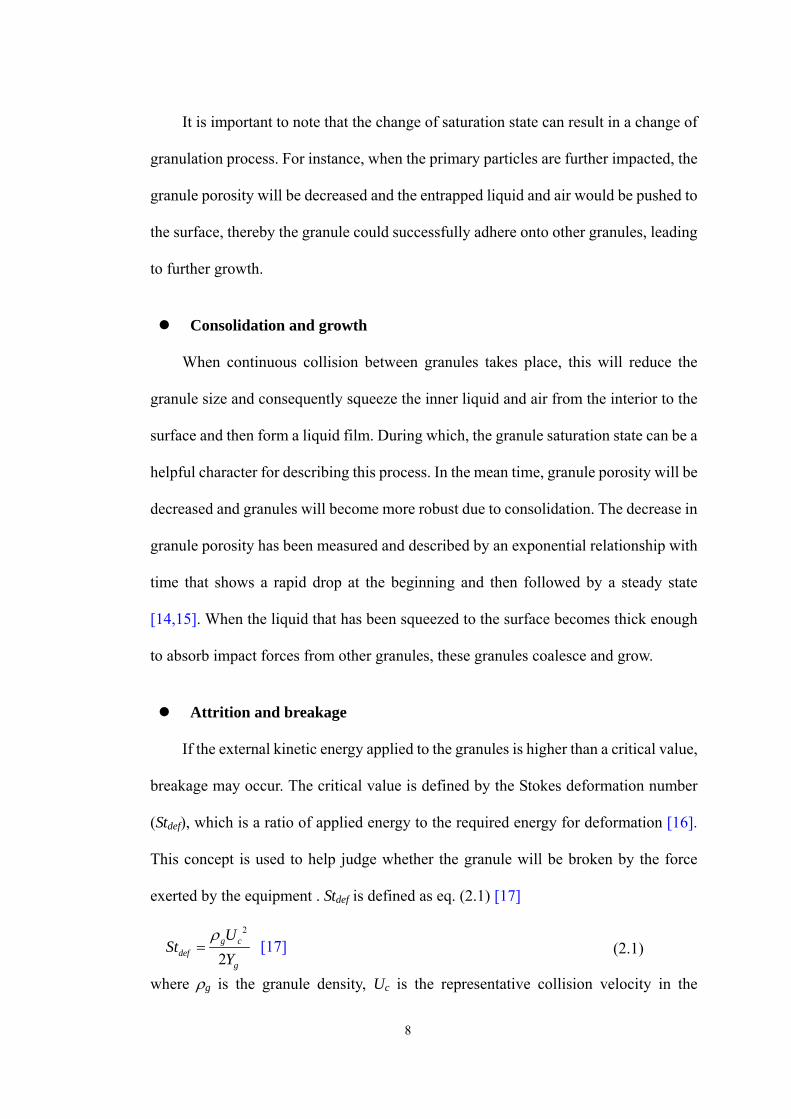
Attrition and breakage
If the external kinetic energy applied to the granules is higher than a critical value,
breakage may occur. The critical value is defined by the Stokes deformation number
(Stdef), which is a ratio of applied energy to the required energy for deformation [16].
This concept is used to help judge whether the granule will be broken by the force
exerted by the equipment . Stdef is defined as eq. (2.1) [17]
2
2g c
defg
USt
Yρ
= [17] (2.1)
where ρg is the granule density, Uc is the representative collision velocity in the

9
granulator, and Yg is the dynamic yield stress of the granules.
A relationship between breakage (defined by the breakage number) and Stdef in
high shear mixer has been investigated as shown in eq. (2.2) [18]. The authors dyed a
certain size fraction of granules as the tracer particles with erythrosine, and then
poured the tracer granules back to the high shear granulator to mix with the tracer-free
granules (called the “reference granules” in their work). Afterwards, they measured
the total amount of erythrosine present in the size of tracer granules (Atracer) and then
divided it with the total amount of erythrosine contained in all the granules (Atotal).
Breakage number was defined as the degree of spread: attrition or breakage.
Breakage number = 1 100%tracer
total
AA
⎛ ⎞− ×⎜ ⎟
⎝ ⎠ [18] (2.2)
where Atracer represents total amount of erythrosine in the tracer granules and Atotal
represents total amount of erythrosine in all the granules. It is noted that the breakage
number should be a function of time. The authors [18] plotted the breakage number
against Stdef, and they found a sharp increase in breakage number when Stdef was at
about 0.01, so they defined a border line accordingly between little breakage (attrition)
and large extent of breakage.
This approach, however, left a number of questions such as whether breakage was
predominately due to high impact forces or the shear in the powder bed because the
effects of impact and shear cannot be separated [8]. The estimation of granule velocity
in equipment is very critical for calculating Stdef. Many disagreements about critical
Stdef have been found probably due to disagreement in the estimation of granule
velocity. For example, Stdef = 0.04 was claimed by Iveson et al. [17] while Stdef = 0.2

10
was claimed by Tardos et al. [16]. It is true of course that estimation of granule
strength can be inaccurate as well.
In high-shear mixer granulators, Knight et al. [19] suggested that Uc could be
approximately 20% of the impeller tip speed. The other estimates of Uc for different
type of granulation processes are provided in Table 2-1 [20].
Table 2-1 Estimates of Uc for different granulation processes [20] Type of granulator Average Uc Maximum Uc
Fluidized beds 6 b d
b
U aa
2
6 b d
b b
U aa l
Tumbling granulators dr dw a ( ) / 2dr drumw D
Mixer granulators ,im d c dw a w a ( ) ( )/ 2 , / 2im im c cw D w DNomenclature:
Ub: bubble velocity (m/s) ab, ad: bubble size, particle diameter (m) lb: dimensionless bubble spacing, defined as the ratio of bubble space over
bubble radius wdr, wim, wc: drum rotating speed, impeller speed and chopper speed (rpm) Ddrum , Dim , Dc: diameter of the drum granulator, impeller and chopper (m)

11
2.1.2 Macroscopic point of view From the macroscopic point of view, a series of granule growth regime maps, defining
growth behaviours based on the change of mean granule size with time, have been proposed
since 1998 [17,21-23]. Fig. 2-3 [17] is a typical regime map which features the maximum
saturation state (Smax) and the Stokes deformation number (Stdef) as abscissa and ordinate,
respectively.
Fig. 2-3 The growth regime map proposed by Iveson and Litster in 2001 [17]
As shown in Fig. 2-3, Smax is expressed as:
( )minmax
min
1ρ ερ ε
−= s
l
wS (2.3)
where ρs and ρl are the density of solid particles and the liquid density respectively. w
represents the mass ratio of liquid to solid and εmin is the minimum porosity the
formulation reaches for that particular set of operating conditions.
A disagreement about the regime map ordinate occurred during the evolution. In 1997,
Tardos et al. [16] recognised that granule coalescence was a very complicated process since

12
the amount of binder evaporation is too difficult to predict. They proposed a Stokes’
deformation number Stdef as shown in eq. (2.4 a) with the definition: a ratio of the external
applied kinetic energy to the energy required for deformation. It was to simplify the
granulation process where ( )τ γ•
was the characteristic stress. ( )τ γ•
can be expressed as
eq. (2.4 b) (Herschel bulkily equation) where kav is the apparent viscosity and n is the flow
index which means the wet granules exhibit both yield strength and non-Newtonian
behaviour. By assuming that the granules are composed of extremely concentrated slurry,
the apparent viscosity kav can be ignored compared to the yield strength. So that eq. (2.4 b)
became eq. (2.4 c). Substitute eq. (2.4 c) into eq. (2.4 a), eq. (2.4 d) can be derived.
212
( )
p c
def
p
m USt
V τ γ•=
[16] (2.4 a)
( )n
y avkτ γ τ γ• •
= + [16]
(2.4 b)
( ) yτ γ τ•
= [16]
(2.4 c)
22
12
2
p p cp c
defp y y
V U USt
V
ρ ρτ τ
= = [16]
However, in 1998, Iveson and Litster [21] suggested that granule deformation could be
considered as plastic, so they developed a new number – deformation number (De) to
quantify the degree of deformation.
2g c
g
UDe
Yρ
= [21]
(2.5)
De is a ratio of applied energy to the plastic energy per unit strain of a granule, and it

13
describes the deformation with dynamic yield stress instead of τy. The disagreement led to
ambiguity when drawing the regime maps, until Iveson et al. [17] suggested to unify the
terminology by replacing τy with Yg in 2001. Finally this integration led to the latest
definition of Stdef as shown below:
2
2g c
defg
USt
Yρ
= [17] (2.6)
The map is a qualitative tool that can explain, understand and sometimes predict
growth behaviour under certain operating conditions based on formulation properties
before doing experiments or mass production. Therefore saving development cost is
considered to be the main advantage of this tool. The map classifies agglomeration
behaviour into four categories: nucleation, steady growth, induction and rapid growth.
Nucleation occurs when the binder is brought into contact with a powder bed and granule
nuclei are formed, but there is not enough binder to promote further growth. Steady growth
occurs with weak and deformable granules, resulting in a steady but slow growth. Induction
behaviour can be observed in a relatively “stiff” system where the granules are less likely to
deform at the beginning. Throughout the entire process of this behaviour, granules will
exhibit three stages: (1) they do not deform apparently caused by liquid transformation from
inner granules to the surfaces; (2) after which they will grow rapidly due to sufficient
coalescence until the third stage; (3) ultimately a steady state for average granules size is
reached [14]. Rapid growth could be found when more liquid is added into the system and
the induction stage becomes very short.
However, it is noted that the boundaries between behaviours vary with the change of
batch, materials, shear force distribution, heat transfer and so on. It is because that the
14
traditional regime maps, e.g. Fig. 2-3, did not aim to define the behaviours with
time-dependent characteristics of the granules, e.g. surface stickiness, hardness,
deformability, shape, GSD (granule size distribution), force distribution, particle friction
forces (internal friction, wall friction) and so on. Relevant researches upon this are still
sparse.
For the abscissa of Fig. 2-3, εmin was found to be a complex function of formulation
properties and operating conditions [17]. It could be estimated in a low intensity granulator,
such as a rotating drum, by simply measuring the wet-tapped porosity of the granules
because in low intensity granulation, the voidage is closely related to the tapped porosity.
On the other hand, in the case of high intensity granulation, e.g. a high shear mixer, it is
necessary to do the experimental measurements for prediction. Secondly, the granule
saturation state can change if the liquid is evaporated or if the solid dissolves and becomes
part of the liquid phase, so that the maximum pore saturation state is employed, instead of
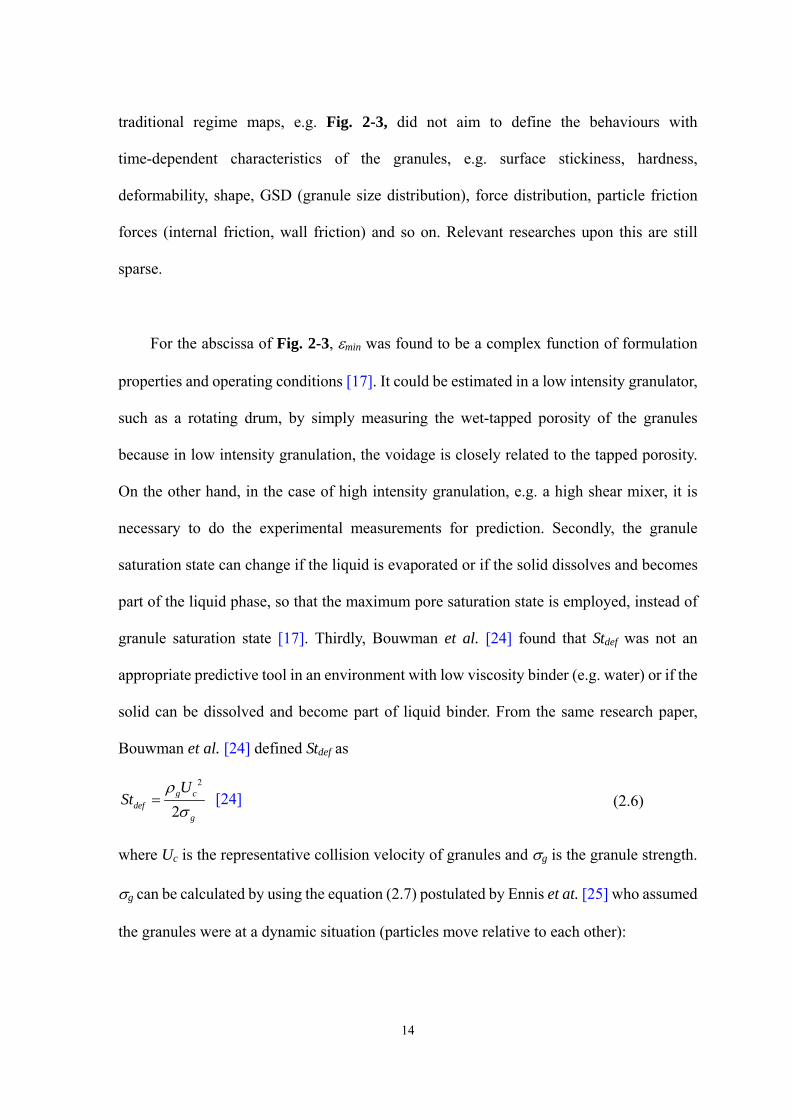
granule saturation state [17]. Thirdly, Bouwman et al. [24] found that Stdef was not an
appropriate predictive tool in an environment with low viscosity binder (e.g. water) or if the
solid can be dissolved and become part of liquid binder. From the same research paper,
Bouwman et al. [24] defined Stdef as
2
2g c
defg
USt
ρσ
= [24] (2.6)
where Uc is the representative collision velocity of granules and σg is the granule strength.
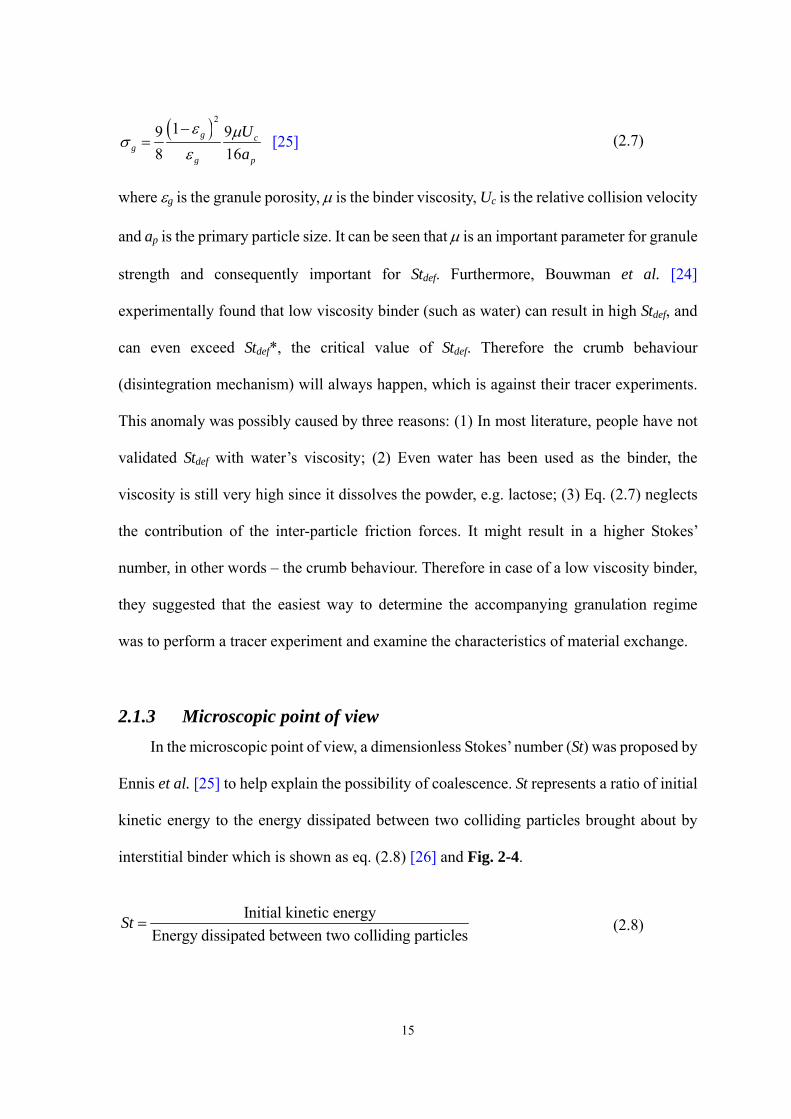
σg can be calculated by using the equation (2.7) postulated by Ennis et at. [25] who assumed
the granules were at a dynamic situation (particles move relative to each other):
15
( )21 99
8 16g c
gg p
Ua
ε μσε
−= [25] (2.7)
where εg is the granule porosity, μ is the binder viscosity, Uc is the relative collision velocity
and ap is the primary particle size. It can be seen that μ is an important parameter for granule
strength and consequently important for Stdef. Furthermore, Bouwman et al. [24]
experimentally found that low viscosity binder (such as water) can result in high Stdef, and
can even exceed Stdef*, the critical value of Stdef. Therefore the crumb behaviour
(disintegration mechanism) will always happen, which is against their tracer experiments.
This anomaly was possibly caused by three reasons: (1) In most literature, people have not
validated Stdef with water’s viscosity; (2) Even water has been used as the binder, the
viscosity is still very high since it dissolves the powder, e.g. lactose; (3) Eq. (2.7) neglects
the contribution of the inter-particle friction forces. It might result in a higher Stokes’
number, in other words – the crumb behaviour. Therefore in case of a low viscosity binder,
they suggested that the easiest way to determine the accompanying granulation regime
was to perform a tracer experiment and examine the characteristics of material exchange.
2.1.3 Microscopic point of view In the microscopic point of view, a dimensionless Stokes’ number (St) was proposed by
Ennis et al. [25] to help explain the possibility of coalescence. St represents a ratio of initial
kinetic energy to the energy dissipated between two colliding particles brought about by
interstitial binder which is shown as eq. (2.8) [26] and Fig. 2-4.
Initial kinetic energy
Energy dissipated between two colliding particles=St (2.8)

16
Fig. 2-4 Schematic drawing of a pair of colliding particles
Provided that there is a pair of liquid-covered identical spheres approaching each other
along with a line of their centres, a pendular bridge (called dynamic pendular bridge) should
form and dissipate the kinetic energy of the colliding particles preventing rebound.
Comparing to the liquid bridge formed with a pair of static granules, the one formed in
collision situation is called the “dynamic pendular bridge”. Ennis et al. [25] suggested that
an approximate solution for the strength of a dynamic pendular bridge can be expressed as
eq. (2.9) which is a superposition of a Laplace-Young capillary pressure Fcap acting in the
outer contact region and a viscous lubrication pressure Fvis acting within the inner contact
region, where are shown as eqs. (2.9 b) & (2.9 c). Note that φ is the filling angle, Co is the
Laplace-Young pressure deficiency and the Ca is the capillary number. The capillary
number is expressed as eq. (2.9 d) where μ is the liquid viscosity, u0 is the particle velocity
and γ is the liquid surface tension.
u0 : initial relative particle collision velocity
hl: thickness of the liquid layer
mp: mass of the sphere
ep: coefficient of restitution
ap: particle radius ρp: particle density
μ: binder viscosity
2x
u0
ha: asperity
17
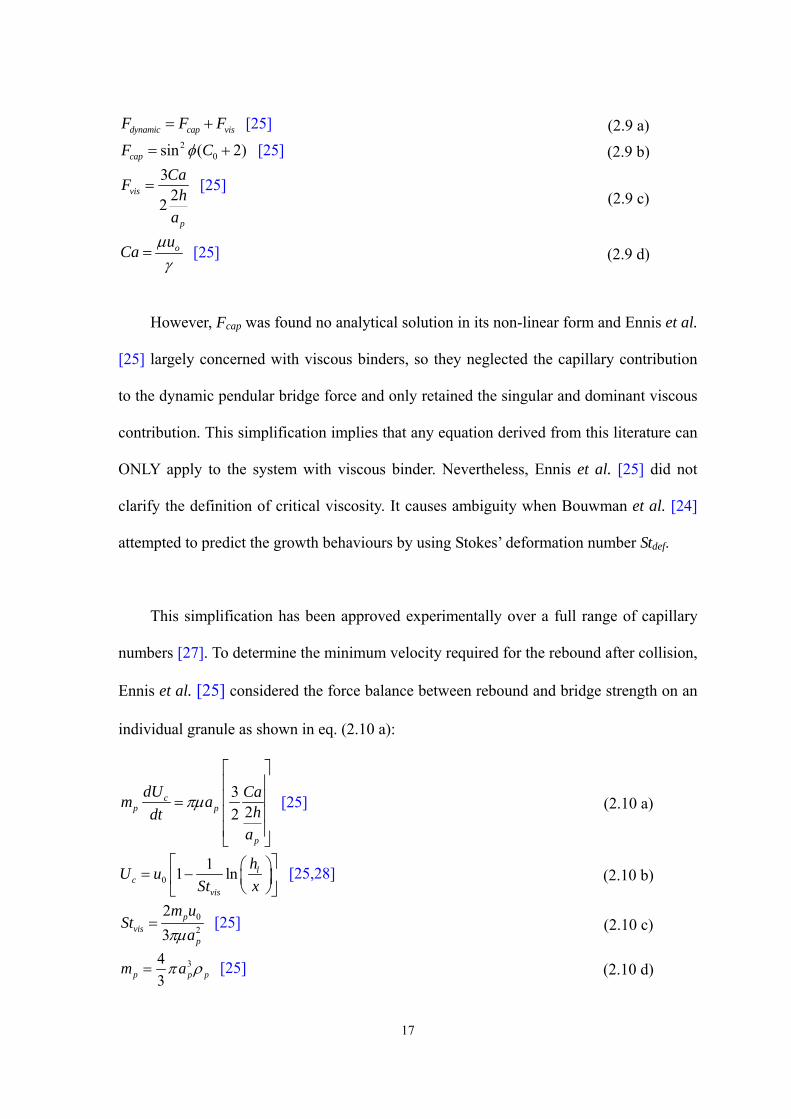
dynamic cap visF F F= + [25] (2.9 a) 2
0sin ( 2)capF Cφ= + [25] (2.9 b) 3
22vis
p
CaF ha
=
[25] (2.9 c)
ouCa μγ
= [25] (2.9 d)
However, Fcap was found no analytical solution in its non-linear form and Ennis et al.
[25] largely concerned with viscous binders, so they neglected the capillary contribution
to the dynamic pendular bridge force and only retained the singular and dominant viscous
contribution. This simplification implies that any equation derived from this literature can
ONLY apply to the system with viscous binder. Nevertheless, Ennis et al. [25] did not
clarify the definition of critical viscosity. It causes ambiguity when Bouwman et al. [24]
attempted to predict the growth behaviours by using Stokes’ deformation number Stdef.
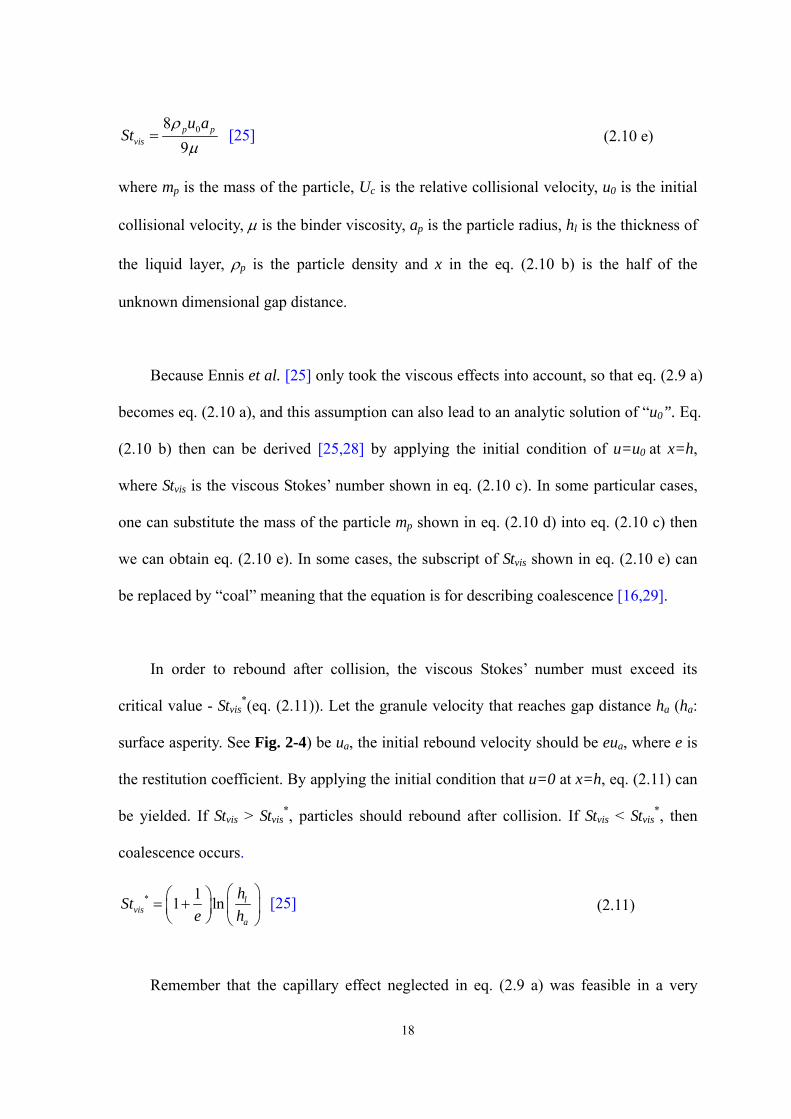
This simplification has been approved experimentally over a full range of capillary
numbers [27]. To determine the minimum velocity required for the rebound after collision,
Ennis et al. [25] considered the force balance between rebound and bridge strength on an
individual granule as shown in eq. (2.10 a):
322
cp p
p
dU Cam a hdta
πμ
⎡ ⎤⎢ ⎥⎢ ⎥=⎢ ⎥⎢ ⎥⎣ ⎦
[25] (2.10 a)
011 ln l
cvis
hU uSt x
⎡ ⎤⎛ ⎞= −⎢ ⎥⎜ ⎟⎝ ⎠⎣ ⎦
[25,28] (2.10 b)
02
23
pvis
p
m uSt
aπμ= [25] (2.10 c)
343p p pm aπ ρ= [25] (2.10 d)
18
089p p
vis
u aSt
ρμ
= [25] (2.10 e)
where mp is the mass of the particle, Uc is the relative collisional velocity, u0 is the initial
collisional velocity, μ is the binder viscosity, ap is the particle radius, hl is the thickness of
the liquid layer, ρp is the particle density and x in the eq. (2.10 b) is the half of the
unknown dimensional gap distance.
Because Ennis et al. [25] only took the viscous effects into account, so that eq. (2.9 a)
becomes eq. (2.10 a), and this assumption can also lead to an analytic solution of “u0”. Eq.
(2.10 b) then can be derived [25,28] by applying the initial condition of u=u0 at x=h,
where Stvis is the viscous Stokes’ number shown in eq. (2.10 c). In some particular cases,
one can substitute the mass of the particle mp shown in eq. (2.10 d) into eq. (2.10 c) then
we can obtain eq. (2.10 e). In some cases, the subscript of Stvis shown in eq. (2.10 e) can
be replaced by “coal” meaning that the equation is for describing coalescence [16,29].
In order to rebound after collision, the viscous Stokes’ number must exceed its
critical value - Stvis*(eq. (2.11)). Let the granule velocity that reaches gap distance ha (ha:
surface asperity. See Fig. 2-4) be ua, the initial rebound velocity should be eua, where e is
the restitution coefficient. By applying the initial condition that u=0 at x=h, eq. (2.11) can
be yielded. If Stvis > Stvis*, particles should rebound after collision. If Stvis < Stvis
*, then
coalescence occurs.
* 11 ln lvis
a
hSte h
⎛ ⎞⎛ ⎞= + ⎜ ⎟⎜ ⎟⎝ ⎠ ⎝ ⎠
[25] (2.11)
Remember that the capillary effect neglected in eq. (2.9 a) was feasible in a very
19
viscous condition. In order to estimate the error caused by this simplification, the critical
capillary Stokes’ number Stcap* given in eq. (2.12) is divided by the critical viscous Stokes’
number Stvis* shown in eq. (2.11). It can be seen that eq. (2.13) equals zero when e→1 and
hl/ha becomes large. It is to say the capillary effects can be ignored under these conditions.
In other words, the particles must be smooth and elastic.
*2
12 1 1 acap
l
hSte h
⎛ ⎞⎛ ⎞= − −⎜ ⎟⎜ ⎟⎝ ⎠⎝ ⎠
[25] (2.12)
*
*
112 1
ln
a
cap l
vis l
a
hSt hSt e h
h
⎛ ⎞−⎜ ⎟
⎛ ⎞ ⎝ ⎠= −⎜ ⎟ ⎛ ⎞⎝ ⎠⎜ ⎟⎝ ⎠
[25] (2.13)
These equations (eqs. (2.9) to (2.12)) have become the very basic theories adopted by
many researchers nowadays to help explain granule deformation during collisions. For
example, if high viscosity binder is added into a system, one could model the granules as
surface wet elastic spheres [30] (although it is not always applicable in reality). In this
case, the energy absorbed during collision is taken to be the energy absorbed by squeezing
interstitial liquid between constitutional particles.
2.2 Agglomeration equipments 2.2.1 Batch-wise equipments
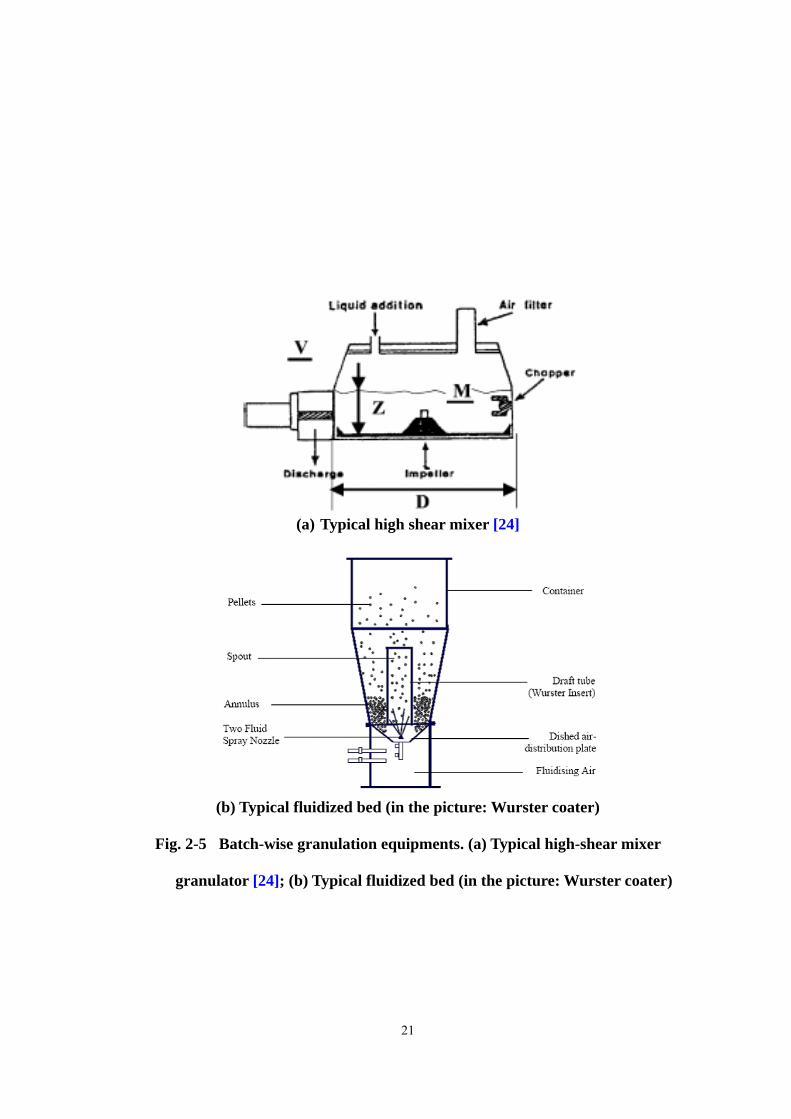
As shown in Fig. 2-5, there are two kinds of equipments are designed for batch-wise
wet granulation: fluidized beds and high shear mixers. The equipments providing low shear
forces, such as fluidized beds have the advantage of better product temperature control.
Nevertheless, the high shear force equipments, such as high shear mixers, are usually more
popular than the lower ones as it is more likely to disperse very viscous binder efficiently
20
and lead the final products to a harder structure. At the same time, the high work rate can
lead to very high temperature (up to 100˚C), causing damage to the products i.e. thermal
decomposition. Also, the binder may become less viscous at high temperature, so that
different growth behaviour may be observed as the result of more deformable granules [25].
It is still difficult to determine a theoretical end point of high shear granulation due to
complex growth behaviours [31,32]. Yet, both high shear mixers and fluidized beds are
batch-wise equipments, generally it is found that inconsistent results sometimes appear
when scaling up from laboratorial (up to 15 kg per batch) to industrial size (up to 100 kg per
batch) [16,25,33].
21
(a) Typical high shear mixer [24]
(b) Typical fluidized bed (in the picture: Wurster coater)
Fig. 2-5 Batch-wise granulation equipments. (a) Typical high-shear mixer
granulator [24]; (b) Typical fluidized bed (in the picture: Wurster coater)

22
2.2.2 Semi-continuous equipments Semi-continuous granulation utilizes materials to be processed sequentially from
feeding, to mixing and drying. Although the materials are processed continuously, the
production line is still a combination of several master batch scale equipments, such as
fluidized beds, high shear mixers and/or cyclones, thus the materials are still partly
processed in an unsteady state environment. An example is shown below in Fig. 2-6 [34]:
Fig. 2-6 Glatt multicell GMC 30 [34]
The main challenges for such granulation were reported as [35]: (1) the batch size is
not well defined, leading to uncertain batch traceability; (2) the system is in general not in
the equilibrium state from the beginning.
2.2.3 Continuous equipments Instead of the conventional batch-wise concept for wet granulation, continuous
methods have been sought. Single screw extrusion or twin screw extrusion techniques are
typical examples.

23
Extrusion has been a very widely adopted technique in industry (particularly in
polymer science related industries) although it is very simple. As a schematic drawing
shown in Fig. 2-7, a force is applied onto the raw materials filled in the container from one
end towards the opposite end. All the materials will then be extruded through a die which
defines the final cross section. In practice, the applied force usually comes from one or a
pair of rotating screws.
Fig. 2-7 Schematic drawing of extrusion
This technique provides several advantages [36,37]:
1. scale-up problems can be ignored
Due to the complicated behaviours found in batch-wise wet granulation, and
the inconsistent results between different operating scales, the 24/7 manufacturing
option – continuous granulation has drawn attention since it can produce many
products steadily and efficiently. Therefore, it is not necessary to enlarge the scale
in which most inconsistent results may occur. The biggest challenge of this
technique, however, is to understand the dominating mechanisms so that the
product quality can be controlled.
2. 24/7 automatic production lines would be possible;
Raw material Force
Die
Extrudate
Container
24
3. It can reduce the labour cost.
4. It can reduce the product property variation that might occur in batch-wise
equipments.
5. For a twin screw extruder, the screws can self-clean themselves and the
equipment as the screws wipe each other [38], leaving only nominal residue
after the process.
6. On-line measurement becomes feasible due to the relative simple path of the
materials.
This thesis will concentrate on the use of a twin screw extruder. It has been a common
and versatile method in food industries [39] and polymer industries. It can be used to
obtained uniform products under various inputs. In 1986, Gamlen and Eardley [40] have
first introduced the use of a twin extruder - Baker Perkins MP50 to produce paracetamol
extrudates. In 1987, Lindberg et al. [41] found that the twin screw extruder can be a possible
continuous granulation method of pharmaceutical manufacturing with effervescent
paracetamol. These researches stated that except for the surface imperfection on extrudates,
twin extruder was recommended for making paracetamol granules. Later, Lindberg et al.
[42] found that granulation via extrusion can yield granules with desired properties under
certain operating conditions. Also they found screw configuration can significantly
influence the granule porosity. Kleinebudde and Lindner [43] used other materials – lactose
and microcrystalline cellulose (MCC) to study the effects of screw speed and water content
on the granulation process and extrudates properties.
Recently, the influence of input variables, formulation variables and the granule

25
characteristics have been further studied [37,44-47]. For the researches mentioned above,
different screw speeds and total input rates were usually considered as the input variables.
For the formulation variables, different screw profile and die block, binder content and
viscosity were usually tested. And for the extrudate/granule characteristics, it was usually of
great interest to measure the properties listed in Table 2-2. The researches listed above all
concluded that a twin screw extruder was an ideal alternative for wet granulation.
The most commonly employed materials for evaluating twin screw granulation are
[36,37,44-47]: (1) excipient: α-lactose monohydrate 200M [36,37], microcrystalline
cellulose Avicel 101 ( MCC 101) [46], sodium guaiazulene sulfonate (GAS-Na) [45] and
cornstarch [45]; (2) binder: water [36,37,45,47], demineralized water [44,46], polyethylene
glycol (PEG) [44] and aqueous polyvinylpyrrolidone solution (PVP) [36,37,45,47]; (3)
model drug (to evaluate the dissolution properties): hydrochlorothiazide (10%) [36,37,47].
It was added to the formulation with and without 2.5% PVP; (4) surfactant [44]: sodium
laurylsuphate (SLS), F127 (poloxamer 407), cremophor® RH40 and polysorbate 80.
Although continuous granulation with twin screw extruders is such an efficient
method to produce granules, several limitations were found:
1. Extrusion has been an ideal technique for melting and forming polymer into a
continuous profile. The axial mixing is probably limited and that means very accurate
metering of feed in this technique would be required in the case of blending small
quantities of active, which is often seen in the industries of pharmaceutical and
chemical manufacturing.
2. The size of container shown in Fig. 2-7 constrains the size of final products, and that

26
can be seen more obviously when screws are installed because the path of flowing
materials becomes narrower.
3. The processing time for the material in an extruder is much less than that in a high
shear mixer, particularly in the case of relative short processing barrel. The output
granules may be imperfect in mixing and hardness, due to the lack of work exerted on
them. Prolonging the processing time can be achieved by extending the length of
barrel or connecting several extruders in series, but both are expensive. Looping
processed granules can increase the residence time, but it is not a practical option and
will stop the process from being continuous. However, it does not require redesign of
the extruder and would be more cost effective for the manufacturers. This thesis will
investigate what effects will be caused on the processed granules by using looping
method later in Chapter 4.
In fact, most pharmaceutical manufacturers still rely on batch-wise granulation
nowadays. Although continuous granulation provides several advantages, its development
is still in the early stage therefore the technique is not ready to meet FDA standard.
2.2.4 Motives of the thesis Agglomeration/granulation has been a critical processing technique in industries and
drawn much attention from academics in order to help understand the mechanisms.
However, granulation is a very complex process that it is still far from optimal control with
the current knowledge. Also, considering that continuous granulation is an important
process for the future PAT initiative from the FDA, this thesis aims to further investigate it
with various operating parameters (LS (Liquid-to-Solid) ratio, screw speed, viscosity,

27
processing time, screw configuration). Torque will be measured to help define the
relationships between operating parameters, granulation process and the properties of final
products.
A work on exploring the regime map for high-shear granulation has been recently
developed [1]. This thesis also aims to develop a new growth regime map for an extruder by
referring to the working matrix. Comparisons will be made between each other as well.
GSD (granule size distribution) will be the main property to represent the rate and extent of
material exchange.
28
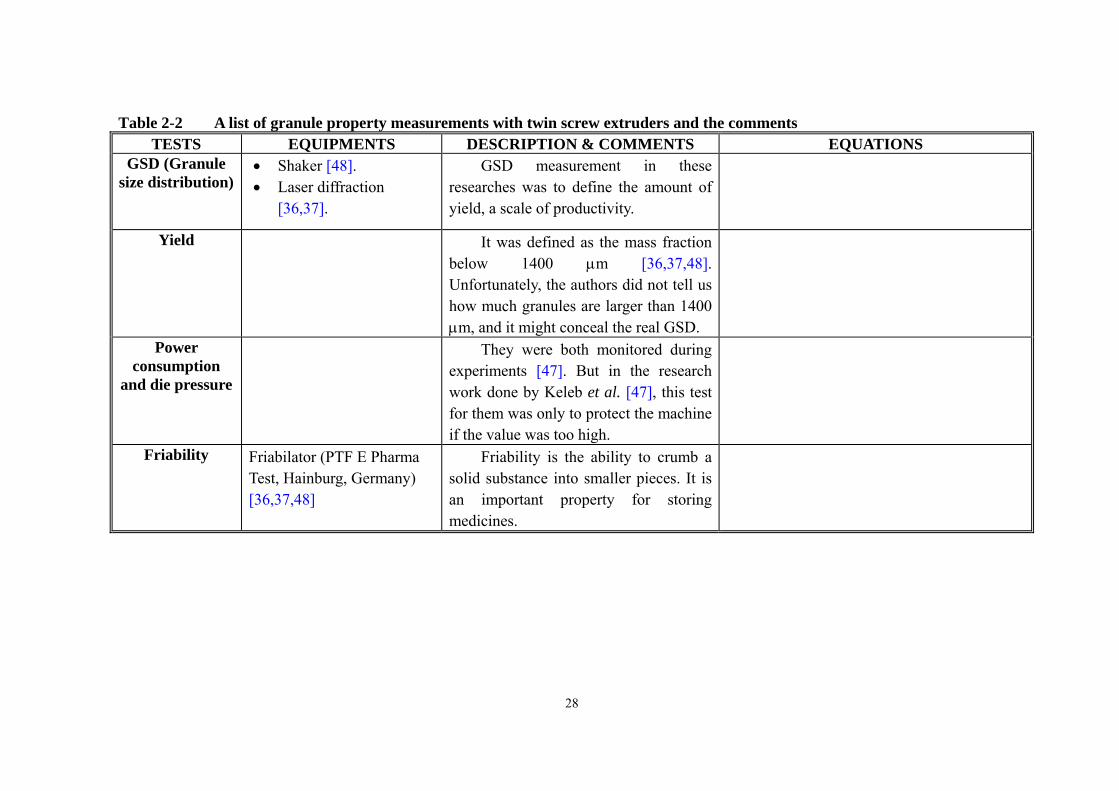
Table 2-2 A list of granule property measurements with twin screw extruders and the comments TESTS EQUIPMENTS DESCRIPTION & COMMENTS EQUATIONS
GSD (Granule size distribution)
• Shaker [48]. • Laser diffraction
[36,37].
GSD measurement in these researches was to define the amount of yield, a scale of productivity.
Yield It was defined as the mass fraction below 1400 μm [36,37,48]. Unfortunately, the authors did not tell us how much granules are larger than 1400 μm, and it might conceal the real GSD.
Power consumption
and die pressure
They were both monitored during experiments [47]. But in the research work done by Keleb et al. [47], this test for them was only to protect the machine if the value was too high.
Friability Friabilator (PTF E Pharma Test, Hainburg, Germany) [36,37,48]
Friability is the ability to crumb a solid substance into smaller pieces. It is an important property for storing medicines.
29
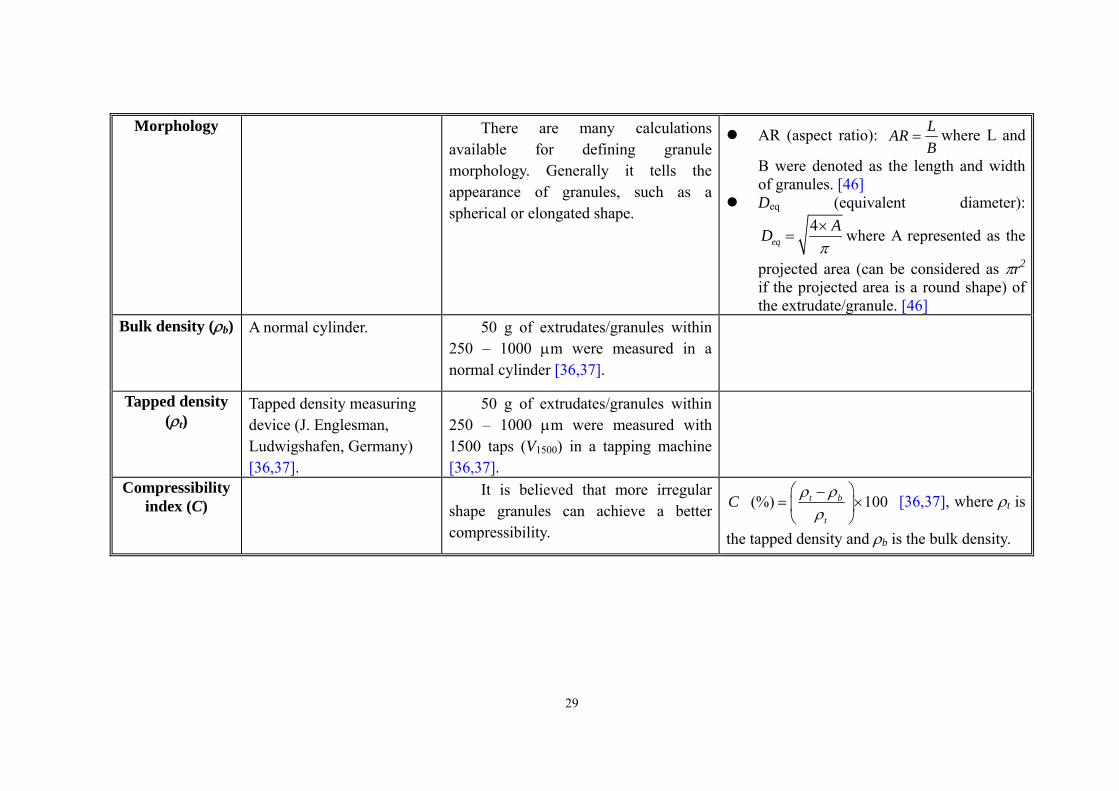
Morphology There are many calculations available for defining granule morphology. Generally it tells the appearance of granules, such as a spherical or elongated shape.
AR (aspect ratio): LARB
= where L and
B were denoted as the length and width of granules. [46]
Deq (equivalent diameter): 4
eqAD
π×
= where A represented as the
projected area (can be considered as πr2
if the projected area is a round shape) of the extrudate/granule. [46]
Bulk density (ρb) A normal cylinder. 50 g of extrudates/granules within 250 – 1000 μm were measured in a normal cylinder [36,37].
Tapped density (ρt)
Tapped density measuring device (J. Englesman, Ludwigshafen, Germany) [36,37].
50 g of extrudates/granules within 250 – 1000 μm were measured with 1500 taps (V1500) in a tapping machine [36,37].
Compressibility index (C)
It is believed that more irregular shape granules can achieve a better compressibility.
(%) 100t b
t
C ρ ρρ
⎛ ⎞−= ×⎜ ⎟
⎝ ⎠ [36,37], where ρt is
the tapped density and ρb is the bulk density.
30
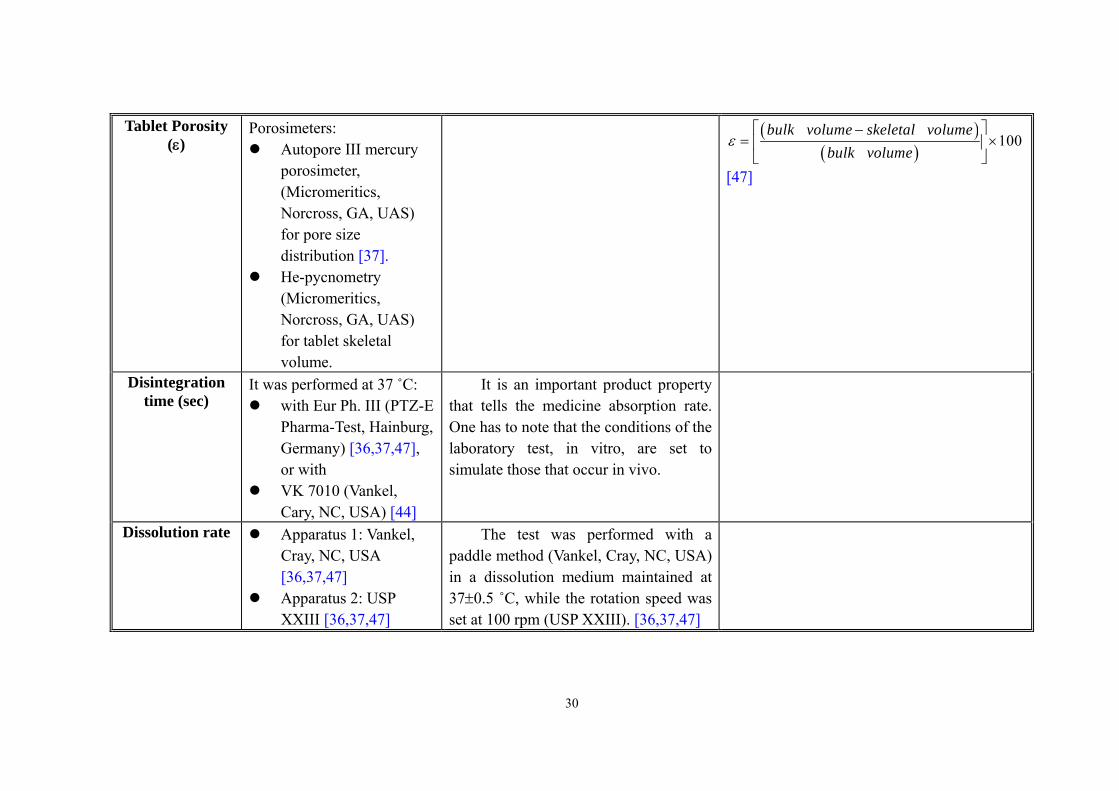
Tablet Porosity (ε)
Porosimeters: Autopore III mercury
porosimeter, (Micromeritics, Norcross, GA, UAS) for pore size distribution [37].
He-pycnometry (Micromeritics, Norcross, GA, UAS) for tablet skeletal volume.
( )( )
100ε⎡ ⎤−
= ×⎢ ⎥⎣ ⎦
bulk volume skeletal volumebulk volume
[47]
Disintegration time (sec)
It was performed at 37 ˚C: with Eur Ph. III (PTZ-E
Pharma-Test, Hainburg, Germany) [36,37,47], or with
VK 7010 (Vankel, Cary, NC, USA) [44]
It is an important product property that tells the medicine absorption rate. One has to note that the conditions of the laboratory test, in vitro, are set to simulate those that occur in vivo.
Dissolution rate Apparatus 1: Vankel, Cray, NC, USA [36,37,47]
Apparatus 2: USP XXIII [36,37,47]
The test was performed with a paddle method (Vankel, Cray, NC, USA) in a dissolution medium maintained at 37±0.5 ˚C, while the rotation speed was set at 100 rpm (USP XXIII). [36,37,47]
31
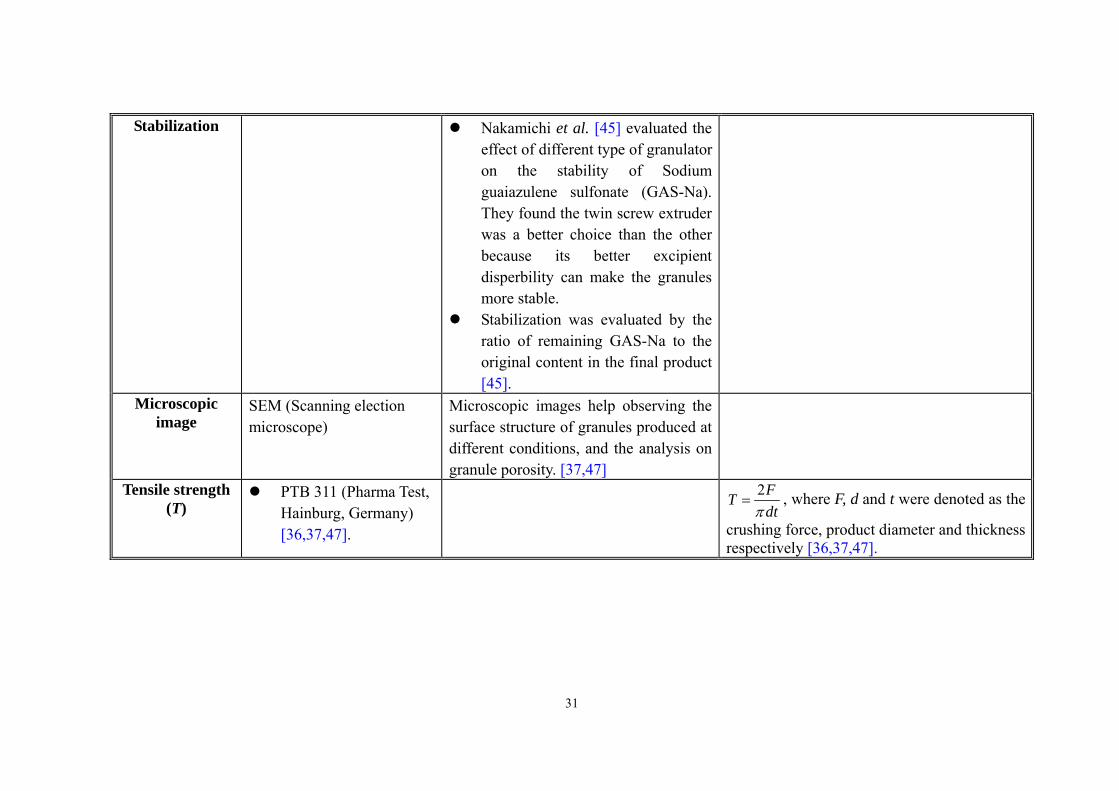
Stabilization Nakamichi et al. [45] evaluated the effect of different type of granulator on the stability of Sodium guaiazulene sulfonate (GAS-Na). They found the twin screw extruder was a better choice than the other because its better excipient disperbility can make the granules more stable.
Stabilization was evaluated by the ratio of remaining GAS-Na to the original content in the final product [45].
Microscopic image
SEM (Scanning election microscope)
Microscopic images help observing the surface structure of granules produced at different conditions, and the analysis on granule porosity. [37,47]
Tensile strength (T)
PTB 311 (Pharma Test, Hainburg, Germany) [36,37,47].
2FTdtπ
= , where F, d and t were denoted as the
crushing force, product diameter and thickness respectively [36,37,47].
32
Residence time distribution
(RTD)
Light Meter Type 213 (General Electric, Cleveland, OH, USA) [49]
COLOR METER IIIF (Minolta, Japan) [49]
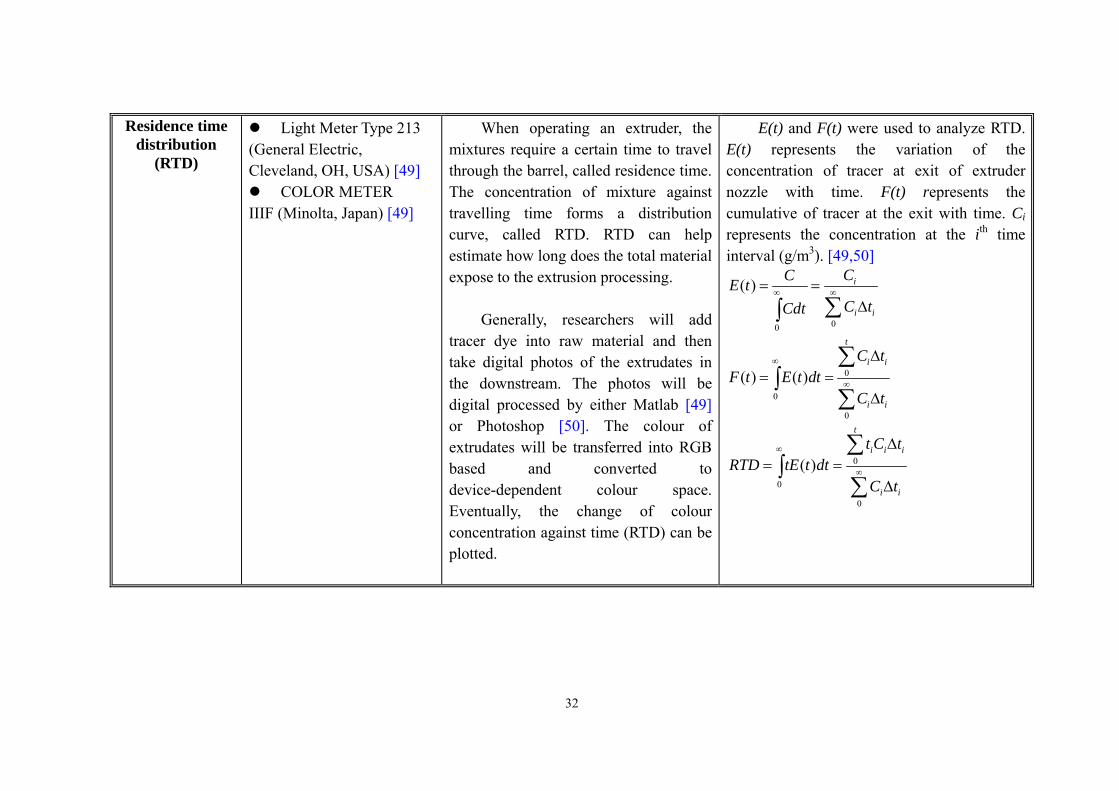
When operating an extruder, the mixtures require a certain time to travel through the barrel, called residence time. The concentration of mixture against travelling time forms a distribution curve, called RTD. RTD can help estimate how long does the total material expose to the extrusion processing.
Generally, researchers will add
tracer dye into raw material and then take digital photos of the extrudates in the downstream. The photos will be digital processed by either Matlab [49] or Photoshop [50]. The colour of extrudates will be transferred into RGB based and converted to device-dependent colour space. Eventually, the change of colour concentration against time (RTD) can be plotted.
E(t) and F(t) were used to analyze RTD. E(t) represents the variation of the concentration of tracer at exit of extruder nozzle with time. F(t) represents the cumulative of tracer at the exit with time. Ci represents the concentration at the ith time interval (g/m3). [49,50]
00
( ) i
i i
CCE tC tCdt
∞ ∞= =Δ∑∫
0
0
0
( ) ( )
t
i i
i i
C tF t E t dt
C t
∞
∞
Δ= =
Δ
∑∫
∑
0
0
0
( )
t
i i i
i i
t C tRTD tE t dt
C t
∞
∞
Δ= =
Δ
∑∫
∑
33
CHAPTER THREE
METHODOLOGY 3.1 Equipment 3.1.1 Co-rotating twin screw extruder
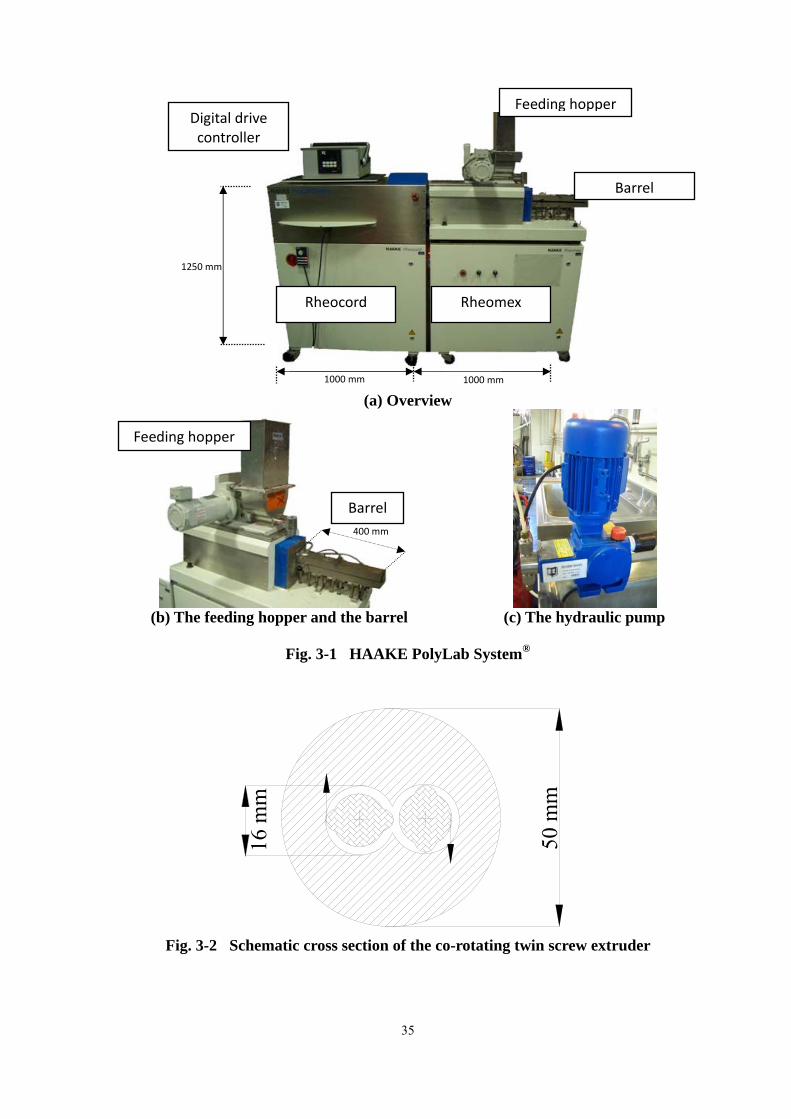
HAAKE PolyLab System PTW 25 (HAAKE®, USA) was employed in this research.
The system consists of four main parts as shown in Fig. 3-1: The Rheocord torque
rheometer, the Rheomex, a powder feeding system and a hydraulic pump:
Rheocord torque rheometer – The drive system It provides all functionality for driving and controlling the measuring sensors and
feeds back the signals to an external PC. It can be considered as the control centre for
the external PC;
Rheomex – The Twin Screw Extruder It makes use of two parallel screws which tightly intermesh and which turn in the
same rotational direction shown in Fig. 3-2. Their circumferential speeds are directed
in the opposite directions. The flight of one screw fits tightly into the screw channel of
the other and therefore one screw seals mass flow against the other screw.
A general category of the twin screw arrangements can be found in Eise et al. [51].
They classified the arrangements by considering (1) the relative rotating directions
(co-rotating or counter-rotating), (2) intermeshing (including fully intermeshing and
partially intermeshing) or non-intermeshing as well as (3) the engagement of screws
(lengthwise and crosswise closed; lengthwise and crosswise open; lengthwise open
34
and crosswise closed). According to this illustration [51], the type of screws employed
in this thesis falls mainly into the category: the fully intermeshing co-rotating twin
screw extruder with a lengthwise open and crosswise closed configuration. It is to say
the geometry wipe and clean each other, and allow the materials to transfer/exchange
in the longitudinal direction.
Powder feeding system A feeding hopper is installed above the barrel. It conveys dry and fresh powder
constantly to the inlet of the barrel. The feeding hopper is driven by a digital drive
controller – Digidrive® which is used to control feeding rate;
Hydraulic pump This pump is to steadily deliver liquid for granulation processes. There are three
multi-purpose barrel ports located evenly on the top side of the barrel. In this research,
liquid was pumped into the barrel through the injection port nearest to the feed port
(distance: 11 cm).
35
(a) Overview
(b) The feeding hopper and the barrel (c) The hydraulic pump
Fig. 3-1 HAAKE PolyLab System®
50 m
m
16 m
m
Fig. 3-2 Schematic cross section of the co-rotating twin screw extruder
Rheocord Rheomex
Digital drive controller
Feeding hopper
Barrel
Barrel
Feeding hopper
400 mm
1000 mm
1250 mm
1000 mm
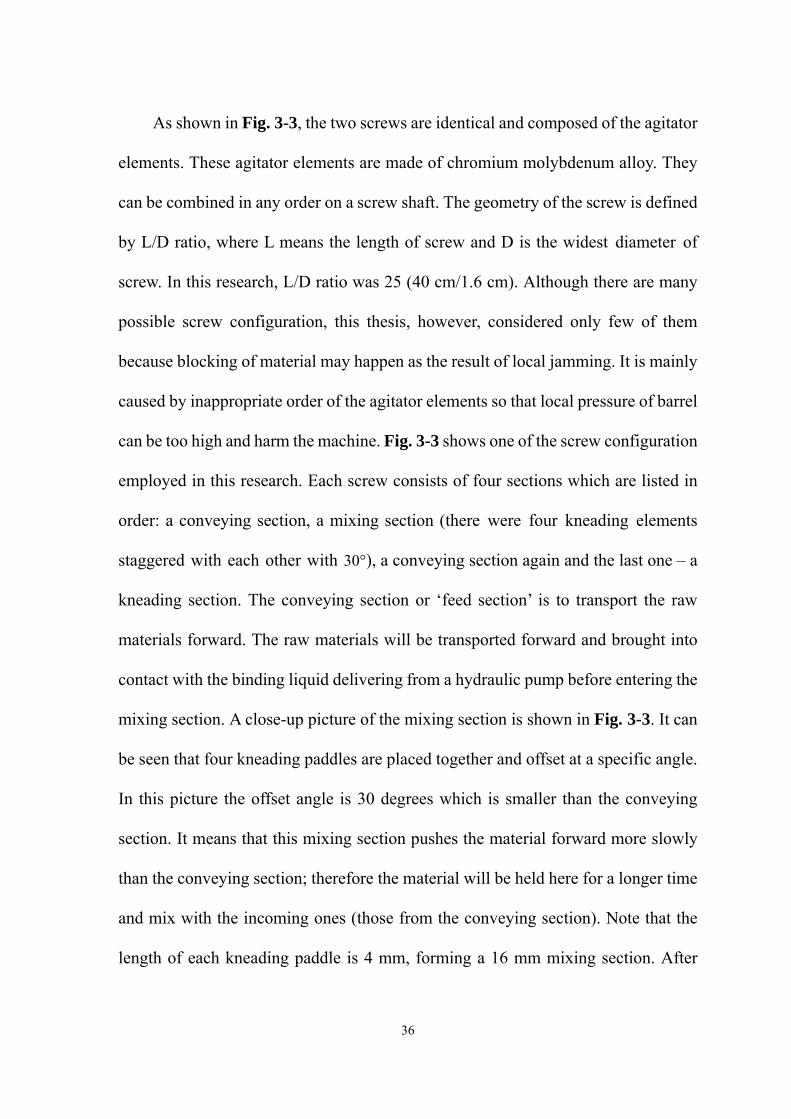
36
As shown in Fig. 3-3, the two screws are identical and composed of the agitator
elements. These agitator elements are made of chromium molybdenum alloy. They
can be combined in any order on a screw shaft. The geometry of the screw is defined
by L/D ratio, where L means the length of screw and D is the widest diameter of
screw. In this research, L/D ratio was 25 (40 cm/1.6 cm). Although there are many
possible screw configuration, this thesis, however, considered only few of them
because blocking of material may happen as the result of local jamming. It is mainly
caused by inappropriate order of the agitator elements so that local pressure of barrel
can be too high and harm the machine. Fig. 3-3 shows one of the screw configuration
employed in this research. Each screw consists of four sections which are listed in
order: a conveying section, a mixing section (there were four kneading elements
staggered with each other with 30°), a conveying section again and the last one – a
kneading section. The conveying section or ‘feed section’ is to transport the raw
materials forward. The raw materials will be transported forward and brought into
contact with the binding liquid delivering from a hydraulic pump before entering the
mixing section. A close-up picture of the mixing section is shown in Fig. 3-3. It can
be seen that four kneading paddles are placed together and offset at a specific angle.
In this picture the offset angle is 30 degrees which is smaller than the conveying
section. It means that this mixing section pushes the material forward more slowly
than the conveying section; therefore the material will be held here for a longer time
and mix with the incoming ones (those from the conveying section). Note that the
length of each kneading paddle is 4 mm, forming a 16 mm mixing section. After

37
mixing, the mixture will then be conveyed forward to the kneading section.
Kneading disks can be regarded as elements with 90 degree flight angles, which
implies that all flow induced by these elements is in the cross-channel or r direction
[52]. Finally the mixture will go through a die block installed in the end of the barrel.
Granules can be made by this process under certain operating conditions.
Fig. 3-3 The screws and the composing sections
3.1.2 Basic measurements In order to determine a proper range of LS ratio for the experiments, firstly it is
necessary to measure the mass flow rate of the dry powders and binder. The mass flow rates
Incoming materials
Conveying section Conveying section
Mixing section Kneading section

38
for dry powders and binder are shown in Fig. 3-4 (a) & (b). Note that dry powder flow rate
was measured at ambient humidity 78% and temperature 19.4 ˚C. In addition, as shown in
Fig. 3-4 (c), a compatible barrel screw speed must be determined as well to ensure a
constant material flow rate throughout experiments, and a consistent flow between the
feeding hopper and the barrel. There is an “unworking regime” shown in Fig. 3-4 (c),
indicating the barrel screw speed is too slow to carry the feeding powder from the feeding
hopper, and it will result in material accumulation in the barrel.

39
Pumping pressure (barg)0 5 10 15 20 25 30 35 40 45
Mas
s flo
w ra
te (g
/min
)
0
5
10
15
20
25
30
35
Deionized waterAqueous PEG 6k, 10%Aqueous PEG 6k, 20%Aqueous PEG 6k, 33%
(a) Binder mass flow rate
Feeder screw speed (rpm)0 250 500 750 1000
Mas
s flo
w ra
te (g
/min
)
0
10
20
30
40
50
MCC 102
(b) Dry powder mass flow rate (from the feeding hopper)
Barrel screw speed (rpm)0 50 100 150 200 250 300
Tota
l mas
s flo
w ra
te (g
/min
)
0
10
20
30
40
50
Feeding hopper: 250 rpmFeeding hopper: 500 rpmFeeding hopper: 750 rpmFeeding hopper: 1000 rpm
Unworking regime
(c) Dry powder mass flow rate (feeding hopper + barrel)
Fig. 3-4 Basic measurements for the co-rotating twin screw extruder

40
3.2 Materials 3.2.1 Microcrystalline cellulose (MCC) 102
“Cellulose” is a natural product that can be derived from wood pulp and formed into
sheets. The individual fibres are then mechanically broken up into small pieces and this
process transfers the cellulose into free-flowing powders. However, it is still poor on the
fluidity and compressibility until an important modification is applied, which is the
isolation of the crystalline part of the cellulose fibre chain. Microcrystalline cellulose
(product name: Avicel) is the product made by following this method. There are two most
common grades in the market: PH101 and PH102. PH101 is the original product while PH
102 is more agglomerated and larger, resulting in slightly better fluidity but with no
significant decrease in compressibility [53].
In this research, MCC Avicel 102 (Microcrystalline Cellulose, Avicel PH 102) was
employed, considering its physical properties of being inert and odourless, and unique
agglomeration characteristics. It was purchased from FMC BioPolymer (USA). The
average particle size was measured by X-ray diffraction technique (Sympatec GmbH, UK)
and as shown in Fig. 3-5 that the d50 of MCC 102 was 125.3 μm.

41
Fig. 3-5 Size measurement of MCC 102
3.2.2 Polyethylene glycol 6000 (PEG 6k) PEG is available over wide range of products depending on its molecular weight from
300g/mol to 10,000,000 g/mol. The higher the molecular weight is, the higher melting point
would be. It is commonly seen in dosage forms because of its low toxicity as well as it can
regulate the dissolving time by choosing the molecular weights. In this research, PEG 6k
(6000 g/mol), a moderate molecular weight found in literatures, was chosen to be the binder
material. It was dissolved in deionized water and the concentration was 33%, making the
aqueous solution of PEG 6k. The viscosity was 0.0324 Pas at 25˚C (Advanced rheometer
AR 1000, TA instrument).
42
3.3 Experimental processes
In order to reach a consistent mass flow rate, MCC 102 was firstly conveyed from the
feeding hopper through the barrel for 10 minutes, and aqueous PEG 6k 33% was pumped
for 10 minutes before connecting to the barrel. Adjust the feeding speeds of the feeding
hopper and the barrel respectively to be as consistent as possible, so that material
accumulation can be avoided. It is imperative to set the feeding rate of feeding hopper
slower than the barrel. Switch on the multi-monitoring program in the control PC, and set
the extruder in the manual-control mode. The program is to control and monitor the barrel
screw speed, and in the mean time, it can record the real time torque for post analysis.
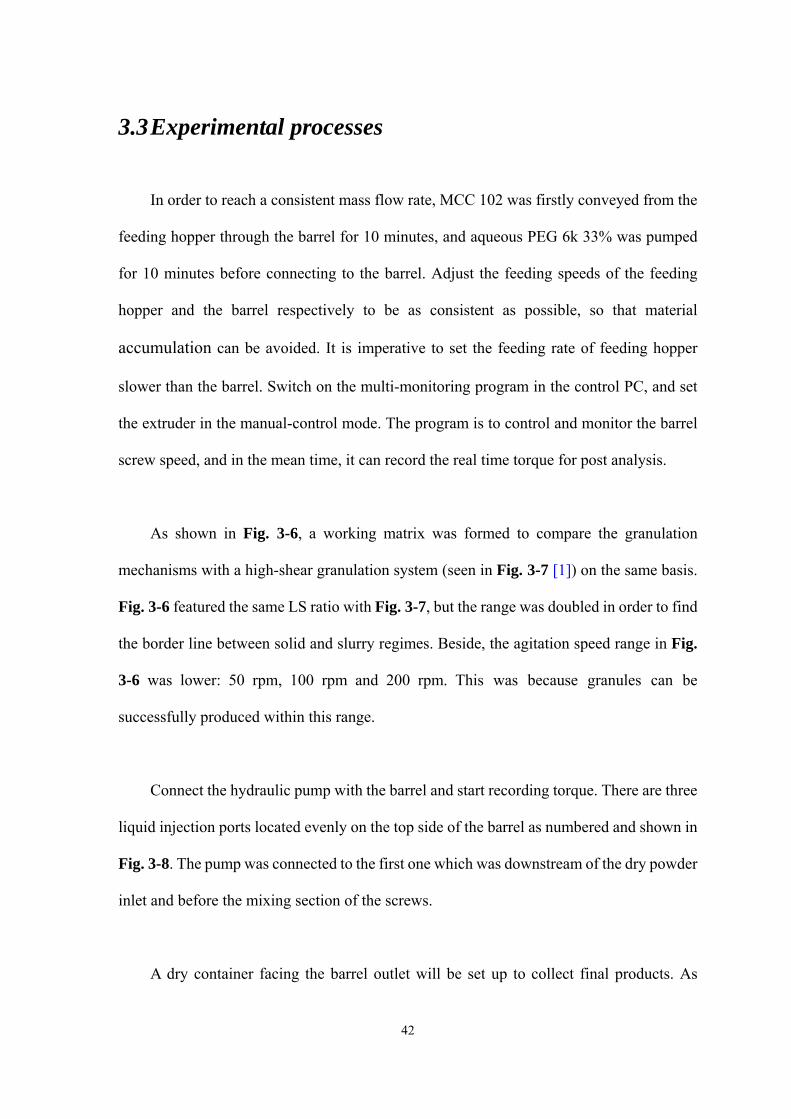
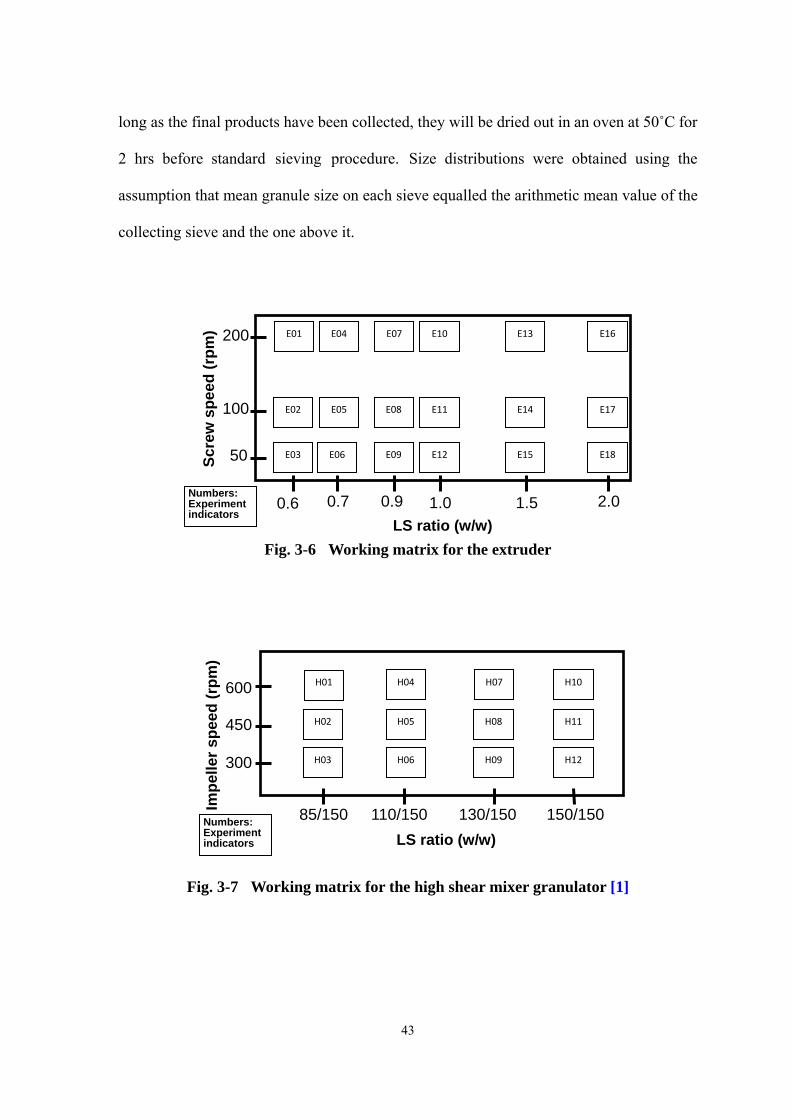
As shown in Fig. 3-6, a working matrix was formed to compare the granulation
mechanisms with a high-shear granulation system (seen in Fig. 3-7 [1]) on the same basis.
Fig. 3-6 featured the same LS ratio with Fig. 3-7, but the range was doubled in order to find
the border line between solid and slurry regimes. Beside, the agitation speed range in Fig.
3-6 was lower: 50 rpm, 100 rpm and 200 rpm. This was because granules can be
successfully produced within this range.
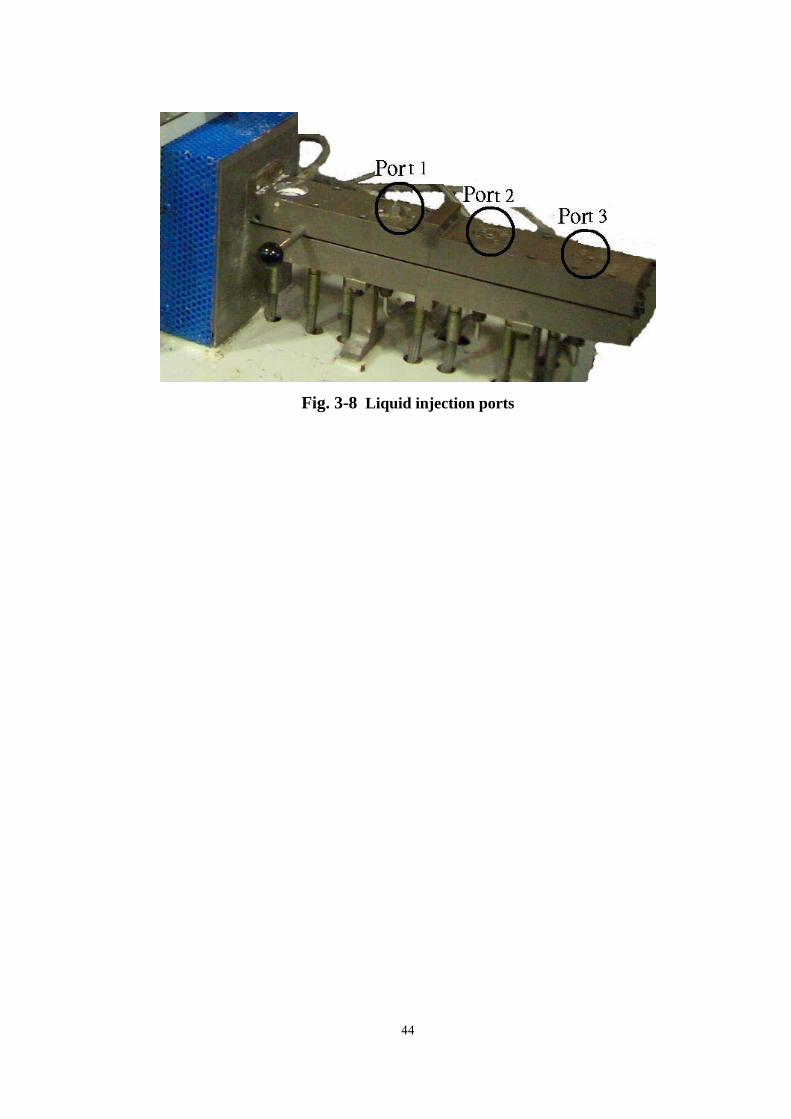
Connect the hydraulic pump with the barrel and start recording torque. There are three
liquid injection ports located evenly on the top side of the barrel as numbered and shown in
Fig. 3-8. The pump was connected to the first one which was downstream of the dry powder
inlet and before the mixing section of the screws.
A dry container facing the barrel outlet will be set up to collect final products. As
43
long as the final products have been collected, they will be dried out in an oven at 50˚C for
2 hrs before standard sieving procedure. Size distributions were obtained using the
assumption that mean granule size on each sieve equalled the arithmetic mean value of the
collecting sieve and the one above it.
Fig. 3-6 Working matrix for the extruder
Fig. 3-7 Working matrix for the high shear mixer granulator [1]
Impe
ller s
peed
(rpm
)
600
450
300
85/150 110/150 130/150 150/150
H01
H02
H03
H04
H05
H06
H07
H08
H09
H10
H11
H12
LS ratio (w/w)Numbers: Experiment indicators
Scre
w s
peed
(rpm
)
Numbers:Experiment indicators
200
100
50
0.6 0.7 0.9
E01
E02
E03
E04
E05
E06
E07
E08
E09
E10
E11
E12
LS ratio (w/w)1.5
E13
E14
E15
1.0
E18
E17
E16
2.0
44
Fig. 3-8 Liquid injection ports
45
CHAPTER FOUR RESULTS AND DISCUSSION
4.1 GSD and the growth regime map
By using the geometry of short single mixing section (shown in Fig. 3-3), the GSD of
each operating conditions were measured and plotted in Fig. 4-1 featured with log aperture
(μm) in x-axis and mass fraction/delta log aperture (μm-1) in y-axis. Except for the
extrudate regime where the system was too wet and the mixture was like paste, the GSD on
the rest of the working matrix was found very poor in terms of uniformity. The effect of LS
ratio was only obvious at the higher screw speeds (100 and 200 rpm) as these GSD were
gradually transferred from bimodal to monomodal from LS = 0.6 to 1.5. Large extent of
fines were found in low LS ratio (LS = 0.6 & 0.7) due to lack of binder in the system. For all
the operating conditions in Fig. 4-1, granules can be produced regardless of the GSD
uniformity; therefore the growth regime here was named: granulation.
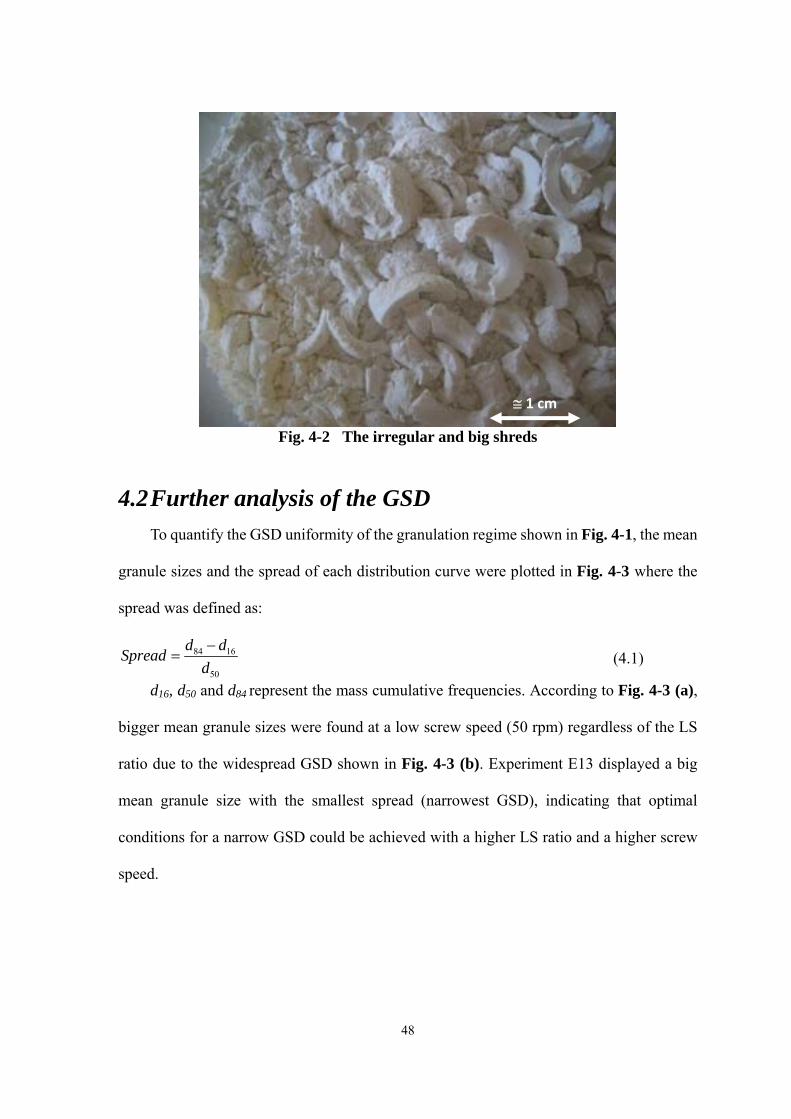
When the screw speed was at 50 rpm, all the samples contained a lot of “irregular and
big” shreds regardless of LS ratio. These shreds are shown in Fig. 4-2. The big shreds were
deduced to be directly released from the mixing section or kneading section as they looked
similar to the screw geometry. Because of the “irregular and big” shreds, the GSD at 50 rpm
were found widespread and multi distributed.
While increasing the screw speed, the GSDs were found to be more uniform at higher

46
LS ratios (LS = 0.9, 1.0 & 1.5). It was presumably because vigorous rotating speed could
help narrow the GSD. However, it is still unclear whether the mechanisms are to break up
lumps or to promote binder distribution among granules.

47
200
rpm
1.8 2.1 2.4 2.7 3.0 3.3 3.60
50
100
150
1 8 2 1 2 4 2 7 3 0 3 3 3 60
50
100
150
200
1.8 2.1 2.4 2.7 3.0 3.3 3.60
50
100
1501.8 2.1 2.4 2.7 3.0 3.3 3.6
0
50
100
150
1.8 2.1 2.4 2.7 3.0 3.3 3.60
50
100
150
1.8 2.1 2.4 2.7 3.0 3.3 3.60
50
100
150
200
1.8 2.1 2.4 2.7 3.0 3.3 3.60
50
100
150
1.8 2.1 2.4 2.7 3.0 3.3 3.60
50
100
150
1.8 2.1 2.4 2.7 3.0 3.3 3.60
50
100
150
200
1.8 2.1 2.4 2.7 3.0 3.3 3.60
50
100
150
1.8 2.1 2.4 2.7 3.0 3.3 3.60
50
100
150
1.8 2.1 2.4 2.7 3.0 3.3 3.60
50
100
150
200
1.8 2.1 2.4 2.7 3.0 3.3 3.60
50
100
150
200
1.8 2.1 2.4 2.7 3.0 3.3 3.60
50
100
150
1.8 2.1 2.4 2.7 3.0 3.3 3.60
50
100
150
1.8 2.1 2.4 2.7 3.0 3.3 3.60
50
100
150
200
1.8 2.1 2.4 2.7 3.0 3.3 3.60
50
100
150
1.8 2.1 2.4 2.7 3.0 3.3 3.60
50
100
150
Extrudates
Extrudates
Extrudates
100
rpm
50
rp
m
LS = 0.6 LS = 0.7 LS = 0.9 LS = 1.0 LS = 1.5 LS = 2.0
Fig. 4-1 The growth regime map for the extruder with a short single mixing section. Powder: MCC PH 102, Binder: aqueous PEG
6k 33%
48
Fig. 4-2 The irregular and big shreds
4.2 Further analysis of the GSD
To quantify the GSD uniformity of the granulation regime shown in Fig. 4-1, the mean
granule sizes and the spread of each distribution curve were plotted in Fig. 4-3 where the
spread was defined as:
84 16
50
d dSpreadd−
= (4.1)
d16, d50 and d84 represent the mass cumulative frequencies. According to Fig. 4-3 (a),
bigger mean granule sizes were found at a low screw speed (50 rpm) regardless of the LS
ratio due to the widespread GSD shown in Fig. 4-3 (b). Experiment E13 displayed a big
mean granule size with the smallest spread (narrowest GSD), indicating that optimal
conditions for a narrow GSD could be achieved with a higher LS ratio and a higher screw
speed.
≅ 1 cm

49
(a) Mean granule size (b) Spread
Fig. 4-3 Further analysis of the GSD
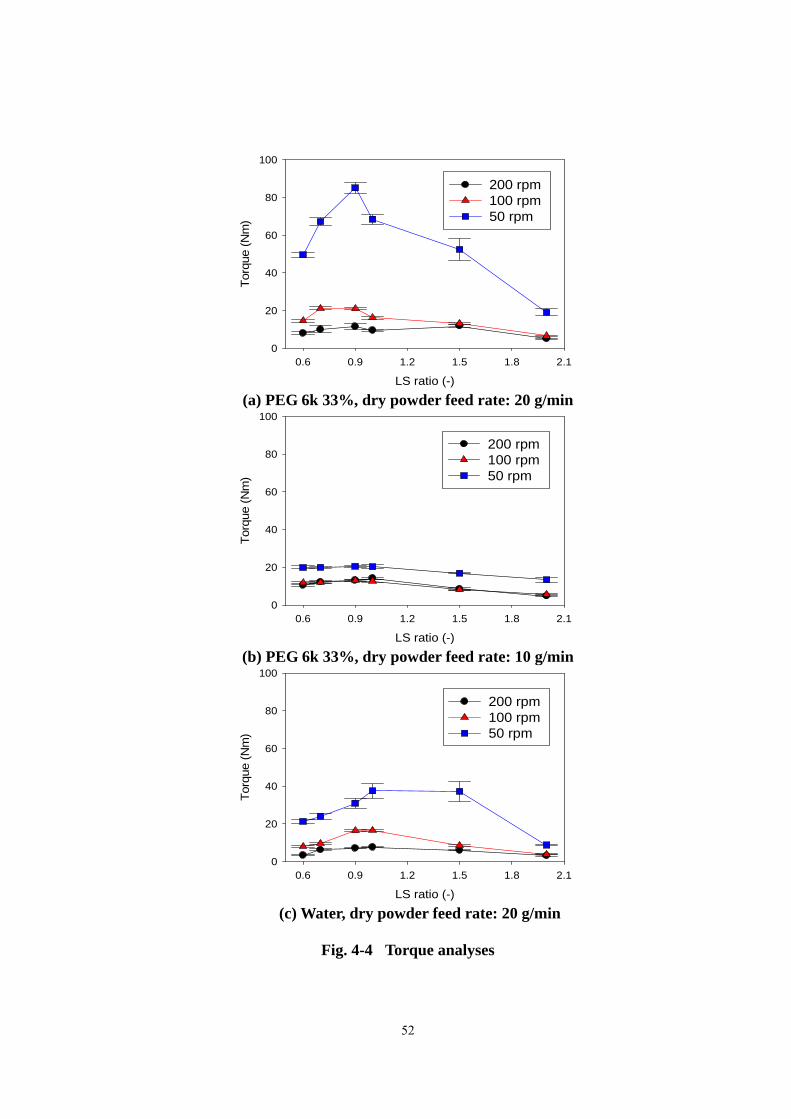
4.3 The effects of screw speed, LS ratio and binder
viscosity on torque When either different screw speed and/or LS ratio was applied, it will change the
amount of material filled in barrel and the wall friction force (between the mixtures and the
inner wall of barrel). Therefore, understanding the effects would be helpful for both the
equipment performance and the granulation mechanisms.
Fig. 4-4 (a) was obtained with the dry powder feed rate at 20 g/min. The torque was
found a function of LS ratio regardless of the screw speed. With the increase of LS ratio, the
torque was kept rising until a critical value (LS = 0.9) and then became lower again. It
implies that increasing LS ratio can result in a higher fill level so that it needs more work to
rotate the screws. However, in the mean time, Fig. 4-4 (a) also shows that the torque
decreases again while adding more binder into the system. It implies that either the binder is
like lubricant or the binder enhances the flowability of the mixture. Thus it is necessary to
investigate the effect of fill level on Fig. 4-3 (b) (see later part of Section 4.3).

50
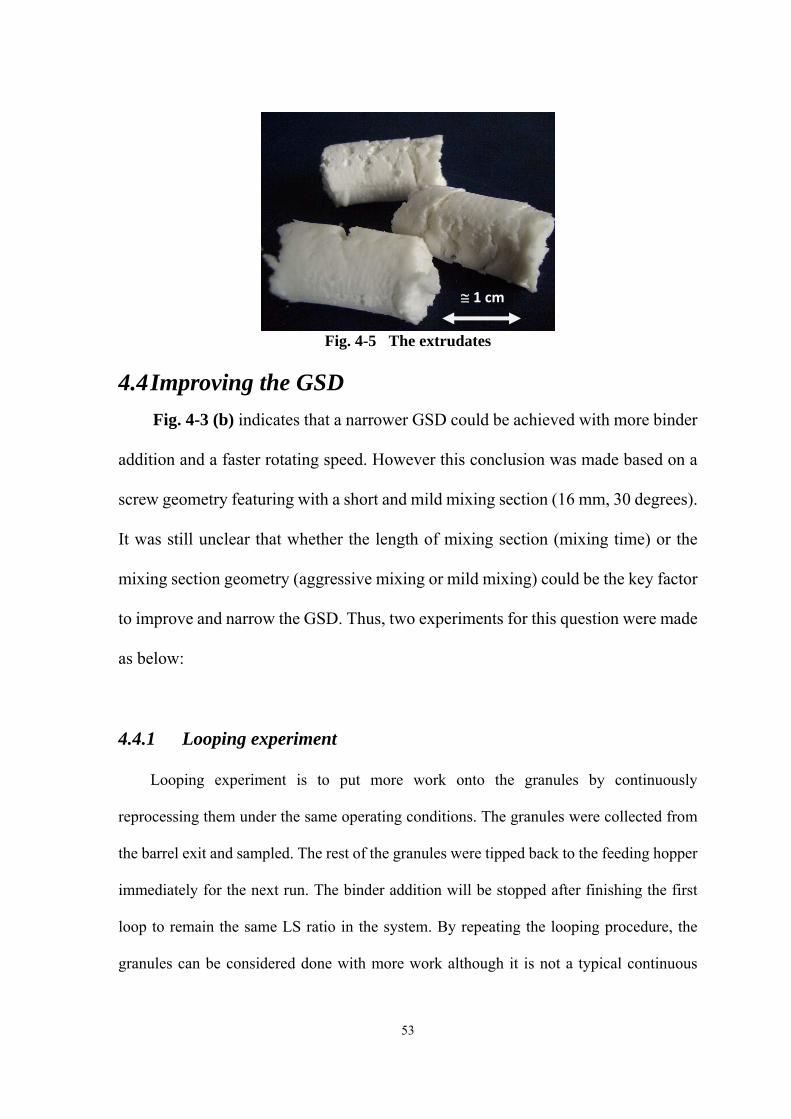
While the mixture was at LS = 2.0, it seemed that the amount of binder was too much,
because the corresponding torque for each rotating screw speed was found very low and
very similar regardless of the screw speed, and extrudates (Fig. 4-5) can be observed
instead of granules. It suggested that a border line distinguishing granules and extrudates
(over-wetted state) should locate between LS = 1.5 and 2.0. The twin screw extruder in this
study can still produce granules at LS = 1.0 in which the ratio that the uncontrollable
growth (granule size increases too quickly to measure and soon exceeds the resolution of
sieves) can occur in the high shear mixer. It was probably because the barrel has
constrained the size of granules so that the granule size will never go uncontrollably large.
In order to find out the effect of fill level and the relationship between fill level, screw
speed and LS ratio, half amount of feeding materials (the dry powder & the binder) was
reduced. The corresponding torque was shown in Fig. 4-4 (b). It can be observed that all the
torque become very low and they are independent of different LS ratio. According to Fig.
3-4 (b), higher screw speed is supposed to convey more materials in the same time. But the
torque in Fig. 4-4 (b) shows no significant difference between each screw speed. Therefore,
in general, the effect of fill level caused by screw speed can be only seen obvious when it
reaches a critical value, where contact force (friction force) can take place between the
materials and the inner wall of barrel. Besides, the effect of LS ratio on torque is dependent
on the fill level caused by different screw speeds.
Except for the effects of fill level, the effect of binder viscosity was also studied by
using a less viscous binder – deionized water. As shown in Fig. 4-4 (c), the amount of

51
feeding materials was kept the same with Fig. 4-4 (a), but it can be seen that the torque
becomes lower. Since the fill level remains the same with Fig. 4-4 (a) except for different
mixture rheology, it is reasonable to assume the low torque was mainly caused by the
addition of water, a binder that is less viscous than aqueous PEG 6k. In fact, the mixture
rheology is very complicated. It can be affected by applied stress, working temperature and
so on. It is necessary to investigate the relationship of mixture properties and torque in the
future.
52
LS ratio (-)0.6 0.9 1.2 1.5 1.8 2.1
Torq
ue (N
m)
0
20
40
60
80
100
200 rpm 100 rpm 50 rpm
(a) PEG 6k 33%, dry powder feed rate: 20 g/min
LS ratio (-)0.6 0.9 1.2 1.5 1.8 2.1
Torq
ue (N
m)
0
20
40
60
80
100
200 rpm 100 rpm 50 rpm
(b) PEG 6k 33%, dry powder feed rate: 10 g/min
LS ratio (-)0.6 0.9 1.2 1.5 1.8 2.1
Torq
ue (N
m)
0
20
40
60
80
100
200 rpm 100 rpm 50 rpm
(c) Water, dry powder feed rate: 20 g/min
Fig. 4-4 Torque analyses
53
Fig. 4-5 The extrudates
4.4 Improving the GSD Fig. 4-3 (b) indicates that a narrower GSD could be achieved with more binder
addition and a faster rotating speed. However this conclusion was made based on a
screw geometry featuring with a short and mild mixing section (16 mm, 30 degrees).
It was still unclear that whether the length of mixing section (mixing time) or the
mixing section geometry (aggressive mixing or mild mixing) could be the key factor
to improve and narrow the GSD. Thus, two experiments for this question were made
as below:
4.4.1 Looping experiment
Looping experiment is to put more work onto the granules by continuously
reprocessing them under the same operating conditions. The granules were collected from
the barrel exit and sampled. The rest of the granules were tipped back to the feeding hopper
immediately for the next run. The binder addition will be stopped after finishing the first
loop to remain the same LS ratio in the system. By repeating the looping procedure, the
granules can be considered done with more work although it is not a typical continuous
≅ 1 cm
54
process. The advantage of this attempting approach is that more work can be done without
elongating the length of the barrel. Another method to put more work onto granules is to use
any screw geometry (usually aggressive in mixing) that can lead to high torque. This can
save the time that has been spent on looping. Note that the effects of different geometry
would represent other dominating mechanisms and will be studied in Section 4.4.2.
Three experiments (experiments E07, E10 & E13) from the extruder working matrix -
Fig. 3-6 were chosen considering the suggestions from Fig. 4-3 (b). 10 loops were
processed and the samples were collected at the end of each loop. These samples were then
dried out in an oven at 50˚C for 2 hrs before sieving. Fig. 4-6 shows the GSD evolution in
each condition. It is very clear that in the first loop of each condition, LS ratio has a strong
effect on the GSD, which is in accordance with Fig. 4-1.
Regardless of the LS ratio, all the GSDs in Fig. 4-6 were found to be more constant
and uniform with time. Fig. 4-7 (a) compares the change of mean granule sizes of Figs.
4-6 (a), (b) and (c). The mean granule size (dmgs) was obtained by following eq. (4.2):
1
1
( )n
i imgs
i t
w ddw
−
=
×= ∑ (4.2)
where n is the number of sieves including a receiver (sievei=1), for which the aperture size
is 0 μm. wi is the weight of granules collected by sievei and wt is the total weight summed
up from sievei=1 to sievei=n-1. di represents the mean diameter of the collecting sieve and
the one above. The granules collected by the largest sieve (sievei=n) will be ignored in
calculation, because the mean granule diameter of those granules is unknown.
It shows that the mean granule size is mainly dependent on the LS ratio for the first

55
loop, but this effect becomes less significant since the average sizes were down to a
constant and tight range. It is interesting to compare this growth behaviour with the
typical growth behaviour in high-shear granulation, where the mean granule size is
usually increased from small towards big. When using an extruder to make granules, all
the granules are produced via a processing barrel. It means that the granule growth will be
constrained by the size of the barrel, and the final granule size cannot be larger than the
screw channel. For a high-shear mixer granulator, the only geometric constraint on
granules is the working vessel itself. Thus it allows a continuous size enlargement process
until the granules are unable to sustain further impact forces.
The changes of each size frequency are displayed in Figs. 4-7 (b), (c) and (d) which
are d16, d50 and d84 respectively. These figures coincide with Figs. 4-6 and 4-7 (a) that the
size distributions were very poor at the first loop, particularly at LS = 1.5 where many ‘big
and irregular shreds’ (Fig. 4-2) were found.
The exerted work per unit mass was obtained by dividing the total work with the total
mass as shown below, where W is work, F is force, s is displacement, r is radius, θ is radian
and w is angular velocity. Thus the heat loss became zero and the effect of residence time
can be ignored. Another simplification is to calculate it with average torque.
dW Fds Frd Torque dθ θ= = = (4.3 a) dW Torque dθ=∫ ∫ (4.3 b)
( )2 sec60
W Torque Torque w timeπθ ⎛ ⎞= × = × × ×⎜ ⎟⎝ ⎠ (4.3 c)
( )2 sec60
Torque w time
Total mass
π⎛ ⎞× × ×⎜ ⎟⎝ ⎠
(unit: kJ/g)
(4.3 d)
56
Figs. 4-6 to 4-8 confirm that prolonging the processing time can achieve a uniform
GSD regardless of the LS ratio. It suggests that a longer mixing time could be one option to
improve the uniformity of GSD. It was noted that while Fig. 4-8 showed that more work
had been done at a lower LS ratio, no significant effect of the higher work was observed in
respect of average granule size and GSD. One possible reason is that lack of binder resulted
in higher torque so that the total work was consequently higher (see eq. (4.3 c)). More work
done to the granules seemed to be an ideal method to achieve uniform GSD but it is unable
to continuously increase the final granule size like high shear mixers due to the fixed barrel
size. In addition, the work shown in Fig. 4-8 was found increased loop by loop gradually.
It was probably because the granules were dried out with the absence of air so that the
comparison between the works done in each loop will not be the same.
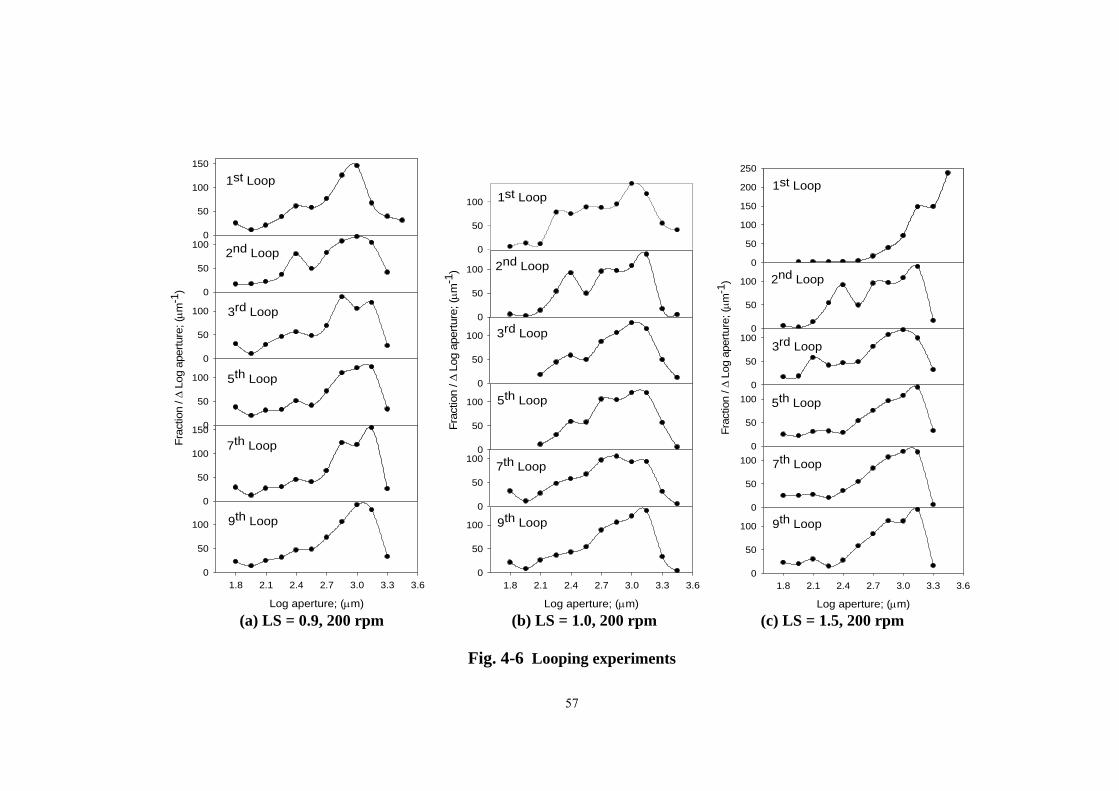
57
0
50
100
150
0
50
100
Frac
tion
/ Δ L
og a
pertu
re; (
μ m-1
)
0
50
100
0
50
100
0
50
100
150
Log aperture; (μm)
1.8 2.1 2.4 2.7 3.0 3.3 3.60
50
100
1st Loop
2nd Loop
3rd Loop
5th Loop
7th Loop
9th Loop
0
50
100
0
50
100
Frac
tion
/ Δ L
og a
pertu
re; (
μ m-1
)
0
50
100
0
50
100
0
50
100
Log aperture; (μm)
1.8 2.1 2.4 2.7 3.0 3.3 3.60
50
100
1st Loop
2nd Loop
3rd Loop
5th Loop
7th Loop
9th Loop
0
50
100
150
200
250
0
50
100
Frac
tion
/ Δ L
og a
pertu
re; (
μ m-1
)
0
50
100
0
50
100
0
50
100
Log aperture; (μm)
1.8 2.1 2.4 2.7 3.0 3.3 3.60
50
100
1st Loop
2nd Loop
3rd Loop
5th Loop
7th Loop
9th Loop
(a) LS = 0.9, 200 rpm (b) LS = 1.0, 200 rpm (c) LS = 1.5, 200 rpm
Fig. 4-6 Looping experiments

58
Loops (-)0 1 2 3 4 5 6 7 8 9 10
Mea
n gr
anul
e si
ze (μ
m)
0
500
1000
1500
2000
2500
3000
200 rpm, LS = 0.9200 rpm, LS = 1.0 200 rpm, LS = 1.5
(a) The change of mean granule size
(b) The change of d16 (c) The change of d50
Loops (-)0 2 4 6 8 10
d 84 (μ
m)
0500
10001500200025003000 200 rpm, LS = 0.9
200 rpm, LS = 1.0200 rpm, LS = 1.5
(d) The change of d84
Fig. 4-7 The change of the mean granule size and each size frequency
Loops (-)0 2 4 6 8 10
d 50 (μ
m)
0500
10001500200025003000 200 rpm, LS = 0.9
200 rpm, LS = 1.0200 rpm, LS = 1.5
Loops (-)0 2 4 6 8 10
d 16 (μ
m)
0500
10001500200025003000 200 rpm, LS = 0.9
200 rpm, LS = 1.0200 rpm, LS = 1.5

59
Fig. 4-8 The work exerted on the granules with the short single mixing section
4.4.2 Long single mixing section Instead of the short single mixing section (16 mm and 30 degrees), a four times longer
length of mixing section (64 mm and 30 degrees) was replaced. It was to reproduce looping
effect by processing the mixture for longer time in a single pass. The operating conditions
remained the same with Section 4.1.
As shown in Fig. 4-9, a longer mixing section resulted in a very different GSD across
the matrix comparing to Fig. 4-1 and formed another regime map. Generally, three main
regimes in Fig. 4-9 were recognised: granulation, extrudates and blocked regimes. For the
regime of granulation, the GSD were still strongly dependent of LS ratio regardless of the
screw speed. The peaks of the GSD were shifted from left to right with the increase of liquid
addition. Also, higher screw speed was found helpful to narrow the GSD, because the big

60
and irregular shreds can be avoided. Fig. 4-10 is the torque of granulation regime of this
geometry. It is very similar to Fig. 4-4 (a) although the length of mixing section has been
elongated to four times of the short one. This implies that high torque was caused by local
jamming occurred within the barrel. The degree of local jamming can be increased by either
low screw speed or high filling capacity. And when it exceeds a critical value, blocked
regime may be observed.
In this thesis, the blocked regime was defined as followed: if the extruder encountered
a high torque (>175 Nm), it will automatically shut down to protect the drive system and
screws. This behaviour was found when the system was at 50 rpm, except for the over
wetted state: LS = 2.0 where the mixture acted like a paste. When more liquid was added at
the system of 50 rpm, the screws started rotating again and the system exhibited the
extrudate behaviour because the over wetted materials cannot make granules but extrudates.
If the screw speed in the extrudates behaviour was increased to 200 rpm (E13 in Fig. 3-6),
granules were produced instead of extrudates. In high shear granulation, the effect of
rotating speed remains minor until enough binder presents in the system. However when the
twin screw extruder was at high LS (LS = 1.5 and 2.0), the effect of high speed on granule
size was not as significant as high shear mixers and was only observed between
experiments E14 & E13. It was presumably because the consolidation achieved by the twin
screw extruder is less than the high shear mixer in which higher LS can be tolerated and
may even be required, unless a very high fill level presents in the twin screw extruder so that
the mixture can be better consolidated.
Hypothetically, when the materials are added into the barrel, they have to be conveyed
through all the sections within the barrel. Take this research for example; the mixture has to
61
travel through a conveying section, mixing section, conveying section and finally a
kneading section. Considering that the mixture is only rolled forward by the conveying
section, a significant mixing can only occur in the mixing section. While the mixture stays
in the mixing section, it will be slowly conveyed forward, thus the material can be
accumulated and therefore mixed with the upcoming materials. Consequently, the local fill
level will be increased, leading to a material consolidation stage, until the incoming mixture
arrives and expels the consolidated mixture to the next section - kneading, a section that
only provides consolidation.
Based on this hypothesis, the big and irregular shreds from 50 rpm & short single
mixing section in Fig. 4-1 were possibly caused by the over-consolidation (very high fill
level). Sequentially, a high fill level can cause a high torque. This became more significant
with a long single mixing section and therefore led the extruder being blocked (blocked
regime in Fig. 4-9), until the screw speed was raised to 100 and 200 rpm.
As seen in Fig. 4-10, the torque in the longer-mixing-section extruder is obviously
higher than the case of short single mixing section (Fig. 4-4 (a)). Although the length of
the mixing section has been elongated by four times, the torque however was only about
two times higher. This means the relationship between length of mixing section and torque
is not linear and it will be worthy of further research on this relationship in the future. In
addition, the effect of LS ratio on torque was the same with Fig. 4-4 (a) that binder addition
can result in a higher torque until reaching a critical amount. And, high screw speed (low fill
level) led to low torque due to insufficient friction forces.
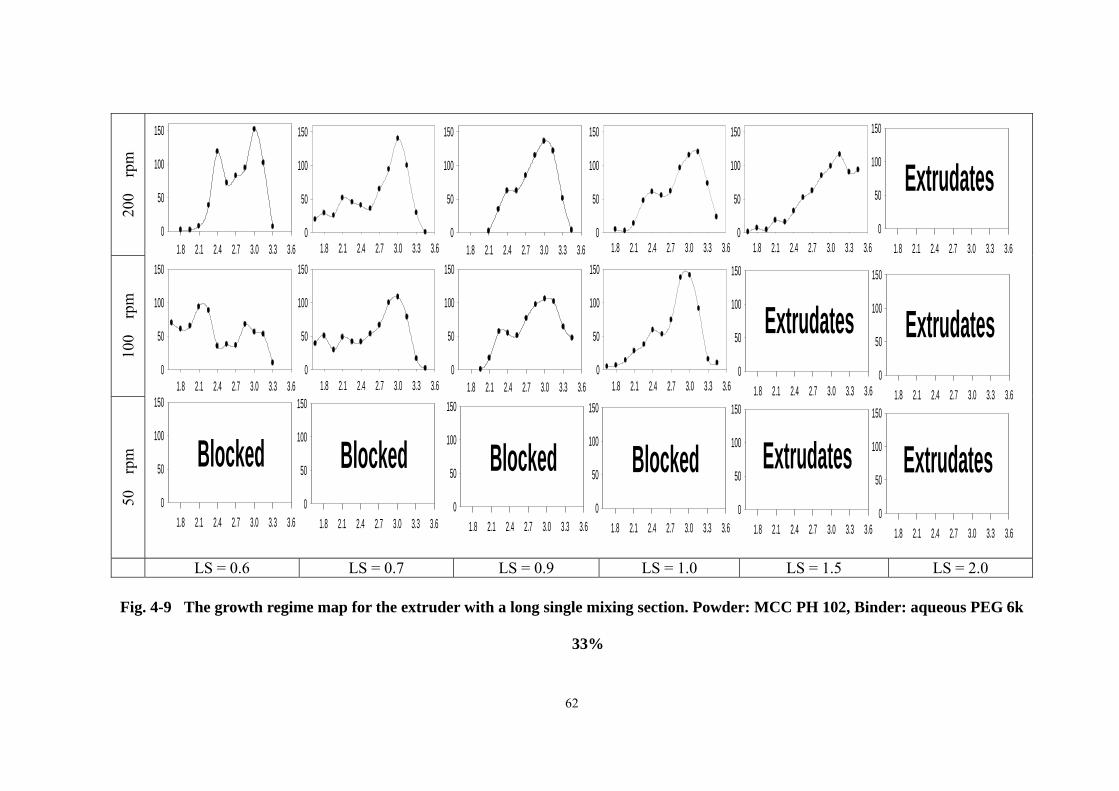
62
200
rpm
1.8 2.1 2.4 2.7 3.0 3.3 3.60
50
100
150
1.8 2.1 2.4 2.7 3.0 3.3 3.60
50
100
1501.8 2.1 2.4 2.7 3.0 3.3 3.6
0
50
100
150
1.8 2.1 2.4 2.7 3.0 3.3 3.60
50
100
1501.8 2.1 2.4 2.7 3.0 3.3 3.6
0
50
100
150
1.8 2.1 2.4 2.7 3.0 3.3 3.60
50
100
1501.8 2.1 2.4 2.7 3.0 3.3 3.6
0
50
100
150
1.8 2.1 2.4 2.7 3.0 3.3 3.60
50
100
1501.8 2.1 2.4 2.7 3.0 3.3 3.6
0
50
100
150
1.8 2.1 2.4 2.7 3.0 3.3 3.60
50
100
150
1.8 2.1 2.4 2.7 3.0 3.3 3.60
50
100
150
Extrudates
Extrudates1.8 2.1 2.4 2.7 3.0 3.3 3.6
0
50
100
150
Blocked1.8 2.1 2.4 2.7 3.0 3.3 3.6
0
50
100
150
Blocked1.8 2.1 2.4 2.7 3.0 3.3 3.6
0
50
100
150
Blocked1.8 2.1 2.4 2.7 3.0 3.3 3.6
0
50
100
150
Blocked
1.8 2.1 2.4 2.7 3.0 3.3 3.60
50
100
1501.8 2.1 2.4 2.7 3.0 3.3 3.6
0
50
100
150
Extrudates
Extrudates
1.8 2.1 2.4 2.7 3.0 3.3 3.60
50
100
150
Extrudates
100
rpm
50
rp
m
LS = 0.6 LS = 0.7 LS = 0.9 LS = 1.0 LS = 1.5 LS = 2.0
Fig. 4-9 The growth regime map for the extruder with a long single mixing section. Powder: MCC PH 102, Binder: aqueous PEG 6k
33%
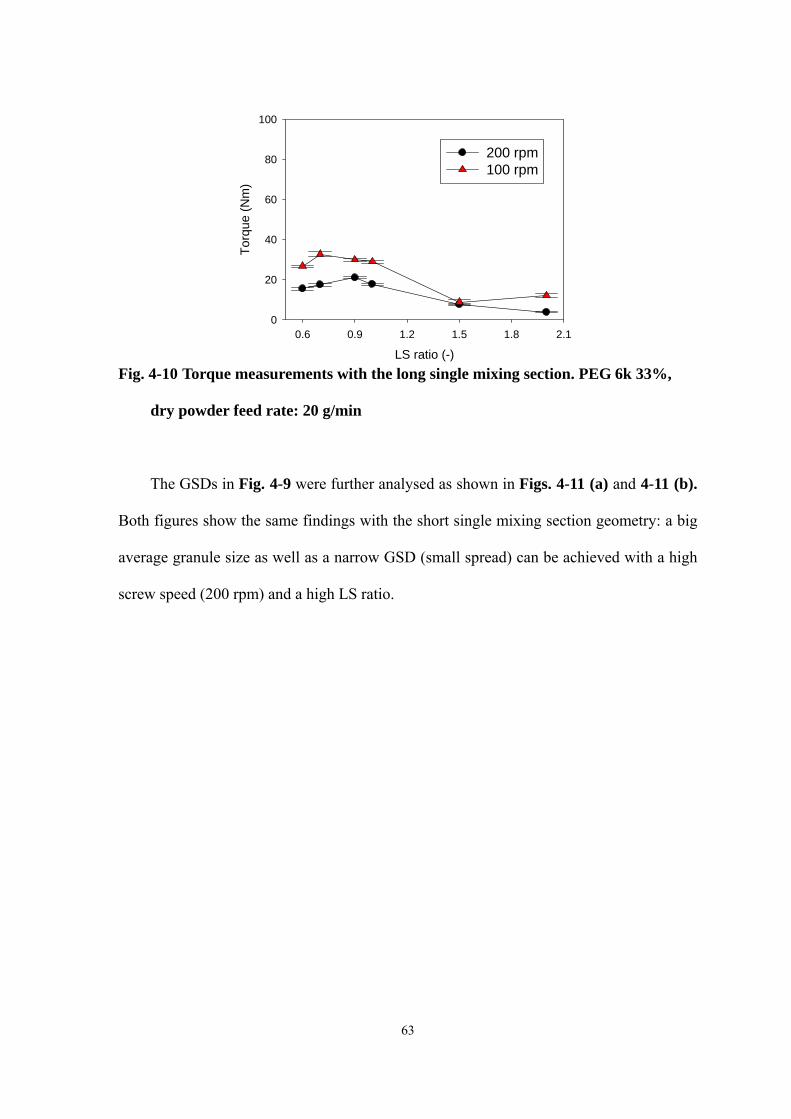
63
LS ratio (-)0.6 0.9 1.2 1.5 1.8 2.1
Torq
ue (N
m)
0
20
40
60
80
100
200 rpm100 rpm
Fig. 4-10 Torque measurements with the long single mixing section. PEG 6k 33%,
dry powder feed rate: 20 g/min
The GSDs in Fig. 4-9 were further analysed as shown in Figs. 4-11 (a) and 4-11 (b).
Both figures show the same findings with the short single mixing section geometry: a big
average granule size as well as a narrow GSD (small spread) can be achieved with a high
screw speed (200 rpm) and a high LS ratio.
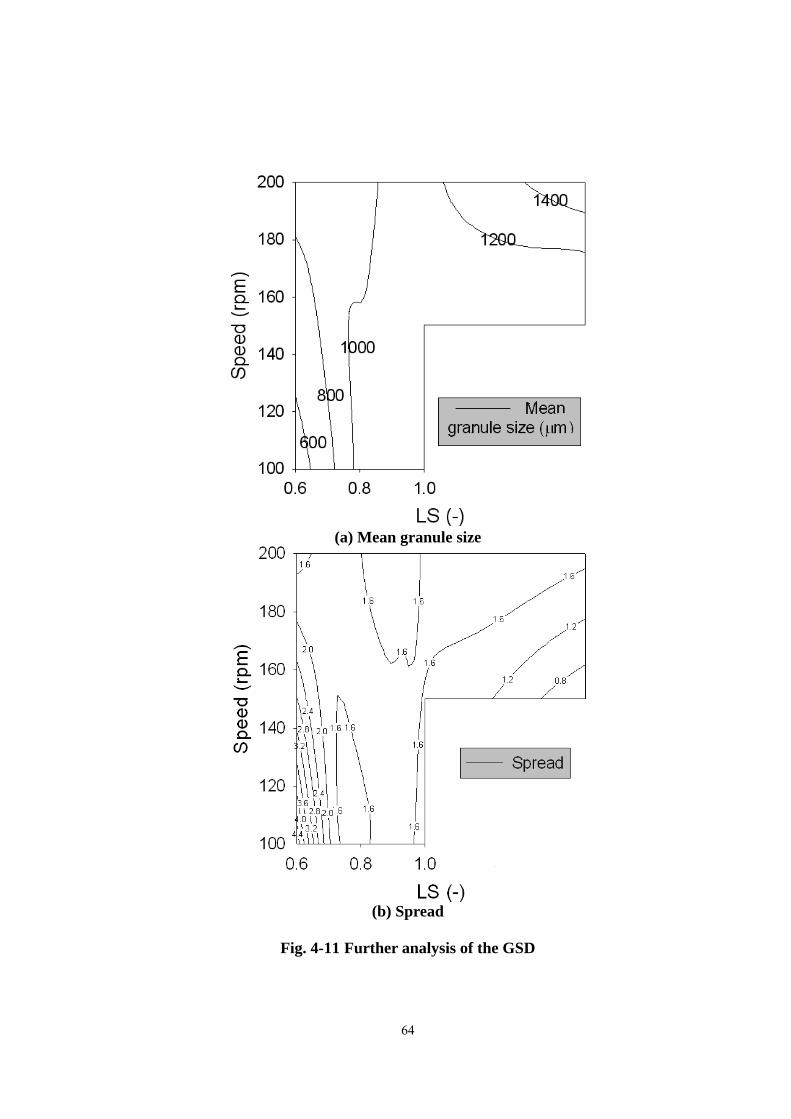
64
(a) Mean granule size
(b) Spread
Fig. 4-11 Further analysis of the GSD

65
A further comparison – looping experiment, was made to evaluate the effect of
processing time on GSD. In order to compare the long-mixing-section extruder with Fig.
4-6 on the same basis, the same operating conditions with Fig. 4-6 were chosen
(experiments E07, E10 and E13) and the GSD evolutions were shown in Fig. 4-12.
Generally for all the first loops, LS ratio did not play a very significant role to change
the GSD uniformity. This was different from the LS effect in Fig. 4-6. It was because the
mixing geometry in Fig. 4-12 has become longer, presumably leading to a better binder
distribution among granules, therefore the first-loop GSDs were similar to each other
regardless of LS ratio. Homogeneous binder distribution in rotating drums [54] and high
shear granulation [55] has been approved to be the key step to achieve uniform GSD. This
thesis presumes that the same mechanism applies to the twin screw extruder granulation
because it is true that longer mixing path should mix the solid and binder better than the
shorter one. Future work regarding the relationship between mixing geometry and binder
distribution amongst granules would be required to further understand the binder
transportation between granules and the accompanying growth mechanisms. It is believed
that due the same hypothetical assumption, all the GSDs shown in Figs. 4-12 (a), (b) & (c)
have quickly become independent of LS and the processing time since the second loop.
Although longer mixing path can provide a better mixing ability, the mass fraction of fines
was found being increased when the looping experiments progressed because this geometry
will also sequentially result in breakage.
Fig. 4-13 (a) shows the evolution of the mean granule size against different LS ratios.
It can be seen that different LS ratios had a similar effect with the geometry of short single
66
mixing section as big granules were found with a high LS ratio at the first loop. It was also
found that the overall size fluctuation in Fig. 4-13 (a) was less than Fig. 4-7 (a), including
d16, d50 and d84 as shown in Figs. 4-13 (b), (c) and (d). Again this could be contributed by
better mixing of solids and binder which is the result of the longer mixing path.
Up to this Section, the operating conditions for obtaining uniform GSD are
recommended here: a system with higher screw speed, a higher LS ratio and a better mixing
(either a longer processing time or an aggressive mixing geometry).
The total work done per unit mass was calculated by following equations (4.3 a) to (4.3
d) and plotted in Fig. 4-14. It shows the same effect of LS ratio with what has been seen in
Fig. 4-8 but the amount of work are greater due to the higher torque.
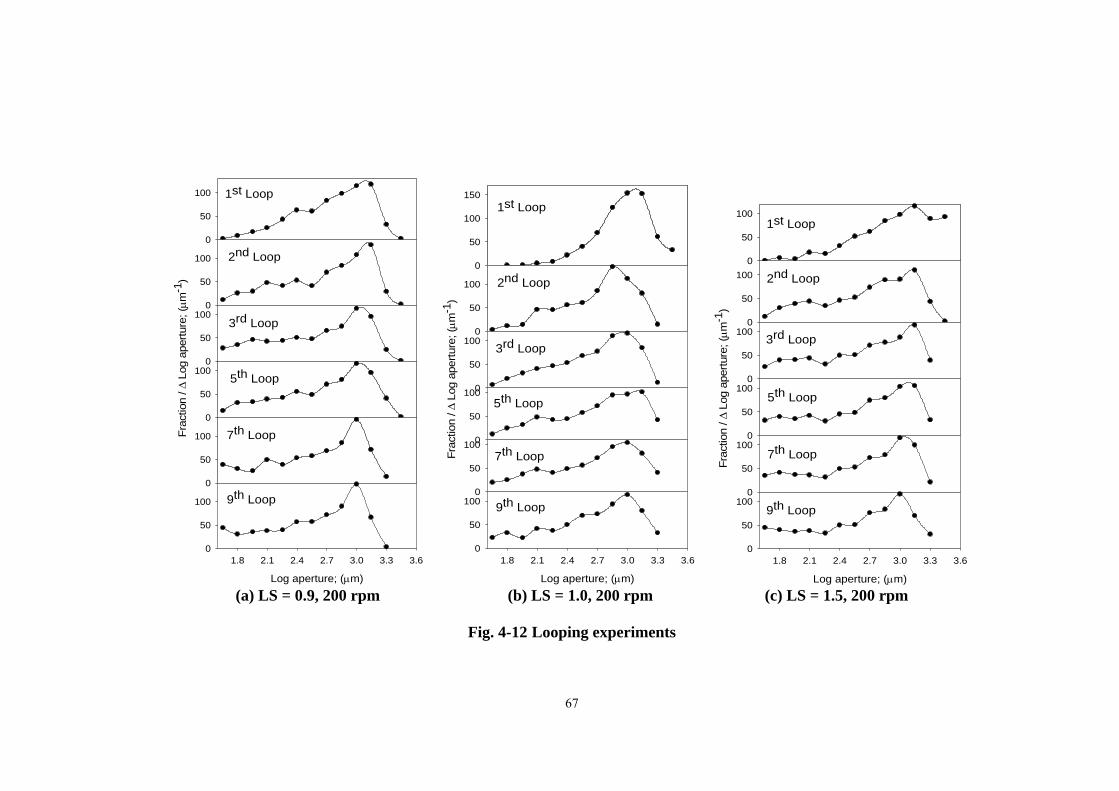
67
0
50
100
0
50
100
0
50
100
Frac
tion
/ Δ L
og a
pertu
re; (
μ m-1
)
0
50
100
0
50
100
Log aperture; (μm)
1.8 2.1 2.4 2.7 3.0 3.3 3.60
50
100
1st Loop
2nd Loop
3rd Loop
5th Loop
7th Loop
9th Loop
0
50
100
150
0
50
100
Frac
tion
/ Δ L
og a
pertu
re; (
μ m-1
)
0
50
100
0
50
100
0
50
100
Log aperture; (μm)
1.8 2.1 2.4 2.7 3.0 3.3 3.60
50
100
1st Loop
2nd Loop
3rd Loop
5th Loop
7th Loop
9th Loop
0
50
100
0
50
100
Frac
tion
/ Δ L
og a
pertu
re; (
μ m-1
)
0
50
100
0
50
100
0
50
100
Log aperture; (μm)
1.8 2.1 2.4 2.7 3.0 3.3 3.60
50
100
1st Loop
2nd Loop
3rd Loop
5th Loop
7th Loop
9th Loop
(a) LS = 0.9, 200 rpm (b) LS = 1.0, 200 rpm (c) LS = 1.5, 200 rpm
Fig. 4-12 Looping experiments

68
Loops (-)0 1 2 3 4 5 6 7 8 9 10
Mea
n gr
anul
e si
ze (μ
m)
0
500
1000
1500
2000
2500
3000
200 rpm, LS = 0.9200 rpm, LS = 1.0200 rpm, LS = 1.5
(a) The change of mean granule size
(b) The change of d16 (c) The change of d50
Loops (-)0 2 4 6 8 10
d 84 (μ
m)
0500
10001500200025003000 200 rpm, LS = 0.9
200 rpm, LS = 1.0200 rpm, LS = 1.5
(d) The change of d84
Fig. 4-13 The change of the mean granule size and each size frequency
Loops (-)0 2 4 6 8 10
d 50 (μ
m)
0500
10001500200025003000 200 rpm, LS = 0.9
200 rpm, LS = 1.0200 rpm, LS = 1.5
Loops (-)0 2 4 6 8 10
d 16 (μ
m)
0500
10001500200025003000 200 rpm, LS = 0.9
200 rpm, LS = 1.0200 rpm, LS = 1.5
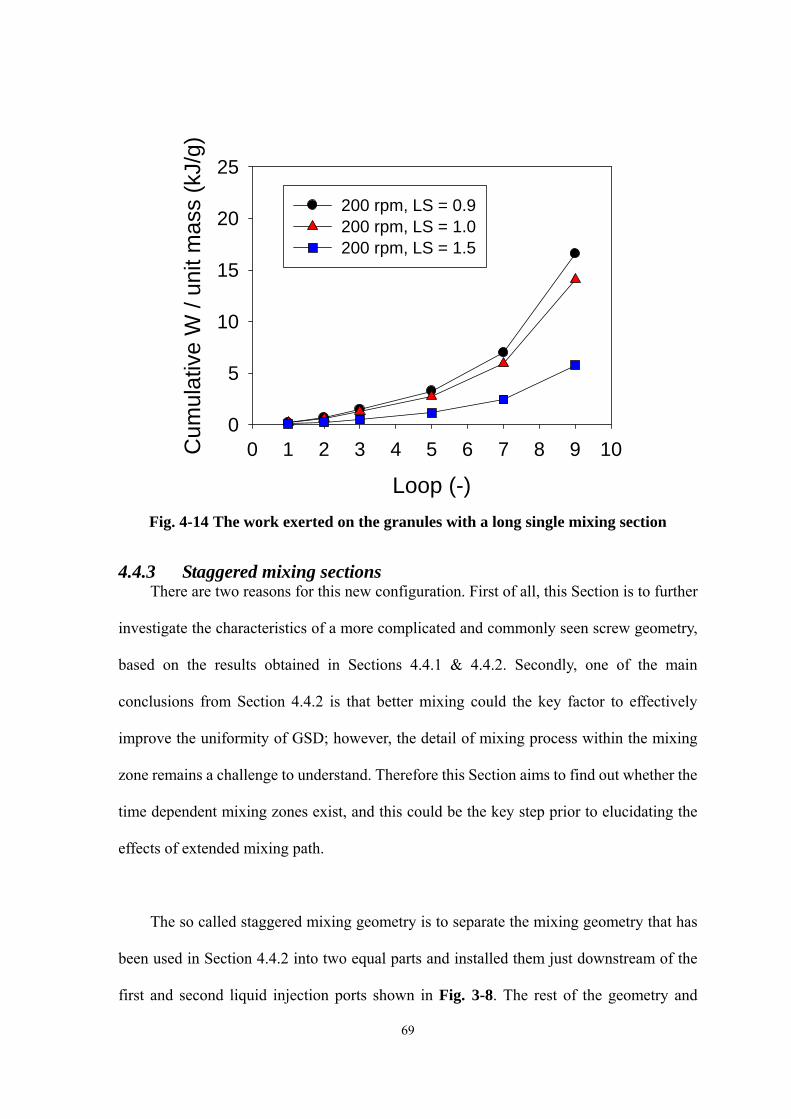
69
Loop (-)0 1 2 3 4 5 6 7 8 9 10C
umul
ativ
e W
/ un
it m
ass
(kJ/
g)
0
5
10
15
20
25
200 rpm, LS = 0.9200 rpm, LS = 1.0200 rpm, LS = 1.5
Fig. 4-14 The work exerted on the granules with a long single mixing section
4.4.3 Staggered mixing sections There are two reasons for this new configuration. First of all, this Section is to further
investigate the characteristics of a more complicated and commonly seen screw geometry,
based on the results obtained in Sections 4.4.1 & 4.4.2. Secondly, one of the main
conclusions from Section 4.4.2 is that better mixing could the key factor to effectively
improve the uniformity of GSD; however, the detail of mixing process within the mixing
zone remains a challenge to understand. Therefore this Section aims to find out whether the
time dependent mixing zones exist, and this could be the key step prior to elucidating the
effects of extended mixing path.
The so called staggered mixing geometry is to separate the mixing geometry that has
been used in Section 4.4.2 into two equal parts and installed them just downstream of the
first and second liquid injection ports shown in Fig. 3-8. The rest of the geometry and

70
binder addition setup remained the same to keep the consistency throughout the thesis. Fig.
4-15 shows the GSDs of each operating conditions across the working matrix. Three
regimes were recognised– the granulation regime, the extrudate regime and the blocked
regime. Interestingly, it was found that the same length of mixing path but with different
arrangement can result in different GSDs as well as the regime map. It is the direct evidence
that the mechanisms of extruder granulation can be changed by simply rearranging original
mixing elements.

71
200
rpm
1.8 2.1 2.4 2.7 3.0 3.3 3.60
50
100
150
200
1.8 2.1 2.4 2.7 3.0 3.3 3.60
50
100
150
2001.8 2.1 2.4 2.7 3.0 3.3 3.6
0
50
100
150
200
1.8 2.1 2.4 2.7 3.0 3.3 3.60
50
100
150
2001.8 2.1 2.4 2.7 3.0 3.3 3.6
0
50
100
150
200
1.8 2.1 2.4 2.7 3.0 3.3 3.60
50
100
150
200
1.8 2.1 2.4 2.7 3.0 3.3 3.60
50
100
150
200
1.8 2.1 2.4 2.7 3.0 3.3 3.60
50
100
150
200
1.8 2.1 2.4 2.7 3.0 3.3 3.60
50
100
150
200
1.8 2.1 2.4 2.7 3.0 3.3 3.60
50
100
150
200
1.8 2.1 2.4 2.7 3.0 3.3 3.60
50
100
150
200
Blocked1.8 2.1 2.4 2.7 3.0 3.3 3.6
0
50
100
150
200
Blocked1.8 2.1 2.4 2.7 3.0 3.3 3.6
0
50
100
150
200
Blocked1.8 2.1 2.4 2.7 3.0 3.3 3.6
0
50
100
150
200
Blocked1.8 2.1 2.4 2.7 3.0 3.3 3.6
0
50
100
150
200
Blocked
1.8 2.1 2.4 2.7 3.0 3.3 3.60
50
100
150
200
1.8 2.1 2.4 2.7 3.0 3.3 3.60
50
100
150
200
1.8 2.1 2.4 2.7 3.0 3.3 3.60
50
100
150
200
Extrudates
Extrudates
Extrudates
100
rpm
50
rp
m
LS = 0.6 LS = 0.7 LS = 0.9 LS = 1.0 LS = 1.5 LS = 2.0
Fig. 4-15 The growth regime map for the extruder with staggered mixing sections. Powder: MCC PH 102, Binder: aqueous PEG 6k
33%
72
As shown in Figs 4-16 (a) & (b), the conditions for producing large granules with
narrow GSD are high rotating speed and more binder addition and these coincide with the
conclusions obtained in Sections 4.4.1 and 4.4.2. Interestingly, high shear granulation
requires the same conditions – while sufficient binder addition is a requirement for granule
growth there is an equally important requirement for distribution of this binder and that low
impeller speeds impart insufficient energy to achieve this. According to the proposing
mechanisms made in Section 4.4.1 and 4.4.2 that sufficient mixing could be the key factor
to achieve large granules with narrow GSD, the staggered mixing sections seem not be able
to provide better mixing than the long single mixing zone (used in Section 4.4.2). As an
imaginary plot shown in Fig. 4-17, the amount of mixing could be a function of the length
of the mixing path, however, the mixing index goes gradually into a plateau, because the
degree of mixing of powders and binder should theoretically go towards 1 for a “fully
mixed state.”

73
(a) Mean granule size
(b) Spread
Fig. 4-16 Further analysis of the GSD
74
Another interesting finding was that the area of extrudate regime in Fig. 4-15 is
smaller than that in Fig. 4-9 because the experiment E14 has become a part of the
granulation regime and E15 has become a part of the blocked regime. Following the
proposing mechanisms made in Section 4.4.2 that the higher “consolidation rate” applied
on mixtures, the paste (extrudate regime) is more likely to become granules. This geometry
(staggered mixing section) suggested that the “amount of consolidation” is also one
possible factor. As shown in Fig. 4-17, the consolidation index goes up linearly until the end
of a mixing zone because the longer the consolidation time, the mixture should be harder
regardless of the consolidation rate. Therefore it was observed that the longer mixing path
(long single mixing section and staggered mixing section) tends to enable the blocked
regimes. To approve the feasibility of Fig. 4-17, it is suggested to investigate the texture of
paste along with barrel in the future and the detail will be discussed in Chapter 6.

75
Staggered mixing section
Long single mixing section
Time
Time
TimeConsolidation
MixingShort single mixing section
Consolidation
Mixing
Consolidation
Mixing
Fig. 4-17 Comparisons between short, long single mixing section and staggered
mixing section
76
CHAPTER FIVE
CONCLUSIONS AND
COMMENTS
This thesis demonstrates the effects of screw speed, LS ratio and screw geometry on
twin screw extruder granulation. Regime maps for the systems are drawn and the specific
behaviours are recognised. The maps as well as the underlying mechanisms are then
compared with the one developed in high-shear wet granulation.
Comparing to a typical high-shear wet granulation, the effect of extruder screw speed
is mainly to change the fill level in the barrel. With a higher fill level in the barrel, higher
friction force as well as higher torque can be observed. Besides, the effect of LS ratio in
extruder granulation is to change the friction force between the mixture and the inner wall
of the barrel. Increasing LS ratio will lead to a high fill level and the torque can be increased
sequentially. After reaching a critical liquid amount, the mixture will become over-wetted
and the torque will become low.
By measuring the GSD of final products, this work develops three extruder granulation
regime maps for the short-single, long-single and staggered mixing geometries. For the
short-single one, a granulation regime and a extrudate regime are recognised; for the
long-single one, three regimes are recognized: granulation, extrudates and the blocked
regimes; for the staggered geometry, three regimes are recognized: granulation, extrudates

77
and the blocked regimes, but the layout is different from the long-single one.
Overall, the granules with big size and a narrow GSD can be achieved with more
binder addition, higher screw speed and any geometry that can provide sufficient mixing.
And these coincide with high shear wet granulation - while sufficient binder addition is a
requirement for granule growth there is an equally important requirement for distribution of
this binder and that low impeller speeds impart insufficient energy to achieve this.
This thesis also proposes hypothetical mechanisms for the extruder granulation: the
mixing only occurs within the mixing zones and the degree of it will approach 1 gradually.
On the other hand, the degree of consolidation is a function of the mixing path, so that the
longer mixing zones are more likely to transform paste into granulation or even the blocked
regime.
78
CHAPTER SIX
FUTURE WORKS In order to develop systematic and new regime maps for extruder granulation this
thesis employs the idea from high-shear wet granulation, although some practical
challenges were found:
1. How to measure the time dependent properties precisely?
Sampling granules and the upcoming analysis determine a typical growth
regime map in high shear wet granulation. The material exchange can be figured
by tracking the changes of each size frequency. Unlike to common granulation
processes (drum, high shear granulator or Wurster coater etc.) where granules are
exposed to the air, sampling in an extruder is not easy because: (1) the interior
space of the barrel is tightly enclosed, resulting in a highly mass flux across the
channel; (2) furthermore, the material flows with an unknown velocity profile
within the barrel. Therefore it is difficult to collect ‘representative granules’ at one
fixed port.
An attempted approach called ‘freezing method’ has been tried by stopping
the process while running. Open the barrel and collect the granules afterwards
immediately. However it failed because the granules were spilled out everywhere
and sometimes the other materials were found jammed at mixing sections
(hypothetically considered “consolidation stage”) as shown in Fig. 6-1.

79
Fig. 6-1 The Freezing method
A proper sampling apparatus would be required in this case to collect
“representative granules” by not suspending the granulation processes. Therefore
the measurement of time dependant properties within the mixing sections, such as
mixing index, density gradient, hardness etc could become feasible and this is the
vital step to understand the transportation phenomena.
2. What are the effects of other geometries?
The geometries in this thesis are set to be simpler than the ones in practice,
aiming to ease the complexity of flow pattern. Thus the proposed granulation
behaviours according to these geometries are sure to be at a fundamental stage. It is
still a lack of direct relationships between simple geometries to reality.
Upper barrel
Lower barrel
Local jamming
80
Comprehensively understanding the effects of different mixing sections
(aggressive or multi sections) is important for regime map development as well as
investigating the formulation mechanisms. Some experiments are suggested: (1)
Different separated distance between mixing sections. It helps explain how the
staggered distance affect the granulation mechanisms; (2) Measurement of the
mixing mechanism. There are two mixing mechanisms in polymer extrusion which
are the distributive mixing and dispersive mixing mechanisms, respectively. It has
been known that distributive mixing must occur in this thesis because the liquid
phase is distributed amongst the solid phase. We could also assume dispersive
mixing occurs at some extent because it is usually observed in these systems. These
measurements would be suggested as it can characterize the governing mixing
mechanisms.
3. Energy consumption monitoring
In industry, total energy consumption is used to be simple and direct
information to monitor the manufacturing processes. However this thesis simplified
the calculation by ignoring the effects of “residence time distribution”, a very
common measurement found in the literatures of twin screw extrusion. This
experimental work will be suggested to take into account nevertheless. Besides, via
the residence time distribution measurement, the binder distribution among granules
and extrudates could also be understood.
It is practically difficult to collect granules as well as visualizing the real flow
pattern during the process; therefore this thesis can only propose a hypothesis of

81
extruder granulation based on the granule morphology and draw the regime maps
accordingly. With the suggested experimental plans mentioned above, a better
understanding of extruder granulation can be achieved and a full extent of
granulation mechanisms can be defined.
82
Reference List
[1] W. D. Tu, A. Ingram, J. P. K. Seville, and S. S. Hsiau, Exploring the regime map for high-shear mixer granulation, Chemical Engineering Journal, 145 (2009) 505-513.
[2] M. Rhodes, Introduction to Particle Technology, John Wiley & Sons, 1998.
[3] A. S. Blair, Dust explosion incidents and regulations in the United States, Journal of Loss Prevention in the Process Industries, 20 (2007) 523-529.
[4] K. Szymocha, Industrial applications of the agglomeration process, Powder Technology, 130 (2003) 462-467.
[5] D. Rossetti and S. J. R. Simons, A microscale investigation of liquid bridges in the spherical agglomeration process, Powder Technology, 130 (2003) 49-55.
[6] W. Pietsch, Agglomeration processes: phenomena, technologies, equipment, Wiley-VCH, 2002.
[7] K. L. Kadam, Granulation Technology for Bioproducts, Informa Health Care, Boston 1990.
[8] Granulation, Elsevier, Amsterdam 2007.
[9] M. Jacob, Granulation equipment, in: A. D. Salman, M. J. Hounslow, and J. P. K. Seville (Eds.), Granulation, Elsevier, Amsterdam, 2007, pp. 417-476.
[10] http://www.glatt.com/e/01_technologien/01_03_02_02.htm
[11] S. M. Iveson, J. D. Litster, K. Hapgood, and B. J. Ennis, Nucleation, growth and breakage phenomena in agitated wet granulation processes: a review, Powder Technology, 117 (2001) 3-39.
[12] S. M. Iveson, J. A. Beathe, and N. W. Page, The dynamic strength of partially saturated powder compacts: the effect of liquid properties, Powder Technology, 127 (2002) 149-161.
[13] T. Schaefer and C. Mathiesen, Melt pelletization in a high shear mixer. IX. Effects of binder particle size, International Journal of Pharmaceutics, 139 (1996) 139-148.
[14] S. M. Iveson, J. D. Litster, and B. J. Ennis, Fundamental studies of granule consolidation Part 1: Effects of binder content and binder viscosity, Powder Technology, 88 (1996) 15-20.
[15] J. S. Fu, Y. S. Cheong, G. K. Reynolds, M. J. Adams, A. D. Salman, and M. J. Hounslow, An experimental study of the variability in the properties and quality of wet granules, Powder Technology, 140 (2004) 209-216.

83
[16] G. I. Tardos, M. I. Khan, and P. R. Mort, Critical parameters and limiting conditions in binder granulation of fine powders, Powder Technology, 94 (1997) 245-258.
[17] S. M. Iveson, P. A. L. Wauters, S. Forrest, J. D. Litster, G. M. H. Meesters, and B. Scarlett, Growth regime map for liquid-bound granules: further development and experimental validation, Powder Technology, 117 (2001) 83-97.
[18] K. van den Dries, O. M. de Vegt, V. Girard, and H. Vromans, Granule breakage phenomena in a high shear mixer; influence of process and formulation variables and consequences on granule homogeneity, Powder Technology, 133 (2003) 228-236.
[19] P. C. Knight, J. P. K. Seville, A. B. Wellm, and T. Instone, Prediction of impeller torque in high shear powder mixers, Chemical Engineering Science, 56 (2001) 4457-4471.
[20] K. P. Hapgood, S. M. Iveson, J. D. Litster, and L. X. Liu, Granulation rate processes, in: A. D. Salman, M. J. Hounslow, and J. P. K. Seville (Eds.), Granulation, Elsevier, Amsterdam, 2007, pp. 897-978.
[21] S. M. Iveson and J. D. Litster, Growth regime map for liquid-bound granules, AIChE Journal, 44 (1998) 1510-1518.
[22] K. P. Hapgood, J. D. Litster, S. R. Biggs, and T. Howes, Drop penetration into porous powder beds, Journal of Colloid and Interface Science, 253 (2002) 353-366.
[23] S. L. Rough, D. I. Wilson, and D. W. York, A regime map for stages in high shear mixer agglomeration using ultra-high viscosity binders, Advanced Powder Technology, 16 (2005) 373-386.
[24] A. M. Bouwman, M. R. Visser, G. M. H. Meesters, and H. W. Frijlink, The use of Stokes deformation number as a predictive tool for material exchange behaviour of granules in the 'equilibrium phase' in high shear granulation, International Journal of Pharmaceutics, 318 (2006) 78-85.
[25] B. J. Ennis, G. Tardos, and R. Pfeffer, A microlevel-based characterization of granulation phenomena, Powder Technology, 65 (1991) 257-272.
[26] S. T. Keningley, P. C. Knight, and A. D. Marson, An investigation into the effects of binder viscosity on agglomeration behaviour, Powder Technology, 91 (1997) 95-103.
[27] B. J. Ennis, J. Li, G. I. Tardos, and R. Pfeffer, The influence of viscosity on the strength of an axially strained pendular liquid bridge, Chemical Engineering Science, 45 (1990) 3071-3088.
[28] G. Barnocky and R. H. Davis, Elastohydrodynamic collision and rebound of spheres: experimental verification, Physics of Fluids, 31 (1988) 1324-1329.
84
[29] I. Talu, G. I. Tardos, and M. I. Khan, Computer simulation of wet granulation, Powder Technology, 110 (2000) 59-75.
[30] P. J. T. Mills, J. P. K. Seville, P. C. Knight, and M. J. Adams, The effect of binder viscosity on particle agglomeration in a low shear mixer/agglomerator, Powder Technology, 113 (2000) 140-147.
[31] P. A. L. Wauters, R. van de Water, J. D. Litster, G. M. H. Meesters, and B. Scarlett, Growth and compaction behaviour of copper concentrate granules in a rotating drum, Powder Technology, 124 (2002) 230-237.
[32] F. Hoornaert, P. A. L. Wauters, G. M. H. Meesters, S. E. Pratsinis, and B. Scarlett, Agglomeration behaviour of powders in a Lodige mixer granulator, Powder Technology, 96 (1998) 116-128.
[33] P. C. Kapur, Balling and Granulation, Advances in Chemical Engineering, 10 (1978) 55-123.
[34] http://www.unitec-solution.de/e/01_technologien/01_04_03.htm
[35] H. Leuenberger, New trends in the production of pharmaceutical granules: batch versus continuous processing, European Journal of Pharmaceutics and Biopharmaceutics, 52 (2001) 289-296.
[36] E. I. Keleb, A. Vermeire, C. Vervaet, and J. P. Remon, Twin screw granulation as a simple and efficient tool for continuous wet granulation, International Journal of Pharmaceutics, 273 (2004) 183-194.
[37] E. I. Keleb, A. Vermeire, C. Vervaet, and J. P. Remon, Continuous twin screw extrusion for the wet granulation of lactose, International Journal of Pharmaceutics, 239 (2002) 69-80.
[38] M. Weinmann, Masterbatch production on co-rotating twin screw extruders, Plastics, Additives and Compounding, 9 (2007) 36-39.
[39] G. M. Owolabi, M. N. Bassim, J. H. Page, and M. G. Scanlon, The influence of specific mechanical energy on the ultrasonic characteristics of extruded dough, Journal of Food Engineering, 86 (2008) 202-206.
[40] M. J. Gamlen and C. Eardley, Continuous extrusion using a Baker Perkins MP50 (Multipurpose) extruder, Drug Development and Industrial Pharmacy, 12 (1986) 1701-1713.
[41] N. O. Lindberg, C. Tufvesson, and L. Olbjer, Extrusion of an effervescent granulation with twin extruder Baker Perkins MPF 50 D, Drug Development and Industrial Pharmacy, 13 (1987) 1891-1913.
[42] N. O. Lindberg, C. Tufvesson, P. Holm, and L. Olbjer, Extrusion of an effervescent granulation with twin screw extruder, Baker Perkins MPF 50 D. Influence on intra-granular porosity and liquid saturation, Drug Development and Industrial
85
Pharmacy, 14 (1988) 1791-1798.
[43] P. Kleinebudde and H. Lindner, Experiments with an instrumented twin-screw extruder using a single-step granulation/extrusion process, International Journal of Pharmaceutics, 94 (1993) 49-58.
[44] B. Van Melkebeke, B. Vermeulen, C. Vervaet, and J. P. Remon, Melt granulation using a twin-screw extruder: A case study, International Journal of Pharmaceutics, 326 (2006) 89-93.
[45] K. Nakamichi, T. Nakano, H. Yasuura, S. Izumi, and Y. Kawashima, Stabilization of sodium guaiazulene sulfonate in granules for tableting prepared using a twin-screw extruder, European Journal of Pharmaceutics and Biopharmaceutics, 56 (2003) 347-354.
[46] C. Schmidt and P. Kleinebudde, Comparison between a twin-screw extruder and a rotary ring die press. Part II: influence of process variables, European Journal of Pharmaceutics and Biopharmaceutics, 45 (1998) 173-179.
[47] E. I. Keleb, A. Vermeire, C. Vervaet, and J. P. Remon, Cold extrusion as a continuous single-step granulation and tabletting process, European Journal of Pharmaceutics and Biopharmaceutics, 52 (2001) 359-368.
[48] A. Darelius, A. Rasmuson, I. N. Bjö n, and S. Folestad, High shear wet granulation modelling-a mechanistic approach using population balances, Powder Technology, 160 (2005) 209-218.
[49] A. Kumar, G. M. Ganjyal, D. D. Jones, and M. A. Hanna, Digital image processing for measurement of residence time distribution in a laboratory extruder, Journal of Food Engineering, 75 (2006) 237-244.
[50] C. Bi, B. Jiang, and A. Li, Digital image processing method for measuring the residence time distribution in a plasticating extruder, Polymer Engineering & Science, 47 (2007) 1108-1113.
[51] K. Eise, H. Herrmann, S. Jakopin, U. Burkhardt, and H. Werner, An analysis of twin-screw extruder mechanisms, Advances in Polymer Technology, 1 (1981) 18-39.
[52] N. P. Cheremisinoff, Composites and specialty application, Handbook of Polymer Science and Technology, CRC Press, 1989.
[53] Pharmaceutical Dosage Forms: Tablets, Informa Health Care, 1989.
[54] P. C. Knight, T. Instone, J. M. K. Pearson, and M. J. Hounslow, An investigation into the kinetics of liquid distribution and growth in high shear mixer agglomeration, Powder Technology, 97 (1998) 246-257.
[55] W. D. Tu, S. S. Hsiau, A. Ingram, and J. Seville, The effect of powder size on induction behaviour and binder distribution during high shear melt agglomeration of calcium carbonate, Powder Technology, 184 (2008) 298-312.
Top Related