


Languages
Pages
Legal

Instructions for use
Title Reflection of cross-disciplinary research at Creative Research Institution (Hokkaido University) in the Web of Sciencedatabase: appraisal and visualization using bibliometry
Author(s) Gautam, Pitambar; Yanagiya, Ryuichi
Citation Scientometrics, 93(1): 101-111
Issue Date 2012
Doc URL http://hdl.handle.net/2115/50158
Type article (author version)
File Information Gautam and Yanagiya_SCIM648-2012-authorversion.pdf
Hokkaido University Collection of Scholarly and Academic Papers : HUSCAP
Published online: 11 February 2012 in Scientometrics, DOI 10.1007/s11192-012-0655-3
1
Reflection of Cross-disciplinary Research at Creative Research Institution (Hokkaido University) in the Web of Science Database: Appraisal and Visualization using Bibliometry
Pitambar Gautam* and Ryuichi Yanagiya
Creative Research Institution, Hokkaido University, N21, W10, Kita-ku, Sapporo,
Hokkaido 001-0021, Japan
*Corresponding author
Abstract
This study describes the results of a preliminary bibliometric analysis of 611 research items,
published between 1996 and 2011 by researchers affiliated with Creative Research Institution
(CRIS) and the Center for Advanced Science and Technology (CAST), Hokkaido University
(HU), retrieved from the Web of Science (WoS) database. CRIS has a primary mission to promote
cutting-edge, world-class, trans-departmental research within HU, and it conducts fundamental,
commercialization-related, cross-disciplinary research and nurtures young in-house/recruited researchers through targeted, innovative tenure-track programs in multiple disciplines. Its research
output derives from 3- to 7-year-long time-bound projects funded strategically by HU, external
grants (e.g., MEXT Super-COE HU Research & Business Park Project (FY2003-7)), industry-
university collaboration with regional businesses, and endowments (e.g., Meiji Dairies). Analyses
using co-words, bibliographic coupling, overlay map aided with visualization, etc., lead to the
following inferences: (i) The published items comprise a dozen well-defined (inter-)disciplinary
clusters, dominated by 3 macro-disciplines (biomedical science, 33%; chemistry, 21%; agricultural
science, ca. 10%) that constitute 18 clusters used for mapping; (ii) research conducted by
externally funded or endowed projects in the biomedical, physical and environmental science &
technology fields (3 broad areas of aggregation derived from the Science Overlay Map) is
interdisciplinary; and (iii) there is an apparently low visibility of publications from projects jointly
executed with industries to an almost complete absence of output from CRIS in the fields of social sciences in the WoS database.
Keywords
Bibliometrics; Web of Science; Co-word analysis; Bibliographic coupling; Cross-
disciplinary research; Science map; Japan
Introduction
Hokkaido University (HU) established Creative Research Initiative “Sousei”
(CRIS) in 2002 as a University-wide organization to promote cutting-edge, world-
class research and to plan a mid- and long-term trans-departmental research
system. After the incorporation of HU in 2004 and structural reforms, the Center
for Advanced Science and Technology (CAST) was merged in FY2005 into
CRIS, which then began to serve also as a base to materialize time-bound research
schemes aimed at commercialization. In April 2009, CRIS was re-inaugurated as
Creative Research Institution to serve also as a management organization with the
Published online: 11 February 2012 in Scientometrics, DOI 10.1007/s11192-012-0655-3
2
mandate to coordinate 18 research-dedicated institutes, apart from giving
continuity to the R&D activities through its Research Department, which then
comprised 5 horizontal divisions: frontier, innovative, strategic priority, project-
based (with businesses), and endowed. During FY2003-7, CRIS executed the
MEXT Super-COE HU Research & Business Park (HUR&BP) Project. Fostering
interdisciplinary exchanges, CRIS has a mission to promote research in an
innovative and cross-disciplinary (in the broad sense, encompassing
multidisciplinary, interdisciplinary, and transdisciplinary; we refer to Wagner et
al. (2011) for a summary of key terms) manner aiming at knowledge creation and
utilization.
In this paper, we present the first results of analyses on the research output of
CRIS (publication volume, type, etc.) and outcome (e.g., citations and
interdisciplinary contribution), partly to gauge the degree of reflection of the
cross-disciplinary research output in the WoS database. Our aim was to assess the
potential of bibliometry as an analytical tool for analysis and interpretation of the
research performance of an institute having a complex mission at different levels
of aggregation (e.g., institute, department, research groups).
Publication data and methodology of analysis
Publication data
Publications were harvested from the WoS SCI & SSCI Database by searching for
author affiliations including reprint address to CAST and CRIS. The search
strings comprised phrases or abbreviations in addresses comprising basically 2
parts: (i) HOKKAIDO UNIV and (ii) CAST or C* ADV SCI TECH* or CRIS or
SO$SE$ or C*EAT RES IN* or DIV INNOVAT RES or DIV FRONT RES. This
was essential to take into account a dozen or more combinations representing a
variety of styles, occasionally with misspelled variants for the Japanese name
“SOUSEI” (meaning innovation or creation) and for the string “CREAT” for
creative. The phrase CRIS BLDG had to be combined with logical NOT with (ii)
in order to exclude references merely to the CRIS Building that also houses
institutions other than CRIS. Because of the time-bound nature of the projects
executed at CRIS and the very fact that CRIS used to be the secondary affiliation
for many researchers, part of the research output resulting from research at CRIS
might have been published with mere acknowledgement to CRIS, with another
institute/department at HU as the only affiliation. Though the data retrieved may
not be complete, we regard them to be fairly representative of the volume of
research output from CAST and CRIS researchers.
Retrieval from WoS using the above-mentioned search strings on 15 January 2012
has yielded 643 citable items (articles, proceedings papers, reviews, and letters)
jointly contributed by CAST and CRIS as illustrated in Fig. 1. The detailed
analysis presented hereafter, however, is restricted to a total of 611 items retrieved
on July 1, 2011 from the same database. There were 506 and 107 items with
affiliation to CRIS (mainly from 2003 onward) and CAST (from 1996),
respectively, implying that just 2 out of 611 items belonged to both affiliations.
Published online: 11 February 2012 in Scientometrics, DOI 10.1007/s11192-012-0655-3
3
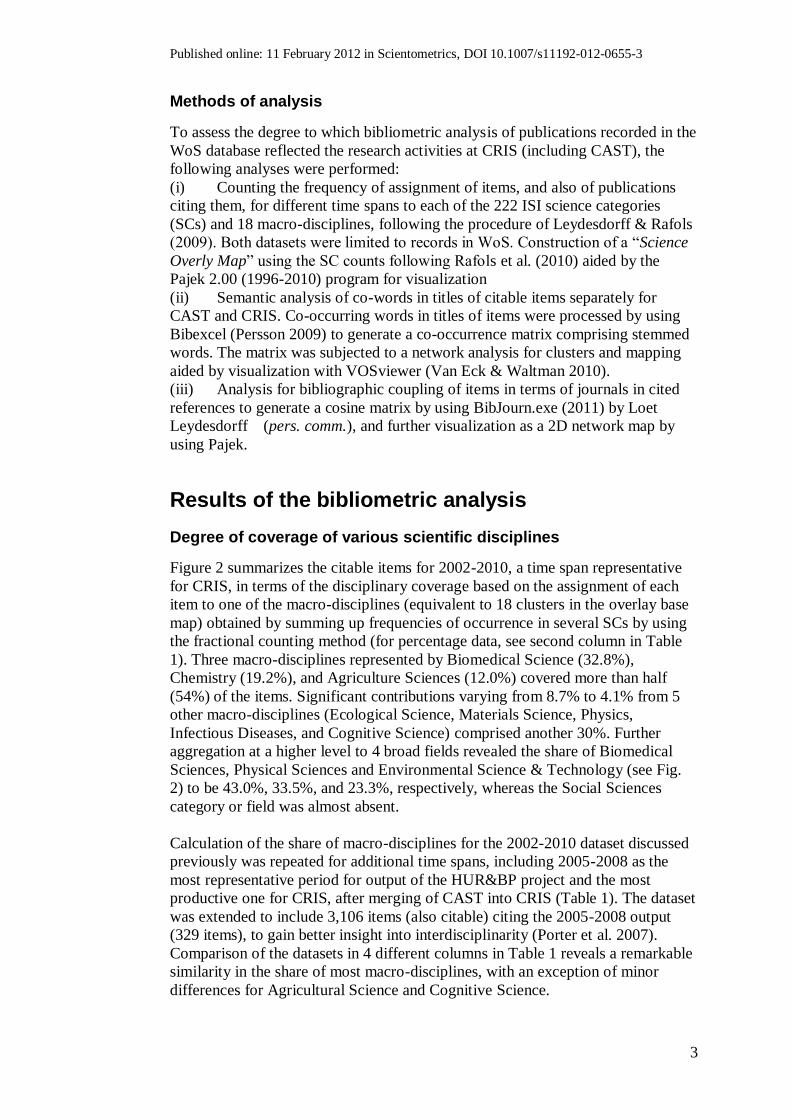
Methods of analysis
To assess the degree to which bibliometric analysis of publications recorded in the
WoS database reflected the research activities at CRIS (including CAST), the
following analyses were performed:
(i) Counting the frequency of assignment of items, and also of publications
citing them, for different time spans to each of the 222 ISI science categories
(SCs) and 18 macro-disciplines, following the procedure of Leydesdorff & Rafols
(2009). Both datasets were limited to records in WoS. Construction of a “Science
Overly Map” using the SC counts following Rafols et al. (2010) aided by the
Pajek 2.00 (1996-2010) program for visualization
(ii) Semantic analysis of co-words in titles of citable items separately for
CAST and CRIS. Co-occurring words in titles of items were processed by using
Bibexcel (Persson 2009) to generate a co-occurrence matrix comprising stemmed
words. The matrix was subjected to a network analysis for clusters and mapping
aided by visualization with VOSviewer (Van Eck & Waltman 2010).
(iii) Analysis for bibliographic coupling of items in terms of journals in cited
references to generate a cosine matrix by using BibJourn.exe (2011) by Loet
Leydesdorff (pers. comm.), and further visualization as a 2D network map by
using Pajek.
Results of the bibliometric analysis
Degree of coverage of various scientific disciplines
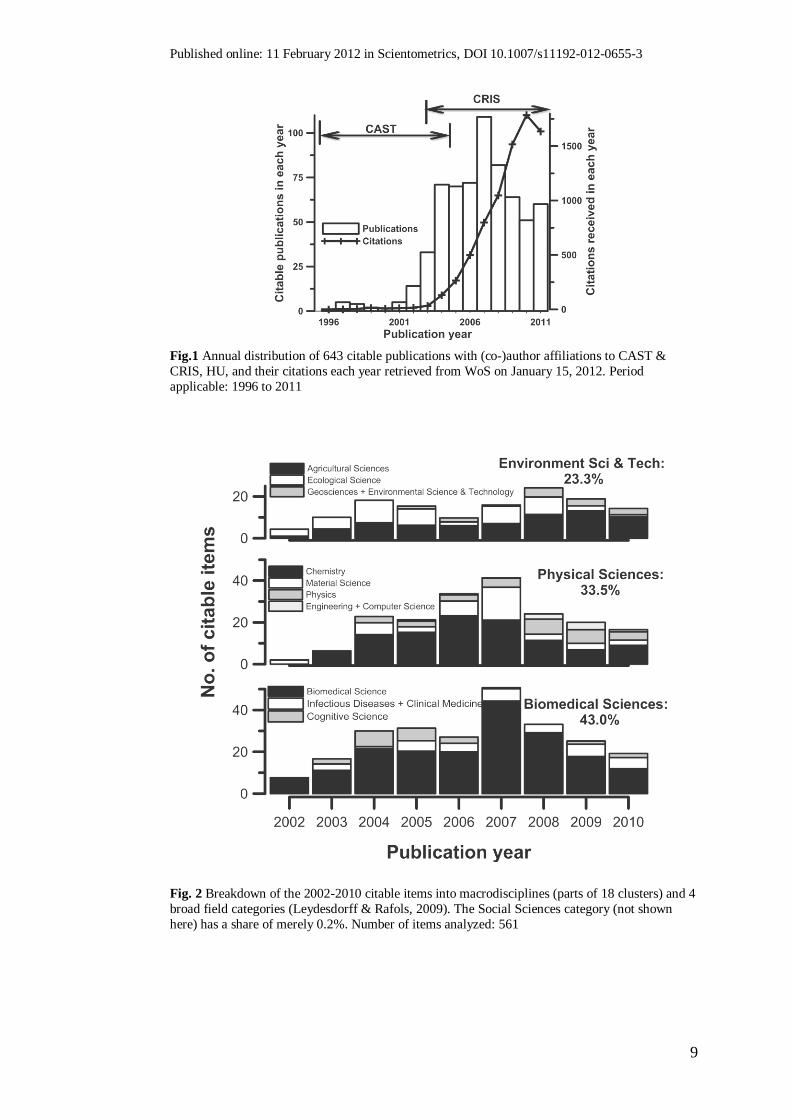
Figure 2 summarizes the citable items for 2002-2010, a time span representative
for CRIS, in terms of the disciplinary coverage based on the assignment of each
item to one of the macro-disciplines (equivalent to 18 clusters in the overlay base
map) obtained by summing up frequencies of occurrence in several SCs by using
the fractional counting method (for percentage data, see second column in Table
1). Three macro-disciplines represented by Biomedical Science (32.8%),
Chemistry (19.2%), and Agriculture Sciences (12.0%) covered more than half
(54%) of the items. Significant contributions varying from 8.7% to 4.1% from 5
other macro-disciplines (Ecological Science, Materials Science, Physics,
Infectious Diseases, and Cognitive Science) comprised another 30%. Further
aggregation at a higher level to 4 broad fields revealed the share of Biomedical
Sciences, Physical Sciences and Environmental Science & Technology (see Fig.
2) to be 43.0%, 33.5%, and 23.3%, respectively, whereas the Social Sciences
category or field was almost absent.
Calculation of the share of macro-disciplines for the 2002-2010 dataset discussed
previously was repeated for additional time spans, including 2005-2008 as the
most representative period for output of the HUR&BP project and the most
productive one for CRIS, after merging of CAST into CRIS (Table 1). The dataset
was extended to include 3,106 items (also citable) citing the 2005-2008 output
(329 items), to gain better insight into interdisciplinarity (Porter et al. 2007).
Comparison of the datasets in 4 different columns in Table 1 reveals a remarkable
similarity in the share of most macro-disciplines, with an exception of minor
differences for Agricultural Science and Cognitive Science.

Published online: 11 February 2012 in Scientometrics, DOI 10.1007/s11192-012-0655-3
4
Appraisal of cross-disciplinary coverage through a science map
Based on the overall similarity in the disciplinary share discussed above, we feel
any dataset used to create Table 1 to be suitable for construction of a Science
Overlay Map to visualize the internal dynamics of the research output
(publications) or outcome (citations). To gain overall insight for both CAST and
CRIS, all 611 items were assigned to individual SCs without fractionation (i.e., if
an item was assigned to 3 SCs, each of them received a score of 1 rather than 1/3)
to draw a 2-dimensional map (Fig. 3). In the map, macro-disciplines and SCs with
a predominant share (percent relative to 611 items) were identified as follows:
a) Biomedical Science: Biochemistry & Molecular Biology (20.1%); Genetics &
Heredity (8.7%); Biophysics (7.4%); Biotechnology & Applied Microbiology
(7.0%).
b) Materials Science: Polymer Science (9.3%); Material Science,
Multidisciplinary (4.9%).
c) Chemistry: Chemistry, Physical (6.1%); Chemistry, Multidisciplinary (5.2%).
d) Agricultural Sciences: Plant Sciences (6.7%), Food Science & Technology
(4.7%).
The map is advantageous in its power to discriminate SCs with a minor
contribution (e.g., Paleontology, with <0.5% of the total output; top right in Fig.
3). Whole counting, however, variably enhanced the visibility of individual SCs
and macro-disciplines in the map compared to the use of fractional counting used
to generate data in Table 1. The score for „Multidisciplinary Science‟ comprising
specific set of journals assigned only to this SC remains unaffected by the
counting method. For other SCs contributing at least 1% of the 611 items using
fractional counting, whole counting enhanced the share by a factor of 1.10 (for
Zoology) to 3.37 (for Chemistry, Applied), with an average of 1.73. At the level
of macro-discipline, Physics and Ecological Science exhibited the least
enhancement (ca. 1.3), whereas a maximum value of ca. 2.1 characterized
Chemistry and Clinical Medicine.
Co-word analysis and visualization of clusters
Datasets from CAST and CRIS were analyzed for co-words in titles separately to
reveal distinctive peculiarities. Selected words and 2-D visualizations of their co-
occurrence relations forming clusters are presented in Tables 2&3 and Fig. 4.
Vosviewer allowed zooming and viewing specific areas as color density maps,
enhancing readability and interpretation.
Research outcomes from activities initiated at CAST, and continued at CRIS for
some time (mainly as former next-generation post-genome and genome dynamics
research divisions, during FY2005-2008) were as follows: chromosome-based
molecular cytogenetic/karyotypic studies of animals (clusters 1, 6 in dataset 1 and
clusters 8, 10 in dataset 2), phylogeny of mammals through ancient and modern
DNA analyses (cluster 3 in dataset 1), and taxonomic/phylogenetic
characterization of red and green algal species (cluster 4 in dataset 1). Cluster 7,
protein-structure analysis, was another prominent theme in both datasets.
Published online: 11 February 2012 in Scientometrics, DOI 10.1007/s11192-012-0655-3
5
The following most productive fields (corresponding clusters in dataset 2, Fig. 4b)
were clearly evident for CRIS: synthesis, and characterization of
polymers/macromolecules/gels (cluster 1); photochemical fabrication of nano-
devices using molecular crystals or organic materials (cluster 2); human cell
culture using fish collagen and production of honeycomb film scaffold for
transplantation (cluster 3); rhizosphere – the plant root & soil environment and
new cultivation system (cluster 4); zoonotic diseases including avian influenza
(cluster 5); gastrointestinal tract/biosphere and functional enzymes/foods, etc.
(cluster 6); and, genomic expression in sea squirts (clusters 9& 10) from the
world‟s oceans.
Coupling pattern of journals as indicators of scientific specialties
The complete dataset (N=611) was analyzed for bibliographic coupling in terms
of journals in the cited references that serve as the knowledge base; this also
provided information on scientific disciplines. Of the 20,834 total references
cited, 11,253 belonged to 2,696 journals indexed in WoS. Visualization in a 2D
map involved running bibJourn.exe at a threshold of 0.2% (only journals
appearing in at least 22 cited references) to obtain a matrix of Salton cosines, and
further processing with Pajek after partition.
Figure 5 shows the mutual arrangement of 93 coupled journals (in cited
references). Ten journals (each provided with corresponding frequency) that
topped the list of the knowledge source consulted by (co-)researchers from CAST
and CRIS were: Nature (255), Science (245), P Natl Acad Sci USA (204), J Biol
Chem (147), J Am Chem Soc (96), Cell (82), Nucleic Acids Res (80), Phys Rev
Lett (77), J Mol Biol (75), and Biochem Biophys Res Co (74). The first 3 journals
belong to the “Multidisciplinary Sciences” according to the ESI 22-field division,
but are included in the “Biomedical Science” macro-discipline (Fig. 3) in the 18-
cluster classification we have used (Fig. 3). The size of each node labeled on the
map reflects the frequency of citations of journals. The mutual separation of nodes
increases with decreasing coupling relationship, and the thickness of connecting
lines indicates the strength of the joint relationship. In Fig. 5, three important
groups of journals are enclosed by ovals. The area designated roughly as
„biomedical and agricultural sciences‟ is very broad and surely exhibits an
interdisciplinary nature.
Discussion and conclusion
The percentage share of the 2002-2010 research outcome from CRIS (partially
also from CAST) in terms of 222-ISI SCs, 18-macro-disciplines, and further
aggregation into 4 fields (Biomedical Sciences, Physical Sciences, Environmental
Science & Technology, and Social Sciences) using the fractional counting method
revealed that 3 fields in Science & Engineering comprise almost the whole
dataset, with a fairly large share for each (varying between 23 and 45%); the
Social Sciences field was virtually absent (Table 1). An overlay science map
revealed the disciplinary structure at the level of SCs, again showing the clear
dominance of Biomedical Science (including 6 items or only a 1% share of the
Multidisciplinary Sciences category), Material Science, Chemistry, and
Agricultural Sciences.

Published online: 11 February 2012 in Scientometrics, DOI 10.1007/s11192-012-0655-3
6
Co-word analyses for titles separately for CAST and CRIS revealed clusters such
that the word assemblies allowed recognition of research themes leading to the
production of an appreciable number of publications in journals recognized and
indexed in the WoS database.
Themes marked by clusters simultaneously in the CAST and CRIS data (Tables
2&3; Fig. 4a, b) on genetic/genomic and protein structure analyses were indeed
interdisciplinary, as evidenced by significant overlaps among the clusters. The
genetic/genomic studies involved close collaboration among researchers from the
Graduate Schools of Science, Advanced Life Science, and Agriculture as well as
many researchers from institutes abroad, and the objects studied (e.g., animals,
algal species) have global coverage (Hokkaido University 2011). The protein-
structure studies focused on trailblazing research on DNA-protein-sugar chain
mechanisms, and the findings served as the basis for collaboration between HU
and businesses (e.g., companies engaged in the medical care/pharmaceutical
sector) for drug development/discovery R&D projects. Most of these studies are
currently being continued at the Genome Dynamics Research Center (since 2008)
and the Frontier Research Center for Post-Genome Science & Technology
(mainly since 2007) affiliated with the Faculty of Science and the Faculty of
Advanced Life Science, respectively (Hokkaido University 2011).
Clusters identified from the CRIS data (Table 3; Fig. 4b) reflect very well the
most productive projects (clusters 2, 4, 9, 10), led by 3 young researchers nurtured
at CRIS‟s Innovative Research Division and one of the two frontier research
programs. Likewise, results of the strategically promoted interdisciplinary team-
based research conducted under the HUR&BP Project on (i) Development of
Diagnosis & Treatment of Zoonosis, (ii) Tissue Transplantation & Engineering,
and (iii) Safe & Sustainable Food Production define clusters 5, 3, and 6,
respectively (Hokkaido University2011). Team research on tissue regeneration
and bio/nanotechnology-based medical care pursued in the Frontier Research
Division also contributed significantly to the study of polymers/biomaterials
(Materials Science).
A bibliographic coupling analysis (Fig. 5) showed that almost all journals serving
as the most representative knowledge base for our dataset belong to the
Biomedical and Agricultural (including some related to environment) Sciences,
Chemistry, and Materials Science, reinforcing the similarity with findings from
disciplinary assignments and the co-word analyses. Other notable SCs (macro-
disciplines) detected from a joint analysis of all previous data, although
comparatively less productive, seem to be Physics (see Figs. 3, 5), Neurosciences
(Cognitive Science), and Geochemistry & Geophysics (Geosciences). These
disciplines have been actively pursued by the frontier research team dealing with
„molecular/structural simulations of superconductors‟, the 4th innovative research
project at CRIS, and the Isotope Imaging Laboratory in the Strategic Project
Research Division, respectively. These themes are partly representative of the
trans-disciplinary research carried out as innovative projects by young researchers
and by other programs that engaged researchers transcending various departments
and also businesses.
Published online: 11 February 2012 in Scientometrics, DOI 10.1007/s11192-012-0655-3
7
Comparison of data for different time spans at the level of each macro-discipline
(Table 1) reveals relatively lower values for Agricultural Science and Cognitive
Science in the last column for items citing 329 publications for 2005-2008. Such
low values may have resulted from the comparatively low annual volume of
publications in these 2 macro-disciplines during the period concerned.
Publications in Agricultural Science showed an already clearly increasing trend
from 2005, whereas Cognitive Science showed a slight recovery after an almost
lack of publications during 2007-2008. As these trends in the publication volume
were dictated by several factors (e.g., completion of the HUR&BP Project in
April 2008; continued funding to a few selected projects), these minor variations
are not important. However, a longer period (e.g., at least 5-6 years) could be
more representative if the aim were to judge the average productivity and impact
at the level of an institute.
An almost complete absence of items in Social Sciences in the WoS records was
clear, even though CRIS had a few research programs engaged partly in this field,
i.e., the Environmental Science & Technology Policy Program under HUR&BP
and 2 research projects in the Innovative Research Division (Hokkaido
University, 2011). Filling the information void in social sciences would require
consulting non-WoS journals (including those written in Japanese) and other
modes of publications (e.g., monographs). It remains to be seen to what extent
such an approach would be necessary for a fuller appreciation of the research
output in other science and engineering fields.
The analyses and interpretations attempted so far, though largely descriptive, have
demonstrated the usefulness of bibliometry as a tool for recognizing the
comprehensive knowledge structure (output and outcome) at the level of an
institute at Hokkaido University. Further analyses using other network tools that
combine several different pieces of information (e.g., word-author-journal) and
2D visualization as time-series maps will surely give insight into shifting
tendencies in research practice, emerging disciplines, etc., and thus provide data
useful for strategic planning.
CRIS is an institute with the mission of promoting/conducting cross-disciplinary
research, and the body of knowledge already produced there indeed involved
teamwork and collaboration. However, it is desirable to apply indicator-based
methods, such as those suggested by Leydesdorff & Rafols (2011) and Wagner et
al. (2011), to judge the extent of multidisciplinarity (simple integration),
interdisciplinarity (a holistic approach with input from various disciplines leading
to partial/complete fusions, novel syntheses, etc.), and transdisciplinarity
(extending beyond or crossing the restricted boundaries of constituent disciplines,
research participants, etc.) in quantitative/statistical terms.
Finally, we emphasize that there is a clear need for applying bibliometric data
objectively, with due consideration of the mission, structure, temporal
characteristics, etc., of the research establishment in question.
Acknowledgments
We are grateful to I. Uyeda and H. Okada, the current and former Executive Directors of CRIS, whose advices and opinions during discussions provided insights for interpretation. We thank

Published online: 11 February 2012 in Scientometrics, DOI 10.1007/s11192-012-0655-3
8
Matthew H Dick, Professor at the Graduate School of Science, for many comments to achieve
clarity in interpretation and the linguistic improvements. We were encouraged very much by T.
Ogawa, Deputy Director of CRIS, to perform this experimental analysis on the CAST and CRIS
datasets. It is to emphasize, however, that we as authors are solely responsible for the approach,
analyses, and interpretations presented in this paper.
References
BibJourn.exe (2011). A program for cocitation analysis of journal names in references written by
Loet Leydesdorff. Downloadable from: http://www.leydesdorff.net/software/bibjourn/index.htm
Hokkaido University (2011). Hokkaidou daigaku souseikennkyuukikou 9-nenkan no ayumi (Nine
years of Creative Research Institution (CRIS), 125+ pp. (Internal publication of Hokkaido
University, Sapporo, Japan, in Japanese)
Leydesdorff, L. & Rafols, I. (2009). A global map of science based on the ISI subject categories.
Journal of the American Society for Information Science and Technology, 60(2), 348–362.
Leydesdorff, L. & Rafols, I. (2011). Indicators of the interdisciplinarity of journals: Diversity,
centrality, and citations. Journal of Informatics, 5(1), 87-100.
Persson, O. (2009). Bibexcel – A toolbox for bibliometricians. Version 2009-11-26. Downloaded
from: http://www8.umu.se/inforsk/Bibexcel/index.html
Pajek 2.00 (1996-2010) developed by Vladimir Batagelj and Andrej Mrvar. Freely available for
non-commercial use from: http://pajek.imfm.si/
Porter, A.L., Cohen, A.S., Roessner, J.D. & Perreault, M. (2007). Measuring researcher
interdisciplinarity. Scientometrics, 72(1), 117–147.
Rafols, I., Porter, A.L. & Leydesdorff, L. (2010). Science overlay maps: A new tool for research
policy and library management. Journal of the American Society for Information Science and
Technology, 61(9), 1871-1887.
Van Eck, N.J. & Waltman, L. (2010). Software survey: VOSviewer, a computer program for
bibliometric mapping. Scientometrics, 84, 523–538. Program downloadable from:
http://www.vosviewer.com/
Wagner, C.S., Roessner, J. D., Bobb, K,, Klein, J.T., Boyack, K.W., Keyton, J., Rafols, I. &
Börner, K. (2011). Approaches to understanding and measuring interdisciplinary scientific
research (IDR): A review of the literature. Journal of Informetrics, 165, 14-26.
Figures with Captions
Published online: 11 February 2012 in Scientometrics, DOI 10.1007/s11192-012-0655-3
9
Fig.1 Annual distribution of 643 citable publications with (co-)author affiliations to CAST &
CRIS, HU, and their citations each year retrieved from WoS on January 15, 2012. Period
applicable: 1996 to 2011
Fig. 2 Breakdown of the 2002-2010 citable items into macrodisciplines (parts of 18 clusters) and 4
broad field categories (Leydesdorff & Rafols, 2009). The Social Sciences category (not shown
here) has a share of merely 0.2%. Number of items analyzed: 561
Published online: 11 February 2012 in Scientometrics, DOI 10.1007/s11192-012-0655-3
10
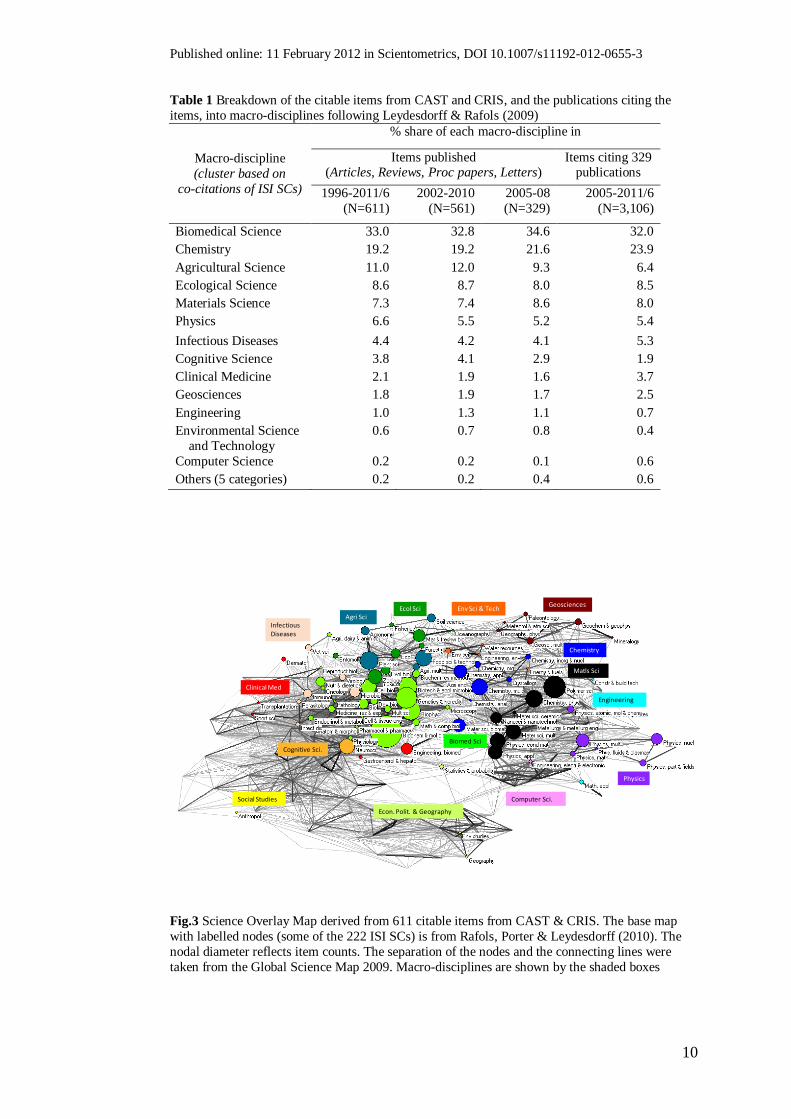
Table 1 Breakdown of the citable items from CAST and CRIS, and the publications citing the
items, into macro-disciplines following Leydesdorff & Rafols (2009)
Macro-discipline
(cluster based on
co-citations of ISI SCs)
% share of each macro-discipline in
Items published (Articles, Reviews, Proc papers, Letters)
Items citing 329 publications
1996-2011/6
(N=611)
2002-2010
(N=561)
2005-08
(N=329)
2005-2011/6
(N=3,106)
Biomedical Science 33.0 32.8 34.6 32.0
Chemistry 19.2 19.2 21.6 23.9
Agricultural Science 11.0 12.0 9.3 6.4
Ecological Science 8.6 8.7 8.0 8.5
Materials Science 7.3 7.4 8.6 8.0
Physics 6.6 5.5 5.2 5.4
Infectious Diseases 4.4 4.2 4.1 5.3
Cognitive Science 3.8 4.1 2.9 1.9
Clinical Medicine 2.1 1.9 1.6 3.7
Geosciences 1.8 1.9 1.7 2.5
Engineering 1.0 1.3 1.1 0.7
Environmental Science
and Technology
0.6 0.7 0.8 0.4
Computer Science 0.2 0.2 0.1 0.6
Others (5 categories) 0.2 0.2 0.4 0.6
Fig.3 Science Overlay Map derived from 611 citable items from CAST & CRIS. The base map
with labelled nodes (some of the 222 ISI SCs) is from Rafols, Porter & Leydesdorff (2010). The
nodal diameter reflects item counts. The separation of the nodes and the connecting lines were
taken from the Global Science Map 2009. Macro-disciplines are shown by the shaded boxes
Cognitive Sci.
Agri Sci
Biomed Sci
Chemistry
Physics
Engineering
Env Sci & Tech
Matls Sci
Infectious Diseases
Social Studies
Clinical Med
Computer Sci.
GeosciencesEcol Sci
Econ. Polit. & Geography

Published online: 11 February 2012 in Scientometrics, DOI 10.1007/s11192-012-0655-3
11
Table 2 Seven clusters, each being defined by 5 co-occurring terms (selected from the set of 10
most frequent stemmed words) that reflect the most productive research themes from CAST
Dataset 1: 107 items (CAST)
Cluster No. & stemmed words: Fig. 4(a)
1: chromosom, gene, mous, chicken, fish
2: sequenc, genet, mitochondri, divers, speci
3: popul, hokkaido, brown, bear, deer
4: japan, red, solieriacea, rhodophyta, gigartinal
5: rat, salmon, structur, cell, transgen
6: molecular, karyotyp, cytogenet, evolut, shrew
7: dna, pharaoni, bind, halorhodopsin, protein
Table 3 Eleven clusters, each represented by 5 co-occurring terms (selected from the set of 10
most frequent stemmed words) that reflect the most productive research themes from CRIS
Dataset 2: 506 items (CRIS)
Cluster No. & stemmed words: Fig. 4(b)
1: synthesi, hydrogel, polym, surfac, network
2: molecular, structur, crystal, organ, cluster
3: cell, human, film, collagen, gel
4: rice, phosphoru, growth, metabol, tropic
5: mous, influenza, viru, h5n1, pathogen
6: gene, function, sequenc, isol, bacteri 7: protein, differenti, bind, neuron, signal
8: chromosom, sex, dna, induc, bird
9: carbon, microarrai, hybrid, ascidian, marker
10: intestinali, ciona, transcript, cycl, specif,
11: dynam, calcium, hydrat, first, ion
Published online: 11 February 2012 in Scientometrics, DOI 10.1007/s11192-012-0655-3
12
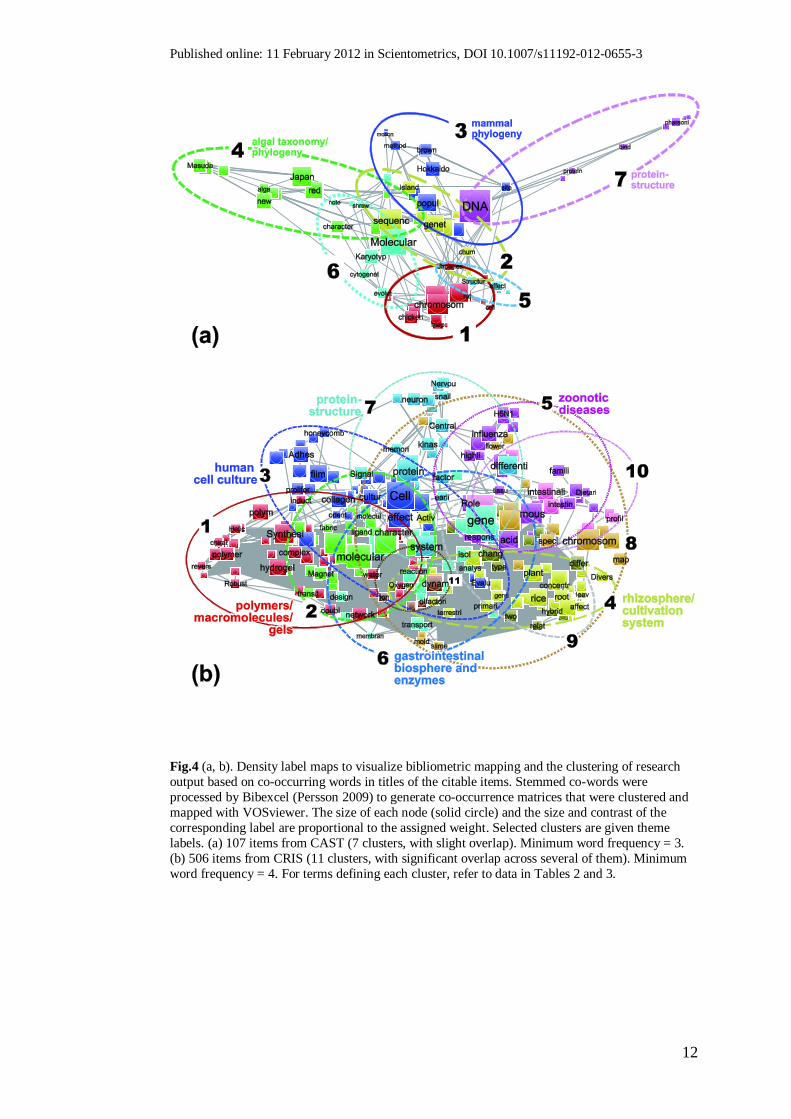
Fig.4 (a, b). Density label maps to visualize bibliometric mapping and the clustering of research
output based on co-occurring words in titles of the citable items. Stemmed co-words were
processed by Bibexcel (Persson 2009) to generate co-occurrence matrices that were clustered and
mapped with VOSviewer. The size of each node (solid circle) and the size and contrast of the
corresponding label are proportional to the assigned weight. Selected clusters are given theme
labels. (a) 107 items from CAST (7 clusters, with slight overlap). Minimum word frequency = 3.
(b) 506 items from CRIS (11 clusters, with significant overlap across several of them). Minimum
word frequency = 4. For terms defining each cluster, refer to data in Tables 2 and 3.

Published online: 11 February 2012 in Scientometrics, DOI 10.1007/s11192-012-0655-3
13
Fig. 5 2D visualization of bibliographic coupling of the 93 most frequent journals, as the
knowledge base, in cited references of 611 items. Ovals delineate 3 generalized groups, definition
of which was not restricted any particular categorization
Top Related