


Languages
Pages
Legal

Page | 1
RC Drilling & Sampling: Optimising the Quantity – Quality Balance*
René Sterk** RSC Consulting Ltd - Floor 2, 109 Princes Street, Dunedin 9016, New Zealand
Duncan Franey Explaurum Pty Ltd - G.P.O Box 3249, Brisbane, Queensland 4001, Australia
In the last few years, design improvements in reverse circulation percussion (RC) drilling
sampling systems have reignited the debate on the usefulness and appropriateness of
samples collected by RC drilling. Where RC drilling has been sometimes criticised as
being a suboptimal drilling technique for the collection of quality data for use in mineral
resource estimation work, manufacturers of new RC sampling systems now claim that
bad sample splitting and poor sample recovery are problems of the past.
However, having a good RC sample splitting system doesn’t necessarily mean a good
sample is collected. In particular, the skills of the RC driller to provide a consistent sample
to the sample splitter are just as critical as the sampling system.
In this paper the authors describe cost-efficient ways to ensure the quality of drilling and
sampling through well-designed standard operating procedures (SOPs), which
incorporate practical and user-friendly systems. Such procedures permit RC drillers to
better understand the implications of drilling actions on sample quality and facilitate
better communication between the drillers and geologists.
Combining sample and drilling quality metrics with production metrics such as rig
availability and rig efficiency allows the drill rig managing geologist to manage the
sample quality on a daily basis. For example, real-time control plots can be used to
identify when a sample quality metric is likely to be out of order (instead of the resource
geologist finding such issues a week or month later). Problems identified this way can be
discussed between driller and rig geologist, as they occur, and immediately corrected.
In this paper, examples of such a quality monitoring system are provided along with
examples of how the system has improved metre delineation, sample recovery, sample
splitting, water and dust management in exploration drilling programmes.
Article history:
Received 21 May 2017
Received in revised form
Accepted
A B S T R A C T
Keywords:
RC drilling
sampling
QA/QC
* A previous version of this paper was first published in the Conference Proceedings for the Drilling for Geology Conference, organised by the AIG
**[email protected], +64 211 78 55 00

Page | 2
INTRODUCTION
Each year, the Australian mineral industry drills
between 2,000 km and 3,000 km for mineral
exploration (Australian Bureau of Statistics, 2017). Of
this, reverse circulation percussion (RC) drilling is the
major component. Most exploration professionals
consider that RC drilling can provide a good-quality
sample that is cheaper and faster to collect than
diamond core (DC) drilling samples, albeit that RC
drilling does not provide the same level of geological
information that is usually available with DC drilling.
In the last few years, design improvements in RC
drilling sample-splitting systems have reignited the
debate on the usefulness and appropriateness of
samples collected by RC drilling. While RC drilling
has been criticised by some as being a suboptimal
drilling technique for the collection of quality data for
use in mineral resource estimation work, others argue
that bad sample splitting and poor sample recovery are
problems of the past.
However, having a good RC sample splitting system
doesn’t necessarily mean a quality sample is collected.
The ability of the RC driller to provide a consistent
sample to the sample splitter are just as critical as the
sampling system.
Opportunities for sampling quality improvement are
often missed because:
• The quality of the sample, which is the most
important aspect of the entire drilling exercise, is
rarely included as a deliverable in any drilling
agreement.
• The two main parties (the geologists and the
drillers) often communicate poorly, due to either
lack of experience and/or incomplete
understanding of each other's requirements.
• There are no real-time systems in place to
adequately monitor quality or performance of the
drilling and sampling.
The goal of this paper, therefore, is to review how the
quality of samples delivered by an RC rig can be
improved through the incorporation of the latest
updates in sample-splitting technology together with
robust sampling procedures and processes.
THE DRILLING CONTRACT
Quality sampling starts with a good understanding
between the two parties on the exploration programme
requirements. Quite often, for smaller exploration
companies, the drilling contract between driller and
explorer is often an afterthought, a standard contract
cobbled together from versions of prior projects. Most
drilling contracts between larger companies and
drillers span many pages, with the contract’s primary
focus being on safety, production management, and
legal clauses.
However, a drilling contract clause that specifically
discusses sample quality is seldom included. Such a
clause should always be included into the drilling
contract, to bring sample quality into the contract
discussions, and to create a framework for discussion
of the quality of the results, before the drill rig arrives
on site. In this way, there is a clear understanding that
the primary service to be provided is the quality of
samples, not sample production rates.
A sample quality clause can be included in an
appended schedule and should include expectations
on:
• Sample recovery
• Sample delimitation
• Sample extraction
• Water control
• Collaring practices
• Acceptable equipment
• Hole tolerance guidelines
• Dust control
• Sample splitting accuracy
• Sample splitting precision
• Drillhole deviation
Defining sample quality constraints in a drilling
contract can be challenging; however, with the use of
clear and unambiguous wording, frequent
communication between drillers and geologists, good
monitoring systems, and an open and positive
approach to maintaining sample quality, the net
benefit in terms of sample quality will always be
positive. The cost-benefit of the small financial
investment required to implement quality sampling
systems is readily demonstrated in all exploration
endeavours.
COMMUNICATION
A contract agreement regarding sample quality only
works well when the rig geologist and driller can work
collaboratively. The geologist in charge of an RC rig
may be young and inexperienced, and both geologist
and drillers may lack specific training in project
management communications.
Page | 3
A rig-management geologist may not fully understand
the subtleties and intricacies of RC drilling, unless the
geologist has spent significant time at an operating RC
drill rig drilling in a variety of ground conditions. As
such, the inexperienced geologist will not understand
how subtle changes in ground conditions can affect
sample quality. Unfortunately, geologists who do
build up practical knowledge regarding RC drilling
often end up being promoted out of the field before
they can transfer this knowledge onto the next
generation of young rig geologists.
Importantly, geologists and drillers need to discuss the
issues that may affect sample quality before the
drilling programme starts. Specifically, there needs to
be a pre-agreement on what criteria define a quality
sample, which comes from mostly good
communication.
Initiatives that facilitate a better understanding and
communication regarding exploration drilling include:
• Training of geologists before they are put in to the
position of managing a drilling programme. Such
training should include theory on quality
assurance and control, the workings and drilling
principles of an RC rig, explanations of various
important components of a rig, and
drilling/sample recovery situations commonly
encountered in different ground conditions. There
are several industry service providers that can
provide this type of training if in-house expertise
is unavailable.
• All drilling programmes should include:
o An office-based commencement
workshop for the drillers and geologists,
where the programme objectives are
explained, the expected ground
conditions are discussed, and access and
logistical issues are made clear. Later, in
a field-based workshop, the driller
should explain how the rig works and
key safety issues related to the drilling
process. The more detail, the better, such
as demonstrating to the geologists a dry-
run of a rod and run-through of some
possible sampling scenarios. The driller
should also collapse the rig mast so the
geologists can inspect the sampling
system from bit to sample bag through
the whole RC sampling collection
system.
o Weekly quality meetings during the
programme, where drillers and
geologists meet to discuss sample
quality aspects along with data and
graphs of quality monitoring results.
• The implementation of a quality management
system that helps facilitate communication as
described further below.
RESOLVING RC SAMPLE QUALITY ISSUES
Creating a monitoring system for the quality of the
samples is only possible if the sources of potential
errors are understood. The following sections discuss
some of the primary sources of errors.
QUALITY OF THE PRIMARY SAMPLE
As discussed above, specification of the expected
quality of the primary sample is very seldom
addressed in pre-programme discussions or drilling
contracts. Often, geologists, when preparing post-RC-
drilling reports, will prepare many pages of graphs
regarding the performance of laboratory quality
standards, but then fail to include a single word on the
monitoring of the quality of the primary sample. At
best, report discussion will include the quality of
sampling from the rig splitter, with the quality of the
primary sample simply implied to be "good".
Importantly, the primary sample (otherwise called "the
lot") is collected at the bottom of the drill string, where
the hammer is breaking up rock over a designated
interval.
The importance of the primary lot generation point is
acknowledged in "Table 1" of the JORC Code (JORC,
2012). The first entry in Section 1 of Table 1 requires
a Competent Person to discuss the quality of the
primary sample. However, too many practitioners only
include information on the RC sample splitting (for
example the ‘field duplicate’), and frequently include
information regarding laboratory preparation and
analytical processes, which should be described in
other subsections of Table 1. These reporting trends
demonstrate that the industry is not focussing on the
quality of this primary sample and to some extent there
is confusion as to how to discuss the primary sample
under JORC Code guidelines. The key omission here
is the understanding that the largest sample errors
occur at the primary sampling stage.
Mineral resource estimation (MRE) is based on
interpolating or extrapolating assay results from
drilling data to estimate the grades of larger volumes.
The assay point data are derived from the RC
subsampling, which often reflect one-metre down hole

Page | 4
drilling intervals. Explorers not immediately familiar
with the estimation process may not immediately
appreciate that, for example, a 30 g fire assay result
may be informing the grade estimate of a mining block
with a mass of >750,000,000 g. Given these order-of-
magnitude mass differences between assay results and
the block size, it is intuitively important for this assay
to be as representative as possible of the primary
sample, meaning that the sample accuracy and
precision are suitable for block grade estimates.
Sampling situations, issues and problems can be
discussed using the standard nomenclature developed
by Pierre Gy in the 1960s (Gy, 1979). For splitting
processes the sampling errors pertinent to RC
subsampling are the Extraction Error (EE),
Delimitation Error (DE), and Preparation Error (PE),
as discussed in the subsections below.
Sample Delimitation Errors
Ideally, the assay resulting from the subsampling and
analysis of a one-metre down-hole drilling interval
will be fully representative of the actual metre drilled.
Usually this means that the assay result lies within
what is deemed to be an acceptable variance from the
true (but unknown) primary sample grade and that
there has been no significant bias in the sample
collection of the targeted primary sample.
Compared to diamond core (DC) drilling, RC drilling
has lower boundary resolution because RC sampling
on fixed intervals means that the sample often
transects geological and grade estimation domain
boundaries. Specifically, with DC drilling, sample
intervals can be selected at key geological contacts,
but with RC drilling, the sample delimitation is
controlled by the regular sampling interval. As such,
RC drilling may not be a suitable method for narrow
tabular mineralisation.
Even when RC sampling is considered appropriate for
the mineralisation under consideration, each sample is
expected to be (exactly) a one-metre interval.
However, if attention is not paid to the advancing drill
string, a delimitation error (DE) will occur and the
resulting subsampling will not represent a one-metre
primary sample. The outcome of such delimitation
errors is an increase in the data variability due to the
difference in sample support between samples. For
confidence in MRE work the assay results should
reflect the true variability of the one-metre intervals,
not the inflated variability that occurs when short
samples are introduced in the MRE database.
DE problems are common in RC drilling programmes
when:
• The metre marks are not properly delimited on the
rig pull down chains and the systems in place to
mark the end of a metre are based on general
visual judgments by drillers or off-siders. Marks
on the mast or chain are often quickly obscured by
dust and/or grease and difficult to see.
• Inattention by the driller in observing the metre
marks when samples are dumped to the
cyclone/sampling system.
• Drilling practices exist, such as slightly over
drilling the last metre of a drill rod to protect the
hammer resulting in the sample support of the
last-rod-sample being say 1.1 m long, while the
first-rod-sample of the subsequent drill rod is 0.9
m long.
These are common issues and the resulting
delimitation errors are often underestimated and
ignored.
Sample Extraction Errors
As the rock is broken up at the hammer down the hole,
the stream of air and sample cuttings enter the RC
inner tube due to built-up air pressure in front of the
bit shroud, which is designed (largely) to prevent the
air from the outer tube of the RC rods from escaping
between the rods and drill hole walls. The sample
stream then proceeds through the sample delivery and
collection system (cyclone) to end up reporting to the
cyclone underflow, from where it reports to the
sampling system. Ideally, all the rock fragments from
a single metre of drill advance should end up in either
the split sub-sample bag(s) or the splitter reject. When
some part of or size fraction of the sample material
does not end up reporting to the cyclone underflow and
sampling system, then an Extraction Error (EE)
occurs. Like the DE, the EE may create an
unacceptable bias and/or inflate the variance of the
MRE data set.
EE can be introduced in RC drilling through:
• Loss to outside return. A worn shroud, too-
narrow rods, or excessively large tolerance
between shroud diameter and bit diameter may
lead to poor sealing of the air stream and instead
of all the sample stream returning through the
inner tube, some fraction is returned to surface
outside the rods. A 3-mm diameter difference

Page | 5
between bit and shroud is generally the
recommended maximum tolerance for good RC
sample recovery. However, some drillers
intentionally set greater tolerances to prevent
bogging and increase drill advance rates by
‘wasting’ some of the primary sample. Drillers
rarely communicate this information with the rig
geologists and such sample quality trade-offs
should be agreed before the drillers make this
decision.
• Blowing out the hole too vigorously between
rods, resulting in hole wall cavitation and (over)
delimitation error, particularly in softer rock
types.
• Lack of air pressure, worn O-rings, blown
inner tubes, lack of rig compressor capacity.
Any of these conditions may result in a situation
where there is insufficient air pressure to lift all
the primary sample up the rod string during the
metre advance. Typically, insufficient air pressure
results in the primary sample being excessively
re-ground and pulverised at the hammer, with
sample material lost by bypassing the shroud to
the outside return or excessive fines loss from the
RC cyclone vortex finder.
• Not allowing time to let samples clear the
system. At the end of each metre, time is required
for all sample cuttings to travel from the bit
through the inner tube to the sampling system.
Removing the sample bags right on the time when
the metre mark is reached means some sample
from that interval will still be travelling to surface
and will inevitably end up in the next sample.
One solution is to pause briefly at the end of each
sample interval to allow the sample to properly
clear the system before the next metre is drilled.
The pause interval needs be increased with the
depth of hole and a simple calculation of air flow
rates, pipe diameters and depth can give an
indication of the clearance time required.
However, this requirement will, of course, reduce
the average drill hole advance and is one of the
more contentious issues that should be dealt with
at the drilling contract stage. Some explorers'
operating procedures require the driller to pause
for up to 10 to 15 seconds at the end of each metre
sampling interval and to “pull the rods off bottom"
and let the hammer “fire out”. This process means
that the RC hammer will lose contact with the
bottom of the hole and will quickly lock and the
air flow should clear through the sample system.
However, some drillers will not like to execute
this procedure because:
o According to some, the process can
damage the RC hammer or the bit rim
ring as the bit design is to preferably
hammer against some support, not for
the piston to fire against open air.
o When the bit is locked and not
hammering, excessive air is lost through
outside return. When the bit is placed
back at the bottom of the hole, the
pressure must be re-established at the
cost of increased diesel consumption.
o When the hammer face is placed back at
the bottom of the hole, unplanned hole
deviation may occur, especially in the
case of using a large shroud tolerance.
Some drillers prefer to let the hammer fire out at the
end of each sampling interval but keep the bit rested
on the bottom to keep the air pressure high and
minimise the risk of bit damage. Significant
experience is required to get this right, and not all
drillers seem to agree on best practice here.
Wet Drilling: Sample Preparation Errors
RC sampling is designed to occur under dry ground
conditions. Compressed air powers the hammer and
carries the drill cuttings to surface through the inner
tubes in the RC drill string. Ideally, injecting very high
pressure air down the hole creates an air pocket ahead
of the drill shroud, so that each drilling interval is kept
dry, even if the sampling interval is below the
groundwater table.
However, when a new rod needs to be added and the
bit is below the water table, the temporary reduction in
air pressure may result in flooding of the hole with
groundwater. In this situation, it is now common
practice to first use a blow-down valve to clear water
from the hole through the outside return, by directing
a blast of high pressure air down both inner and outer
tubes. Drilling can then re-commence under dry
drilling conditions.
Page | 6
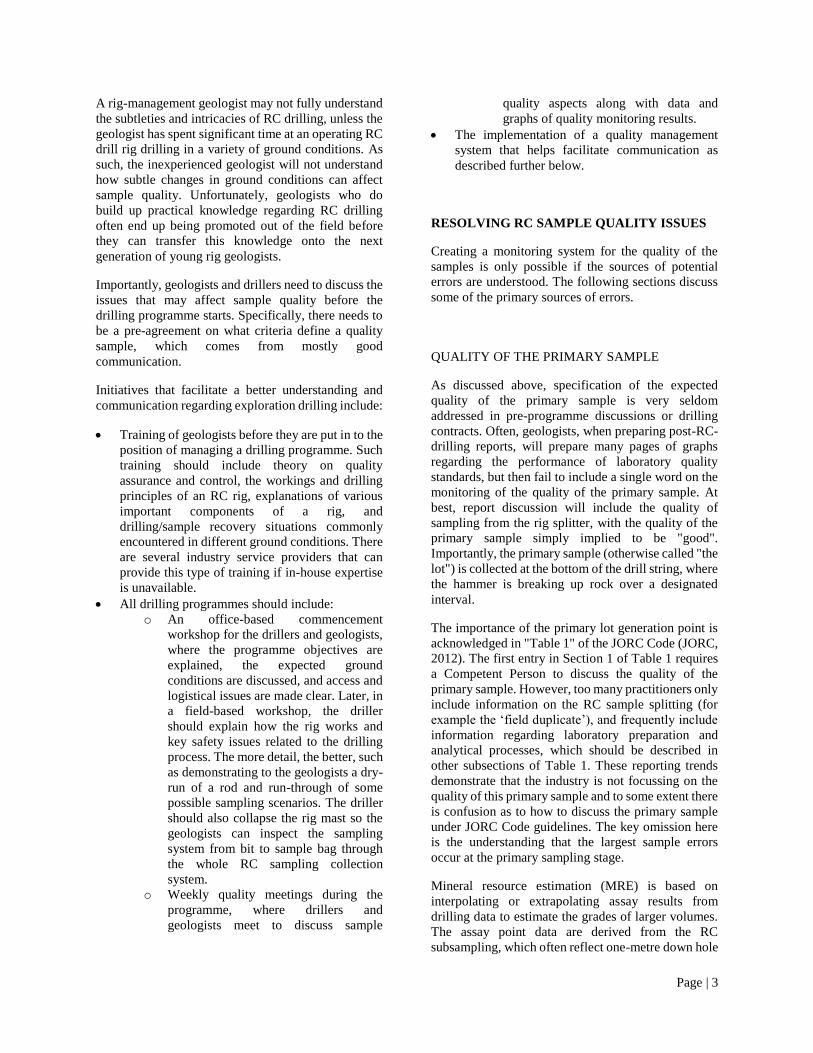
Figure 1 A classic rig-mounted static cone sampling tower

Page | 7
Even with good-practice drilling, it is inevitable that
water will sometimes enter the hole when water-
saturated broken-ground conditions are encountered,
and/or the available air pressure is momentarily
insufficient to drive water away from the advancing
bit. While it may be possible to increase air pressure to
keep the hole dry there is a risk that a too-high pressure
could blow out the collar seal and the hole would have
to be abandoned.
In the case of water inflow due to local conditions of
broken ground, it may be possible to drill beyond the
broken zone (producing wet samples) and then
continue dry drilling as normal. In such situations, the
geologists and drillers need make sure that the
sampling system is appropriately cleaned of mud
build-ups at the first available rod-change, and they
should note on the electronic logging sheets that the
condition of the sample collected is likely to be of poor
or suspect quality.
In the case where significant continuous water inflows
are encountered, the driller may need to secure collars
by cementing them. This adds significantly to time and
cost, and the benefit does not always outweigh the cost
of having the occasional wet sample returned from the
bottom of some drill holes. This is where discussion
regarding expected ground conditions (particularly
expected water inflows) before the start of a drill
programme and each drill hole are valuable.
Even though some authors consider that good quality
sampling is possible under wet drilling conditions
(Carswell and Sutton, 2014), preparation errors (PEs)
always occur when RC drilling happens under wet
conditions due to loss of fines in the slurry water. The
best solution here is to switch to DC drilling when RC
drilling is clearly not meeting quality sample
requirements.
QUALITY OF THE SECONDARY SAMPLE (RIG
SPLIT SAMPLE)
After the sample cuttings have passed through the
inner tubes and the sampling hose, the sample stream
exits the RC cyclone to the sample splitting system.
The primary sample mass then needs to be reduced to
provide the laboratory with a manageable sample mass
from the primary sample, which is typically 35 kg to
45 kg for one-metre drilling interval. A manageable
mass is typically in the range of 2 kg to 4 kg, although
some mineralisation types require split samples larger
than 4 kg.
There are a variety of RC subsampling systems on the
market, and all require a cyclone to separate the
particulate sample cuttings from the high-pressure air
prior to subsampling (Figure 1). A cyclone is
effectively a particle size -and density separation
device and the micron-sized fines from the sample
stream are lost from the top of the cyclone unless
specific measures are implemented to catch these
fines. The coarse particles exit at the base of the
cyclone.
The sample cuttings are usually collected into a
cyclone dump box before this primary lot is gravity-
fed into the splitter. Splitters typically used in RC
subsampling are commonly static cones, rotary cones,
or tiered riffle splitters. These sub-sample splitting
systems may be mounted on the drill rig, on a separate
trailer, or simply mounted on the ground as separate
cyclone and splitting devices.
In the first sample splitting stage, several sampling
errors can and usually do occur. The main argument
against the use of RC drilling for sample collection for
MRE work is that even under optimum conditions, a
sample bias will always be present when sample fines
are lost from the sample collection system.
Conventional sampling systems such as the popular
static cone splitters produce a potentially biased
sample, due to the fact that it is very difficult to make
sure that material is presented to the splitter
consistently.
Sample Delimitation Errors
Sample delimitation errors are common on both static
cone and tiered riffle splitters. The designs of both
these splitters, as per the theory of sampling, are
incorrect, particularly the static cone. Notwithstanding
the incorrect designs, these splitters can also introduce
additional biases due to improper feeding of the
sample stream to the splitter and state and maintenance
of the equipment.
For a static cone splitter to deliver a correct sample the
sample stream must be uniformly distributed when
delivered to top of cone, as only one part of the sample
stream is directed to the laboratory subsample. A
uniform distribution from a cyclone dump-box is
problematic regardless of the dump-box door design
(butterfly, sliding, single-flap) as the sample collected
in the dump box will be delivered inconsistently to the
cone, producing a DE and a bias, particularly if the
material in the dump box is segregated. Additional
bias will occur if the splitting system is not perfectly
level. Commonly, regardless of how the sampling

Page | 8
system is mounted, static cone splitters have a high
sub-sample mass variability resulting in a potential
systematic grade bias.
For tiered riffle splitters, most sample feed designs are
incorrect with designs releasing material too quickly
onto one side of the riffle splitter, choking the device
and introducing biases due to sifting segregation.
Almost all riffle splitters mounted on an RC sampling
system are tiered, comprising three or four tiers of
riffles. Tiered riffle splitters assume mixing of
material between tiers, which is an unrealistic
assumption, and the subsamples are therefore
incorrectly delimited. They are also highly sensitive to
long-axis levelling. Any tilt results in uneven
presentation of the flow from the exit chute of one
riffle onto the vane below. This is exacerbated from
level to level, and a very slight tilt can induce a large
departure (bias) in split proportion away from the
theoretical mass. If flow segregation develops
downwards through the chutes, then the mass bias will
lead to grade bias also.
Sample delimitation errors also occur with incorrect
operating procedures of the equipment. Often, after
years of usage, the sample shoots on the splitter, which
regulate the size of the sample, may be blocked or
damaged. Using a crowbar or other device to force the
cone splitter sample shoot sliders to move may lead to
bent chute blades and a biased sample. The duplicate
cone splitter chutes are commonly operated like
scissors, and uneven setup may result in the two chutes
giving a different split weight. Older sampling systems
that are not well-maintained may often have either the
knife valve or the lower cyclone dump box doors stuck
and drillers may drill with these doors open. This
practice will result in sample segregation of coarse and
fine particles as the vortex airflow created in the
cyclone will likely generate a preferential path for the
material, with the result being a more substantial bias
of one side of the splitter over the other.
Geologists need to communicate clearly with the
drillers before contract commencement as to what
sample systems are to be used and how the systems are
to be maintained. The geologist must inspect the
systems before the rigs and sampling systems are
mobilised to site and should seek independent expert
advice on mechanical issues that they may not have
the skills to assess. There should also be a clear
understanding on how sampling systems are to be
used.
Sample delimitation is the primary focus for
improvement of a new generation of RC sampling
systems, such as the Metzke SplitterTM (Metzke,
2017), the Corporaal TruSplitTM (Corporaal, 2017),
and the Progradex PGXTM sampling systems
(Progradex, 2017). Such systems come with a price
and before they are widely adopted and further fine-
tuned by the industry, it pays for the geologist to match
the purpose of the programme with the targeted quality
of the sample: it may not be a problem running a
standard cone splitter for a greenfields base-metal
drilling programme, but a coarse gold resource
definition drill-out will require optimum sample
quality control.
Sample Extraction Errors
In common with the primary sample, extraction errors
occur often at the splitting stage. The following errors
occur commonly and should be avoided where
possible:
• Loss of sample as dust. As discussed above, dust
loss is the main sampling flaw in RC drilling. The
RC drill bit pulverises the sample at the bottom of
the hole and a significant amount of this material
travels up the sampling system as very fine
material, smaller than 100 µm. As it enters the
cyclone, the larger particles will travel down in
the cyclone but a significant mass of dust will
escape out of the top of the cyclone, unless
measures are taken to collect this material (Figure
1). In styles of mineralisation where the valuable
material is preferentially contained (or depleted)
in fines, fines loss may significantly bias the
samples.
There are four ways to deal with dust. Each has its
benefits and drawbacks:
o Bulk dust collection can be done with
dust sampling tools that are linked in
with the normal sampling mechanism.
The problem with this approach is that
the dust collected cannot be attributed to
a specific metre interval, and as such,
assaying the dust component only gives
a post-sampling insight into the level of
bias occurring due to dust loss.
o Metre-specific dust collection, which
requires a specialised sampling system
such as the Progradex sampler, which
collects the cyclone dust for each
sampling interval with the rest of the
sample. While this is theoretically a
good solution, the sampler is relatively
expensive and mechanically complex,

Page | 9
leading to it currently not being widely
adopted by exploration drilling
contractors.
o Dust suppression, which involves
spraying the dusted air with a water mist
as it enters the sampling system. The
concept here is to introduce sufficient
moisture to make sure that the fine
particles agglomerate and create
particles heavy enough to gravitate
through the cyclone into the splitter, but
to not cause particles to stick to the
cyclone lining and other parts of the
sampling system. As such, dust
suppression does not always meet the
concept idea, and the geologists need to
be aware of the limitations and risks.
Geologists need to talk to drillers to find
out how much moisture they are
applying and inspect the sampling
system for build-up and clogging at the
end of each rod drilled. Due to design
flaws or other technical problems,
regulation of moisture induction on a rig
is sometimes difficult to get right,
resulting in either too much or too little
suppression. Such information is very
rarely communicated with the geologist.
o Slurry creation, which involves adding
sufficient water to the return sample
stream to create a slurry of material,
which can be sub sampled using a correct
slurry splitting device such as a Vezin-
style sampler and the Metzke rotary
splitter. However, this then creates the
problem of dealing with wet samples,
which must be dried before further
sample preparation, with possible loss of
fines in the slurry water draining from
calico bags if used, or possible losses in
flocculation/decanting process, if used.
• Sample left behind. As mentioned above,
excessive dust control water, wet drilling, or
drilling sticky materials may lead to material
adhering to the walls of the sampling system. This
means that some sample is left behind and doesn’t
end up in the sample bag, which can lead to worse
biases when sample build up blocks up the sample
system passages. A good indicator of the degree
of sample build-up is the presence and amount of
layer-cake material that falls to the ground below
and around the splitter, after the device has been
inspected and scraped clean at rod change.
Sample Preparation Errors
The geologist should be aware of the common
preparation errors that can occur with sample splitting.
Notably:
• Contamination between samples. Sampling
systems get clogged up due to the presence of wet
material, which causes contamination between
samples. And samples cross-contaminate if
proper metre delimitation is not adhered to (e.g.
the driller not pausing in between metres, see
above)
• Preparation errors due to design flaws. Some
splitting systems are not designed properly, for
instance the use of wide-rimmed sample chute
edges instead of knife-edged ones (creating
sample build-up and cross-contamination
between samples), or single-flap valves to open
the cyclone dump box (not allowing the sample to
fall over the splitter from a central point and
uniformly).
• Preparation errors due to system meddling. Ad
hoc solutions to fix problems with sampling
systems often create sample preparation errors.
For example, changing the cyclone airflow by
restricting it or otherwise modifying it, or not
using the cyclone dump box the way it is intend
to, all can cause errors.
• Preparation errors due to mishandling of the
sample. Off-siders should take care when
removing the calico sample bags from the sample
chutes to make sure that material from large bags
doesn’t spill. Each off-sider should follow the
same process when handling the sample bags.
• Preparation errors due to incorrect sample
bags/numbers. For example, using the incorrect
sample bag so that the sample is assigned to the
wrong depth. This requires diligent checking and
cross-checking during drilling to ensure that the
samples are in the correct order and that the
correct bags are being used by the drillers. Bar-
coding of sample bags with bar-code readers used
to ensure that the correct sample bags/numbers
are being used is one method (albeit expensive
and labour-intensive) of minimising these types of
errors.
Recent developments in sample splitting for RC rigs
include the development of systems that can collect
the entire sample, including the fine dust, in a
theoretically sound manner (the Progradex sampling

Page | 10
system (Progradex, 2017)), as well as systems that are
less prone to delimitation errors and can deal with wet
samples (Metzke Splitter (Metzke, 2017)).
A PRACTICAL QUALITY ASSURANCE AND
QUALITY CONTROL SYSTEM FOR RC
DRILLING
QUALITY ASSURANCE
The most cost effective way to reduce sampling errors
is for geologists and drillers to understand how
sampling errors occur and then prevent the errors by
implementing well-designed quality assurance (QA)
processes. As mentioned previously, drillers and
geologists should discuss the quality issues mentioned
above and include expectations in the drilling
contracts. Good communication and discussion of the
various sources of errors should happen before the
drilling, so that all parties understand the expectations,
as well as during the drilling. An ongoing discussion
is required to keep refining the quality framework.
Drill contractors will aim to prepare the lowest cost bid
to win a drilling tender and geologists need to consider
that such bids may not factor in high sample quality
unless the drillers are informed of the specific quality
requirements before the bid is submitted. Well-
designed standard operating procedures (SOPs) can be
used as a guideline for expectations on sample quality,
and can ensure that everyone in the team, from rig
geologists to field technicians, understands how the
various tools and practices work.
QUALITY CONTROL
Good QA is about error prevention, but a good quality
control (QC) system is also required to correct errors
as they occur. QC tools include the checks and
balances that are used to measure the performance of
the sampling system with a feedback loop for
changes/improvements to be implemented as the
sampling process is happening. For instance, at the
laboratory, where the QC concept is well-ingrained,
such tools include the insertion of standards, blanks
and duplicates, so that process control can be
monitored, corrected as necessary and kept as a record
that the laboratory assaying process are always in
control.
The same principle can be applied to RC drilling,
where subsample and/or reject bag masses can be used
to give important information on sampling
consistency. Most delimitation and extraction errors
influence the subsample weights and therefore can be
used as a good proxy for drilling quality.
Note that the purpose of QC is real-time error
correction, not post-drilling reviews weeks or months
after the process has finished. Therefore, the bag
weight data needs to be controlled as the rig is drilling,
as well as being reviewed at least daily, rather than
handing the result over for review at the end of the
programme.
QC on the Primary Sample
Assuming relatively uniform rock types and density,
dry drilling and a uniform hole diameter, each drilled
metre should result in the same expected sample mass.
If that mass is higher or lower than the expected mass,
then a procedural drilling or a sampling error has likely
occurred. For instance, if the mass of a metre of sample
is 35 kg instead of an expected 40 kg, then it is highly
likely the interval was not properly delimited, or that
there has been a substantial loss of sample during
extraction. However, for the case of a 39 kg sample
return, it is likely that mass variance is simply an
acceptable (normal) random error that can be expected
even in a well-controlled physical process.
An effective QC process is to plot the total mass of
each successive metre sample on a control plot, in a
similar manner to the typical laboratory certified
reference material control. Control limit lines can then
be added to the plot using a moving range (MR)
approach (Sterk, 2015). Samples having masses that
plot outside the upper and lower control limits are
outliers and indicate that something in the sampling
process is likely to be out of order and need to be
investigated. Equally, two out of the last three points
above/below two MR-standard deviations, four out of
the last five points above/below one MR-standard
deviations or eight consecutive points on one side of

Page | 11
the mean or target value, all indicate that something is
likely to be wrong with the sampling system.
The approach described above implicitly assumes that
the errors in weights are normally distributed due to a
random process. However, a variety of rock types are
encountered in drilling a hole with both fresh and
weathered conditions, changing bit sizes down the
hole, and samples can also be damp or wet, depending
on ground conditions. As such, data in the sample
mass control plots should be automatically corrected
for known or assumed densities, bit diameter changes,
and wet samples are excluded from the analysis. The
primary samples are weighed in total, including the
bulk plastic bag and original and duplicate calico
sampling bags. The data is entered into the control
spreadsheet by a sampling technician as the samples
are collected at the rig, so that there is a real-time
monitoring process. The technician will enter any
relevant comments, so that it is clear to end users of
the data that a certain sample mass was deemed
defective for a specific reason, such as water in the
hole, a blow-out or cave-in, collar debris re-drill, etc.
and, that the data should be excluded for MRE work.
Figure 2 is an example of a sample mass control plot
where a "normal" pattern of variability can be
observed in the wavering blue line in the top graph of
the primary sample bag masses. The weathered rock
sampling intervals are not included in this analysis but
can be treated separately if required. In this example
the hole was mostly dry, so not many wet samples
were excluded from the analysis. A lot of this mass
variance may well be "reasonably expected" for this
type of drilling, and the results are consistent with
largely random controlled variability. However, the
samples automatically highlighted with yellow circles
in Figure 2 indicate sample masses that are statistically
unlikely due to just random variability, and such
samples need investigation and explanation. In this
example, the corrective actions a rig geologist should
implement are: firstly a discussion with the driller to
learn if they are one-off causes due to the drilling
approach; and, if no cause can be found, drilling
should continue under more scrutiny regarding sample
quality. If a second outlier deviation occurs, this
signals a need to stop drilling and inspect the drilling
and sampling system.
Sample mass control plots also permit the monitoring
of trends. A trend of higher sample masses for samples
collected from the last sample in a drill rod run is
common, which may indicate delimitation errors, as
discussed previously in this paper. Any mass trends
can be further investigated by group-averaging the
masses of the1st, 2nd, 3rd, 4th, 5th, and 6th metre of
every rod and plotting these as a bar graph, as depicted
in Figure 3. In this example, there is a significant
metre-delimitation problem that needs to be resolved,
as metres are getting progressively heavier towards the
end of each rod. In the authors' experience, this is a
frequently observed issue.
With regards to the expected mass accuracy of each
primary sample, the total estimated recovery per metre
can be calculated, and where this metric is higher or
lower than expected, this mass bias should be
discussed with the driller. This may identify issues
such as too much material being lost to outside return
from excessive shroud tolerance or dust losses from
the top of the cyclone. An estimated total sample
recovery of 90% or better should be routinely
achievable.
QC on the Rig Split Sample
The mass monitoring system to check for delimitation
and extraction errors can also be used to monitor the
primary lot sub-samples to provide a QC system for
the sample splitting process. Ideally, a splitter should
show zero mass difference between the routinely
collected sample (the original) and a duplicate sample
collected from the same primary lot. If the splitter is
providing uneven mass splits, then the difference in
the routine-duplicate subsample mass will be highly
variable.
The routine-duplicate sample mass differences can be
measured and plotted in exactly the same way as the
primary lot sample masses. Any samples having
masses outside the control lines can signal splitting
issues such as sample hang-ups, blockages and/or
misalignment of the splitter. Real-time monitoring of
Page | 12
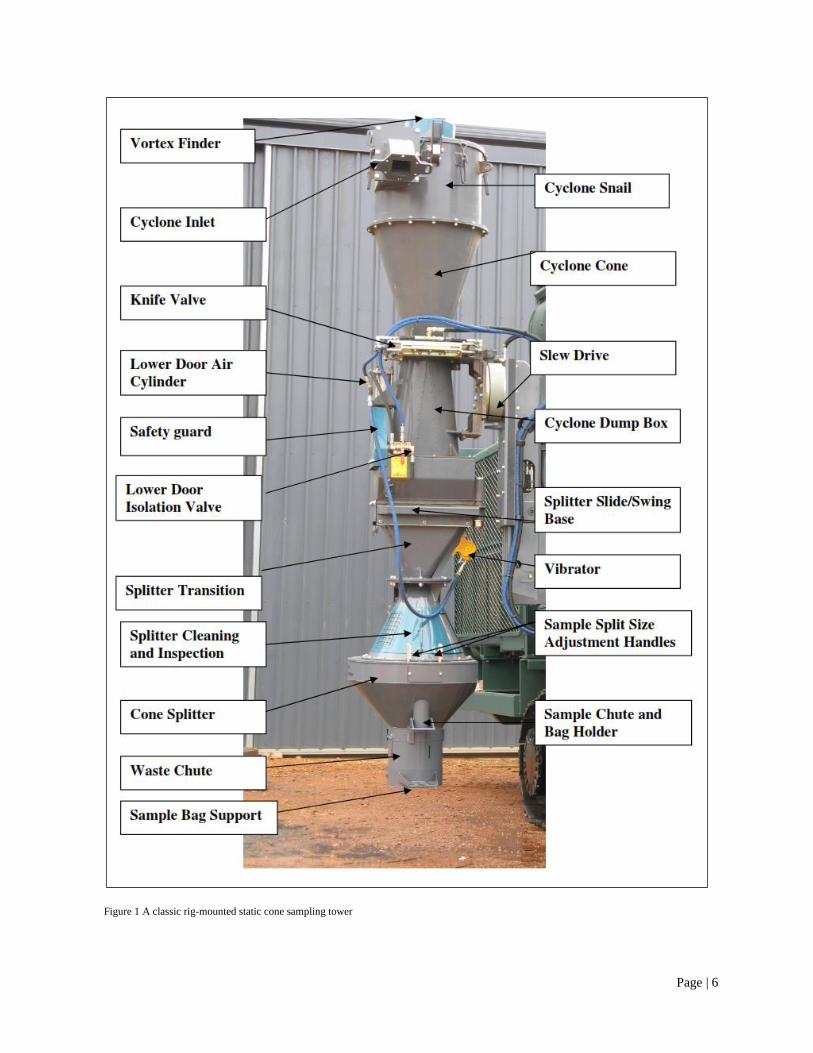
Figure 2 RSC quality control sheet for RC drilling sample mass data. The first graph (blue shade) is a plot of primary sample masses on the vertical axis plotted against time sequence. The second graph (green shade) is a plot of the relative difference weights between the routine and
duplicate samples. The tabulation below the charts is a record of the data collected and includes recovery estimates adjusted for each rock type
and other systematic variations expected in the drill hole. Red and yellow dots identify special cause variation (too many points on one side of the mean and points outside warning lines resp.). Explanation in text.
the mass difference data offers the opportunity to
make immediate corrections, and improve the quality
of the sample splitting throughout the drilling
programme or drill hole under consideration.
In the example shown in Figure 2, the split-mass data
reveals some suspect trends, with two periods having
sample split masses that are clearly biased. These
cases signalled the need to open up and clean the
sampling system. Again, the sampling technician
included comments in the data input spreadsheet so
that end users of the data (such as the resource
geologist) can decide whether to exclude or increase
the risk weighting of these biased samples in MRE
work.
Note that the split mass QC process requires the
collection of a duplicate sample for each metre drilled.
However, not all the duplicates need to be submitted
to the laboratory, only a designated proportion of
duplicates need to be submitted, and the duplicates can
be selected from likely mineralised material rather
than collecting duplicates from obvious waste zones.
The additional duplicates collected do have the cost of
an additional subsample calico bag but this approach
creates a resource of additional duplicates that have
already been split using the same splitting tool and
under the same conditions as the original samples.
Logistically, this approach has advantages for future
resampling, especially when the sample rejects are
discarded. As such, the small extra cost of the calico
bag and cost in managing those extra bags is therefore
easily justified.
Every QC system comes with its limitations and QC
monitoring should not be used as a tool designed to
immediately criticize a drillers skill and performance.
In the authors' experience, most drillers are interested
in understanding what impacts their actions have on
the sample quality, and are keen to improve their
drilling skills with the use of a positive feedback
system. It is good practice to provide drillers with the
control plots from each day of drilling, so they can
review and discuss the results with the geologist

Page | 13
before the start of their next shift as well at weekly
toolbox meetings.
MEASURING PRODUCTION VS QUALITY
Given the trade-off between quality and production, it
is useful to capture this balance in graphical format, so
that better decisions can be made by drillers and
geologists on a daily basis.
From the drilling contractors’ perspective, RC drilling
performance is measured as the total metres drilled per
day. This metric is a measure of the drillers’ general
efficiency, including the ability to get ready for the
day, conduct their pre-checks, have fuel and water
solutions at hand and not cause down-time, handle the
ground conditions, and drill metres. Useful efficiency
metrics include:
• Daily Drilling Efficiency ratio, measured as:
100% − (𝑊𝑜𝑟𝑘 𝑇𝑖𝑚𝑒 − 𝐷𝑜𝑤𝑛 𝑇𝑖𝑚𝑒 − 𝑆𝑡𝑎𝑛𝑑𝑏𝑦 𝑇𝑖𝑚𝑒 − 𝐷𝑟𝑖𝑙𝑙𝑖𝑛𝑔 𝑇𝑖𝑚𝑒)
(𝑊𝑜𝑟𝑘 𝑇𝑖𝑚𝑒 − 𝐷𝑜𝑤𝑛 𝑇𝑖𝑚𝑒 − 𝑆𝑡𝑎𝑛𝑑𝑏𝑦 𝑇𝑖𝑚𝑒)× 100%
• Daily Utilisation Total, measured as:
100% − (𝑊𝑜𝑟𝑘 𝑇𝑖𝑚𝑒 − 𝐷𝑜𝑤𝑛 𝑇𝑖𝑚𝑒 − 𝑆𝑡𝑎𝑛𝑑𝑏𝑦 𝑇𝑖𝑚𝑒)
(𝑊𝑜𝑟𝑘 𝑇𝑖𝑚𝑒 − 𝐷𝑜𝑤𝑛 𝑇𝑖𝑚𝑒)× 100%
• Daily Availability, measured as:
100% − (𝑊𝑜𝑟𝑘 𝑇𝑖𝑚𝑒 − 𝐷𝑜𝑤𝑛 𝑇𝑖𝑚𝑒)
(𝑊𝑜𝑟𝑘 𝑇𝑖𝑚𝑒)× 100%
Figure 3 Average bag weights of 1st, 2nd, 3rd, 4th, 5th and 6th metre of each rod for one day of drilling (single driller on single rig)
Avera
ge
Bag W
eig
ht
per
Ro
d M
etre
(k
g)

Page | 14
However, when comparing quality of drilling with
production, it is best to look at production during
active drilling hours only, being the total metres drilled
when the RC hammer is operating (often called
"penetration rate"). In particular, a focus on drill
penetration rate gives a measure of how too-rapid
advance rates may be adversely affecting sampling
quality for a given set of ground conditions.
Quality monitoring can be presented using time or
depth graphs of the precision and accuracy on both
primary and rig split samples. There are five quality
metrics that can be used to compare against the
metres/active drilling production ratio:
• Precision of all bag masses, as an indicator of the
control on delimitation and extraction errors on
the primary sample, measured by the standard
deviation divided by the mean for all dry, fresh
and density-corrected data for the time period.
• Precision of average 1st, 2nd, 3rd, 4th, 5th and 6th
metre of every rod as an indicator of the control
on delimitation errors on the primary sample (e.g.
"delimitation performance"). This is measured by
the standard deviation divided by the mean for the
overall average of, respectively, the 1st, 2nd, 3rd,
4th, 5th and 6th metre of every rod for the time
period.
• Overall recovery for the day as a measure of
accuracy of the primary sample, measured by the
ratio of all dry, fresh and density-corrected
weights over the theoretical weight for the time
period.
• Precision of sample split masses, as an indicator
of the control on delimitation and extraction
errors on the rig split sample, measured by the
standard deviation divided by the mean for all
mass differences for the time period.
• Overall bias of the difference between original
and duplicate sample masses as a measure of
accuracy of the rig split sample, measured by the
average of all split weight differences.
Examples of control plots are shown in Figure 4,
Figure 5, and Figure 6.
Figure 4 is a of the delimitation precision of the
primary sample over time for one driller. The clustered
light-to-dark-blue lines are the average masses for the
1st, 2nd, 3rd, 4th, 5th and 6th metre of every rod for
each day. For the 10-day period between 14 to 24 May,
the 6th sample of each rod was always the heaviest and
the second metre the lightest. For the period between
6 April and 4 May rod-interval-sample-mass pattern
was random, and lines for each sample sequence are
clustered more closely together indicating the
preferred target variability between sequential samples
on each rod. The orange line in Figure 4 represents the
principal delimitation precision, with low precision
numbers representing better quality (e.g. low variance
is desirable). Again, the period between 6 April and 4
May stands out as period of good sample quality
because of the low precision. Discussions with the
drillers identified that some of the quality issues
related to the rig conditions (rigs were changed over
on the 10th of May) as well as some ground condition
issues. One of the issues identified by this graph (and
using the plot in Figure 3) was that the metre marks
used to identify drilling advance intervals were
incorrectly placed on one of the drill rigs.
Figure 5 is a plot of the delimitation and extraction
precision, and the accuracy of the rig split sample over
time. The blue points on the background of the plot are
the routine-duplicate mass difference values plotted on
the vertical axis, date on the horizontal axis. The red
dotted line is a 20-point moving average for the pair
mass difference data.
The plot reveals at least three periods where average
mass differed significantly, as indicated by step
changes in the average mass line (black) in Figure 5.
In the first period the mass difference bias is ≈ +400
g, with the duplicate always heavier than the routine
split, which was targeted to be 5 kg. As such, the +400
g difference represented a relative bias of ≈ +8%. The
second period, started on 29 March when the sample
splitting device was changed from a static cone splitter
(used for the first period) to a Metzke Splitter. During
commissioning of this unit, the mass difference plot
revealed that the new sampling unit produced a
negative bias between routine and duplicate samples
of ≈ -400 g up until 10 April. Following some small
engineering modifications and with increasing
experience with the new sampling system, the split
masses returned on average to zero difference, and
sample splitting continued without bias.

Page | 15
Figure 4 Delimitation precision of the primary sample over time. See text for explanation
Figure 5 Accuracy and Delimitation & Extraction Precision of the rig split over time. See text for explanation

Page | 16
Figure 6 Delimitation & Extraction Precision% vs Metre/Active Drilling Hours. See text for explanation
Figure 6 is a plot of the primary delimitation precision
against the metres/active drilling hour for a drill rig.
Note how the drilling production improves towards the
end of the programme from 18-22 m/active hour to 22-
24 m/active hour, with quality improving in parallel
from 12-14% precision to 8-10% precision. Both
metrics spike upwards after 21 April, when a drilling
crew changeover occurs and a new driller takes over.
However, the chart then reveals that with time and
feedback the new driller learns how to deal with the
ground conditions and returned both metrics to levels
of good production and good sampling precision.
SUMMARY AND CONCLUSIONS
RC drilling is usually subject to a range of sampling
errors that occur in the primary or sample splitting
stage. Understanding the source of these errors and
putting systems in place is the first point of call for a
robust system to improve the overall quality of the RC
sample.
A QC system that is based on sample primary sample
masses and secondary sample mass difference for
replicated splits from the primary lot can identify
when delimitation and extraction errors may be
occurring on a real-time basis. When plots of these
metrics are prepared as easy-to-interpret
communication tools for geologists and drillers,
constructive discussions around the results improves
both sample quality and drill production rates.
When these types of processes are implemented in RC
drilling programmes, the resulting data can be
considered as high-quality for downstream MRE
work.
ACKNOWLEDGEMENTS
The authors would like to thank John Graindorge,
Mike Stewart, Ian Glacken, and Mark Murphy for
their helpful comments and edits.

Page | 17
REFERENCES
Australian Bureau of Statistics, 2017. Mineral and
Petroleum Exploration, Australia, Dec 2016
[online][Accessed: 5 June 2017 2017].
Carswell, J T and Sutton, K, 2014. Sources of
Sampling Error and Implications for Quality
Assurance and Quality Control in Surface and
Underground Reverse Circulation Drilling, paper
presented to Sampling 2014, Perth.
Corporaal, 2017. Trusplit Range [online], Available
from: <http://www.corporaal.com.au/drilling-
equipment/trusplit-range.html> [Accessed: 31-May
2017].
Gy, P, 1979. Sampling of particulate materials :
theory and practice, xvii, 431 p. p (Elsevier Scientific
Pub Co: Amsterdam).
JORC, 2012. Australasian Code for Reporting of
Exploration Results, Mineral Resources and Ore
Reserves (The JORC Code) [online], Available from:
<http://www.jorc.org> [Accessed: 31-May 2017].
Metzke, 2017. Metzke Splitter [online], Available
from:
<http://www.metzke.com.au/index.php?option=com_
zoo&task=item&item_id=38&Itemid=224>
[Accessed: 31-May-2016 2017].
Progradex, 2017. Premium PGX Series Sampler
[online], Available from:
<http://www.progradex.com/progradex-sampling-
system/> [Accessed: 31-May-2017 2017].
Top Related