


Languages
Pages
Legal


savills.com.au/research
Quarter TimeNational Retail Q4/2019
Savills Research Australia
Dept. Store Rent
DDS Gross Rent
Specialty Tenant Rent
Mini-Major Rent
Average Yield
Average IRR
Total Outgoings
Average Capital Value
Highlights
• Easing monetary conditions are still not positively impacting and promoting consumer and hence business sentiment
• Retail assets exposed to non-discretionary spending, particularly Neighbourhood centres continue to demonstrate resilience in the challenging retail landscape
• Private and Syndicate investors continue to actively buy centres, taking advantage of favourable lending conditions and perhaps displaying first mover advantage as asset prices meet revised investment return objectives
Sales Activity(last 12mo $5m+)
$7.86 billion
207 Sales
Retail Trade$27.771 billion
2.72% annual growth
Trend details
Source: Savills Research
Q4/2019
savills.com.au/research 2
Savills Research | Quarter Time – National Retail
Report ContentsNational Retail Highlights 3Major Sales Analysis 7Retail Trade Trends & Drivers 8Retail Economic Indicators 9Retail Development Analysis 9
State Indicators and Major ActivityNew South Wales 10Victoria 15Queensland 20Western Australia 25South Australia 30
About Savills 34Disclaimer 35
Executive Summary
The Australian economy continues to be defined as sluggish, despite the RBA’s record low monetary policy stance at 0.75%. The three easing’s through 2019 have not, as yet, positively impacted business and consumer sentiment, with GDP still below potential at 2.2% year on year to December 2019. As such retailers are continuing to rely on sales events, such as the US phenomenon of Black Friday and Cyber Monday retail sales. Unfortunately, these retailer events to bring the consumer out to play had an unintended consequence of bringing forward Christmas retail sales, with many retailers lamenting a lower December trading period.
Underpinning the recalcitrant consumer has been relatively high unemployment at 5.2% to January 2020, inflation at 1.7% versus targeted 2.5% long term average and a higher underemployment rate at 8.6% (people are working but want to work more hours). Resulting retail sales growth of 2.7% to December 2019 versus the 10 year average of 3.4%, making a tough trading environment for retailers.
However the benign economic environment is creating opportunities. We have not seen evidence of shopping centres being sold due to financial stress, indeed we have seen an emergence of the Private Investor and Syndicates taking advantage of sellers having differing financial objectives and returns expectations. As such, price discipline is being observed and where appropriate, assets are being taken off the market and alternative redevelopment plans are being determined. Two REITs that were sellers through 2019, decided to do such after not being able to achieve their desired sale outcomes.
Neighbourhood centres (especially those with higher exposures to non-discretionary spending and day-today living consumerism) are still a focus by Private Investor and Syndicates as they apply differing investment objectives. With low for longer interest rates and cheaper cost of debt, IRR’s are more aggressive than what perhaps traditional corporate and Wholesale Funds requirements are. This has been the opportunity for this buyer group where Private Investor and Syndicates have been 39.2% of total transactions. Foreign investors have also been active making up 18% of acquisitions, highlighting their lower cost of capital advantage and currency translation.
Supporting the theory that good retail will always retain value through cycle, there is sales evidence of two large Super-Regional shopping centre transactions in the December quarter trading at reasonable yields, with 50% of Westfield Marion sold by Lendlease at 5.5% (buyer Singapore’s SPH REIT) and 50% of AMP’s Booragoon, Perth including management and development rights at 4.75% to Scentre Group. Both centres have a reasonable exposure to discretionary spending via fashion, yet both transacted at stable levels. Another example was the Sub-Regional Noosa Civic that traded at 5.75%, with Stockwell buying from GIC.
Annual Retail returns (MSCI December 2019) were relatively muted with +2.0% total return, with an income return of +5.1%, while capital growth was -3.0%. New South Wales and Victoria continue to be the drivers for retail nationally, (reflecting population densification, enhanced by immigration and state GDP), producing a total return of 4.0% and 4.7% respectively. WA and Queensland reported -4.3% and -2.1% respectively, with meaningful falls in capital growth of -9.2% and -6.9% as weaker centres and country locations struggled.
Throughout 2020, while economic conditions may continue to be challenging and retailers will consolidate and rationalise their footprints, “adaptive retail” will remain a focal point for the consumers’ dollar. Centres with exposure to densification, rising socio-economic conditions, access to mixed-use amenities such as apartments, offices, transport hubs and of course scarcity will continue to retain value and investors will continue to seek them out. Some tenants will require an ongoing redevelopment schedule to continually attract the consumer spend.
Head of ResearchResearch & Consultancy
Phil [email protected]
AnalystResearch & Consultancy
Monique [email protected]
AnalystResearch & Consultancy
Matthew Di [email protected]
GraduateResearch & Consultancy
Boyd [email protected]
Q4/2019
savills.com.au/research 3
Savills Research | Quarter Time – National Retail
Key Highlights
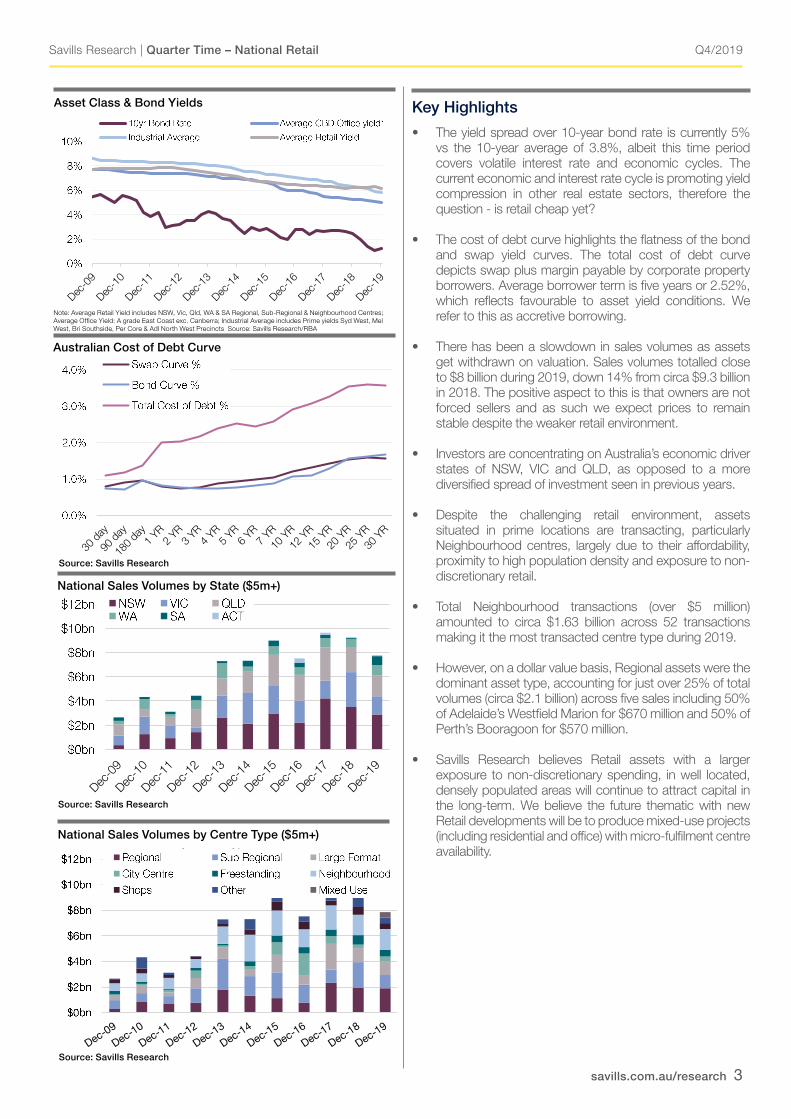
• The yield spread over 10-year bond rate is currently 5% vs the 10-year average of 3.8%, albeit this time period covers volatile interest rate and economic cycles. The current economic and interest rate cycle is promoting yield compression in other real estate sectors, therefore the question - is retail cheap yet?
• The cost of debt curve highlights the flatness of the bond and swap yield curves. The total cost of debt curve depicts swap plus margin payable by corporate property borrowers. Average borrower term is five years or 2.52%, which reflects favourable to asset yield conditions. We refer to this as accretive borrowing.
• There has been a slowdown in sales volumes as assets get withdrawn on valuation. Sales volumes totalled close to $8 billion during 2019, down 14% from circa $9.3 billion in 2018. The positive aspect to this is that owners are not forced sellers and as such we expect prices to remain stable despite the weaker retail environment.
• Investors are concentrating on Australia’s economic driver states of NSW, VIC and QLD, as opposed to a more diversified spread of investment seen in previous years.
• Despite the challenging retail environment, assets situated in prime locations are transacting, particularly Neighbourhood centres, largely due to their affordability, proximity to high population density and exposure to non-discretionary retail.
• Total Neighbourhood transactions (over $5 million) amounted to circa $1.63 billion across 52 transactions making it the most transacted centre type during 2019.
• However, on a dollar value basis, Regional assets were the dominant asset type, accounting for just over 25% of total volumes (circa $2.1 billion) across five sales including 50% of Adelaide’s Westfield Marion for $670 million and 50% of Perth’s Booragoon for $570 million.
• Savills Research believes Retail assets with a larger exposure to non-discretionary spending, in well located, densely populated areas will continue to attract capital in the long-term. We believe the future thematic with new Retail developments will be to produce mixed-use projects (including residential and office) with micro-fulfilment centre availability.
Source: Savills Research
Source: Savills Research
National Sales Volumes by State ($5m+)
National Sales Volumes by Centre Type ($5m+)
Asset Class & Bond Yields
Australian Cost of Debt Curve
National Sales Volumes by State
National Sales Volumes by Centre Type
Source: Savills Research
Asset Class & Bond Yields
Australian Cost of Debt Curve
National Sales Volumes by State
National Sales Volumes by Centre Type
Source: Savills Research
Asset Class & Bond YieldsAsset Class & Bond Yields
Australian Cost of Debt Curve
National Sales Volumes by State
National Sales Volumes by Centre Type
Source: Savills Research
Australian Cost of Debt Curve
Asset Class & Bond Yields
Australian Cost of Debt Curve
National Sales Volumes by State
National Sales Volumes by Centre Type
Source: Savills Research
Note: Average Retail Yield includes NSW, Vic, Qld, WA & SA Regional, Sub-Regional & Neighbourhood Centres; Average Office Yield: A grade East Coast exc. Canberra; Industrial Average includes Prime yields Syd West, Mel West, Bri Southside, Per Core & Adl North West Precincts Source: Savills Research/RBA
Source: Savills Research
Q4/2019
savills.com.au/research 4
Savills Research | Quarter Time – National Retail
Sales Volumes by Purchaser Type ($5m+)Sales Volumes by Purchaser Type
Source: Savills Research
Source: Savills Research
Source: ABS
Source: ABS
Source: Savills Research
Key Highlights
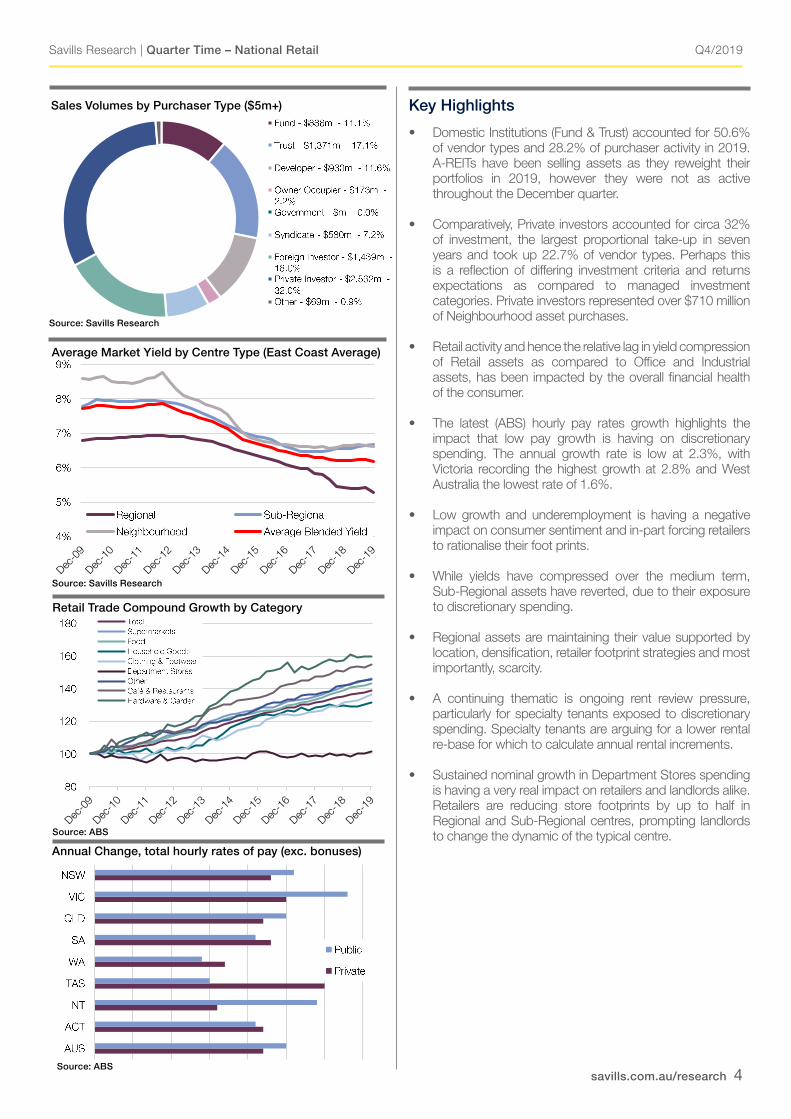
• Domestic Institutions (Fund & Trust) accounted for 50.6% of vendor types and 28.2% of purchaser activity in 2019. A-REITs have been selling assets as they reweight their portfolios in 2019, however they were not as active throughout the December quarter.
• Comparatively, Private investors accounted for circa 32% of investment, the largest proportional take-up in seven years and took up 22.7% of vendor types. Perhaps this is a reflection of differing investment criteria and returns expectations as compared to managed investment categories. Private investors represented over $710 million of Neighbourhood asset purchases.
• Retail activity and hence the relative lag in yield compression of Retail assets as compared to Office and Industrial assets, has been impacted by the overall financial health of the consumer.
• The latest (ABS) hourly pay rates growth highlights the impact that low pay growth is having on discretionary spending. The annual growth rate is low at 2.3%, with Victoria recording the highest growth at 2.8% and West Australia the lowest rate of 1.6%.
• Low growth and underemployment is having a negative impact on consumer sentiment and in-part forcing retailers to rationalise their foot prints.
• While yields have compressed over the medium term, Sub-Regional assets have reverted, due to their exposure to discretionary spending.
• Regional assets are maintaining their value supported by location, densification, retailer footprint strategies and most importantly, scarcity.
• A continuing thematic is ongoing rent review pressure, particularly for specialty tenants exposed to discretionary spending. Specialty tenants are arguing for a lower rental re-base for which to calculate annual rental increments.
• Sustained nominal growth in Department Stores spending is having a very real impact on retailers and landlords alike. Retailers are reducing store footprints by up to half in Regional and Sub-Regional centres, prompting landlords to change the dynamic of the typical centre.
Source: Savills Research
Retail Trade Compound Growth by Category
Average Market Yield by Centre Type (East Coast Average)
Source: ABS
Sales Volumes by Purchaser Type
Source: Savills Research
Source: Savills Research
Source: ABS
Source: ABS
Source: ABS
Annual Change, total hourly rates of pay (exc. bonuses)
Sales Volumes by Purchaser Type
Source: Savills Research
Source: Savills Research
Source: ABS
Source: ABS
Sales Volumes by Purchaser Type
Source: Savills Research
Source: Savills Research
Source: ABS
Source: ABS
Q4/2019
savills.com.au/research 5
Savills Research | Quarter Time – National Retail
Key Highlights
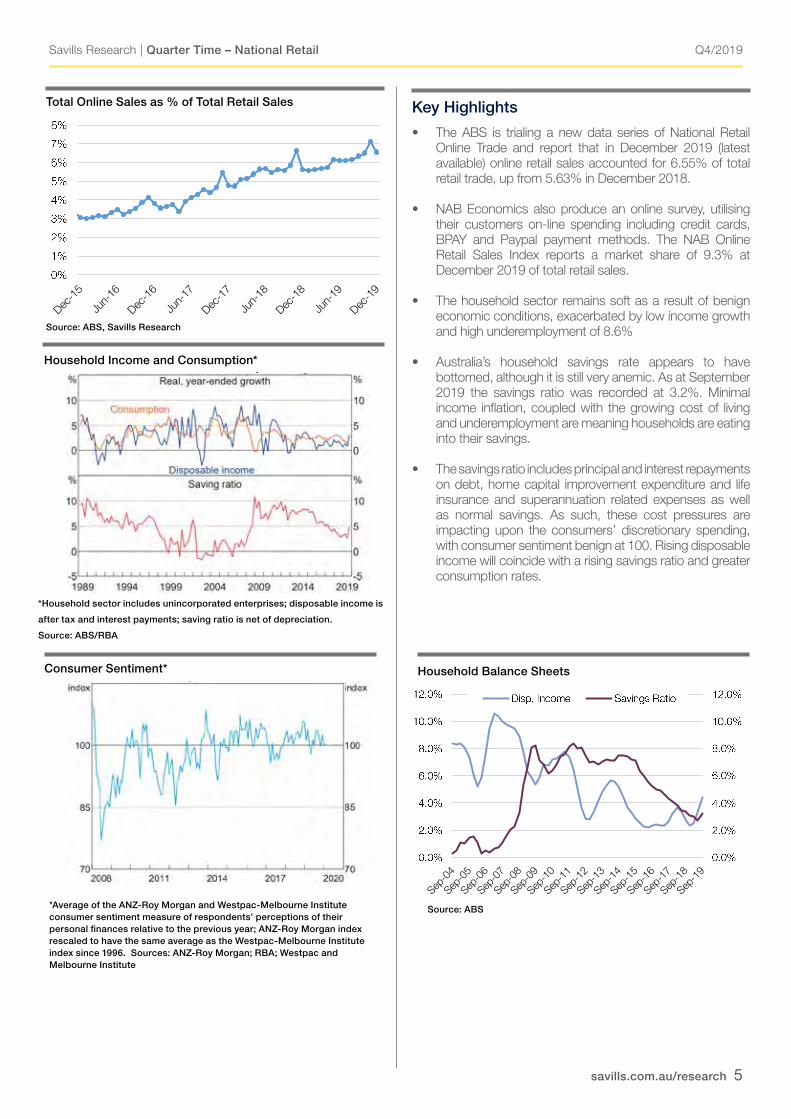
• The ABS is trialing a new data series of National Retail Online Trade and report that in December 2019 (latest available) online retail sales accounted for 6.55% of total retail trade, up from 5.63% in December 2018.
• NAB Economics also produce an online survey, utilising their customers on-line spending including credit cards, BPAY and Paypal payment methods. The NAB Online Retail Sales Index reports a market share of 9.3% at December 2019 of total retail sales.
• The household sector remains soft as a result of benign economic conditions, exacerbated by low income growth and high underemployment of 8.6%
• Australia’s household savings rate appears to have bottomed, although it is still very anemic. As at September 2019 the savings ratio was recorded at 3.2%. Minimal income inflation, coupled with the growing cost of living and underemployment are meaning households are eating into their savings.
• The savings ratio includes principal and interest repayments on debt, home capital improvement expenditure and life insurance and superannuation related expenses as well as normal savings. As such, these cost pressures are impacting upon the consumers’ discretionary spending, with consumer sentiment benign at 100. Rising disposable income will coincide with a rising savings ratio and greater consumption rates.
Household Income and Consumption*
Total Online Sales as % of Total Retail Sales
Source: ABS/Savills Research Household Income and Consumption*
*Household sector includes unincorporated enterprises; disposable income is after tax and interest payments; saving ratio is net of depreciation Sources: ABS; RBA Consumer Sentiment*
*Average of the ANZ-Roy Morgan and Westpac-Melbourne Institute consumer sentiment measure of respondents’ perceptions of their personal finances relative to the previous year; ANZ-Roy Morgan index rescaled to have the same average as the Westpac-Melbourne Institute index since 1996
Sources: ANZ-Roy Morgan; RBA; Westpac and Melbourne Institute
Source: ABS
*Household sector includes unincorporated enterprises; disposable income is
after tax and interest payments; saving ratio is net of depreciation.
Source: ABS/RBA
*Average of the ANZ-Roy Morgan and Westpac-Melbourne Institute consumer sentiment measure of respondents’ perceptions of their personal finances relative to the previous year; ANZ-Roy Morgan index rescaled to have the same average as the Westpac-Melbourne Institute index since 1996. Sources: ANZ-Roy Morgan; RBA; Westpac and Melbourne Institute
Consumer Sentiment*
Total Online Sales as % of Total Retail Sales
Source: ABS/Savills Research Household Income and Consumption*
*Household sector includes unincorporated enterprises; disposable income is after tax and interest payments; saving ratio is net of depreciation Sources: ABS; RBA Consumer Sentiment*
*Average of the ANZ-Roy Morgan and Westpac-Melbourne Institute consumer sentiment measure of respondents’ perceptions of their personal finances relative to the previous year; ANZ-Roy Morgan index rescaled to have the same average as the Westpac-Melbourne Institute index since 1996
Sources: ANZ-Roy Morgan; RBA; Westpac and Melbourne Institute
Source: ABS
Household Balance Sheets
Total Online Sales as % of Total Retail Sales
Source: ABS/Savills Research Household Income and Consumption*
*Household sector includes unincorporated enterprises; disposable income is after tax and interest payments; saving ratio is net of depreciation Sources: ABS; RBA Consumer Sentiment*
*Average of the ANZ-Roy Morgan and Westpac-Melbourne Institute consumer sentiment measure of respondents’ perceptions of their personal finances relative to the previous year; ANZ-Roy Morgan index rescaled to have the same average as the Westpac-Melbourne Institute index since 1996
Sources: ANZ-Roy Morgan; RBA; Westpac and Melbourne Institute
Source: ABS Source: ABS
Total Online Sales as % of Total Retail Sales
Source: ABS, Savills Research
Total Online Sales as % of Total Retail Sales
Source: ABS/Savills Research Household Income and Consumption*
*Household sector includes unincorporated enterprises; disposable income is after tax and interest payments; saving ratio is net of depreciation Sources: ABS; RBA Consumer Sentiment*
*Average of the ANZ-Roy Morgan and Westpac-Melbourne Institute consumer sentiment measure of respondents’ perceptions of their personal finances relative to the previous year; ANZ-Roy Morgan index rescaled to have the same average as the Westpac-Melbourne Institute index since 1996
Sources: ANZ-Roy Morgan; RBA; Westpac and Melbourne Institute
Source: ABS

Q4/2019
savills.com.au/research 6
Savills Research | Quarter Time – National Retail
Key Markets – Average Yield vs 10yr Bond Rate (East Coast only)
Source: RBA, Savills Research
Source: RBA, Savills Research
Sales Activity by Vendor Type (Sales $5m+) Sales Volume by Price Range (YTD Sales $5m+)
Vendor/Purchaser Analysis – 12 months to December 2019
Sales Activity by Vendor Type ($5m+)
Sales Volume by Price Range ($5m+)
Source: Savills Research Source: Savills Research
Source: RBA, Savills Research
Sales Activity by Vendor Type (Sales $5m+) Sales Volume by Price Range (YTD Sales $5m+)
Vendor/Purchaser Analysis – 12 months to December 2019
Source: RBA, Savills Research
Sales Activity by Vendor Type (Sales $5m+) Sales Volume by Price Range (YTD Sales $5m+)
Vendor/Purchaser Analysis – 12 months to December 2019
Vendor/Purchaser Analysis – 12 Months to Dec-19 ($5m+)
Source: Savills Research
Source: RBA, Savills Research
Sales Activity by Vendor Type (Sales $5m+) Sales Volume by Price Range (YTD Sales $5m+)
Vendor/Purchaser Analysis – 12 months to December 2019

Q4/2019
savills.com.au/research 7
Savills Research | Quarter Time – National Retail
Major Sales Analysis Notable Sales by Value
Type Property Price ($m) | Date | GLA Yield | Type | $/sq m
Super Regional Westfield Marion, Oaklands Park, SA (50%) 670.0 | Nov-19 | 136,837 5.26 | e | 9,793
Major Regional Westfield Burwood, Burwood, NSW (50%) 575.0 | May-19 | 63,248 5.00 | e | 18,182
Super Regional Westfield Booragoon, Booragoon, WA (50%) 570.0 | Dec-19 | 72,843 4.75 | e | 15,650
Sub Regional Noosa Civic S.C, Noosaville, QLD 247.3 | Aug-19 | 24,999 5.75 | i | 9,893
Mixed Use Central Park Mall, Sydney, NSW 174.5 | Oct-19 | 14,716 5.13 | i | 11,858
Neighbourhood Norton Plaza and Norton Central S.C, Leichhardt, NSW 153.2 | Aug-19 | 11,856 5.49 | e | 12,922
Sub Regional Brimbank S.C, Deer Park, VIC 153.0 | Dec-19 | 32,788 7.45 | i | 4,666
Sub Regional Rockdale Plaza, Rockdale, NSW 145.0 | Apr-19 | 21,335 6.08 | e | 6,656
Large Format Crossroads Homemaker Centre, Casula, NSW 140.0 | Feb-19 | 45,051 6.55 | i | 3,108
Sub Regional Warun Ponds S.C, Greater Geelong, VIC (50%) 112.5 | Jul-19 | 47,822 n.a | n.a | 4,705
City Centre 155 King St, Sydney, NSW 105.0 | Aug-19 | 1,472 n.a | n.a | 71,332
Neighbourhood Stockland Cleveland S.C, Cleveland, QLD 103.0 | Mar-19 | 15,650 6.30 | i | 6,581
Sub Regional Corio Central S.C, Corio, VIC 101.0 | Nov-19 | 31,052 8.00 | i | 3,253
Large Format Craigieburn Junction, Craigieburn, VIC 100.0 | Jul-19 | 23,000 n.a | n.a | 4,348
Major Regional Mt Ommaney Centre, Mount Ommaney, QLD (25%) 94.5 | Nov-19 | 56,198 6.12 | e | 6,726
Sub Regional Neeta City S.C, Fairfield, NSW 85.3 | Mar-19 | 24,672 7.80 | i | 3,457
Sub Regional Great Western Super Centre, Keperra, QLD 84.5 | Dec-19 | 15,273 6.69 | e | 5,533
City Centre Village Way Shopping Arcade, Brisbane, QLD 80.0 | Sep-19 | n.a 5.00 | r | n.a
Neighbourhood Marketplace Warner, Warner, QLD 78.4 | Dec-19 | 11,400 5.75 | e | 6,873
Mixed Use 130 Queen St, Brisbane, QLD 77.1 | May-19 | 3,770 5.58 | i | 20,451
Source: Savills Research; Yield Types: i = initial, e = equated, r = reported, v = vacant, dev = development
Q4/2019
savills.com.au/research 8
Savills Research | Quarter Time – National Retail
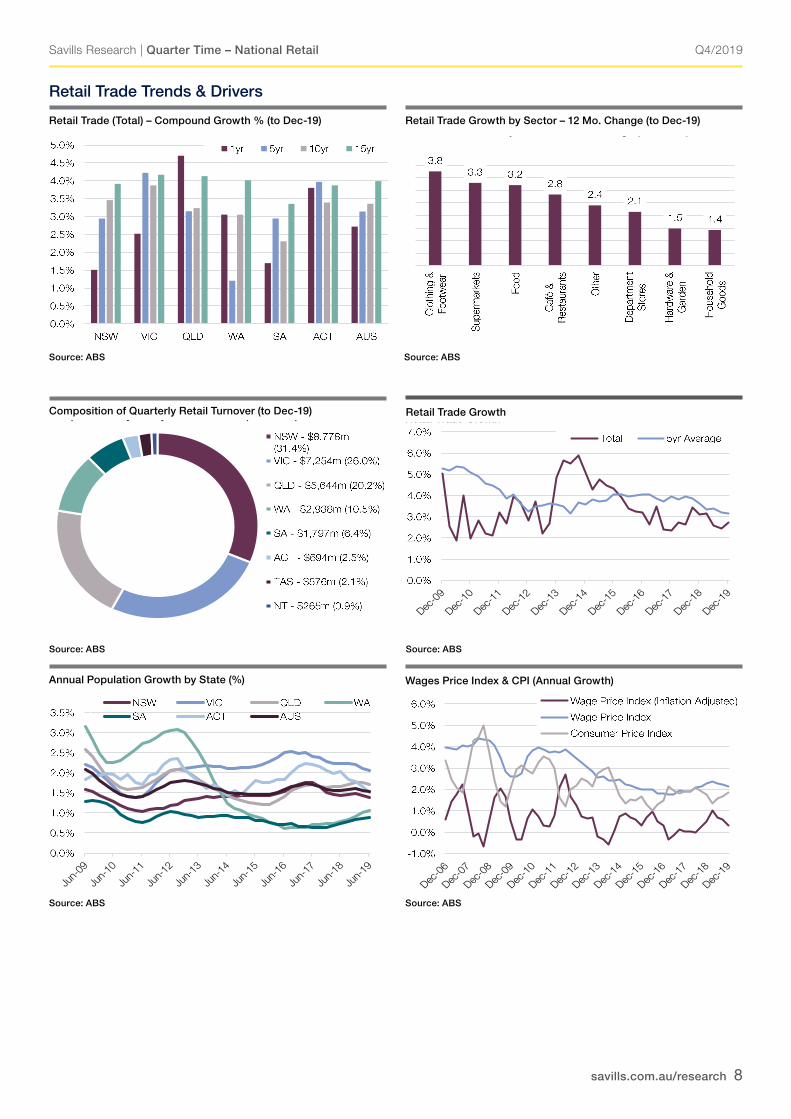
Retail Trade Trends & Drivers
Retail Trade (Total) – Compound Growth % (to Dec-19)
Composition of Quarterly Retail Turnover (to Dec-19)
Retail Trade Growth by Sector – 12 Mo. Change (to Dec-19)
Retail Trade Growth
Annual Population Growth by State (%)
Wages Price Index & CPI (Annual Growth)
Source: ABS Source: ABS
Source: ABS Source: ABS
Source: ABS Source: ABS
Retail Trade Trends & Drivers Retail Trade (Total) – Compound Growth % (to Dec-19)
Source: ABS
Composition of Quarterly Retail Turnover (to Dec-19)
Source: ABS
Annual Population Growth by State (%) (to Jun-19)
Source: ABS
Retail Trade Growth by Sector – 12 Mo. Change (to Dec-19)
Source: ABS
Retail Trade Growth
Source: ABS
Wages Price Index & CPI (Annual Growth)
Source: ABS
Q4/2019
savills.com.au/research 9
Savills Research | Quarter Time – National Retail
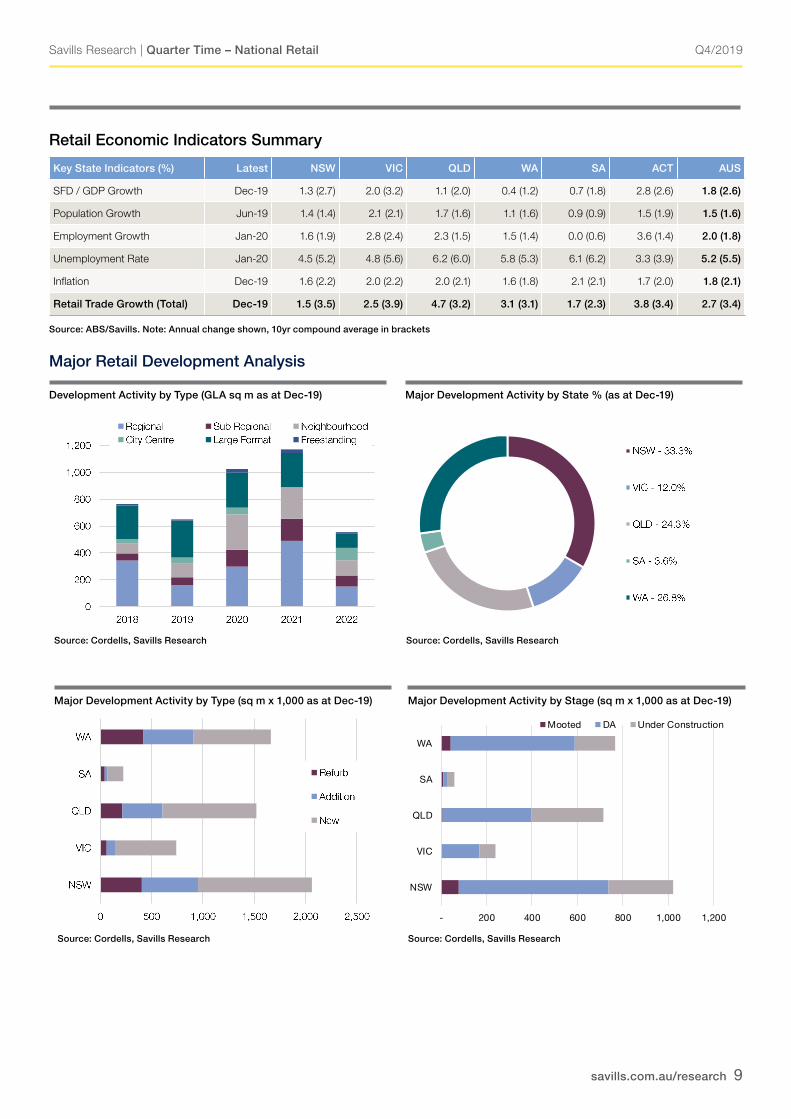
Retail Economic Indicators Summary
Key State Indicators (%) Latest NSW VIC QLD WA SA ACT AUS
SFD / GDP Growth Dec-19 1.3 (2.7) 2.0 (3.2) 1.1 (2.0) 0.4 (1.2) 0.7 (1.8) 2.8 (2.6) 1.8 (2.6)
Population Growth Jun-19 1.4 (1.4) 2.1 (2.1) 1.7 (1.6) 1.1 (1.6) 0.9 (0.9) 1.5 (1.9) 1.5 (1.6)
Employment Growth Jan-20 1.6 (1.9) 2.8 (2.4) 2.3 (1.5) 1.5 (1.4) 0.0 (0.6) 3.6 (1.4) 2.0 (1.8)
Unemployment Rate Jan-20 4.5 (5.2) 4.8 (5.6) 6.2 (6.0) 5.8 (5.3) 6.1 (6.2) 3.3 (3.9) 5.2 (5.5)
Inflation Dec-19 1.6 (2.2) 2.0 (2.2) 2.0 (2.1) 1.6 (1.8) 2.1 (2.1) 1.7 (2.0) 1.8 (2.1)
Retail Trade Growth (Total) Dec-19 1.5 (3.5) 2.5 (3.9) 4.7 (3.2) 3.1 (3.1) 1.7 (2.3) 3.8 (3.4) 2.7 (3.4)
Source: ABS/Savills. Note: Annual change shown, 10yr compound average in brackets
Major Retail Development Analysis
Development Activity by Type (GLA sq m as at Dec-19)
Major Development Activity by State % (as at Dec-19)
Major Development Activity by Stage (sq m x 1,000 as at Dec-19)
Source: Cordells, Savills Research Source: Cordells, Savills Research
Source: Cordells, Savills ResearchSource: Cordells, Savills Research
Retail Economic Indicators Summary Key State Indicators (%) Latest NSW VIC QLD WA SA ACT AUS
SFD / GDP Growth
Population Growth
Employment Growth
Unemployment Rate
Inflation
Retail Trade Growth (Total) Source: ABS / Savills Note: Annual change shown, 10yr compound average in brackets
Major Retail Development Analysis Development Activity by Type (GLA ‘000 sq m as at Dec-19)
Major Development Activity by Type (sq m x 1,000) (as at Dec-19)
Source: Cordells / Savills
Major Development Activity by State (as at Dec-19)
Major Development Activity by Stage (sq m x 1,000) (as at Dec-19)
- 200 400 600 800 1,000 1,200
NSW
VIC
QLD
SA
WA
Mooted DA Under Construction
Major Development Activity by Type (sq m x 1,000 as at Dec-19)
Q4/2019
savills.com.au/research 10
Savills Research | Quarter Time – National Retail
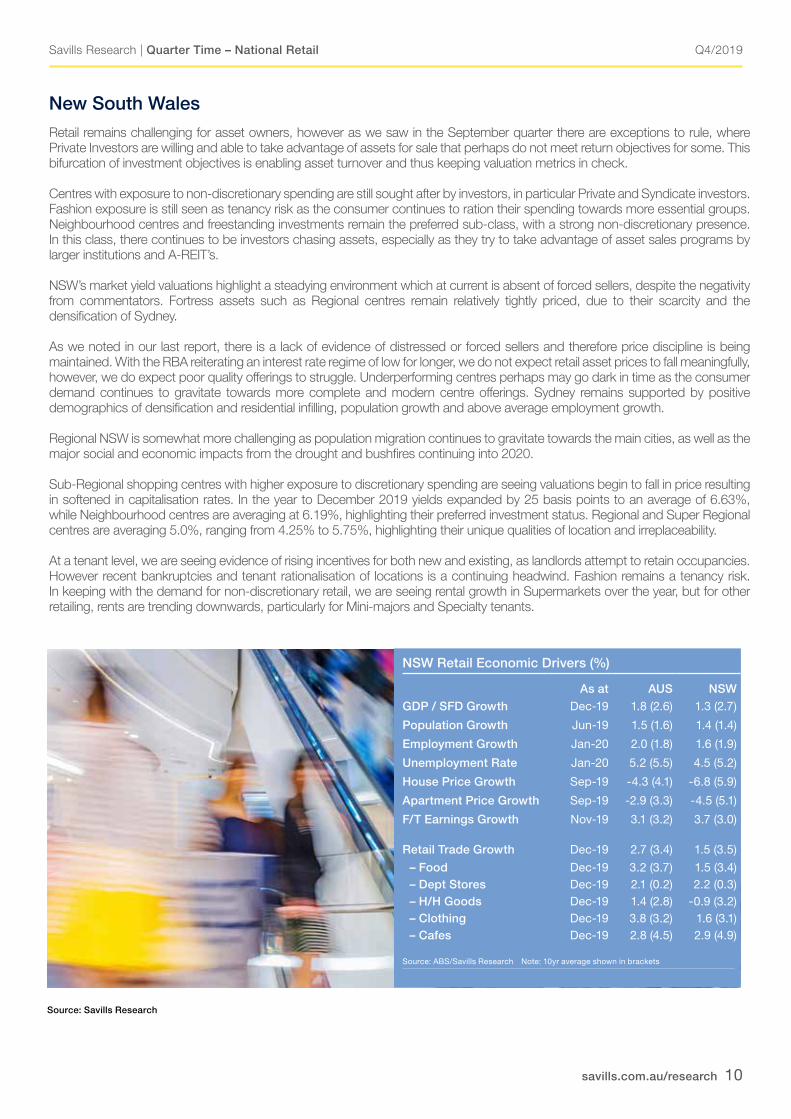
Source: Savills Research
NSW Retail Economic Drivers (%)
As at AUS NSWGDP / SFD Growth Dec-19 1.8 (2.6) 1.3 (2.7)
Population Growth Jun-19 1.5 (1.6) 1.4 (1.4)
Employment Growth Jan-20 2.0 (1.8) 1.6 (1.9)
Unemployment Rate Jan-20 5.2 (5.5) 4.5 (5.2)
House Price Growth Sep-19 -4.3 (4.1) -6.8 (5.9)
Apartment Price Growth Sep-19 -2.9 (3.3) -4.5 (5.1)
F/T Earnings Growth Nov-19 3.1 (3.2) 3.7 (3.0)
Retail Trade Growth Dec-19 2.7 (3.4) 1.5 (3.5)
– Food Dec-19 3.2 (3.7) 1.5 (3.4) – Dept Stores Dec-19 2.1 (0.2) 2.2 (0.3) – H/H Goods Dec-19 1.4 (2.8) -0.9 (3.2) – Clothing Dec-19 3.8 (3.2) 1.6 (3.1) – Cafes Dec-19 2.8 (4.5) 2.9 (4.9)
Source: ABS/Savills Research Note: 10yr average shown in brackets
New South WalesRetail remains challenging for asset owners, however as we saw in the September quarter there are exceptions to rule, where Private Investors are willing and able to take advantage of assets for sale that perhaps do not meet return objectives for some. This bifurcation of investment objectives is enabling asset turnover and thus keeping valuation metrics in check.
Centres with exposure to non-discretionary spending are still sought after by investors, in particular Private and Syndicate investors. Fashion exposure is still seen as tenancy risk as the consumer continues to ration their spending towards more essential groups. Neighbourhood centres and freestanding investments remain the preferred sub-class, with a strong non-discretionary presence. In this class, there continues to be investors chasing assets, especially as they try to take advantage of asset sales programs by larger institutions and A-REIT’s.
NSW’s market yield valuations highlight a steadying environment which at current is absent of forced sellers, despite the negativity from commentators. Fortress assets such as Regional centres remain relatively tightly priced, due to their scarcity and the densification of Sydney.
As we noted in our last report, there is a lack of evidence of distressed or forced sellers and therefore price discipline is being maintained. With the RBA reiterating an interest rate regime of low for longer, we do not expect retail asset prices to fall meaningfully, however, we do expect poor quality offerings to struggle. Underperforming centres perhaps may go dark in time as the consumer demand continues to gravitate towards more complete and modern centre offerings. Sydney remains supported by positive demographics of densification and residential infilling, population growth and above average employment growth.
Regional NSW is somewhat more challenging as population migration continues to gravitate towards the main cities, as well as the major social and economic impacts from the drought and bushfires continuing into 2020.
Sub-Regional shopping centres with higher exposure to discretionary spending are seeing valuations begin to fall in price resulting in softened in capitalisation rates. In the year to December 2019 yields expanded by 25 basis points to an average of 6.63%, while Neighbourhood centres are averaging at 6.19%, highlighting their preferred investment status. Regional and Super Regional centres are averaging 5.0%, ranging from 4.25% to 5.75%, highlighting their unique qualities of location and irreplaceability.
At a tenant level, we are seeing evidence of rising incentives for both new and existing, as landlords attempt to retain occupancies. However recent bankruptcies and tenant rationalisation of locations is a continuing headwind. Fashion remains a tenancy risk. In keeping with the demand for non-discretionary retail, we are seeing rental growth in Supermarkets over the year, but for other retailing, rents are trending downwards, particularly for Mini-majors and Specialty tenants.
Q4/2019
savills.com.au/research 11
Savills Research | Quarter Time – National Retail
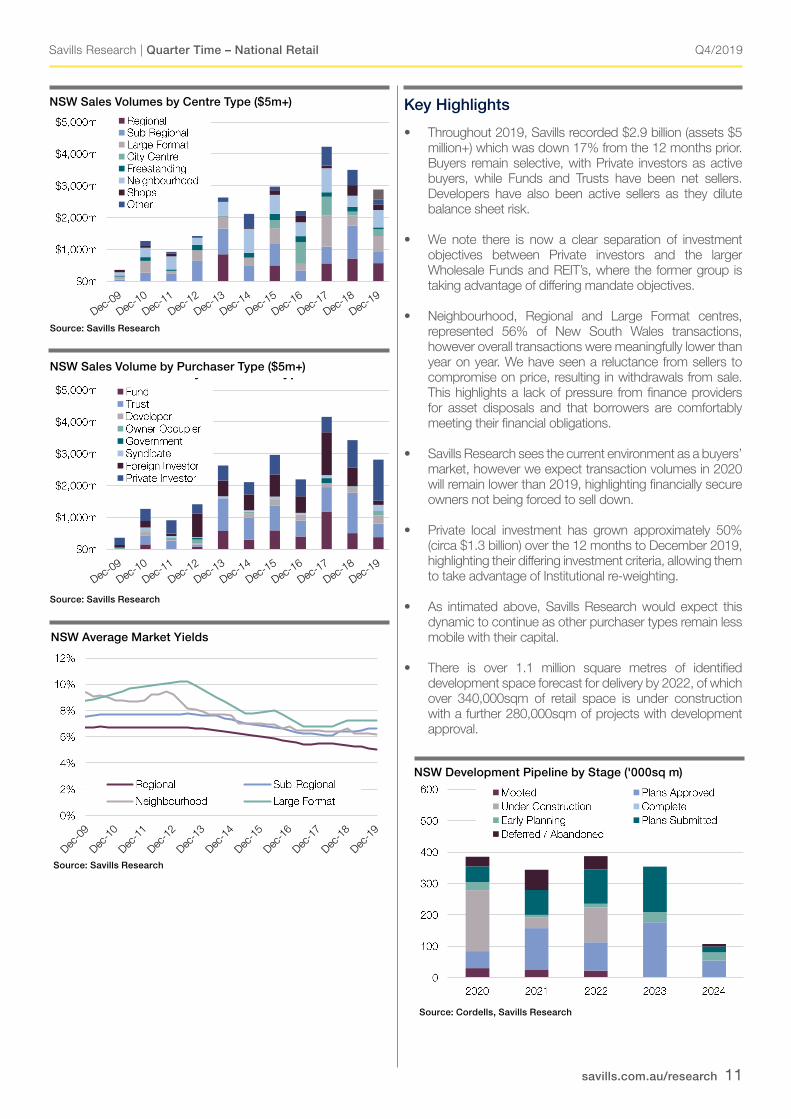
Key Highlights
• Throughout 2019, Savills recorded $2.9 billion (assets $5 million+) which was down 17% from the 12 months prior. Buyers remain selective, with Private investors as active buyers, while Funds and Trusts have been net sellers. Developers have also been active sellers as they dilute balance sheet risk.
• We note there is now a clear separation of investment objectives between Private investors and the larger Wholesale Funds and REIT’s, where the former group is taking advantage of differing mandate objectives.
• Neighbourhood, Regional and Large Format centres, represented 56% of New South Wales transactions, however overall transactions were meaningfully lower than year on year. We have seen a reluctance from sellers to compromise on price, resulting in withdrawals from sale. This highlights a lack of pressure from finance providers for asset disposals and that borrowers are comfortably meeting their financial obligations.
• Savills Research sees the current environment as a buyers’ market, however we expect transaction volumes in 2020 will remain lower than 2019, highlighting financially secure owners not being forced to sell down.
• Private local investment has grown approximately 50% (circa $1.3 billion) over the 12 months to December 2019, highlighting their differing investment criteria, allowing them to take advantage of Institutional re-weighting.
• As intimated above, Savills Research would expect this dynamic to continue as other purchaser types remain less mobile with their capital.
• There is over 1.1 million square metres of identified development space forecast for delivery by 2022, of which over 340,000sqm of retail space is under construction with a further 280,000sqm of projects with development approval.
Source: Savills Research
Source: Savills Research
NSW Sales Volumes by Centre Type ($5m+)
NSW Average Market Yields
NSW Sales Volume by Purchaser Type ($5m+)
Source: Savills Research
NSW Sales Volumes by Centre Type
Source: Savills Research
NSW Sales Volumes by Purchaser Type
Source: Savills Research NSW Average Market Yields
NSW Development Pipeline by Development Stage ('000sq m)
NSW Sales Volumes by Centre Type
Source: Savills Research
NSW Sales Volumes by Purchaser Type
Source: Savills Research NSW Average Market Yields
NSW Development Pipeline by Development Stage ('000sq m)
NSW Development Pipeline by Stage ('000sq m)
NSW Sales Volumes by Centre Type
Source: Savills Research
NSW Sales Volumes by Purchaser Type
Source: Savills Research NSW Average Market Yields
NSW Development Pipeline by Development Stage ('000sq m)
NSW Sales Volumes by Centre Type
Source: Savills Research
NSW Sales Volumes by Purchaser Type
Source: Savills Research NSW Average Market Yields
NSW Development Pipeline by Development Stage ('000sq m)
Source: Cordells, Savills Research
Q4/2019
savills.com.au/research 12
Savills Research | Quarter Time – National Retail
Key Highlights• Despite low for longer interest rates providing cheap cost of
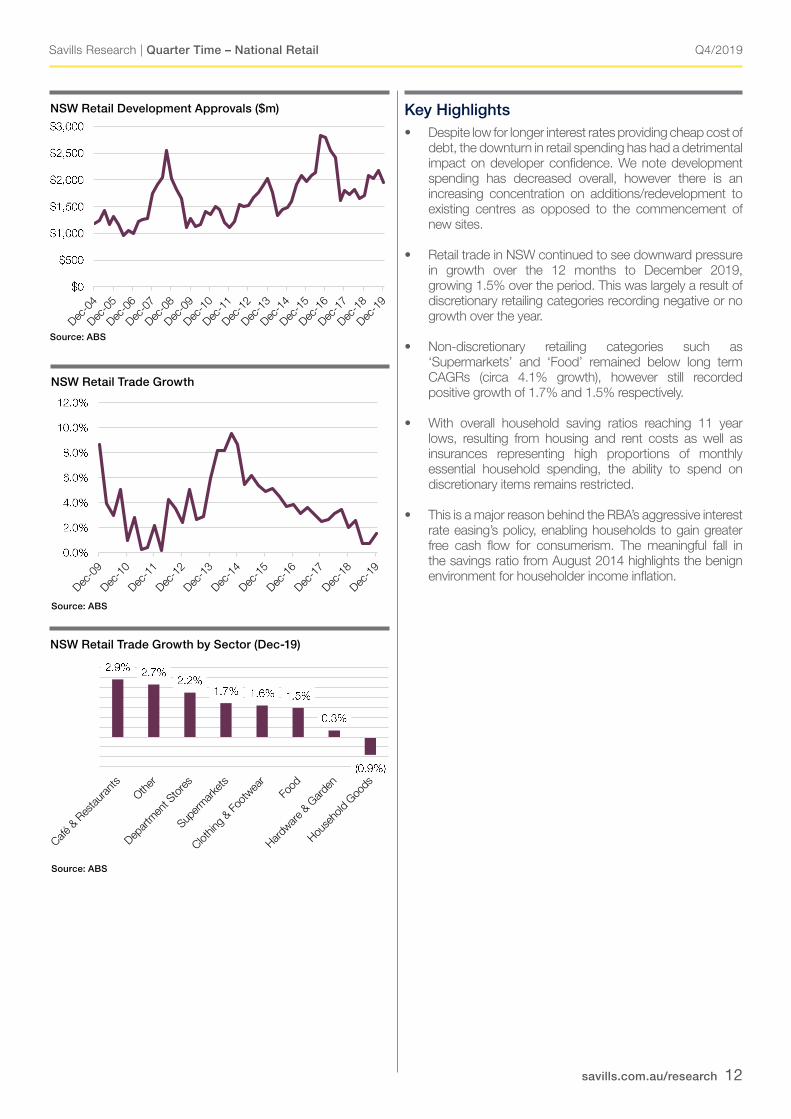
debt, the downturn in retail spending has had a detrimental impact on developer confidence. We note development spending has decreased overall, however there is an increasing concentration on additions/redevelopment to existing centres as opposed to the commencement of new sites.
• Retail trade in NSW continued to see downward pressure in growth over the 12 months to December 2019, growing 1.5% over the period. This was largely a result of discretionary retailing categories recording negative or no growth over the year.
• Non-discretionary retailing categories such as ‘Supermarkets’ and ‘Food’ remained below long term CAGRs (circa 4.1% growth), however still recorded positive growth of 1.7% and 1.5% respectively.
• With overall household saving ratios reaching 11 year lows, resulting from housing and rent costs as well as insurances representing high proportions of monthly essential household spending, the ability to spend on discretionary items remains restricted.
• This is a major reason behind the RBA’s aggressive interest rate easing’s policy, enabling households to gain greater free cash flow for consumerism. The meaningful fall in the savings ratio from August 2014 highlights the benign environment for householder income inflation.
Source: ABS
NSW Retail Development Approvals ($m)
NSW Retail Development Approvals ($m)
Source: ABS NSW Retail Trade Growth
Source: ABS NSW Retail Trade by Sector (to Dec-19)
Source: ABS
Source: ABS
NSW Retail Trade Growth
NSW Retail Development Approvals ($m)
Source: ABS NSW Retail Trade Growth
Source: ABS NSW Retail Trade by Sector (to Dec-19)
Source: ABS
Source: ABS
NSW Retail Trade Growth by Sector (Dec-19)
NSW Retail Development Approvals ($m)
Source: ABS NSW Retail Trade Growth
Source: ABS NSW Retail Trade by Sector (to Dec-19)
Source: ABS

Q4/2019
savills.com.au/research 13
Savills Research | Quarter Time – National Retail
NSW Key Indicators
Enclosed CentresRegional Sub-Regional Neighbourhood Large Format
Low High Low High Low High Low High
Department Store Rent ($/sq m) Gross 150 300 - - - - - -
DDS Rent ($/sq m) Gross 150 300 150 250 - - - -
Supermarket Rent ($/sq m) Gross 300 550 250 550 250 500 - -
Mini-Major Rent ($/sq m) Gross 150 300 150 250 300 700 - -
Specialty Tenant Rent ($/sq m) Gross 1,000 2,750 700 1,400 550 1,000 200 400
Yield - Market (%) 4.25 6.00 5.50 8.00 5.25 7.25 6.50 8.00
IRR (%) 6.00 7.00 6.50 8.00 6.25 7.50 7.50 8.75
Outgoings - Operating ($/sqm) 124 191 105 147 86 147 10 22
Outgoings - Statutory ($/sqm) 19 37 20 39 25 51 17 31
Outgoings - Total ($/sqm) 143 228 125 186 111 198 27 53
Capital Values ($/sqm) 8,500 17,000 3,450 7,500 3,000 9,000 1,500 6,000
Source: Savills Research
Type Property Price ($m) | Date | GLA (sq m) Yield | Type | $/sq m
Major Regional Westfield Burwood, Burwood (50%) 575.0 | May-19 | 63,248 5 | e | 18,182
Mixed Use Central Park Mall, Sydney 174.5 | Oct-19 | 14,716 5.13 | i | 11,858
Neighbourhood Norton Plaza and Norton Central S.C, Leichhardt 153.2 | Aug-19 | 11,856 5.49 | e | 12,922
Sub Regional Rockdale Plaza, Rockdale 145.0 | Apr-19 | 21,335 6.08 | e | 6,796
Large Format Crossroads Homemaker Centre, Casula 140.0 | Feb-19 | 45,051 6.62 | e | 3,108
City Centre 155 King St, Sydney 105.0 | Aug-19 | 1,472 n.a | n.a | 71,332
Sub Regional Neeta City S.C, Fairfield 85.3 | Mar-19 | 24,672 7.8 | i | 3,457
Mixed Use St Marys Village, St Marys 68.0 | Oct-19 | 15,904 5.35 | r | 4,276
Large Format Homemaker Prospect, Prospect 64.3 | Aug-19 | 25,771 7.01 | e | 2,494
Neighbourhood Wentworthville Mall, Wentworthville 63.4 | Nov-19 | 5,467 n.a | n.a | 11,597
NSW – Market Activity Notable Sales
Yield Types: i = initial, e = equated, r = reported, v = vacant, dev = development
Q4/2019
savills.com.au/research 14
Savills Research | Quarter Time – National Retail
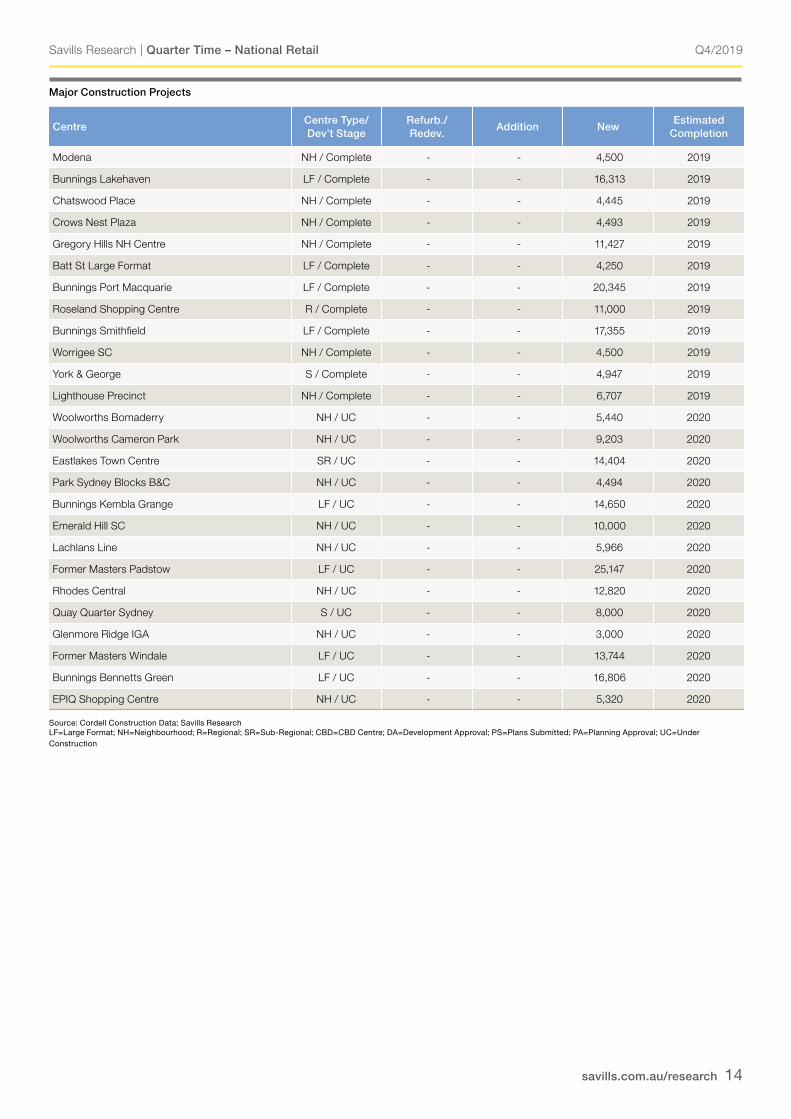
Major Construction Projects
CentreCentre Type/ Dev’t Stage
Refurb./ Redev.
Addition NewEstimated
Completion
Modena NH / Complete - - 4,500 2019
Bunnings Lakehaven LF / Complete - - 16,313 2019
Chatswood Place NH / Complete - - 4,445 2019
Crows Nest Plaza NH / Complete - - 4,493 2019
Gregory Hills NH Centre NH / Complete - - 11,427 2019
Batt St Large Format LF / Complete - - 4,250 2019
Bunnings Port Macquarie LF / Complete - - 20,345 2019
Roseland Shopping Centre R / Complete - - 11,000 2019
Bunnings Smithfield LF / Complete - - 17,355 2019
Worrigee SC NH / Complete - - 4,500 2019
York & George S / Complete - - 4,947 2019
Lighthouse Precinct NH / Complete - - 6,707 2019
Woolworths Bomaderry NH / UC - - 5,440 2020
Woolworths Cameron Park NH / UC - - 9,203 2020
Eastlakes Town Centre SR / UC - - 14,404 2020
Park Sydney Blocks B&C NH / UC - - 4,494 2020
Bunnings Kembla Grange LF / UC - - 14,650 2020
Emerald Hill SC NH / UC - - 10,000 2020
Lachlans Line NH / UC - - 5,966 2020
Former Masters Padstow LF / UC - - 25,147 2020
Rhodes Central NH / UC - - 12,820 2020
Quay Quarter Sydney S / UC - - 8,000 2020
Glenmore Ridge IGA NH / UC - - 3,000 2020
Former Masters Windale LF / UC - - 13,744 2020
Bunnings Bennetts Green LF / UC - - 16,806 2020
EPIQ Shopping Centre NH / UC - - 5,320 2020
Source: Cordell Construction Data; Savills Research LF=Large Format; NH=Neighbourhood; R=Regional; SR=Sub-Regional; CBD=CBD Centre; DA=Development Approval; PS=Plans Submitted; PA=Planning Approval; UC=Under Construction
Q4/2019
savills.com.au/research 15
Savills Research | Quarter Time – National Retail
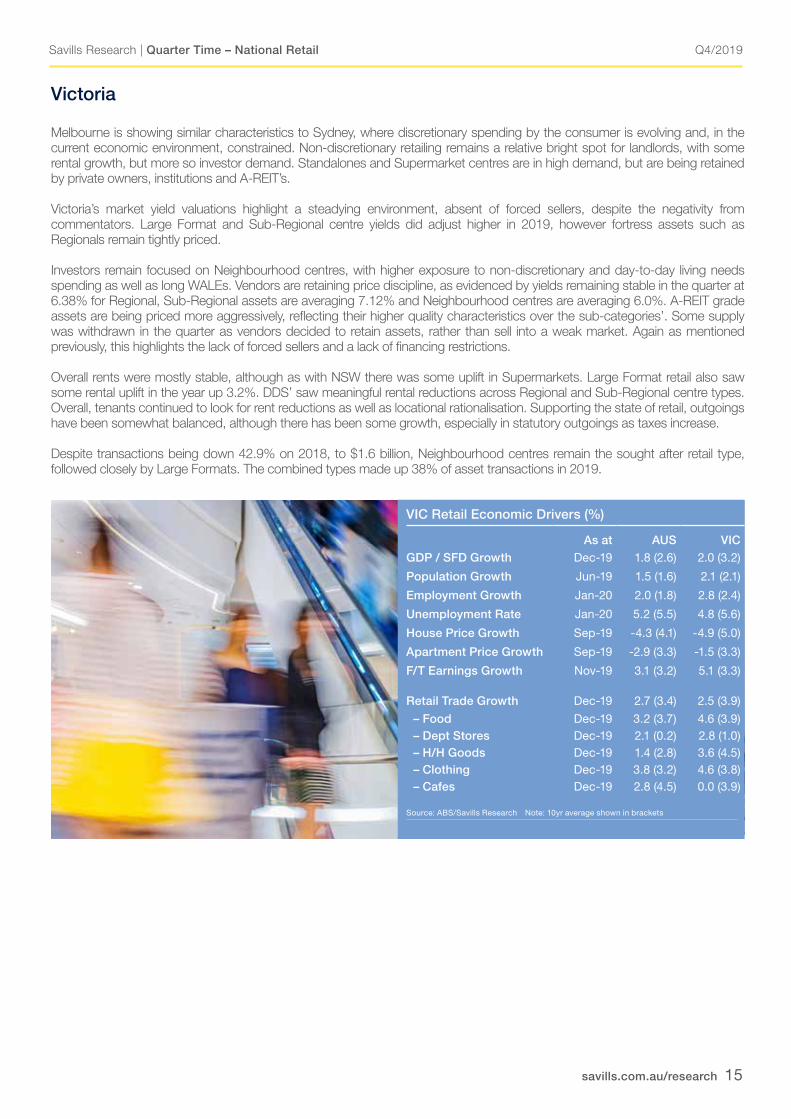
VIC Retail Economic Drivers (%)
As at AUS VICGDP / SFD Growth Dec-19 1.8 (2.6) 2.0 (3.2)
Population Growth Jun-19 1.5 (1.6) 2.1 (2.1)
Employment Growth Jan-20 2.0 (1.8) 2.8 (2.4)
Unemployment Rate Jan-20 5.2 (5.5) 4.8 (5.6)
House Price Growth Sep-19 -4.3 (4.1) -4.9 (5.0)
Apartment Price Growth Sep-19 -2.9 (3.3) -1.5 (3.3)
F/T Earnings Growth Nov-19 3.1 (3.2) 5.1 (3.3)
Retail Trade Growth Dec-19 2.7 (3.4) 2.5 (3.9)
– Food Dec-19 3.2 (3.7) 4.6 (3.9) – Dept Stores Dec-19 2.1 (0.2) 2.8 (1.0) – H/H Goods Dec-19 1.4 (2.8) 3.6 (4.5) – Clothing Dec-19 3.8 (3.2) 4.6 (3.8) – Cafes Dec-19 2.8 (4.5) 0.0 (3.9)
Source: ABS/Savills Research Note: 10yr average shown in brackets
Victoria
Melbourne is showing similar characteristics to Sydney, where discretionary spending by the consumer is evolving and, in the current economic environment, constrained. Non-discretionary retailing remains a relative bright spot for landlords, with some rental growth, but more so investor demand. Standalones and Supermarket centres are in high demand, but are being retained by private owners, institutions and A-REIT’s.
Victoria’s market yield valuations highlight a steadying environment, absent of forced sellers, despite the negativity from commentators. Large Format and Sub-Regional centre yields did adjust higher in 2019, however fortress assets such as Regionals remain tightly priced.
Investors remain focused on Neighbourhood centres, with higher exposure to non-discretionary and day-to-day living needs spending as well as long WALEs. Vendors are retaining price discipline, as evidenced by yields remaining stable in the quarter at 6.38% for Regional, Sub-Regional assets are averaging 7.12% and Neighbourhood centres are averaging 6.0%. A-REIT grade assets are being priced more aggressively, reflecting their higher quality characteristics over the sub-categories’. Some supply was withdrawn in the quarter as vendors decided to retain assets, rather than sell into a weak market. Again as mentioned previously, this highlights the lack of forced sellers and a lack of financing restrictions.
Overall rents were mostly stable, although as with NSW there was some uplift in Supermarkets. Large Format retail also saw some rental uplift in the year up 3.2%. DDS’ saw meaningful rental reductions across Regional and Sub-Regional centre types. Overall, tenants continued to look for rent reductions as well as locational rationalisation. Supporting the state of retail, outgoings have been somewhat balanced, although there has been some growth, especially in statutory outgoings as taxes increase.
Despite transactions being down 42.9% on 2018, to $1.6 billion, Neighbourhood centres remain the sought after retail type, followed closely by Large Formats. The combined types made up 38% of asset transactions in 2019.

Q4/2019
savills.com.au/research 16
Savills Research | Quarter Time – National Retail
Key Highlights
• Victoria’s total retail asset sales transactions (over $5 million) declined a large 48% in the 12 months to December 2019 to $1.5 billion from $2.8 billion in the year to December 2018. This highlights the softening retail environment.
• As with NSW, Private investors were the most active players, representing 36% of sales and 26% of purchases in the year to December 2019. Local Funds and Trusts followed, totalling to 25% of purchases, however, reflected 25% of vendor composition.
• Foreign investors amounted to 18% of purchasers, up from 10% in 2018. The growth in Foreign capital highlights the relative yield pickup versus alternative global investments as well as the advantageous pricing of the Australian dollar, enabling superior metrics. Of course investment isn’t just about the running yield so time will tell if this activity provides meaningful capital gain. Interestingly, Foreign capital was not as active or dominant in NSW.
• Retail related development approvals increased in 2019 as owners decided to upgrade existing assets to make more competitive and appealing to consumers and as a matter of course to retain tenants, who are becoming more discerning on locations. Development Approvals are up 17.7% on 2018 to $1.8 billion.
• Approximately 242,000sq m of Retail space is under construction and an additional 225,000sqm with development approval.
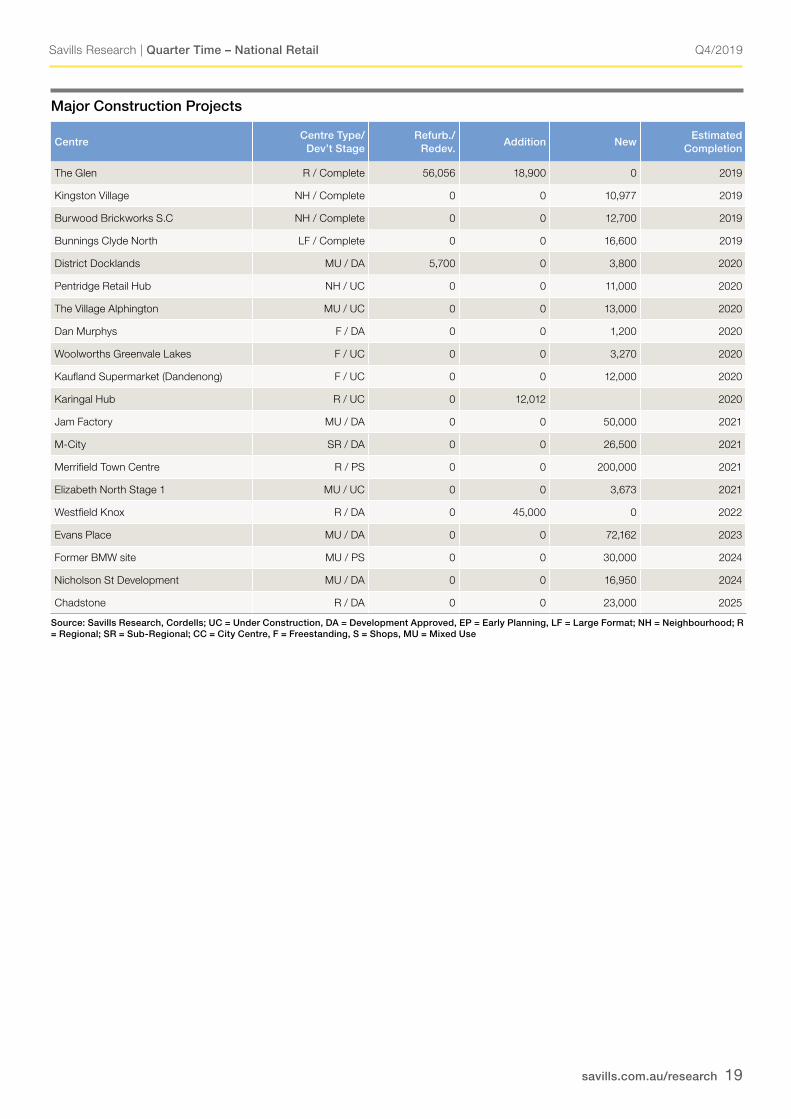
• Regional centre projects, (including additions), account for the largest share of future development supply in Victoria. This is mainly due to plans such as the Merrifield Shopping Centre, offering 200,000sq m of additional retail space.
• In response to changing consumer demand, landlords are refurbishing and adding new additional spaces within existing centres in an effort to keep customers in store. One of Melbourne’s most iconic centres the Jam Factory on Chapel St will almost completely be demolished in an effort to convert the centre into a mixed use space, including; office, retail, a garden terrace, a new 2,300 seat cinema, dining podium and open-air plaza.
• Vicinity is the most active landlord in Victoria with major scale redevelopments underway or planned from building hotel at Chadstone, serviced apartments at Sunshine Marketplace, retail and mixed-use at Box Hill Central and Victoria Gardens to plans for office at Emporium and Chadstone.
Source: Savills Research
Source: Savills Research
VIC Sales Volumes by Centre Type ($5m+)
VIC Average Market Yields
VIC Sales Volumes by Purchaser Type ($5m+)
Source: Savills Research
VIC Sales Volumes by Centre Type
Source: Savills Research
VIC Sales Volumes by Purchaser Type
Source: Savills Research VIC Average Market Yields
VIC Sales Volumes by Centre Type
Source: Savills Research
VIC Sales Volumes by Purchaser Type
Source: Savills Research VIC Average Market Yields
VIC Sales Volumes by Centre Type
Source: Savills Research
VIC Sales Volumes by Purchaser Type
Source: Savills Research VIC Average Market Yields
VIC Retail Development Approvals ($m)
Source: ABS
VIC Sales Volumes by Centre Type
Source: Savills Research
VIC Sales Volumes by Purchaser Type
Source: Savills Research VIC Average Market Yields
Q4/2019
savills.com.au/research 17
Savills Research | Quarter Time – National Retail
Key Highlights
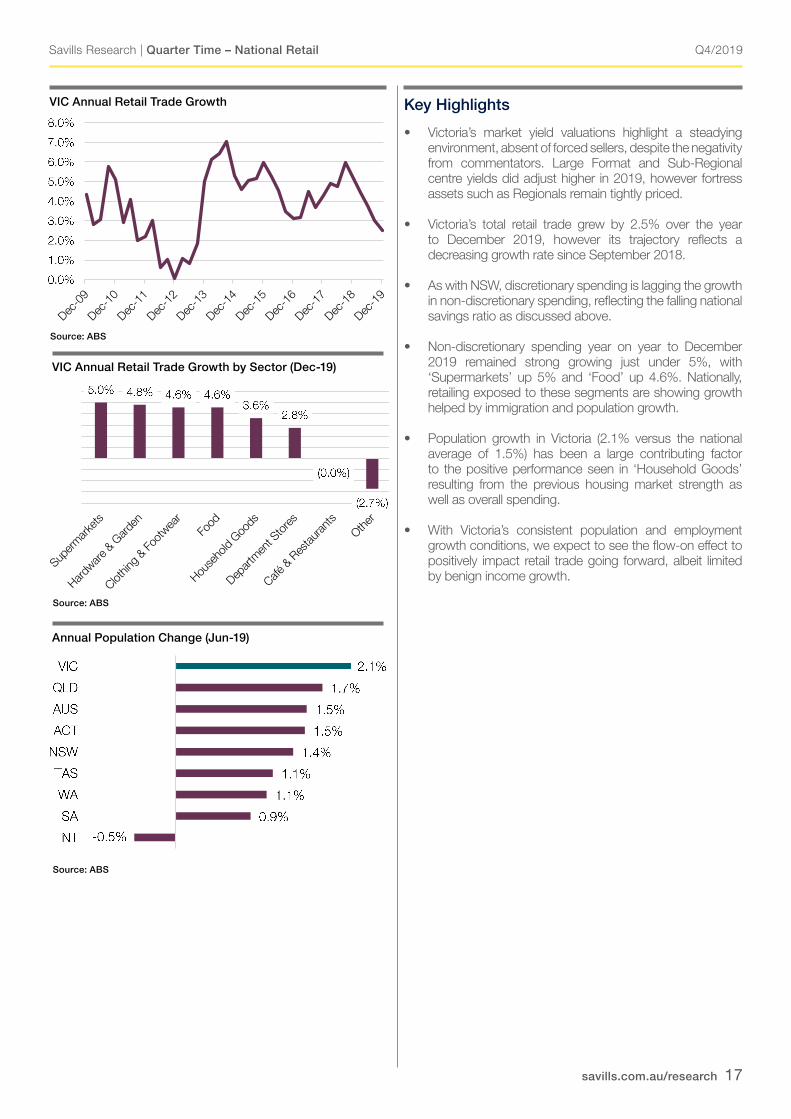
• Victoria’s market yield valuations highlight a steadying environment, absent of forced sellers, despite the negativity from commentators. Large Format and Sub-Regional centre yields did adjust higher in 2019, however fortress assets such as Regionals remain tightly priced.
• Victoria’s total retail trade grew by 2.5% over the year to December 2019, however its trajectory reflects a decreasing growth rate since September 2018.
• As with NSW, discretionary spending is lagging the growth in non-discretionary spending, reflecting the falling national savings ratio as discussed above.
• Non-discretionary spending year on year to December 2019 remained strong growing just under 5%, with ‘Supermarkets’ up 5% and ‘Food’ up 4.6%. Nationally, retailing exposed to these segments are showing growth helped by immigration and population growth.
• Population growth in Victoria (2.1% versus the national average of 1.5%) has been a large contributing factor to the positive performance seen in ‘Household Goods’ resulting from the previous housing market strength as well as overall spending.
• With Victoria’s consistent population and employment growth conditions, we expect to see the flow-on effect to positively impact retail trade going forward, albeit limited by benign income growth.
Source: ABS
VIC Annual Retail Trade Growth VIC Retail Trade Growth (Dec-19)
Source: ABS
VIC Retail Trade Annual Growth by Sector (Dec-19)
Source: ABS Annual Population Change (Jun-19)
Source: ABS
VIC Annual Retail Trade Growth by Sector (Dec-19)
VIC Retail Trade Growth (Dec-19)
Source: ABS
VIC Retail Trade Annual Growth by Sector (Dec-19)
Source: ABS Annual Population Change (Jun-19)
Source: ABS
Annual Population Change (Jun-19)
VIC Retail Trade Growth (Dec-19)
Source: ABS
VIC Retail Trade Annual Growth by Sector (Dec-19)
Source: ABS Annual Population Change (Jun-19)

Q4/2019
savills.com.au/research 18
Savills Research | Quarter Time – National Retail
Victoria Key Indicators
Enclosed CentresRegional Sub-Regional Neighbourhood Large Format
Low High Low High Low High Low High
Department Store Rent ($/sq m) Gross 150 300 - - - - - -
DDS Rent ($/sq m) Gross 150 300 150 250 - - - -
Supermarket Rent ($/sq m) Gross 300 500 250 500 250 500 - -
Mini-Major Rent ($/sq m) Gross 500 1,500 400 1,350 300 650 - -
Specialty Tenant Rent ($/sq m) Gross 1,000 2,200 650 1,400 550 750 190 300
Yield - Market (%) 4.25 5.75 5.50 7.25 5.25 6.75 6.25 7.50
IRR (%) 6.00 6.75 6.50 7.75 6.00 7.50 7.25 8.25
Outgoings - Operating ($/sqm) 114 198 106 145 87 149 25 50
Outgoings - Statutory ($/sqm) 39 61 30 46 37 53 20 30
Outgoings - Total ($/sqm) 153 259 136 191 124 202 45 80
Capital Values ($/sqm) 7,500 12,000 4,000 7,500 4,000 7,500 2,250 3,500
Source: Savills Research
Type Property Price ($m) | Date | GLA (sq m) Yield | Type | $/sq m
Sub Regional Brimbank SC, Deer Park 153.0 | Dec-19 | 32,788 7.45 | i | 4,666
Sub Regional Warun Ponds SC, Greater Geelong 112.5 | Jul-19 | 47,822 n.a | n.a | 4,705
Sub Regional Corio Central SC, Corio, (50%) 101.0 | Nov-19 | 31,500 7.75 | e | 3,175
Large Format Craigieburn Junction, Craigieburn 100.0 | Jul-19 | 23,000 n.a | n.a | 4,348
Sub Regional Uni Hill Factory Outlets, Bundoora 67.8 | Dec-19 | 19,580 6.5 | r | 3,463
Neighbourhood Tooronga Village S.C, Glen Iris 62.8 | Jul-19 | 8,973 6.27 | e | 6,975
Large Format Warragul Retail Centre, Warragul 51.3 | Jul-19 | 25,315 6.10 | e | 2,024
Other Mernda Town Centre, Mernda 50.0 | Feb-19 | n.a n.a | n.a | n.a
Neighbourhood Coburg North Village, Coburg North 47.0 | Apr-19 | 6,283 4.82 | i | 7,481
Neighbourhood Aurora Village SC, Epping 45.0 | Jan-19 | 9,677 5.76 | i | 4,650
Victoria – Market Activity Notable Sales
Yield Types: i = initial, e = equated, r = reported, v = vacant, dev = development
Q4/2019
savills.com.au/research 19
Savills Research | Quarter Time – National Retail
Major Construction Projects
CentreCentre Type/
Dev’t StageRefurb./
Redev.Addition New
EstimatedCompletion
The Glen R / Complete 56,056 18,900 0 2019
Kingston Village NH / Complete 0 0 10,977 2019
Burwood Brickworks S.C NH / Complete 0 0 12,700 2019
Bunnings Clyde North LF / Complete 0 0 16,600 2019
District Docklands MU / DA 5,700 0 3,800 2020
Pentridge Retail Hub NH / UC 0 0 11,000 2020
The Village Alphington MU / UC 0 0 13,000 2020
Dan Murphys F / DA 0 0 1,200 2020
Woolworths Greenvale Lakes F / UC 0 0 3,270 2020
Kaufland Supermarket (Dandenong) F / UC 0 0 12,000 2020
Karingal Hub R / UC 0 12,012 2020
Jam Factory MU / DA 0 0 50,000 2021
M-City SR / DA 0 0 26,500 2021
Merrifield Town Centre R / PS 0 0 200,000 2021
Elizabeth North Stage 1 MU / UC 0 0 3,673 2021
Westfield Knox R / DA 0 45,000 0 2022
Evans Place MU / DA 0 0 72,162 2023
Former BMW site MU / PS 0 0 30,000 2024
Nicholson St Development MU / DA 0 0 16,950 2024
Chadstone R / DA 0 0 23,000 2025
Source: Savills Research, Cordells; UC = Under Construction, DA = Development Approved, EP = Early Planning, LF = Large Format; NH = Neighbourhood; R = Regional; SR = Sub-Regional; CC = City Centre, F = Freestanding, S = Shops, MU = Mixed Use
Q4/2019
savills.com.au/research 20
Savills Research | Quarter Time – National Retail
QLD Retail Economic Drivers (%)
As at AUS QLDGDP / SFD Growth Dec-19 1.8 (2.6) 1.1 (2.0)
Population Growth Jun-19 1.5 (1.6) 1.7 (1.6)
Employment Growth Jan-20 2.0 (1.8) 2.3 (1.5)
Unemployment Rate Jan-20 5.2 (5.5) 6.2 (6.0)
House Price Growth Sep-19 -4.3 (4.1) -0.9 (2.2)
Apartment Price Growth Sep-19 -2.9 (3.3) 2.0 (0.7)
F/T Earnings Growth Nov-19 3.1 (3.2) 1.9 (2.8)
Retail Trade Growth Dec-19 2.7 (3.4) 4.7 (3.2)
– Food Dec-19 3.2 (3.7) 4.4 (3.9) – Dept Stores Dec-19 2.1 (0.2) 1.1 (-0.1) – H/H Goods Dec-19 1.4 (2.8) 1.2 (2.2) – Clothing Dec-19 3.8 (3.2) 9.9 (4.0) – Cafes Dec-19 2.8 (4.5) 5.8 (4.2)
Source: ABS/Savills Research Note: 10yr average shown in brackets
Queensland
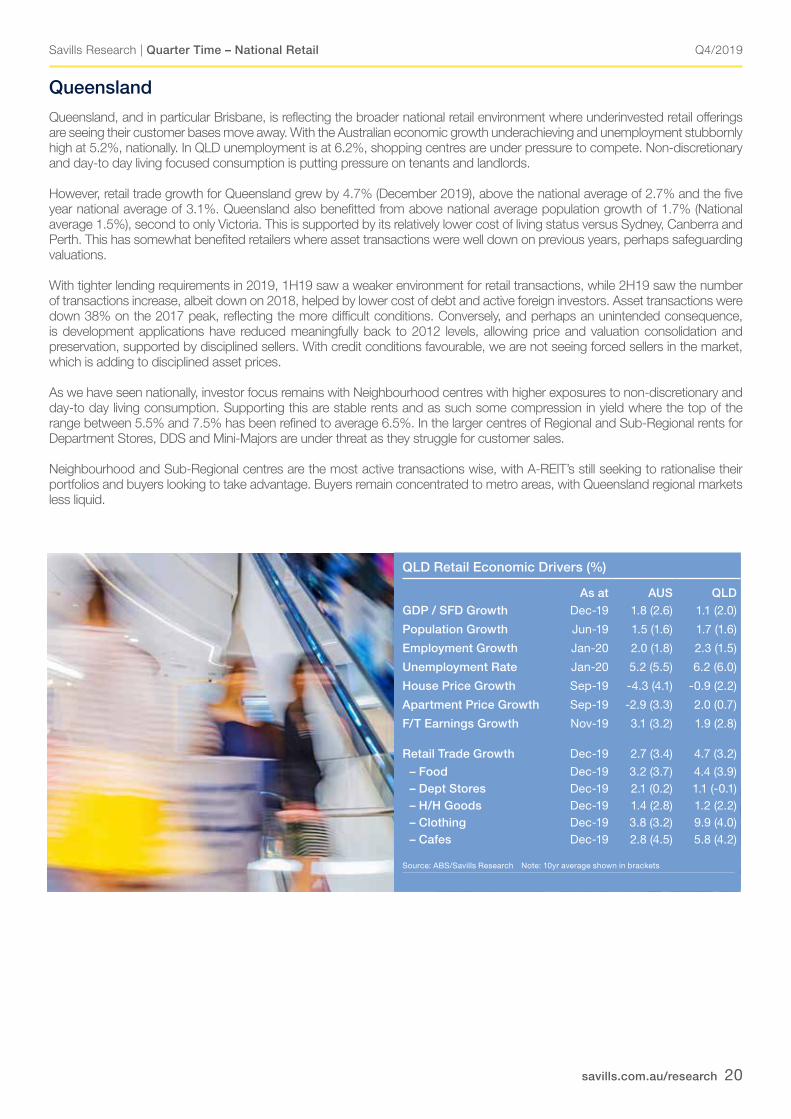
Queensland, and in particular Brisbane, is reflecting the broader national retail environment where underinvested retail offerings are seeing their customer bases move away. With the Australian economic growth underachieving and unemployment stubbornly high at 5.2%, nationally. In QLD unemployment is at 6.2%, shopping centres are under pressure to compete. Non-discretionary and day-to day living focused consumption is putting pressure on tenants and landlords.
However, retail trade growth for Queensland grew by 4.7% (December 2019), above the national average of 2.7% and the five year national average of 3.1%. Queensland also benefitted from above national average population growth of 1.7% (National average 1.5%), second to only Victoria. This is supported by its relatively lower cost of living status versus Sydney, Canberra and Perth. This has somewhat benefited retailers where asset transactions were well down on previous years, perhaps safeguarding valuations.
With tighter lending requirements in 2019, 1H19 saw a weaker environment for retail transactions, while 2H19 saw the number of transactions increase, albeit down on 2018, helped by lower cost of debt and active foreign investors. Asset transactions were down 38% on the 2017 peak, reflecting the more difficult conditions. Conversely, and perhaps an unintended consequence, is development applications have reduced meaningfully back to 2012 levels, allowing price and valuation consolidation and preservation, supported by disciplined sellers. With credit conditions favourable, we are not seeing forced sellers in the market, which is adding to disciplined asset prices.
As we have seen nationally, investor focus remains with Neighbourhood centres with higher exposures to non-discretionary and day-to day living consumption. Supporting this are stable rents and as such some compression in yield where the top of the range between 5.5% and 7.5% has been refined to average 6.5%. In the larger centres of Regional and Sub-Regional rents for Department Stores, DDS and Mini-Majors are under threat as they struggle for customer sales.
Neighbourhood and Sub-Regional centres are the most active transactions wise, with A-REIT’s still seeking to rationalise their portfolios and buyers looking to take advantage. Buyers remain concentrated to metro areas, with Queensland regional markets less liquid.
Q4/2019
savills.com.au/research 21
Savills Research | Quarter Time – National Retail
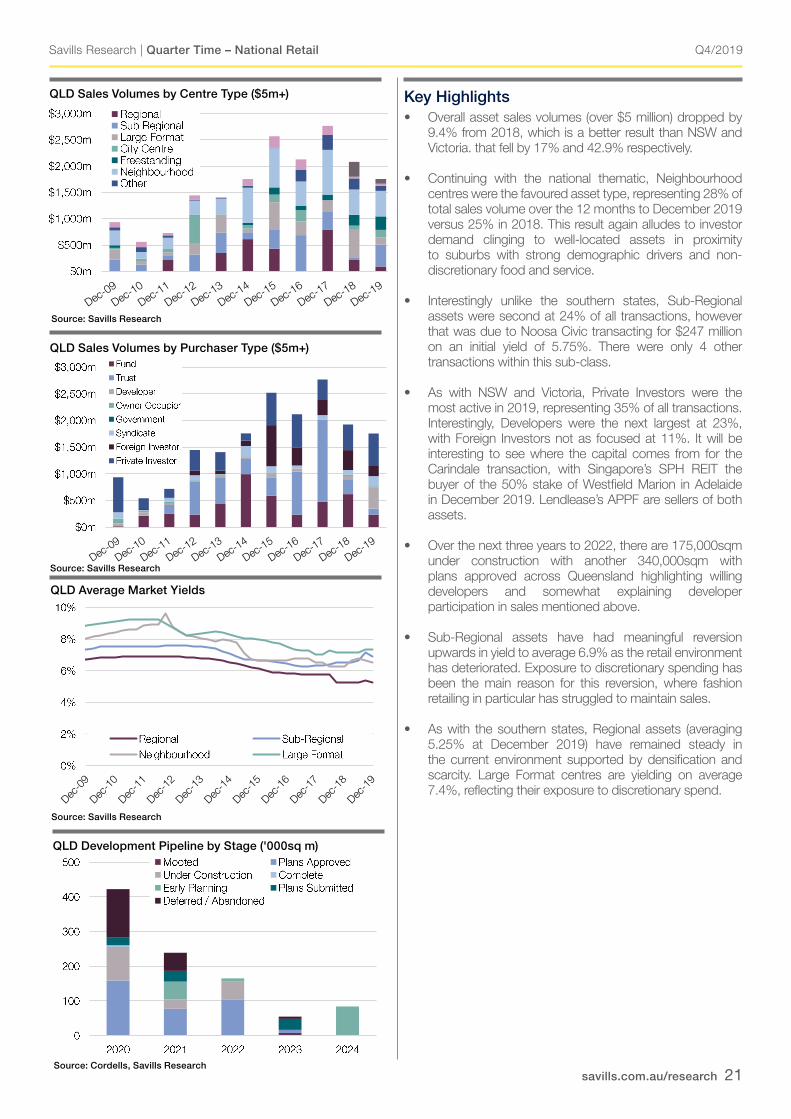
Key Highlights• Overall asset sales volumes (over $5 million) dropped by
9.4% from 2018, which is a better result than NSW and Victoria. that fell by 17% and 42.9% respectively.
• Continuing with the national thematic, Neighbourhood centres were the favoured asset type, representing 28% of total sales volume over the 12 months to December 2019 versus 25% in 2018. This result again alludes to investor demand clinging to well-located assets in proximity to suburbs with strong demographic drivers and non-discretionary food and service.
• Interestingly unlike the southern states, Sub-Regional assets were second at 24% of all transactions, however that was due to Noosa Civic transacting for $247 million on an initial yield of 5.75%. There were only 4 other transactions within this sub-class.
• As with NSW and Victoria, Private Investors were the most active in 2019, representing 35% of all transactions. Interestingly, Developers were the next largest at 23%, with Foreign Investors not as focused at 11%. It will be interesting to see where the capital comes from for the Carindale transaction, with Singapore’s SPH REIT the buyer of the 50% stake of Westfield Marion in Adelaide in December 2019. Lendlease’s APPF are sellers of both assets.
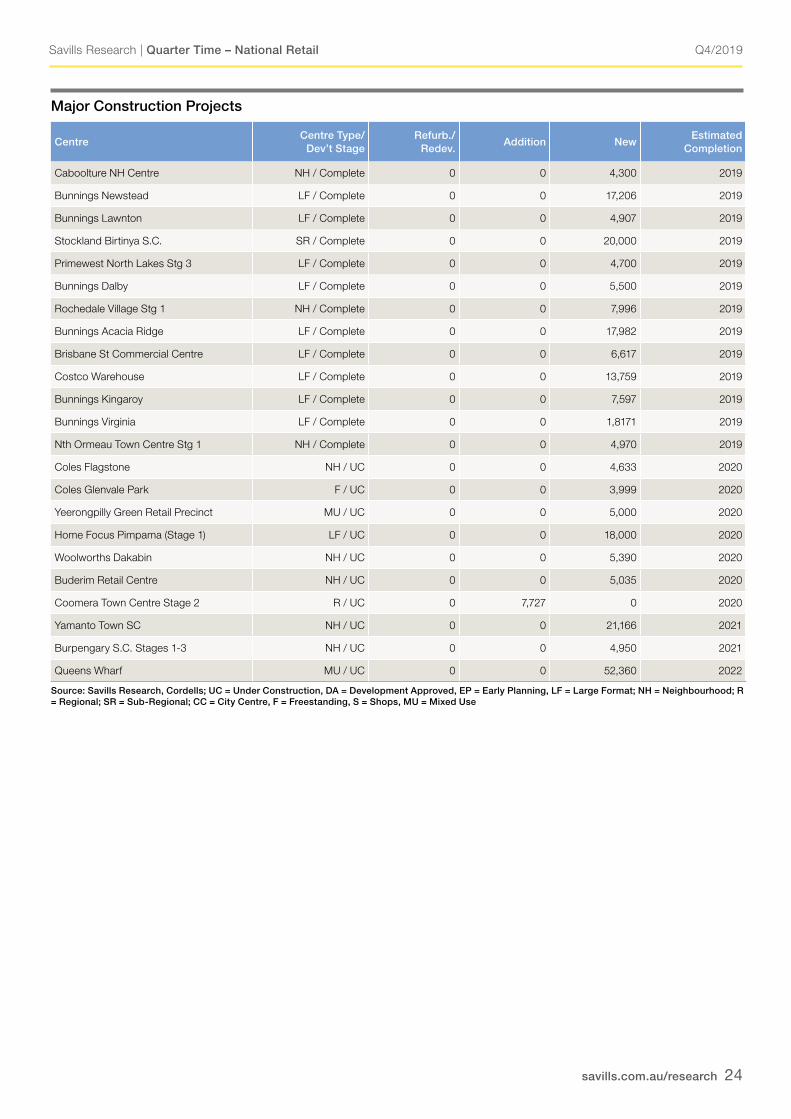
• Over the next three years to 2022, there are 175,000sqm under construction with another 340,000sqm with plans approved across Queensland highlighting willing developers and somewhat explaining developer participation in sales mentioned above.
• Sub-Regional assets have had meaningful reversion upwards in yield to average 6.9% as the retail environment has deteriorated. Exposure to discretionary spending has been the main reason for this reversion, where fashion retailing in particular has struggled to maintain sales.
• As with the southern states, Regional assets (averaging 5.25% at December 2019) have remained steady in the current environment supported by densification and scarcity. Large Format centres are yielding on average 7.4%, reflecting their exposure to discretionary spend.
Source: Savills Research
Source: Savills Research
QLD Sales Volumes by Centre Type ($5m+)
QLD Average Market Yields
QLD Sales Volumes by Purchaser Type ($5m+)
Source: Savills Research
QLD Sales Volumes by Centre Type ($5 million+)
QLD Sales Volumes by Purchaser Type
QLD Average Market Yields by Type
QLD Development Pipeline by Development Stage ('000sq m)
Source: Cordells, Savills Research
QLD Development Pipeline by Stage ('000sq m)
QLD Sales Volumes by Centre Type ($5 million+)
QLD Sales Volumes by Purchaser Type
QLD Average Market Yields by Type
QLD Development Pipeline by Development Stage ('000sq m)
QLD Sales Volumes by Centre Type ($5 million+)
QLD Sales Volumes by Purchaser Type
QLD Average Market Yields by Type
QLD Development Pipeline by Development Stage ('000sq m)
QLD Sales Volumes by Centre Type ($5 million+)
QLD Sales Volumes by Purchaser Type
QLD Average Market Yields by Type
QLD Development Pipeline by Development Stage ('000sq m)
Q4/2019
savills.com.au/research 22
Savills Research | Quarter Time – National Retail
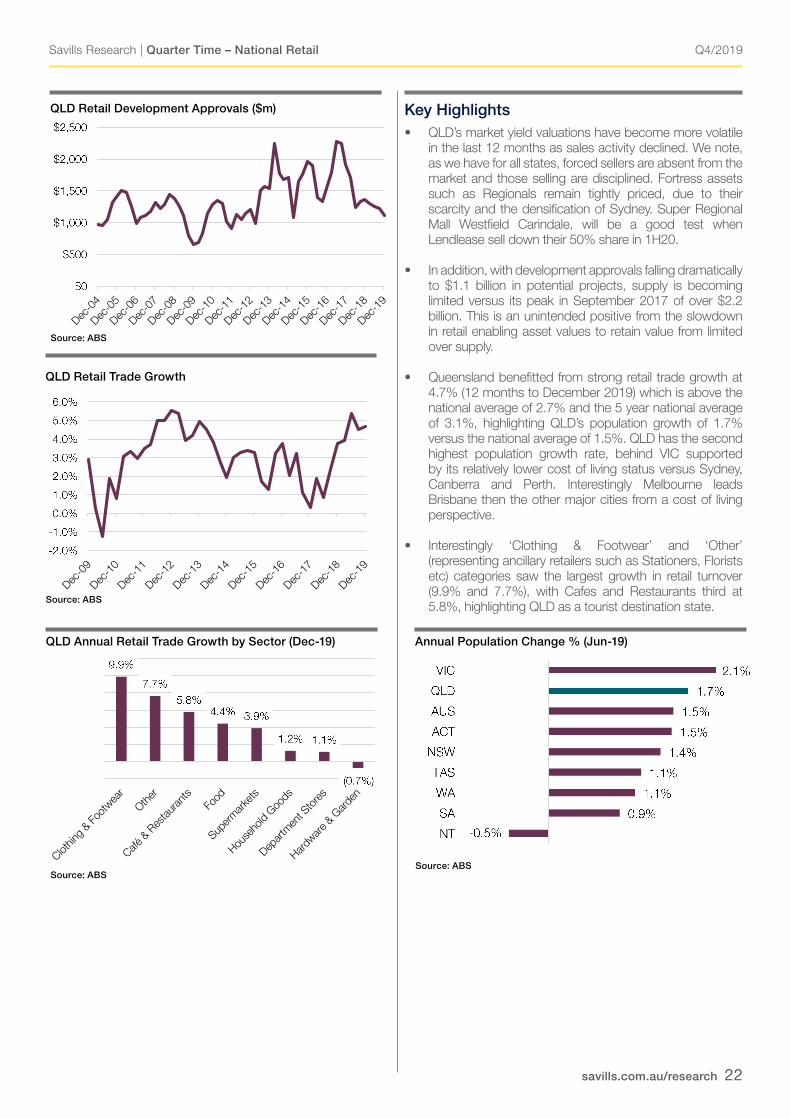
Key Highlights• QLD’s market yield valuations have become more volatile
in the last 12 months as sales activity declined. We note, as we have for all states, forced sellers are absent from the market and those selling are disciplined. Fortress assets such as Regionals remain tightly priced, due to their scarcity and the densification of Sydney. Super Regional Mall Westfield Carindale, will be a good test when Lendlease sell down their 50% share in 1H20.
• In addition, with development approvals falling dramatically to $1.1 billion in potential projects, supply is becoming limited versus its peak in September 2017 of over $2.2 billion. This is an unintended positive from the slowdown in retail enabling asset values to retain value from limited over supply.
• Queensland benefitted from strong retail trade growth at 4.7% (12 months to December 2019) which is above the national average of 2.7% and the 5 year national average of 3.1%, highlighting QLD’s population growth of 1.7% versus the national average of 1.5%. QLD has the second highest population growth rate, behind VIC supported by its relatively lower cost of living status versus Sydney, Canberra and Perth. Interestingly Melbourne leads Brisbane then the other major cities from a cost of living perspective.
• Interestingly ‘Clothing & Footwear’ and ‘Other’ (representing ancillary retailers such as Stationers, Florists etc) categories saw the largest growth in retail turnover (9.9% and 7.7%), with Cafes and Restaurants third at 5.8%, highlighting QLD as a tourist destination state.
Source: ABS
QLD Retail Development Approvals ($m)
Source: ABS
QLD Retail Trade Growth
QLD Retail Development Approvals ($m)
Source: ABS QLD Retail Trade Growth (Dec-19)
Source: ABS
QLD Retail Trade Annual Growth by Sector (Dec-19)
Source: ABS, Savills Research Annual Population Change (Jun-19)
Source: Savills Research
Source: ABS
QLD Annual Retail Trade Growth by Sector (Dec-19)
QLD Retail Development Approvals ($m)
Source: ABS QLD Retail Trade Growth (Dec-19)
Source: ABS
QLD Retail Trade Annual Growth by Sector (Dec-19)
Source: ABS, Savills Research Annual Population Change (Jun-19)
Source: Savills Research
Source: ABS
Annual Population Change % (Jun-19)
QLD Retail Development Approvals ($m)
Source: ABS QLD Retail Trade Growth (Dec-19)
Source: ABS
QLD Retail Trade Annual Growth by Sector (Dec-19)
Source: ABS, Savills Research Annual Population Change (Jun-19)
Source: Savills Research
QLD Retail Development Approvals ($m)
Source: ABS QLD Retail Trade Growth (Dec-19)
Source: ABS
QLD Retail Trade Annual Growth by Sector (Dec-19)
Source: ABS, Savills Research Annual Population Change (Jun-19)
Source: Savills Research
Q4/2019
savills.com.au/research 23
Savills Research | Quarter Time – National Retail
Queensland Key Indicators
Enclosed CentresRegional Sub-Regional Neighbourhood Large Format
Low High Low High Low High Low High
Department Store Rent ($/sq m) Gross 150 300 - - - - - -
DDS Rent ($/sq m) Gross 150 300 150 275 - - - -
Supermarket Rent ($/sq m) Gross 300 450 250 450 350 450 - -
Mini-Major Rent ($/sq m) Gross 500 1,500 400 1,000 200 650 - -
Specialty Tenant Rent ($/sq m) Gross 1,000 2,000 700 1,600 550 900 150 330
Yield - Market (%) 4.50 6.00 6.25 7.50 5.50 7.50 6.75 8.00
IRR (%) 6.25 7.00 7.00 7.50 6.75 7.75 7.50 8.50
Outgoings - Operating ($/sqm) 139 185 102 146 73 112 34 44
Outgoings - Statutory ($/sqm) 36 58 34 46 23 47 20 25
Outgoings - Total ($/sqm) 175 243 136 192 96 159 54 69
Capital Values ($/sqm) 7,000 14,000 3,000 7,000 3,000 7,000 1,750 5,150
Source: Savills Research
Type Property Price ($m) | Date | GLA (sq m) Yield | Type | $/sq m
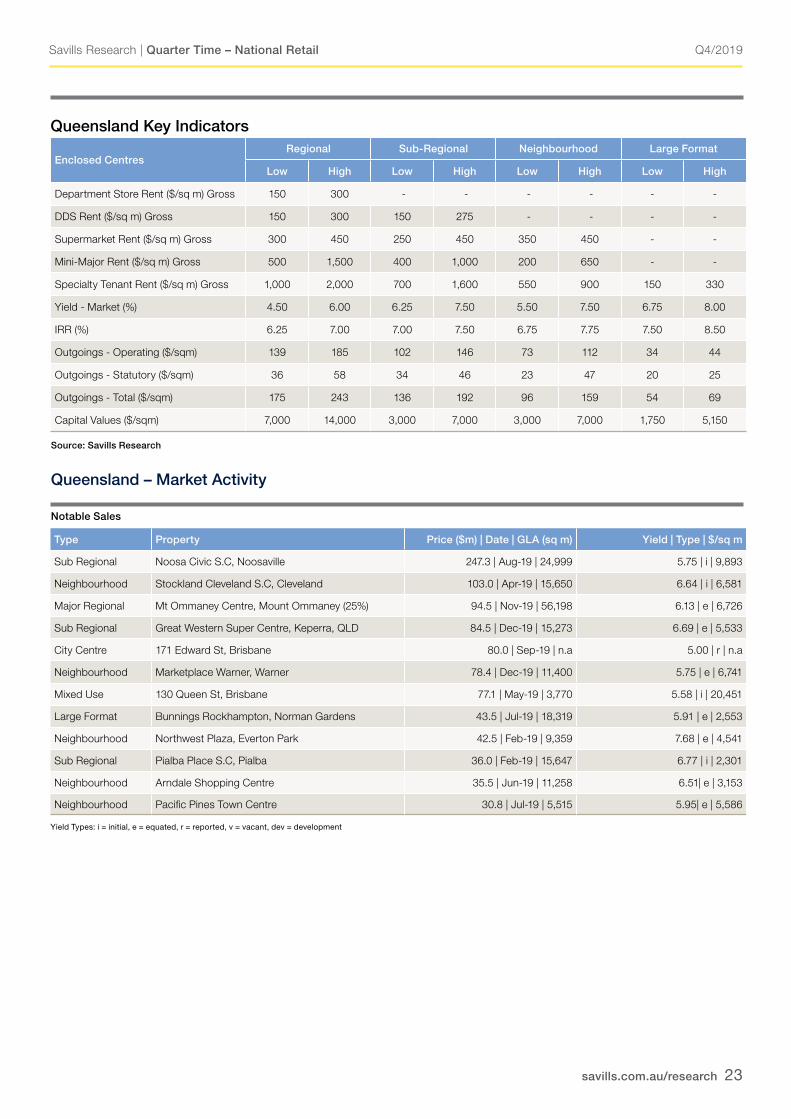
Sub Regional Noosa Civic S.C, Noosaville 247.3 | Aug-19 | 24,999 5.75 | i | 9,893
Neighbourhood Stockland Cleveland S.C, Cleveland 103.0 | Apr-19 | 15,650 6.64 | i | 6,581
Major Regional Mt Ommaney Centre, Mount Ommaney (25%) 94.5 | Nov-19 | 56,198 6.13 | e | 6,726
Sub Regional Great Western Super Centre, Keperra, QLD 84.5 | Dec-19 | 15,273 6.69 | e | 5,533
City Centre 171 Edward St, Brisbane 80.0 | Sep-19 | n.a 5.00 | r | n.a
Neighbourhood Marketplace Warner, Warner 78.4 | Dec-19 | 11,400 5.75 | e | 6,741
Mixed Use 130 Queen St, Brisbane 77.1 | May-19 | 3,770 5.58 | i | 20,451
Large Format Bunnings Rockhampton, Norman Gardens 43.5 | Jul-19 | 18,319 5.91 | e | 2,553
Neighbourhood Northwest Plaza, Everton Park 42.5 | Feb-19 | 9,359 7.68 | e | 4,541
Sub Regional Pialba Place S.C, Pialba 36.0 | Feb-19 | 15,647 6.77 | i | 2,301
Neighbourhood Arndale Shopping Centre 35.5 | Jun-19 | 11,258 6.51| e | 3,153
Neighbourhood Pacific Pines Town Centre 30.8 | Jul-19 | 5,515 5.95| e | 5,586
Queensland – Market Activity Notable Sales
Yield Types: i = initial, e = equated, r = reported, v = vacant, dev = development
Q4/2019
savills.com.au/research 24
Savills Research | Quarter Time – National Retail
Major Construction Projects
CentreCentre Type/
Dev’t StageRefurb./
Redev.Addition New
EstimatedCompletion
Caboolture NH Centre NH / Complete 0 0 4,300 2019
Bunnings Newstead LF / Complete 0 0 17,206 2019
Bunnings Lawnton LF / Complete 0 0 4,907 2019
Stockland Birtinya S.C. SR / Complete 0 0 20,000 2019
Primewest North Lakes Stg 3 LF / Complete 0 0 4,700 2019
Bunnings Dalby LF / Complete 0 0 5,500 2019
Rochedale Village Stg 1 NH / Complete 0 0 7,996 2019
Bunnings Acacia Ridge LF / Complete 0 0 17,982 2019
Brisbane St Commercial Centre LF / Complete 0 0 6,617 2019
Costco Warehouse LF / Complete 0 0 13,759 2019
Bunnings Kingaroy LF / Complete 0 0 7,597 2019
Bunnings Virginia LF / Complete 0 0 1,8171 2019
Nth Ormeau Town Centre Stg 1 NH / Complete 0 0 4,970 2019
Coles Flagstone NH / UC 0 0 4,633 2020
Coles Glenvale Park F / UC 0 0 3,999 2020
Yeerongpilly Green Retail Precinct MU / UC 0 0 5,000 2020
Home Focus Pimpama (Stage 1) LF / UC 0 0 18,000 2020
Woolworths Dakabin NH / UC 0 0 5,390 2020
Buderim Retail Centre NH / UC 0 0 5,035 2020
Coomera Town Centre Stage 2 R / UC 0 7,727 0 2020
Yamanto Town SC NH / UC 0 0 21,166 2021
Burpengary S.C. Stages 1-3 NH / UC 0 0 4,950 2021
Queens Wharf MU / UC 0 0 52,360 2022
Source: Savills Research, Cordells; UC = Under Construction, DA = Development Approved, EP = Early Planning, LF = Large Format; NH = Neighbourhood; R = Regional; SR = Sub-Regional; CC = City Centre, F = Freestanding, S = Shops, MU = Mixed Use
Q4/2019
savills.com.au/research 25
Savills Research | Quarter Time – National Retail
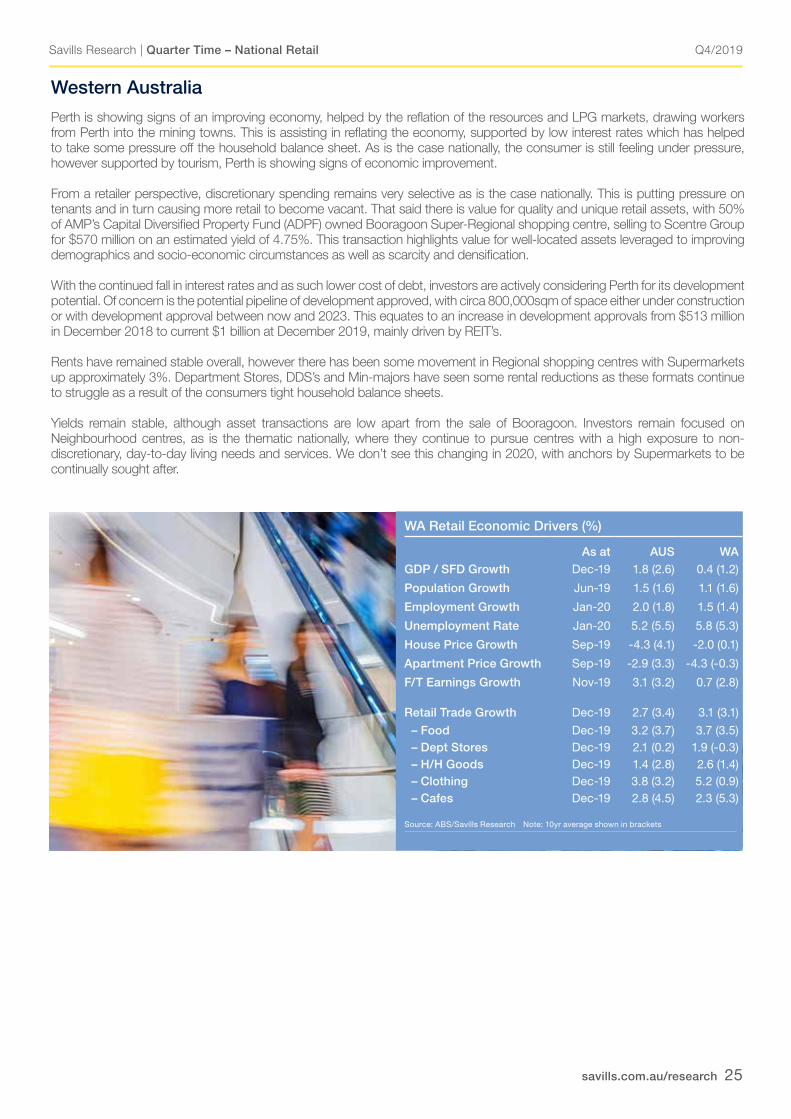
WA Retail Economic Drivers (%)
As at AUS WAGDP / SFD Growth Dec-19 1.8 (2.6) 0.4 (1.2)
Population Growth Jun-19 1.5 (1.6) 1.1 (1.6)
Employment Growth Jan-20 2.0 (1.8) 1.5 (1.4)
Unemployment Rate Jan-20 5.2 (5.5) 5.8 (5.3)
House Price Growth Sep-19 -4.3 (4.1) -2.0 (0.1)
Apartment Price Growth Sep-19 -2.9 (3.3) -4.3 (-0.3)
F/T Earnings Growth Nov-19 3.1 (3.2) 0.7 (2.8)
Retail Trade Growth Dec-19 2.7 (3.4) 3.1 (3.1)
– Food Dec-19 3.2 (3.7) 3.7 (3.5) – Dept Stores Dec-19 2.1 (0.2) 1.9 (-0.3) – H/H Goods Dec-19 1.4 (2.8) 2.6 (1.4) – Clothing Dec-19 3.8 (3.2) 5.2 (0.9) – Cafes Dec-19 2.8 (4.5) 2.3 (5.3)
Source: ABS/Savills Research Note: 10yr average shown in brackets
Western Australia
Perth is showing signs of an improving economy, helped by the reflation of the resources and LPG markets, drawing workers from Perth into the mining towns. This is assisting in reflating the economy, supported by low interest rates which has helped to take some pressure off the household balance sheet. As is the case nationally, the consumer is still feeling under pressure, however supported by tourism, Perth is showing signs of economic improvement.
From a retailer perspective, discretionary spending remains very selective as is the case nationally. This is putting pressure on tenants and in turn causing more retail to become vacant. That said there is value for quality and unique retail assets, with 50% of AMP’s Capital Diversified Property Fund (ADPF) owned Booragoon Super-Regional shopping centre, selling to Scentre Group for $570 million on an estimated yield of 4.75%. This transaction highlights value for well-located assets leveraged to improving demographics and socio-economic circumstances as well as scarcity and densification.
With the continued fall in interest rates and as such lower cost of debt, investors are actively considering Perth for its development potential. Of concern is the potential pipeline of development approved, with circa 800,000sqm of space either under construction or with development approval between now and 2023. This equates to an increase in development approvals from $513 million in December 2018 to current $1 billion at December 2019, mainly driven by REIT’s.
Rents have remained stable overall, however there has been some movement in Regional shopping centres with Supermarkets up approximately 3%. Department Stores, DDS’s and Min-majors have seen some rental reductions as these formats continue to struggle as a result of the consumers tight household balance sheets.
Yields remain stable, although asset transactions are low apart from the sale of Booragoon. Investors remain focused on Neighbourhood centres, as is the thematic nationally, where they continue to pursue centres with a high exposure to non-discretionary, day-to-day living needs and services. We don’t see this changing in 2020, with anchors by Supermarkets to be continually sought after.

Q4/2019
savills.com.au/research 26
Savills Research | Quarter Time – National Retail
Key Highlights
• 2019 was looking to be a low transactions turnover year until Scentre Group acquired 50% of the Super-Regional shopping centre Booragoon from AMP for $570 million on an estimated yield of 4.75%.
• Scentre’s acquisition (including management and development rights) highlights despite retail being challenging at present, good assets will always attract capital. Scentre Group have been able to buy into a population demographic, they otherwise would have been unable (economically) to create organically, highlighting our thesis that retail valuations will remain underpinned by scarcity and densification.
• Excluding Booragoon, Neighbourhood centres, as has been seen nationally, were the dominant asset type, transacting at 63% of all retail investments in WA. Domestic Institutions and Private Investors continue to be the most active players.
• Yields remain stable, encouraged by the Booragoon transaction, albeit a unique transaction. As we have seen nationally, Sub-Regional yields have trended higher as centres exposed to discretionary spending, in particular fashion, have struggled. We have seen average yields for Sub-Regional assets increase from 6.25% in December 2018 to 6.75% as at December 2019.
• WA’s pipeline for additional and new retail development is concerning, with circa 800,000sqm of space either under construction or with development approval by the end of 2023.
• We would expect a number of these projects to be delayed or put on-hold until conditions improve more meaningfully.
• The value of development approvals have increased meaningfully from $513 million in December 2018 to current $1 billion at December 2019. These have in the main part been driven by REITs that have had access to cheap capital, enabling redevelopment works to be either commenced or in planning.
Source: Savills Research
Source: Savills Research
WA Sales Volumes by Centre Type ($5m+)
WA Sales Volumes by Purchaser Type ($5m+)
WA Average Market Yields
Source: Savills Research
WA Sales Volumes by Centre Type
WA Average Market Yield by Centre Type
WA Sales Volumes by Purchaser Type
WA Development Pipeline by Development Stage ('000sq m)
Source: Cordell, Savills Research
WA Retail Development Approvals ($m)
Source: ABS, Savills Research
WA Sales Volumes by Centre Type
WA Average Market Yield by Centre Type
WA Sales Volumes by Purchaser Type
WA Development Pipeline by Development Stage ('000sq m)
Source: Cordell, Savills Research
WA Retail Development Approvals ($m)
Source: ABS, Savills Research
WA Sales Volumes by Centre Type
WA Average Market Yield by Centre Type
WA Sales Volumes by Purchaser Type
WA Development Pipeline by Development Stage ('000sq m)
Source: Cordell, Savills Research
WA Retail Development Approvals ($m)
Source: ABS, Savills Research
Source: Cordells, Savills Research
WA Development Pipeline by Stage ('000sq m)
Source: ABS
WA Retail Development Approvals ($m)
WA Sales Volumes by Centre Type
WA Average Market Yield by Centre Type
WA Sales Volumes by Purchaser Type
WA Development Pipeline by Development Stage ('000sq m)
Source: Cordell, Savills Research
WA Retail Development Approvals ($m)
Source: ABS, Savills Research
WA Sales Volumes by Centre Type
WA Average Market Yield by Centre Type
WA Sales Volumes by Purchaser Type
WA Development Pipeline by Development Stage ('000sq m)
Source: Cordell, Savills Research
WA Retail Development Approvals ($m)
Source: ABS, Savills Research
Q4/2019
savills.com.au/research 27
Savills Research | Quarter Time – National Retail
Key Highlights
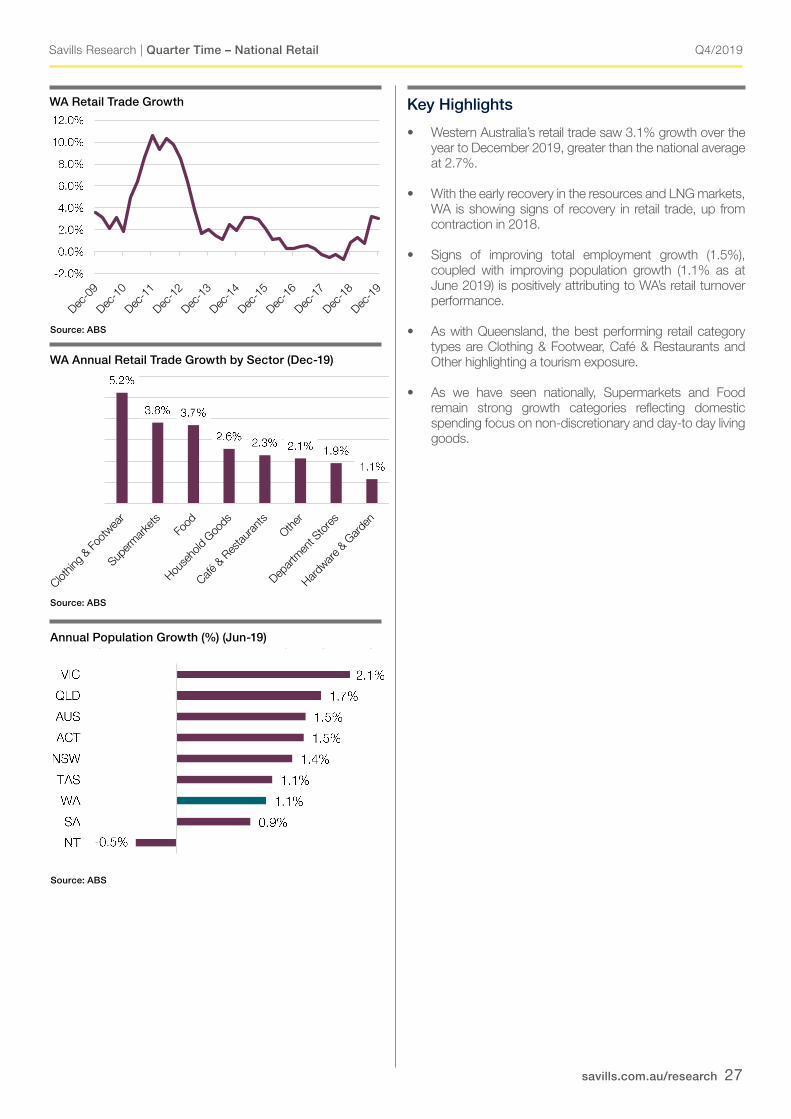
• Western Australia’s retail trade saw 3.1% growth over the year to December 2019, greater than the national average at 2.7%.
• With the early recovery in the resources and LNG markets, WA is showing signs of recovery in retail trade, up from contraction in 2018.
• Signs of improving total employment growth (1.5%), coupled with improving population growth (1.1% as at June 2019) is positively attributing to WA’s retail turnover performance.
• As with Queensland, the best performing retail category types are Clothing & Footwear, Café & Restaurants and Other highlighting a tourism exposure.
• As we have seen nationally, Supermarkets and Food remain strong growth categories reflecting domestic spending focus on non-discretionary and day-to day living goods.
Source: ABS
WA Retail Trade Growth
WA Annual Retail Trade Growth by Sector (Dec-19)
WA Retail Trade Growth (Dec-19)
Source: ABS, Savills Research WA Retail Trade Annual Growth by Sector (Dec-19)
Source: ABS, Savills Research Total Population - 12 month % change to (Jun-19)
Source: ABS
Annual Population Growth (%) (Jun-19)
WA Retail Trade Growth (Dec-19)
Source: ABS, Savills Research WA Retail Trade Annual Growth by Sector (Dec-19)
Source: ABS, Savills Research Total Population - 12 month % change to (Jun-19)
WA Retail Trade Growth (Dec-19)
Source: ABS, Savills Research WA Retail Trade Annual Growth by Sector (Dec-19)
Source: ABS, Savills Research Total Population - 12 month % change to (Jun-19)
Source: ABS
Q4/2019
savills.com.au/research 28
Savills Research | Quarter Time – National Retail
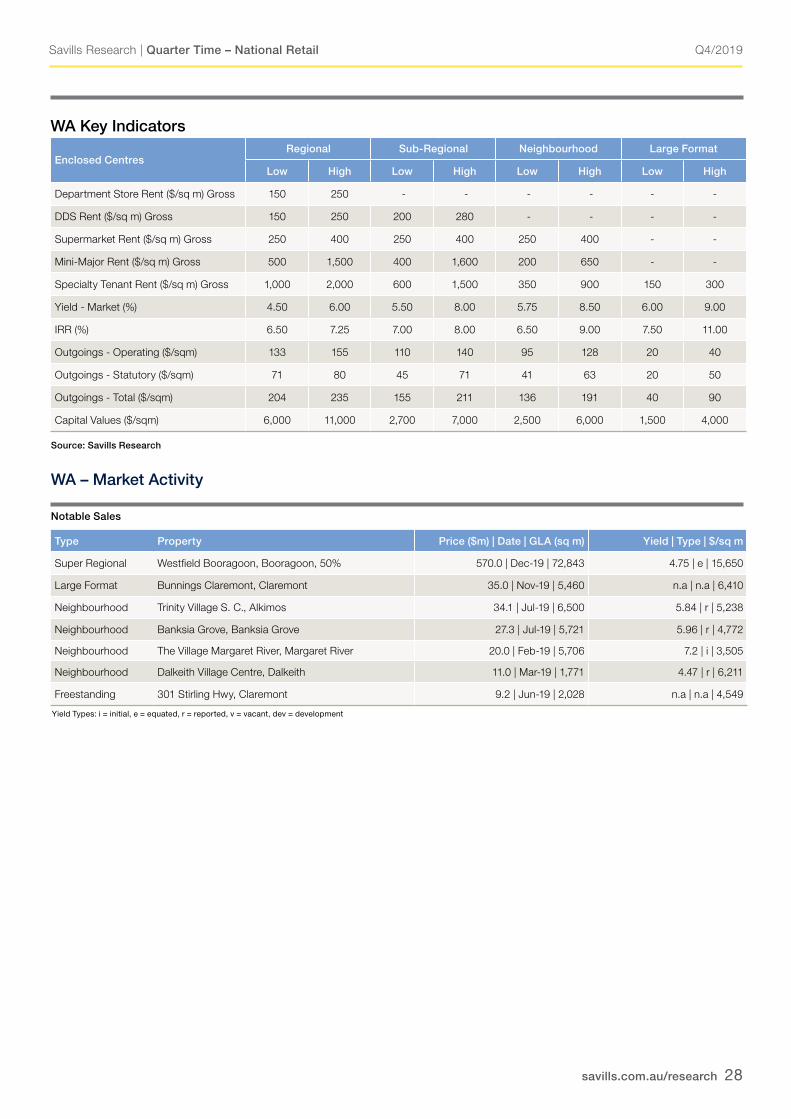
WA Key Indicators
Enclosed CentresRegional Sub-Regional Neighbourhood Large Format
Low High Low High Low High Low High
Department Store Rent ($/sq m) Gross 150 250 - - - - - -
DDS Rent ($/sq m) Gross 150 250 200 280 - - - -
Supermarket Rent ($/sq m) Gross 250 400 250 400 250 400 - -
Mini-Major Rent ($/sq m) Gross 500 1,500 400 1,600 200 650 - -
Specialty Tenant Rent ($/sq m) Gross 1,000 2,000 600 1,500 350 900 150 300
Yield - Market (%) 4.50 6.00 5.50 8.00 5.75 8.50 6.00 9.00
IRR (%) 6.50 7.25 7.00 8.00 6.50 9.00 7.50 11.00
Outgoings - Operating ($/sqm) 133 155 110 140 95 128 20 40
Outgoings - Statutory ($/sqm) 71 80 45 71 41 63 20 50
Outgoings - Total ($/sqm) 204 235 155 211 136 191 40 90
Capital Values ($/sqm) 6,000 11,000 2,700 7,000 2,500 6,000 1,500 4,000
Source: Savills Research
Type Property Price ($m) | Date | GLA (sq m) Yield | Type | $/sq m
Super Regional Westfield Booragoon, Booragoon, 50% 570.0 | Dec-19 | 72,843 4.75 | e | 15,650
Large Format Bunnings Claremont, Claremont 35.0 | Nov-19 | 5,460 n.a | n.a | 6,410
Neighbourhood Trinity Village S. C., Alkimos 34.1 | Jul-19 | 6,500 5.84 | r | 5,238
Neighbourhood Banksia Grove, Banksia Grove 27.3 | Jul-19 | 5,721 5.96 | r | 4,772
Neighbourhood The Village Margaret River, Margaret River 20.0 | Feb-19 | 5,706 7.2 | i | 3,505
Neighbourhood Dalkeith Village Centre, Dalkeith 11.0 | Mar-19 | 1,771 4.47 | r | 6,211
Freestanding 301 Stirling Hwy, Claremont 9.2 | Jun-19 | 2,028 n.a | n.a | 4,549
WA – Market Activity Notable Sales
Yield Types: i = initial, e = equated, r = reported, v = vacant, dev = development

Q4/2019
savills.com.au/research 29
Savills Research | Quarter Time – National Retail
Major Construction Projects
CentreCentre Type/
Dev’t StageRefurb./
Redev.Addition New
EstimatedCompletion
Woolworths Mt Pleasant NH / Complete 0 0 4,969 2019
Midland Gate S.C. R / Complete 0 18,000 0 2019
The Shops at Ellenbrook (Stage 2) SR / Complete 0 2,775 0 2019
FOMO Kings Square MU / UC 5,500 0 0 2020
Bunbury Centrepoint S.C. SR / DA 16,813 2,424 0 2020
Ellenbrook Central SR / UC 0 11,000 0 2020
Karrinyup S.C. R / UC 0 48,000 120,000 2020
1 Butler Blvd LF / DA 12,340 0 0 2020
Costco Perth LF / UC 0 0 14,000 2020
Busselton Central S.C. SR / DA 11,162 0 0 2021
Garden City R / DA 0 42,780 0 2021
Westfield Stirling (Innaloo) R / DA 51,258 47,568 0 2021
Whitfords City (Stage 2) R / DA 0 100,000 0 2021
Woolworths Midvale NH / DA 0 0 6,220 2021
Kalgoorlie Shopping Centr NH / DA 0 0 11,500 2021
High Street Mall S / UC 4,727 0 0 2022
Pinjarra Rd Commercial Development SR / DA 0 0 1,358 2022
Woolworths Inglewood SR / PS 3,266 0 4,726 2022
Bunbury Forum S.C. R / DA 28,866 8,300 0 2023
Morley Galleria R / DA 73,365 106,050 0 2023
The Promenade Mixed Use Development MU / PS 0 0 0 2023
Byford Neighbourhood Centre NH / PS 3,805 0 230,700 2024
Source: Savills Research, Cordells; UC = Under Construction, DA = Development Approved, EP = Early Planning, LF = Large Format; NH = Neighbourhood; R = Regional; SR = Sub-Regional; CC = City Centre, F = Freestanding, S = Shops, MU = Mixed Use
Q4/2019
savills.com.au/research 30
Savills Research | Quarter Time – National Retail
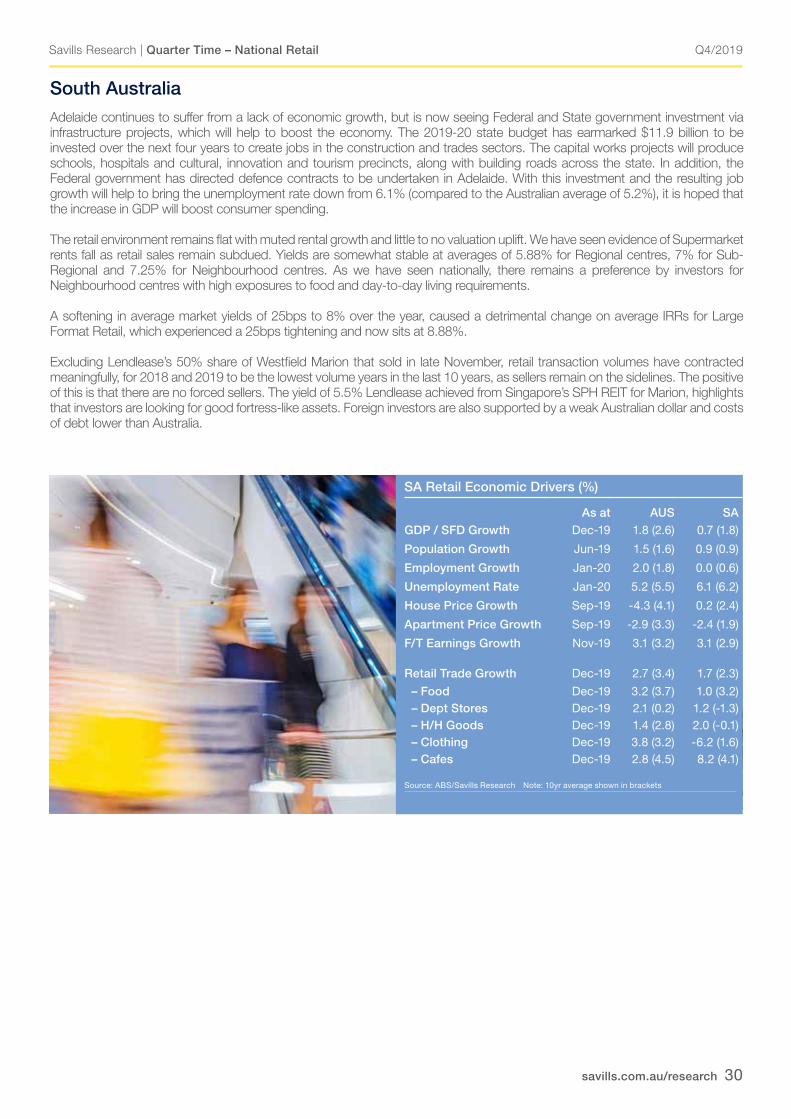
SA Retail Economic Drivers (%)
As at AUS SAGDP / SFD Growth Dec-19 1.8 (2.6) 0.7 (1.8)
Population Growth Jun-19 1.5 (1.6) 0.9 (0.9)
Employment Growth Jan-20 2.0 (1.8) 0.0 (0.6)
Unemployment Rate Jan-20 5.2 (5.5) 6.1 (6.2)
House Price Growth Sep-19 -4.3 (4.1) 0.2 (2.4)
Apartment Price Growth Sep-19 -2.9 (3.3) -2.4 (1.9)
F/T Earnings Growth Nov-19 3.1 (3.2) 3.1 (2.9)
Retail Trade Growth Dec-19 2.7 (3.4) 1.7 (2.3)
– Food Dec-19 3.2 (3.7) 1.0 (3.2) – Dept Stores Dec-19 2.1 (0.2) 1.2 (-1.3) – H/H Goods Dec-19 1.4 (2.8) 2.0 (-0.1) – Clothing Dec-19 3.8 (3.2) -6.2 (1.6) – Cafes Dec-19 2.8 (4.5) 8.2 (4.1)
Source: ABS/Savills Research Note: 10yr average shown in brackets
South AustraliaAdelaide continues to suffer from a lack of economic growth, but is now seeing Federal and State government investment via infrastructure projects, which will help to boost the economy. The 2019-20 state budget has earmarked $11.9 billion to be invested over the next four years to create jobs in the construction and trades sectors. The capital works projects will produce schools, hospitals and cultural, innovation and tourism precincts, along with building roads across the state. In addition, the Federal government has directed defence contracts to be undertaken in Adelaide. With this investment and the resulting job growth will help to bring the unemployment rate down from 6.1% (compared to the Australian average of 5.2%), it is hoped that the increase in GDP will boost consumer spending.
The retail environment remains flat with muted rental growth and little to no valuation uplift. We have seen evidence of Supermarket rents fall as retail sales remain subdued. Yields are somewhat stable at averages of 5.88% for Regional centres, 7% for Sub-Regional and 7.25% for Neighbourhood centres. As we have seen nationally, there remains a preference by investors for Neighbourhood centres with high exposures to food and day-to-day living requirements.
A softening in average market yields of 25bps to 8% over the year, caused a detrimental change on average IRRs for Large Format Retail, which experienced a 25bps tightening and now sits at 8.88%.
Excluding Lendlease’s 50% share of Westfield Marion that sold in late November, retail transaction volumes have contracted meaningfully, for 2018 and 2019 to be the lowest volume years in the last 10 years, as sellers remain on the sidelines. The positive of this is that there are no forced sellers. The yield of 5.5% Lendlease achieved from Singapore’s SPH REIT for Marion, highlights that investors are looking for good fortress-like assets. Foreign investors are also supported by a weak Australian dollar and costs of debt lower than Australia.

Q4/2019
savills.com.au/research 31
Savills Research | Quarter Time – National Retail
Key Highlights• Transactional activity in Adelaide’s retail market was muted
in 2019, except for the sale of Lendlease’s 50% stake in Westfield Marion in late November for $670 million, 5.5% yield, to Singapore’s SPH REIT.
• Yields supported the rest of the country with Regional assets supported by scarcity and densification, while Neighbourhood’s, Large Format’s and Sub-Regional assets were stable.
• There had been a surge in development approvals in 2H19 as a result of Kaufland’s then expansionary strategy. News in late January that Kaufland will exit Australia has resulted in the cancelation of all their development projects.
• The future development pipeline will now be somewhat questionable as to whether they commence, as Coles and Woolworths had been forced into upgrades of sites in response to Kaufland’s entry into the Adelaide market.
• Savills Research expect developers to remain cautious and disciplined until conditions recover.
Source: Savills Research
Source: Savills Research
SA Sales Volumes by Centre Type ($5m+)
SA Sales Volumes by Purchaser Type ($5m+)
SA Market Yields
Source: Savills Research
SA Sales Volumes by Centre Type
SA Retail Development Approvals
Source: ABS, Savills Research
SA Market Yield by Centre Type
SA Sales Volumes by Purchaser Type
SA Development Pipeline by Development Stage ('000sq m)
Cordell, Savills Research
SA Sales Volumes by Centre Type
SA Retail Development Approvals
Source: ABS, Savills Research
SA Market Yield by Centre Type
SA Sales Volumes by Purchaser Type
SA Development Pipeline by Development Stage ('000sq m)
Cordell, Savills Research
SA Sales Volumes by Centre Type
SA Retail Development Approvals
Source: ABS, Savills Research
SA Market Yield by Centre Type
SA Sales Volumes by Purchaser Type
SA Development Pipeline by Development Stage ('000sq m)
Cordell, Savills Research
Source: Cordells, Savills Research Source: ABS
SA Development Pipeline by Stage ('000sq m) SA Retail Development Approvals ($m)
SA Sales Volumes by Centre Type
SA Retail Development Approvals
Source: ABS, Savills Research
SA Market Yield by Centre Type
SA Sales Volumes by Purchaser Type
SA Development Pipeline by Development Stage ('000sq m)
Cordell, Savills Research
SA Sales Volumes by Centre Type
SA Retail Development Approvals
Source: ABS, Savills Research
SA Market Yield by Centre Type
SA Sales Volumes by Purchaser Type
SA Development Pipeline by Development Stage ('000sq m)
Cordell, Savills Research
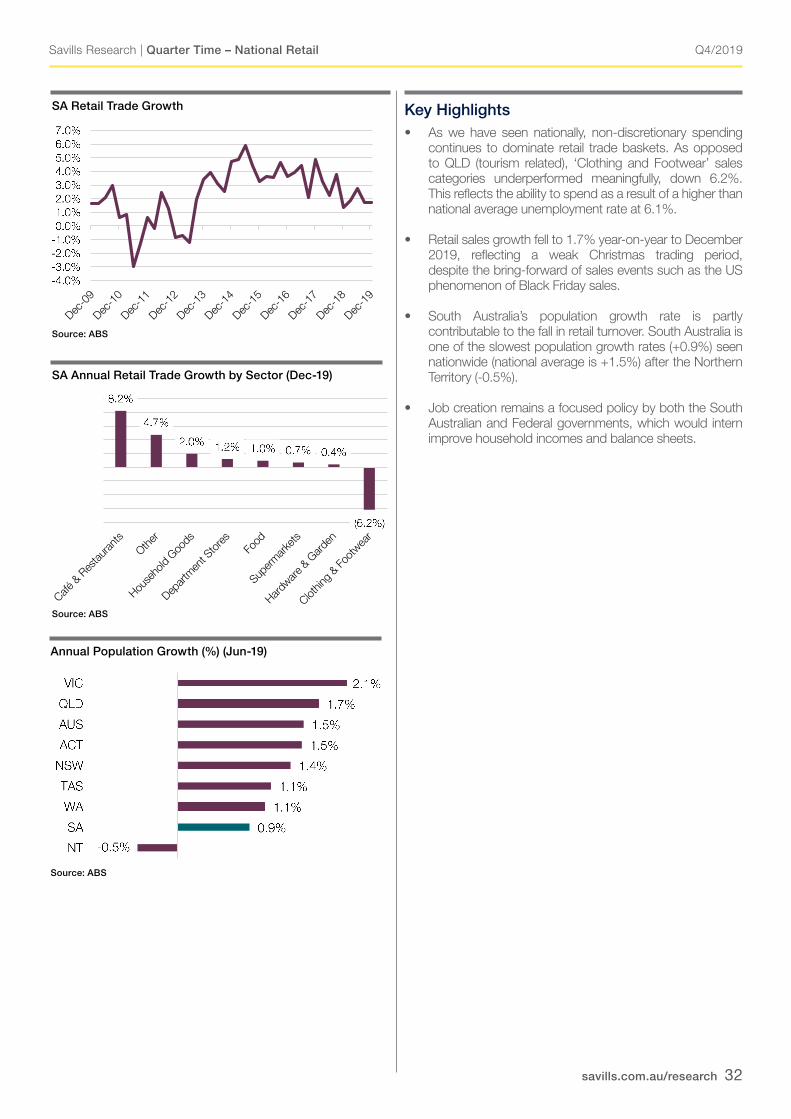
Q4/2019
savills.com.au/research 32
Savills Research | Quarter Time – National Retail
Key Highlights• As we have seen nationally, non-discretionary spending
continues to dominate retail trade baskets. As opposed to QLD (tourism related), ‘Clothing and Footwear’ sales categories underperformed meaningfully, down 6.2%. This reflects the ability to spend as a result of a higher than national average unemployment rate at 6.1%.
• Retail sales growth fell to 1.7% year-on-year to December 2019, reflecting a weak Christmas trading period, despite the bring-forward of sales events such as the US phenomenon of Black Friday sales.
• South Australia’s population growth rate is partly contributable to the fall in retail turnover. South Australia is one of the slowest population growth rates (+0.9%) seen nationwide (national average is +1.5%) after the Northern Territory (-0.5%).
• Job creation remains a focused policy by both the South Australian and Federal governments, which would intern improve household incomes and balance sheets.
SA Retail Trade Growth
Source: ABS
SA Retail Trade Growth (Dec-19)
Source: ABS, Savills Research SA Retail Trade Annual Growth by Sector (Dec-19)
Source: ABS Total Population - 12 month % change to (Jun-19)
SA Annual Retail Trade Growth by Sector (Dec-19)
Source: ABS
SA Retail Trade Growth (Dec-19)
Source: ABS, Savills Research SA Retail Trade Annual Growth by Sector (Dec-19)
Source: ABS Total Population - 12 month % change to (Jun-19)
Annual Population Growth (%) (Jun-19)
Source: ABS
SA Retail Trade Growth (Dec-19)
Source: ABS, Savills Research SA Retail Trade Annual Growth by Sector (Dec-19)
Source: ABS Total Population - 12 month % change to (Jun-19)
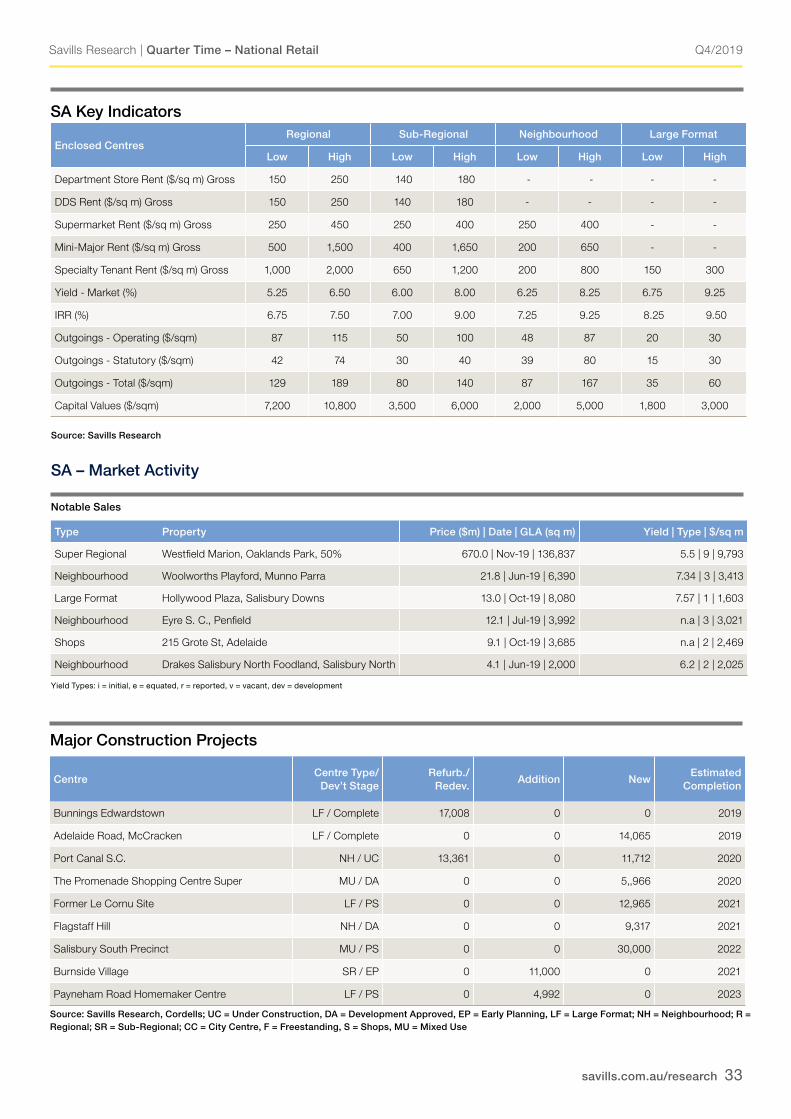
Q4/2019
savills.com.au/research 33
Savills Research | Quarter Time – National Retail
SA Key Indicators
Enclosed CentresRegional Sub-Regional Neighbourhood Large Format
Low High Low High Low High Low High
Department Store Rent ($/sq m) Gross 150 250 140 180 - - - -
DDS Rent ($/sq m) Gross 150 250 140 180 - - - -
Supermarket Rent ($/sq m) Gross 250 450 250 400 250 400 - -
Mini-Major Rent ($/sq m) Gross 500 1,500 400 1,650 200 650 - -
Specialty Tenant Rent ($/sq m) Gross 1,000 2,000 650 1,200 200 800 150 300
Yield - Market (%) 5.25 6.50 6.00 8.00 6.25 8.25 6.75 9.25
IRR (%) 6.75 7.50 7.00 9.00 7.25 9.25 8.25 9.50
Outgoings - Operating ($/sqm) 87 115 50 100 48 87 20 30
Outgoings - Statutory ($/sqm) 42 74 30 40 39 80 15 30
Outgoings - Total ($/sqm) 129 189 80 140 87 167 35 60
Capital Values ($/sqm) 7,200 10,800 3,500 6,000 2,000 5,000 1,800 3,000
Source: Savills Research
Type Property Price ($m) | Date | GLA (sq m) Yield | Type | $/sq m
Super Regional Westfield Marion, Oaklands Park, 50% 670.0 | Nov-19 | 136,837 5.5 | 9 | 9,793
Neighbourhood Woolworths Playford, Munno Parra 21.8 | Jun-19 | 6,390 7.34 | 3 | 3,413
Large Format Hollywood Plaza, Salisbury Downs 13.0 | Oct-19 | 8,080 7.57 | 1 | 1,603
Neighbourhood Eyre S. C., Penfield 12.1 | Jul-19 | 3,992 n.a | 3 | 3,021
Shops 215 Grote St, Adelaide 9.1 | Oct-19 | 3,685 n.a | 2 | 2,469
Neighbourhood Drakes Salisbury North Foodland, Salisbury North 4.1 | Jun-19 | 2,000 6.2 | 2 | 2,025
SA – Market Activity Notable Sales
Yield Types: i = initial, e = equated, r = reported, v = vacant, dev = development
Major Construction Projects
CentreCentre Type/
Dev’t StageRefurb./
Redev.Addition New
EstimatedCompletion
Bunnings Edwardstown LF / Complete 17,008 0 0 2019
Adelaide Road, McCracken LF / Complete 0 0 14,065 2019
Port Canal S.C. NH / UC 13,361 0 11,712 2020
The Promenade Shopping Centre Super MU / DA 0 0 5,,966 2020
Former Le Cornu Site LF / PS 0 0 12,965 2021
Flagstaff Hill NH / DA 0 0 9,317 2021
Salisbury South Precinct MU / PS 0 0 30,000 2022
Burnside Village SR / EP 0 11,000 0 2021
Payneham Road Homemaker Centre LF / PS 0 4,992 0 2023
Source: Savills Research, Cordells; UC = Under Construction, DA = Development Approved, EP = Early Planning, LF = Large Format; NH = Neighbourhood; R = Regional; SR = Sub-Regional; CC = City Centre, F = Freestanding, S = Shops, MU = Mixed Use

Q4/2019
savills.com.au/research 34
Savills Research | Quarter Time – National Retail
Savills Research & Consultancy
• Asia Markets
• Capital Advisory
• Capital Transactions
• City Sales & Investments
• Cross Border Investments
• Facilities Management
• Hotels Investments
• Industrial Leasing
• Industrial Sales
• Insolvency & Turnaround Services
• Metropolitan & Regional Sales
• Occupier Services Office Leasing
• Project Management
• Property Accounting
• Property Management
• Residential Projects
• Residential Rentals & Property Management
• Residential Sales
• Residential Site Sales
• Retail Investments
• Retail Leasing
• Student Accommodation Investment
• Tenant Representation
• Valuation & Advisory
• Industrial & Logistics
• Office
• Residential
• Retail
• Hotels
• Student Accomodation
Founded in 1855, Savills is one of the world's leading property agencies. Savills operates from over 600 owned and associate offices, employing more than 39,000 people in over 70 countries. We'll always have an expert who is local to you, with the right knowledge to help.
Our scale gives us wide-ranging specialist and local knowledge, and we take pride in providing best-in-class advice as we help individuals, businesses and institutions make better property decisions.
Our Services Our Sectors
Head of ResearchResearch & Consultancy
Phil [email protected]
AnalystResearch & Consultancy
Monique [email protected]
AnalystResearch & Consultancy
Matthew Di [email protected]
GraduateResearch & Consultancy
Boyd [email protected]
Q4/2019
savills.com.au/research 35
Savills Research | Quarter Time – National Retail
Savills is a leading global property service provider listed on the London Stock Exchange. Trusted since 1855, we have extensive experience across the Asia Pacific, with over 50 offices, and in Australia, we have over 800 staff focused on meeting all your property needs.
Disclaimer
This communciation has been prepared by Savills (Aust) Pty Ltd’s Research Team (“Savills”) for general information only and is not intended to be relied upon in any way.
Information, projections and images
Information contained in this communication has been obtained from materials and sources believed to be reliable at the date of publication, however Savills has not taken steps to verify or certify its accuracy or completeness. Opinions, projections and forecasts in this communication depend on the accuracy of any information and assumptions on which they are based, and on prevailing market conditions, for which Savills does not accept responsibility. No representations or warranties of any nature are given, intended or implied by Savills about this communication, any information, opinions and forecasts contained within this communication or the accuracy or enforceability of any material referred to in this communication.
Savills (including its employees, officers and agents) any of the employees of Savills referenced in the communication will not be liable, including in negligence, for any direct, indirect, special, incidental or consequential losses or damages arising out of or in any way connected with use of or reliance on anything in this communication. For the avoidance of doubt, Savills (including its employees, officers and agents) will not be liable for any investment decision based in whole or in part on the information or projections contained herein. All images are only for illustrative purposes. Given the above, Savills strongly advises all recipients of this communication to exercise caution and to conduct their own due diligence on the relevance, accuracy, completeness and currency of the information in this communication.
This communication does not form part of or constitute an offer or contract.
GST
Unless otherwise expressly stated, all amounts, prices, values or other sums stated in this document are exclusive of GST.
Confidentiality
This communication is the confidential information of Savills and is strictly for the intended recipient. This communication must not be disclosed to any other party without the prior written consent of Savills.
Copyright
This communication is copyright material owned by Savills. Permission to use any part of this document must be sought directly from Savills.
Top Related