


Languages
Pages
Legal


Q1 2019 Results PresentationMay 2019

Forward-looking statements are based on the beliefs and assumptions of ENAP’s management and on informationcurrently available to the Company. They involve risks, uncertainties and assumptions because they relate tofuture events and therefore depend on circumstances that may or may not occur in the future. Investors shouldunderstand that general economic conditions, industry conditions and other operating factors could also affectthe future results of ENAP and could cause results to differ materially from those expressed in such forward-looking statements.
This presentation contains certain performance measures that do not represent Chilean GAAP and IFRSdefinitions, such as “EBITDA” and “Net financial debt”. These measures cannot be compared with the samepreviously used by ENAP and the same used by other companies.
Disclaimer
3
Q1’19 Highlights
Operational Highlights
Financial Highlights
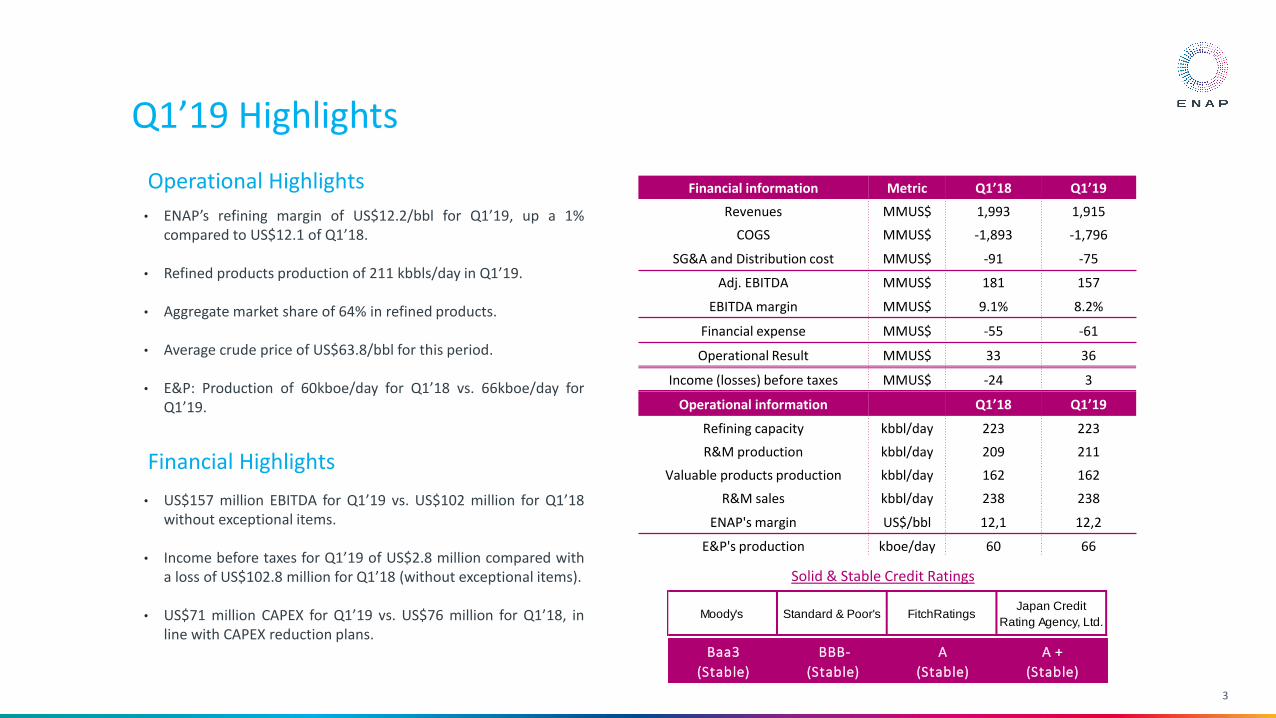
• ENAP’s refining margin of US$12.2/bbl for Q1’19, up a 1%compared to US$12.1 of Q1’18.
• Refined products production of 211 kbbls/day in Q1’19.
• Aggregate market share of 64% in refined products.
• Average crude price of US$63.8/bbl for this period.
• E&P: Production of 60kboe/day for Q1’18 vs. 66kboe/day forQ1’19.
• US$157 million EBITDA for Q1’19 vs. US$102 million for Q1’18without exceptional items.
• Income before taxes for Q1’19 of US$2.8 million compared witha loss of US$102.8 million for Q1’18 (without exceptional items).
• US$71 million CAPEX for Q1’19 vs. US$76 million for Q1’18, inline with CAPEX reduction plans.
Financial information Metric Q1’18 Q1’19
Revenues MMUS$ 1,993 1,915
COGS MMUS$ -1,893 -1,796
SG&A and Distribution cost MMUS$ -91 -75
Adj. EBITDA MMUS$ 181 157
EBITDA margin MMUS$ 9.1% 8.2%
Financial expense MMUS$ -55 -61
Operational Result MMUS$ 33 36
Income (losses) before taxes MMUS$ -24 3
Operational information Q1’18 Q1’19
Refining capacity kbbl/day 223 223
R&M production kbbl/day 209 211
Valuable products production kbbl/day 162 162
R&M sales kbbl/day 238 238
ENAP's margin US$/bbl 12,1 12,2
E&P's production kboe/day 60 66
Baa3
(Stable)
BBB-
(Stable)
A
(Stable)
A +
(Stable)
Solid & Stable Credit Ratings
Moody's Standard & Poor's FitchRatingsJapan Credit
Rating Agency, Ltd.

Revenues & Adj. EBITDA
Revenues Adj. EBITDA(US$ million) (US$ million)
4
1,993 1,915
Q1'18 Q1'19
180.7157.3
Q1'18 Q1'19
Revenues Adj. EBITDA(1)
• Revenues decreased in US$78 million mainly due to a lower ICE Brentprice for this quarter compared to Q1’18, US$63.8/bbl vs. US$67.2/bbl.
(i) -US$112.8 million in lower own production sales despite stableproduction (ENAP’s product prices Q1’19 US$74.7/bbl vs. Q1’18US$81.5/bbl).
(ii) +US$50.6 million due to higher volume sold of importedproducts.
• EBITDA of US$157.3 million for Q1’19 decreased US$23.4 millioncompared to Q1’18 level of US$180.7 million.
• Without exceptional items such as the reversal of spare parts forUS$51 million and US$29 million due to Mehr block, Q1’18 EBITDA isreduced to US$102 million (Q1’19 varies positively in US$56 million).
• Reduction in Personnel costs, Administrative expenses and Distributioncost translated into US$29 million in savings for Q1’19 vs. Q1’18.
(1) Adjusted EBITDA is defined as the sum of: (i) gross margin, (ii) other income, per function, (iii) depreciation and depletion quota, (iv) abandonment of exploratory wells, (v) geological studies and non absorbed costs, (vi) deterioration and other non operational provisions and (vii) exploration costs, less (i) distribution costs, (ii) administrative expenses and (iii) other expenses, per function.
• US$12.2 million in lower E&P sales,mainly due to Pampa del Castillosale effect (revenues of US$24.9million during Q1’18). Without theaforementioned effect, revenues inE&P would have increased inUS$12.7 million.
• Revenues from E&P Ecuadorincreased US$9.3 million comparedto Q1’18 due to higher productionin MDC.
• EBITDA of US$58 million for R&Mthis quarter, down a 23% comparedto Q1’18.
• E&P’s EBITDA for Q1’19 reachedUS$98 million, down US$3 millionvs. Q1’18.
• G&E’s EBITDA of $1 millioncompared to Q1’18 of US$3 million.
Cost of Goods Sold & Other Operational Expenses
5
COGS Other Operational Expenses
COGS Other Operational Expenses(US$ million) (US$ million)
1,893 1,797
Q1'18 Q1'19
99.487.3
Q1'18 Q1'19
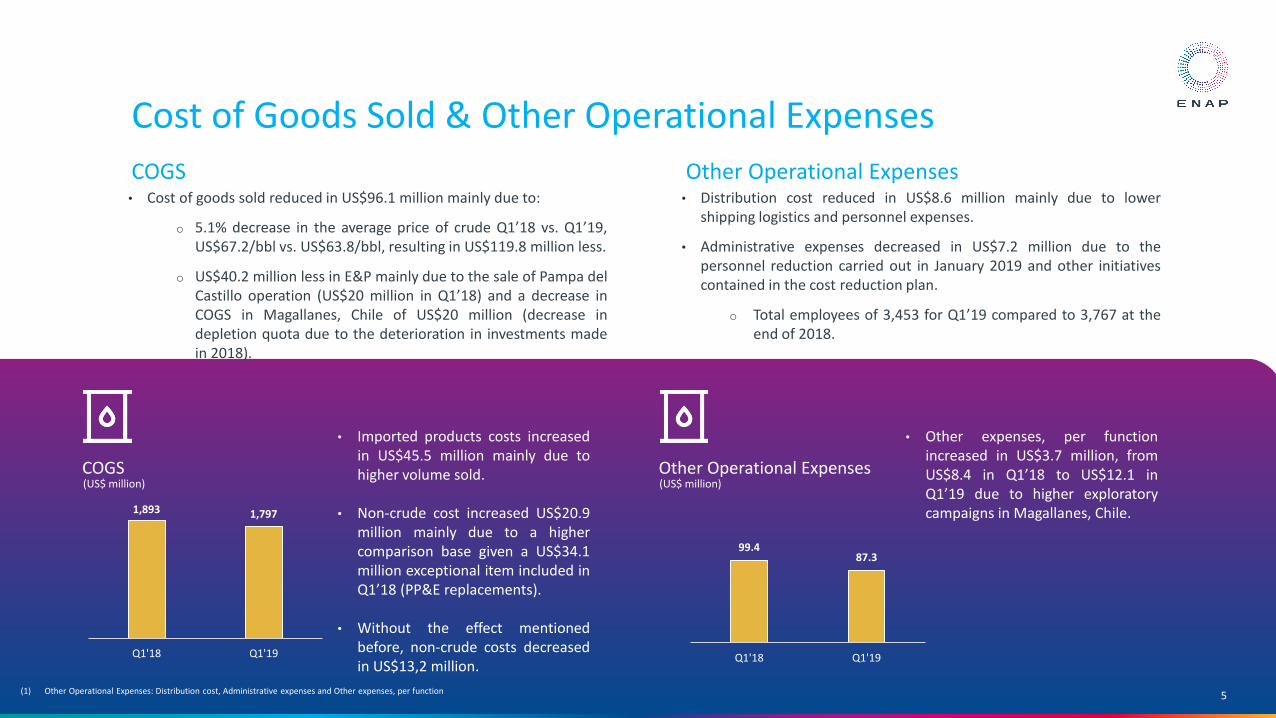
• Imported products costs increasedin US$45.5 million mainly due tohigher volume sold.
• Non-crude cost increased US$20.9million mainly due to a highercomparison base given a US$34.1million exceptional item included inQ1’18 (PP&E replacements).
• Without the effect mentionedbefore, non-crude costs decreasedin US$13,2 million.
• Other expenses, per functionincreased in US$3.7 million, fromUS$8.4 in Q1’18 to US$12.1 inQ1’19 due to higher exploratorycampaigns in Magallanes, Chile.
• Cost of goods sold reduced in US$96.1 million mainly due to:
o 5.1% decrease in the average price of crude Q1’18 vs. Q1’19,US$67.2/bbl vs. US$63.8/bbl, resulting in US$119.8 million less.
o US$40.2 million less in E&P mainly due to the sale of Pampa delCastillo operation (US$20 million in Q1’18) and a decrease inCOGS in Magallanes, Chile of US$20 million (decrease indepletion quota due to the deterioration in investments madein 2018).
• Distribution cost reduced in US$8.6 million mainly due to lowershipping logistics and personnel expenses.
• Administrative expenses decreased in US$7.2 million due to thepersonnel reduction carried out in January 2019 and other initiativescontained in the cost reduction plan.
o Total employees of 3,453 for Q1’19 compared to 3,767 at theend of 2018.
(1) Other Operational Expenses: Distribution cost, Administrative expenses and Other expenses, per function

Refining & Marketing
6
EBITDA Additional information• R&M EBITDA of US$58 million for Q1’19 compared to US$75 million in
Q1’18 (US$24 million without spare parts adjustment).
• Weighted average price of refined products for Q1’19 of US$74.7/bblcompared to US$81.5/bbl for Q1’18.
• Imported products volume sold increased in nearly 19.7%compensated by lower prices.
EBITDA Sales – Q1’19 (US$ million) (kbbl/day)
58
33
16
24
1
1
75
58
Q1'18 Q1'19
Petropower Imported productsOwn production
Crude imports – Q1’19
51%
95%
61%54%
94%
64%
Diesel Gasoline Average
Q1'18 Q1'19
52%
33%
6%9%
Brazil Ecuador USA Others
7365
23
49
7565
17
54
Gasolina Diesel Fuel Oil Others
Q1'18 Q1'19
Production(kbbl/day)
68 61
932
77
93
Gasoline Diesel
Imported Own production
Market share(1) – Q1’19
• 4% higher refined products production for Q1’19 compared to Q1’18.
• During March’19, ENAP reached a new high in gasoline production,with 374,000 cubic meters.
• 80% in valuable products production for Q1’19 vs. 78% for Q1’18.
• Total Crude Oil Purchases: 15 million barrels in Q1’19 from 11 differentsuppliers.
1: As of February 2019

• ENAP’s margin (“Margen Primo”)
• 2015: 21.1 US$/bbl• 2016: 15.5 US$/bbl• 2017: 15.6 US$/bbl• 2018: 12.0 US$/bbl• Q1’18: 12.2 US$/bbl• Q1’19: 12.1 US$/bbl
ENAP’s refining margin(US$ per barrel)
7
7- 331 basket(US$ per barrel)
• Basket 7:3:3:1 vs ICE Brent
• 2015: 9.7 US$/bbl• 2016: 8.0 US$/bbl• 2017: 10.6 US$/bbl• 2018: 8.1 US$/bbl• Q1’18: 8.4 US$/bbl• Q1’19: 7.1 US$/bbl
• Brent
• Q1’18 average: US$67.2• Q1’19 average: US$63.8
Refining & Marketing
7
12
17
22
27
32
0
20
40
60
80
100
120
140
Dec
-13
Mar
-14
Jun
-14
Sep
-14
Dec
-14
Mar
-15
Jun
-15
Sep
-15
Dec
-15
Mar
-16
Jun
-16
Sep
-16
Dec
-16
Mar
-17
Jun
-17
Sep
-17
Dec
-17
Mar
-18
Jun
-18
Sep
-18
Dec
-18
Mar
-19
US$
/bb
l
US$
/bb
l
ENAP's Refining Margin ENAP's Product Prices ENAP's Oil Cost Brent
0
5
10
15
20
25
0
20
40
60
80
100
120
140
160
Dec
-13
Mar
-14
Jun
-14
Sep
-14
Dec
-14
Mar
-15
Jun
-15
Sep
-15
Dec
-15
Mar
-16
Jun
-16
Sep
-16
Dec
-16
Mar
-17
Jun
-17
Sep
-17
Dec
-17
Mar
-18
Jun
-18
Sep
-18
Dec
-18
Mar
-19
US$
/bb
l
US$
/bb
lBasket 7:3:3:1 vs. ICE Brent (US$/bbl) Basket 7:3:3:1 (US$/bbl) ICE Brent (US$/bbl)

Exploration & Production
8
EBITDA
EBITDA CAPEX(US$ million)
Reserves(Th. boe)
18 3016
2126
3641
11
101 98
Q1'18 Q1'19
Chile Argentina Ecuador Egypt
Production – Q1’19(Th. boed)
26
21
7
19 11
21
17
21
7
Chile Argentina Ecuador Egypt
Oil Gas
(US$ million)
58%23%
10%
9%
Chile Argentina
Ecuador Egypt
13 15
238
4
13
13
41 39
Q1'18 Q1'19
Chile Argentina Ecuador Egypt
Total reserves1: 144 MM boe
1: As of December 2018
I. E&P’s EBITDA decreased from US$101 million during first quarter2018 to US$98 million in same period 2019.
II. EBITDA from Magallanes (Chile) increased US$12 million, mainly dueto an increase in prices and volumes.
III. Argentina’s contribution to E&P’s EBITDA increased US$5 millionmainly due to higher production in Area Magallanes, partially offsetby a decrease in sale prices.
IV. In Ecuador, EBITDA increased US$10 million due to higher production,and in Egypt, EBITDA’s contribution related to production did notchange significantly.
V. During Q1’18, there was a positive impact in EBTIDA related to areimbursement from NIOC due to exploration activities carried out(by a consortium integrated by Sipetrol International S.A., Repsol S.A.and OMV) between 2001 and 2007. Finally in 2009, consortiumdecided not to continue operations in Iran.

CAPEX analysis
9
2014-2018 CAPEX CAPEX Q1’18 – Q1’19
5-year historical CAPEX Q1’18 – Q1’19 CAPEX(US$ million, EOY) (US$ million)
400
635
754705
524
2014 2015 2016 2017 2018
7671
Q1'18 Q1'19
• New administration and BoDrevised the plan and consideredseveral CAPEX reductions.
• 2018’s CAPEX of US$524(1) million isa result of that revision: nearlyUS$150 million werecancelled/postponed due to highleverage.
• 2018’s Capex by business unit:US$303 million for E&P; US$195million for R&M; US$16 million forG&E.
• E&P investments reached US$39million for Q1’19, focused in Arenaland Dorado Riquelme blocks inChile, and MDC and PBHI in Ecuador.
• US$32 million in R&M for thisquarter focused in programmedshutdowns, initiatives andpreventive maintenance in ourrefineries.
• G&E investments of US$1 millionfor Q1’19, focused in AconcaguaCogeneration facility.
• Average CAPEX of US$604 million for this 5-year period.
• New projects includes PIAM Project, Cogeneradora Aconcagua andE&P investment in Magallanes (Chile).
• An average of US$100 million per year in maintenance for ourrefineries.
• Main increase in CAPEX due to the 2015-2025 strategic plan.
• 6.6% reduction in CAPEX for Q1’19 compared to Q1’18, with US$71million vs. US$76 million.
• Q1’18’s Capex by business unit: US$41 million for E&P; US$30 millionfor R&M; US$3 million for G&E.
• Q1’18 investments focused on E&P investment in Magallanes (Chile),Wet Gas Scrubber in Bío Bío Refinery and Cogeneradora Aconcagua.
1: Includes US$10 million assigned in a corporate level

10
Debt Statistics & Maturity Profile
Financial Debt & Supplier’s Credit Key Financial Ratios
Debt Maturity Profile – March 2019(US$ million)
(US$ million)
5.9 x5.0 x
5.8 x6.7 x
8.0 x 8.4 x
6.7 x
5.3 x 4.9 x5.3 x 4.1 x 4.1 x
3.6 x 4.0 x 3.8 x 3.3 x2.2 x 2.2 x
Dec-14 Dec-15 Dec-16 Dec-17 Dec-18 Mar-19Total net debt / EBITDA (LTM) Total net debt / Equity EBITDA / Interest expense
3,832 3,802 4,007 4,519 4,727 4,329
287 0 91 235 255120
4,119 3,802 4,0994,753 4,982
4,449
Dec-14 Dec-15 Dec-16 Dec-17 Dec-18 Mar-19
Supplier's Credit Total Financial Debt
50 69 55 5100
380
264163
115
174
410600
700227
227 227
600
545
243
465
5
100
600
700
491
227 227163
600
2019 2020 2021 2022 2023 2024 2025 2026 2027 2028 2029 … 2033 … 2047
International Bonds Local Bonds ST Bank Debt LT Bank Debt


Geography
12
Downstream Upstream• Leading position in refining capacity, with 230kbbl/day.
• Extensive oil & gas wholesale distribution network in Chile.
• Unmatched asset base of critical importance to Chile includingcountry’s only 3 refining facilities.
• ENAP reached a 211 kbbl/day production during Q1’19 of refinedproducts, including gasoline, diesel, kerosene, LPG, among others.
• Field expertise and relationships with E&P partners and crude oilsuppliers worldwide.
• Fields in Chile, Argentina, Ecuador and Egypt.
• E&P’s goal: to maintain oil and gas reserves in Chile and abroad.
• E&P’s production: 35 kbbl/day and 30 kboe/day of crude and gasrespectively.
Concón:-Aconcagua
Refinery-Aconcagua
Cogeneration Power plant
Santiago:-ENAP
Headquarters
Santiago:-ENAP Sipetrol
S.A. (HQ)
Maipú:-Fuel Storage Terminal
San Fernando:-TerminalLinares:
-Terminal Chillán:-Pumping Station
Hualpén:-Bío Bío
Refinery
Punta Arenas:-Gregorio
Refinery-Wind farm project
Cabo Negro
1
2
3
Ecuador
• PBH (100%)• MDC (100%)•PBHI (100%)•Block 28 (42%)
Chile
• Magallanes Chile (100%)
Argentina
• Área Magallanes (50%)
• CAM 2/A Sur (50%)
• E2 (33%) *
• Camp. Central (50%) *
• Octans Pegaso (100%)
• El Turbio Este (100%)
Egypt
• East RasQattara (50.5%)
(%) Ownership * Blocks where ENAP is not an operator

ENAP and the owner
13
Corporate Governance Support• A new Corporate Governance Law: gives ENAP more stability in long-term
plans, following best practices of private sector.
• Reduction in number of Board Members from eight to seven.
• Shareholders: Finance and Energy Ministers.
• Five-year Business Plan 2019-2023 under review. The yearly budget andlong term debt issuance are also subject to their approval.
• Capital injections: US$250 MM capital increase in 2008 and US$400 MMcapital increase in 2018.
• Capitalization of Retained Earnings (Subsidiaries) approved on a yearly-basis. The Republic has waived its right to receive any dividends for thepast nine years.
• Gas sales subsidy in Magallanes (Chile): Approved on a yearly basis as partof the Chilean General Budget Law. Up to CLP $58,521 million (~US$90million) approved for 2019.
Board
• Seven Members:
o Appointed directly by the President of the Republic
María Loreto Silva Rojas (Chairman) and FernandoMassú Taré
o Elected from proposals from the High Public ManagementSystem (ADP)
Ana Holuigue Barros, Rodrigo Azócar Hidalgo, José LuisMardones Santander and Claudio Skármeta Magri
o Elected by the company's employees
Marcos Varas Alvarado
• Board Members will have four-year terms and will be eligible forreelection only once
• Members will be changed partially, not all at the same time
14
Financial Statements
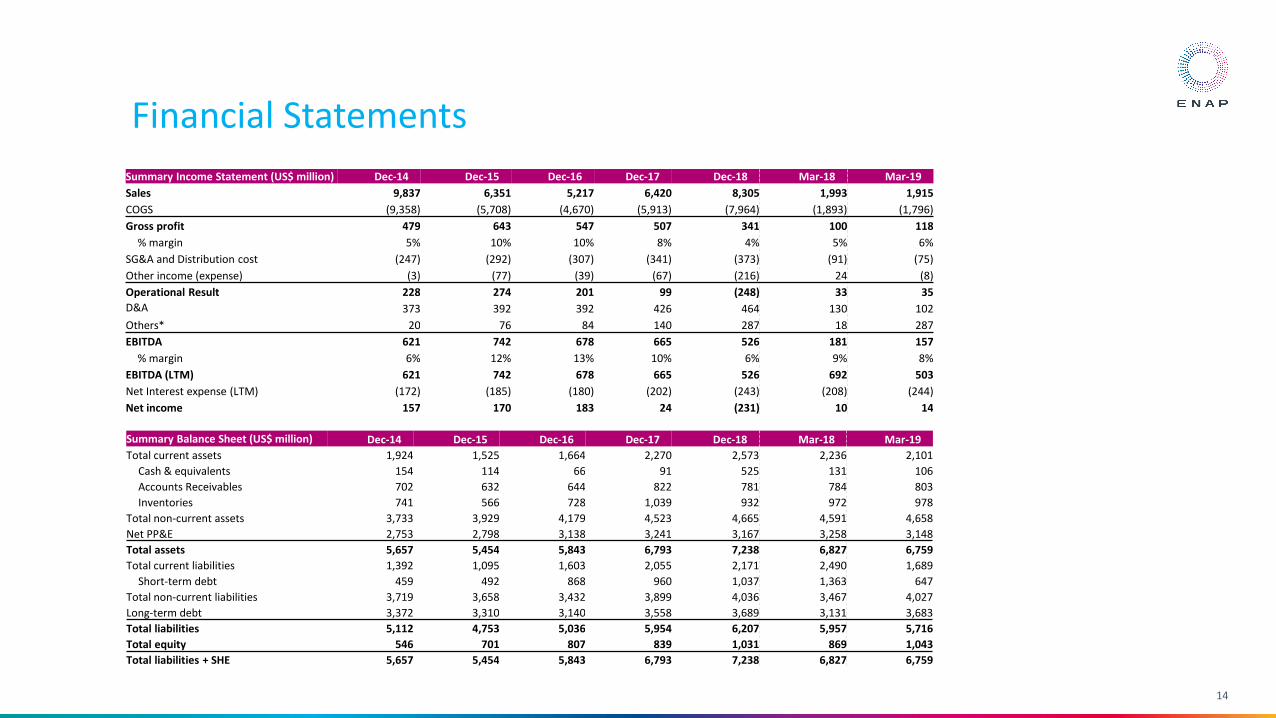
Summary Income Statement (US$ million) Dec-14 Dec-15 Dec-16 Dec-17 Dec-18 Mar-18 Mar-19
Sales 9,837 6,351 5,217 6,420 8,305 1,993 1,915
COGS (9,358) (5,708) (4,670) (5,913) (7,964) (1,893) (1,796)
Gross profit 479 643 547 507 341 100 118
% margin 5% 10% 10% 8% 4% 5% 6%
SG&A and Distribution cost (247) (292) (307) (341) (373) (91) (75)
Other income (expense) (3) (77) (39) (67) (216) 24 (8)
Operational Result 228 274 201 99 (248) 33 35
D&A 373 392 392 426 464 130 102
Others* 20 76 84 140 287 18 287
EBITDA 621 742 678 665 526 181 157
% margin 6% 12% 13% 10% 6% 9% 8%
EBITDA (LTM) 621 742 678 665 526 692 503
Net Interest expense (LTM) (172) (185) (180) (202) (243) (208) (244)
Net income 157 170 183 24 (231) 10 14
Summary Balance Sheet (US$ million) Dec-14 Dec-15 Dec-16 Dec-17 Dec-18 Mar-18 Mar-19
Total current assets 1,924 1,525 1,664 2,270 2,573 2,236 2,101
Cash & equivalents 154 114 66 91 525 131 106
Accounts Receivables 702 632 644 822 781 784 803
Inventories 741 566 728 1,039 932 972 978
Total non-current assets 3,733 3,929 4,179 4,523 4,665 4,591 4,658
Net PP&E 2,753 2,798 3,138 3,241 3,167 3,258 3,148
Total assets 5,657 5,454 5,843 6,793 7,238 6,827 6,759
Total current liabilities 1,392 1,095 1,603 2,055 2,171 2,490 1,689
Short-term debt 459 492 868 960 1,037 1,363 647
Total non-current liabilities 3,719 3,658 3,432 3,899 4,036 3,467 4,027
Long-term debt 3,372 3,310 3,140 3,558 3,689 3,131 3,683
Total liabilities 5,112 4,753 5,036 5,954 6,207 5,957 5,716
Total equity 546 701 807 839 1,031 869 1,043
Total liabilities + SHE 5,657 5,454 5,843 6,793 7,238 6,827 6,759

Top Related