


Languages
Pages
Legal

7/28/2019 Pyhsical Inactivity
http://slidepdf.com/reader/full/pyhsical-inactivity 1/12
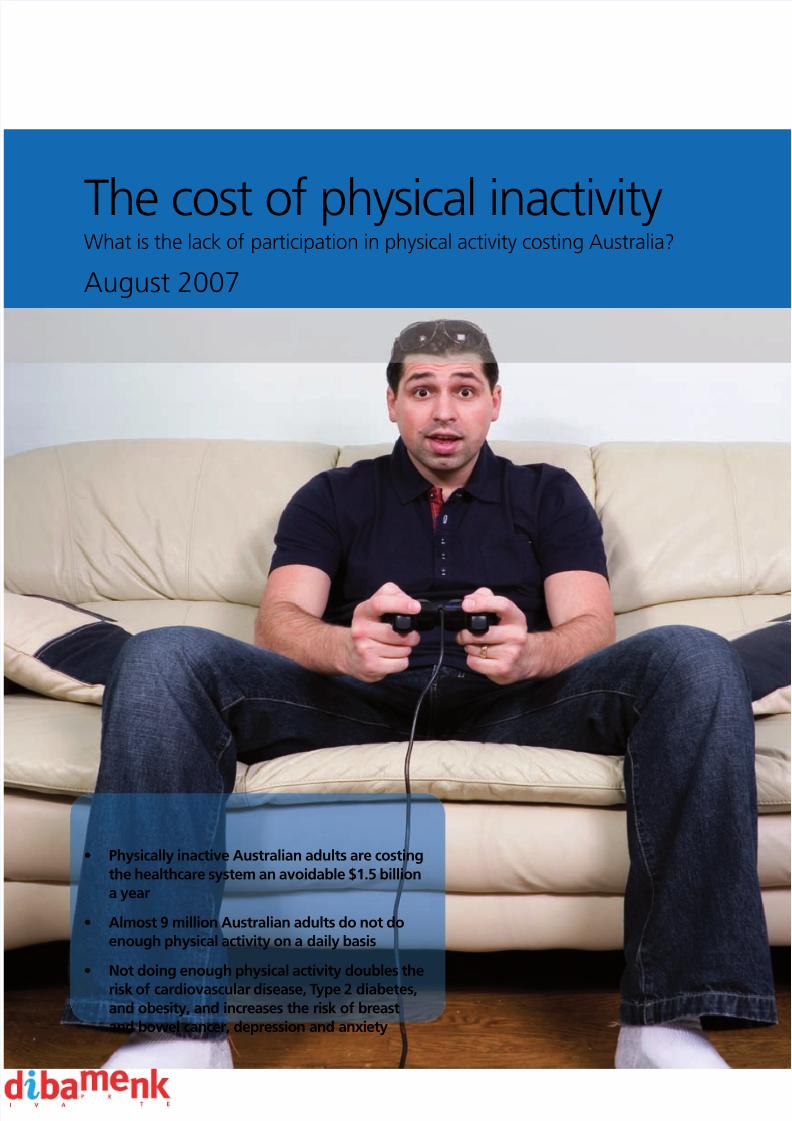
The cost o physical inactivity What is the lack o participation in physical activity costing Australia?
August 2007
• Physically inactive Australian adults are costingthe healthcare system an avoidable $1.5 billiona year
• Almost 9 million Australian adults do not doenough physical activity on a daily basis
• Not doing enough physical activity doubles the
risk of cardiovascular disease, Type 2 diabetes,and obesity, and increases the risk of breastand bowel cancer, depression and anxiety
7/28/2019 Pyhsical Inactivity
http://slidepdf.com/reader/full/pyhsical-inactivity 2/12
4 What is physical inactivity costing Australia?
6 How much activity is enough?
8 The health impacts o physical inactivity
10 Other costs o physical inactivity
11 Need help getting active?
Contents
2
7/28/2019 Pyhsical Inactivity
http://slidepdf.com/reader/full/pyhsical-inactivity 3/12
Australia is a sport loving nation
Many o us live and breathe to support our avourite
sporting team, we thrive on sporting rivalries betweenclub, state, and country. As a nation we pride ourselves
on our passion or sport being second to none around
the world.
However, new research conrms our sports obsession
is not refected in our sports participation and the
lack o participation in physical activity in Australia is
costing many people their health, in some cases
their lie, and costing the economy signicantly.
3
7/28/2019 Pyhsical Inactivity
http://slidepdf.com/reader/full/pyhsical-inactivity 4/12
4
What is physical inactivity costing Australia?
For the rst time, Medibank Private has put a
dollar gure on the cost o physical inactivity
to the Australian healthcare system.
Research commissioned by Medibank Private,
conducted by Econtech (an independent
economic consultancy), has calculated the
gross and net direct health costs o physical
inactivity o seven medical conditions:
• Coronaryheart • Breastcancer
disease(CHD) • Coloncancer
• Stroke • Depression
• Type2diabetes • Falls
The research estimated the direct costs,
attributable to physical inactivity, or the seven
medical conditions, based on medical evidence
showing a strong relationship between physical
inactivity and the increased risk o mortality
and/or incidence o these conditions.
The research revealed 17% o the total health
cost o treating these seven conditions can
be attributed to physical inactivity amongst
Australian adults2 – equating to $1.5 billion
in direct healthcare costs.
1 The National Physical Activity guidelines (NPA guidelines) or Australians recommend 30 minutes o
moderate-intensity physical activity a day as the minimum requirement or good health. However, to
be considered ‘physically active’ the NPA Survey states you should participate in at least 150 minutes
o moderate-intensity physical activity over at least fve sessions in a week.
2 Adult Australians defned as 18 – 75.
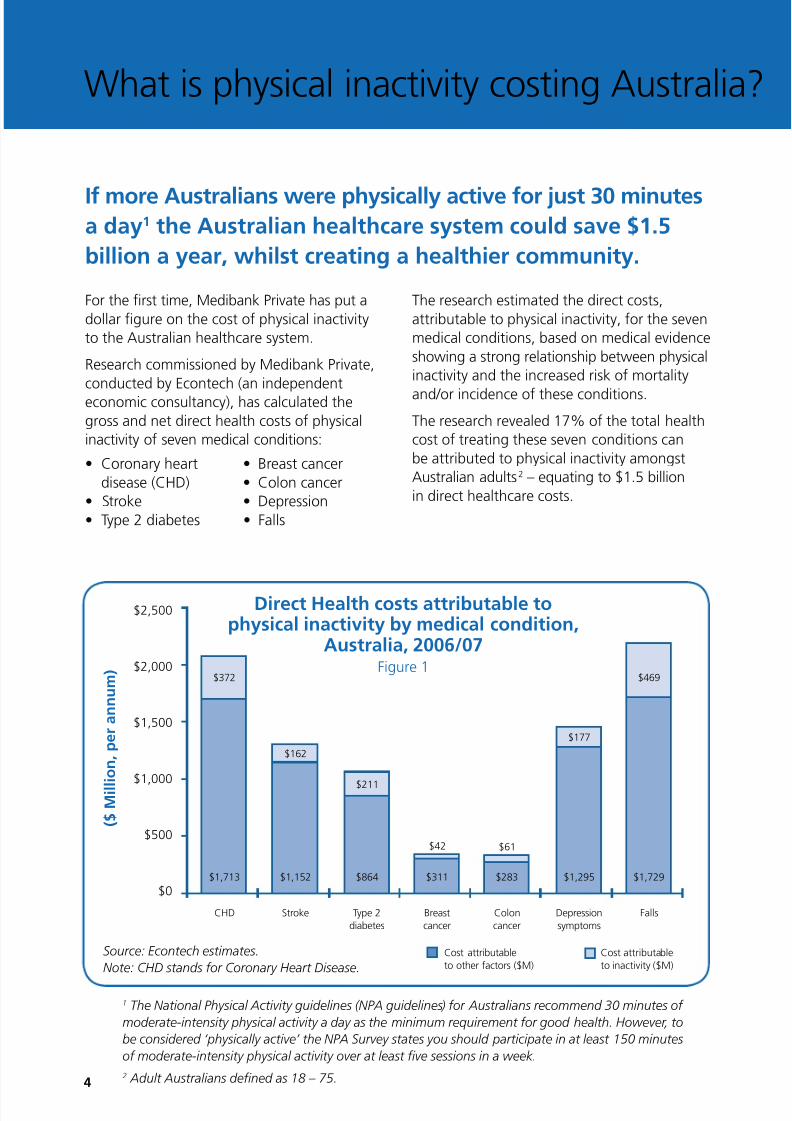
If more Australians were physically active for just 30 minutesa day1 the Australian healthcare system could save $1.5
billion a year, whilst creating a healthier community.
Direct Health costs attributable tophysical inactivity by medical condition,
Australia, 2006/07Figure 1
$2,500
$2,000
$1,500
$1,000
$500
$0
CHD
Cost attributable
to other factors ($M)
Cost attributable
to inactivity ($M)
$372
$162
$211
$42 $61
$177
$469
$1,713 $1,152 $864 $311 $283 $1,295 $1,729
Stroke Type 2
diabetes
Breast
cancer
Colon
cancer
Depression
symptoms
Falls
( $ M i l l
i o n , p e r a n n u m )
Source: Econtech estimates.
Note: CHD stands or Coronary Heart Disease.
7/28/2019 Pyhsical Inactivity
http://slidepdf.com/reader/full/pyhsical-inactivity 5/12
5
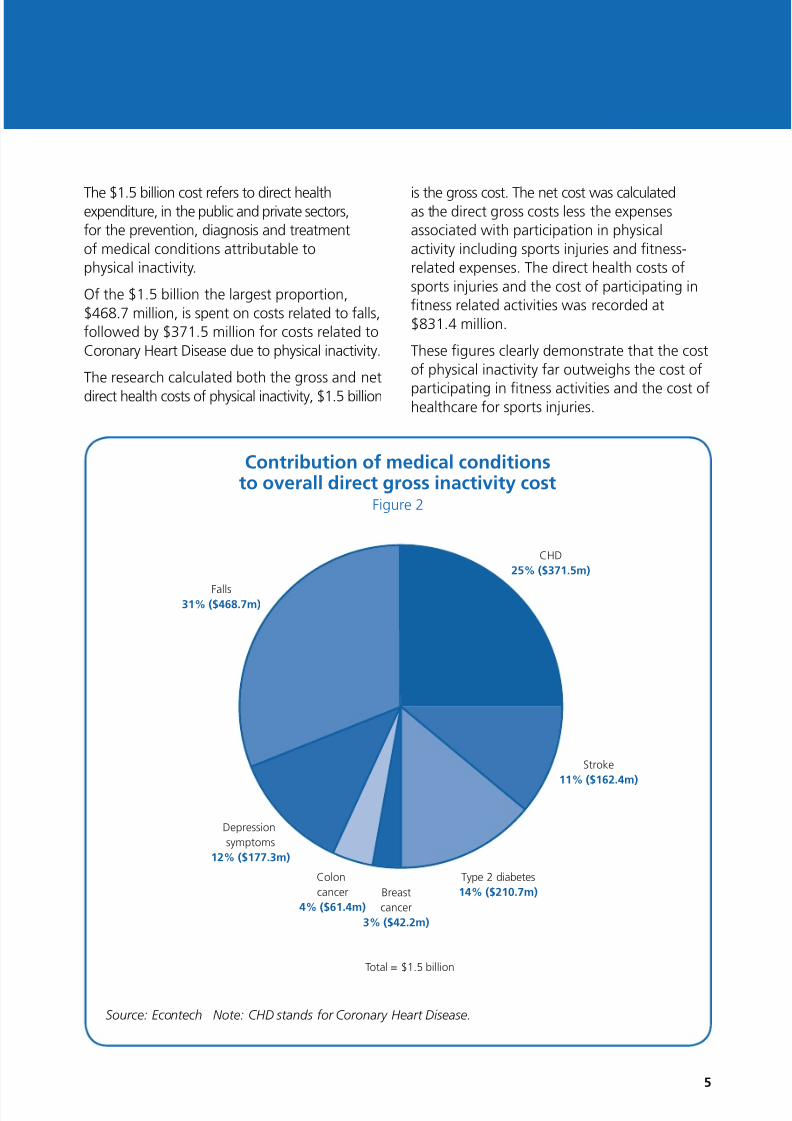
Contribution of medical conditionsto overall direct gross inactivity cost
Figure 2
Source: Econtech Note: CHD stands or Coronary Heart Disease.
The $1.5 billion cost reers to direct healthexpenditure, in the public and private sectors,
or the prevention, diagnosis and treatment
o medical conditions attributable to
physical inactivity.
O the $1.5 billion the largest proportion,
$468.7 million, is spent on costs related to alls,
ollowed by $371.5 million or costs related to
Coronary Heart Disease due to physical inactivity.
The research calculated both the gross and net
direct health costs o physical inactivity, $1.5 billion
is the gross cost. The net cost was calculatedas the direct gross costs less the expenses
associated with participation in physical
activity including sports injuries and tness-
related expenses. The direct health costs o
sports injuries and the cost o participating in
tness related activities was recorded at
$831.4 million.
These gures clearly demonstrate that the cost
o physical inactivity ar outweighs the cost o
participating in tness activities and the cost ohealthcare or sports injuries.
Total = $1.5 billion
Depression
symptoms
12% ($177.3m)
Colon
cancer
4% ($61.4m)
Breast
cancer
3% ($42.2m)
Type 2 diabetes
14% ($210.7m)
Stroke
11% ($162.4m)
CHD
25% ($371.5m)
Falls31% ($468.7m)
7/28/2019 Pyhsical Inactivity
http://slidepdf.com/reader/full/pyhsical-inactivity 6/12
6
How much activity is enough?
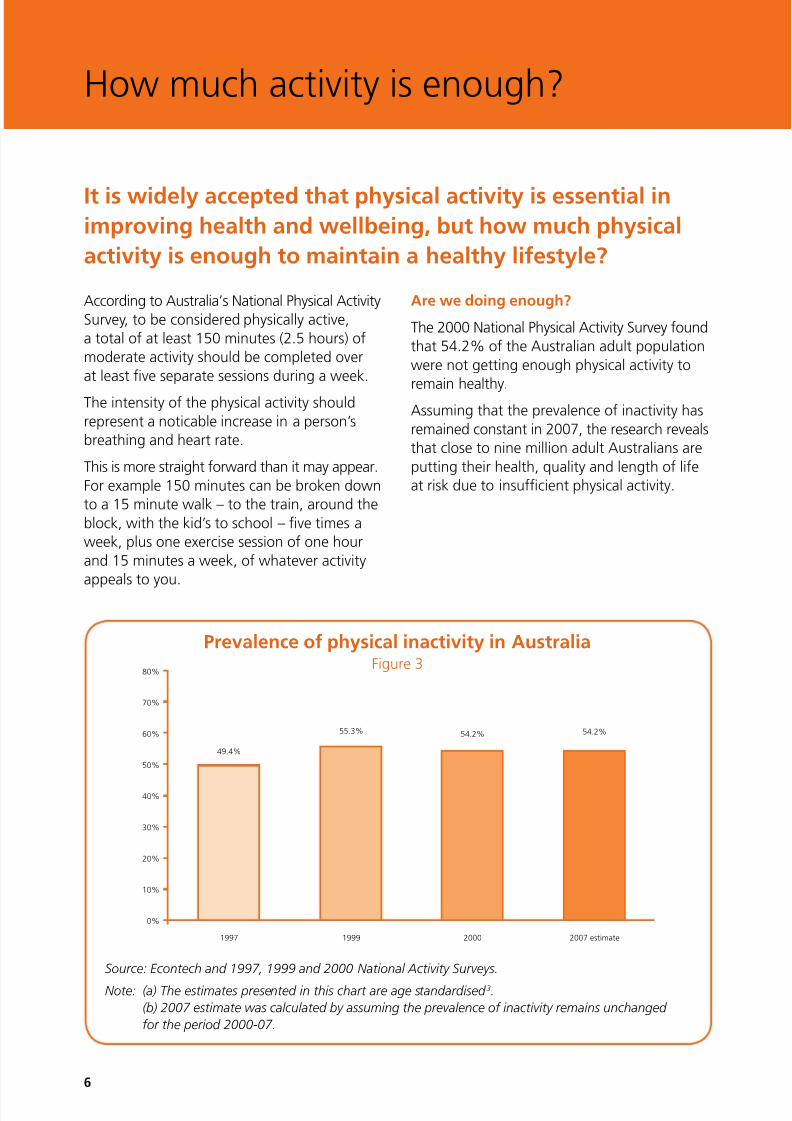
According to Australia’s National Physical Activity
Survey,tobeconsideredphysicallyactive,
a total o at least 150 minutes (2.5 hours) o
moderate activity should be completed over
at least ve separate sessions during a week.
The intensity o the physical activity should
represent a noticable increase in a person’s
breathing and heart rate.
This is more straight orward than it may appear.
For example 150 minutes can be broken down
to a 15 minute walk – to the train, around the
block, with the kid’s to school – ve times a
week, plus one exercise session o one hour
and 15 minutes a week, o whatever activity
appeals to you.
Are we doing enough?
The2000NationalPhysicalActivitySurveyfound
that 54.2% o the Australian adult population
were not getting enough physical activity to
remain healthy.
Assuming that the prevalence o inactivity has
remained constant in 2007, the research reveals
that close to nine million adult Australians are
putting their health, quality and length o lie
at risk due to insucient physical activity.
Prevalence of physical inactivity in AustraliaFigure 3
Source: Econtech and 1997, 1999 and 2000 National Activity Surveys.
Note: (a) The estimates presented in this chart are age standardised 3.
(b) 2007 estimate was calculated by assuming the prevalence o inactivity remains unchanged
or the period 2000-07.
It is widely accepted that physical activity is essential inimproving health and wellbeing, but how much physical
activity is enough to maintain a healthy lifestyle?
80%
70%
60%
50%
40%
30%
20%
10%
0%
1997
49.4%
1999
55.3%
2000
54.2%
2007 estimate
54.2%
7/28/2019 Pyhsical Inactivity
http://slidepdf.com/reader/full/pyhsical-inactivity 7/12
7
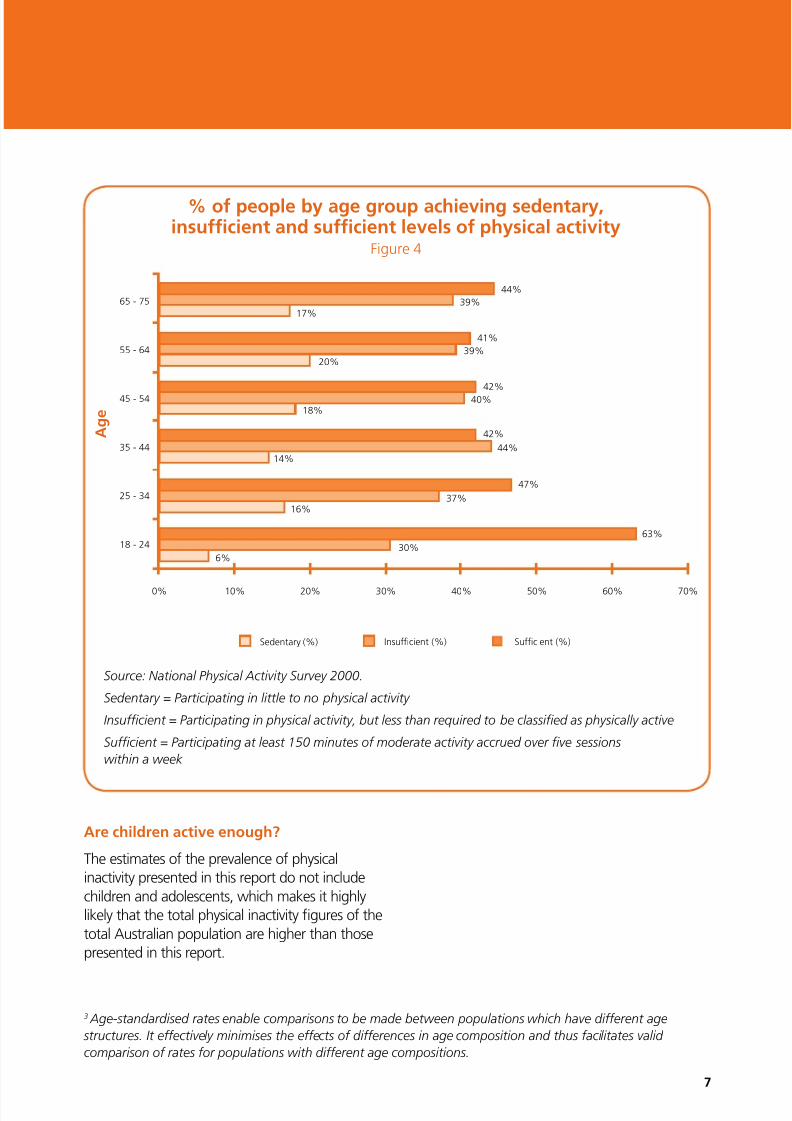
% of people by age group achieving sedentary,insufcient and sufcient levels of physical activity
Figure 4
Source: National Physical Activity Survey 2000.
Sedentary = Participating in little to no physical activity
Insufcient = Participating in physical activity, but less than required to be classifed as physically active
Sufcient = Participating at least 150 minutes o moderate activity accrued over fve sessions
within a week
3 Age-standardised rates enable comparisons to be made between populations which have dierent age
structures. It eectively minimises the eects o dierences in age composition and thus acilitates valid
comparison o rates or populations with dierent age compositions.
Are children active enough?
The estimates o the prevalence o physical
inactivity presented in this report do not include
children and adolescents, which makes it highly
likely that the total physical inactivity gures o the
total Australian population are higher than those
presented in this report.
65 - 75
55 - 64
45 - 54
35 - 44
25 - 34
18 - 24
44%
41%
42%
39%20%
40%18%
39%17%
42%
44%14%
47%
37%16%
63%
30%6%
0% 10% 20% 30% 40% 50% 60% 70%
Sedentary (%) Insufficient (%) Sufficient (%)
A g e
7/28/2019 Pyhsical Inactivity
http://slidepdf.com/reader/full/pyhsical-inactivity 8/12
8
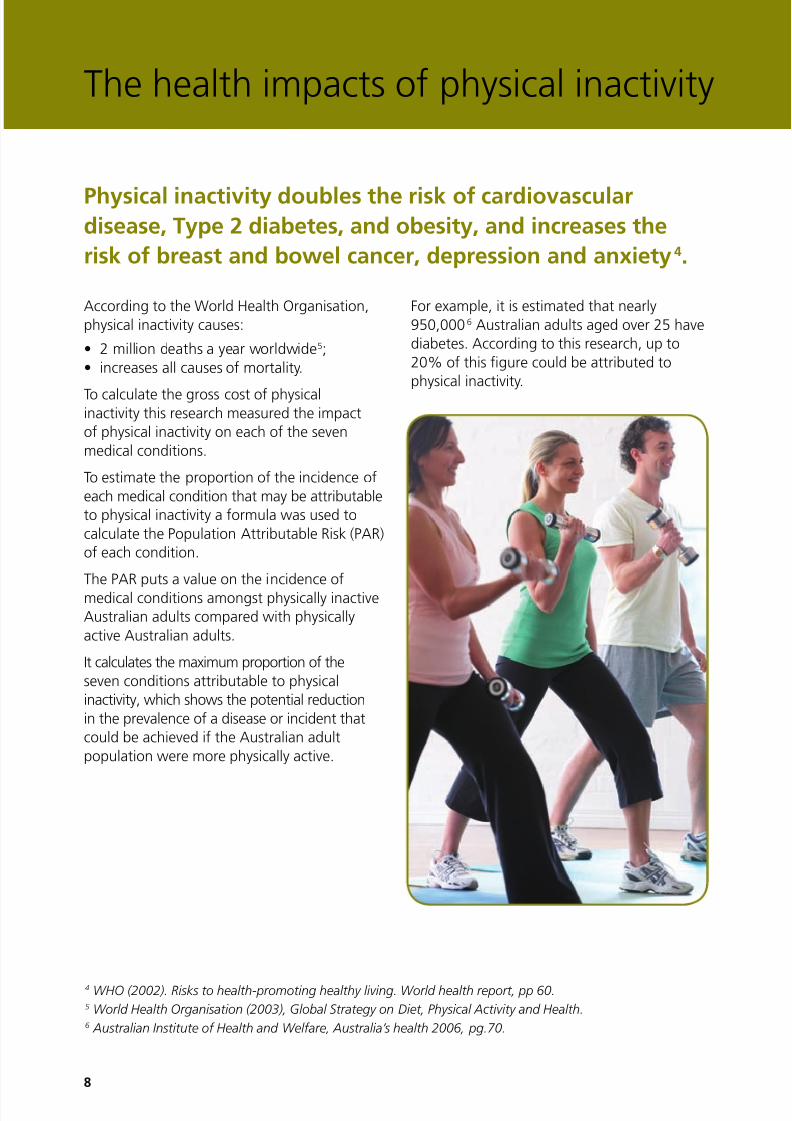
The health impacts o physical inactivity
According to the World Health Organisation,
physical inactivity causes:
• 2milliondeathsayearworldwide5;
• increasesallcausesofmortality.
To calculate the gross cost o physicalinactivity this research measured the impact
o physical inactivity on each o the seven
medical conditions.
To estimate the proportion o the incidence o
each medical condition that may be attributable
to physical inactivity a ormula was used to
calculate the Population Attributable Risk (PAR)
o each condition.
The PAR puts a value on the incidence o
medical conditions amongst physically inactive
Australian adults compared with physically
active Australian adults.
It calculates the maximum proportion o the
seven conditions attributable to physical
inactivity, which shows the potential reduction
in the prevalence o a disease or incident that
could be achieved i the Australian adult
population were more physically active.
For example, it is estimated that nearly
950,000 6 Australian adults aged over 25 have
diabetes. According to this research, up to
20% o this gure could be attributed to
physical inactivity.
Physical inactivity doubles the risk of cardiovasculardisease, Type 2 diabetes, and obesity, and increases the
risk of breast and bowel cancer, depression and anxiety 4.
4 WHO (2002). Risks to health-promoting healthy living. World health report, pp 60.5 World Health Organisation (2003), Global Strategy on Diet, Physical Activity and Health.6 Australian Institute o Health and Welare, Australia’s health 2006, pg.70.
7/28/2019 Pyhsical Inactivity
http://slidepdf.com/reader/full/pyhsical-inactivity 9/12
9
Source: Econtech estimates. Note: CHD stands or Coronary Heart Disease.
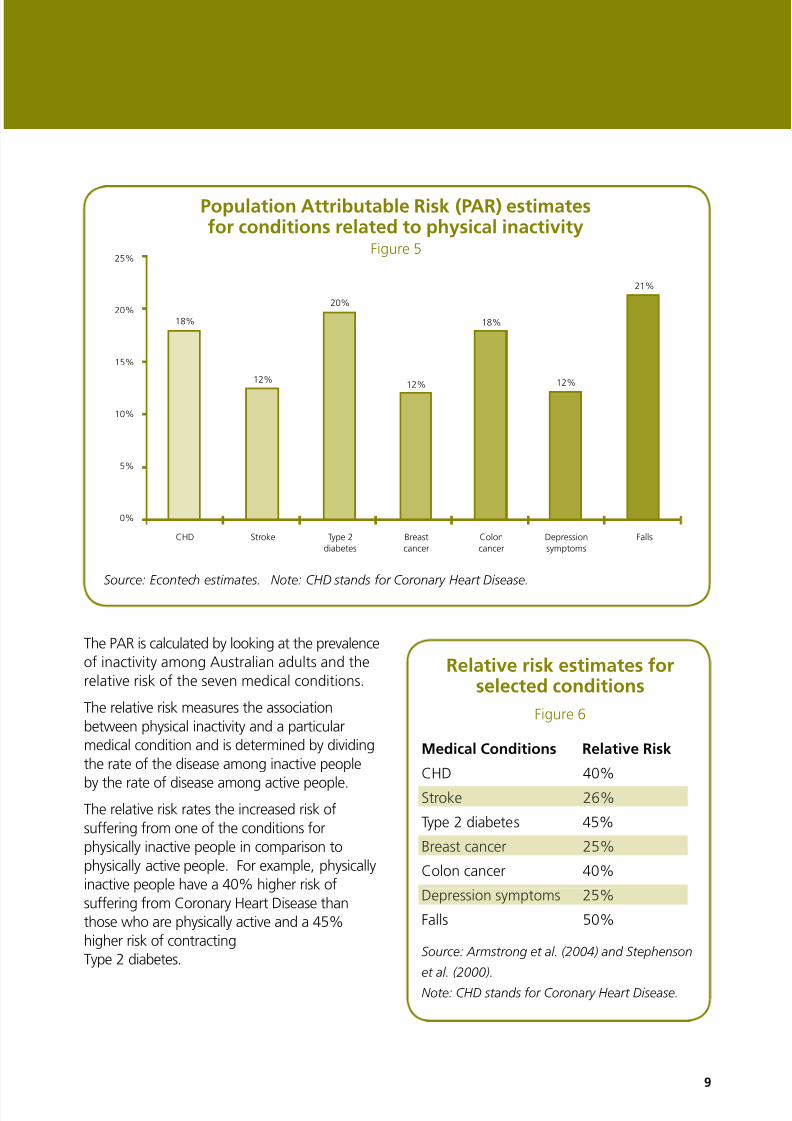
The PAR is calculated by looking at the prevalence
o inactivity among Australian adults and the
relative risk o the seven medical conditions.
The relative risk measures the association
between physical inactivity and a particular
medical condition and is determined by dividing
the rate o the disease among inactive people
by the rate o disease among active people.The relative risk rates the increased risk o
suering rom one o the conditions or
physically inactive people in comparison to
physically active people. For example, physically
inactive people have a 40% higher risk o
suering rom Coronary Heart Disease than
those who are physically active and a 45%
higher risk o contracting
Type 2 diabetes.
Population Attributable Risk (PAR) estimatesfor conditions related to physical inactivity
Figure 5
Relative risk estimates forselected conditions
Figure 6
Medical Conditions Relative Risk
CHD 40%
Stroke 26%
Type 2 diabetes 45%
Breastcancer 25%
Colon cancer 40%
Depression symptoms 25%
Falls 50%
Source: Armstrong et al. (2004) and Stephenson
et al. (2000).
Note: CHD stands or Coronary Heart Disease.
25%
20%
15%
10%
5%
0%
CHD Stroke Type 2
diabetes
Breast
cancer
Colon
cancer
Depression
symptoms
Falls
18%
12%
20%
12%
18%
12%
21%
Stroke 26%
Breastcancer 25%
Depression symptoms 25%
7/28/2019 Pyhsical Inactivity
http://slidepdf.com/reader/full/pyhsical-inactivity 10/12
Other costs o physical inactivity
10
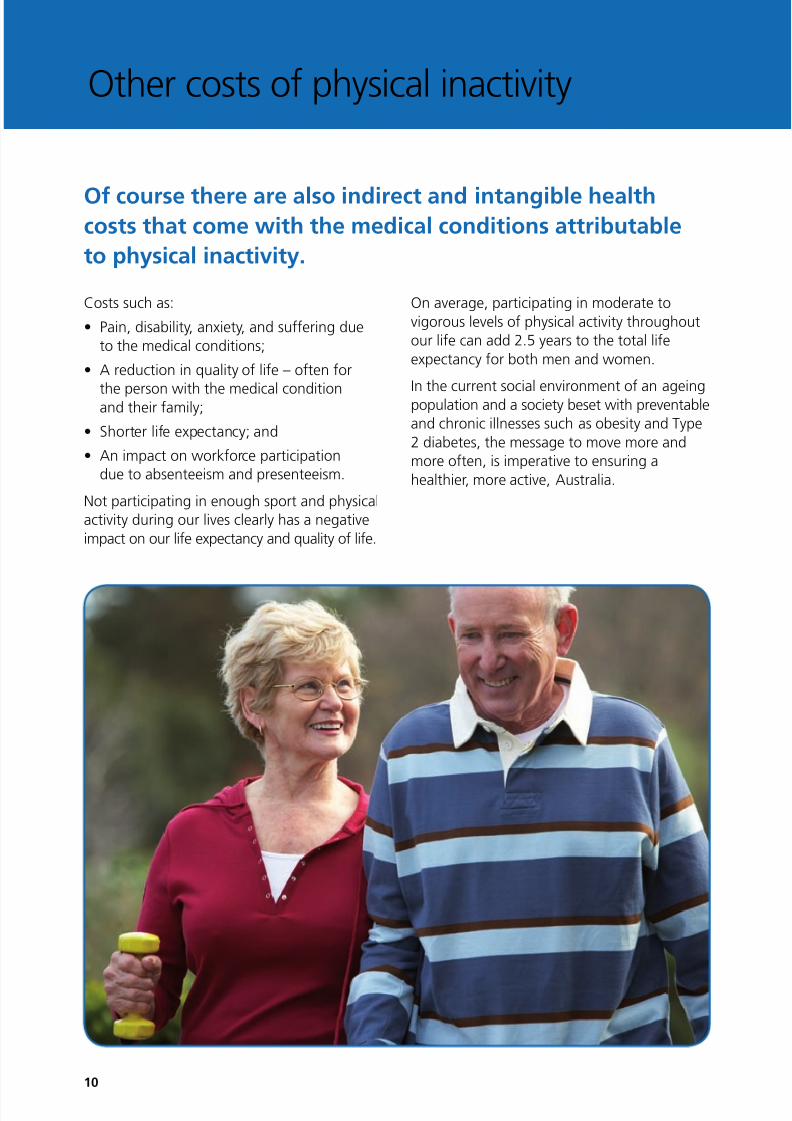
Costs such as:
• Pain,disability,anxiety,andsufferingdue
to the medical conditions;
• Areductioninqualityoflife–oftenfor
the person with the medical conditionand their amily;
• Shorterlifeexpectancy;and
• Animpactonworkforceparticipation
due to absenteeism and presenteeism.
Not participating in enough sport and physical
activity during our lives clearly has a negative
impact on our lie expectancy and quality o lie.
On average, participating in moderate to
vigorous levels o physical activity throughout
our lie can add 2.5 years to the total lie
expectancy or both men and women.
In the current social environment o an ageingpopulation and a society beset with preventable
and chronic illnesses such as obesity and Type
2 diabetes, the message to move more and
more oten, is imperative to ensuring a
healthier, more active, Australia.
Of course there are also indirect and intangible healthcosts that come with the medical conditions attributable
to physical inactivity.
7/28/2019 Pyhsical Inactivity
http://slidepdf.com/reader/full/pyhsical-inactivity 11/12
At Medibank Private we believe a good way to preventsickness is to promote health and we want to help
members take a more active role in managing their health
and wellbeing.
11
Medibank Private members have automatic
access to better health online, a health, tness
and wellbeing program.
better health online oers exercise planners,healthy recipes, and health related articles
to help people improve, or maintain, a
healthy liestyle.
For those with an active liestyle but motivated
to tackle specic sporting goals or training or
competition, better health online also oers
ActiveSportPrograms.
ActiveSportProgramsarepreparedby
experts to suit individual sporting ambitions
and match various levels o expertise with
daily warm-up and workout plans – theprograms cover:
• Marathon
• FunRuns
• Openwaterswims
• Strengthtraining
• Sprintdistancetriathlons
• Cycling
• Skiing
Startgettingmorephysicallyactive
by visiting better health online –medibank.tness2live.com.au
Need help getting active?
Medibank Private is Australia’s largest provider o private health insurance,covering over 3 million people. Medibank Private oers health insurance to
all Australians through retail and corporate products, as well as catering orinternational students and visitors.
About Medibank Private:
This research was conducted by Econtech on behal o Medibank Private.Econtech is one o Australia’s leading independent economic consultancies,withanemphasisoneconomicmodelling.Specialisinginconsultingontaxation,policy and orecasting, as well as orecasting reports and sotware.
About Econtech:
7/28/2019 Pyhsical Inactivity
http://slidepdf.com/reader/full/pyhsical-inactivity 12/12
Phone132 331
MedibankPrivateLimitedABN47080890259
MPLM17100807
Top Related