


Languages
Pages
Legal


Chan, W., Bosch, J.A., Jones, D., McTernan, P.G., Inston, N., Moore, S., Kaur, O., Phillips, A.C., & Borrows, R. (2015 online). Cardiovascular, Muscular and Perceptual Contributions to Physical Fatigue in Prevalent Kidney Transplant Recipients. Transplant International, IF 2.60 http://dx.doi.org/10.1111/tri.12727
Cardiovascular, Muscular and Perceptual Contributions to Physical Fatigue in Prevalent Kidney Transplant Recipients
Winnie Chan1,2,3, David Jones4, Jos A Bosch2,5, Jamie McPhee4, Nicola Crabtree6, Philip G McTernan7, Okdeep Kaur1, Nicholas Inston1, Sue Moore1,
Andrew McClean1, Lorraine Harper1, Anna C Phillips2, Richard Borrows1,8
1Department of Nephrology & Kidney Transplantation, Area 5, Level 7, Queen Elizabeth Hospital Birmingham, Mindelsohn Way, Edgbaston, Birmingham B15 2WB, UK.
2School of Sport, Exercise and Rehabilitation Sciences, University of Birmingham, Edgbaston, Birmingham B15 2TT, UK.
3Department of Nutrition & Dietetics, Therapy Services South Suite, 1st Floor, Queen Elizabeth Hospital Birmingham, Mindelsohn Way, Edgbaston, Birmingham B15 2WB, UK.4School of Healthcare Science, Manchester Metropolitan University, John Dalton Building,
Chester Street, Manchester M1 5GD, UK.5Faculteit der Maatschappij- en Gedragswetenschappen, Programmagroep: Clinical
Psychology, Kamernummer: 5.12, Weesperplein 4, 1018 XA, Amsterdam, Nederland.6Department of Nuclear Medicine, Ground Floor, Queen Elizabeth Hospital Birmingham,
Mindelsohn Way, Edgbaston, Birmingham B15 2WB, UK.7Division of Metabolic and Vascular Health, Clinical Sciences Research Institute, Warwick
Medical School, University of Warwick, Coventry CV2 2DX, UK.8University of Birmingham, Birmingham B15 2WB, UK.
Corresponding Author
Dr Richard BorrowsDepartment of Nephrology & Kidney Transplantation, Area 5, Level 7, Queen Elizabeth
Hospital Birmingham, Mindelsohn Way, Edgbaston, Birmingham B15 2WB, UK.Tel: +44 (0) 121 371 6099Fax: +44 (0) 121 371 5858
Email: [email protected]

Chan, W., Bosch, J.A., Jones, D., McTernan, P.G., Inston, N., Moore, S., Kaur, O., Phillips, A.C., & Borrows, R. (2015 online). Cardiovascular, Muscular and Perceptual Contributions to Physical Fatigue in Prevalent Kidney Transplant Recipients. Transplant International, IF 2.60 http://dx.doi.org/10.1111/tri.12727
Word Count
Abstract = 200Main Text = 3997
Running Title
Physical Fatigue in Kidney Transplant Recipients
Funding
Winnie Chan received a research grant from the British Renal Society, and was awarded a PhD research training fellowship from the West Midlands
Strategic Health Authority.
Disclosure
The authors declare no conflicts of interest.
Keywords
Cardiovascular; Fatigue; Kidney; Muscular; Perception; Transplant
Author Contributions
Winnie Chan, David Jones, Jos A Bosch, and Richard Borrows designed the research.
Winnie Chan, David Jones, Jos A Bosch, Philip G McTernan, Anna C Phillips, and Richard Borrows wrote the manuscript.
Winnie Chan, Jamie McPhee, Nicola Crabtree, Okdeep Kaur, Nicholas Inston, Sue Moore, Andrew McClean, Lorraine Harper, and Richard Borrows
conducted the research.
Winnie Chan, David Jones, Jos A Bosch, Anna C Phillips, and Richard Borrows analysed the data and performed the statistical analysis.
Winnie Chan and Richard Borrows had primary responsibility for the final content.

Chan, W., Bosch, J.A., Jones, D., McTernan, P.G., Inston, N., Moore, S., Kaur, O., Phillips, A.C., & Borrows, R. (2015 online). Cardiovascular, Muscular and Perceptual Contributions to Physical Fatigue in Prevalent Kidney Transplant Recipients. Transplant International, IF 2.60 http://dx.doi.org/10.1111/tri.12727
Abbreviations
BM Body Mass
CBT Cognitive Behavioural Therapy
CFS Chronic Fatigue Syndrome
CI Confidence Interval
CMJ Counter Movement Jump
DEXA Dual-Energy X-Ray Absorptiometry
eGFR Estimated Glomerular Filtration Rate
FM Fat Mass
HADS Hospital Anxiety and Depression Scale
HR Heart Rate
hsCRP High-Sensitivity C-Reactive Protein
Hb Haemoglobin
Ht2 Height Squared
ICED Index of Co-Existing Disease
IQR Interquartile Range
KTRs Kidney Transplant Recipients
LLTM Lower Limb Lean Tissue Mass
LTM Lean Tissue Mass
MFI-20 Multi-Dimensional Fatigue Inventory-20
NODAT New-Onset Diabetes After Transplantation
O2 pulse Oxygen Pulse
Pre-DM Presence of Diabetes Pre-Transplantation
Chan, W., Bosch, J.A., Jones, D., McTernan, P.G., Inston, N., Moore, S., Kaur, O., Phillips, A.C., & Borrows, R. (2015 online). Cardiovascular, Muscular and Perceptual Contributions to Physical Fatigue in Prevalent Kidney Transplant Recipients. Transplant International, IF 2.60 http://dx.doi.org/10.1111/tri.12727
PSQI Pittsburgh Sleep Quality Index
QoL Quality of Life
RPE Rating of Perceived Exertion
RPEindex Rating of Perceived Exertion Index
SD Standard Deviation
SF-36 Medical Outcomes Study Short-Form 36
SSRI Selective Serotonin Reuptake Inhibitors
VO2 Oxygen Consumption
VO2max Maximal Oxygen Consumption
W Watts

Chan, W., Bosch, J.A., Jones, D., McTernan, P.G., Inston, N., Moore, S., Kaur, O., Phillips, A.C., & Borrows, R. (2015 online). Cardiovascular, Muscular and Perceptual Contributions to Physical Fatigue in Prevalent Kidney Transplant Recipients. Transplant International, IF 2.60 http://dx.doi.org/10.1111/tri.12727
Abstract
Background: Physical fatigue is debilitating and common among kidney transplant
recipients (KTRs). This study investigated the mechanistic aetiology of physical fatigue in
this setting through examinations of muscle mass, muscular and cardiovascular function, and
perceived exertion. The incidence of physical fatigue, its association with quality of life
(QoL), and the predictors of perceived exertion, were evaluated.
Methods: This single-centre observational cross-sectional study enrolled 55 KTRs. Muscle
mass was quantified using dual-energy x-ray absorptiometry. Muscular function was
assessed by jumping mechanography. Cardiovascular function (maximal oxygen
consumption and oxygen pulse) was estimated during submaximal exercise testing, with
perceived exertion determined using age-adjusted Borg scale-ratings. Physical fatigue was
measured using Multi-Dimensional Fatigue Inventory-20. QoL was assessed using Medical
Outcomes Study Short Form-36. Demographic, clinical, nutritional, psychosocial and
behavioural predictors of perceived exertion were assessed.
Results: Of clinical importance, increased perceived exertion was the only independent
predictor of physical fatigue (p=0.001), with no association found between physical fatigue
and muscular or cardiovascular parameters. Physical fatigue occurred in 22% of KTRs, and
negatively impacted on QoL (p<0.001). Predictors of heightened perception included anxiety
(p<0.05) and mental fatigue (p<0.05).
Conclusion: Perception is a key determinant of physical fatigue in KTRs, paving the way for
future interventions.
Chan, W., Bosch, J.A., Jones, D., McTernan, P.G., Inston, N., Moore, S., Kaur, O., Phillips, A.C., & Borrows, R. (2015 online). Cardiovascular, Muscular and Perceptual Contributions to Physical Fatigue in Prevalent Kidney Transplant Recipients. Transplant International, IF 2.60 http://dx.doi.org/10.1111/tri.12727
Introduction
Fatigue is the subjective sensation of profound and persistent tiredness, weakness, and lack of
energy (1, 2). It is a complex and multi-dimensional phenomenon involving physical,
cognitive, and emotional components that interfere with individuals’ abilities to function
normally (2, 3). Fatigue is a prevalent patient-reported outcome among kidney transplant
recipients (KTRs), occurring in up to 59% of these patients (3-5) and substantially impacting
upon quality of life (QoL) (4, 5). Yet it is often medically unexplained, clinically under-
recognised, and usually untreated (4).
One of the most frequently used instruments for fatigue assessment, namely Multi-
Dimensional Fatigue Inventory-20 (MFI-20), measures physical, behavioural, emotional and
cognitive components contributing to the overall assessment of fatigue. Although KTRs
displayed high scores in all aspects of fatigue (4), physical fatigue, found in 38% of KTRs
(4), represents the dominant component outweighing behavioural, emotional, and cognitive
aspects (4), and impacts on all domains of QoL (4).
Conceptually, physical fatigue has traditionally been considered as a consequence of
strenuous physical activity. Accordingly, excessive physical fatigue may be ascribed to
either “cardiovascular”, “muscular”, or “perceptual” aetiologies. The cardiovascular model
refers to insufficient cardiovascular oxygen or nutrient delivery to the muscular system,
limiting oxidative phosphorylation and glycolysis, both essential mechanisms for muscle
contraction (6). Correspondingly, “cardiovascular” fatigue results in decreased ability of

Chan, W., Bosch, J.A., Jones, D., McTernan, P.G., Inston, N., Moore, S., Kaur, O., Phillips, A.C., & Borrows, R. (2015 online). Cardiovascular, Muscular and Perceptual Contributions to Physical Fatigue in Prevalent Kidney Transplant Recipients. Transplant International, IF 2.60 http://dx.doi.org/10.1111/tri.12727
muscle to generate and maintain force, contributing to physical fatigue. The “muscular”
model denotes insufficient muscle mass or reduced muscular function, leading to failure of
muscle force generation (6-8), and/or inability to maintain force or power output (9),
resulting in physical fatigue. The “perceptual” theory represents increased perception of
effort, characterised by loss of motivation and reluctance to perform physical tasks when
perception of effort reaches a certain level. In fatigue with perceptual origin, individuals
experience heightened responses to a combination of feed forward signals from the motor
centres and afferent feedback from the working body (6, 10, 11), resulting in depressed
motivation with increasing exercise intensity and/or duration. The extent of inhibition varies,
individuals with heightened perceived exertion experiencing a greater sense of effort for a
given workload, expressed as physical fatigue. Of interest, it is recognised that mental
fatigue, characterised by inability to focus and maintain cognitive attention, is a crucial
determinant of physical limits in healthy individuals (12-14), by heightening the perception
of exertion (12, 13).
The cardinal mechanisms underlying physical fatigue in KTRs remain unexplored. The
primary objectives of this study were to systematically examine the aetiology of physical
fatigue in KTRs, by measuring factors which may be mechanistically linked to symptoms of
physical fatigue. These include quantification of muscle mass, assessment of muscular and
cardiovascular function, and evaluation of perceived exertion during a standardised exercise
protocol. In addition, the incidence of physical fatigue, and its impact on QoL in clinically
stable KTRs, were examined. The key findings were that physical fatigue affected 22% of
clinically stable KTRs, adversely impacted on QoL, and was unrelated to cardiovascular or
muscular factors. Rather, heightened perception of fatigue during exercise was closely

Chan, W., Bosch, J.A., Jones, D., McTernan, P.G., Inston, N., Moore, S., Kaur, O., Phillips, A.C., & Borrows, R. (2015 online). Cardiovascular, Muscular and Perceptual Contributions to Physical Fatigue in Prevalent Kidney Transplant Recipients. Transplant International, IF 2.60 http://dx.doi.org/10.1111/tri.12727
related to physical fatigue. These findings led to further investigation to examine the role of
mental fatigue, and other plausible predictors of heightened perception.
Subjects and Methods
Participants and Study Design
Prevalent KTRs were recruited from the renal transplant outpatient clinic at Queen Elizabeth
Hospital Birmingham UK, between August 2011 and August 2013. Inclusion and exclusion
criteria are detailed in Table 1. Of 67 KTRs approached, 12 did not participate mainly due to
work commitment. Age- and gender- matched healthy subjects (control group) were
recruited over the same time period, from Queen Elizabeth Hospital Birmingham UK through
recruitment posters, and from University of Birmingham UK by email invitations to all
students and staff members. Of 45 volunteers, 4 were excluded due to the presence of known
chronic illnesses and the use of regular medications.
The study was approved by the local research ethics committee, and was conducted in
accordance with the principles of the Declaration of Helsinki.
Protocol Overview
KTRs and controls attended the research visit in the morning following an overnight rest and
a light breakfast (260kcal; 12g protein). Upon arrival, the testing procedures including the
use of questionnaires, tools and equipment were explained.

Chan, W., Bosch, J.A., Jones, D., McTernan, P.G., Inston, N., Moore, S., Kaur, O., Phillips, A.C., & Borrows, R. (2015 online). Cardiovascular, Muscular and Perceptual Contributions to Physical Fatigue in Prevalent Kidney Transplant Recipients. Transplant International, IF 2.60 http://dx.doi.org/10.1111/tri.12727
The order of tests was standardised. First, blood sampling was undertaken. Self-completion
of questionnaires, including Multi-Dimensional Fatigue Inventory-20 (MFI-20), Hospital
Anxiety and Depression Scale (HADS), Pittsburgh Sleep Quality Index (PSQI), and Medical
Outcomes Study Short-Form 36 (SF-36) followed. Then, Dual-Energy X-Ray
Absorptiometry (DEXA) scanning and jumping mechanography were undertaken. Finally,
participants rested for one-hour prior to performing an incremental submaximal exercise test,
which included a measure of exertion using the Borg Rating of Perceived Exertion (RPE)
scale.
Multi-Dimensional Fatigue Inventory-20 (MFI-20) and Definition of Physical Fatigue
Severity of physical fatigue was assessed subjectively using the MFI-20, a 20-item self-report
questionnaire measuring fatigue in 5 dimensions, with 4 items measuring physical fatigue
using a 5-point Likert scale. Scores for physical fatigue ranged from 4-20, with higher scores
indicating greater fatigue. See Supporting Information, Subjects and Methods.
The incidence of physical fatigue was determined using the previously established definition
of physical fatigue, defined as ≥95th percentile for the general population as reported by Lin et
al (4, 15).
Dual-Energy X-ray Absorptiometry
DEXA provided measures of whole-body lean tissue mass (LTM), lower limb lean tissue
mass (LLTM), and fat mass (FM) (16, 17). Both LTM and LLTM were normalised to height

Chan, W., Bosch, J.A., Jones, D., McTernan, P.G., Inston, N., Moore, S., Kaur, O., Phillips, A.C., & Borrows, R. (2015 online). Cardiovascular, Muscular and Perceptual Contributions to Physical Fatigue in Prevalent Kidney Transplant Recipients. Transplant International, IF 2.60 http://dx.doi.org/10.1111/tri.12727
squared (Ht2) accounting for differences in body size. See Supporting Information,
Subjects and Methods.
Jumping Mechanography
The Leonardo Mechanography Ground Reaction Force Platform (Novotec Medical,
Germany) was used to assess lower limb muscle power, an indication of muscular function.
Participants performed a two-legged counter movement jump (CMJ) on the platform. Peak
power of the vertical movement was computed by the system as the product of force and
velocity (18-22), then normalised to total body mass (BM). Jumping mechanography
predominately investigates kinetic factors of lower limb muscle function (23, 24), peak power
was also adjusted to LLTM. See Supporting Information, Subjects and Methods.
Incremental Submaximal Exercise Test
Cardiovascular function, represented by maximal oxygen consumption (VO2max) and
oxygen pulse (O2 pulse), were measured by performing a submaximal incremental exercise
test on an electrically braked cycle ergometer (Lode Corival, Cranlea, UK).
The exercise protocol was preceded and followed by two-minute warm-up and cool-down
periods at 10 watts (W). The test started at 25W, with work rate increasing by 25W at three-
minute intervals until voluntary exhaustion or the end of three-minute at 75W. Participants
were encouraged verbally to maintain cadence ≥65 revolutions per minute.

Chan, W., Bosch, J.A., Jones, D., McTernan, P.G., Inston, N., Moore, S., Kaur, O., Phillips, A.C., & Borrows, R. (2015 online). Cardiovascular, Muscular and Perceptual Contributions to Physical Fatigue in Prevalent Kidney Transplant Recipients. Transplant International, IF 2.60 http://dx.doi.org/10.1111/tri.12727
Expired air volume and composition were collected continuously and analysed every 30
seconds using the MOXUS Modular Metabolic System (AET Technologies, USA), providing
oxygen consumption (VO2). See Supporting Information, Subjects and Methods. Heart
rate (HR) was monitored continuously and recorded every 30 seconds (Polar Vantage,
Finland).
The VO2 and HR measurements were averaged over the final minute of each three-minute
workloads (25W, 50W and 75W). Consequently, VO2max was estimated by linear regression
of VO2 as a function of HR, and extrapolating VO2 to age-predicted maximum HR: Age-
predicted maximum HR = 205.8–(0.685×Age) (25-27). Estimated VO2max correlates highly
with measured VO2max when calculated with this approach (28). An example of the linear
regression is shown in Figure 1a; the mean r2 for the linear regression in the studied cohort
was 0.97 ± 0.04.
O2 pulse, oxygen consumed per heartbeat, was calculated as the gradient of the linear
regression of VO2 versus HR (29). An example is shown in Figure 1b; the mean r2 for the
cohort was 0.97 ± 0.05. O2 pulse was expressed as absolute volume and adjusted for BM. To
account for the effect of body size on O2 pulse during exercise, O2 pulse was also adjusted to
LTM.
Perception of Exertion
Perception of exertion was evaluated using the 15-point Borg RPE Scale (28). This is a self-
reported measure that evaluates the subjective perception of exertion on a scale of 6-20, with
6 representing “no exertion at all”, and 20 denoting “maximal exertion”. The RPE Scale was

Chan, W., Bosch, J.A., Jones, D., McTernan, P.G., Inston, N., Moore, S., Kaur, O., Phillips, A.C., & Borrows, R. (2015 online). Cardiovascular, Muscular and Perceptual Contributions to Physical Fatigue in Prevalent Kidney Transplant Recipients. Transplant International, IF 2.60 http://dx.doi.org/10.1111/tri.12727
administered using standardised instructions provided by Borg (30). Participants were
familiarised with the scale prior to exercise testing. Although subjects received strong
concurrent verbal encouragement throughout the exercise protocol, memory anchoring was
not used. The RPE scale was displayed in sight of the participant during the entire exercise.
In the last 5 seconds of each minute of the exercise, participants reported an instantaneous
RPE by pointing at the scale.
To account for inter-individual differences in predicted maximum HR due to variations in
age, a Rating of Perceived Exertion “Index” (RPEindex) was adopted for both within-group and
between-group comparisons. To derive RPEindex, the actual RPE at the end of the exercise
protocol (or volitional fatigue) was compared to the expected RPE based on the subject’s HR
at that time as a fraction of estimated age-predicted maximum HR and assuming that RPE
would be 20 at maximum HR. RPEindex is therefore independent of age and absolute work
rate, and hence a true reflection of the subject’s sense of effort per se. Derivation is
summarised as follows:
RPEindex = (Actual RPE / Expected RPE of 20) × (Estimated Age-predicted Maximum HR /
Actual HR at exhaustion or end of exercise)
As such, a RPEindex of 1.0 is considered “normal”, with values above this representing
heightened perception of effort during this exercise protocol, and vice versa.
Quality of Life Assessment

Chan, W., Bosch, J.A., Jones, D., McTernan, P.G., Inston, N., Moore, S., Kaur, O., Phillips, A.C., & Borrows, R. (2015 online). Cardiovascular, Muscular and Perceptual Contributions to Physical Fatigue in Prevalent Kidney Transplant Recipients. Transplant International, IF 2.60 http://dx.doi.org/10.1111/tri.12727
SF-36 was used to assess QoL, consisting of 36 questions grouped into 8 subscales
corresponding to different life domains. It generates a total score for QoL, as well as
physical- and mental- health scores. Within the SF-36, there is an “energy and vitality”
subscale that measures fatigue (31). Due to its confounding effect, correlations with physical
fatigue were analysed prior to and following exclusion of this subscale. See Supporting
Information, Subjects and Methods.
Clinical, Demographic, Psychosocial and Behavioural Data Collection
Blood sampling was undertaken from both KTRs and control group for analysis of high-
sensitivity C-Reactive Protein (hsCRP), haemoglobin (Hb) and creatinine-derived estimated
Glomerular Filtration Rate (eGFR) using the 4-variable modification of diet in renal disease
equation (32).
For both KTRs and control group, the following data were enquired by questionnaire: age,
gender, marital status, ethnicity, smoking status (never smoked, current smoker, ex-smoker),
alcohol intake (units per week), symptoms of anxiety and depression assessed using HADS,
and sleep quality evaluated using PSQI. See Supporting Information, Subjects and
Methods.
For KTRs, the following data were collected from patient’s medical records: time post-
transplantation, co-morbidity assessed as Index of Co-Existing Disease (ICED) (33), presence
of diabetes, either pre-transplantation (pre-DM) or New Onset Diabetes After Transplantation
(NODAT), prior acute rejection episodes, beta-adrenergic blocker and immunosuppressive
medication usage.

Chan, W., Bosch, J.A., Jones, D., McTernan, P.G., Inston, N., Moore, S., Kaur, O., Phillips, A.C., & Borrows, R. (2015 online). Cardiovascular, Muscular and Perceptual Contributions to Physical Fatigue in Prevalent Kidney Transplant Recipients. Transplant International, IF 2.60 http://dx.doi.org/10.1111/tri.12727
Statistical Analysis
Statistical analyses were performed using SPSS Statistics 21 (Chicago, IL). Regression
diagnostics were performed. Results were presented as mean ± SD for normally distributed
data, or median (interquartile range; IQR) for non-normal data. Chi-square or Fisher’s exact
tests were used to compare differences between groups on categorical variables. Mann-
Whitney U test was used to compare differences between groups on ordinal variable.
Independent-sample t-test was used to compare continuous data between groups.
Linear regression analysis was used to determine the association between predictor variable
and the continuously-distributed outcome variable. There were two outcome variables in this
study, physical fatigue and RPEindex, and both variables were tested for normality prior to
regression analyses. The analyses were performed in three stages. Initially, the effect of each
variable was examined in a series of univariate regression analyses. Then, interaction
analyses moderated by the effect of gender, age and eGFR for each of the univariate
relationships were performed. Subsequently, the joint effect of variables demonstrating some
evidence of association in univariate analyses (p<0.20) was examined in a multivariate
regression analysis, using a fully adjusted multivariate model. A type I error rate ≤5%
(p≤0.05) was considered significant in the model. Specifically, the associations between each
of the cardiovascular parameter and physical fatigue were adjusted for usage of beta-
blockers.
Results

Chan, W., Bosch, J.A., Jones, D., McTernan, P.G., Inston, N., Moore, S., Kaur, O., Phillips, A.C., & Borrows, R. (2015 online). Cardiovascular, Muscular and Perceptual Contributions to Physical Fatigue in Prevalent Kidney Transplant Recipients. Transplant International, IF 2.60 http://dx.doi.org/10.1111/tri.12727
Population characteristics for the cohorts of KTRs and controls are shown in Table 2.
Results for physical fatigue score, measurements of muscle mass and function, VO2max, O2
pulse, and RPEindex for both cohorts are indicated in Table 3. The comparisons of these
parameters between KTRs and control group are also shown in Table 3.
Muscular Mass and Function
Table 3 shows that LTM adjusted to Ht2 and LLTM adjusted to Ht2 did not differ
significantly between KTRs and controls in either males or females.
Similarly, Table 3 indicates that jumping power derived from CMJ per kg LLTM did not
differ significantly between KTRs and controls in either males or females. However, while
jumping power from CMJ per kg BM did not differ significantly between female KTRs and
female controls, it is significantly lower in male KTRs compared to their control
counterparts.
Importantly, in the analysis of KTRs, no correlation was found between physical fatigue and
LTM adjusted to Ht2 (r=0.09, p=0.75), LLTM adjusted to Ht2 (r=0.05, p=0.48), muscular
power from CMJ (r=0.18, p=0.33), or CMJ adjusted to BM (r=0.19, p=0.31), or CMJ
adjusted to LLTM (r=0.24, p=0.28).
Cardiovascular Function

Chan, W., Bosch, J.A., Jones, D., McTernan, P.G., Inston, N., Moore, S., Kaur, O., Phillips, A.C., & Borrows, R. (2015 online). Cardiovascular, Muscular and Perceptual Contributions to Physical Fatigue in Prevalent Kidney Transplant Recipients. Transplant International, IF 2.60 http://dx.doi.org/10.1111/tri.12727
Table 3 indicates that VO2max, absolute O2 pulse, O2 pulse adjusted to BM, and O2 pulse
adjusted to LTM were significantly lower in female KTRs compared to female controls. No
differences between male KTRs and controls were seen.
Of note, in the analyses relating to KTRs, no significant correlations were seen between
physical fatigue and VO2max (r=0.23, p=0.09), absolute O2 pulse (r=0.17, p=0.21), O2 pulse
adjusted for BM (r=0.21, p=0.20), or O2 pulse adjusted for LTM (r=0.17, p=0.23).
Perceived Exertion
Figure 2 shows the overall distribution of RPEindex in KTRs and the control group. RPEindex
was significantly higher in KTRs (1.0±0.3) compared to controls (0.8±0.2) (p=0.001).
Specifically, as shown in Table 3, RPEindex was significantly higher in both male (0.9 ± 0.3)
and female (1.0 ± 0.2) KTRs compared to male (0.7 ± 0.2) and female (0.8 ± 0.2) controls
respectively.
Notably, in the regression analysis pertaining to KTRs, and in contrast to the lack of
association between physical fatigue and either cardiovascular or muscular parameters,
RPEindex demonstrated a significant, graded, and positive correlation with physical fatigue
(r=0.42, p=0.001, Figure 3).
Predictors of Physical Fatigue in Kidney Transplant Recipients
Physical fatigue scores were normally distributed and analysed on the original scale of
measurement. Table 4 shows the associations between physical fatigue and measures of

Chan, W., Bosch, J.A., Jones, D., McTernan, P.G., Inston, N., Moore, S., Kaur, O., Phillips, A.C., & Borrows, R. (2015 online). Cardiovascular, Muscular and Perceptual Contributions to Physical Fatigue in Prevalent Kidney Transplant Recipients. Transplant International, IF 2.60 http://dx.doi.org/10.1111/tri.12727
muscle mass and function, VO2max, O2 pulse, and RPEindex in KTRs. On univariate analysis,
the only significant predictor of increasing physical fatigue in KTRs was increased RPEindex
(β=5.7; 95% Confidence Interval [CI]=2.2, 9.2; r=0.42; p=0.001, Figure 3). No significant
associations were seen between physical fatigue and measures of muscle mass and function.
A trend towards an association between physical fatigue and VO2max was evident on
univariate analysis (β=-0.1; 95% CI=-0.2, 0.0; r=0.23; p=0.09), Figure 4.
With RPEindex and VO2max analysed in the fully adjusted multivariate model, VO2max no
longer retained significance (β=-0.1; 95% CI=-0.2, 0.1; p=0.43). In this model, RPEindex
remained the single independent predictor of physical fatigue (β=5.4; 95% CI=1.6, 9.3;
p=0.001). Of note, no significant age-, gender-, and eGFR- interactions were found between
physical fatigue and any predictor variables (p>0.05 for all associations), see Supporting
Information, Results, Table 1.
Incidence of Physical Fatigue; and Correlation with Quality of Life in Kidney
Transplant Recipients
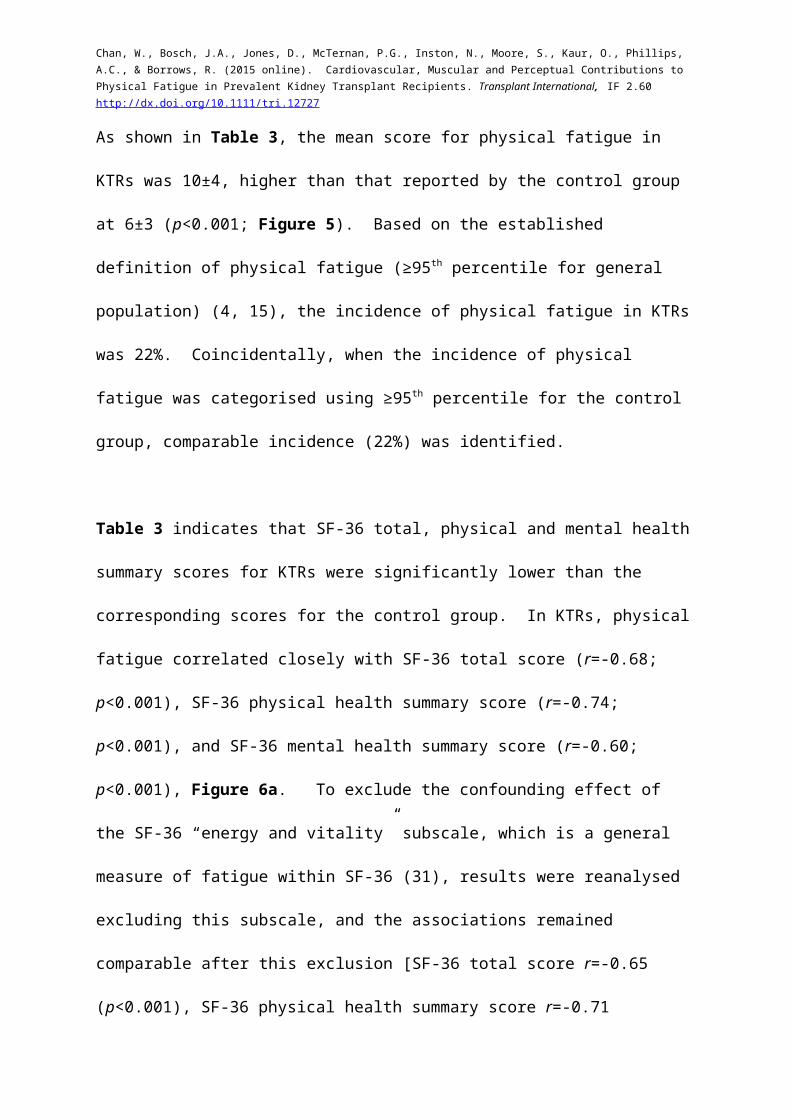
As shown in Table 3, the mean score for physical fatigue in KTRs was 10±4, higher than that
reported by the control group at 6±3 (p<0.001; Figure 5). Based on the established definition
of physical fatigue (≥95th percentile for general population) (4, 15), the incidence of physical
fatigue in KTRs was 22%. Coincidentally, when the incidence of physical fatigue was
categorised using ≥95th percentile for the control group, comparable incidence (22%) was
identified.

Chan, W., Bosch, J.A., Jones, D., McTernan, P.G., Inston, N., Moore, S., Kaur, O., Phillips, A.C., & Borrows, R. (2015 online). Cardiovascular, Muscular and Perceptual Contributions to Physical Fatigue in Prevalent Kidney Transplant Recipients. Transplant International, IF 2.60 http://dx.doi.org/10.1111/tri.12727
Table 3 indicates that SF-36 total, physical and mental health summary scores for KTRs
were significantly lower than the corresponding scores for the control group. In KTRs,
physical fatigue correlated closely with SF-36 total score (r=-0.68; p<0.001), SF-36 physical
health summary score (r=-0.74; p<0.001), and SF-36 mental health summary score (r=-0.60;
p<0.001), Figure 6a. To exclude the confounding effect of the SF-36 “energy and vitality”
subscale, which is a general measure of fatigue within SF-36 (31), results were reanalysed
excluding this subscale, and the associations remained comparable after this exclusion [SF-36
total score r=-0.65 (p<0.001), SF-36 physical health summary score r=-0.71 (p<0.001), and
SF-36 mental health summary score r=-0.53 (p<0.001); Figure 6b)].
Predictors of Perceived Exertion in Kidney Transplant Recipients
Finally, in light of the association between RPEindex and physical fatigue in KTRs, and the
previously described association between mental fatigue and perceived exertion in a non-
transplant cohort (12), the impact of mental fatigue and other plausible predictors upon
perceived exertion was examined in this cohort of KTRs.
Scores for RPEindex were normally distributed and analysed on the original scale of
measurement. Measurements of the potential predictors of RPEindex, including demographic,
clinical, nutritional, psychosocial and behavioural parameters are indicated in Tables 2 and
3. On univariate analysis, as shown in Table 5, mental fatigue, NODAT, absence of
cyclosporine, increasing age, low alcohol intake, anxiety, and depression were significantly
associated with RPEindex. In the fully adjusted multivariate analysis, age and depression did
not retain significance, but the remaining variables remained significantly associated with
RPEindex (Table 5).

Chan, W., Bosch, J.A., Jones, D., McTernan, P.G., Inston, N., Moore, S., Kaur, O., Phillips, A.C., & Borrows, R. (2015 online). Cardiovascular, Muscular and Perceptual Contributions to Physical Fatigue in Prevalent Kidney Transplant Recipients. Transplant International, IF 2.60 http://dx.doi.org/10.1111/tri.12727
Discussion
This is the first study to systematically investigate the potential aetiology of physical fatigue
in KTRs, and reveals novel findings. Specifically, physical fatigue in KTRs seems unrelated
to muscular and cardiovascular factors, but rather, it is driven by increased perception of
exertion during exercise. In turn, mental fatigue is significantly associated with such
heightened perception of effort. The findings of the current study also confirm physical
fatigue as a common and disabling symptom among KTRs, negatively impacting on QoL (3-
5). Whilst novel to transplantation, these results resonate with recent findings emerged from
other populations, whereby heightened perception limits exercise capacity in healthy trained
individuals (34) and diabetic patients (35), and mental fatigue impairs physical performance
in healthy subjects through increased perception of effort rather than limiting
musculoenergetic or cardiovascular function (12, 13). In addition, observations in chronic
fatigue syndrome (CFS) further support the findings from this study, corroborating that
fatigue is not explained by deficits in the muscular and cardiovascular systems (36). These
results suggest that interventions directed towards the psychology rather than physiology of
fatigue may be beneficial to KTRs with this important and debilitating symptom.
This is a single-centre pilot study of 55 patients, and validation is needed in larger cohorts.
For ethical and safety reasons, the physiological testing was performed in a selected cohort of
clinically stable KTRs, limiting the generalisation of the results to the overall kidney
transplant population. However, the focus of the current study was to specifically address
physical fatigue in this context, enabling evaluation without the confounding effect of
intercurrent or chronic illnesses. Thus, it is noteworthy that despite this targeted enrolment,

Chan, W., Bosch, J.A., Jones, D., McTernan, P.G., Inston, N., Moore, S., Kaur, O., Phillips, A.C., & Borrows, R. (2015 online). Cardiovascular, Muscular and Perceptual Contributions to Physical Fatigue in Prevalent Kidney Transplant Recipients. Transplant International, IF 2.60 http://dx.doi.org/10.1111/tri.12727
and based on the established definition of physical fatigue (≥95th percentile for general
population) (4, 15), 22% of KTRs experienced significant physical fatigue. Indeed, the mean
physical fatigue score in KTRs (10±4) was higher than healthy subjects in the control group
(6±3), and comparable to “chronically unwell” patients (10±4) reported previously by Lin et
al (15). This, together with the adverse associations with all aspects of QoL, indicates the
severity of the problem.
Varied disease processes, immunosuppression with steroid therapy, and lack of physical
activity may result in muscle atrophy. In these circumstances, muscles work at a relatively
high work-load even in everyday life, and hence fatigue rapidly. However, whole body LTM
and LLTM in KTRs were comparable to healthy subjects in the control group, and there was
no association between physical fatigue with either whole body LTM or LLTM in KTRs. In
support of these results, muscle mass was comparable to previous literature in this field (37,
38). Certainly, muscle mass per se may not be the crucial factor, the ability of musculature to
generate force and movement may be of greater importance. Interestingly, the results from
the jumping mechanography studies showed that KTRs were mostly capable of generating
muscular power similar to healthy subjects in the control group, apart from the observation
that male KTRs displayed significantly lower muscular power adjusted to body weight
compared to healthy subjects in the control group. Such discrepancy may be explained by
significantly higher adiposity measured by DEXA among male KTRs compared to male
controls. Nevertheless, there were no associations between any measure of muscular power
and physical fatigue among KTRs.
VO2max is the conventional measure of cardiovascular fitness, and its prognostic utility is
well-established in research and clinical settings (39, 40). In this study, VO2max was

Chan, W., Bosch, J.A., Jones, D., McTernan, P.G., Inston, N., Moore, S., Kaur, O., Phillips, A.C., & Borrows, R. (2015 online). Cardiovascular, Muscular and Perceptual Contributions to Physical Fatigue in Prevalent Kidney Transplant Recipients. Transplant International, IF 2.60 http://dx.doi.org/10.1111/tri.12727
estimated by extrapolating oxygen uptake from the relationship with HR during a
submaximal exercise test. This is a common approach (27), although there are 2 caveats.
Firstly, estimation of maximum HR in relation to age can be unreliable (25, 41). Secondly,
the conventional expression of body weight-adjusted VO2max may be misleading due to
inter-individuals’ variability in body composition. Accordingly, fat mass may influence
VO2max measurement that has limited relevance to actual cardiovascular function. An
alternative, but complimentary measure of O2 pulse has recently emerged (39, 40). O2 pulse
is independent of body composition and maximum HR, and predominately determined by
cardiac stroke volume and peripheral oxygen extraction during exercise, thereby potentially
reflecting cardiovascular function more accurately (39, 40, 42). Both male and female KTRs
had numerically lower VO2max and O2 pulse measures compared to healthy subjects in the
control group, albeit only of statistical significance in females. In support of these results,
VO2max data was comparable to findings from previous studies in this field (37, 38, 43, 44).
Of note, neither VO2max nor O2 pulse were associated with physical fatigue in KTRs in the
adjusted multivariate analysis. The difference in cardiovascular fitness between KTRs and
healthy subjects is perhaps unsurprising, but identifying the underlying reasons for this was
not the focus of the current study.
In contrast, it was RPEindex that independently and significantly correlated with physical
fatigue in KTRs, consistent with a heightened perception of exertion. It should be noted that
this derived index takes into account predicted maximal HR, and is therefore not a reflection
of age, cardiovascular fitness and absolute work rate. The RPEindex represents an objective
evaluation of perceived exertion during a protocolled exercise test. In the absence of
evidence that cardiovascular or muscular mechanisms were associated with physical fatigue,

Chan, W., Bosch, J.A., Jones, D., McTernan, P.G., Inston, N., Moore, S., Kaur, O., Phillips, A.C., & Borrows, R. (2015 online). Cardiovascular, Muscular and Perceptual Contributions to Physical Fatigue in Prevalent Kidney Transplant Recipients. Transplant International, IF 2.60 http://dx.doi.org/10.1111/tri.12727
the results of this study suggest that modifying the perception of fatigue may be the key to
alleviate this symptom.
The mechanisms by which perception of effort influences physical performance has been
proposed by Marcora and colleagues using the Brehm’s theory of motivation (12). In this
theory, individuals opt to withdraw from a task when it is perceived to be too difficult, or the
effort required exceeds the individuals’ willingness to perform (45). During the decision-
making process, individuals are suspected to have lowered their level of task difficulty for
withdrawal (46, 47), and indeed, impaired physical performance is a common feature in
KTRs (48, 49).
In turn, KTRs displayed considerable mental fatigue, with MFI-20 scores of 10±5,
comparable to “chronically unwell” patients (11±4) reported by Lin et al (15). Further,
mental fatigue was an independent predictor of increased perception of exertion. This novel
finding in KTRs is highly reminiscent of that from Marcora et al in a non-transplant cohort
(12), whereby experimentally-induced mental fatigue decreases physical performance via
increased perception of effort, without affecting conventional physiological variables such as
stroke volume, oxygen uptake, blood pressure, or lactate levels (12). In addition, it has been
shown that experimentally-induced mental fatigue does not affect neuromuscular function
(13), suggesting a failure of central motivation driving physical fatigue. Mental fatigue was
measured by self-report questionnaire in this study, whereas mental fatigue was induced
experimentally by a 90-minute computer-based cognitive task in Marcora’s study (12), hence
it is unclear whether the two methodologies characterised equivalent effects. Yet the
similarities between the studies are noteworthy, and it is highly plausible that increased

Chan, W., Bosch, J.A., Jones, D., McTernan, P.G., Inston, N., Moore, S., Kaur, O., Phillips, A.C., & Borrows, R. (2015 online). Cardiovascular, Muscular and Perceptual Contributions to Physical Fatigue in Prevalent Kidney Transplant Recipients. Transplant International, IF 2.60 http://dx.doi.org/10.1111/tri.12727
perception of exertion results from mental fatigue among KTRs, contributing to symptoms of
physical fatigue.
In this study, the mean anxiety score for KTRs on HADS was 8±5, considered as mild
anxiety (50). Increased anxiety was independently associated with heightened perceived
exertion. Depression also displayed a univariate association with increased perceived
exertion. These observations were noted in previous studies of non-transplant cohorts (51,
52), highlighting the relevance of the current findings. However, a caveat with the
interpretation of the associations between self-reported data should be acknowledged, known
as “common method variance” (53). This includes symptoms of physical and mental fatigue,
perceived exertion, anxiety and depression, whereby patients in negative mood perceive,
remember, and report more physical and psychological symptoms, and report those
symptoms to be more severe than patients with less negative mood (54). Dissecting the
differences between the self-reported symptoms of “psychological distress” requires detailed
psychological evaluation, and such evaluation was beyond the scope of the current study.
Nevertheless, the findings of the current study point towards psychological factors rather than
physiological underperformance as the drivers of physical fatigue in KTRs. Future
studies should focus on testing interventional strategies aiming to
improve psychological factors. Exercise intervention, cognitive
behavioural therapy (CBT) and centrally-acting pharmacological therapy
may be beneficial in this setting. Exercise-based interventions have
shown promising results in relieving anxiety and depressive symptoms
(55, 56), and may indirectly improve perception of fatigue. Exercise
therapy has also demonstrated efficacy in alleviating symptoms of fatigue
in CFS (57). A recent pre-clinical study showed that exercise training

Chan, W., Bosch, J.A., Jones, D., McTernan, P.G., Inston, N., Moore, S., Kaur, O., Phillips, A.C., & Borrows, R. (2015 online). Cardiovascular, Muscular and Perceptual Contributions to Physical Fatigue in Prevalent Kidney Transplant Recipients. Transplant International, IF 2.60 http://dx.doi.org/10.1111/tri.12727
increases brain mitochondrial biogenesis, contributing to reductions in
centrally-mediated fatigue (58). The exact mechanisms for these changes
are unknown, but it is possible that increased brain mitochondria plays an
important role in reducing fatigue through their influence on cerebral
energy status (58). CBT per se or with exercise integration were found
effective in treating symptoms of fatigue and mood in somatoform
disorders, CFS, or fibromyalgia (59-61), and such approaches may be
applicable in this setting. The use of centrally-acting pharmacological
therapy may also be considered. Selective serotonin reuptake inhibitors
(SSRI) are used in patients with marked fatigue resulting from significant
anxiety (62), and they reduce fatigue in depressed patients with multiple
sclerosis through positive effects on mood (63).
The commonly studied clinical and demographic variables, including eGFR, Hb and hsCRP,
showed no associations with perception of effort in KTRs. Other factors which were
associated with heightened perceived exertion in KTRs included NODAT, absence of
cyclosporine, and low alcohol intake. These correlations may be biologically plausible (64-
69), although the possibility of type I statistical error should be acknowledged.
In conclusion, it is likely that improving physical fitness or function per se may not improve
physical fatigue, and other strategies such as exercise interventions, cognitive behavioural
therapy or centrally-acting pharmacological therapies may be more appropriate. The findings
of this study set the scene for future interventional research and therapeutic strategies.
Acknowledgements

Chan, W., Bosch, J.A., Jones, D., McTernan, P.G., Inston, N., Moore, S., Kaur, O., Phillips, A.C., & Borrows, R. (2015 online). Cardiovascular, Muscular and Perceptual Contributions to Physical Fatigue in Prevalent Kidney Transplant Recipients. Transplant International, IF 2.60 http://dx.doi.org/10.1111/tri.12727
The authors declare no conflict of interest. Winnie Chan received a research grant
from the British Renal Society, and was awarded a PhD research training
fellowship from the West Midlands Strategic Health Authority. The research
was carried out at the National Institute of Health Research (NIHR) / Wellcome Trust
Clinical Research Facility Birmingham. The views expressed are those of the authors and not
necessarily those of the National Health Service and the NIHR of the Department of Health.
The authors would like to thank the staff in the Renal Outpatients Department and the
Wellcome Trust Clinical Research Facility for supporting this study. Also, special thanks to
Golaleh McGinnell, Theresa Brady and Helen Houston for leading the nursing support of this
research; Jackie Walford and Deirdre Chapman for performing DEXA scanning and jumping
mechanography.
References
1. Macdonald JH, Fearn L, Jibani M, Marcora SM. Exertional Fatigue in Patients With CKD. American Journal of Kidney Diseases. 2012;60(6):930-9.2. Jhamb M, Weisbord SD, Steel JL, Unruh M. Fatigue in Patients Receiving Maintenance Dialysis: A Review of Definitions, Measures, and Contributing Factors. American journal of kidney diseases : the official journal of the National Kidney Foundation. 2008;52(2):353-65.3. Goedendorp MM, Hoitsma AJ, Bloot L, Bleijenberg G, Knoop H. Severe fatigue after kidney transplantation: a highly prevalent, disabling and multifactorial symptom. Transpl Int. 2013;26(10):1007-15.4. Chan W, Bosch JA, Jones D, Kaur O, Inston N, Moore S, et al. Predictors and Consequences of Fatigue in Prevalent Kidney Transplant Recipients. Transplantation. 2013;96(11):987-94.5. Rodrigue JR, Mandelbrot DA, Hanto DW, Johnson SR, Karp SJ, Pavlakis M. A cross-sectional study of fatigue and sleep quality before and after kidney transplantation. Clinical Transplantation. 2011;25(1):E13-E21.6. Davis MP, Walsh D. Mechanisms of fatigue. J Support Oncol. 2010;8(4):164-74.7. Kent-Braun JA. Central and peripheral contributions to muscle fatigue in humans during sustained maximal effort. Eur J Appl Physiol Occup Physiol. 1999;80(1):57-63.8. Schillings ML, Hoefsloot W, Stegeman DF, Zwarts MJ. Relative contributions of central and peripheral factors to fatigue during a maximal sustained effort. Eur J Appl Physiol. 2003;90(5-6):562-8.
Chan, W., Bosch, J.A., Jones, D., McTernan, P.G., Inston, N., Moore, S., Kaur, O., Phillips, A.C., & Borrows, R. (2015 online). Cardiovascular, Muscular and Perceptual Contributions to Physical Fatigue in Prevalent Kidney Transplant Recipients. Transplant International, IF 2.60 http://dx.doi.org/10.1111/tri.12727
9. Wust RC, Degens H. Factors contributing to muscle wasting and dysfunction in COPD patients. Int J Chron Obstruct Pulmon Dis. 2007;2(3):289-300.10. Neil SE, Klika RJ, Garland SJ, McKenzie DC, Campbell KL. Cardiorespiratory and neuromuscular deconditioning in fatigued and non-fatigued breast cancer survivors. Support Care Cancer. 2013;21(3):873-81.11. Chaudhuri A, Behan PO. Fatigue in neurological disorders. Lancet. 2004;363(9413):978-88.12. Marcora SM, Staiano W, Manning V. Mental fatigue impairs physical performance in humans. J Appl Physiol. 2009;106(3):857-64.13. Pageaux B, Marcora SM, Lepers R. Prolonged Mental Exertion Does Not Alter Neuromuscular Function of the Knee Extensors Med Sci Sports Exerc. 2013;45(12):2254-64.14. Yoon T, Keller ML, De-Lap BS, Harkins A, Lepers R, Hunter SK. Sex differences in response to cognitive stress during a fatiguing contraction. J Appl Physiol. 2009;107(5):1486-96.15. Lin JM, Brimmer D, Maloney E, Nyarko E, BeLue R, Reeves W. Further validation of the Multidimensional Fatigue Inventory in a US adult population sample. Population Health Metrics. 2009;7(1):18.16. Albanese CV, Diessel E, Genant HK. Clinical applications of body composition measurements using DXA. J Clin Densitom. 2003;6(2):75-85.17. Visser M, Fuerst T, Lang T, Salamone L, Harris TB. Validity of fan-beam dual-energy X-ray absorptiometry for measuring fat-free mass and leg muscle mass. Health, Aging, and Body Composition Study--Dual-Energy X-ray Absorptiometry and Body Composition Working Group. J Appl Physiol. 1985;87(4):1513-20.18. Rittweger J, Schiessl H, Felsenberg D, Runge M. Reproducibility of the jumping mechanography as a test of mechanical power output in physically competent adult and elderly subjects. J Am Geriatr Soc. 2004;52(1):128-31.19. Dionyssiotis Y, Galanos A, Michas G, Trovas G, Lyritis GP. Assessment of musculoskeletal system in women with jumping mechanography. Int J Womens Health. 2010;1:113-8.20. Ward KA, Das G, Berry JL, Roberts SA, Rawer R, Adams JE, et al. Vitamin D status and muscle function in post-menarchal adolescent girls. J Clin Endocrinol Metab. 2009;94(2):559-63.21. Veilleux LN, Rauch F. Reproducibility of jumping mechanography in healthy children and adults. J Musculoskelet Neuronal Interact. 2010;10(4):256-66.22. Caserotti P, Aagaard P, Simonsen EB, Puggaard L. Contraction-specific differences in maximal muscle power during stretch-shortening cycle movements in elderly males and females. Eur J Appl Physiol. 2001;84(3):206-12.23. Fricke O, Weidler J, Tutlewski B, Schoenau E. Mechanography--a new device for the assessment of muscle function in pediatrics. Pediatr Res. 2006;59(1):46-9.24. Matheson LA, Duffy S, Maroof A, Gibbons R, Duffy C, Roth J. Intra- and inter-rater reliability of jumping mechanography muscle function assessments. J Musculoskelet Neuronal Interact. 2013;13(4):480-6.25. Robergs AR, Landwehr R. The surprising history of the “HRmax=220-age” equation. Journal of Exercise Physiology Online: Official Journal of The American Society of Exercise Physiologists (ASEP). 2002;5(2):1-10.26. Inbar O, Oren A, Scheinowitz M, Rotstein A, Dlin R, Casaburi R. Normal cardiopulmonary responses during incremental exercise in 20- to 70-yr-old men. Med Sci Sports Exerc. 1994;26(5):538-46.27. Astrand PO, Ryhming I. A nomogram for calculation of aerobic capacity (physical fitness) from pulse rate during sub-maximal work. J Appl Physiol. 1954;7(2):218-21.28. Borg G. Borg's Perceived Exertion and Pain Scales. Human Kinetics. 1998;Chapter 1-13:2-91.29. Whipp BJ, Higgenbotham MB, Cobb FC. Estimating exercise stroke volume from asymptotic oxygen pulse in humans. J Appl Physiol. 1985;81(6):2674-9.30. Borg G. Borg's Perceived Exertion and Pain Scales. Human Kinetics. 1998;Appendix(Scales and Instructions):Borg's RPE Scale Instructions.

Chan, W., Bosch, J.A., Jones, D., McTernan, P.G., Inston, N., Moore, S., Kaur, O., Phillips, A.C., & Borrows, R. (2015 online). Cardiovascular, Muscular and Perceptual Contributions to Physical Fatigue in Prevalent Kidney Transplant Recipients. Transplant International, IF 2.60 http://dx.doi.org/10.1111/tri.12727
31. Brown LF, Kroenke K, Theobald DE, Wu J. Comparison of SF-36 vitality scale and Fatigue Symptom Inventory in assessing cancer-related fatigue. Supportive Care in Cancer. 2011;19(8):1255-9.32. Levey AS, Coresh J, Greene T, Marsh J, Stevens LA, Kusek JW, et al. Expressing the Modification of Diet in Renal Disease Study Equation for Estimating Glomerular Filtration Rate with Standardized Serum Creatinine Values. Clinical Chemistry. 2007;53(4):766-72.33. Miskulin DC, Athienites NV, Yan G, Martin AA, Ornt DB, Kusek JW, et al. Comorbidity assessment using the Index of Coexistent Diseases in a multicenter clinical trial. Kidney Int. 2001;60(4):1498-510.34. Marcora SM, Staiano W. The limit to exercise tolerance in humans: mind over muscle? Eur J Appl Physiol. 2010;109(4):763-70.35. Goedendorp MM, Tack CJ, Steggink E, Bloot L, Bazelmans E, Knoop H. Chronic fatigue in type 1 diabetes: highly prevalent but not explained by hyperglycaemia or glucose variability. Diabetes Care. 2014;37(1):73-80.36. Cook DB, Nagelkirk PR, Peckerman A, Poluri A, Lamanca JJ, Natelson BH. Perceived exertion in fatiguing illness: civilians with chronic fatigue syndrome. Med Sci Sports Exerc. 2003;35(4):563-8.37. van den Ham EC, Kooman JP, Schols AM, Nieman FH, Does JD, Franssen FM, et al. Similarities in skeletal muscle strength and exercise capacity between renal transplant and hemodialysis patients. Am J Transplant. 2005;5(8):1957-65.38. Painter PL, Hector L, Ray K, Lynes L, Dibble S, Paul SM, et al. A randomized trial of exercise training after renal transplantation. Transplantation. 2002;74(1):42-8.39. Oliveira RB, Myers J, Araújo CGS, Abella J, Mandic S, Froelicher V. Maximal exercise oxygen pulse as a predictor of mortality among male veterans referred for exercise testing. European Journal of Cardiovascular Prevention & Rehabilitation. 2009;16(3):358-64.40. Oliveira RB, Myers J, Araújo CGSde. Long-term stability of the oxygen pulse curve during maximal exercise. Clinics (Sao Paulo). 2011;66(2):203-9.41. Tanaka H, Monahan KD, Seals DR. Age-predicted maximal heart rate revisited. J Am Coll Cardiol. 2001;37(1):153-6.42. Laukkanen JA, Kurl S, Salonen JT, Lakka TA, Rauramaa R. Peak oxygen pulse during exercise as a predictor for coronary heart disease and all cause death. Heart. 2006;92(9):1219-24.43. Orazio LK, Isbel NM, Armstrong KA, Tarnarskyj J, Johnson DW, Hale RE, et al. Evaluation of Dietetic Advice for Modification of Cardiovascular Disease Risk Factors in Renal Transplant Recipients. Journal of renal nutrition : the official journal of the Council on Renal Nutrition of the National Kidney Foundation. 2011;21(6):462-71.44. Painter PL, Topp KS, Krasnoff JB, Adey D, Strasner A, Tomlanovich S, et al. Health-related fitness and quality of life following steroid withdrawal in renal transplant recipients. Kidney Int. 2003;63(6):2309-16.45. Wright RA. Refining the prediction of effort: Brehm’s distinction between potential motivation and motivation intensity. Soc Pers Psychol Compass. 2008;2:682–701.46. Wright RA, Junious TR, Neal C, Avello A, Graham C, Herrmann L, et al. Mental fatigue influence on effort-related cardiovascular response: difficulty effects and extension across cognitive performance domains. Motiv Emot. 2007;31(3):219-31.47. Wright RA, Stewart CC, Barnett BR. Mental fatigue influence on effort-related cardiovascular response: extension across the regulatory (inhibitory)/non-regulatory performance dimension. Int J Psychophysiol. 2008;69(2):127-33.48. Williams TJ, McKenna MJ. Exercise Limitation Following Transplantation. Comprehensive Physiology: John Wiley & Sons, Inc.; 2012.49. Petersen AC, Leikis MJ, McMahon LP, Kent AB, Murphy KT, Gong X, et al. Impaired exercise performance and muscle Na(+),K(+)-pump activity in renal transplantation and haemodialysis patients. Nephrol Dial Transplant. 2012;27(5):2036-43.

Chan, W., Bosch, J.A., Jones, D., McTernan, P.G., Inston, N., Moore, S., Kaur, O., Phillips, A.C., & Borrows, R. (2015 online). Cardiovascular, Muscular and Perceptual Contributions to Physical Fatigue in Prevalent Kidney Transplant Recipients. Transplant International, IF 2.60 http://dx.doi.org/10.1111/tri.12727
50. Crawford JR, Henry JD, Crombie C, Taylor EP. Normative data for the HADS from a large non-clinical sample. Br J Clin Psychol. 2001;40(4):429-34.51. Morgan WP. Psychological components of effort sense. Med Sci Sports Exerc. 1994;26(9):1071-7.52. Knapen J, Vancampfort D, Raepsaet J, Probst M. Study on the Perceived Exertion during a Graded Exercise Test in Patients with Depressive and Anxiety Disorders International Journal of Psychosocial Rehabilitation. 2012;16(1):44-51.53. Podsakoff PM, MacKenzie SB, Lee J-Y, Podsakoff NP. Common method biases in behavioral research: A critical review of the literature and recommended remedies. Journal of Applied Psychology. 2003;88(5):879-903.54. Watson D, Pennebaker JW. Health complaints, stress, and distress: Exploring the central role of negative affectivity. Psychological Review. 1989;96(2):234-54.55. Rethorst CD, Wipfli BM, Landers DM. The antidepressive effects of exercise: a meta-analysis of randomized trials. Sports medicine (Auckland, NZ). 2009;39(6):491-511.56. Jayakody K, Gunadasa S, Hosker C. Exercise for anxiety disorders: systematic review. Br J Sports Med. 2014;48(3):187-96.57. Edmonds M, McGuire H, Price J. Exercise therapy for chronic fatigue syndrome. The Cochrane database of systematic reviews. 2004(3):CD003200.58. Steiner JL, Murphy EA, McClellan JL, Carmichael MD, Davis JM. Exercise training increases mitochondrial biogenesis in the brain. Journal of Applied Physiology. 2011;111(4):1066-71.59. O'Dowd H, Gladwell P, Rogers CA, Hollinghurst S, Gregory A. Cognitive behavioural therapy in chronic fatigue syndrome: a randomised controlled trial of an outpatient group programme. Health technology assessment (Winchester, England). 2006;10(37):iii-iv, ix-x, 1-121.60. Powell P, Bentall RP, Nye FJ, Edwards RH. Randomised controlled trial of patient education to encourage graded exercise in chronic fatigue syndrome. BMJ. 2001;322(7283):387-90.61. Fulcher KY, White PD. Randomised controlled trial of graded exercise in patients with the chronic fatigue syndrome. BMJ. 1997;314(7095):1647-52.62. Marin H, Menza MA. Specific treatment of residual fatigue in depressed patients. Psychiatry (Edgmont (Pa : Township)). 2004;1(2):12-8.63. Mohr DC, Hart SL, Goldberg A. Effects of treatment for depression on fatigue in multiple sclerosis. Psychosomatic medicine. 2003;65(4):542-7.64. Britton A, Singh-Manoux A, Marmot M. Alcohol Consumption and Cognitive Function in the Whitehall II Study. American Journal of Epidemiology. 2004;160(3):240-7.65. Arntzen KA, Schirmer H, Wilsgaard T, Mathiesen EB. Moderate wine consumption is associated with better cognitive test results: a 7 year follow up of 5033 subjects in the Tromso Study. Acta neurologica Scandinavica Supplementum. 2010(190):23-9.66. Tacca MC. Commonalities between Perception and Cognition. Frontiers in psychology. 2011;2:358.67. Kalmijn S, van Boxtel MPJ, Verschuren MWM, Jolles J, Launer LJ. Cigarette Smoking and Alcohol Consumption in Relation to Cognitive Performance in Middle Age. American Journal of Epidemiology. 2002;156(10):936-44.68. Singh-Manoux A, Britton AR, Marmot M. Vascular disease and cognitive function: evidence from the Whitehall II Study. J Am Geriatr Soc. 2003;51(10):1445-50.69. Alessandri B, Rice AC, Levasseur J, DeFord M, Hamm RJ, Bullock MR. Cyclosporin A improves brain tissue oxygen consumption and learning/memory performance after lateral fluid percussion injury in rats. J Neurotrauma. 2002;19(7):829-41.

Chan, W., Bosch, J.A., Jones, D., McTernan, P.G., Inston, N., Moore, S., Kaur, O., Phillips, A.C., & Borrows, R. (2015 online). Cardiovascular, Muscular and Perceptual Contributions to Physical Fatigue in Prevalent Kidney Transplant Recipients. Transplant International, IF 2.60 http://dx.doi.org/10.1111/tri.12727
Table Legends
Table 1. Inclusion and Exclusion Criteria
Table 2. Population Characteristics for Kidney Transplant Recipients (KTRs) and
Healthy Subjects (Control Group)
Table 3. Measurements of Physical and Mental Fatigue, Quality of Life, and
Potential Predictors of Physical Fatigue in Kidney Transplant Recipients
(KTRs) and Healthy Subjects (Control Group)
Table 4. Predictors for Mechanistic Aetiology of Physical Fatigue in Kidney
Transplant Recipients (KTRs)
Table 5. Predictors of Rating of Perceived Exertion Index (RPEindex) in Kidney
Transplant Recipients (KTRs)

Chan, W., Bosch, J.A., Jones, D., McTernan, P.G., Inston, N., Moore, S., Kaur, O., Phillips, A.C., & Borrows, R. (2015 online). Cardiovascular, Muscular and Perceptual Contributions to Physical Fatigue in Prevalent Kidney Transplant Recipients. Transplant International, IF 2.60 http://dx.doi.org/10.1111/tri.12727

31
Table 1. Inclusion and Exclusion Criteria
Inclusion Criteria
KTRs beyond 1 year post-transplantation
Stable graft function (<10% increase in serum creatinine over the preceding 6 months)
Exclusion Criteria
Inability to provide written informed consent
Episodes of acute rejection within the last 6 months
Evidence of sepsis in the last 6 weeks
Known active malignancy or chronic infection
History of thyroid disease of adrenal insufficiency
Evidence of unstable angina (occurring at rest, severe and of new onset, or crescendo pattern)
Evidence of acute coronary syndrome in the last 6 months
Moderate or severe aortic stenosis (mean transvalvular gradient of >25mmHg or valve area of <1.5cm2 on
echocardiogram)
Immobility
Pregnancy

32
Table 2. Population Characteristics for Kidney Transplant Recipients (KTRs) and Healthy Subjects (Control Group)
Demographic parameters KTRs Control Group P-value
Sample size n = 55 n = 41 n/a
Gender (%) Male = 57Female = 43
Male = 56Female = 44
1.00 a
†Mean age (years) 46 ± 14 48 ± 12 0.94b
Marital status (%) Single = 22Married = 67Divorced/Widowed = 11
Single = 20Married = 68Divorced/Widowed = 12
0.95c
Ethnicity (%) Caucasian = 80Asian = 13Afro-Caribbean = 5Others = 2
Caucasian = 82Asian = 12Afro-Caribbean = 6Others = 0
1.00 a,d
‡Median time post-transplantation (years) 2 (1-7) n/a n/a
Co-morbidity and clinical parameters KTRs Control Group P-value
‡Median ICED 2 (2-2) n/a n/a
Presence of diabetes (%) Non-diabetic = 73NODAT = 14Pre-DM = 13
Non-diabetic = 100NODAT = n/aPre-DM = n/a
n/an/an/a
Previous episodes of acute rejection (%) 7 n/a n/a
Use of beta-adrenergic blocker (%) 4 0 n/a
Immunosuppressive medication usage:Calcineurin inhibitor (%)Adjunctive antiproliferative agent (%)Prednisolone (%)
938786
n/an/an/a
n/an/an/a
Dosage of immunosuppressive medications:†Mean dose of tacrolimus (mg/day)†Mean dose of cyclosporine (mg/day)†Mean dose of mycophenolate mofetil (mg/day)†Mean dose of azathioprine (mg/day)‡Median dose of prednisolone (mg/day)
5.8 ± 3.2184 ± 471147 ± 45685 ± 365.3 (5.0-5.0)
n/an/an/an/an/a
n/an/an/an/an/a
Psychosocial & behavioural parameters KTRs Control Group P-value
Smoking status (%) Non-smoker = 60Current smoker = 11Ex-smoker = 29
Non-smoker = 62Current smoker = 8Ex-smoker = 30
0.83c
‡Median alcohol intake (units/week) 2 (0-3) 3 (1-4) 0.32b
†Mean anxiety score (HADS score) 8 ± 5 4 ± 3 0.002e
‡Median depression score (HADS score) 4 (1-6) 2 (1-3) 0.004e
†Mean sleep quality score (PSQI global score) 6 ± 3 4 ± 3 0.001e
Biochemical profile KTRs Control Group P-value
‡Median hsCRP (mg/l) 1.67 (0.61-3.96) 0.92 (0.49-2.14) 0.01b
†Mean Hb (g/dl) 12.6 ± 1.5 14.0 ± 1.4 0.17b
†Mean eGFR (ml/min) 49.4 ± 12.9 82.2 ± 11.7 <0.001b
†Normally distributed data, results expressed as mean ± standard deviation (SD). ‡Non-normally distributed data, results expressed as median (interquartile range, IQR).aFisher’s exact test was used to test statistical differences between 2 groups on categorical variables. bIndependent sample t-test was used to test statistical differences between 2 groups on the continuous variable. cChi-square test was used to test statistical differences between 2 groups on the categorical variables. dFor the purpose of statistical analysis using Fisher’s exact test, “Asian”, “Afro-Caribbean” and “Others” were grouped as “Non-Caucasian”. eMann-Whitney U test was used to test statistical differences between 2 groups on the ordinal variable.

33
Abbreviations: KTRs=kidney transplant recipients; ICED=index of co-existing disease; NODAT=new onset diabetes after transplantation; Pre-DM=pre-existing diabetes mellitus; HADS=hospital anxiety and depression scale; PSQI=Pittsburgh sleep quality index; hsCRP=high-sensitivity c-reactive protein; Hb=haemoglobin; eGFR=estimated glomerular filtration rate.

34
Table 3. Measurements of Physical and Mental Fatigue, Quality of Life, and Potential Predictors of Physical Fatigue in Kidney Transplant Recipients (KTRs) and Healthy Subjects (Control Group)
Physical fatigue KTRs Control Group P-value
†Mean MFI-20 scoreMFI-20 score ≥95th percentile for general population* (%)
10 ± 422
6 ± 33
<0.001a
0.006a
Mental fatigue KTRs Control Group P-value
†Mean MFI-20 scoreMFI-20 score ≥95th percentile for general population* (%)
10 ± 520
7 ± 35
0.78a
0.18a
Quality of Life KTRs Control Group P-value
†Mean total score†Mean physical health summary score†Mean mental health summary score
77 ± 1873 ± 2077 ± 18
88 ± 1085 ± 1187 ± 9
0.01a
<0.001a
0.03a
Body composition (DEXA measurements) KTRs Control Group P-valueAll Male Female All Male Female All Male Female
†Mean LTM (kg)†Mean LTM adjusted to Ht2 (kg/m2)†Mean LLTM (kg)†Mean LLTM adjusted to Ht2 (kg/m2)†Mean FM (kg)
50.7 ± 11.517.5 ± 2.516.0 ± 3.75.5 ± 0.926.1 ± 2.4
58.0 ± 9.618.7 ± 2.418.1 ± 3.15.8 ± 0.825.9 ± 2.3
41.2 ± 4.915.8 ± 1.613.4 ± 2.45.0 ± 0.826.1 ± 2.6
52.3 ± 9.717.8 ± 2.317.0 ± 3.15.7 ± 0.924.0 ± 2.1
57.9 ± 7.418.6 ± 1.718.8 ± 2.66.1 ± 0.722.9 ± 2.1
44.8 ± 7.016.7 ± 2.614.4 ± 3.05.4 ± 1.124.9 ± 2.2
0.11b
0.63b
0.21b
0.22b
0.26b
0.31b
0.81b
0.78b
0.22b
0.04b
0.11b
0.18b
0.19b
0.21b
0.67b
Jumping mechanography KTRs Control Group P-valueAll Male Female All Male Female All Male Female
†Mean muscle power from CMJ (W)†Mean muscle power per BM from CMJ (W/kg)†Mean muscle power per LLTM from CMJ (W/kg)
2641 ± 75635 ± 7169 ± 31
3008 ± 72737 ± 8172 ± 33
2171 ± 49332 ± 6166 ± 29
2962 ± 72740 ± 7170 ± 30
3567 ± 74547 ± 6177 ± 25
2397 ± 52336 ± 7160 ± 30
0.12b
0.10b
0.45b
0.06b
0.03b
0.42b
0.31b
0.25b
0.41b
Incremental submaximal exercise test KTRs Control Group P-valueAll Male Female All Male Female All Male Female
†Mean VO2max (ml/min/kg)†Mean O2 Pulse (ml/beat)†Mean O2 Pulse (ml/beat/kg BM)†Mean O2 Pulse (ml/beat/kg LTM)
27.7 ± 10.416.8 ± 5.80.22 ± 0.070.35 ± 0.14
31.1 ± 10.721.6 ± 7.40.26 ± 0.080.38 ± 0.13
22.4 ± 5.512.0 ± 4.20.18 ± 0.060.30 ± 0.14
30.2 ± 8.120.1 ± 5.40.26 ± 0.070.40 ± 0.08
35.0 ± 8.224.5 ± 5.50.30 ± 0.060.42 ± 0.07
27.2 ± 6.717.2 ± 5.50.24 ± 0.070.38 ± 0.09
0.13b
0.18b
0.20b
0.22b
0.15b
0.26b
0.21b
0.29b
0.02b
0.03b
0.04b
<0.001b
Borg scale KTRs Control Group P-valueAll Male Female All Male Female All Male Female
†Mean RPEindex 1.0 ± 0.3 0.9 ± 0.3 1.0 ± 0.2 0.8 ± 0.2 0.7 ± 0.2 0.8 ± 0.2 0.001b 0.001b 0.002b
†Normally distributed data, results expressed as mean ± standard deviation (SD). *Established definition of physical fatigue: ≥95 th percentile for general population reported by Lin et al (4, 15).aMann-Whitney U test was used to test statistical differences between 2 groups on the ordinal variable. bIndependent sample t-test was used to test statistical differences between 2 groups on the continuous variable.

35
Abbreviations: MFI-20=multi-dimensional fatigue inventory-20; DEXA=dual energy x-ray absorptiometry; LTM=lean tissue mass; Ht2=height squared; LLTM=lower limb lean tissue mass; FM=fat mass; CMJ=single two-legged counter movement jump; BM=total body mass; VO2max=estimated maximal oxygen consumption; O2 pulse =oxygen pulse; RPEindex=rating of perceived exertion index.

36
Table 4. Predictors for Mechanistic Aetiology of Physical Fatigue in Kidney Transplant Recipients (KTRs)
Univariate Analysis Multivariate analysis*Beta Coefficient, β (95% CI**)
p-value Beta Coefficient, β (95% CI**)
p-value
RPEindex 5.7 (2.2, 9.2) 0.001 5.4 (1.6, 9.3) 0.001
VO2max (ml/min/kg) ***-0.1 (-0.2, 0.0) 0.09 -0.1 (-0.2, 0.1) 0.43
O2 Pulse (ml/beat) ***3.5 (-4.1, 11.2) 0.21
O2 Pulse (ml/beat/kg BM) ***2.5 (-2.7, 11.4) 0.20
O2 Pulse (ml/beat/kg LTM) ***4.7 (-3.1, 12.6) 0.23
LTM adjusted to Ht2 (kg/m2) 0.1 (-0.4, 0.5) 0.75
LLTM adjusted to Ht2 (kg/m2) -0.4 (-1.6, 0.8) 0.48
‡CMJ, absolute power (W) -0.1 (-0.2, 0.1) 0.33
†CMJ, power per BM (W/kg) -0.1 (-0.2, 0.1) 0.31
†CMJ, power per LLTM (W/kg) -0.1 (-0.3, 0.1) 0.28
R2 value from the fully adjusted multivariate model 28%*Results in the fully adjusted multivariate regression model were presented. **CI = Confidence Interval.***Association adjusted for usage of beta-blockers.†Coefficients reported for a 10-unit increase in explanatory variable.‡Coefficients reported for a 100-unit increase in explanatory variable.Abbreviations: RPEindex=rating of perceived exertion index; VO2max=estimated maximal oxygen consumption; O2 pulse=oxygen pulse; BM=total body mass; LTM=lean tissue mass; Ht2=height squared; LLTM=lower limb lean tissue mass; CMJ=single two-legged counter movement jump.

37
Table 5. Predictors of Rating of Perceived Exertion Index (RPEindex) in Kidney Transplant Recipients (KTRs)
Univariate Analysis Multivariate Analysis*Beta Coefficient, β(95% CI**)
p-value Beta Coefficient, β(95% CI**)
p-value
Presence of diabetesNon-diabeticNODATPre-DM
00.3 (0.0, 0.5)0.6 (-0.2, 1.4)
0.02 00.2 (0.0, 0.5)0.2 (-0.0, 0.5)
0.04
Use of calcineurin inhibitorNoneCyclosporineTacrolimus
0-0.3 (-0.5, -0.1)-0.1 (-0.3, 0.2)
0.03 0-0.4 (-0.6, -0.2)-0.0 (-0.3, 0.3)
0.03
†Mental fatigue (MFI-20 score) 0.3 (0.1, 0.5) 0.04 0.5 (0.1, 0.9) 0.03†Anxiety (HADS score) 0.5 (0.1, 0.8) 0.04 0.4 (0.1, 0.7) 0.04†Alcohol intake (units per week) -0.4 (-1.1, -0.0) 0.04 -0.6 (-1.1, -0.1) 0.03†Age (years) 0.1 (0.0, 0.2) 0.04 0.1 (-0.1, 0.2) 0.21†Depression (HADS score) 0.5 (0.0, 0.1) 0.05 0.1 (-0.2, 0.5) 0.37Use of prednisoloneNoYes
0-0.4 (-0.9, 0.1)
0.10 0-0.1 (-0.3, 0.1) 0.25
Co-morbidity (ICED score) 0.9 (-0.4, 2.2) 0.18 0.1 (-0.5, 0.6) 0.35Previous episodes of acute rejectionNoYes
0-0.4 (-1.1, 0.2)
0.20
Time post transplantation (years) 0.1 (-0.2, 0.4) 0.35Marital statusMarriedSingleDivorced / Widowed
00.2 (-0.6, 0.2)-0.0 (-0.2, 0.1)
0.46
***EthnicityCaucasian†Non-Caucasian
00.4 (-0.2, 3.8)
0.48
GenderFemaleMale
00.1 (-0.2, 0.5)
0.51
†FM (kg) 0.1 (-0.2, 0.3) 0.55Smoking statusNever smoked†Ex-smokerCurrent smoker
00.5 (-1.6, 2.4)0.1 (-7.3, 7.6)
0.66
†Hb (g/dL) 0.3 (-0.9, 1.5) 0.66†PSQI (global score) 0.1 (-0.5, 0.6) 0.77†eGFR (mL/min) 0.0 (-0.1, 0.2) 0.82ℓhsCRP (mg/L) 0.0 (-0.3, 0.4) 0.94Use of adjunctive antiproliferative agentsNone†Mycophenolate mofetilAzathioprine
0-0.2 (-4.3, 0.4)0.0 (-0.3, 0.3)
0.98
†LTM (kg) 0.00 (-0.2, 0.2) 0.99R2 value from the fully adjusted multivariate model 38%
*Results in the fully adjusted multivariate regression model were presented. **CI = Confidence Interval. ***For the purpose of statistical analysis, the ethnicity of patients classified as “Afro-Caribbean”, “Asian” and “Others” was grouped as “Non-Caucasian”, 80% “Caucasian” versus 20% “Non-Caucasian”.†Coefficients reported for a 10-unit increase in explanatory variable. ℓVariable analysed on the log scale (base 10).Abbreviations: NODAT=new onset diabetes after transplantation; Pre-DM=pre-existing diabetes mellitus; MFI-20=multi-dimensional fatigue inventory-20; HADS=hospital anxiety and depression scale; ICED=index of co-existing disease; FM=fat mass; Hb=haemoglobin; PSQI=Pittsburgh sleep quality index; eGFR=estimated glomerular filtration rate; hsCRP=high-sensitivity C-reactive protein; LTM=lean tissue mass.

38
Figure Legends
Figure 1a: An Example of Linear Regression for Estimation of Maximal Oxygen
Consumption (VO2max)
Figure 1b: An Example of Linear Regression for Estimation of Oxygen Pulse (O2
Pulse)
Figure 2: Comparison of Rating of Perceived Exertion Index (RPEindex) between
Healthy Subjects (Control Group) and Kidney Transplant Recipients
(KTRs)
Figure 3: Association between Physical Fatigue and Rating of Perceived Exertion
Index (RPEindex) in Kidney Transplant Recipients (KTRs)
Figure 4: Association between Physical Fatigue and Maximal Oxygen Consumption
(VO2max) in Kidney Transplant Recipients (KTRs)
Figure 5: Comparison of Physical Fatigue Scores between Healthy Subjects (Control
Group) and Kidney Transplant Recipients (KTRs)
Figure 6a: Association between Physical Fatigue and Quality of Life (QoL) in Kidney
Transplant Recipients (KTRs) ~ All Subscales
Figure 6b: Association between Physical Fatigue and Quality of Life (QoL) in Kidney
Transplant Recipients (KTRs) ~ Excluding “Energy & Vitality” Subscale
39

40

41

42

43
Top Related