


Languages
Pages
Legal


Puget Sound Shoreline Parcel Owner Characteristics
Prepared for: WA Department of Fish and Wildlife and WA State Department of Natural
Resources Prepared by: Futurewise
Prepared as part of the project: Social Marketing to Reduce Shoreline Armor

Puget Sound Shoreline Parcel Owner Characteristics (Deliverable 2B) Page 2

Puget Sound Shoreline Parcel Owner Characteristics (Deliverable 2B) Page 3
Table of Contents
Tables and Figures ........................................................................................................................................ 4
Key Findings .................................................................................................................................................. 7
Project Background ....................................................................................................................................... 8
Methods ........................................................................................................................................................ 9
Identifying owner entity type and owner occupancy ............................................................................. 11
Owner occupancy .................................................................................................................................... 12
Matching with voter database ................................................................................................................ 13
Multiple parcels owned by landowners .................................................................................................. 13
Results ......................................................................................................................................................... 14
Owner type .............................................................................................................................................. 14
Where property owners live ................................................................................................................... 15
Owner occupancy ................................................................................................................................ 15
Where owners live: In-State ............................................................................................................... 20
Where owners live: Out-of-state and international ........................................................................... 22
Age of property owners .......................................................................................................................... 25
Voting activity .......................................................................................................................................... 27
Length of residence ................................................................................................................................. 29
In-county owners ................................................................................................................................. 29
Out-of-county owners ......................................................................................................................... 31
Year that property improvement was built or renovated....................................................................... 33
Parcel market value ................................................................................................................................. 35
Size of parcels .......................................................................................................................................... 37
Appendix 1. Data tables ............................................................................................................................. 39

Puget Sound Shoreline Parcel Owner Characteristics (Deliverable 2B) Page 4
Tables and Figures
Table 1. Parcel Segments ............................................................................................................................. 9
Figure 1. Percentage of parcels held in trusts ............................................................................................ 14
Figure 2. Percentage owner occupied parcels, by parcel segment ........................................................... 15
Figure 3. Owners who live near their shoreline parcel .............................................................................. 16
Figure 4. Owners who live in same county as their shoreline parcel ........................................................ 16
Figure 5A. Owners who live in different county, out of state or out of country, by parcel segment ........ 17
Figure 5B. Owners who live in different county, out of state or out of country, by parcel county ........... 18
Figure 6A. Percentage owner occupied parcels, by county ....................................................................... 18
Figure 6B. Percentage owner occupied parcels, by county ....................................................................... 19
Figure 7. Out of State owners .................................................................................................................... 19
Figure 8A. Out-of-county owner locations (1) ........................................................................................... 20
Figure 8B. Out-of-county owner locations (2) ............................................................................................ 21
Figure 9. Where Seattle and East King County residents own homes (outside of King Co) ...................... 21
Figure 10A. Out of state owners (1) ........................................................................................................... 22
Figure 10B. Out of state owners (2) ........................................................................................................... 23
Figure 11. Canadian owners ....................................................................................................................... 23
Figure 12. Non-Canadian international owners ......................................................................................... 24
Figure 13. Age of owners ........................................................................................................................... 25
Figure 14. Age of owners: owner-occupied parcels .................................................................................. 25
Figure 15. 60-69 and 70-79 year old shoreline parcel owners .................................................................. 26
Figure 16. Parcel owner age distribution by parcel county: owner occupied parcels. ............................. 27
Figure 17. Voting activity by shoreline property owners ........................................................................... 27
Figure 18. Voting activity within the most recent year .............................................................................. 28
Figure 19. Comparison of shoreline parcel owner voting activity with King Co and WA .......................... 29
Figure 20. Minimum length of residence: same county as shoreline parcel ............................................ 30
Figure 21. Minimum length of residence: same county as shoreline parcel (by county) ......................... 30
Figure 22. Minimum length of residence: owner occupied parcels (by county) ...................................... 31
Figure 23A Minimum length of residence: out-of-county owners ........................................................... 32
Figure 23B. Minimum length of residence: out-of-county owners compared with in-county and owners
who live at their property ........................................................................................................................... 32
Puget Sound Shoreline Parcel Owner Characteristics (Deliverable 2B) Page 5
Figure 24. Minimum length of residence: out-of-county owners (by parcel county)............................... 33
Figure 25. Year improvement renovated or built ...................................................................................... 34
Figure 26. Year improvement renovated or built in 1991-2000 and 2001-2011, by county ..................... 34
Figure 27. Market value of improvements ................................................................................................ 35
Figure 28. Market value of improvements and land (total value) ............................................................. 36
Figure 29A. Mason County: Market value of improvements and land (total value) ................................. 36
Figure 29B. San Juan County: Market value of improvements and land (total value) .............................. 37
Figure 30. Size of parcels ............................................................................................................................ 37
Figure 31. Size of parcels, by county .......................................................................................................... 38
Figure 32. Comparison of homes and armor with parcel size ................................................................... 38

Puget Sound Shoreline Parcel Owner Characteristics (Deliverable 2B) Page 6
Puget Sound Shoreline Parcel Owner Characteristics (Deliverable 2B) Page 7
Key Findings
From an analysis of 2012 Washington State parcel database as well as information from WA Statewide
Voter Registration Database, the following key findings were determined for characteristics of owners of
residential shoreline parcels in Puget Sound:
About 1/5 of the parcels are held in legal structures such as trusts or living estates. 20.4% of
shoreline residential parcels are held in a legal structure such as a trust or living estate rather than owned
directly by individuals. The highest rate of this type of legal structure ownership is in San Juan County (37.5%
of the parcels in the county) and the lowest rate is in King County (7.3%).
About 40% of all parcels are owner occupied; about 46% of parcels with homes are owner
occupied. Between 38.5 and 41.5 % of all shoreline residential parcels are owner occupied, with the highest
rate of owner occupancy for parcels with homes with armor and no erosion risk (parcel segment 7). Thurston
County has the highest owner occupancy rate (61% of all parcels, 71% of parcels with homes) while San Juan
and Mason counties have the lowest rates.
22% of the parcels are owned by persons living elsewhere in county, 30% in WA, 9% outside WA.
Beyond the 39.5% of owner-occupied parcels, 22% of shoreline parcels are owned by residents who reside
elsewhere in the county, 30% live in a different county, 8% live out of state (3,602 parcels) and 1% live outside
the US (437 parcels). Of the parcels owned by residents with international addresses, the bulk are Canadian.
Seattle (8.9%) and east King County (5.6%) residents own the most out-of county shoreline
parcels. Seattle and east King County residents own their shoreline homes at highest rates in Island and San
Juan counties.
Shoreline property owners are seniors (largest number 60-69 years old). From voter information, we
determined that the largest percentage of shoreline residential parcels are owned by persons in the 60-69 age
range, followed by the 70-79 age range. This figure is relatively consistent across parcel counties for the 60-69
age bracket but more variable for 70-79 year old owners with highest number of parcels owned by this age
range in Skagit, Clallam, and San Juan counties.
Shoreline property owners are highly active voters. The cumulative record of these currently registered
property owners shows that that 96.2% most recently voted in the November 2012 general election or later,
which is a much higher percentage than Washington statewide voters in the same time frame at 79.7%.
Out-of-county owners have lived in their counties longer than in-county owners. Property owners
who live in the same county as their shoreline parcel have lived there for fewer years than those who own
shoreline parcels located in other counties. In addition, an average of about 12.5% of parcels had new
improvements (likely homes) constructed in each of these time periods: 1981-1990, 1991-2000, 2001-2012.
This implies that people have moved to (retired to?) their shoreline parcels or new residents have purchased
shoreline parcels in these counties in recent years.
The value (land and improvements) of most parcels is in the range $100,000 to $400,000. The value
ranges varies greatly from county to county. San Juan County had the largest percentage of highest value
homes with 8% of their homes valued over $800,000.
Smaller parcels with homes are more likely to have armor than larger parcels and this trend
increases with larger parcels. Parcels of 1 acre or less (parcel size based on tax assessor records) with
homes are more likely to have armor compared to parcels that are greater than 1 acre. This trend of parcels
less likely to have armor generally increases with larger parcel size.

Puget Sound Shoreline Parcel Owner Characteristics (Deliverable 2B) Page 8
Project Background
The Puget Sound Marine & Nearshore Grant Program, co-led by Washington Departments of Fish and Wildlife and Natural Resources, funded this project with the goal of reducing the total amount of traditional “hard” armor along Puget Sound marine shorelines. This can be accomplished by a combination of reducing new armor and removing existing armor. Hard armor refers to structures placed on the upper beach and at the toe of bluffs typically to reduce erosion, and is referred to using a variety of terms in the Puget Sound region, including the terms bulkhead, seawall, revetment, and rockery. Armor has been associated with numerous negative impacts to the Puget Sound nearshore. The Social Marketing Strategy to Reduce Puget Sound Shoreline Armoring project describes how we can overcome barriers and motivate residential landowners to voluntarily choose alternatives to hard armor. This project team has used social marketing principles to research and design a program that will help reduce the amount of hard armor along Puget Sound marine shorelines. It resulted in:
- A Sound-wide GIS database of residential marine shore properties, including audience segmentation based on shore characteristics, and prioritization based on high value shoreforms and habitats with documented ecological impacts from shore hardening
- Descriptions of priority segments in terms of size, demographics and additional parcel data - Desired audience behaviors for each segment - Prioritized list of barriers and motivations for each desired armoring behavior - Social marketing strategies and interventions to encourage the desired behaviors - Toolkit for stakeholders to use in implementing social marketing campaigns in Puget Sound - Detailed evaluation plan and report that details all project findings
The goal for this project is to create a social marketing behavior change strategy designed to influence priority segments of residential shoreline landowners to make behavior changes related to shore armor in order to achieve grant program goals. The strategy will focus on realistic approaches that use research-based incentives to overcome the specific barriers to reducing shore armor among key target audience segments.
Funding statement: This project has been funded wholly or in part by the United States Environmental
Protection Agency under assistance agreement PC 00J29801 to Washington Department of Fish and
Wildlife. The contents of this document do not necessarily reflect the views and policies of the
Environmental Protection Agency, nor does mention of trade names or commercial products constitute
endorsement or recommendation for use.

Puget Sound Shoreline Parcel Owner Characteristics (Deliverable 2B) Page 9
Approach
The team first worked together to identify a set of nine initial target audience segments made up of
residential shoreline property owners, organized by the following shoreline parcel characteristics:
• Armor Status (does the parcel currently have hard armor?)
• Structure Status (does the parcel currently have a home on the property?)
• Erosion Potential (based on shoretype and wave energy considerations, does the parcel have no,
low, moderate, or high erosion potential?)
• Behavior objective (preserve unarmored condition OR remove armor where not necessary
Table 1 displays these parcel segments.
Table 1. Parcel Segments
AUDIENCE SEGMENTS DETERMINED BY PARCEL CHARACTERISTICS
ARMOR
STATUS:
NO ARMOR ARMOR
HOME ON
PROPERTY:
No Home Home No Home Home
EROSION POTENTIAL:
No Erosion
Potential
Low-Mod Hi Erosion Potential
No Erosion
Potential
Low-Mod- Hi Erosion
Potential
No Erosion
Potential
Low-Mod-Hi Erosion
Potential
No Erosion Potenti
al
Low-Mod
Erosion Potential
High Erosion
Potential
Segment number
designation:
Segment
1
Segment 2 Segment
3
Segment
4
Segment
5
Segment
6
Segment
7
Segment
8
Segment
9
Methods
Information about characteristics of shoreline property owners was drawn from the dataset provided in
the 2012 Washington State Parcel database (UW Database) as well as the Statewide Voter Registration
Database. The Statewide Voter Registration Database included voter information through August 2013.
The characteristics from the WA State Parcel database that were used in this analysis include:
Parcel number
Site address
Owner name
Owner address
Tax Owner Name
Tax Owner Address
Tax roll ID
Taxpayer Name ID
Source Parcel ID

Puget Sound Shoreline Parcel Owner Characteristics (Deliverable 2B) Page 10
Tax Account ID
Tabular Acres
Improved Acres
Unimproved Acres
State Land Use Code o 11 One single family household o 12 2-4 household units o 13 5 or more household units o 14 Residential hotel or condominium o 15 Mobile home courts or parks o 18 Structures on leased land p.p. on real o 19 Cabin o 74 Recreational activities (includes homes and parcels on which bulkheads are present) o 91 Undeveloped land o 93 Water areas (includes parcels designated as saltwater tidelands, bay/lagoon, etc.
which are locations on which armor could be or has been installed) o 94 Open space o 99 Other undeveloped land
Source Land Use Description
Tax Status
Market Value Total
Market Value Improvements
Market Value Land
Market Value Unimproved Land
Market Value Improved Land
Taxable Value Total
Taxable Value Improvements
Taxable Value Land
Taxable Value Unimproved Land
Taxable Value Improved Land
Year Built
Year Renovated
Improvement Type
We began the process to analyze parcel owner characteristics by doing a significant effort to “clean up”
the data provided in the 2012 Washington State parcel database. The sources of these data were
individual counties, much of it from their tax assessor parcel databases. Over many decades, these data
had been entered using different protocols (even within counties) and with numerous instances of
human error (spelling errors, typos, incorrect cities, etc.). In addition, many of the site addresses from
the UW dataset were missing city identification.
A large number of parcels in the database had no site addresses. This apparently reflects different
protocols in different counties for undeveloped parcels. In some counties, no address is assigned, in
some counties a vacant parcel is designated with a street but no number such as “XXX Elm Street,” and
in others a full street address is assigned. For the purposes of our assessment all parcels were assigned
a city based on the position of the parcel within drift cells. In order to make this determination, the
dataset was sorted by drift cell and parcel number and then a large number of parcels located in overlap

Puget Sound Shoreline Parcel Owner Characteristics (Deliverable 2B) Page 11
areas were spot checked by looking up the parcel in individual county tax assessor online parcel
databases.
Owner names and site and owner addresses were parced into unique fields in order to later compare
these with the voter data information. A small portion of the parcels had unknown ownership in the
UW dataset. All of these parcels were checked by accessing the individual county tax assessor online
parcel databases. Through this process, a few owner/addresses were updated with information. At a
minimum, a “city” identification for parcel site location was able to be determined through this process.
Twenty parcels remained with no ownership information.
Finally, in order to match the parcel dataset with the voter dataset, changes were made to abbreviations
and other ways that words were expressed (e.g., changing “IS” to “Island,” Pt to “Point”) so that the two
datasets would be comparable.
Identifying owner entity type and owner occupancy
In parsing the owner names, we were able to determine the type of ownership of the parcels based on
the legal name by which the taxes were paid as well as information in other fields in the UW dataset. As
a note, some of the owner names were truncated in the dataset and so this process may have resulted
in an underestimate of the number of properties in some of the categories. For example, the number of
parcels held in trusts may be an under estimate because the trust wording sometimes is located at the
end of an official owner name.
Owner names were generally incorporated into the database in the order in which they are listed on the
tax assessor records, which means that usually the male name is listed first when there are dual
male/female owners. In some counties, notably Snohomish County, a separate “tax owner” was listed
in addition to the property owner. These tax owners were incorporated into the database and used to
match with voter records as additional contacts. In some cases, the contact listed in the tax assessor
records are service providers such as attorneys, accountants, and bank staff. Most of these contacts
were screened out but a few were likely included because the information did not clearly highlight their
role. This inclusion was deemed acceptable because in comparing owner names to the voter database,
their professional addresses would not in most cases be their home address (assuming that home
addresses are usually used for voter registration).
The ownership “type” was identified for each parcel and then these parcels were grouped into the
categories which reflect the purpose of our project. Two categories (parcels owned by individual
owners or owned in a legal structure such as a trust, living estate, or holding) are the categories for
which our social marketing tools will be targeted and primarily includes parcels that are residential. The
other categories appear to include parcels that are residential but may also include those that are being
used for other purposes or are being used for both residence and commercial purposes (i.e., an at-home
business). Parcels that are categorized by the tax assessor as commercial or industrial were eliminated
from the database but for these remaining parcels, further study would be needed to fully assess the
actual use of the parcel.
The types of ownership were categorized as follows:
Government, Utilities and Railroads: This category includes owners that are listed as federal,
tribal, counties, cities, ports, school districts, park districts, railroads, water districts, utilities,
and universities (public). These parcels may have residences on them, may be undeveloped or
may have other structures on them.

Puget Sound Shoreline Parcel Owner Characteristics (Deliverable 2B) Page 12
Industries: This category includes owners that are listed as maritime (shellfish, marinas,
maritime construction), timber, and agricultural. These parcels may have residences on them,
may be undeveloped or may have other structures on them.
Non-profit: This category includes owners that are listed as scouts, land trusts, parks (private),
religious, and foundations. These parcels may have residences on them, may be undeveloped or
may have other structures on them.
Unknown: This category includes owners that are “unknown” in the county tax assessor
databases.
Associations and other: This category includes owners that are listed as associations, adjacent
lot owners, clubs, companies and corporations (not clearly industrial), resorts, and other
entities. These are parcels for which a residential use is possible. In some cases, the property
owner may use the parcel for an at-home business or other use.
Trusts and similar: This category includes owners that are listed as trusts, estates, LLCs, et. al.,
et. ux., et. vir., individual percentages, tenants in common, LLPs, LPs, partnerships, banks,
mortgage companies, investments, holdings, and similar entities. These are parcels for which
the ownership appears to be by groups of persons or individuals who have a legal structure for
that ownership other than direct ownership.
Individuals: This category includes owners that are listed as individual names (i.e., Joe and Mary
Smith).
Owner occupancy
In order to determine owner occupancy, the site address was compared with the owner address. From
this comparison, we were able to categorize parcel owners into the categories listed below. It should be
noted that, when tabulated, these determinations are the minimum number in some categories. In
other words, due to potential errors in the dataset (spelling errors, incorrect street numbers, street
name, or city name), the matches were imperfect:
Owner occupied
Nearby (address of owner is on the same street as the site address)
Same city
o Address of owner is in same city as site address
o PO Box listing for owner in the same city as site address. This category is differentiated
because many owners may live at the parcel but use a PO Box for mail.
Same county
Washington resident
Out of state resident
Out of country resident
Unknown owner address (Know or do not know owner name)
Puget Sound Shoreline Parcel Owner Characteristics (Deliverable 2B) Page 13
Out of state owners includes those with armed forces PO boxes. Out of state owners with local
taxpayers were tabulated as “out of state.”
Matching with voter database
The state voter database with data through August 2013 was obtained in order to characterize the age,
most recent voting activity, and date registered to vote in the county of parcel owners by comparison
with the name and address of in-state parcel owners (“Individuals” and “Trust and similar owners”
categories) in the parcel database. In addition, this cross check of addresses provided information about
owner occupancy for many parcels, resulting in the additional determination of over 200 parcels as
being owner occupied.
Multiple parcels owned by landowners
Our analysis is based on parcels, not owners. That is, we did not eliminate situations in which multiple
parcels are owned by the same owners. This assessment is recommended for a future iteration of this
project, but because many owners own properties in different combinations of partners and legal
structures, we did not find that looking at duplicate ownership was feasible in this assessment. Thus,
the results in the next section do include instances of repeated owner information.

Puget Sound Shoreline Parcel Owner Characteristics (Deliverable 2B) Page 14
Results
The results below are presented for shoreline parcels which are either owned by individuals or are
owned by individuals held in a legal structure such as a trust, a holdings or similar. This totals 43,630
parcels. Properties owned by tribes, associations and other types of owners, unknown owners, etc.
(1,646 or 3.6% of the parcels) while they may be strong candidates for addressing shoreline features
through social marketing, are not included in these results below because we lacked enough specific
information to present owner characteristics. For detailed breakout of data by parcel segment and
county, please see Appendix 1.
Owner type
Analysis of the 43,630 residential shoreline parcels show that 20.4% of the parcels were owned in a legal
structure such as a trust, estate, holdings, or similar, rather than individually. This mode of owning
properties was higher for parcels with homes. Owners held their parcel in a legal structure for 1,872 out
of 7,616 (24.6%) parcels with no residence and a lower percentage, 7,011 out of 36,014 (19.47%) for
parcels with a residence.
Looking at these data by county, we found that the number of parcels held using a legal structure varied,
with the highest percentage in San Juan County (35.7%). Clallam, Mason, and Jefferson had the next
highest percentages. The lowest percentage occurred in King County (7.3%) (Figure 1).
0.0%
5.0%
10.0%
15.0%
20.0%
25.0%
30.0%
35.0%
40.0%
Figure 1. Percentage of parcels held in trusts
Percentage of residential shoreline parcels held in legal structures such as trusts or similar, by county.

Puget Sound Shoreline Parcel Owner Characteristics (Deliverable 2B) Page 15
Where property owners live
We analyzed where property owners live in order to determine “owner occupancy”: do they live at their
shoreline parcel or do they live elsewhere? For those who live elsewhere, do they live in-county, in-state
or internationally?
Owner occupancy
We found that 38.5% (16,824) of all residential shoreline parcels were owner occupied. The site address
matched at least one of the owner addresses.
We also found that a small number of additional parcels that were listed on tax assessor records as
vacant, open space, tidelands or similar had residents identified with “owner address” or “voting
address” at that address. This indicates that residents might live at these parcels and thus these parcels
appear to be misclassified by the local tax assessor offices. Either the address of the parcel was
incorrect and the actual residential structure was on an adjacent lot or the property owner was indeed
living there and the tax status was incorrect. These parcels made up an additional 0.6% of the shoreline
residential parcels (260 parcels).
In addition, 2.4% (1,050) of the shoreline parcels had property owners who listed a PO Box as their
contact address and thus may live at the parcel. When voting records were matched with site addresses,
for the successful matches, a large number were indeed PO boxes and we were able to determine
owner occupancy with better certainty.
The combination of these three categories of owner residency type resulted in a range of 38.5% to
41.5% of parcels with owners who likely lived at their shoreline parcel out of all residential parcels,
including undeveloped parcels.
Across the parcel segment categories, the highest rates of owner occupancy were in parcel segment 7
(Home, armor, no erosion risk) at 56% (Figure 2).
0%
10%
20%
30%
40%
50%
60%
Parcel Segments
Figure 2. Percentage owner occupied parcels, by parcel segment

Puget Sound Shoreline Parcel Owner Characteristics (Deliverable 2B) Page 16
Percentage parcels owned by residents living at parcel, by parcel segment. For parcel segment numbers see Table 1. n=16,824
out of total n=43,650.
For property owners living near their shoreline parcel (on the same street, in the same city or using a PO
Box) the highest percentage was for segment categories with no homes (segments 1, 2, 5 and 6) at rates
that range from 25% to 46% (Figure 3).
0%10%20%30%40%50%
Parcel Segments
Figure 3. Owners who live near their shoreline parcel
Percentage parcels owned by residents living near their shoreline parcel (same street, same city, or PO Box in same city), by
parcel segment. For parcel segment numbers see Table 5. n=6,186 out of total n=43,650.
An additional 3,180 (7%) of the parcels had property owners who live in the same county as their
shoreline parcel. These owners had higher rates of ownership of undeveloped shoreline parcels
(segments 1, 2, 5, and 6) than developed parcels (Figure 4).
0%2%4%6%8%
10%12%14%16%
Parcel Segments
Figure 4. Owners who live in same county as their shoreline parcel
Percentage parcels owned by residents living in same county as their shoreline parcel, by parcel segment. For parcel segment
numbers see Table 5. n=3,180 out of total n=43,650.

Puget Sound Shoreline Parcel Owner Characteristics (Deliverable 2B) Page 17
Finally, persons owning shoreline parcels and living elsewhere in Washington State, out of state or out
of the country accounted for 17,176 parcels (39% of all parcels). The highest rate of out-of-county
ownership was of parcels that are undeveloped and have no armor (segments 1 and 2) (Figure 5A).
0%
10%
20%
30%
40%
50%
60%
Parcel Segments
Figure 5A. Owners who live in different county, out of state or out of country, by parcel segment
Percentage parcels owned by residents living in a different county, out of state or out of the country, by parcel segment. For
parcel segment numbers see Table 5. n=17,176 out of total n=43,650.
The highest percentages of out of county parcel ownership were in San Juan (63%) and Mason (60%)
counties and lowest in King (14%) and Thurston (17%) counties. The total out of county ownership for
Puget Sound was 39% (Figure 5B).

Puget Sound Shoreline Parcel Owner Characteristics (Deliverable 2B) Page 18
0%
10%
20%
30%
40%
50%
60%
70%
Figure 5B. Owners who live in a different county, out of state or out of country, by parcel county
Percentage of parcels owned by residents living in a different county, out of state or out of the country, by parcel county.
n=17,176 out of total n=43,650.
Comparing the occupancy data by counties, there were large variations in the percentages of shoreline
parcels in which the owner lived at their parcel relative to all parcels in each county. Parcels in San Juan
(21%) and Mason (20%) counties had the lowest owner occupancy rate while Thurston had the highest
rate (61%). King County (51%), Pierce (49%), Kitsap (49%) and Snohomish (48%) counties had the next-
highest percentages. The percentage for all Puget Sound shoreline parcels was 39% (Figure 6A).
0%
10%
20%
30%
40%
50%
60%
70%
Figure 6A. Percentage owner occupied parcels, by county
Percentage parcels owned by residents living at parcel relative to all parcels, by county. n=16,824.
For parcels with homes, the pattern of owner occupancy is similar. Again, Thurston County (71%) has
the highest percentage of owner occupied parcels relative to parcels in the county. King County (61%),
Snohomish (61%), Pierce (58%), and Kitsap (57%) counties have the next-highest percentages. San Juan

Puget Sound Shoreline Parcel Owner Characteristics (Deliverable 2B) Page 19
(23%) and Mason (26%) had the lowest percentages of owner occupancy for parcels with homes. The
percentage for all Puget Sound shoreline parcels was 46% (Figure 6B).
0%10%20%30%40%50%60%70%80%
Figure 6B. Percentage owner occupied parcels, by county
Percentage of parcels owned by residents living at parcel relative to all parcels with homes, by county. n=16,824.
The percentages of parcels owned by of out of state and out of the US owners were highest for
Whatcom (23%), Clallam (18%) and San Juan (17%) counties relative to all parcels in each county (Figure
7).
0%
5%
10%
15%
20%
25%
Figure 7. Out of State owners
Percentage parcels owned by residents living at parcel, by parcel county. n=4,039.

Puget Sound Shoreline Parcel Owner Characteristics (Deliverable 2B) Page 20
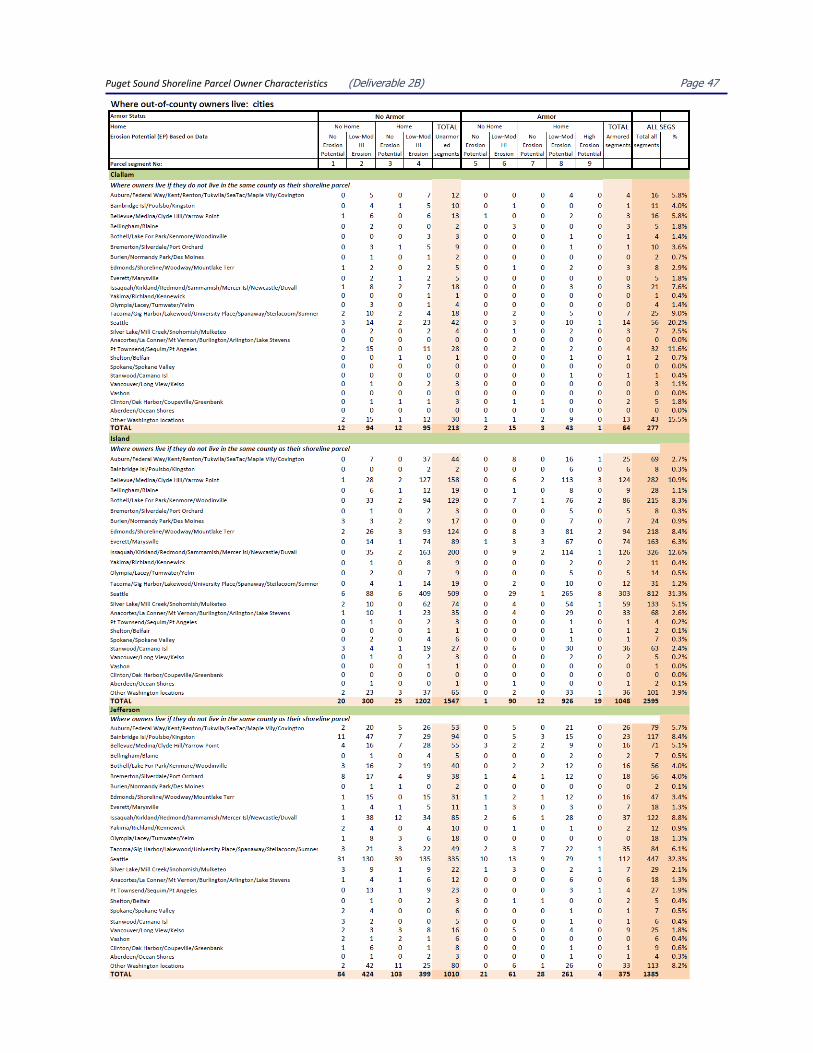
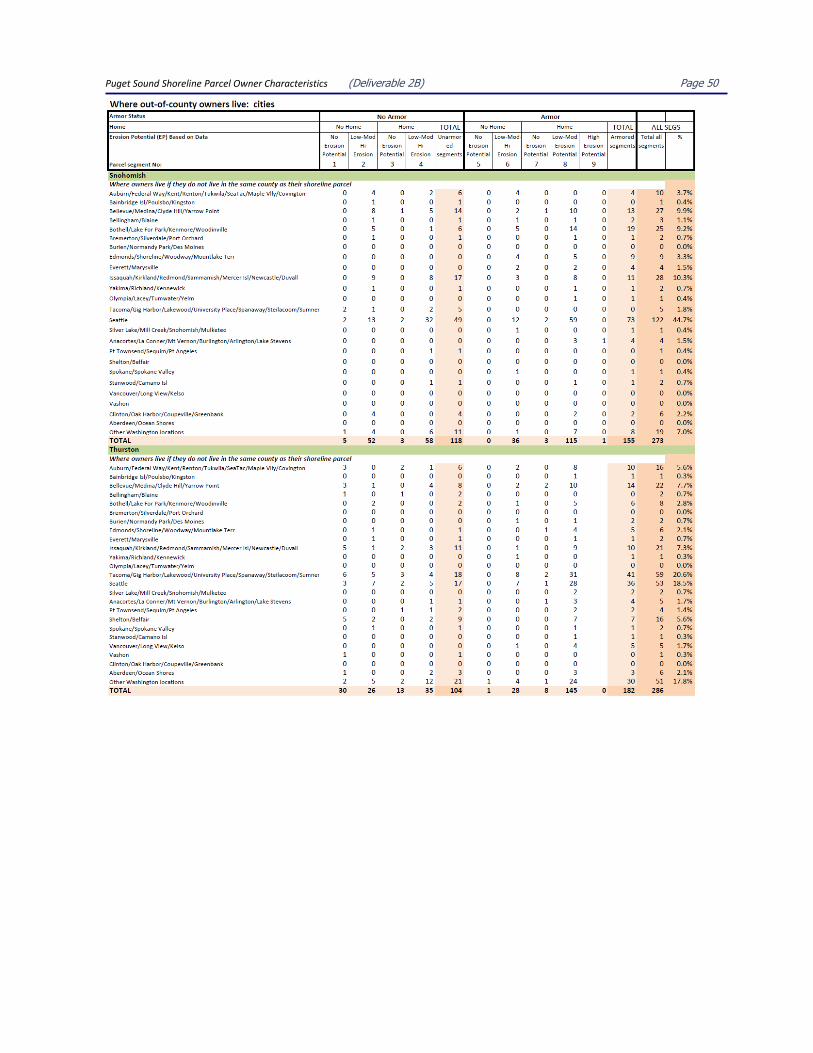
Where owners live: In-State
13,137 parcels were owned by landowners who lived outside of the county in which their shoreline
parcel was located. The largest number of these out-of-county owners resided in Seattle (owners of
3,876 parcels) representing 29.5% of these out-of-county residents or 8.9% of all shoreline residential
parcels.
Parcel owners residing in cities in eastern King County and the greater Tacoma area also had high
numbers of out-of-county owners comprising 7,334 parcels. Washington residents living in other out-of-
county locations in small numbers in each location owned 1,034 shoreline parcels (Figure 8A).
Other out-of-county parcel owners mostly lived in the Puget Sound region with some number of owners
living in coastal Washington, the Yakima, Spokane, and Vancouver areas (Figure 8B).
0 500 1000 1500 2000 2500 3000 3500 4000
Tacoma/Gig Harbor/Lakewood/University Place/Spanaway/Steilacoom/Sumner
Seattle
Issaquah/Kirkland/Redmond/Sammamish/Mercer Isl/Newcastle/Duvall
Bellevue/Medina/Clyde Hill/Yarrow Point
Other Washington locations (not broken out in this graph)
Figure 8A. Out-of-county owner locations (1)
Locations of in-state owner residences for parcels owned by out-of-county owners (part 1: larger populations). n=8,368. Note:
these two bar graphs were split into two so that smaller populations could be more easily read.

Puget Sound Shoreline Parcel Owner Characteristics (Deliverable 2B) Page 21
0 100 200 300 400 500 600 700 800
Auburn/Federal Way/Kent/Renton/Tukwila/SeaTac/Maple Vlly/Covington
Bainbridge Isl/Poulsbo/Kingston
Bellingham/Blaine
Bothell/Lake For Park/Kenmore/Woodinville
Bremerton/Silverdale/Port Orchard
Burien/Normandy Park/Des Moines
Edmonds/Shoreline/Woodway/Mountlake Terr
Everett/Marysville
Yakima/Richland/Kennewick
Olympia/Lacey/Tumwater/Yelm
Silver Lake/Mill Creek/Snohomish/Mulketeo
Anacortes/La Conner/Mt Vernon/Burlington/Arlington/Lake Stevens
Pt Townsend/Sequim/Pt Angeles
Shelton/Belfair
Spokane/Spokane Valley
Stanwood/Camano Isl
Vancouver/Long View/Kelso
Vashon
Clinton/Oak Harbor/Coupeville/Greenbank
Aberdeen/Ocean Shores
Figure 8B. Out-of-county owner locations (2)
Location of in-state owner residences for parcels owned by out-of-county owners (part 2: smaller pop). n= 4,769.
Looking at where Seattle and east King County residents own shoreline parcels (outside King County),
we found that they owned homes proportionately in similar locations. That is, they owned larger
numbers of homes in the same counties. The largest numbers of parcels owned by Seattle and east
King County residents were in Island and San Juan, followed by Mason and Kitsap counties (Figure 9).
0
200
400
600
800
1000
East King Co Seattle
Figure 9. Where Seattle and East King County residents own homes (outside of King Co)
Location of Seattle and East King County owner residences for parcels owned out-of-county, by county. n= 6,338. Note: no
parcels are shown for King County as this analysis focused on parcels owned out-of-county by these King County owners.

Puget Sound Shoreline Parcel Owner Characteristics (Deliverable 2B) Page 22
Where owners live: Out-of-state and international
3,602 parcels (8% of all parcels) were owned by landowners who lived elsewhere in the United States
and 437 parcels were owned by residents with international addresses.
We found that out-of-state owners lived in all 50 US states. The largest numbers of parcels were owned
by residents from California, Oregon, Arizona, Texas, Arkansas and Colorado (Figure 10A).
Moderate numbers of parcels (10-84) were owned by residents from 29 states, including those with
armed forces PO Boxes (APO), and the remainder of the states had residents representing fewer than 10
Puget Sound shoreline residential parcels (Figure 10B).
0 200 400 600 800 1000 1200 1400
CA
OR
AZ
TX
AK
CO
Figure 10A. Out of state owners (1)
Parcels owned by out-of-state owners. This graph shows the states with the largest number of out-of-state owners. n= 2,500.

Puget Sound Shoreline Parcel Owner Characteristics (Deliverable 2B) Page 23
0 20 40 60 80
FL
NV
HI
IL
VA
ID
NY
OH
MT
MN
UT
MI
MD
PA
MA
APO
NM
CT
GA
MO
NC
NJ
TN
IN
WY
WI
DC
OK
SC
IA
LA
NE
KY
RI
SD
DE
KS
ND
AR
AL
MS
ME
MB
VT
WV
Figure 10B. Out of state owners (2)
Parcels owned by out-of-state owners. This graph shows the states with smaller numbers of out-of-state owners, including
armed forces PO boxes (APO). n= 1,102.
Canadians owned the largest number of internationally-owned parcels. The largest numbers were
owned by British Columbians with 371 parcels (Figure 11); 316 of these parcels were in Whatcom
County.
Figure 11. Canadian owners
Parcels owned by Canadians, by province. n= 391.
0 50 100 150 200 250 300 350 400
Canada-Yuk
Canada-Ont
Canada-BC
Canada-Alb

Puget Sound Shoreline Parcel Owner Characteristics (Deliverable 2B) Page 24
An additional 46 parcels were owned by other international owners, with the largest number (10) being
owned by UK residents (Figure 12).
0 2 4 6 8 10
UK
Thailand
Switzerland
Spain
Russia
Philippines
Norway
New Zealand
Netherlands
Korea
Jordan
Japan
Italy
Hong Kong
Guam
Germany
France
China
Australia
Figure 12. Non-Canadian international owners
Parcels owned by non-Canadian international residents. n= 46.
In sum, the distribution of parcel ownership was:
% residents living at parcel 38.5%
% residents living elsewhere in county 22.1%
% residents living elsewhere in Washington 30.1%
% residents living out of state 8.3%
% residents living out of US 1.0%

Puget Sound Shoreline Parcel Owner Characteristics (Deliverable 2B) Page 25
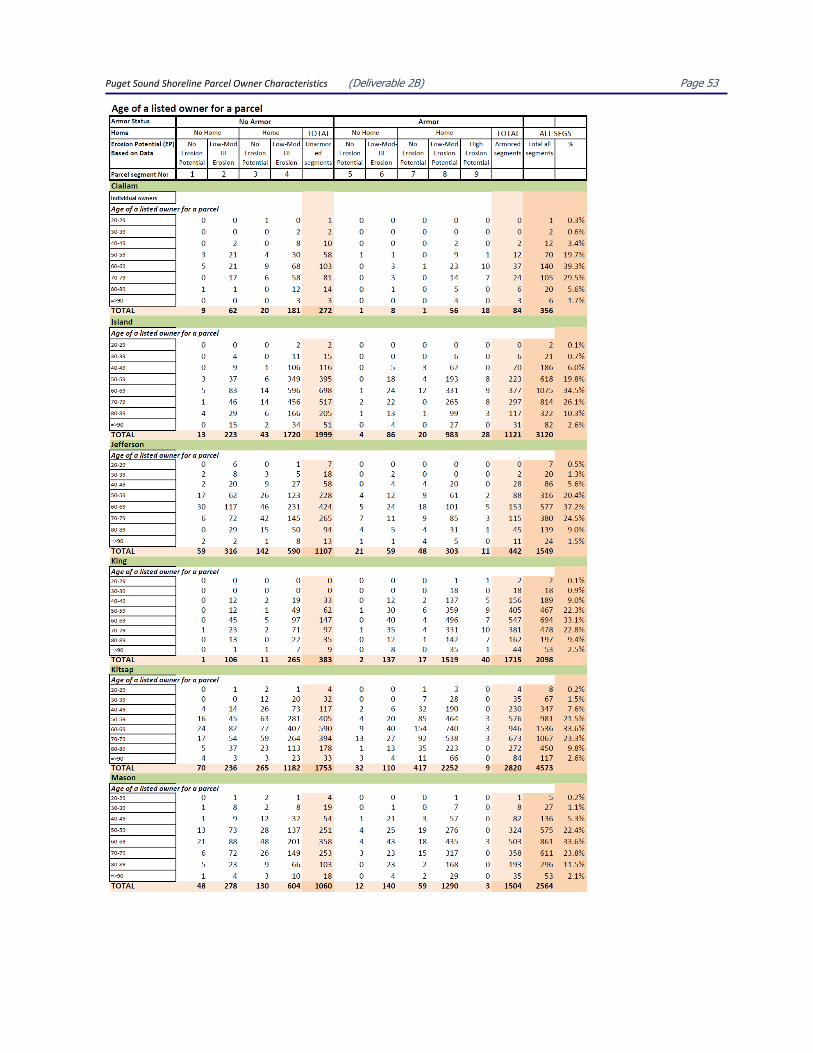
Age of property owners
Using the State voter database of August 2013, we were able to match voting records with 27,920 (64%)
of the residential parcel owners. The match rate would have likely been higher if not for spelling and
other factors which precluded perfect matches.
From the voter information, we could assess the age of voters who correlated with shoreline residential
parcel owners. Most of the information we derived through this comparison was for males because
their names are listed first on most of the tax assessor rolls.
Through this analysis, we found that the largest numbers of shoreline residential parcel owners
(individual owners) were aged 60-69 years (7,992 parcels), followed by those aged 70-79 (5,751 parcels)
(Figure 13). We calculated age of owners at December 31, 2013.
38 280
1647
5080
7992
5751
2267
496
0
1000
2000
3000
4000
5000
6000
7000
8000
20-29 30-39 40-49 50-59 60-69 70-79 80-89 ≥90
Figure 13. Age of owners
Age ranges of owners of parcels owned by individual owners. n= 23,551.
Looking at parcels which were owner occupied the same age distribution pattern was evident. Similar to
the population of all shoreline property owners, the largest and 2nd largest age populations were 60-69
and 70-79 year old persons respectively for these owner-occupied shoreline properties (Figure 14).
0
1000
2000
3000
4000
20-29 30-39 40-49 50-59 60-69 70-79 80-89 ≥90
Figure 14. Age of owners: owner-occupied parcels
Age ranges of owners of parcels owned by individual owners. n= 12,839.

Puget Sound Shoreline Parcel Owner Characteristics (Deliverable 2B) Page 26
Analyzing by county in which the shoreline parcel was located, the percentage of parcel owners
(individual owners) in the 60-69 year range, relative to all parcels in each county, was between 32%-39%
with an average of 34% across all counties. The highest percentage of parcels owned by 60-69 year old
residents was in Clallam County (39%).
A less consistent distribution was found for owners in the 70-79 year old bracket. Owners in the 70-79
age range had highest percentages in Skagit (30%), Clallam (29%), and San Juan (28%) counties and
lowest percentages in Snohomish and Thurston counties (Figure 15).
0%5%
10%15%20%25%30%35%40%
60-69 70-79
Figure 15. 60-69 and 70-79 year old shoreline parcel owners
Percentages of owners aged 60-69 of parcels owned by individual owners, by county in which parcel is located. Total n= 12,839
for all parcels with voter data available.
Looking only at owner-occupied parcels for all age ranges, we found that Pierce (34.9%), Thurston
(33.3%), King (32.9%), and Snohomish (31.3%) counties have the largest number of owner occupied
parcels owned by younger owners (younger than 60 years old). San Juan (17.6%), Island (14.0%), and
Skagit (13.2%) have the large percentage of parcels owned by older owners (older than 79 years old)
(Figure 16).

Puget Sound Shoreline Parcel Owner Characteristics (Deliverable 2B) Page 27
0%
20%
40%
60%
80%
100%
20-29 30-39 40-49 50-59 60-69 70-79 80-89 ≥90
Figure 16. Parcel owner age distribution by parcel county: owner occupied parcels.
Percentage of parcels with owners in each age range, per parcel county. n= 12,839
Voting activity
26,330 of the voters matched to residential parcels were listed as current voters. Our analysis of the
date at which these shoreline property owners most recently voted shows that this population included
highly active voters (Figure 17).
1327912056
144 345 305 2010
2000
4000
6000
8000
10000
12000
14000
Most recentvote was in
a 2013election
(pre-Nov )
Most recentvote was in2012 Novelection
Most recentvote was in2012 pre-
Nov election
Most recentvote was in
a 2010-2011election
Most recentvote wasprior to
2010
Have notvoted
Figure 17. Voting activity by shoreline property owners
Voting activity showing number of currently registered property owners. n= 26,330
Puget Sound Shoreline Parcel Owner Characteristics (Deliverable 2B) Page 28
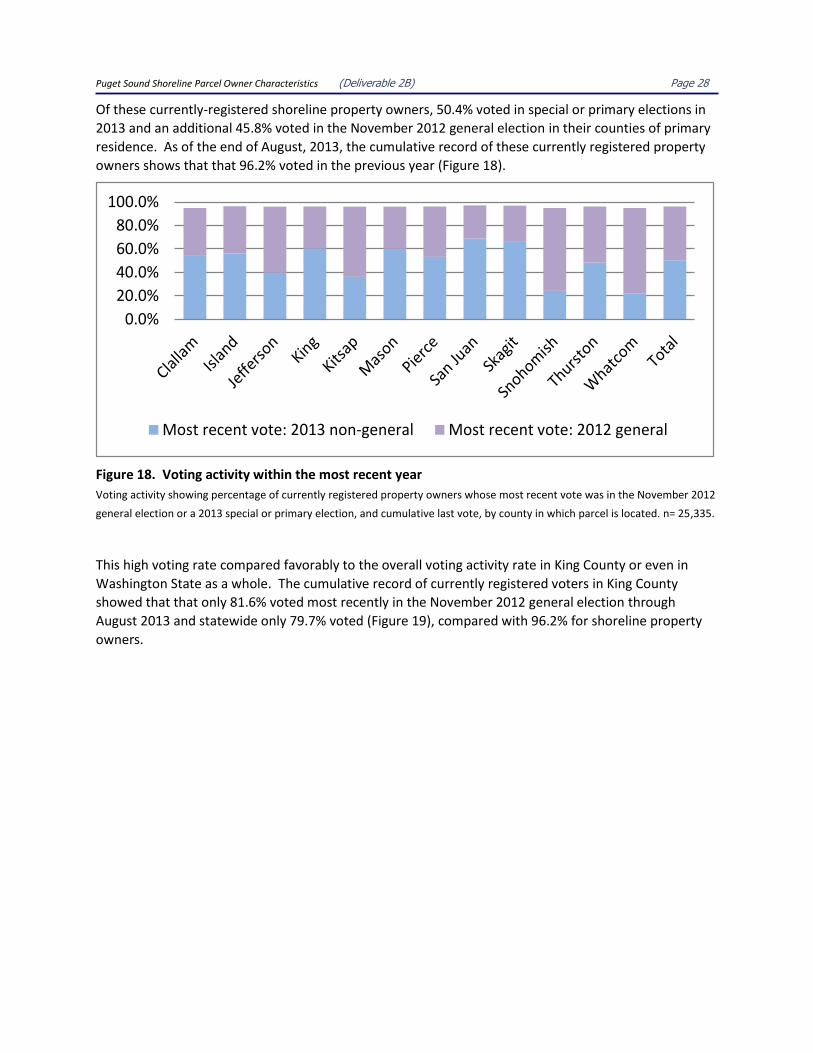
Of these currently-registered shoreline property owners, 50.4% voted in special or primary elections in
2013 and an additional 45.8% voted in the November 2012 general election in their counties of primary
residence. As of the end of August, 2013, the cumulative record of these currently registered property
owners shows that that 96.2% voted in the previous year (Figure 18).
0.0%
20.0%
40.0%
60.0%
80.0%
100.0%
Most recent vote: 2013 non-general Most recent vote: 2012 general
Figure 18. Voting activity within the most recent year
Voting activity showing percentage of currently registered property owners whose most recent vote was in the November 2012
general election or a 2013 special or primary election, and cumulative last vote, by county in which parcel is located. n= 25,335.
This high voting rate compared favorably to the overall voting activity rate in King County or even in
Washington State as a whole. The cumulative record of currently registered voters in King County
showed that that only 81.6% voted most recently in the November 2012 general election through
August 2013 and statewide only 79.7% voted (Figure 19), compared with 96.2% for shoreline property
owners.

Puget Sound Shoreline Parcel Owner Characteristics (Deliverable 2B) Page 29
50.4%
32.2%28.6%
45.8%
49.4% 51.1%
0.0%
10.0%
20.0%
30.0%
40.0%
50.0%
60.0%
70.0%
80.0%
90.0%
100.0%
ShorelinePropertyOwners
King Co WA State
Most recent vote: 2012general
Most recent vote: 2013 non-general
96.2%
81.6% 79.7%
Figure 19. Comparison of shoreline parcel owner voting activity with King Co and WA
Comparison of Shoreline parcel owners with King County and Washington State currently registered voters: Voting activity
showing percentage of all currently registered voters whose last vote was Nov. 2012 and through August 2013. Shoreline parcel
owner total n= 25,335; King County total n= 1,036,635; WA State total n= 3,778,206.
Length of residence
As a surrogate for the length of residence, we looked at the date at which residents registered to vote in
their county. For in-county residents (i.e., live at the shoreline property, live in same city, live in county)
this provided an indicator of their minimum time in the county of their specific shoreline parcel. For
residents who lived elsewhere in Washington State, this provided an indicator of how long they have
lived in their current county as an understanding of minimum length of time of residence in the state.
In-county owners
About 62.5% of the parcels owned by in-county residents (12,223 parcels) had lived in the county where
their shoreline parcel was located since 1990, at a minimum. 7.2% of these parcels were owned by
owners who registered in their county in 2010 or more recently (Figure 20).

Puget Sound Shoreline Parcel Owner Characteristics (Deliverable 2B) Page 30
0.0%
5.0%
10.0%
15.0%
20.0%
25.0%
30.0%
prior to 1950 1950-1959 1960-1969 1970-1979 1980-1989 1990-1999 2000-2009 2010-2013
Figure 20. Minimum length of residence: same county as shoreline parcel
Percentage of parcels showing minimum length of residence in the county by owners who live in the same county as their
shoreline parcel. n= 19,565.
Looking at minimum residence length by county, King County had the largest percentage of parcels with
property owners who have lived in the county prior to 1990 (58%), followed by Snohomish (55%) and
Thurston (47%). Jefferson, Island and Mason counties all have the highest percentages (12% each) of
shoreline parcels with owners who registered to vote in their county in 2010 through 2013 (Figure 21).
These results may indicate that Jefferson, Island and Mason Counties have had the largest increases in
new shoreline parcel owners in recent years.
Figure 21. Minimum length of residence: same county as shoreline parcel (by county)
Percentage of parcels showing minimum length of residence in the county by owners living in the same county as their
shoreline parcel, by county. n= 19,565.

Puget Sound Shoreline Parcel Owner Characteristics (Deliverable 2B) Page 31
Considering only owner occupied parcels, we found similar patterns for all counties except Mason,
Whatcom and Skagit counties which had different proportions, reflecting different numbers of owner
occupied parcels (Figure 22).
0%
20%
40%
60%
80%
100%
prior to 1990 1990-1999 2000-2009 2010-2013
Figure 22. Minimum length of residence: owner occupied parcels (by county)
Percentage of parcels showing minimum length of residence in the county by owners living at the parcel (owner occupied), by
county (including probably “living there” parcels). n= 14,684
Out-of-county owners
For parcels with property owners who lived in counties other than where their shoreline parcel is
located, these owners tended to have lived a minimum of time longer in the county than those who
lived within the same county as their parcel (Figure 23A). These parcels with out-of-county owners had a
larger percentage, 57.6%, than in-county owners, 37.5%, of owners who had lived in their county at
least as early as 1990. This may be reflective of residents retiring or moving to their shoreline parcels or
of a larger percentage of residents who have purchased shoreline properties in their county of residence
in more recent years. This trend is even clearer when the minimum length of residence of out-of-county
owners is plotted on the same graph as in-county owners and owners who live at their property (Figure
23B).

Puget Sound Shoreline Parcel Owner Characteristics (Deliverable 2B) Page 32
0.0%
5.0%
10.0%
15.0%
20.0%
25.0%
prior to1950
1950-1959 1960-1969 1970-1979 1980-1989 1990-1999 2000-2009 2010-2013
Figure 23A Minimum length of residence: out-of-county owners
Percentage of parcels showing minimum length of residence in the county by owners living in a different county than their
shoreline parcel. n= 8,190.
0.0%
5.0%
10.0%
15.0%
20.0%
25.0%
30.0%
prior to 1950 1950-1959 1960-1969 1970-1979 1980-1989 1990-1999 2000-2009 2010-2013
Out-of-county owners in WA In county owners Owner-occupied
Figure 23B. Minimum length of residence: out-of-county owners compared with in-county and owners who live at their property
Percentage of parcels showing minimum length of residence in the county by owners living in a different county than their
shoreline parcel vs. those who live in the same county as their parcel (but do not live at the property) vs. those who live at the
property. Out of county owners n = 8,190; in-county owners n= 4,881; owners who live at their property n = 14,684.
Looking by county, the pattern of parcels with owners who have lived a longer minimum number of years (i.e., since prior to 1990) in their home county is seen in all counties (Figure 24), in contrast to the period of residence of the in-county owners which has a less consistent pattern.

Puget Sound Shoreline Parcel Owner Characteristics (Deliverable 2B) Page 33
0%
20%
40%
60%
80%
100%
prior to 1990 1990-1999 2000-2009 2010-2013
Figure 24. Minimum length of residence: out-of-county owners (by parcel county)
Percentage of parcels showing minimum length of residence in the county by owners living out of the county of their shoreline
parcel, by parcel county. n= 8,190.
Year that property improvement was built or renovated
Tax assessor records were available for the date an improvement was renovated or built for 21,942
parcels but this information has limitations. Renovation type listed as “other” was not included in our
analysis. All other dollar values of improvements were included because the actual type of improvement
was not listed in the database; they were listed as “residential” or they had no listing of the type of
improvement.
Overall, these data were inconsistently listed in the UW database which may be reflective of the various
ways different counties tabulate this information. Furthermore, quite a few counties had no listings in
the UW database for date that improvements were built or renovated: Clallam, King, Pierce, Thurston,
and Whatcom counties.
In the database, some parcels that had a tax designation other than residential had records for “date
built.” It is unclear what improvements were indicated by this listing and further study would be needed
to determine the nature of the improvement on these parcels. These may include homes (thus
indicating incorrect tax categorization) or other improvements.
Based on the data available, we found that the year that property improvements were built or
renovated indicated that improvements on 4-4.5% of the shoreline parcels were renovated in each of
the roughly 10 year timeframes 1991-2000 and 2000-2011. In the three most recent time periods, fairly
consistent percentages (average of 12.5%) of the shoreline parcels were constructed in each (Figure 25).

Puget Sound Shoreline Parcel Owner Characteristics (Deliverable 2B) Page 34
982 879 915
2666 29842448
5235 5833
0100020003000400050006000
Renovated2001-2011
Renovated1991-2000
Renovatedprior to
1991
Built 2001-2012
Built 1991-2000
Built 1981-1990
Built 1961-1980
Built priorto 1961
Figure 25. Year improvement renovated or built
Numbers of parcels in which improvements were renovated, or if no renovation record, the year the improvement was built.
Data are for the following counties: Island, Jefferson, Kitsap, Mason, San Juan, Skagit, and Snohomish. n= 21,942.
Looking at the construction of new improvements by county, we found that for the counties with available data, the number in each of the last two decades was relatively close (within each county). The exception to this trend was Snohomish County and this discrepancy may be due to database reporting problems. Kitsap and Island counties had the highest levels of construction of new improvements: an average of 717 newly constructed improvements per decade in Kitsap County and 618 in Island County (Figure 26).
ND ND ND ND ND0
200
400
600
800
Built 2001-2012 Built 1991-2000
Figure 26. Year improvement renovated or built in 1991-2000 and 2001-2011, by county
Number of residential parcels in which new improvements were constructed in the last two roughly 10 year periods (1991-2000
and 2001-2011), by county. Data are for the following counties: Island, Jefferson, Kitsap, Mason, San Juan, Skagit, and
Snohomish. n= 5,650.

Puget Sound Shoreline Parcel Owner Characteristics (Deliverable 2B) Page 35
Parcel market value
Market value data for shoreline parcel improvements were available for all counties except Kitsap. The
largest numbers of parcels had improvements in the $100,000 to $400,000 range (Figure 27). San Juan
County had the largest percentage of highest value homes with 8% of their homes valued over $800,000.
0
2000
4000
6000
8000
10000
<20K ≥20K -50K
≥50K -100K
≥100K -200K
≥200K -400K
≥400K -600K
≥600 -800K
≥800K
Figure 27. Market value of improvements
Number of parcels in each range of market value of improvement, for all counties except Kitsap County. n= 28,734.
Puget Sound Shoreline Parcel Owner Characteristics (Deliverable 2B) Page 36
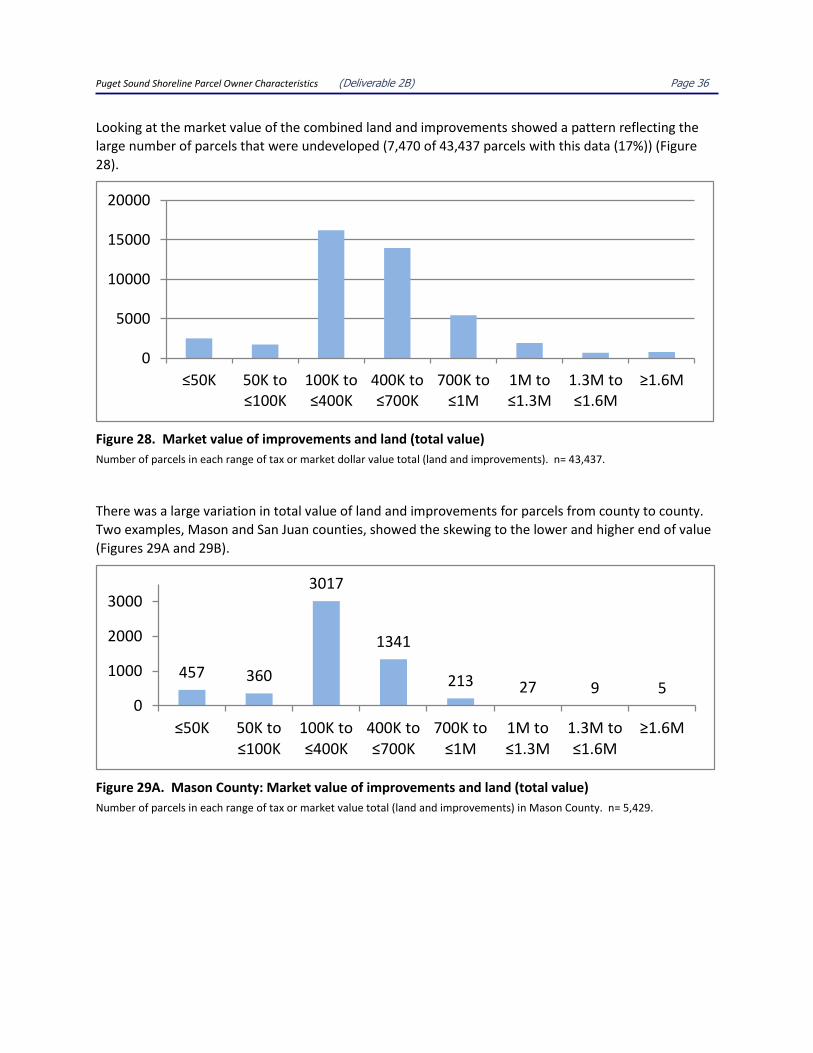
Looking at the market value of the combined land and improvements showed a pattern reflecting the
large number of parcels that were undeveloped (7,470 of 43,437 parcels with this data (17%)) (Figure
28).
0
5000
10000
15000
20000
≤50K 50K to ≤100K
100K to ≤400K
400K to ≤700K
700K to ≤1M
1M to ≤1.3M
1.3M to ≤1.6M
≥1.6M
Figure 28. Market value of improvements and land (total value)
Number of parcels in each range of tax or market dollar value total (land and improvements). n= 43,437.
There was a large variation in total value of land and improvements for parcels from county to county.
Two examples, Mason and San Juan counties, showed the skewing to the lower and higher end of value
(Figures 29A and 29B).
457 360
3017
1341
213 27 9 50
1000
2000
3000
≤50K 50K to ≤100K
100K to ≤400K
400K to ≤700K
700K to ≤1M
1M to ≤1.3M
1.3M to ≤1.6M
≥1.6M
Figure 29A. Mason County: Market value of improvements and land (total value)
Number of parcels in each range of tax or market value total (land and improvements) in Mason County. n= 5,429.

Puget Sound Shoreline Parcel Owner Characteristics (Deliverable 2B) Page 37
35 44
916
1291
1020
482
230358
0
500
1000
1500
≤50K 50K to ≤100K
100K to ≤400K
400K to ≤700K
700K to ≤1M
1M to ≤1.3M
1.3M to ≤1.6M
≥1.6M
Figure 29B. San Juan County: Market value of improvements and land (total value)
Number of parcels in each range of tax or market value total (land and improvements) in San Juan County. n= 4,387.
Size of parcels
Parcel size was available from tax assessor records for 33,152 shoreline residential parcels from all counties except King County, and these data showed that the largest percentage of parcels were 1 acre or smaller in size: 18,667 parcels (56.3%) (Figure 30).
0.0%
5.0%
10.0%
15.0%
20.0%
25.0%
30.0%
≤0.5 >0.5 - 1.0>1.0 - 1.5>1.5 - 2.0>2.0 - 2.5>2.5 - 3.0>3.0 - 3.5 >3.5acres
Figure 30. Size of parcels
Percentage of parcels in each size range (acres), from tax assessor records. No data: King County. n= 33,152.
Looking by county, Whatcom (81%), Snohomish (77%), Kitsap (70%) and Skagit (69%) had the highest
number of shoreline parcels less than 1 acre relative to the total number of shoreline parcels in each
county. Clallam (31%) and San Juan (29%) had the highest percentage of parcels equal or greater than 3
acres (Figure 31).

Puget Sound Shoreline Parcel Owner Characteristics (Deliverable 2B) Page 38
0%
20%
40%
60%
80%
100%
≤1 acre >1.0 - 2.0 >2.0 - 3.0 >3.0 acres
Figure 31. Size of parcels, by county
Percentage of parcels in each size range (acres), from tax assessor records, by county except King County. n= 33,152.
Comparing parcel size (from the tax assessor parcel size records) with presence of a residence or
presence of armor, we found that for parcels with homes: the smallest parcels (mostly strongly for ≤0.5
acre, less strongly for ≤1 acre) were more likely to have armor while parcels greater than 1 acre (most
strongly for >3.5 acres) were less likely to have armor. This trend of parcels being less likely to have
armor generally increased as parcel size increases. For undeveloped parcels, the pattern was less
evident (Figure 32).
0
1000
2000
3000
4000
5000
6000
≤0.5 >0.5 - 1.0 >1.0 - 1.5 >1.5 - 2.0 >2.0 - 2.5 >2.5 - 3.0 >3.0 - 3.5 >3.5
No home, no armor Home, no armor No home, armor Home, armor
Figure 32. Comparison of homes and armor with parcel size
Percentage of parcels in each size range (acres), from tax assessor records showing presences of homes (green) versus
undeveloped parcels (blue) and presence of armor (darker color). No data: King County. n= 33,152.

Puget Sound Shoreline Parcel Owner Characteristics (Deliverable 2B) Page 39
Appendix 1. Data tables

Puget Sound Shoreline Parcel Owner Characteristics (Deliverable 2B) Page 40

Puget Sound Shoreline Parcel Owner Characteristics (Deliverable 2B) Page 41

Puget Sound Shoreline Parcel Owner Characteristics (Deliverable 2B) Page 42

Puget Sound Shoreline Parcel Owner Characteristics (Deliverable 2B) Page 43

Puget Sound Shoreline Parcel Owner Characteristics (Deliverable 2B) Page 44

Puget Sound Shoreline Parcel Owner Characteristics (Deliverable 2B) Page 45

Puget Sound Shoreline Parcel Owner Characteristics (Deliverable 2B) Page 46
Puget Sound Shoreline Parcel Owner Characteristics (Deliverable 2B) Page 47

Puget Sound Shoreline Parcel Owner Characteristics (Deliverable 2B) Page 48

Puget Sound Shoreline Parcel Owner Characteristics (Deliverable 2B) Page 49
Puget Sound Shoreline Parcel Owner Characteristics (Deliverable 2B) Page 50

Puget Sound Shoreline Parcel Owner Characteristics (Deliverable 2B) Page 51

Puget Sound Shoreline Parcel Owner Characteristics (Deliverable 2B) Page 52
Puget Sound Shoreline Parcel Owner Characteristics (Deliverable 2B) Page 53

Puget Sound Shoreline Parcel Owner Characteristics (Deliverable 2B) Page 54

Puget Sound Shoreline Parcel Owner Characteristics (Deliverable 2B) Page 55

Puget Sound Shoreline Parcel Owner Characteristics (Deliverable 2B) Page 56

Puget Sound Shoreline Parcel Owner Characteristics (Deliverable 2B) Page 57

Puget Sound Shoreline Parcel Owner Characteristics (Deliverable 2B) Page 58

Puget Sound Shoreline Parcel Owner Characteristics (Deliverable 2B) Page 59

Puget Sound Shoreline Parcel Owner Characteristics (Deliverable 2B) Page 60

Puget Sound Shoreline Parcel Owner Characteristics (Deliverable 2B) Page 61
Puget Sound Shoreline Parcel Owner Characteristics (Deliverable 2B) Page 62

Puget Sound Shoreline Parcel Owner Characteristics (Deliverable 2B) Page 63

Puget Sound Shoreline Parcel Owner Characteristics (Deliverable 2B) Page 64

Puget Sound Shoreline Parcel Owner Characteristics (Deliverable 2B) Page 65

Puget Sound Shoreline Parcel Owner Characteristics (Deliverable 2B) Page 66

Puget Sound Shoreline Parcel Owner Characteristics (Deliverable 2B) Page 67

Puget Sound Shoreline Parcel Owner Characteristics (Deliverable 2B) Page 68

Puget Sound Shoreline Parcel Owner Characteristics (Deliverable 2B) Page 69

Puget Sound Shoreline Parcel Owner Characteristics (Deliverable 2B) Page 70
Top Related