


Languages
Pages
Legal

PUBLIC SECTOR RETRENCHMENT: SPAIN IN THE 1980s
JosJ Manuel CampaStern School of Business
New York University44 West 4th Street
New York, NY 10012Ph: (212) 998 0429Fax: (212) 995 4221
email: [email protected]
This version: January 1997
Abstract
This paper documents the process of public sector retrenchment in Spain during the 1980s witha special emphasis on the reallocation schemes for misplaced workers. The retrenchmentprocess focused on the implementation of capacity reductions and technological improvementsof state-owned enterprises and on the liquidation or privatization of those enterprises that hadno strategic value to the public sector. The reallocation policies for surplus workers from theseretrenchment process were centered around the creation of Employment Promotion Funds. Theability of these funds to reallocate misplaced workers in alternative industries was very limited.The majority of misplaced workers ended into either early retirement schemes or into long termunemployment. Several reasons can be accounted for the limited success of the rellocationprocess: retraining efforts focused in updating workers' current rather than new skills; highlevels of financial benefits to displaced workers reduced their incentives to find new jobs; andthe requirement that employers must offer a full time indefinite employment contract made theseworkers less attractive for employment than those under alternative available schemes, such aspart-time and fixed term contracts.
This paper is part of a World Bank research project on Public Sector Retrenchment and EfficientCompensation Schemes. I would like to thank Mauro GuillJn, MartRn Rama, Ana Revenga andJuan V<zquez and participants at the World Bank Seminar on Public Sector Retrenchement fortheir comments and suggestions, and Laura ChaquJs and Carlos Pereira for research assistance.
The findings, interpretations, and conclusions expressed in this paper are entirely those of theauthor. They do not necessarily represent the view of the World Bank, its Executive Directors,or the countries they represent.
PUBLIC SECTOR RETRENCHMENT: SPAIN IN THE 1980s
I.- Introduction
In the late 1970s, the industrial sector in Spain entered a period of sharp and substantial
decline. A legacy of protection from international competition and high energy dependence,
along with rapidly rising labor costs, help explain why Spanish industry was particularly ill-
prepared to deal with the oil shocks and compete effectively in increasingly competitive world
markets. This process coincided with a delicate political transition which depended heavily on
the existence of economic and financial stability for success. The public sector guaranteed this
economic stability by acquiring an increasing number of non-profitable private firms in
uncompetitive industries.
In 1981, once the political transition had taken place, the government decided to
implement a comprehensive plan of industrial reconversion and restructuring. This plan, passed
in a first version in 1981 and subsequently revised in 1983, involved a significant retrenchment
in a number of Spanish declining industries, including: home appliances, shipbuilding, iron and
steel, fertilizers, textiles, footwear, electronic equipment and cables and other electrical
components. Given the dominant position of public enterprises in many of these sectors --such
as shipbuilding and steel-- the program not only had important implications for the state sector
but also for a large number of private enterprises. This restructuring program reversed the
previous increasing role of the public sector in the Spanish economy. The contribution of public
enterprises under the Instituto Nacional de Industria to Spanish GDP fell from 6.9% in 1983 to
3.7% by 1990. During the same period, employment in public enterprises dropped by more than
22% (Allard and Bolorinos, 1992).
The retrenchment of the public sector also involved large capital investments and1
organizational changes that will not be studied in detail here.
2
This paper documents the process of reconversion and retrenchment of Spanish state-
owned enterprises during this period. It focuses on the sectors involved, the problems of political
economy to manage the restructuring process, the form as well as the speed in which the
retrenchment took place as well as its impact on workers and the financial costs of the
restructuring program. The emphasis here is on the policies pursued to reduce the labor force
in the state-owned enterprises undergoing restructuring and on the efficacy and cost of such labor
adjustment. 1
The rest of the paper is organized as follows. Section II provides a short overview of
Spanish economic policies during the 1970s that led by the end of the decade to a large,
inefficient and unprofitable system of state-owned enterprises. Section III describes the basic
policies for the retrenchment of the public sector. Section IV deals with the privatization of
state-owned enterprises. Section V describes the different policy schemes developed to reduce
the labor force in the industrial public sector. Section VI evaluates the speed and success in the
reallocation of these excess workers in other sectors of the economy. Section VII provides some
quantitative evidence on the estimated costs of the adjustment process. Finally, section VIII
concludes with some lessons that can be drawn from the Spanish experience.
II.- Evolution of the Public Sector as a Hospital for Unprofitable Enterprises
The decade of the 1970s confronted Spain with two major challenges: the need to
3
restructure its industrial economic activity in response to the international oil shocks, and the
unique opportunity of a fundamental political and social reform following the death in November
1975 of Francisco Franco who had ruled for the previous forty years. The political elites at the
time perceived that the political and social transformation towards a democratic government was
such a unique opportunity that it should take first priority in the direction of government action.
Therefore, an agreement was reached to subordinate the restructuring of industrial activity to the
political reform. Economic policy during this period focused on minimizing the process of
economic reform so as to prevent any social unrest that dissatisfaction from economic
restructuring could cause in order to avoid any distraction from the process of political reform.
(GarcRa Fern<ndez 1990, Linde 1990).
As a result, whenever a private company with a significant market share in an industry
faced serious structural problems that made it unable to confront the economic crisis without
undergoing major restructuring the public sector would intervene by buying out existing
shareholders and continuing the firm's activity. By acquiring these firms and allowing then to
continue their operations, the government avoided their immediate restructuring. The
government normally maintained the employment to the existing workforce, at the expense of
providing financial support to cover the firms operating losses. The Spanish public sector had
already performed such a role in particular instances in the past. However, never before had
such a process become so widespread as during this period to the extent that newly acquired
firms became the major component of the structure of state-owned enterprises.
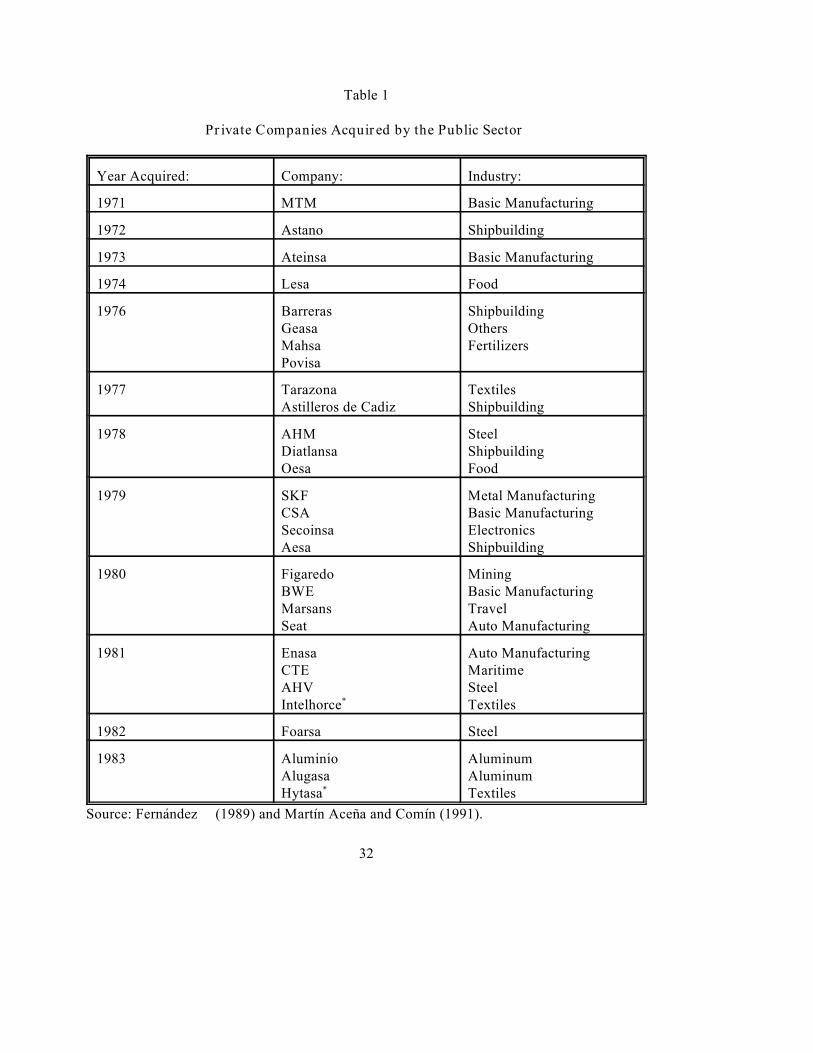
Table 1 shows the list of companies ending in direct control of the Instituto Nacional de
Industria [hereafter INI], the major holding company of all state-owned enterprises, from 1971
Throughout this paper we will refer to the public sector as the group of firms under the2
control of the Instituto Nacional de Industria (INI). This holding firm includes most state-ownedindustrial firms and was the focus of the retrenchment process. There are a number of state-owned firms that are not included in this holding. In particular the electric utilities andpetrochemical companies are held by the Instituto Nacional de Hidrocarburos, and the railroadsystem, national television channels, ports, and national post service are all under the directcontrol of different Ministries. See Cuervo Garcia (1985) for a more detailed explanation.
4
to 1983. The acquisitions of private firms begins in the early 1970s when the political2
dictatorship of Francisco Franco was beginning to show signs of weakness and intensifies after
Franco's death in November 1975. Most of these firms are concentrated in a small subset of
industries (steel, shipbuilding, basic and auto manufacturing and textiles) which were either
declining or in need of major restructuring. All of these firms were major players in their
respective industries and, as a result of their transfer to the public sector, the market-share in
some of these industries controlled by state-owned enterprises increased drastically. Between
1969 and 1980 the share of state owned enterprises in sales by domestic producers went from
26% to 87% in shipbuilding and from less than 20% to more than 50% in fertilizers. State owned
enterprises controlled a 100% of the production of aluminum production by 1983 up from about
26% in the mid 1960s (MartRn AceZa y ComRn 1991, p.648). In all cases, acquisition of these
companies by the public sector came after a refusal from private shareholders of these firms to
either confront the financial needs of the firms for their restructuring or to maintain the exiting
level of the work force.
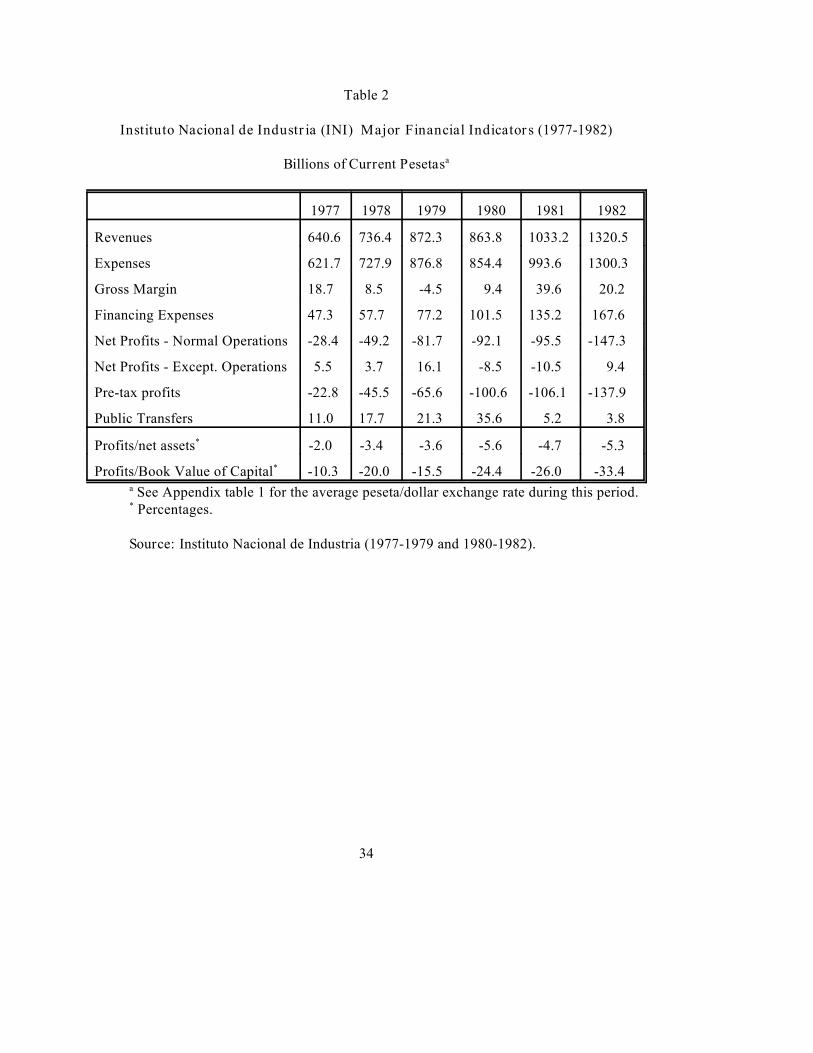
The financial consequences of this process of rapid and unstructured growth for the public
sector were immediate. Table 2 shows the major financial indicators of the state-owned holding
company, the Instituto Nacional de Industria from 1977 to 1982. Its gross revenues more than
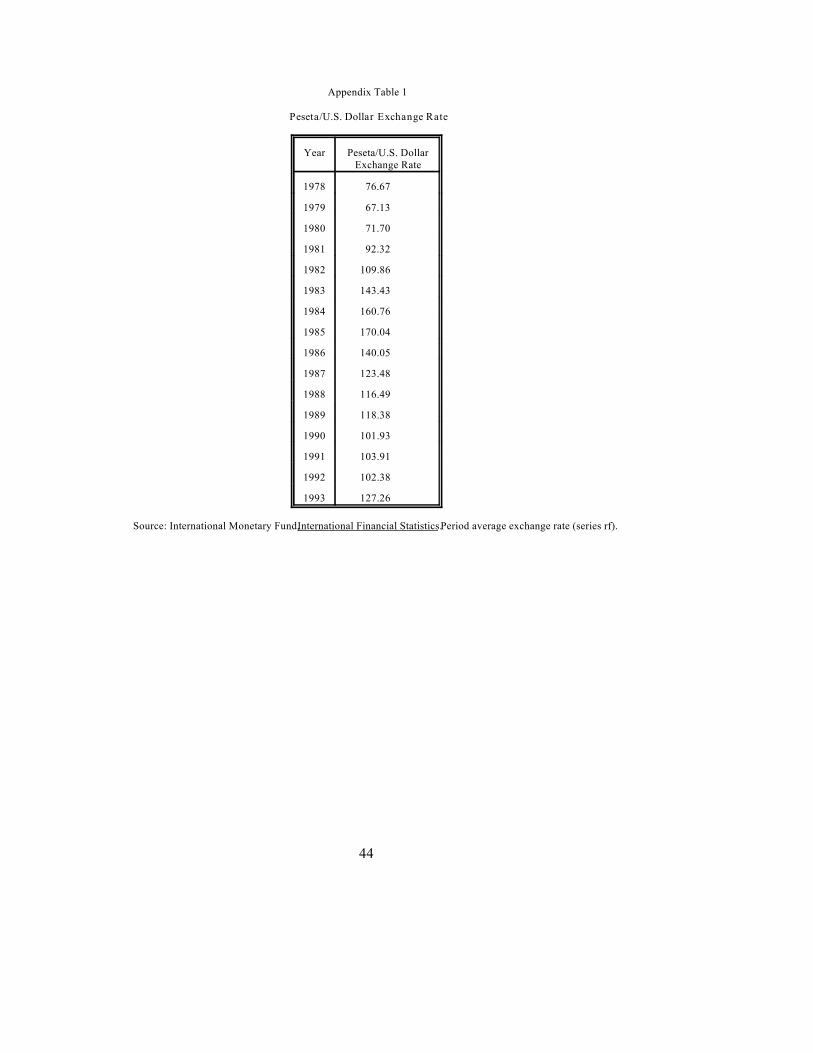
Appendix table 1 provides the average annual peseta/dollar exchange rate during this period.3
See also Novales et al. (1987) and Novales (1989).4
5
doubled during this period (from 641 billion pesetas in 1977 to 1,321 billions by 1982). This3
growth occurred in a seemingly random manner that did not correspond to any coherent strategy.
It was dispersed across very diverse sectors of economic activity and was particularly
concentrated in those industries hardest hit by the economic recession. The acquired firms all
showed a similar pattern of financial losses, lack of financial resources, low productivity,
oversized labor forces, large inefficiencies and for the most part old and mostly obsolete capital
investments.
Given this situation, the financial performance of the INI deteriorated significantly. By
1982 the overall return on assets of the INI was -5.3% while its ratio of profits to its book value
of capital reached a low of -33.4% from -10.3% in 1977. This performance was considerably
worse than the average return in the private sector. Myro (1985) shows that in 1980 private
companies had an average rate of return that was 4.2% higher than state-owned enterprises.4
Myro finds that lower productivity of state-owned enterprises accounts for 42.8% of this
difference in returns, higher labor costs accounts for 40.5% of the difference while the remaining
16.5% is due to higher depreciation rates. Lower productivity of state-owned corporations could
be broken down between 44.4% due to lower labor productivity while lower capital productivity
accounted for the remaining 55.6%.
III.- Restructuring and Retrenchment of the Public Sector

Restructuring plans were approved for the following industries: home appliances,5
shipbuilding, iron and steel, specialty steels, textiles, footwear, fertilizers, electronic equipment,heavy machinery, and cables and other electrical components.
Two single firm (ERT Group and Standard-ITT) restructuring plans were also approved.6
6
Once the process of political reform had been mostly completed by 1980, the government
began to concentrate on the need to restructure industrial activity in a number of industries.
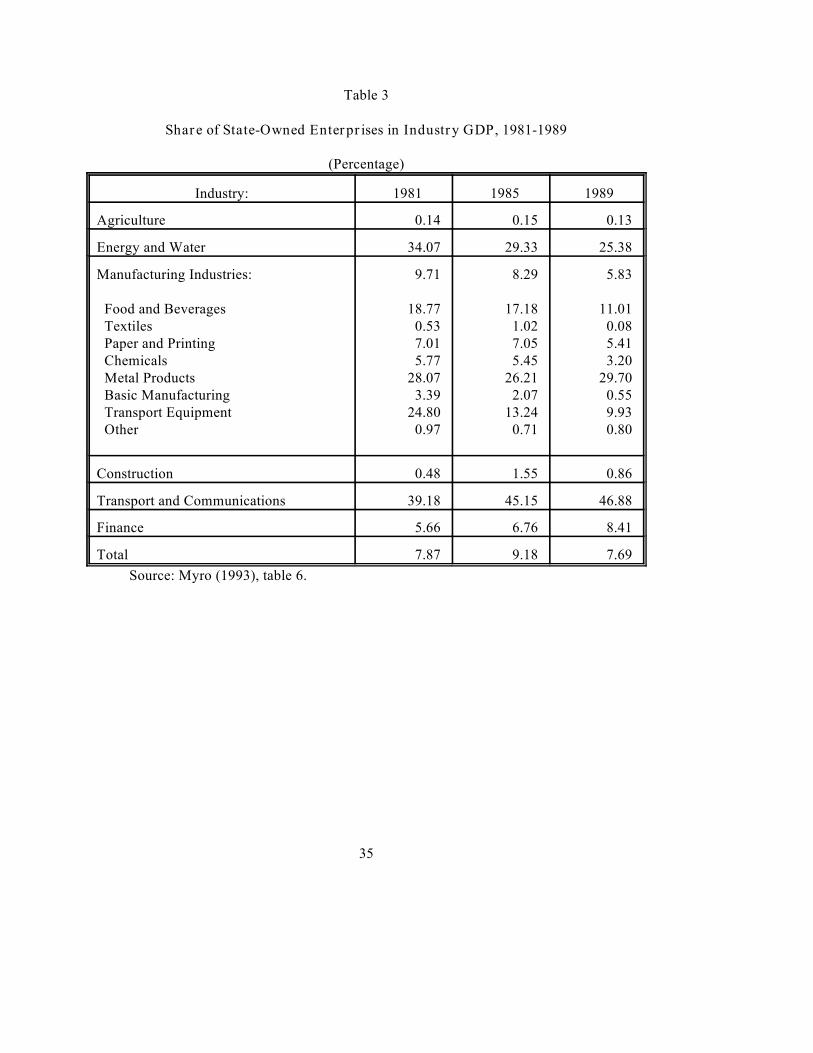
Table 3 shows the share of GDP by industry accounted by state-owned enterprises during the
decade of the 1980s. The table shows a significant decline in the contribution of state-owned
enterprises to GDP in manufacturing industries which went from 9.71% in 1981 to only 5.83%
by 1989. This reduction in public participation in manufacturing industries was most pronounced
in the food, chemicals, heavy manufacturing, and transportation industries. This restructuring
of the public sector took place through general plans for restructuring in industries in need of
a structural adjustment and through policies explicitly designed to improve the performance of
public enterprises.
By 1982 programs had been developed by the existing government for the restructuring
of a number of particular industries. These plans were approved during the 2 year period from5
June 1980 to June 1982. Each plan was specific for each individual industry and applied equally
to all firms in the industry regardless of whether they were private or state-owned enterprises.6
The selection of industries eligible for a restructuring plan was an ad hoc process based on the
relative bargaining position between the firms involved and the government. As a result, this
process favored industries with a small number of large market share companies.
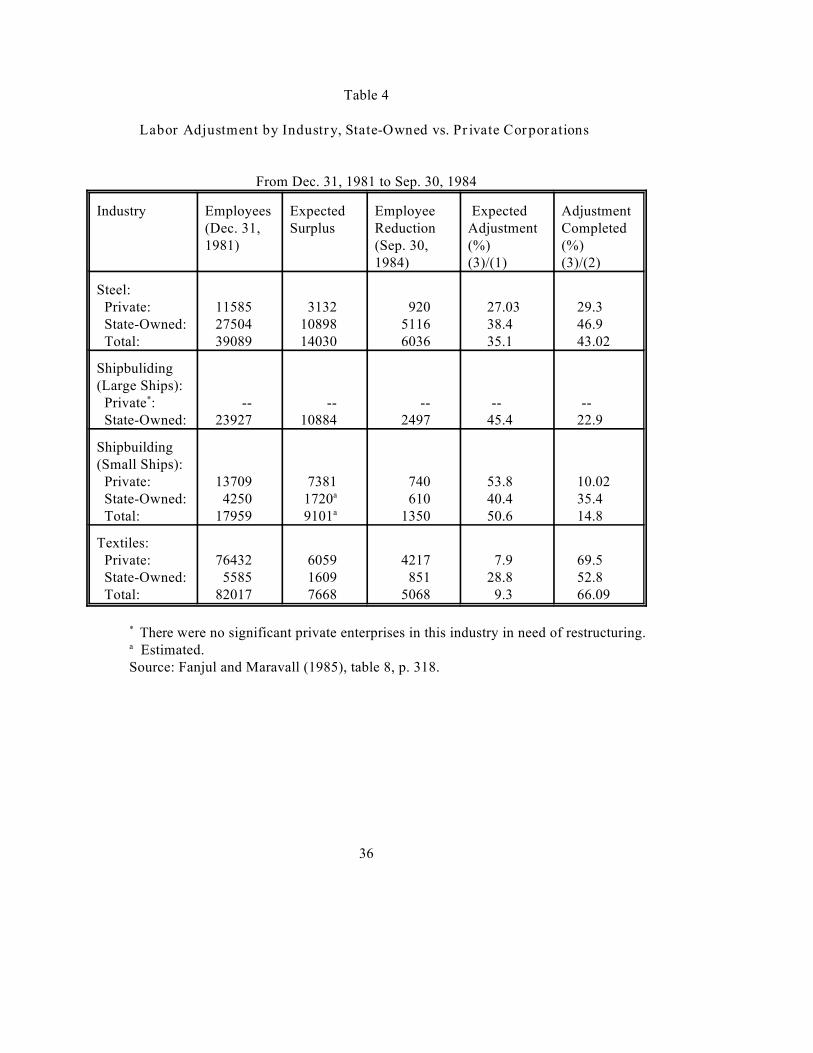
Table 4 lists the industries which had approved restructuring plans. The table reports the
In fact, the performance of state-owned enterprise worsened during this period.7
7
period within which the restructuring should take place, the total number of existing workers in
the industry at the beginning of the period and expected number of surplus workers for the
industry. The last two columns report the actual number of surplus workers as of December
1990 and the proportion of those workers relative to the initial estimate. Most of the large
surplus workers are in shipbuilding (large ships), iron and steel and specialty steels, precisely the
industries with the largest share of state-owned enterprises. Notice also that the number of
estimated excess workers at the time the restructuring plans were developed were considerably
less in these industries than the actual surplus workers as of December 1990, indicating that the
initial restructuring plans were overly optimistic on the future of these industries.
The restructuring plans for most of these industries were approved prior to the arrival of
the Socialist government in November 1982. However, until that moment the group of state-
owned enterprises affected did not undergo any significantly reform. The existing government
already lacked any significant support by the beginning of 1982 and was incapable of enforcing
these plans on state-owned enterprises. With the arrival to power of the Socialist Government,7
a revised proposal for industrial reconversion was approved by the spring of 1983. This revised
proposal contained a single integrated, and internally consistent, plan for the overall restructuring
of economic activity. Most important, there was a clear vision on the role that state-owned
enterprises should play in the country's economic development. State-owned enterprises were
to exist within the context of a market economy and be evaluated according to the performance
standards of a market economy. Those firms that proved to be unprofitable or with no strategic
8
role in overall industrial activity were to either be closed or sold back to the private sector. The
objective in the restructuring of the public sector was not only to decrease existing losses but to
also build the basis for a group of state-owned enterprises that would provide impetus to the
overall industrial activity in the future.
The objectives in the restructuring of state-owned enterprises were focused around three
basic parameters: 1) state-owned companies operating in industries already undergoing
restructuring according to the previously approved restructuring plans should submit themselves
to the same rules and operating behavior that privately held companies in their respective
industries; 2) companies that were not in industries strategically important for the public sector
will either have to be sold to private investors if the firm is perceived to be viable or otherwise
be liquidated; and 3) all remaining state-owned enterprises should be brought up to economic
profitability and their performance should be evaluated by the same standards than those
applicable to private corporations, unless exceptional circumstances were present. This later
clause had special significance since a strategic firm was supposed to be one with special
characteristics that made its evaluation exclusively based on profitability inadequate according
to the government. Some of these firms were perceived to have significant economic
externalities (such as the transportation companies RENFE and IBERIA) while others were
perceived to be maintaining some sort of social-economic stability (such as firms with a large
concentration of employment in specific regions such as HUNOSA).
The retrenchment program of the public sector was divided in two distinct periods. The
first period covered the years 1983 to 1987, and the government's objectives were to be achieved
by a combination of employment reduction, capacity reductions and the liquidation or
The restructuring plan for the mining sector has been consistently delayed and HUNOSA and8
Figaredo remain as the two state-owned companies in need of a considerable adjustment.
9
privatization of non-profitable public companies. Firms belonging to industries undergoing
restructuring were rationalized during this period. Other state-owned firms that were not
perceived to be necessary they remained in the public sector were either privatized of liquidated.
Large financial contributions from the public sector were needed to write out the accumulated
losses of the different companies and to write off existing unprofitable capital investments.
The second period (which continues onto the present) has focused on increasing the
productivity and technological capability of the remaining public companies with profit potential
while continuing the reduction of the number of unprofitable corporations. In September 1991,
the government formalized this reorganization by instigating a split of the major public holding
INI into two separate holdings: INISA includes all remaining public companies that are either
already profitable or potentially so, and INISE includes all the remaining unprofitable companies
which have no expectation to ever become lucrative. Public contributions for INISA were8
primarily directed in this period towards new investments in productive capacity of the firms
with profit potential.
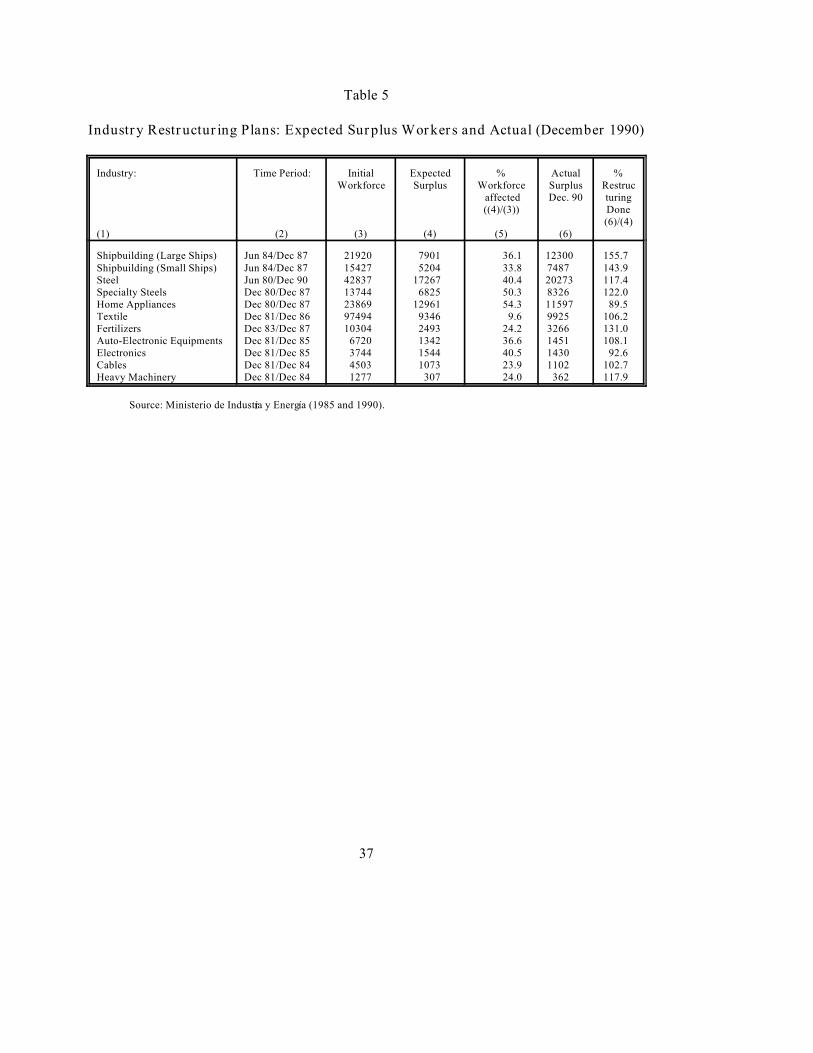
The implementation of the restructuring plans previously approved for the shipbuilding,
steel, aluminum, and fertilizer industries to the state-owned companies was performed fairly
quickly during the first period. Table 5 reports the degree to which labor adjustment in four
industry had been accomplished by September 1984. The labor adjustment in the table is broken
down by whether the employment reductions were performed by private or public enterprises.
The last column shows that the public sector was faster in adjusting its labor force than private
10
companies in those sectors in which it had the largest share of workers (i.e., steel and
shipbuilding). In steel most of the adjustment had taken place through the closing of a single
company in Sagunto (accounting for 2475 workers). As will be discussed below most of these
adjustments were done through special Employment Promotion Funds.
As shown in Table 4, this process had been basically completed by December 1990. The
privatization of other state-owned enterprises was also performed in a fairly short period of time.
The next section focuses on this process of privatization. This privatization primarily focused
on companies producing basic manufacturing, food, autos, defense, and transportation.
IV.- Privatization of Public Enterprises
As part of the overall rationalization of the group of state-owned enterprises, the
government started evaluating in 1983 the possibility of selling back to the private sector some
of its existing enterprises. The government explicitly recognized that selling sate-owned
enterprises made sense whenever the private sector could guarantee the financial and commercial
viability of the enterprise and also provide larger value for the company than the public sector
(MINER, 1983). Whenever this is the case, a price (positive or negative) must exist at which
the transaction will be advantageous for buyer and seller.
The government decided to privatize an existing state-owned enterprise when either of
the two following reasons were present: 1) the company operated in an industry in which the
activity was dominated by multinationals and the company did not have sufficient size to

In most cases, the INI had already been contributing large amounts of capital to cover past9
losses and recurring restructuring expenses.
11
guarantee its independent viability; 2) the company was profitable but did not have any strategic
interest for the public sector, either because there wasn't any reason for the public sector to
participate in that industry or because the company was sufficiently small that had no significant
impact on overall industry activity. Finally, the government also committed to the closing and
liquidation of those companies whose viability was clearly implausible.
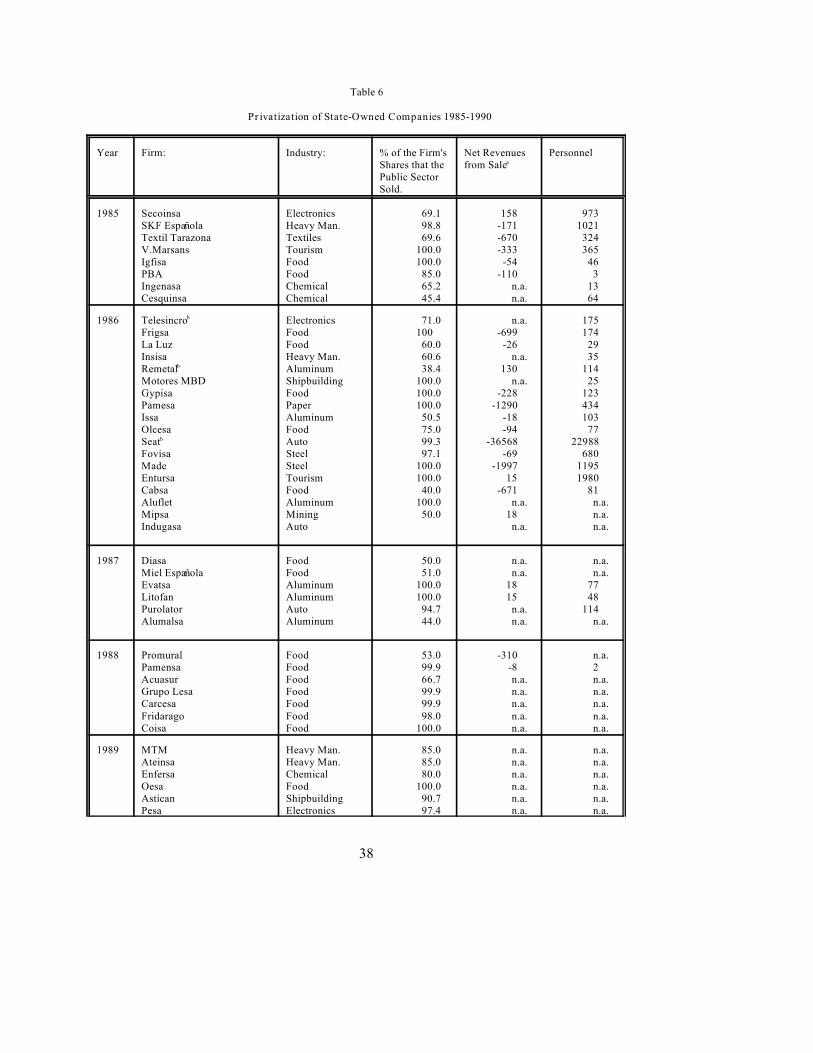
Table 6 lists the state-owned companies that were privatized or closed between 1985 and
1990. There were a total of 47 enterprises representing a total number of over 35,000 employees
which amounted to over 20% of the employment by INI. With the exception of the auto
companies SEAT and ENASA most of these companies were relative small companies in
industries that were either not perceived to be strategic (food, textile, tourism) or highly
internationalized (food, automobile, chemical, aluminum). In no case were these firms major
players in their respective industries. The second to last column shows the cost of the transaction
for the public sector. Given the available information the public sector resulted with a negative
cash-flow in almost all of the transactions reflecting the need of these companies for a major
restructuring and significant investments to guarantee their long run performance.9
The largest privatization by far was the sale of the automaker SEAT to the German
company Volkswagen. Volkswagen had signed a collaboration agreement with the Spanish
government in 1982 and agreed to purchase 51 percent of the stock in 1985 and up to a 100% of
the capital by the end of 1990. Prior to the sale however, a large effort of financial and
productive restructuring of the company was needed. In the period prior to the privatization,
12
from 1978 to 1985, the company reported cumulative losses of 198 billion pesetas and MartRn
AceZa y ComRn (1991) estimate that the public sector contributed over 408 billion pesetas to the
company to cover losses and performed the necessary restructuring and investment.
As part of these privatization process, the government also started a process of initial
public offerings of small portions of the capital of other large sate-owned enterprises through the
stock market. Usually, in these cases the public sector remained as the majority shareholder and
kept the management control. Public utilities (ENDESA) and large public monopolies (such as
IBERIA, Telefonica, and the petrochemical company REPSOL) were all partly privatized during
this period. These offers had the goal of increasing the net cash-flow of the companies and
therefore reducing the contributions from the public budget. These public offers were not
limited to the domestic market with public offerings in the New York Stock Exchange by
ENDASA, REPSOL and Telefonica.
V.- Employment Reduction Schemes: The Employment Promotion Funds
As stated above, the government decided that those state-owned enterprises in industries
undergoing a process of restructuring already under the current provisions should follow the
procedures stated in each industry's restructuring plan for its adjustment. Given that a large
number of companies had been taken over by the public sector during the previous decade, by
the time these restructuring plans took effect in the early 1980s the share of state-owned
companies in total industry was very large in the four sectors in which significant public
restructuring was necessary mainly (shipbuilding, steel, specialty steel, and fertilizers).
This implied that a firm in one of these sectors was automatically presumed to be under10
need of restructuring.
13
Therefore, we can talk about restructuring in these four sectors as being primarily the
restructuring of state-owned enterprises.
One of the primary goals of the restructuring was the reduction of total employment in
these industries. Both government and trade unions agreed that this employment reduction had
to be achieved with the lowest possible adjustment cost for the workers affected. They
substantially disagree, however, on the optimal schemes to achieve this goal. The government
believed the optimal policy would be the rescission of existing contracts to a percentage of
existing workers while the trade unions favored alternative forms of effective employment
reduction such as reductions in weekly working hours, voluntary substitution of full-time
employment into part-time, voluntary resignations, and early retirement schemes that did not
require the direct cancellation of any existing contracts.
These disagreements between government and trade unions on what should be the optimal
employment reduction schemes led to a lack of agreement on a standardized policy to be applied
across industries. Industry specific restructuring plans would have to be agreed upon among
existing firms in the industry, trade unions and the government. However, once a restructuring
plan for an industry was approved, firms in that industry immediately qualified for the
exceptions from the regular labor regulations available under that particular plan for firms in
need of restructuring. Therefore, the firm did not have to prove it needed restructuring, it only10
had to present a restructuring plan that was consistent with the regulations in its industry specific
restructuring plan.
14
The only single measure applicable to all these industries referred to the minimum
amount of unemployment benefits that a worker in a restructuring industry would be entitled.
All unemployed workers in these industries were eligible for the maximum of unemployment
benefits under the current system, regardless of how many years they had worked in the past or
what their normal unemployment benefits would have been (unemployment benefits under the
normal system were a function of a worker's age and the length of time working prior to
unemployment, see table 7 below). This measure was perceived to be necessary to minimize the
social cost of the increased level of structural unemployment created by the restructuring,
specially given the high difficulties to employed surplus workers from these industries in the rest
of the economy. The rest of employment reduction schemes in these industries centered around
the creation of Employment Promotion Funds (EPF) for each industry. These Funds were
designed to ease the workers' costs from restructuring by increasing the duration and amount of
their financial benefits and by helping workers improve their probability of reemployment.
The first Employment Promotion Fund was created in 1984 in specialty steels and it was
quickly imitated by the other three industries. These Funds were immediately perceived to be
the key instrument to reallocate excess workers from restructuring industries. Although the
Funds were in principle industry specific, their basic regulations and functioning share a number
of common parameters. In particular, their form of operation and the type and amount of
benefits provided by the different Funds were essentially identical. Four Funds were created:
specialty steels, shipbuilding, home appliances and an independent Fund for the steel company
AHM. The first and last had a regional focus while the other two applied nationwide. These
funds were jointly managed by an equal number of representatives from the participating
15
companies, the trade unions and the government.
The funding for EPFs was in principle to be provided by five different sources: 1) the
contributions (primarily from firms and central government) per worker joining the Fund
established in its creation; 2) voluntary company contributions; 3) public subsidies; 4) financial
returns on the Fund's endowment; and 5) other contributions including the "solidarity
contributions" from the workers remaining employed in these companies. De facto, most of the
funding came from the first three sources.
The three objectives of these Employment Promotion Funds were: 1) to guarantee a high
level of benefits to misplaced workers; 2) to retrain and promote the employability of these
workers; and 3) to reallocate the workers in other industries. Let's analyze the first two of these
objectives here. Given the special importance of the third goal we will look at it with more
detail in the following section.
Worker's Benefits under the Employment Promotion Funds
Table 7 summarizes the benefits that a worker joining an EPF was entitled. The first
column of the table shows the existing level of benefits by type of worker available under the
regular unemployment system. In both cases, the amount and type of benefits varied depending
on the worker's age at the time he or she joined the EPF (ie. became unemployed). However,
the benefits provided by the EPFs were in all cases more favorable (both in their duration and
in the amount of benefits) than what the worker was entitled under the regular system.
Workers 60 years of age or older received, until they reached 65 years of age, benefits
equal to 75% of their average gross pay while working. After turning 65 they were to receive
100% of their corresponding pension base. This pension base would have been updated during
This was the result of a compromise between the government and the trade unions to11
account for the latter's opposition to any layoffs. Under the Employment Promotion Funds,workers under 55 would have their contracts suspended while workers 55 and older will havetheir contracts terminated and would enter in the early retirement scheme.
In practice, however, as we will see below, given the lack of success in re-employing these12
workers the Funds were extended and workers did not use this option.
16
the years prior to the worker reaching 65 at the same rate as if the worker had remained working
in her last job. Workers between 55 and 60 years of age received 80% of their average gross pay
while working until they reached 60 years of age. These workers could possibly obtain an
increase in their 4th and 5th year equal to the increase for that year agreed upon by the collective
agreement in the industry. During this period the Fund would also continue to pay the social
security contributions for these workers so that the worker could reach early retirement at the
age of 60 as if she had continued working until that moment. After turning 60, the workers were
eligible for early retirement under the regular system.
Finally, workers under 55 years of age were eligible for 3 years of unemployment
benefits of an amount equal to 80% of their average gross salary while working. Workers under
55 joining an EPF did not, however, have their existing contracts formally terminated, their
contracts were only being temporarily "suspended". This implied that when workers finished11
their 3 year period of benefits they could become officially unemployed and could therefore
qualify for the special general provision stated above that entitled workers in restructuring
industries to the maximum of unemployment benefits under the regular unemployment system.12
The benefits stated in Table 7 for EPFs workers were usually a guaranteed minimum
compensation that was often complemented by company contributions, specially for the early
Any compensation above regular unemployment benefits was, however, subject to income13
tax. Also subject to income tax was all compensation received once the worker reached 60 yearsof age, since this compensation was considered retirement income rather than unemploymentbenefits.
17
retirement schemes. In summary, the level of benefits was very generous. It is true that surplus
workers experienced a lost in their real incomes relative to the remaining workers in the industry
but their benefits were clearly superior to those of other unemployed workers in the economy.
In fact, the real benefits were larger than what appears in Table 7 since a decision by the
Supreme Court held that unemployment benefits were neither subject to Income Tax nor subject
to withholding. 13
This system of benefits was expected to be financed by the National Employment Agency
(part of the Ministry of Labor), the Social Security Administration, the EPFs, the companies
involved and the so called Solidarity Contributions from employed workers in the industry. The
Employment Agency paid the regular unemployment benefits and the Social Security
contributions for unemployed workers (i.e. for those under 60 years of age). The Social Security
Administration paid the benefits that would correspond under the regular system of benefits to
those workers under early retirement (i.e. for those 60 years or older the percentage of their
salary corresponding to their age in Table 7). The companies paid the extra benefits
corresponding only to those workers that were above 60 years of age when they joined the EPF,
up to their guaranteed benefits under the system. Finally, all remaining contributions were
provided by the Employment Promotion Funds.
Retraining of workers:
Each Fund jointly with the National Employment Agency developed annual programs to
18
promote the retraining of workers in their Funds. These programs, primarily financed from
contributions from the National Employment Agency, were directed both towards improving the
current skills of existing workers and towards the retraining of these workers in new activities.
The retraining was primarily focused on the group of workers under 55 years of age. The
expectation by a large number of these workers to be reemployed by their previous employers
led to an excessive emphasis in the updating and improvement of the workers' existing current
skills rather than in the development of new ones. This might have worsened the inability of
these workers to find alternative employment (Pettibo and Saez Barcena 1989).
VI.- Reallocation of Workers to Other Industries
The most important goal of the Employment Promotion Funds was to reallocate
misplaced workers in other industries. This was perceived particularly important for workers
under the age of 55 given that their youth and longer expected work life made the necessary
efforts in retraining and placement most appealing. This reemployment activity was, however,
confronted with a fair amount of opposition by large segments of the population. Given the high
overall unemployment level in the Spanish economy during this period (the average for the
decade of the 1980s was approximately 18%) certain groups questioned (both on legal and
ethical grounds) the preferential treatment and the financial incentives provided by the EPFs for
the employment of their workers in alternative industries as a form of discrimination. This
opposition was most severe in regions such as Ferrol and Vigo where the proportion of EPF
workers relative to total population was particularly high.
Workers that left an EPF to become self-employed are included under the other category.14
19
As stated above, the EPFs were initially created for a temporary period of three years.
The Funds covered benefits for workers under 55 years of age for this three year period on the
expectation that at the end of this period the reallocation of these workers would have been
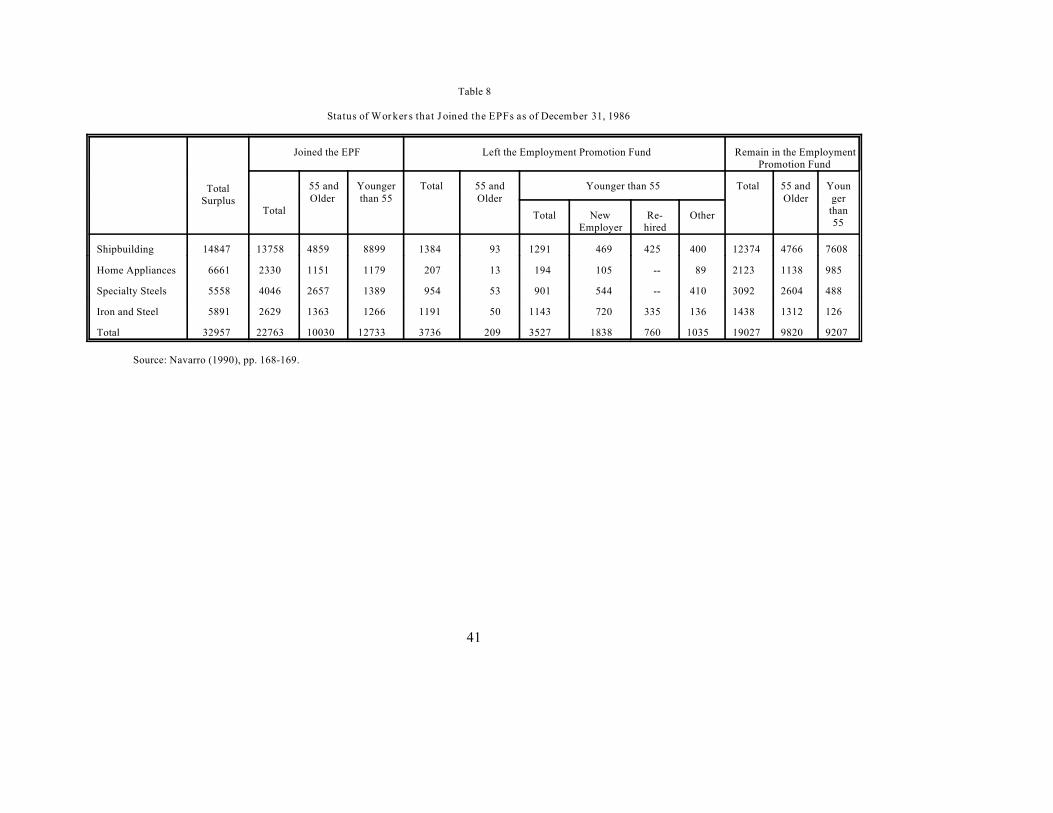
concluded. However, this objective was far from accomplished. Table 8 shows the status of
workers within each of the Employment Promotion Funds at the end of 1986, almost three years
after the Funds had started to operate. Of the 32,957 workers that were initially expected to be
in need of reallocation, more than 22,000 had joined one of the Funds. However, of these only
3,527 had left their Funds by December 1986, less than 20% of all workers. Of the 12,733
workers under 55 years of age that had joined an EPF, only 3,527 had left the Fund by 1986 and
of these only about 50 percent (1,838) had left for new employment in alternative industries. 760
workers were hired back by their previous employers. The amount of worker reallocation was14
drastically lower for workers above 55 years of age. Only 209 out of a total 10,030 of these
workers had left the EPFs by the end of 1986.
The success in the reallocation of workers was not evenly distributed across the different
EPFs. The two EPFs with a regional concentration (i.e. those for the steel and specialty steel
industries) were more effective in re-placing workers than the other two. More that 23% of
workers joining the EPF in specialty steels (954 of 4,046 workers) and almost half of the workers
in iron and steel (1,191 of 2,629 workers) had left their respective Fund by the end of 1986. By
contrast less than 10% of workers in home appliances, and about 10% in shipbuilding had left
their respective EPF in the same period.
Projects in the service sector were not eligible for these benefits. This restriction was15
probably detrimental since employment creation in the service sector accounted for a largepercentage of overall employment creation during this period.
20
The relative success on reallocating workers in the iron and steel and specialty steel
industries was largely due to the provision of regional economic incentives. Most of the
reallocation was accomplished through employment increases in the heavily subsidized "Areas
in need of Urgent Industrialization." These areas were created around seven geographical areas
that had suffered substantial employment reductions (Asturias, Barcelona, Cadiz, Galicia-Ferrol,
Galicia-Vigo, Madrid and Nervion). They were conceived as short run instruments of regional
development (their duration was 18 months) for creating employment with special emphasis on
the re-employment of misplaced workers under the age of 55. Industrial projects undertaken in
these geographic regions were eligible for a number of incentives including reductions in taxes,
preferential access to official financing and up to 30% subsidies of the project's initial
investment. In return for these benefits, the projects were required to create employment in the
industrial sector of the region and to offer a minimum percentage of those new job openings to
EPF workers. 15
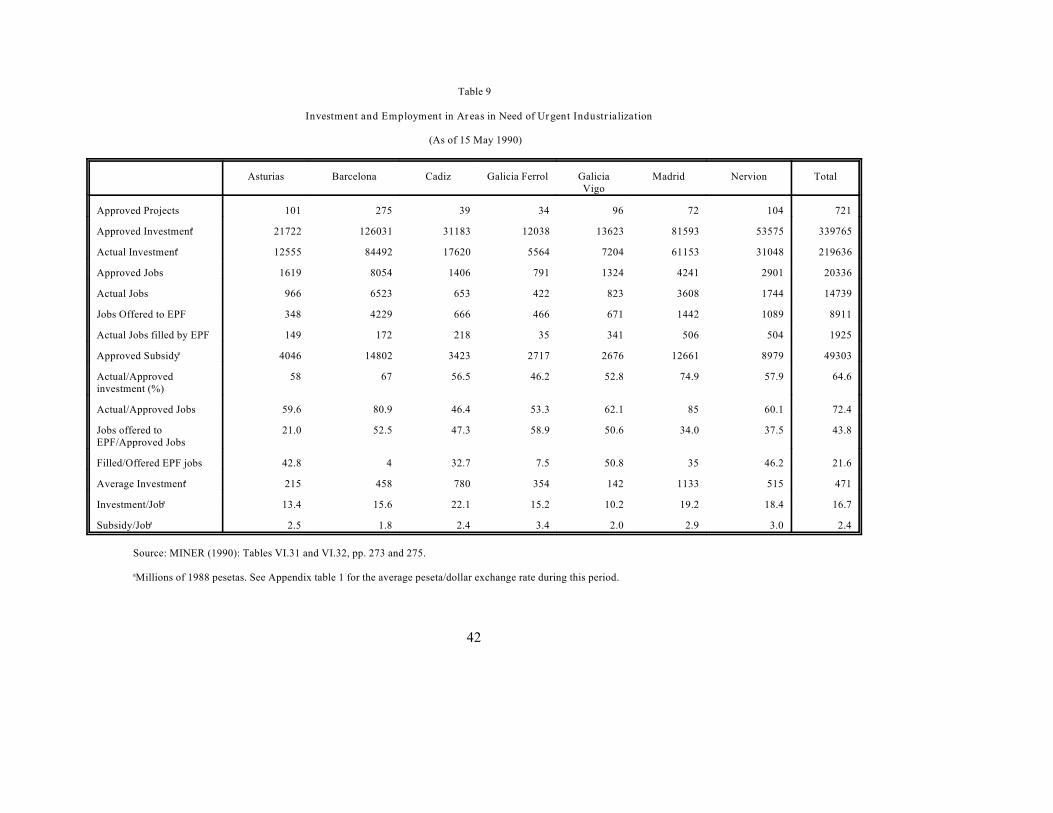
Table 9 shows the distribution of the number of projects by region as well as the overall
level of investment and jobs created under this instrument. The approved projects expected to
create 20,336 jobs nationwide. 8,911 of these jobs were to be offered to workers under the EPF.
This number is clearly below the number of workers under the EPFs but it represented a large
proportion of the workers in the EPFs with priority for re-employment (i.e. the 12,733 workers
under 55 years of age). However, what is really striking is the low level of EPFs workers that
Unfortunately, there is no good information on the amount of internal migration as a result16
of the restructuring process. Anecdotal evidence seems to indicate that this amount was verysmall.
Unfortunately we don't have information on the actual subsidies per actual job created which17
might differed substantially from the approved amounts.
21
were ultimately hired. Only 1,925 EPF workers resulted employed from this scheme,
representing about 21.6% of all jobs approved for EPF workers, and only 14% of the total actual
jobs created. The distribution of these jobs offers also varies widely by region. Projects in the
large urban areas of Barcelona and Madrid were the most successful and generating
employment. They were also the regions with the highest percentage of actual jobs created
relative to expected jobs from approved projects. However, their performance in employing
EPFs workers was very poor with only 4% in Barcelona and 35% in Madrid of all jobs offered
to EPFs workers actually being filled.
The low number of EPF workers ultimately employed might have been due in part to the
lower number of actual jobs created. Other factors, however, such as the mismatch between the
location of the job offer and the worker's residence (for instance, Madrid and Barcelona had a
much higher number of jobs offered relative to misplaced workers than other regions) ,16
disparities between the workers' skills and those required by the jobs being offered, and the
reluctance of some workers to leave the EPFs also contributed to this poor result. The last row
of table 9 reports the estimated financial cost to the public sector per approved job. This cost in
terms of investment subsidies averaged 2.4 million pesetas for the country. However, if we are17
willing to accept that the primary reason behind this policy scheme was to promote the
Given that only about 15% of the total employment increase were EPF workers the cost of18
these subsidies per each of these workers would have been around 15 million pesetas per worker.
22
employment of EPF workers, the cost per EPF worker employed was considerably higher.18
The government, faced with this lack of progress in reallocating workers, decided at the
beginning of 1987 to provide an extension on the duration of these funds for an additional
eighteen month period. After this period, given the continued lack of success in placing
remaining workers, the government decided to terminate the Funds by promoting early
retirements (reaching the total number of affected workers that ended in retirement closed to
22,000) and by unilaterally forcing remaining workers not eligible for early retirement to accept
severance payments of approximately 4 to 5.5 million pesetas, the exact amount depending on
the age and the qualifications of the affected worker.
A number of reasons have been suggested to explain this lack of success in the
reallocation of excess workers. First, most of the workers' retraining efforts were focused in
updating their current skills on their expectation of returning to their previous jobs. As a result
workers might have lacked the skills required by the new jobs. Second, employers also showed
considerable reluctance to hire workers which had shown high levels of labor conflict in the past
and had grown used to the relatively favorable working conditions provided by the public sector.
Third, workers also probably lacked sufficient incentives to accept a new job given their high
level of financial benefits, and their expectation that they either would be likely to return to their
previous jobs or would remain with a level of benefits similar to their current ones.
Finally, a major obstacle for the availability of new positions for these workers is likely
There was also a debate regarding the effects of this preferential treatment on the overall19
labor market. Specially on whether these workers were given significant advantages relative tothe other large pool of unemployed workers, and on whether these workers were actuallyreplacing existing workers implying a zero net increase in overall employment or not.
23
to have been the restrictions on the type of employment contract that had to be offered to them.
In 1984, the government had tried to alleviate the large unemployment rate by stimulating overall
job creation through the introduction of three new labor contracts that allowed for temporary
employment and fixed term contracts. These contracts significantly lowered the burden of
layoffs on employers. As a result, new job offers were most likely to occur under one of these
contracts (by 1989 workers working under one of these contracts accounted for over 30% of total
employment, MINER 1989). The EPFs, in contrast, required new employers to provide a job
offer on a stable basis, i.e. according to the existing labor regulations applicable for full time
indefinite employment. This implied substantial limitations and a larger financial burden on the
ability of the new employer to fire an EPF worker in the future relative to the cost of hiring and
firing a non EPF worker.19
VII.- Estimated Costs of the Retrenchment Process:
There doesn't exist a single estimate of the overall costs of the process of restructuring
and retrenchment of the public sector. It is clear that the Government directed a large amount
of financial resources during the decade of the 1980s and continuous to do so in the present. Part
of these resources have gone to cover operating losses and investments in all companies and part
has gone explicitly to the restructuring of the companies in structural crisis. However, all
Using a different method, Navarro (1990, p. 251) estimates the overall cost of restructuring20
in the Spanish economy at around 3,000 billion pesetas during this period and states that hisestimation assigns about two thirds of these amount to the public sector (i.e. approximately 2,000billion pesetas which is close to the estimate provided above).
To these capital contributions one should also probably add the subsidies to cover losses in21
companies still in need of restructuring. For instance, only for the mining company HUNOSA,this concept amounted to over 100 billion pesetas for the 1982-1986 period (Ruiz Canete 1989).
24
estimates seem to indicate that the cost was very significant.
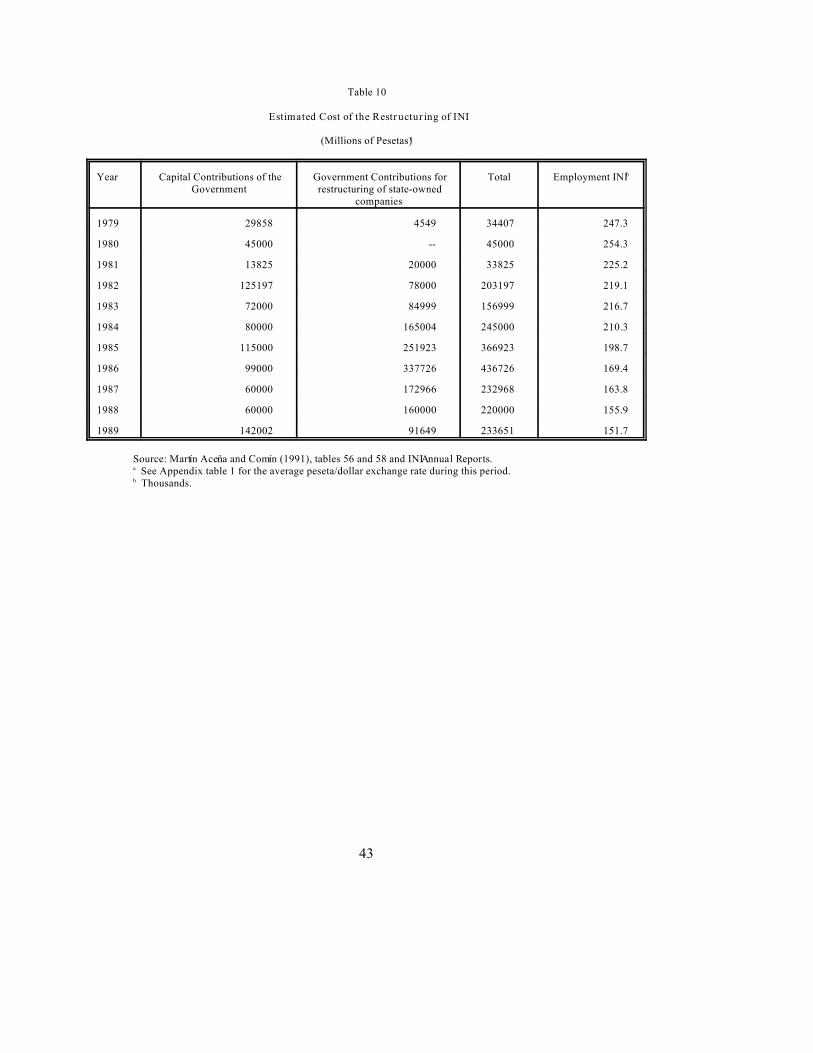
One estimate of the cost of the restructuring of the public sector is reported in Table 10
which shows the financial contributions made by the government to INI (according to its annual
reports) during this period. These contributions are broken down by whether they were for
capital investments or for the specific purpose of the restructuring of state-owned enterprises.
The total contribution between 1978 and 1989 exceeds 2,200 billion pesetas. As expected, most20
of this contribution took place starting in 1982 with the restructuring process. During the peak
of the restructuring, between 1984 and 1988, the total contributions for restructuring surpassed
1,500 billion pesetas. Approximately 700 billions were used to compensate for operating and21
accumulated losses while 600 billion were used for investments in restructuring. The remaining
200 billion is the estimated net cost to the government of the sale of the auto company SEAT to
Volkswagen.
To these direct financial contributions one should add the labor costs of the restructuring
not accounted directly by INI. It is very hard to compute the total cost of employment reduction
for companies under restructuring because most of the costs of misplaced workers are not
covered directly or indirectly by company contributions. Most of the cost of the employment
reduction schemes was covered by other public agencies such as the Social Security
The sectoral distribution of these costs is: shipbuilding 92 billions, iron and steel 66 billions,22
specialty steel 5 billions, and fertilizers 2.2 billions.
Extrapolating from these four sectors will imply an approximately total cost for the 102,00023
workers involved of over 830 billion pesetas. This extrapolation however, is likely to be too highsince a large part of the additional reduction in employment was through the privatization ofcompanies that remained in business.
25
Administration, the National Employment Institute, and regional governments through their
contributions to worker reallocation schemes such as the Employment Promotion Funds and the
Areas in Need of Urgent Industrialization. MartRn AceZa and ComRn (1991) estimate that the
labor costs of reducing employment in the four restructuring industries (steel, specialty steel,
shipbuilding, and fertilizers) was at least 165 billion pesetas. Given that the total reduction in22
employment in these sectors was around 21,000 workers and that the total reduction in
employment of the INI between 1980 and 1989 was approximately 102,000 workers, the total
costs of the labor adjustment was clearly very high. 23
VIII.- Conclusions
This paper has documented the process of public sector retrenchment in Spain during the
last decade with a special emphasis on the reallocation schemes for misplaced workers and the
speed with which these workers were absorbed by the rest of the economy. The process of
public sector retrenchment followed a period in which the public industrial sector became a
temporary hospital for private firms in need of restructuring. This situation had resulted from
a conscious political choice to subordinate economic restructuring to the success of the process
26
of political reform the country was undergoing during this period.
Once public sector retrenchment started in 1983, the process was centered along two
primary strategies. Capacity reductions and technological improvements in state-owned
enterprises to guarantee their future profitability and the liquidation or privatization of those
firms that were either perceived not to be strategic or had no profit potential. These adjustment
process has taken longer than initially anticipated and is still now being implemented in certain
industries that showed high levels of labor opposition (primarily in mining).
The compensation and reallocation schemes developed for workers undergoing
restructuring were centered around the creation of Employment Promotion Funds. These Funds
provided large amounts of financial compensation to misplaced workers and were designed to
promote the employability of these workers in alternative industries. The Funds were initially
conceived to be a temporary institution, however, given their lack of success in reallocating
workers they had to be consistently extended until remaining workers were either accepted into
an early retirement scheme or were provided large one time lump sum monetary amounts.
This inability of the EPFs to provide employment to misplaced workers can be attributed
to the high financial compensations workers received while unemployed which limited their
incentives to accept alternative jobs, the reluctance of employers to hire workers which had
shown high levels of unionization and labor conflicts in the past and the overall high
unemployment rate in the Spanish economy. Also, the partial liberalization of the labor markets
that took place in 1984 did not applied to workers currently covered by an EPF decreasing these
workers employability potential.
The costs, from this process of industrial restructuring were substantial. These costs
27
included the financial costs of improving the balance sheets of troubled companies, the one time
financial incentives provided with the privatization of money loosing firms, the costs of new
investments to foster productivity and technological improvements and the costs of the
compensation schemes through early retirement benefits and other contributions. The overall
financial burden of public sector restructuring, without including the benefits to misplaced
workers, is estimated to be around 2,000 billion pesetas. The estimated cost of benefits to
misplaced workers lie somewhere between 160 billion and 495 billion pesetas.
It is difficult to estimate the total cost per misplaced worker for each of the alternatives
pursued by the Spanish public sector. The government followed three distinct policies: continue
subsidization, restructuring and privatization or liquidation. On aggregate it seems clear that the
total costs per worker (including the subsidization of operating and restructuring capital losses)
was highest on the cases in which the firms remained within the public sector without significant
restructuring (such as HUNOSA). Privatization and restructuring, in this order, seem to have
yield the lowest cost per affected worker from the Spanish experience. However, this
comparison can be highly misleading since the choice of policy applied to each individual firm
was obviously endogenous to the firm's particular situation and the feasibility as well as the
potential costs and benefits of pursuing each policy.
There are several lessons that can be drawn from this Spanish experience. The
availability of the public sector to reallocate workers is limited by the willingness of the
government to accept the social costs that such a reallocation implies. There is a trade off
between the amount and quality of benefits to misplaced workers, and the related costs for these
workers, and the workers willingness to actively pursued and accept alternative employment
28
opportunities. The retraining of workers should focus on the development of new skills capable
of being applied in alternative industries rather than on the improvement of the workers existing
skills, specially since the probability of returning to the same industry is likely to be very low.
The believe by the private sector of the presence of structural low labor productivity and high
labor conflict might reduce their incentive towards providing employment opportunities to these
workers. Finally, requiring higher employment standards on employers even when providing
large financial incentives might result in low employment potential when a more flexible
alternative might exist.
29
References:
Allard, Gayle and Jose Bolorinos (1992): Spain to 2000, The Economist Intelligence Unit,London.
Cuervo GarcRa, Alvaro (1985): "El Ajuste de la Empresa Pdblica: Un Tema Pendiente," Papelesde EconomRa EspaZola, pp. 114-139.
Fanjul, Oscar, and Fernando Maravall (1985): ")A QuJ Ritmo Avanza la Reconversi\nIndustrial en EspaZa?" Papeles de EconomRa EspaZola, pp. 310-324.
FariZas, Jose Carlos, Jordi Jaumandreu and Gonzalo Mato (1989): "La Empresa PdblicaIndustrial EspaZola: 1981-1986" Papeles de EconomRa EspaZola, 38, pp. 199-216.
Fern<ndez, Zulima (1989): "El Alcanze del Proceso Privatizador en EspaZa," Papeles deEconomRa EspaZola, 38, pp. 243-246.
GarcRa Fern<ndez, J. (1990): "PolRtica Empresarial Pdblica 1973-1988," in P. MartRn AceZa andF. ComRn (eds.) Empresa Pdblica e industrializacion en EspaZa.
GarcRa Hermoso, J. M. (1989): "El INI como grupo de negocios: presente y futuro," Papeles deEconomRa EspaZola, 38.
Instituto Nacional de Industria: Memoria Annual, several years.
Instituto Nacional de Industria: Balances Consolidados, 1977-1979.
Instituto Nacional de Industria: Balances agregados, 1980-1982.
Linde, L.M. (1990): "La Profundizaci\n de la crisis econ\mica, 1979-1982," en J.L. GarcRaDelgado ed. EconomRa EspaZola de la transici\n y la democracia, Madrid.
MartRn AceZa, Pablo y Fernando ComRn (1991): INI 50 AZos de Industrializaci\n en EspaZa,Madrid: Bilioteca de EconomRa.
Ministerio de Industria y Energia [MINER] (1983): Libro Blanco de la Reindustrializaci\n,Madrid.
Ministerio de Industria y Energia [MINER] (1984): Informe Anual Sobre la Industria EspaZola1983, Madrid.
Ministerio de Industria y Energia [MINER] (1985): Informe Anual Sobre la Industria EspaZola
30
1984, Madrid.
Ministerio de Industria y Energia [MINER] (1986): Informe Anual Sobre la Industria EspaZola1985, Madrid.
Ministerio de Industria y Energia [MINER] (1987): Informe Anual Sobre la Industria EspaZola1986, Madrid.
Ministerio de Industria y Energia [MINER] (1988): Informe Anual Sobre la Industria EspaZola1987, Madrid.
Ministerio de Industria y Energia [MINER] (1989): Informe Anual Sobre la Industria EspaZola1988, Madrid.
Ministerio de Industria y Energia [MINER] (1990): Informe Anual Sobre la Industria EspaZola1989, Madrid.
Myro, Rafael (1985): "Productividad y Rentabilidad en las Industrias del INI: Una Comparaci\nSectorial con Empresas Privadas," EconomRa Industrial, January-February, pp. 77-88.
Myro, Rafael (1988): "Las Empresas Pdblicas," in J.L. GarcRa Delgado (ed.) EspaZa. EconomRa,Espasa-Calpe, Madrid, pp. 471-497.
Myro, Rafael (1993): "Las Empresas Pdblicas," in J.L. GarcRa Delgado (ed.) EspaZa. EconomRa,2nd. edition, Espasa-Calpe, Madrid, pp. 613-640.
Navarro, Miquel (1990): Politica de Reconversi\n: Balance CrRtico, Madrid: Eudema editores.
Novales, Alfonso (1989): "Evoluci\n del saneamiento financiero de las empresas pdblicasindustriales en EspaZa," Papeles de EconomRa EspaZola, 38.
Novales, Alfonso, Carlos Sebastian, Luis Serven, and J.A. Trujillo (1987): La Empresa PdblicaIndustrial en EspaZa, Madrid, FEDEA.
Pascual RuRz-ValdepeZas, Henar (1993): Reconversi\n y Reindustrializaci\n en EspaZa. Losnuevos dinamismos espaciales, Secretariado de Publicaciones, Universidad de Valladolid.
Pettibo, A. and J. Saez B<rcena (1990): "El papel de la polRtica industrial en la recuperaci\n yreestructuraci\n de la industria espaZola," in J. Velarde et al. eds. La industria espaZola.Recuperaci\n, estructura y mercado de trabajo, Madrid, Colegio de Economistas.
Ruiz CaZete, O. (1989): "Empresa pdblica y transferencias estatales," Papeles de EconomRaEspaZola, 38.

31
V<zquez, Juan (1990): "Crisis, cambio y recuperaci\n industrial," in J.L. GarcRa Delgado ed.EconomRa espaZola de la transici\n y la democracia, Madrid.
32
Table 1
Private Companies Acquired by the Public Sector
Year Acquired: Company: Industry:
1971 MTM Basic Manufacturing
1972 Astano Shipbuilding
1973 Ateinsa Basic Manufacturing
1974 Lesa Food
1976 Barreras ShipbuildingGeasa OthersMahsa FertilizersPovisa
1977 Tarazona TextilesAstilleros de Cadiz Shipbuilding
1978 AHM SteelDiatlansa ShipbuildingOesa Food
1979 SKF Metal ManufacturingCSA Basic ManufacturingSecoinsa ElectronicsAesa Shipbuilding
1980 Figaredo MiningBWE Basic ManufacturingMarsans TravelSeat Auto Manufacturing
1981 Enasa Auto ManufacturingCTE MaritimeAHV SteelIntelhorce Textiles*
1982 Foarsa Steel
1983 Aluminio AluminumAlugasa AluminumHytasa Textiles*
Source: Fern<ndez (1989) and MartRn AceZa and ComRn (1991).

33
Not acquired by INI, they are acquired by la Direccion General de Patrimonio.*
34
Table 2
Instituto Nacional de Industria (INI) Major Financial Indicators (1977-1982)
Billions of Current Pesetasa
1977 1978 1979 1980 1981 1982
Revenues 640.6 736.4 872.3 863.8 1033.2 1320.5
Expenses 621.7 727.9 876.8 854.4 993.6 1300.3
Gross Margin 18.7 8.5 -4.5 9.4 39.6 20.2
Financing Expenses 47.3 57.7 77.2 101.5 135.2 167.6
Net Profits - Normal Operations -28.4 -49.2 -81.7 -92.1 -95.5 -147.3
Net Profits - Except. Operations 5.5 3.7 16.1 -8.5 -10.5 9.4
Pre-tax profits -22.8 -45.5 -65.6 -100.6 -106.1 -137.9
Public Transfers 11.0 17.7 21.3 35.6 5.2 3.8
Profits/net assets -2.0 -3.4 -3.6 -5.6 -4.7 -5.3*
Profits/Book Value of Capital -10.3 -20.0 -15.5 -24.4 -26.0 -33.4*
See Appendix table 1 for the average peseta/dollar exchange rate during this period.a
Percentages.*
Source: Instituto Nacional de Industria (1977-1979 and 1980-1982).
35
Table 3
Share of State-Owned Enterprises in Industry GDP, 1981-1989
(Percentage)
Industry: 1981 1985 1989
Agriculture 0.14 0.15 0.13
Energy and Water 34.07 29.33 25.38
Manufacturing Industries: 9.71 8.29 5.83
Food and Beverages 18.77 17.18 11.01 Textiles 0.53 1.02 0.08 Paper and Printing 7.01 7.05 5.41 Chemicals 5.77 5.45 3.20 Metal Products 28.07 26.21 29.70 Basic Manufacturing 3.39 2.07 0.55 Transport Equipment 24.80 13.24 9.93 Other 0.97 0.71 0.80
Construction 0.48 1.55 0.86
Transport and Communications 39.18 45.15 46.88
Finance 5.66 6.76 8.41
Total 7.87 9.18 7.69Source: Myro (1993), table 6.
36
Table 4
Labor Adjustment by Industry, State-Owned vs. Private Corporations
From Dec. 31, 1981 to Sep. 30, 1984
Industry Employees Expected Employee Expected Adjustment(Dec. 31, Surplus Reduction Adjustment Completed1981) (Sep. 30, (%) (%)
1984) (3)/(1) (3)/(2)
Steel: Private: 11585 3132 920 27.03 29.3 State-Owned: 27504 10898 5116 38.4 46.9 Total: 39089 14030 6036 35.1 43.02
Shipbuliding(Large Ships): Private : -- -- -- -- --*
State-Owned: 23927 10884 2497 45.4 22.9
Shipbuilding(Small Ships): Private: 13709 7381 740 53.8 10.02 State-Owned: 4250 1720 610 40.4 35.4 Total: 17959 9101 1350 50.6 14.8
a
a
Textiles: Private: 76432 6059 4217 7.9 69.5 State-Owned: 5585 1609 851 28.8 52.8 Total: 82017 7668 5068 9.3 66.09
There were no significant private enterprises in this industry in need of restructuring.*
Estimated.a
Source: Fanjul and Maravall (1985), table 8, p. 318.
37
Table 5
Industry Restructuring Plans: Expected Surplus Workers and Actual (December 1990)
Industry: Time Period: Initial Expected % Actual %
(1) (2) (3) (4) (5) (6)
Workforce Surplus Workforce Surplus Restruc affected Dec. 90 turing((4)/(3)) Done
(6)/(4)
Shipbuilding (Large Ships) Jun 84/Dec 87 21920 7901 36.1 12300 155.7Shipbuilding (Small Ships) Jun 84/Dec 87 15427 5204 33.8 7487 143.9Steel Jun 80/Dec 90 42837 17267 40.4 20273 117.4Specialty Steels Dec 80/Dec 87 13744 6825 50.3 8326 122.0Home Appliances Dec 80/Dec 87 23869 12961 54.3 11597 89.5Textile Dec 81/Dec 86 97494 9346 9.6 9925 106.2Fertilizers Dec 83/Dec 87 10304 2493 24.2 3266 131.0Auto-Electronic Equipments Dec 81/Dec 85 6720 1342 36.6 1451 108.1Electronics Dec 81/Dec 85 3744 1544 40.5 1430 92.6Cables Dec 81/Dec 84 4503 1073 23.9 1102 102.7Heavy Machinery Dec 81/Dec 84 1277 307 24.0 362 117.9
Source: Ministerio de IndustrRa y EnergRa (1985 and 1990).
38
Table 6
Privatization of State-Owned Companies 1985-1990
Year Firm: Industry: % of the Firm's Net Revenues PersonnelShares that the from SalePublic SectorSold.
a
1985 Secoinsa Electronics 69.1 158 973SKF EspaZola Heavy Man. 98.8 -171 1021Textil Tarazona Textiles 69.6 -670 324V.Marsans Tourism 100.0 -333 365Igfisa Food 100.0 -54 46PBA Food 85.0 -110 3Ingenasa Chemical 65.2 n.a. 13Cesquinsa Chemical 45.4 n.a. 64
1986 Telesincro Electronics 71.0 n.a. 175b
Frigsa Food 100 -699 174La Luz Food 60.0 -26 29Insisa Heavy Man. 60.6 n.a. 35Remetal Aluminum 38.4 130 114b
Motores MBD Shipbuilding 100.0 n.a. 25Gypisa Food 100.0 -228 123Pamesa Paper 100.0 -1290 434Issa Aluminum 50.5 -18 103Olcesa Food 75.0 -94 77Seat Auto 99.3 -36568 22988b
Fovisa Steel 97.1 -69 680Made Steel 100.0 -1997 1195Entursa Tourism 100.0 15 1980Cabsa Food 40.0 -671 81Aluflet Aluminum 100.0 n.a. n.a.Mipsa Mining 50.0 18 n.a.Indugasa Auto n.a. n.a.
1987 Diasa Food 50.0 n.a. n.a.Miel EspaZola Food 51.0 n.a. n.a.Evatsa Aluminum 100.0 18 77Litofan Aluminum 100.0 15 48Purolator Auto 94.7 n.a. 114Alumalsa Aluminum 44.0 n.a. n.a.
1988 Promural Food 53.0 -310 n.a.Pamensa Food 99.9 -8 2Acuasur Food 66.7 n.a. n.a.Grupo Lesa Food 99.9 n.a. n.a.Carcesa Food 99.9 n.a. n.a.Fridarago Food 98.0 n.a. n.a.Coisa Food 100.0 n.a. n.a.
1989 MTM Heavy Man. 85.0 n.a. n.a.Ateinsa Heavy Man. 85.0 n.a. n.a.Enfersa Chemical 80.0 n.a. n.a.Oesa Food 100.0 n.a. n.a.Astican Shipbuilding 90.7 n.a. n.a.Pesa Electronics 97.4 n.a. n.a.

39
1990 Saldosa Chemical n.a. n.a.Enasa Autos 100.0 n.a. n.a.
Source: Myro (1989) and Fern<ndez (1989).
Millions of Pesetas. See Appendix table 1 for the average peseta/dollar exchange rate during this period.a
The public sector maintained a minority participation in these firms after this privatization.b

40
Table 7
Benefits for Unemployed Workers Under the Employment Promotion Funds (EPF)
Worker's Age: Ordinary System of Benefits: Promotion Employment Funds
<55 Years Basic Benefits: - Duration: 3 Years-Duration: 24 Months - Amount: 80% of gross salary while working-Amount: - Updates: no 6 Months, 80% of BR 6 Months, 70% of BR 12 Months, 60% of BR
>= 55 Years but Basic Benefits: - Duration: until 60 years of age< 60 Years - Duration: 24 Months - Amount: 80% of gross salary while working
-Amount: - Updates: update during years 4 and 5 6 Months, 80% of BR according to the collective agreement 6 Months, 70% of BR - Social Security contributions get updated 12 Months, 60% of BR annually so as to reach early retirement - Updates: No as if the person had been working until
Additional Benefits:- Duration: until 60 years of age- Amount: 75% of minimum wage.- Updates: No
reaching 60 years.
>=60 Years Option A: basic unemployment benefits as in - Duration: from age 60 to 65other age groups. - Amount: 75% of gross salary while working.
Option B: early retirement with the From 65 years on, 100% of pension following payments: 60% at corresponding to its BR.60, 68% at 61, 76% at 62, - Updates: Equivalent to compensation changes 84% at 63 and 92% starting at had the worker remain working in her 64. last job.
- Updates: No
BR = "Base Reguladora" is the unemployment base wage. It is computed as the mean of the social security wage baseduring the six months prior to unemployment. Its amount is considerably smaller than the average gross wage since certaincomponents of the gross wage are not included in the social security wage base and there is also a maximum on the social securitywage base.
Source: Navarro (1990) pp. 158-159.
41
Table 8
Status of Workers that Joined the EPFs as of December 31, 1986
TotalSurplus
Joined the EPF Left the Employment Promotion Fund Remain in the EmploymentPromotion Fund
Total than
55 and Younger Total 55 and Younger than 55 Total 55 and YounOlder than 55 Older Older ger
55Total New Re- Other
Employer hired
Shipbuilding 14847 13758 4859 8899 1384 93 1291 469 425 400 12374 4766 7608
Home Appliances 6661 2330 1151 1179 207 13 194 105 -- 89 2123 1138 985
Specialty Steels 5558 4046 2657 1389 954 53 901 544 -- 410 3092 2604 488
Iron and Steel 5891 2629 1363 1266 1191 50 1143 720 335 136 1438 1312 126
Total 32957 22763 10030 12733 3736 209 3527 1838 760 1035 19027 9820 9207
Source: Navarro (1990), pp. 168-169.
42
Table 9
Investment and Employment in Areas in Need of Urgent Industrialization
(As of 15 May 1990)
Asturias Barcelona Cadiz Galicia Ferrol Galicia Madrid Nervion TotalVigo
Approved Projects 101 275 39 34 96 72 104 721
Approved Investment 21722 126031 31183 12038 13623 81593 53575 339765a
Actual Investment 12555 84492 17620 5564 7204 61153 31048 219636a
Approved Jobs 1619 8054 1406 791 1324 4241 2901 20336
Actual Jobs 966 6523 653 422 823 3608 1744 14739
Jobs Offered to EPF 348 4229 666 466 671 1442 1089 8911
Actual Jobs filled by EPF 149 172 218 35 341 506 504 1925
Approved Subsidy 4046 14802 3423 2717 2676 12661 8979 49303a
Actual/Approved 58 67 56.5 46.2 52.8 74.9 57.9 64.6investment (%)
Actual/Approved Jobs 59.6 80.9 46.4 53.3 62.1 85 60.1 72.4
Jobs offered to 21.0 52.5 47.3 58.9 50.6 34.0 37.5 43.8EPF/Approved Jobs
Filled/Offered EPF jobs 42.8 4 32.7 7.5 50.8 35 46.2 21.6
Average Investment 215 458 780 354 142 1133 515 471a
Investment/Job 13.4 15.6 22.1 15.2 10.2 19.2 18.4 16.7a
Subsidy/Job 2.5 1.8 2.4 3.4 2.0 2.9 3.0 2.4a
Source: MINER (1990): Tables VI.31 and VI.32, pp. 273 and 275.
Millions of 1988 pesetas. See Appendix table 1 for the average peseta/dollar exchange rate during this period.a
43
Table 10
Estimated Cost of the Restructuring of INI
(Millions of Pesetas)a
Year Capital Contributions of the Government Contributions for Total Employment INIGovernment restructuring of state-owned
companies
b
1979 29858 4549 34407 247.3
1980 45000 -- 45000 254.3
1981 13825 20000 33825 225.2
1982 125197 78000 203197 219.1
1983 72000 84999 156999 216.7
1984 80000 165004 245000 210.3
1985 115000 251923 366923 198.7
1986 99000 337726 436726 169.4
1987 60000 172966 232968 163.8
1988 60000 160000 220000 155.9
1989 142002 91649 233651 151.7
Source: MartRn AceZa and ComRn (1991), tables 56 and 58 and INI Annual Reports. See Appendix table 1 for the average peseta/dollar exchange rate during this period.a
Thousands.b
44
Appendix Table 1
Peseta/U.S. Dollar Exchange Rate
Year Peseta/U.S. DollarExchange Rate
1978 76.67
1979 67.13
1980 71.70
1981 92.32
1982 109.86
1983 143.43
1984 160.76
1985 170.04
1986 140.05
1987 123.48
1988 116.49
1989 118.38
1990 101.93
1991 103.91
1992 102.38
1993 127.26
Source: International Monetary Fund, International Financial Statistics. Period average exchange rate (series rf).
Top Related