


Languages
Pages
Legal

Pub
lic D
iscl
osur
e A
utho
rized
Pub
lic D
iscl
osur
e A
utho
rized
Pub
lic D
iscl
osur
e A
utho
rized
Pub
lic D
iscl
osur
e A
utho
rized
Pub
lic D
iscl
osur
e A
utho
rized
Pub
lic D
iscl
osur
e A
utho
rized
Pub
lic D
iscl
osur
e A
utho
rized
Pub
lic D
iscl
osur
e A
utho
rized

SS~U!Sng ll!
Sl~J:Jn~~Jng

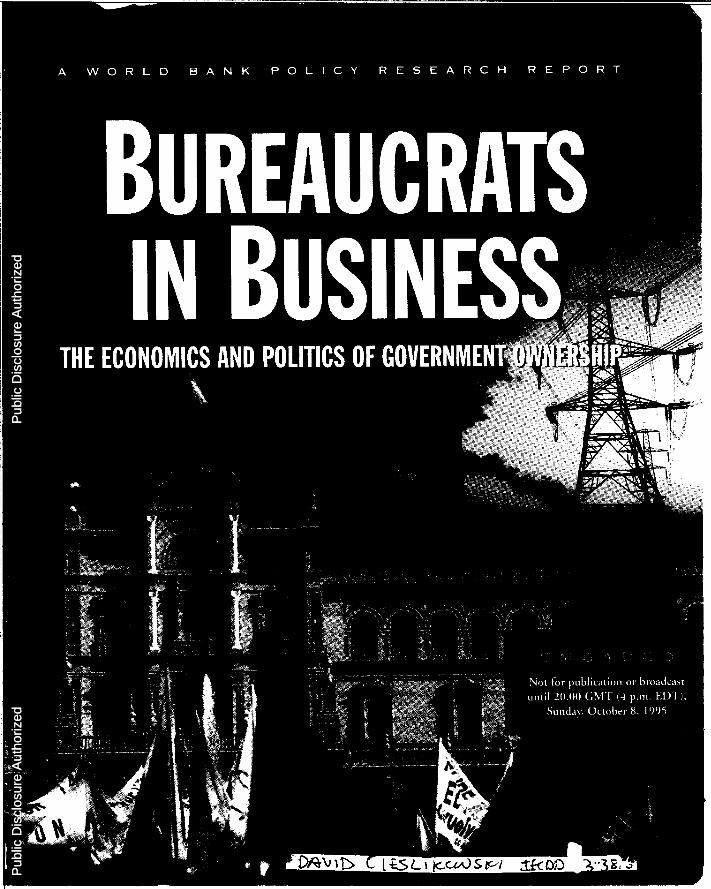
Bureaucrats in Business The Economics and Politics of Government Ownership
Published for the World Bank OXFORD UNIVERSITY PRESS
Oxford University Press
OXFORD NEW YORK TORONTO
DELHI BOMBAY CALCUTTA MADRAS KARACHI
KUALA LUMPUR SINGAPORE HONG KONG TOKYO
NAIROBI DAR ES SALAAM CAPE TOWN
MELBOURNE AUCKLAND
and associated companies in
BERLIN IBADAN
© 1995 The International Bank for Reconstruction and Development/ THE WORLD BANK
1818 H Street, N W. Washington, D.C. 20433, US.A.
Published by Oxford University Press, Inc. 200 Madison Avenue, New York, NY 10016
Oxford is a registered trademark of Oxford University Press. All rights reserved No part of this publication may be reproduced, stored in a retrieval system, or transmitted, in any form or by any means, electronic, mechanical, photocopying, recording, or otherwise, without the prior permission of Oxford University Press.
Manufoctured in the United States of America First printing September 1995
Cover photographs: At the top, a coal-fired power station; Hilary Wilkes (International Stock). At the bottom, a labor demonstration; PeterS. Heller.
The World Bank does not guarantee the accuracy of the data included in this publication and accepts no responsibility whatsoever for any consequence of their use.
Library of Congress Cataloging-in-Publication Data
Bureaucrats in business: the economics and politics of government ownership p. em.- (World Bank policy research report, ISSN 1020-0851) ''Published for the World Bank. " Includes bibliographical reftrences and index. ISBN 0-19-521106-5 1. Government ownership-Developing countries. 2. Government business enterprises-Developing countries. 3. Industrial efficiency-Developing countries. 4. Socialism-Developing countries. 5. Developing countries-Economic conditions. !International Bank for Reconstruction and Development. ll Series. HD4420.8.B87 1995 338.6'2'091724-dc20 95-33961
CIP ISSN 1020-0851
§ Text printed on paper that conforms to the American National Standards for Permanence of Paper for Printed Library Materials. Z39. 48-1984
Contents
Foreword xt
The Report Team x111
Acknowledgments xv
Definitions xvu
Introduction and Overview 1 What Makes for Success in State Enterprise Reform? 4 Contracting: What Works, What Doesn't, and Why 6 The Politics of Reforming State-Owned Enterprises 10 What Can Be Done to Spur Reforms and Improve Outcomes? 14
1 Bureaucrats Are Still in Business 25 State-Owned Enterprise Sector Remains Large Despite Increasing
Divestiture 25 How SOEs Affect Economic Performance 33 Conclusion 50 Notes 51
2 Success and Failure in SOE Reform 55 Measuring Success and Failure 57 What Reform Characteristics Distinguish Successful Reformers? 66 Divestiture and SOE Reform 67 Outgrowing Stated-Owned Enterprises: An Alternative to
Divestiture? 71 Divestiture Alone Is Seldom Enough 75 Improving SOE Performance through Competition 76 Hard Budgets 81 Financial Sector Reform 86 Changing the Relationship between Governments and
SOE Managers 93 Conclusion 95
v
SIN BUSINESS
Appendix 2.1: Reforms to Open SOE Markets to Competition and Introduce Hard Budget Constraints 97
Appendix 2.2: Financial Sector Reform 101 Notes 103
3 Contracting: What Works, What Doesn't, and Why 1 07 How Incentive Factors Interact to Influence Outcomes 109 Performance Contracts: With Public Managers 112 Management Contracts: With Private Managers 133 Regulatory Contracts: With Private Owners 150 Conclusion 168 Notes 171
4 The Politics of SOE Reform 175 Assessing Condition I: Political Desirability 178 Assessing Condition II: The Political Feasibility of SOE Reform 190 Assessing Condition III: The Credibility of State-Owned Enterprise
Reform 203 Explaining and Predicting Reform Success 215 Conclusion 217 Appendix 4.1: The Politics of State-Owned Enterprise Reform:
Additional Evidence 218 Notes 227
5 How to Spur Reforms and Improve Outcomes 231 How to Tell Whether a Country Is Ready to Reform 233 What to Do in Countries Not Ready for SOE Reform 237 What to Do in Countries Ready for SOE Reform 241 What to Do with SOEs That Cannot Be Divested 250 Conclusion 257 Notes 257
Implications for Foreign Assistance 259
Statistical Appendix 263
Refi:rences 325
Index 341
Vl
Boxes How Foreign Aid Can Better Assist State-Owned Enterprise
Reform 17 1.1 What Is a State-Owned Enterprise? 26 1.2 Welfare Consequences of Selling State-Owned Enterprises 39 1.3 Privatization and Pollution 41 2.1 China's Ownership Patterns: Not State but Not Private 66 2.2 External Incentives and Corporate Behavior: The Case of
Shepheard's Hotel 67 2.3 Getting the Most from Privatization 72 2.4 How China's Township and Village Enterprises Differ from
State Enterprises 74 2.5 Uncovering Hidden Subsidies 82 2.6 Procurement Favors SOEs over Private Manufacturers
in India 85 2.7 Roles of a Well Developed Financial System in SOE Reform 87 2.8 Measuring Financial Sector Development 90 2.9 The Financial Sector and SOE Reform: The Case of Poland 91 2.10 Weak Financial Regulation Can Undermine Privatization:
The Case of Chile 93 3.1 Measuring SOE Performance: What about Social Goals? 115 3.2 Performance Contracts in China 131 3.3 3.4 4.1 4.2 4.3 4.4 4.5 4.6 5.1 5.2 5.3
Sri Lanka's Experience with Management Contracts 140 Price Cap and Benchmark Regulation 160 Indicators of Coalition Realignment: The Mexican Example 182 State Enterprise Reform in China 189 Compensation of Reform Losers in Chilean SOE Reforms 196 Mass Privatization through Vouchers in the Czech Republic 202 Measuring Credibility 206 Locking in Reform: Restraints on Executive Discretion in Chile 211 Getting Ready for Reform 238 Privatization Can Have Pitfalls 244 Guarantees and Privatization 251
Tables 1 Unmet Conditions in Less Than Successful SOE Reformers 14 1.1 Divestiture in Developing Countries, 1980-93 27 1.2 Revenue from Divestiture in Developing Countries by Region
and Sector, 1988-93 28 2.1 Twelve Countries Undertaking State-Owned Enterprise Reform 56 2.2 Successful Reformers Divested More 69 2.3 Privatization in Manufacturing 70 2.4a Prereform Status of Domestic Competition, Selected Industries 78
Vll
UCRATS IN BUSINESS
2.4b Postreform (1994) Status of Domestic Competition, Selected Industries 79
2.5 Measures of Foreign Competition 80 2.6 Government Transfers to State-Owned Enterprises (1978-91)
and Price Regulation 83 2. 7 Institutional Reforms of State-Owned Enterprises in the 1980s 94 3.1 Number of Performance Contracts in Developing Countries,
by Sector 112 3.2 Case Study Enterprises 114 3.3 Comparison ofTarget Characteristics 122 3.4 Comparison of Contract Incentives 125 3.5 Instances of Government Reneging in Whole or in Part 127 3.6 Comparison of Performance with Selected Contract
Characteristics 13 2 3.7 Management Contracts by Country 135 3.8 Management Contracts by Sector 136 3.9 Sample of Management Contracts 137 3.10 Summary of Outcomes 138 3.11 The Effects of Selection and Financing on Contract
Performance 146 3.12 Value ofRecent Infrastructure Privatization in Developing
Countries 151 3.13 Sample of Countries with Private Sector Participation in
Telecommunications 152 3.14 Indicators of Quality ofT elecommunications Service, before
and after Reform 155 3.15 Mechanisms for Revealing Information about
Telecommunications 157 3.16 Price Regulation in Sample Countries 161 3.17 Agencies Enforcing Regulations: Their Neutrality, Enforcement
Powers, and Skills 164 4.1 Condition I for State-Owned Enterprise Reform: Political
Desirability 180 4.2 Estimates of Overstaffing in State-Owned Enterprises 192 4.3 Condition II for State-Owned Enterprise Reform: Political
Feasibility 193 4.4 Condition III for State-Owned Enterprise Reform: Credibility 208 4.5 Unmet Conditions in Less Than Successful SOE Reformers 216
Appendix tables A.1 Share of State-Owned Enterprises in Economic Activity,
1978-91 268 A.2 Share of State-Owned Enterprises in Nonagricultural Economic
Activity, 1978-91 272
Vlll
A.3 Share of State-Owned Enterprise Investment in Gross Domestic Investment, 1978-91 276
A.4 State-Owned Enterprise Investment as a Proportion of Gross Domestic Product, 1978-91 282
A.5 Share of State-Owned Enterprises in Employment, 1978-91 288 A.6 State-Owned Enterprise Overall Balances before Transfers as a
Proportion of Gross Domestic Product, 1978-91 292 A.7 Net Financial Flows from Government to State-Owned
Enterprises as a Proportion of Gross Domestic Product, 1978-91 296
A.8 Share of State-Owned Enterprises in Gross Domestic Credit, 1978-91 300
A.9 Gross Domestic Credit to State-Owned Enterprises as a Proportion of Gross Domestic Product, 1978-91 304
A.1 0 Share of State-Owned Enterprises in Total External Debt, 1978-91 308
A.ll External Debt of State-Owned Enterprises as a Proportion of Gross Domestic Product, 1978-91 312
Figures 1 A Decision Tree for State-Owned Enterprise Reform 16 1.1 Share of State-Owned Enterprise Investment in Gross
Domestic Investment, by Region 29 1.2 Share of State-Owned Enterprises in Gross Domestic Product,
by Region 31 1.3 Share of State-Owned Enterprise Employment in Total
Employment, by Region 32 1.4 Three Measures ofSOE Importance in Low-Income Economies 34 1.5 Pollution Abatement Efforts 40 1.6 Water Pollution Levels, by Age and Ownership of Firm,
Indonesia 40 1.7 State-Owned Enterprise Savings Minus Investment 43 1.8 Net Financial Transfers to State-Owned Enterprises as a Share of
Gross Domestic Product 44 1.9 State-Owned Enterprise Share in Gross Domestic Credit 44 1.10 State-Owned Enterprise Share in Total External Debt 45 1.11 Explicit Operating Subsidies to State-Owned Enterprises 48 1.12 Indicators of State-Owned Enterprise Performance in
Developing Countries 49 2.1 Financial Performance of State-Owned Enterprises 59 2.2 Productivity of State-Owned Enterprises 62 2.3 Savings Minus Investment as a Percentage of Gross Domestic
Product 63 2.4 China: Growth Rates by Ownership Type 73
co
lX
SIN BUSINESS
2.5 China: Response of State Sector to Competition from Nonstate Enterprises 77
2.6 Indicators of Financial Sector Development, 1991 89 3.1 Pre- and Postcontract Performance: Net Rate of Return on
Revalued Assets 116 3.2 Pre- and Postcontract Performance: Labor Productivity 117 3.3 Pre- and Postcontract Performance: Total Factor Productivity 119 3.4 Performance Changes after the Introduction of Performance
Contracts 120 3.5 Implementation of Management Contracts: Summary of
Results 139 3.6 Contract Effects of Fee Structure, Autonomy, and Duration on
Performance 142 3.7 Telecommunications Reform: Impact on Network Expansion,
Labor Productivity, and Returns 154 4.1 Net Aid Flows to Egypt 185 4.2 Net Aid Flows to Senegal 187 4.3 Chile: Employment Reduction in Selected State-Owned
Enterprises 195 4.4 Ghana: Planned and Actual Employment Reductions in SOEs 198 5.1 A Decision Tree for State-Owned Enterprise Reform 232
Box Figures 1.2 Welfare Effects of Selling State-Owned Enterprises 39 1.3 SOE and Private Contribution to Pollution in Brazil 41 2.8 Financial Sector Development, 1991 90
X
Foreword
PUBLICATION OF THIS REPORT COMES AT A PROPITIOUS TIME.
Throughout the developing world and in the transition countries,
governments are striving to reform their economies. Yet in many
countries, particularly the poorest, some parts of the economy have re
mained stubbornly resistant to reform. This report deals with one of the
more important of these: the inefficient, loss-making state-owned enter
prises that are a significant burden on government budgets and scarce
resources in many countries. These enterprises hinder growth, impede
market liberalization, and thus both directly and indirectly limit efforts
to reduce poverty.
Drawing on a unique data base and detailed case studies, the report
analyzes which types of state enterprise reform measures have worked
best. It describes the formidable obstacles governments face when at
tempting to divest state-owned enterprises or otherwise improve their
performance, and how successful reformers have overcome these barri
ers. It looks at company experience in depth and creatively applies in
stitutional analysis to determine how contracts between management
and government can serve as tools to reform enterprises. Finally, it sug
gests policy courses to be pursued under different country and enter
prise conditions.
One central finding of the report is encouraging: some governments
have indeed overcome the obstacles. Following a comprehesive reform
strategy, they have divested when possible, and improved performance
incentives for firms remaining in government hands. Trade and invest
ment have usually followed, bringing more rapid growth and enhanced
opportunities for society at large.
But why haven't more governments privatized or otherwise reformed
state-owned enterprises? Reform entails political costs. Because politics
is integral to reform, a study of reforms in public ownership cannot ex
clude political analysis. A key finding of the report is that political ob
stacles are the main reason that state enterprise reform has made so little
headway in the last decade. The report makes an innovative attempt to
Xl
CRATS IN BUSINESS
xu
objectively disentangle and measure the elements that constitute the po
litical constraints on reform. While this is a significant contribution, we
should also bear in mind that our analytical knowledge of political
processes, though arguably older, is less complete than that of economic
forces and motives. It is an area in which additional analytical work and
more data will no doubt enhance our knowledge in the years to come.
However, it is our belief that the thrust of the main findings of this study
will hold true even with further scrutiny and more observations.
We hope that the research presented in this book will give political
leaders, policymakers, and the broader development community a
clearer picture of the substantial benefits that could result from state
owned enterprise reform and, just as important, a better understanding
of how the obstacles to reform can be overcome. Bureaucrats in Business is the fourth in a series of Policy Research Re
ports designed to bring to a wide audience the results of World Bank re
search on development policy issues. While accessible to nonspecialists, books in the series also seek to move forward the discussion among academics and policymakers of the appropriate public policy objectives and
instruments for developing economies. Like previous Policy Research
Reports, this report is a product of the staff of the World Bank; the judg
ments made herein do not necessarily reflect the views of its Board of
Directors or the governments that they represent.
September 1995
~~ Michael Bruno
Vice President, Development Economics, and Chief Economist
The World Bank
The Report Team
THE REPORT TEAM WAS LED BY MARY SHIRLEY. THE PRINCIPAL
co-authors were Ahmed Galal and Mary Shirley; Philip Keefer was the principal author of chapter 4. Sections draw heavily on
work by Asli Demirgi.ic;:-Kunt and Ross Levine (finance), Alan Gelb and I. ]. Singh (transition economies), and Hafeez Shaikh (management
contracts). Bharat Nauriyal compiled the statistical appendix and provided research assistance; Luke Haggarty wrote many of the boxes and provided research assistance. Other assistance was provided by Abdalla
Gergis, Rebecca Hife, and Clemencia Torres. Herbert Baer wrote box 2.9, Gerald Caprio wrote box 5.3, and David Wheeler wrote box 1.3.
The report was produced under the direction ofLyn Squire and Michael Bruno.
Lawrence MacDonald was the principal editor. The editorial
production team for the report was led by Jenepher Moseley, with additional help from Luke Haggarty, Audrey Heiligman, and Bill Moore. Polly Means produced the graphics. Alfred Imhoff provided additional
editorial advice. The support staff team was led by Zeny Kranzer and included Daniele Evans, Bill Moore, and Paulina Sintim-Aboagye.
Xlll

Acknowledgments
MANY INDIVIDUALS INSIDE AND OUTSIDE THE WORLD BANK
provided valuable contributions and comments. Special thanks are due to the Fiscal Mfairs Department of the Inter
national Monetary Fund for help on the data base and to our external Advisory Board-Robert Bates, Heba Handoussa, Moises Nairn, David
Newbery, Lawrence H. Summers, Vito Tanzi, John Vickers, John Waterbury, and Oliver Williamson-for its guidance and comments. Particular thanks are also due to Robert Klitgaard, Douglass North, and Raymond Vernon for their comments. Many Bank staff provided valuable comments. Special thanks to Luca Barbone, Harry Broadman, Eliana Cardoso, Maureen Cropper, Marinela Dado, Shanta Deveragan,
William Easterly, Jeffrey Hammer, Ulrich Hewer, Ishrat Husain, Magdi Iskander, Emmanuel Jimenez, Hyung-Ki Kim, Robert Lacey, Muthukumara Mani, Martha de Melo, John Nellis, Robert Picciotto, Lant
Pritchett, Enrique Rueda-Sabater, Joanne Salop, Luis Servin, Ulrich Thumm, Paulo Vieira Da Cunha, and Douglas Webb.
A good deal of invaluable background work was done for this report
by Arup Banerji (labor), Ed Campos (political economy), Nichola Dyer Cisse (performance contracts), Robert Cordon (case studies), Hadi
Esfahani (political economy), Gunnar Fors (trade), E. Gyimah-Boadi
(case studies), Song Dae Hee (case studies), William Heller (political economy), Rolf Liiders (case studies), Mathew McCubbins (political economy), Vedot Milor (case studies), Richard Sabot (labor), Luis
Servin (macroeconomy), Andres Solimano (macroeconomy),
Raimundo Soto (macroeconomy), Pankaj Tandon (product markets), and Bruce Tolentino (case studies).
XV

Definitions
LOW-INCOME AND MIDDLE-INCOME ECONOMIES ARE SOME
times referred to in this report as "developing economies." The
use of the term is convenient; it is not intended to imply that all
economies in the group are experiencing the same kind of development
or that other economies have reached a preferred or final stage of devel
opment. Classification by income does not necessarily reflect development status. Similarly, the term "industrial economies" has been used
for high-income economies and is not intended to imply that countries
in other groupings are unindustrialized nor that industry is the sole de
terminant of economic development.
Economy Groups
• Low-income economies are those that had a 1992 per capita in
come of $675 or less
• Middle-income economies are those that had a 1992 per capita in
come of $676 to $8,355
• Developing economies are those that had a 1992 per capita income
of $8,355 or less
• Industrial economies are those that had a 1992 per capita income
of $8,356 or more
Geographic Groups
THE FOLLOWING ARE GENERAL GUIDELINES TO THE GEO
graphic analytical groupings used in this report. Some calcula
tions, graphs, and tables use varying geographical definitions
because they are based on different data sets. Sources should be con
sulted for the exact group composition.
:X:Vll
RATS I N B US I N E S S
X:Vlll
Africa
Asia
Latin America
Transition economies
Generally includes all of Africa. Sub-Saharan Africa excludes the North African countries of
Morocco, Algeria, Tunisia, Libya, and Egypt.
Includes South Asia, Southeast Asia and the
Pacific, and nontransitional economies in
Central Asia.
Short for Latin America and the Caribbean; refers to all American and Caribbean econ
omies south of the United States.
Refers to the former socialist economies in
Central and Eastern Europe, Central Asia,
and China.
Complete coverage may not be available for all countries in each group. See the technical notes in the statistical appendix for specific countries
in the different groupings.
Data Notes
HISTORICALDATAINTHISBOOKMAYDIFFERFROMTHOSEIN
other World Bank publications if more reliable data have be
come available, if a different base year has been used for con
stant price data, or if countries have been classified differently.
• Billion is 1,000 million.
• Dollars($) are current U.S. dollars unless otherwise specified.
• Net aid flows are disbursements net of principal payments +
interest
Acronyms and Abbreviations
ADB Asian Development Bank
AD! African Development Indicators (World Bank)
AfoB African Development Bank
CPA Refers to the CPA franc, a currency known in West Africa as
the "franc de la Communaute financiere d'Afrique" and
known in Central Africa as the "franc de la Cooperation fi
nanciere en Afrique centrale"
DEJit.i
CPI Consumer price index
DFI Direct foreign investment
ECU European currency unit
EU European Union
GATT General Agreement on Tariffs and Trade
GDP Gross domestic product
GNP Gross national product
IBRD/IDA International Bank for Reconstruction and Development/
International Development Association (the World Bank)
!DB Inter-American Development Bank
IMF International Monetary Fund
NAFTA North American Free Trade Agreement
OECD Organisation for Economic Co-operation and Development
ROA Return on assets
UNDP United Nations Development Programme
TFP Total factor productivity
TVE Township and village enterprise (China)
s-r Savings minus investment
SOE State-owned enterprise
WTO World Trade Organization (successor to GATT)
X1X

Introduction and Overview
UREAUCRATS ARE STILL IN BUSINESS. DESPITE MORE
than a decade of divestiture efforts and the growing
consensus that governments perform less well than the private sector in a host of activities, state-owned enter
prises (SOEs) account for nearly as large a share of de
veloping economies today as twenty years ago. Indeed, as data compiled for this study show, the size of the state-owned enter
prise sector has significantly diminished only in the former socialist
economies and a few middle-income countries. In most developing
countries, particularly the poorest, bureaucrats run as large a share of
the economy as ever. Government employees operate a casino in
Ghana, bake cookies in Egypt, assemble watches in India, mine salt
in Mexico, make matches in Mali, and bottle cooking oil in Senegal.
In many developing countries that continue to support large SOE sec
tors, inefficient state-owned firms generate deficits that hinder eco
nomic growth, making it more difficult for people to lift themselves
out of poverty.
Consider these facts:
• In many developing economies, SOEs absorb a large amount of
funds that could be better spent on basic social services. In Tanza
nia, central government subsidies to SOEs equal 72 percent of cen
tral government spending on education and 150 percent of central
government spending on health.
• SOEs often capture a disproportionate share of credit, squeezing
out private sector borrowing. In Bangladesh, SOEs take about one
fifth of domestic credit, although SOE output accounts for less
than 3 percent of gross domestic product (GDP).
t"\ t·.~
I
TS IN BUSINESS
2
11 State-owned factories often pollute more than privately owned
factories. In Indonesia, for example, government factories dis
charge about five times as much water pollution per unit of out
put as private factories of the same size and age engaged in the
same activity.
11 A modest improvement in state-owned enterprise efficiency
would substantially reduce and in some cases eliminate the fiscal
deficit in most developing countries. In Egypt, Peru, Senegal, and
Turkey a mere 5 percent reduction in SOE operating costs would
reduce the fiscal deficit by about one-third.
Many governments have announced plans to sell state-owned enter
prises and to improve the performance of firms that remain in government hands, but only a few developing countries have made measurable
progress. Our study found that
11 Developing countries, excluding the transition economies, are di
vesting an average of just three enterprises per year, although most
governments own hundreds of firms.
11 Although SOE deficits have declined, they continue to be a signifi
cant burden to government finances and to banking systems in de
veloping economies.
• Notwithstanding the sale of some very large firms, the state
owned enterprise share of developing market economies has re
mained stubbornly high since 1980, at about 11 percent of GOP,
even as it fell in the industrial countries from about 9 percent to
less than 7 percent.
• The state-owned enterprise sector is larger and the problems asso
ciated with it are more severe in the world's poorest countries,
where SOEs account for 14 percent ofGDP.
In sum, although the potential gains from privatization and other
reforms are substantial, only a few countries have reformed their state
owned enterprises successfully. Why haven't more countries reformed
their SOEs? What distinguishes the few that have from the many that
have not? What are the political obstacles to reform, and how have
these been overcome? How can leaders and policymakers in developing
economies hasten reform and increase the likelihood of success? And fi
nally, what is the role of foreign aid? These are the questions this book
sets out to answer.
INTRODUCTION AND 0
To do so, we examine the economic problems that arise when bu
reaucrats are in business-that is, when governments own and oper
ate enterprises that could be run as private firms-and the political
obstacles to change. We do not suggest that bureaucrats are to blame
for these ills. To the contrary, we find that divestiture and other
state-owned enterprise reforms cannot succeed without a sound bu
reaucracy. Requiring bureaucrats to oversee businesses better han
dled by private entrepreneurs places a heavy toll on bureaucracies in
developing economies, diverting attention from problems that only
governments can address. Bureaucrats typically perform poorly in
business, not because they are incompetent (they aren't), but because
they face contradictory goals and perverse incentives that can dis
tract and discourage even very able and dedicated public servants.
The problem is not the people but the system, not bureaucrats per se
but the situations they find themselves in as bureaucrats in business.
We begin our study by measuring the size and economic impact
of the SOE sector in developing economies. As noted above, we find
that SOE sectors remain large in many developing countries and that
large SOE sectors have a negative effect on growth (chapter 1). To un
derstand the differences between the few countries that reformed
successfully and the many that have not, we next investigate SOE re
form efforts in twelve countries representing a broad cross-section of
regions and experiences. Our sample includes nine developing mar
ket economies (Chile, Egypt, Ghana, India, Mexico, the Philippines,
Republic of Korea, Senegal, and Turkey) and three transition
economies (China, the Czech Republic, and Poland). We find that
the countries that improved the performance of their SOEs made the
most of divestiture, competition, hard budgets, and financial sector
reforms. In addition, all twelve countries tried to improve the incen
tive structure by changing the relationship between government and
state-owned enterprises, but this last measure rarely worked alone
(chapter 2). To discover why, we go a level deeper and explore
changes at the enterprise level. We find that improving the perfor
mance of SOEs or privatized monopolies requires a better incentive
structure. In other words, the contract between government and SOE
management, or between government and private management, or
between government and the owners of a privatized, regulated mo
nopoly must be rewritten to motivate both sides to improve perfor
mance (chapter 3).
3
RAT S I N B U S I N E S S
4
Taken together, this analysis shows that divestiture and other re
forms can indeed improve SOE performance but that only a few gov
ernments have adopted the policies necessary to reform successfully.
Why haven't more governments attempted these policies? To answer
this question, we investigated the politics of SOE reform in our twelve
country sample, identifYing political obstacles and the ways that suc
cessful reformers overcame them (chapter 4). What can policymakers
and the development community do to speed the reform process? Our
final chapter draws on the findings of the previous work to construct a
decision tree that reform advocates can use in deciding whether or not
a country is ready for reform and how to proceed in each instance
(chapter 5). We conclude with a note outlining ways foreign assistance
can help to encourage reform. The remainder of this introduction and
overview highlights the central arguments and findings of the book from chapter 2 onward.
What Makes for Success in State Enterprise Reform?
TO UNDERSTAND THE DIFFERENCES BETWEEN SUCCESSFUL
and unsuccessful SOE reform, we first need an objective mea
sure of success. We establish three objective indicators: state
owned enterprise financial returns, state-owned enterprise productiv
ity, and the state-owned enterprise savings-investment deficit (for a
detailed discussion of these measures, see chapter 2). Using these indi
cators, we find that Chile, Korea, and Mexico achieved the best results;
their SOE sectors performed better than the other countries and they
were able to improve on already good performance. Egypt, Ghana, and
the Philippines had mixed results; and India, Senegal, and Turkey had
the poorest results. Although we lacked comparable data for ranking
the three transition economies, partial indicators suggest that China,
the Czech Republic, and Poland show mixed to good results.
What explains these differences? To find out, we considered the
extent to which each country in our sample used the five components
of reform that economic theorists and reform practitioners widely
recommend. These components are divestiture, competition, hard budgets, financial sector reform, and changes in the institutional re-
INTRODUCTION AND OVE
lationship between SOEs and governments. We found that the more
successful reformers made the most of all five components. Indeed, they
used them not as separate options but as mutually supportive com
ponents of an overall strategy. Other countries in our sample achieved
less in individual reform elements and followed a less comprehensive
strategy overall.
Key findings about the ways that successful reformers, on one hand,
and the mixed performers and least successful performers, on the other,
approached each of these five components of SOE reform include the
following:
• SuccessfUl SOE reformers divested more, especially where the initial
size of the state enterprise sector was large.
• Successful SOE reformers introduced more competition. They liber
alized trade, eased restrictions on entry, and unbundled large
enterprises.
• SuccessfUl SOE reformers hardened SOE budgets. They reduced or
eliminated direct subsidies, put access to credit on a more commercial
basis, improved regulation of SOE monopoly prices, and reduced or
eliminated hidden subsidies.
• SuccessfUl SOE reformers reformed the financial sector. They strength
ened supervision and regulation, relaxed controls over interest rates,
and reduced directed credit. They also relaxed entry restrictions and
privatized banks once SOE reform and supervisory and regulatory re
form were well under way.
• Surprisingly, successfUl and unsuccessfUl reformers alike tried to im
prove the incentive structure by changing the relationship between
SOE managers and the government. Countries at the top and bottom
of our performance ratings introduced new oversight bodies, increased
managerial autonomy, and signed explicit performance agreements.
Why did the apparently similar efforts to change relationships be
tween SOE managers and governments produce different results? Partly,
such institutional reforms only work in conjunction with the other
reforms just described. In addition, there may be differences in the ways
that countries designed and implemented these changes that would show
up only in detailed company-level analysis. To find out, we analyzed the
ways that governments rewrote their contracts with managers of state
owned enterprises, with private managers contracted to run government
firms, and with the owners of privatized, regulated monopolies.
5
TS IN BUSINESS
6
Contracting: What Works, What Doesn't, and Why
EACH RELATIONSHIP BETWEEN A GOVERNMENT AND
the manager of a state-owned enterprise, or between a govern
ment and private managers of a state's assets, or between a gov
ernment and the owner of a regulated, private monopoly can be seen as
a contract, that is, an agreement between the government and the other
party based on shared expectations. Written contracts have been estab
lished for only a small proportion of state enterprises worldwide, but
their use is growing. Countries often use written contracts for their most
important and problematic activities, such as infrastructure monopolies
(electricity, water, and telecoms), and major exporters and revenue
earners (tea in Sri Lanka, gold in Ghana, and hotels in Egypt). Yet little
is known about whether such contracts work, what distinguishes the
successful contracts, or which type of contract works best in which cir
cumstances. Our study (chapter 3) focused on three types of contracts:
• Performance contracts, which define the relationship between the
government and government employees managing a state-owned
enterprise
• Management contracts, which define the relationship between the
government and a private firm contracted to manage a state
owned enterprise
• Regulatory contracts, which consist of the regulations and legisla
tion that define the relationship between the government and the
owner of a private, regulated monopoly.
For each type of contract, we first examined a sample of firms to de
termine whether the contract improved performance. To understand
differences in outcomes, we then analyzed how each contract resolved,
or failed to resolve, problems in three areas: information, rewards and
penalties, and commitment.
We found that performance contracts worked least well. Manage
ment contracts worked better, but only in circumstances identified
below. Regulatory contracts, when properly designed and imple
mented, worked well for enterprises in monopoly markets. Overall,
then, the greater the participation of private agents in ownership and
management, the better enterprise performance. Our analysis suggests
that this was because private managers and owners, unlike their gov-
INTRODUCTION AND 0
ernment counterparts, could readily capture the benefits if perfor
mance improved; responding to these incentives, they worked harder
than government managers and obtained better results. We summarize
the main findings for each type of contract below.
Performance Contracts Rarely Improve Incentives and May Do More Harm than Good
Performance contracts are currently used in thirty-three developing
economies. Our analysis of a sample of twelve companies in six coun
tries gives little support to the premise that these contracts help im
prove SOE performance. Only three of the twelve case study companies
showed a turnaround in total factor productivity (TFP) after contracts
were introduced (Ghana Water, Mexico Electricity, and Senegal Tele
coms), six continued their past trends, and three performed substan
tially worse under contracts than before. The rate of return on assets
deteriorated for three firms; the rest show little change.
Why did performance contracts work so badly? We found that these
contracts did not improve, and in some cases exacerbated, the poor in
centive structures facing government managers. Indeed, performance
contracts failed to address all three contracting problems. They did not
reduce the managers' information advantage; instead managers were
able to use their knowledge of the firm to negotiate multiple soft targets
that were easy for them to reach. Similarly, performance contracts
rarely included rewards and penalties that could motivate managers
and staff to exert more effort. When cash bonuses were offered they
had little effect because they were not linked to better performance;
other promised incentives, such as greater managerial autonomy, were
often not delivered; and penalties for poor performance, such as firing
or demotion, were seldom applied. Finally, governments demonstrated
little commitment to the terms of the contracts, frequently reneging on
key promises. This increased managers' incentive to use their informa
tion advantage to negotiate soft targets.
Each of these problems can be seen with the performance contract
governing Senegal Electricity. The contract included twenty-two criteria
for judging performance, but no rewards if managers attained them;
moreover, government regulators lacked the power to enforce penalties
reliably. Finally, although the government promised to take actions that
would make it possible for the firm to meet its targets, such as forcing
7
TS IN BUSINESS
8
other state-owned enterprises to pay their electricity bills, these promises
were often broken. The company suffered declining productivity. In
deed, as with several other enterprises in our sample, it appears that the
contract may have actually worsened incentives and performance.
Management Contracts Work but Are Not Widely Used
Management contracts are not widely used but have generally been
successful where they were attempted. Our worldwide search using a rela
tively broad definition (see chapter 3) found only 150 management con
tracts: forty-four involved hotels managed by major international chains;
the rest were concentrated in agriculture and water. Our analysis of man
agement contracts governing rwenty firms in eleven countries found that
profitability and productivity improved in rwo out of three cases.
What were the characteristics of the successful management con
tracts? And, since they are often successful, why aren't they used more
often? Analysis of the ways that the successful contracts addressed the
problems of information, rewards and penalties, and commitment an
swers both questions.
Where management contracts succeeded, governments used compe
tition to reduce management's information advantage. Of the thirteen
successful contracts, ten involved SOEs in competitive markets; the
other three involved competitive bidding for monopoly enterprises
(rwo water companies and a container port). Successful contracts also
established meaningful rewards and penalties, usually by linking the
contractor's fee to the firm's performance. Finally, successful contracts
were set up in ways that elicited a strong commitment from both par
ties. For example, they covered longer periods, included the possibility
of renewal, and provided for arbitration of disputes.
If management contracts work, why are they not used more often?
We concluded that the costs to the government of obtaining the infor
mation needed to negotiate, monitor, and enforce a management con
tract are one reason that they are largely confined to hotels, agriculture,
and water. Information is more easily available, and contract transac
tion costs thus lower, in sectors where technology is not changing
rapidly and output is a single, homogeneous product (as with water or
sugar); or where the private contractor has an international reputation
to protect, the market is competitive, and quality is easily compared (as
with hotels). Moreover, under the conditions where management con-

INTRODUCTION AND
tracts can work, privatization will often offer governments higher ben
efits (revenue from the sale) and lower costs (no need to monitor, en
force, and renegotiate the contract).
Regulatory Contracts Work but Require Careful Design
Nearly all privatized firms providing infrastructure services operate
in monopoly markets where government regulation is needed to pre
vent firms from abusing their market power. These regulations and
other divestiture provisions constitute a regulatory contract, that is, an
agreement between the government and the firm's owners about the
conditions under which the firm should operate.
To evaluate these contracts, we analyzed the experience in the seven
developing countries where the basic telephone network is privately
owned and government regulated (Argentina, Chile, Jamaica, Malaysia,
Mexico, the Philippines, and Venezuela). We found that regulatory con
tracts improved performance in most cases; investment and labor pro
ductivity increased significantly in five countries, and the quality and
quantity of service usually improved rapidly. Not all regulatory contracts
are successful, however, as we can see from a comparison of their suc
cessful use in Chile and the problems encountered in the Philippines.
Again countries with successful contracts addressed all three con
tracting issues. In Chile, for example, the government reduced its in
formation disadvantage by selling the franchise for local telephone ser
vice through competitive bidding and by injecting other elements of
competition into the contract wherever possible. Price regulations were
designed to reward improved performance and penalize failure to im
prove. Finally, the Chilean government demonstrated its commitment
to abide by the contract to investors in many ways; for example, the
legislature passed laws defining procedures for arbitration and appeal of
disputes.
The overall evidence from our sample suggests that divestiture of
state-owned enterprises in noncompetitive markets, accompanied by
appropriate regulation, usually does result in greater efficiency, ex
panded service, and overall improved welfare. But only a small propor
tion of the countries with large government monopolies in noncom
petitive sectors have attempted regulatory contracts. Indeed, as we have
seen, despite the potentially large economic benefits of divestiture and
other types of SOE reform, relatively few countries have made a system-
9
TS IN BUSINESS
IO
atic, determined attempt to reform their SOEs. To find out why, we
studied the politics of state-owned enterprise reform.
The Politics of Refonning State-Owned Enterprises
THE REFORM OF SOES CAN COST A GOVERNMENT ITS SUPPORT
base, because reforms almost invariably involve eliminating jobs
and cutting long-established subsidies. Not surprisingly, politi
cians carefully weigh any change in SOE policies, naturally preferring
policies that benefit their constituents and help them remain in power
over policies that undermine support and may cause them to be turned
out of office. While some exceptional leaders may be able to change
their support base and mobilize new constituents for reform, most are
inherently responsive to the supporters who put them in office. How
have the countries that reformed successfully overcome the political obstacles to reform? What can other countries learn from their example to
hasten the reform process? In considering these questions, we found that
there are three necessary conditions for successful reform:
• Reform must be politically desirable to the leadership and its con
stituencies. Reform becomes desirable to the leadership and its
supporters when the political benefits outweigh the political
costs. This usually happens with a change in regime or coalition
shift in which those favoring the status quo lose power. It may
also happen when an economic crisis makes SOE subsidies so
costly that reform becomes preferable to the status quo.
• Reform must be politically feasible. Leaders must have the means
to implement change and to withstand opposition to reform.
• Promises central to state-owned enterprise reform must be credible. Investors must believe that the government will not renation
alize privatized firms; SOE employees and others who fear that
they may lose out in reform must believe that the government
will deliver on any promises of future compensation.
Chapter 4 describes these conditions in detail, using as examples the
twelve successful and unsuccessful reformers we present in chapter 2. The
analysis does not support the widely held view that SOE reform is more
likely in authoritarian regimes. In our sample, among authoritarian gov-
INTRODUCTION AND
ernments there were both successful and unsuccessful reformers, while
reform was slow in some democracies and rapid in others. Below we il
lustrate the three conditions with brief examples, then present possible
predictors of reform readiness.
Condition 1: Political Desirability
Reforms become desirable to the leadership in two complementary
ways. The first involves a change in government: either an outright regime
shift (as in Chile in 1973 or the Velvet Revolution in Czechoslovakia in
1989) or a shift in the governing coalition (as in Mexico in 1988) that al
ters the leadership's constituencies in such a way that those who might lose
from SOE reform are no longer a significant part of the leadership's support
base. The second involves an economic crisis-for example, a significant
drop in GOP (Czechoslovakia, Ghana, Mexico) or a sharp fall in net for
eign assistance (Senegal, Egypt)-that makes it increasingly difficult for
the government to continue subsidizing SOEs. The size of the economic
crisis needed to make reform desirable depends on how much the leader
ship relies on the support of those who benefit from the status quo.
All the more successful reformers in our sample met the political de
sirability test, while most of the countries with mixed or poor reform
records did not. Even though most of the latter group experienced either
a significant regime shift or economic problems that could have created
an opening for reform, the continued importance of the SOE sector in
the government's support base meant reform did not become politically
desirable. In Turkey, for example, a regime change in 1983 resulted in
numerous economic reforms. However, these efforts stopped short of
privatizing or otherwise reforming state-owned enterprises because SOE
employees were crucial to the new government's support base.
Condition II: Political Feasibility
Reform is politically feasible when the leadership can secure the ap
proval and support of other government entities whose cooperation is
critical to success. These include legislatures, bureaucracies, and the
state or provincial governments that are responsible for formulating
policy or carrying out the reform. In addition, the leadership must be
able to withstand opposition to reform from potential losers; these may
be SOE employees, especially when such groups are organized, numer-
II
CRATS IN BUSINESS
12
ous, and ready to engage in demonstrations, work stoppages in strate
gic industries, and other actions that might be costly to the govern
ment. The likelihood of opposition is greatest when the enterprise has
many extra employees-in some SOEs up to 90 percent of employees
may not be needed. In such instances, workers, rightly worried that re
form might lead to layoffs, have a strong incentive to resist.
In all the successfully reforming countries in our sample, the leader
ship controlled policymaking and implementation when reform began;
moreover, in each country the leadership offered compensation and
sometimes used compulsion sufficient to overcome resistance outside
normal political channels. Compulsion can have high social costs and
reforms enacted through coercion are often not sustainable. No govern
ment relied solely on compulsion to overcome opposition. In Chile, for
example, the military government in the 1970s employed often harsh
measures to curb union powers but also offered high severance pay to
port employees who might otherwise have disrupted the economy. In
the 1980s, the government sold some SOE shares to the general public
and SOE employees under various generous financing alternatives. Nei
ther Poland nor the Czech Republic used compulsion but instead satis
fied reform opponents with different distributions of enteprise shares.
Ghana, which we rank as partially meeting Condition II, illustrates
the difficulties that less successful reformers faced in overcoming oppo
sition to reform. Throughout most of the 1980s and into the 1990s,
the executive controlled policymaking. In 1985, to overcome substan
tial resistance to SOE reform, the government tried a mix of compulsion
and compensation. On the one hand, it reduced the power of the state
owned enterprise union, detaining labor leaders critical of the reform;
on the other, it began to give fired state-owned enterprise workers more
generous severance payments. With the approach of district elections
in 1988, however, the government became increasingly reluctant to
compel compliance with decisions about layoffs. Severance payments
became so expensive that the government had to abandon efforts to cut
SOE employment.
Condition Ill: Credibility
The third and final condition for successful state-owned enterprise
reform is government credibility. We identified three ways to judge a
government's credibility. First, credible governments have a reputation
INTRODUCTION AND 0
for keeping promises; for example, because they announced and imple
mented overall economic reforms or have not previously expropriated
private firms. Second, they face domestic restraints on policy reversal,
such as constitutional restrictions that make it hard to overturn legisla
tion or wide ownership of shares in privatized SOEs that creates a large,
pro-reform constituency. Third, they submit to international restraints,
such as trade treaties or loan covenants, which make it costly to reverse
reforms. Some mechanisms are more powerful than others. A govern
ment with a solid reputation, or strong domestic restraints, may enjoy
sufficient credibility whether or not it accedes to international treaties.
The reverse is not true, however: international restraints are usually too
weak to confer credibility where other conditions are absent.
The range of abilities that countries exhibit to credibly commit to reform can be seen by looking at two less successful reformers, India and Egypt, and two more successful reformers, the Czech Republic
and Poland. Although India did not meet the first two conditions of
reform, any reforms that it might have undertaken would have en
joyed substantial credibility. India had significant domestic restraints
on policy reversal and was regarded by investor risk services as a rela
tively safe place to commit resources. In contrast, Egypt in the 1980s
had a low confidence score with foreign investors and few domestic re
straints to protect reforms from being overturned. The experience of
the Czech Republic and Poland illustrates how decisive moves to im
plement macroeconomic reform while at the same time putting in
place domestic restraints that make policy reversal difficult can enable
a country to build credibility in remarkably little time.
Predicting Reform Readiness
Knowing how countries meet the conditions of desirability, feasibil
ity, and credibility helps predict reform outcomes. Political behavior is
inherently complex and dynamic, making prediction difficult. Never
theless, the methodology developed in the report allows us to formulate
objective and transparent indicators for prediction that can be tested for
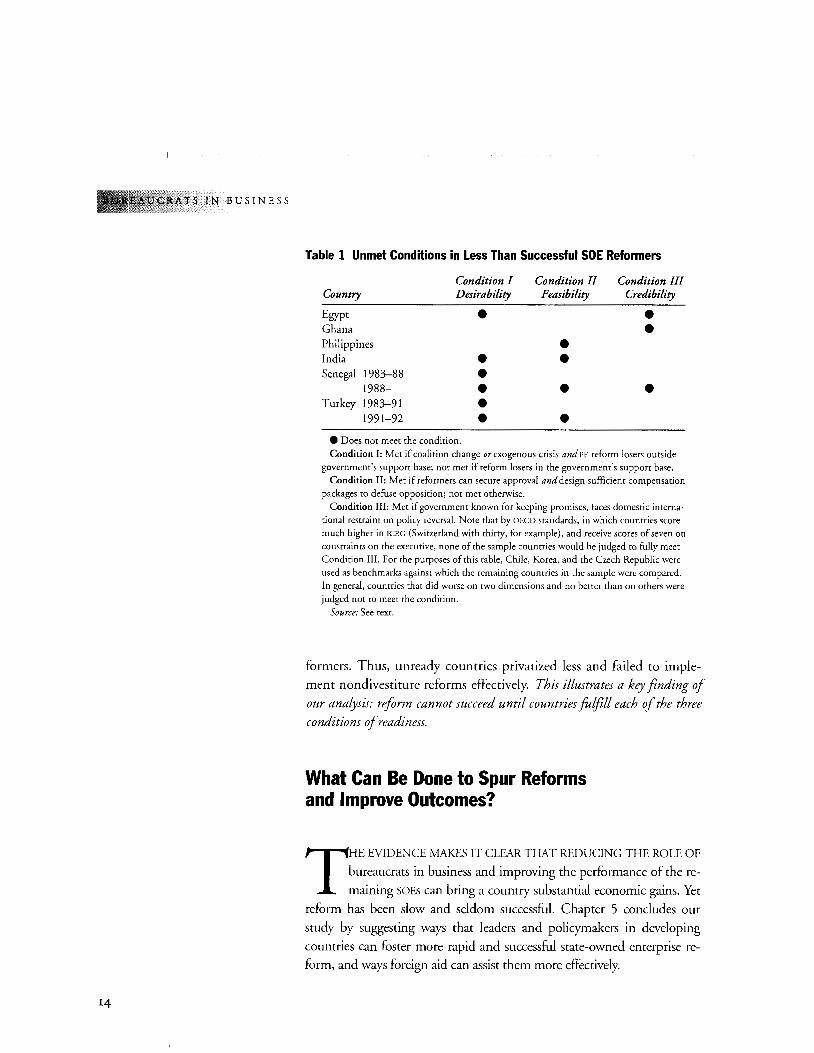
accuracy and consistency and applied systematically to our entire sample. Table 1 shows which countries in our sample failed to meet the
three necessary conditions according to objective measures. Countries
that met all three conditions reformed successfully. Countries that
failed to meet any one of the three conditions were less successful re-
13
TS IN BUSINESS
14
Table 1 Unmet Conditions in Less Than Successful SOE Reformers
Condition I Condition II Condition III Country Desirability Feasibility Credibility
Egypt • • Ghana • Philippines • India • • Senegal 1983-88 • 1988- • • • Turkey 1983-91 •
1991-92 • • e Does not meet the condition. Condition 1: Met if coalition change or exogenous crisis and PE reform losers outside
government's support base; not met if reform losers in the government's support base. Condition II: Met if reformers can secure approval and design sufficient compensation
packages to defuse opposition; not met otherwise. Condition III: Met if government known for keeping promises, faces domestic interna
tional restraint on policy reversal. Note that by OECD standards, in which countries score much higher in ICRG (Switzerland with thirty, for example), and receive scores of seven on constraints on the executive, none of the sample countries would be judged to fully meet Condition Ill. For the purposes of this table, Chile, Korea, and the Czech Republic were used as benchmarks against which the remaining countries in the sample were compared. In general, countries that did worse on rwo dimensions and no better than on others were judged not to meet the condition.
Source: See text.
formers. Thus, unready countries privatized less and failed to imple
ment nondivestiture reforms effectively. This illustrates a key finding of
our analysis: reform cannot succeed until countries foljill each of the three
conditions of readiness.
What Can Be Done to Spur Reforms and Improve Outcomes?
T HE EVIDENCE MAKES IT CLEAR THAT REDUCING THE ROLE OF
bureaucrats in business and improving the performance of the re
maining SOEs can bring a country substantial economic gains. Yet
reform has been slow and seldom successful. Chapter 5 concludes our
study by suggesting ways that leaders and policymakers in developing
countries can foster more rapid and successful state-owned enterprise re
form, and ways foreign aid can assist them more effectively.
INTRODUCTION AND OV
A Decision Tree for Reform of State-Owned Enterprises
State-owned enterprise reform involves a multitude of choices, each
with its own set of problems and opportunities. The choices made will
inevitably vary from country to country; but to lead to successful out
comes, they must be made in a logical order. It might seem obvious, for
example, that countries will not reform successfully until the leadership
perceives reform as desirable. Yet, perhaps precisely because the eco
nomic gains of reform are substantial, well-intentioned outsiders, in
cluding the World Bank, have sometimes attempted to prod developing
countries that are not ready for reform into acting. Similarly, developing
country leaders and policymakers, persuaded of the benefits of reform
ing SOEs, have sometimes attempted to do so, only to choose an option that meets with failure. How can those who rightly favor reform organize the multitude of choices they face in a way that will increase the
likelihood of success?
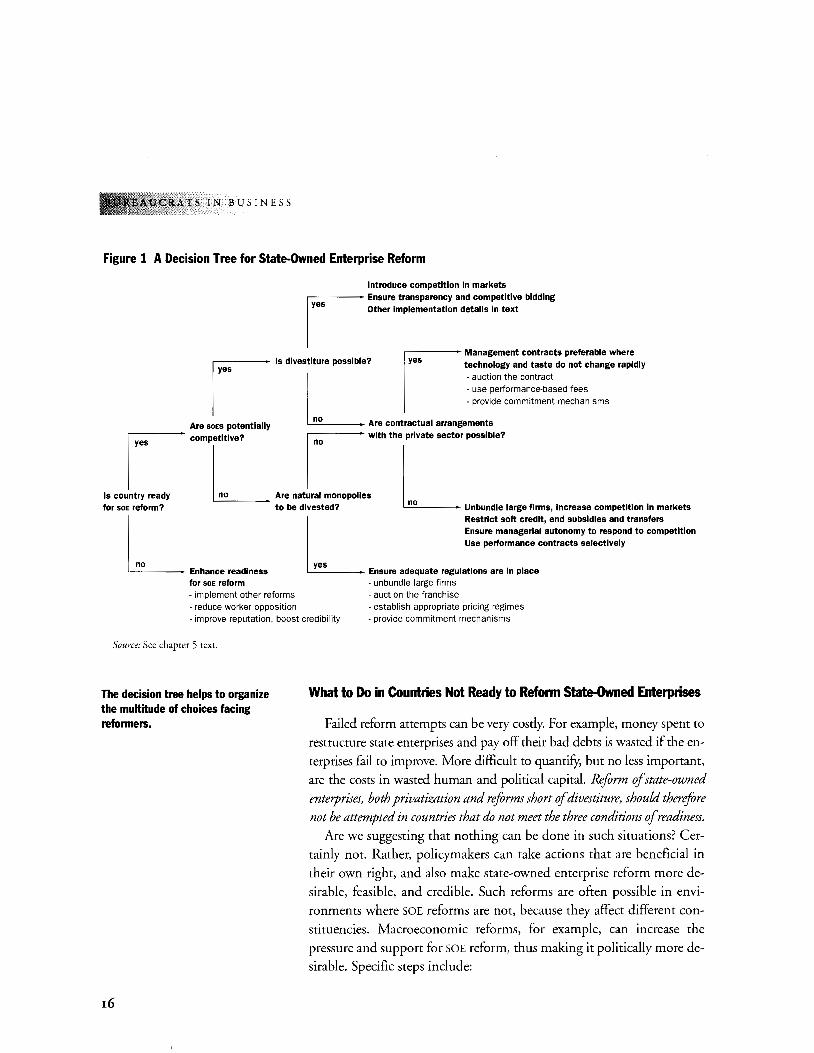
In thinking about the prerequisites of reform and the conditions that
are necessary for the success of various reform options, we have found it
useful to draw a decision tree (figure 1). At each juncture we ask a ques
tion, the answer to which sends us in one of two directions, where we
encounter another juncture and another question. Chapter 5 describes
that decision tree, offering checklists that reform advocates can use in
deciding how to proceed in a particular country or with a particular enterprise in order to avoid the potential pitfalls along the way. We con
clude this overview with a brief summary of the main decision points.
The essential first question is whether or not the country is ready for
reform. The answer will be determined by whether or not a country
meets each of the three conditions for readiness described above. In the
borderline cases, of which there may be many, upfront actions, such as
trimming an oversized SOE workforce or selling or liquidating a large
firm, can be a good signal of readiness to proceed with a broader pro
gram of SOE reform. Depending on the answer, the course of action is
radically different. If the country is not ready, then SOE reforms are unlikely to succeed. Instead, policymakers should pursue reforms in other areas
that are desirable in their own right and at the same time lay the ground
work for future SOE reform. Because foreign aid can have an important
influence on the timing ofSOE reform and how it is pursued, we suggest
ways to enhance its effectiveness in supporting SOE reform at the end of
the book, summarized here in box 1.
15
TS IN BUSINESS
Figure 1 A Decision Tree for State-Owned Enterprise Reform
Introduce competition In markets r- Ensure transparency and competitive bidding
I ..... ····~·""''""' ....... ,, ....
I Management contracts preferable where
lis divestiture possible? technology and taste do not change rapidly
s
L -auction the contract - use performance-based fees -provide commitment mechanisms
0 Are soEs potentially Are contractual arrangements p- competitive? r with the private sector possible?
I I"' '' '"""'-'' L •~ ooWmO moooooU" L no for soE reform? to be divested? Unbundle large firms, Increase competition In markets
L L Restrict soft credit, end subsidies and transfers Ensure managerial autonomy to respond to competition Use performance contracts selectively
yes Enhance readiness Ensure adequate regulations are In place for soE reform - unbundle large firms -implement other reforms -auction the franchise - reduce worker opposition - establish appropriate pricing regimes -improve reputation, boost credibility - provide comm·1tment mechanisms
Source: See chapter 5 text.
The decision tree helps to organize the multitude of choices facing reformers.
r6
What to Do in Countries Not Ready to Reform State-Owned Enterprises
Failed reform attempts can be very costly. For example, money spent to
restructure state enterprises and pay off their bad debts is wasted if the en
terprises fail to improve. More difficult to quantifY, but no less important,
are the costs in wasted human and political capital. Reform ofstate-owned enterprises, both privatization and reforms short of divestiture, should therefore not be attempted in countries that do not meet the three conditions of readiness.
Are we suggesting that nothing can be done in such situations? Cer
tainly not. Rather, policymakers can take actions that are beneficial in
their own right, and also make state-owned enterprise reform more de
sirable, feasible, and credible. Such reforms are often possible in envi
ronments where SOE reforms are not, because they affect different con
stituencies. Macroeconomic reforms, for example, can increase the
pressure and support for SOE reform, thus making it politically more desirable. Specific steps include:
INTRODUCTION AND
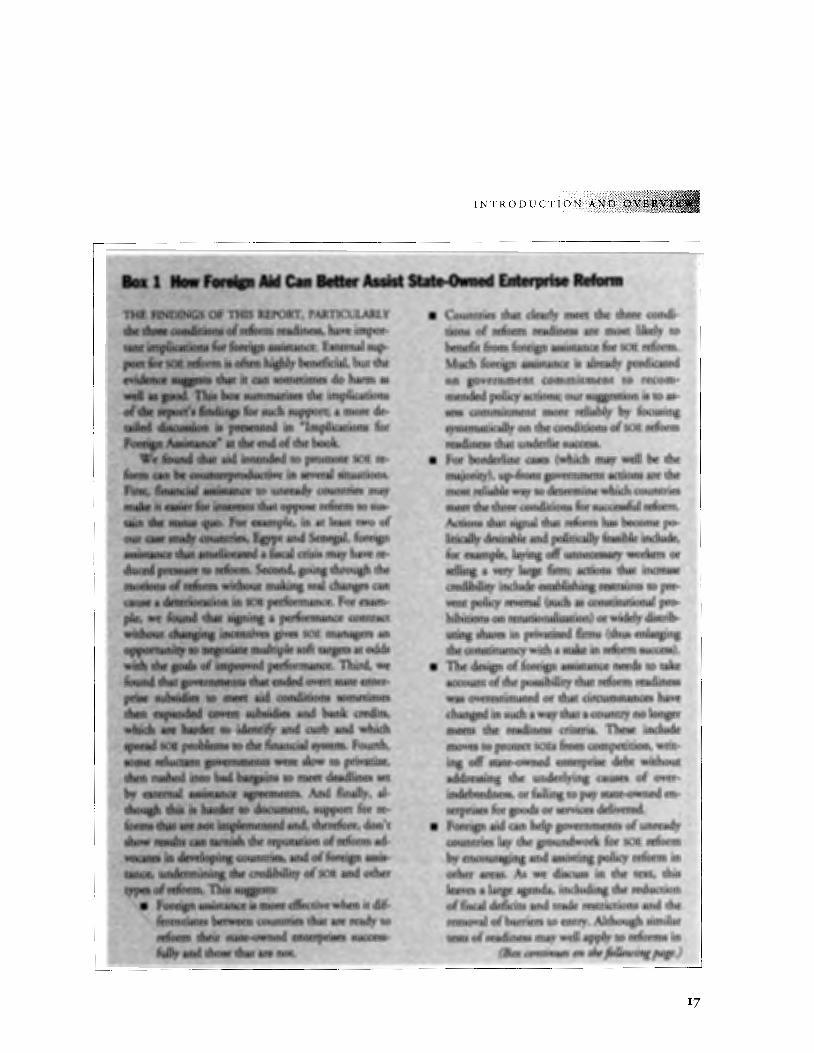
• Countries thut dearly meet. the three condi-.... tions of refortn readiness are most likely to
benefit from foreign assistance for SOE reform. Much foreign. ass.istance is already predicated ofl govemtnent commitment to recommended policy actions; oursusgestion is to asseSs ctul1mitment more reliably by focusing systetnat:ically on the conditions of SOE reform readiness that underlie success. For' borderline cases (which may well be the majotity); up:.front government actions are the
.. mosr reliable way to de~ermlnc: which countries . • meet the three :::Onditions ror suceessful rerorm. A~o~s that signal thut refor!tl haS become politic:ally desirable and. politically feasible include, for example, laying off' unnecessaty workers or · $dling a very large firm; actions· thut · incyease cre<J.ibiliry include establishing restraints to prevent policy reversal (sueh as constitutional pro-
. · hibitioti,S on renationalization) or widely distrilr uting shares in privatized firms· (thus. enlarging
.. the constituency with a stake in reform s~.J.CCeSS). Tlie·design offordgn assistance needs to. rake account of the possibility that reform readiness ·was overe$timated or that circumstances have
· changed in such a way that a cotl.ntcy no longer meets the readiness criteria. These include moves to protect SOBS from competition, writIng off state-owned enterprise debt without addressing the underlying· causes of overindebtc~dness, or failing to pay State-owned enterp1hl~ ror goods or services delivered . .lloreign aid can help governments of unready coUntries lay the groundwork fOr SOE reform .byencouraging and assisting policy reform in o.rher ar~s. As we discuss in the text, this leaves a large agef1da, including the reduction of fiscal deficits and trade restrictions and the removal of barriers to entry. Although similar tests of readiness m:l.y well apply to reforms in
·(Box continues on the. following page.)
17
18
r;!RATS IN BUSINESS
Box 1. [COIIthJuedJ rither a~as; the const!tuendes fi>r ~d agabtst reforll1 .fliffer depell:d.ing on the policy and
·sector. invrily«J; thU$; some non,-SOJ1 reforms ar~ PQs$ible in. coun~ries where ~h~ coJ1ditio:ns · fo{SQE refo~ll1.do :not ~t exist. F;xtertw ~ t~ce ~n als? help ptqpa.te dt¢ Wa.yfqr $OB~ form. by.providingi~f9~tion: ai:muqlie net
· <:oSt:s of miin~ning the srart.ts qY.o.~d the nqfbenefhs from re{or111 and py infotllli~g pq~ltiGa;lJea~rs, · polj~~rs! opj:nlon~;leau~ .. ers, an~ others aboJ,lt SOB .ieforJti exp<!ijenres ill Pt!t~r .:QW1tries:. . . . .. · .... · . . .. · .. · .. •· •...• · .. ·
a Fot~n ass~~ ~n ~~p refom~-:~d)rgov:.. . etthnen£$. attta¢t private inyes~6rs' ~ ~~ernment that is otherwise ready to. relOri:ti .but ls
• Reducing fiscal deficits. Fiscal and monetary reforms that bring rev
enues and expenditures into line also increase pressure for SOE re
form by making the burden of SOE deficits explicit.
• Easing trade restrictions. Liberalizing trade restrictions gives ex
porters a stronger position in the economy, and exporters can be
come an important constituency for SOE reform, demanding more
efficient provision of the goods and services that SOEs supply.
• Removing barriers to entry. Removing barriers to entry increases the
number of voices calling for SOE reform. New entrants who must
rely on state-owned enterprise services or compete with subsidized
SOE products help enlarge the constituency for reform.
• Initiating financial sector reform. Governments not ready to reform
SOEs may still be prepared to develop their financial system by im
proving supervisory and regulatory capacity, reducing directed
credit and direct government control over financial intermedi
aries, and easing some interest rate controls.
Similarly, governments can make SOE reform more feasible by reduc
ing the opposition to reform by workers and others dependent on state
owned enterprises. Possible actions include:
INTRODUCTION AND
• Eliminating obstacles to private job creation. One reason state
owned enterprise workers typically oppose reform is that while
overstaffing makes layoffs likely, appealing alternative employ
ment is often lacking. Policymakers can thus ease the way for SOE
reform by improving private employment opportunities. Steps in
clude eliminating interest rate subsidies (these encourage employ
ers to substitute capital for labor) and complex employment regu
lations (which have been shown to inhibit private job growth).
• Uncoupling SOE jobs and social services. State workers who receive many goods and social services through their jobs are especially fearful of being fired. In socialist economies, for example, state
firms traditionally provided housing, health care, transport, edu
cational assistance, and other benefits. Transition economies need alternatives to enterprise benefits-a commercial housing market or public health care, for example-so that SOEs can stop provid
ing these services and offer offsetting higher pay instead. This
gives workers greater mobility and reduces their resistance to re
forms that may threaten their jobs.
Finally, to enhance their credibility, governments can:
• Improve their reputation. By announcing in advance programs such as the macroeconomic reforms mentioned above, and adhering to
the program scrupulously, governments can enhance their reputa
tion with potential reform supporters.
• Establish domestic and international constraints. Enacting and ad
hering to constitutional provisions guaranteeing the right to prop
erty can help reassure investors that the government will honor its
commitments. Trade treaties and multilateral agreements raise the
cost of reversing future SOE reforms and help enhance credibility.
Policymakers who pursue this agenda will eventually find themselves
on the opposite branch of the decision tree, among countries that are
ready for SOE reform.
What to Do in Countries Ready to Reform State-Owned Enterprises
A country that meets the political conditions for successful SOE re
form faces a multitude of choices about how to handle each enterprise.
19
TS IN BUSINESS
20
The decisions will depend on the nature of the market, the firm, and the
country's capacity to divest and, in the case of monopoly markets, to
regulate. Returning to our decision tree, we see that it asks policymakers
in countries ready to reform to classify SOEs into two types:
• Those operating in competitive or potentially competitive mar
kets (all manufacturing and most services) and
• Those operating in natural monopoly markets where regulation
is necessary to protect consumers (some utilities and most
infrastructure).
Enterprises in competitive or potentially competitive markets can be divested in such a way that competition is enhanced and arrangements for the sale are transparent and competitive or at least open to the possibility of competitive bidding. Enterprises in natural monopoly markets can also be divested, provided that the sale is transparent and open to competitive bidding and that a credible regulatory structure can be put in place. These two outcomes correspond to the two outermost branches of our decision tree.
For both types of enterprises, policymakers undertaking divestiture face many questions that have different answers depending on country conditions and, in some instances, on the size and condition of the en
terprise being sold. Questions that policymakers will want to consider when designing a divestiture strategy include the following:
• Is it better to begin with small enterprises or big enterprises? Selling big firms first produces bigger welfare gains: the bigger the firm, the bigger the potential benefits. It also signals that the govern
ment is serious about reform and, properly done, can create new proreform constituencies. On the other hand, starting with small
firms and gaining experience before tackling the large firms makes sense if bureaucratic capacity is the limiting factor.
• Should the government financially restructure firms before selling them? Although some financial restructuring may be necessary, new in
vestments are seldom recovered in the sale price. Even so, government assumption of SOE debt is sometimes the only feasible way to
unload a company whose debt exceeds the sales value of its assets.
• Should the government lay off workers before selling an enterprise? Countries as diverse as Argentina, Japan, Mexico, and Tunisia have sometimes had to fire state-owned enterprise employees prior
INTRODUCTION AND OV
to privatization. This is sometimes necessary because investors will
not buy a firm where acrimonious labor disputes seem likely.
Moreover, governments are usually better able than private in
vestors to alleviate adverse social effects of mass layoffs. Severance
pay can reduce the risks facing SOE workers.
Selling monopolies is more complex than selling firms in competitive
or potentially competitive markets. Even so, as long as the sale is com
petitive and transparent and a credible regulatory contract can be de
vised and implemented, divesting monopolies can produce major welfare gains. Policymakers who decide their country is ready to divest
state-owned monopolies will want to incorporate the following findings
in their divestiture plans:
• Regulatory contracts work better when government reduces the firm's information advantage through competition. In addition to compet
itive bidding for the contract itself, postsale competition can be in
creased by splitting competitive activities from natural monopolies
and breaking national monopolies into regional monopolies. In
markets that still remain monopolies, the government could re
quire the winning bidder to meet specified targets or lose the con
cesswn.
• Price regulation is more effective when it allows firms to retain some of the benefits of improved performance while passing part to consumers in the form of lower prices. Where possible, basing prices on infor
mation from sources other than the firm can eliminate the firm's
incentive to inflate costs. Infrequently revising prices gives firms
an incentive to cut costs between adjustments.
• Credible regulatory contracts lower costs to the consumer. Govern
ments that credibly commit to meeting their end of the regulatory
contract can drive a harder bargain with investors. When the reg
ulatory contract is based only on a presidential decree or lacks pro
visions for impartial adjudication of conflicts, investors demand
higher returns or greater monopoly powers to compensate for
higher risk. When such costs are very high, policymakers may
wish to improve credibility before divesting. Alternatively, they
may seek external guarantees. (See box 5.3.)
Even in countries where the leadership is committed to rapid and ex
tensive privatization, some SOEs are likely to remain in government
21
RATS IN BUSINESS
22
hands for a long time, for political if not for economic reasons. What to do with these enterprises is the final question on the decision tree; it
asks: are contractual arrangements with the private sector possible?
Management contracts with the private sector are the preferred course;
however, as we have shown above, these are useful only in a limited
number of circumstances where the enterprise's technology changes
slowly and output is primarily a single, homogeneous product (such as
water and sugar) or where quality is easily monitored (such as hotels).
For firms that cannot be divested but are unsuitable for management
contracts, policymakers have no choice but to attempt improvements
within the existing ownership and management arrangements. Specific measures that must be implemented include introducing competition, cutting government subsidies, reforming financial arrangements to eliminate soft credits, and holding managers responsible for results while giving them the freedom to make necessary changes. The performance of SOEs that are not divested can be improved through these actions; but getting the details right is tough, because each reform relies on the successful implementation of others. Policymakers will want to keep in mind the following:
• Foster competition wherever possible to create incentives for improved performance. State-owned enterprise managers will only exert the effort needed to improve performance if pushed by competition.
• End subsidies and transftrs. Fostering competition is fundamental to improving the performance of SOEs in potentially competitive
markets. But competition can only be effective if government transfers and subsidies are eliminated.
• Eliminate access to soft credit. Cutting subsidies and transfers only results in hard budgets if access to soft credit is also eliminated.
• Give managers the autonomy to respond to competition and hold them accountable for results. Managers must have the power to lay off workers, seek lower-cost suppliers, end unprofitable activities, and pursue new markets. And they must be held accountable for re
sults. Lacking autonomy and responsibility, managers may re
spond to the increasing number of constraints in ways that hurt the enterprise, such as cutting spending on maintenance, marketing, and even supplies.
• Only use performance contracts when they address underlying problems. Performance contracts should only be used if they convey
INTRODUCTION AND 0
clear signals for reform, provide rewards for improved perfor
mance, and curb governments' tendency to renege. Writing a
sound performance contract can seem simple; however, they have
usually failed to address the problems of information, rewards and
penalties, and commitment. In general, the effort that goes into
such contracts could be better spent pursuing the measures de
scribed above, in particular, putting in place the conditions for
divestiture.
• •• In sum, this study shows that large and inefficient state-owned enter
prise sectors are costing developing economies dearly, especially the
poorest among them. Yet reform is possible and offers potentially large benefits, including more goods and services of better quality at lower prices; increased availability of resources for health, education, and other
social spending; and improved fiscal stability-all of which could con
tribute to more rapid economic growth. Reforming SOEs isn't easy, how
ever, and reforms often entail political costs. Indeed, we found that po
litical obstacles are the main reason that state-owned enterprise reform
has made so little headway in the last decade. Nevertheless, this study
documents that countries in very different economic and political cir
cumstances have overcome these barriers and successfully reformed.
23

R 1
Bureaucrats Are Still in Business
RESTATE-OWNED ENTERPRISES A PROBLEM? TOO
often the answer varies depending on where a person
sits on the ideological spectrum. To minimize such
subjectivity, we set out to determine empirically
whether and how state-owned enterprises (SOEs) in
fluence the economies of developing countries. Our
first step was to define SOEs (see box 1.1). We-then assembled the best
available evidence to estimate the size of the SOE sector in developing
countries and to assess whether this has changed over time.
State-Owned Enterprise Sector Remains Large Despite Increasing Divestiture
WE FOUND THAT ALTHOUGH GOVERNMENTS ARE SELLING
more and bigger enterprises, outside Eastern Europe and
the former Soviet Union and a handful of countries in other
regions, the SOE sector has remained stubbornly large. We concluded
that large SOE sectors can hinder growth for a variety of reasons, in part
because individual SOEs are usually less efficient than private firms and
in part because the resulting aggregate SOE deficits are typically financed
in ways that undermine macroeconomic stability. In addition, subsidies
to SOEs often divert scarce funds from growth-enhancing public spend
ing, such as education and health. Finally, we found that because SOE
sectors tend to be larger in low-income countries, SOEs are likely to be
most costly in the countries that can least afford them. This chapter pre
sents the evidence for these findings.
25
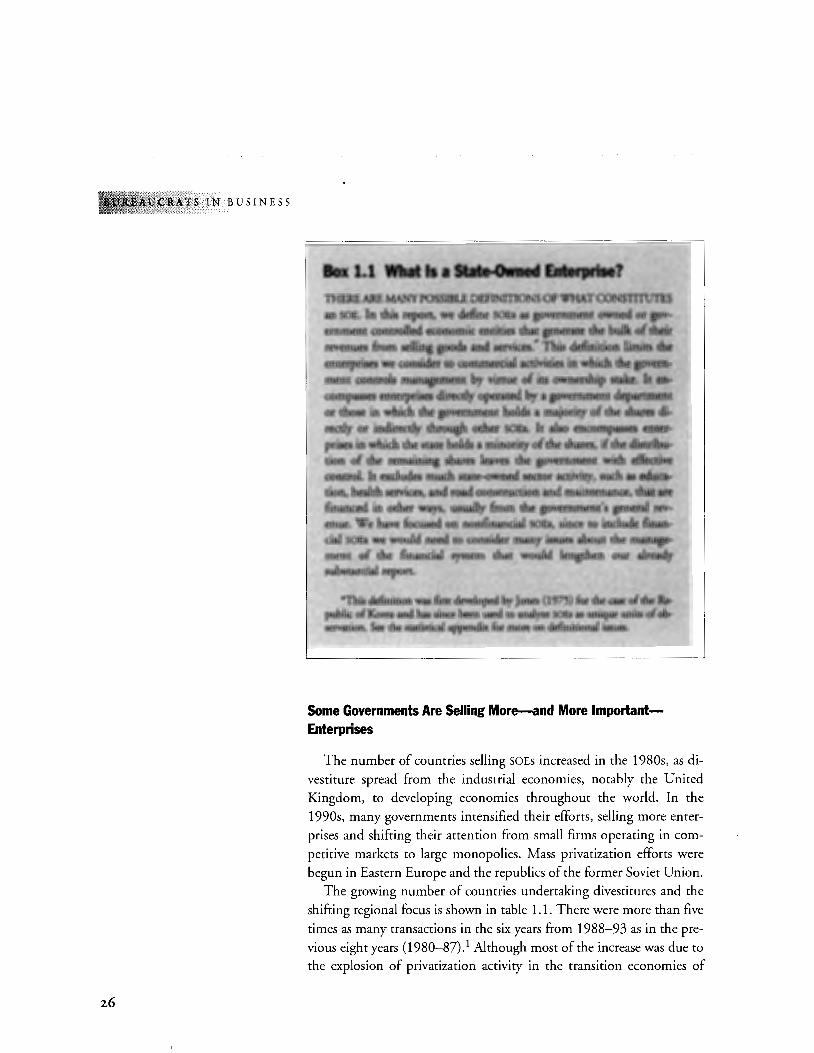
TS IN BUSINESS
26
aoxt;t:~~~~~t '";di""· THEREAREM:ANYP0$1QOEaNlTIONS t,W:.WHt
ftha~¢ed in oth~r wars; ~1)')1-(}~ tlle,gOl<~nm#:~i{~, ~ , "' '· ... ·• .. . enue;• We have foc~4wtno.nf~nt:W:sots, ~in<;eiQ .. ·m.:tiide,.t'itnin"i · ··
::~~iti~~~~t~~~~t~!::~~· ... substantial tq:mn. · · · >f ·
·. *This~rlon~,~~Ped•QrJo~·{t~5Jf9~.tfle.~.~~\~~;L:; public off(orea and ~:stn<:e f:Jeen~tQ analJ2¢$Qii$~l;fliiqt$e iuhi¢~<>~ .• · · servation. See the s£ati$tic~ ap{>endk fot more on defb:1~tllli ~: .. ··· ...
Some Governments Are Selling More-and More ImportantEnterprises
The number of countries selling SOEs increased in the 1980s, as divestiture spread from the industrial economies, notably the United Kingdom, to developing economies throughout the world. In the
1990s, many governments intensified their efforts, selling more enter
prises and shifting their attention from small firms operating in competitive markets to large monopolies. Mass privatization efforts were
begun in Eastern Europe and the republics of the former Soviet Union. The growing number of countries undertaking divestitures and the
shifting regional focus is shown in table 1.1. There were more than five
times as many transactions in the six years from 1988-93 as in the pre
vious eight years (1980-87).1 Although most of the increase was due to the explosion of privatization activity in the transition economies of
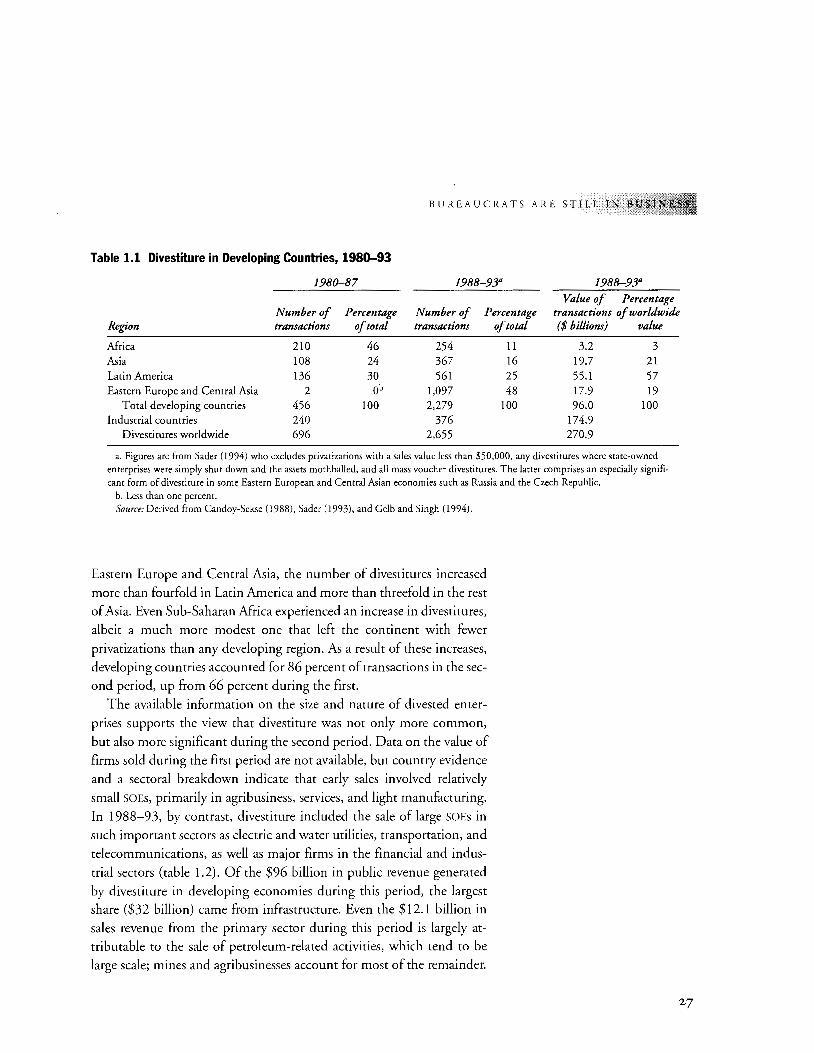
Table 1.1 Divestiture in Developing Countries, 1980-93
1980-87
B U REA U C RATS ARE STILL 1 N B U SI
1988-93a 1988-93a
Number of Percentage Number of Percentage Value of Percentage
transactions of worldwide Region transactions of total transactions of total ($ billions) value
Mrica 210 46 254 11 3.2 3 Asia 108 24 367 16 19.7 21 Latin America 136 30 561 25 55.1 57 Eastern Europe and Central Asia 2 oh 1,097 48 17.9 19
Total developing countries 456 100 2,279 100 96.0 100 Industrial countries 240 376 174.9
Divestitures worldwide 696 2,655 270.9
a. Figures are from Sader (1994) who excludes privatizations with a sales value less than $50,000, any divestitures where state-owned enterprises were simply shut down and the assets mothballed, and all mass voucher divestitures. The latter comprises an especially significant form of divestiture in some Eastern European and Central Asian economies such as Russia and the Czech Republic.
b. Less than one percent. Source: Derived from Candoy-Sekse (1988), Sader (1993), and Gelb and Singh (1994).
Eastern Europe and Central Asia, the number of divestitures increased
more than fourfold in Latin America and more than threefold in the rest
of Asia. Even Sub-Saharan Mrica experienced an increase in divestitures,
albeit a much more modest one that left the continent with fewer
privatizations than any developing region. As a result of these increases,
developing countries accounted for 86 percent of transactions in the sec
ond period, up from 66 percent during the first.
The available information on the size and nature of divested enter
prises supports the view that divestiture was not only more common,
but also more significant during the second period. Data on the value of
firms sold during the first period are not available, but country evidence
and a sectoral breakdown indicate that early sales involved relatively
small SOEs, primarily in agribusiness, services, and light manufacturing.
In 1988-93, by contrast, divestiture included the sale of large SOEs in
such important sectors as electric and water utilities, transportation, and
telecommunications, as well as major firms in the financial and indus
trial sectors (table 1.2). Of the $96 billion in public revenue generated
by divestiture in developing economies during this period, the largest share ($32 billion) came from infrastructure. Even the $12.1 billion in
sales revenue from the primary sector during this period is largely at
tributable to the sale of petroleum-related activities, which tend to be
large scale; mines and agribusinesses account for most of the remainder.
27
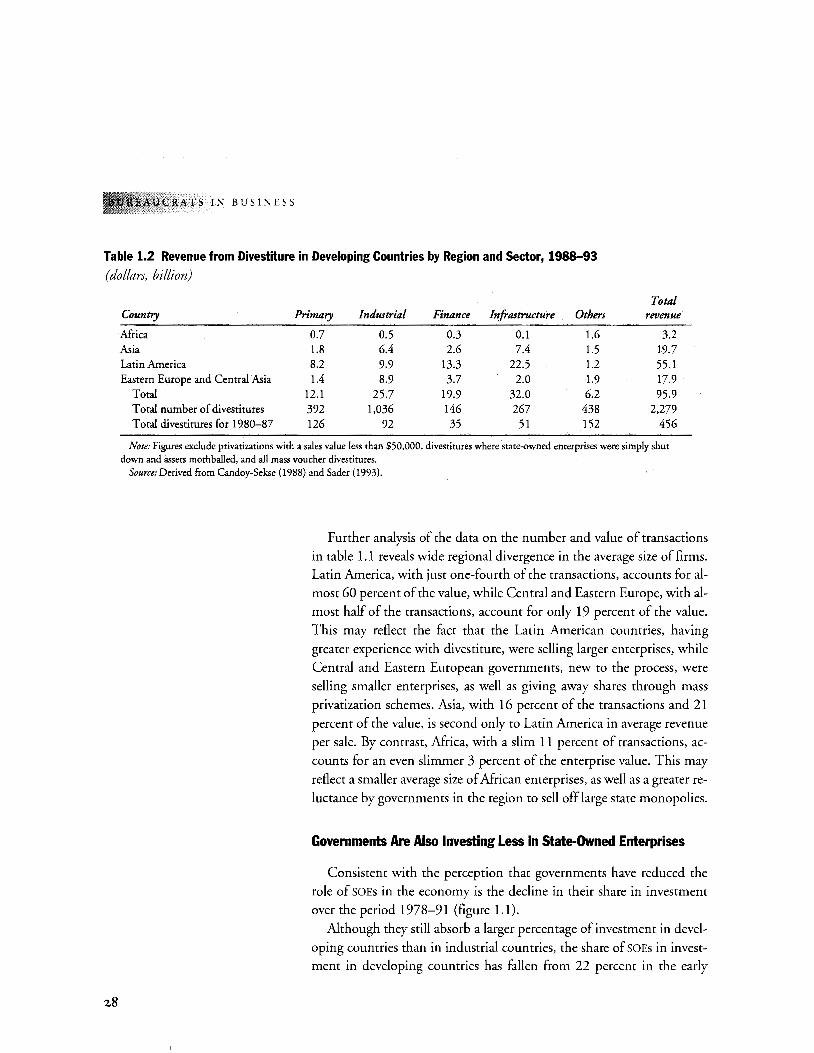
CRATS IN BUSINESS
Table 1.2 Revenue from Divestiture in Developing Countries by Region and Sector, 1988-93
(dollars, billion)
28
Total Country Primary Industrial Finance Infrastructure Others revenue
Mrica 0.7 0.5 0.3 0.1 1.6 3.2 Asia 1.8 6.4 2.6 7.4 1.5 19.7 Latin America 8.2 9.9 13.3 22.5 1.2 55.1 Eastern Europe and Central Asia 1.4 8.9 3.7 2.0 1.9 17.9
Total 12.1 25.7 19.9 32.0 6.2 95.9 Total number of divestitures 392 1,036 146 267 438 2,279 Total divestitures for 1980-87 126 92 35 51 152 456
Note: Figures exclude privatizarions with a sales value less than $50,000, divestitures where state-owned enterprises were simply shut down and assets mothballed, and all mass voucher divestitures.
Source: Derived from Candoy-Sekse (1988) and Sader (1993).
Further analysis of the data on the number and value of transactions
in table 1.1 reveals wide regional divergence in the average size of firms. Latin America, with just one-fourth of the transactions, accounts for al
most 60 percent of the value, while Central and Eastern Europe, with al
most half of the transactions, account for only 19 percent of the value.
This may reflect the fact that the Latin American countries, having
greater experience with divestiture, were selling larger enterprises, while
Central and Eastern European governments, new to the process, were
selling smaller enterprises, as well as giving away shares through mass
privatization schemes. Asia, with 16 percent of the transactions and 21 percent of the value, is second only to Latin America in average revenue
per sale. By contrast, Africa, with a slim 11 percent of transactions, ac
counts for an even slimmer 3 percent of the enterprise value. This may
reflect a smaller average size of African enterprises, as well as a greater re
luctance by governments in the region to sell offlarge state monopolies.
Governments Are Also Investing Less in State-Owned Enterprises
Consistent with the perception that governments have reduced the
role of SOEs in the economy is the decline in their share in investment
over the period 1978-91 (figure 1.1).
Although they still absorb a larger percentage of investment in devel
oping countries than in industrial countries, the share of SOEs in invest
ment in developing countries has fallen from 22 percent in the early
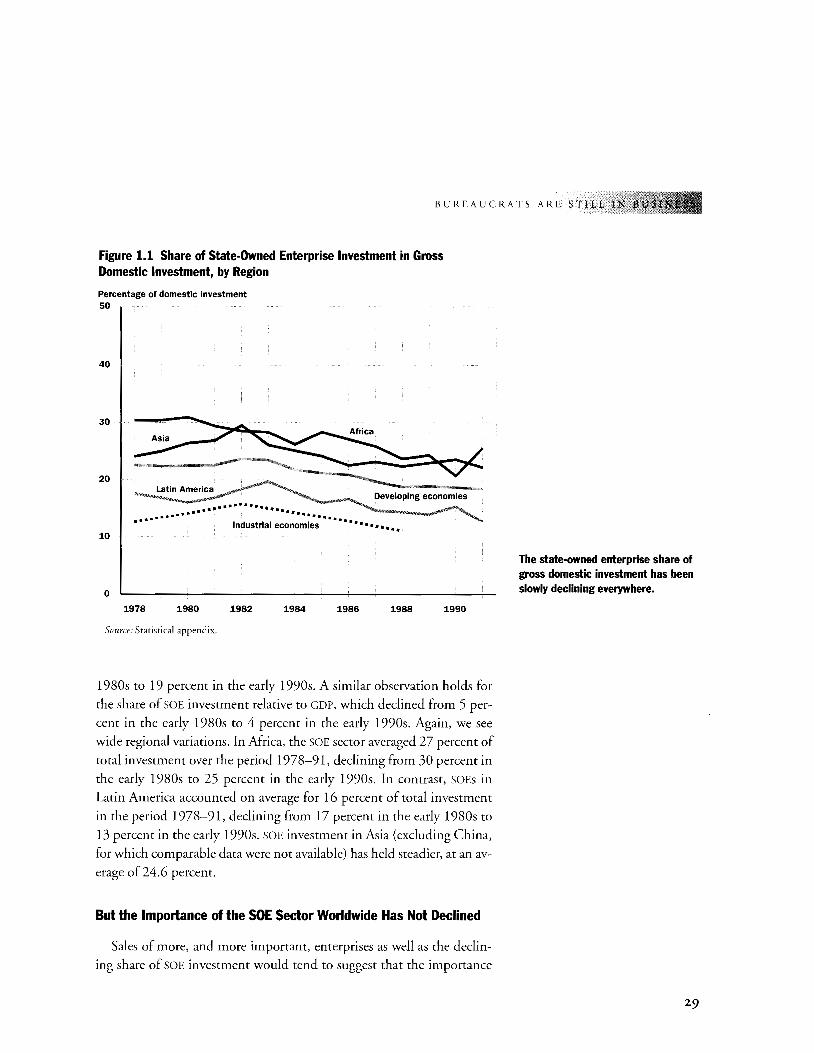
BUREAUCRATS ARE STILL IN
Figure 1.1 Share of State-Owned Enterprise Investment in Gross Domestic Investment, by Region
Percentage of domestic investment 50
40
30
20
···•··········•··· ····•······ •·•········• • Industrial economies • • • • • • ••• I
10
0
1978 1980 1982 1984 1986 1988
Source: Statistical appendix.
1990
1980s to 19 percent in the early 1990s. A similar observation holds for
the share of SOE investment relative to GOP, which declined from 5 per
cent in the early 1980s to 4 percent in the early 1990s. Again, we see
wide regional variations. In Mrica, the SOE sector averaged 27 percent of
total investment over the period 1978-91, declining from 30 percent in
the early 1980s to 25 percent in the early 1990s. In contrast, SOEs in
Latin America accounted on average for 16 percent of total investment
in the period 1978-91, declining from 17 percent in the early 1980s to
13 percent in the early 1990s. SOE investment in Asia (excluding China,
for which comparable data were not available) has held steadier, at an av
erage of 24.6 percent.
But the Importance of the SOE Sector Worldwide Has Not Declined
Sales of more, and more important, enterprises as well as the declin
ing share of SOE investment would tend to suggest that the importance
The state-owned enterprise share of gross domestic investment has been slowly declining everywhere.
29
~ruct: .. Kh T S 1 N BUSINESS
30
of SOEs has diminished in recent years. Neither trend, however, appears
to have made a significant dent. First, although divestiture has grown, it
is still small relative to the stock of SOEs. Dividing total transactions
worldwide (3,351) by the number of divesting countries (ninety-five)
over thirteen years (1980-93) yields an annual average ofless than three
divestitures per country per year, against hundreds of SOEs that could
have been divested in almost all countries.2 In fact, most countries fell
well short of the average, because transactions have been concentrated in
only a few countries. In 1980-87, eight countries accounted for 45 per
cent of divestiture transactions in developing countries. In 1988-93,
just five countries (Argentina, Brazil, Hungary, Mexico, and Poland) ac
counted for about 30 percent of developing-country transactions and
60 percent of the value of enterprises sold. Second, the declining share
of SOE investment may not have affected the size of the SOE sector in the
period we examined, because investment typically represents a small
proportion of capital stock. To the extent that this trend continues, the
relative role of the SOE sector in the economy will diminish in the future. But for now, the small number of divestitures relative to the total num
ber of SOEs, the concentration of sales in only a few countries, and the
fact that the decline in the SOE share of investment will only gradually
reduce the size of SOE capital stock relative to the rest of the economy all
suggest that the importance of the SOE sector on average has remained
substantially unchanged in developing countries.
The share of SOEs in developing-country GDP supports this view.
Excluding the transition economies, SOE value added as a percentage of
developing-country GDP has not decreased over time (figure 1.2). In the
late 1980s it was about 11 percent, little changed from the beginning of
the decade and higher than in the late 1970s. In contrast, SOEs' share of
GDP in industrial countries fell from about 9 percent in 1982 to less than
7 percent by 1988. During the 1986-91 period as a whole, setting aside
the transition economies, SOEs played the biggest role in Mrica, where
they accounted for an average of 14 percent of GDP, followed by Latin
America with 10 percent and Asia with 9 percent (figure 1.2).
Is SOE value added as a proportion of GDP a meaningful measure of
the relative importance of the SOE sector? It is possible, of course, that
SOE price increases in the 1980s offset the effects of divestiture and lower
investment; in that case, an SOE sector smaller by other measures would
nonetheless remain constant in terms of value added. This argument
would be valid if SOE selling prices rose faster than prices in the rest of
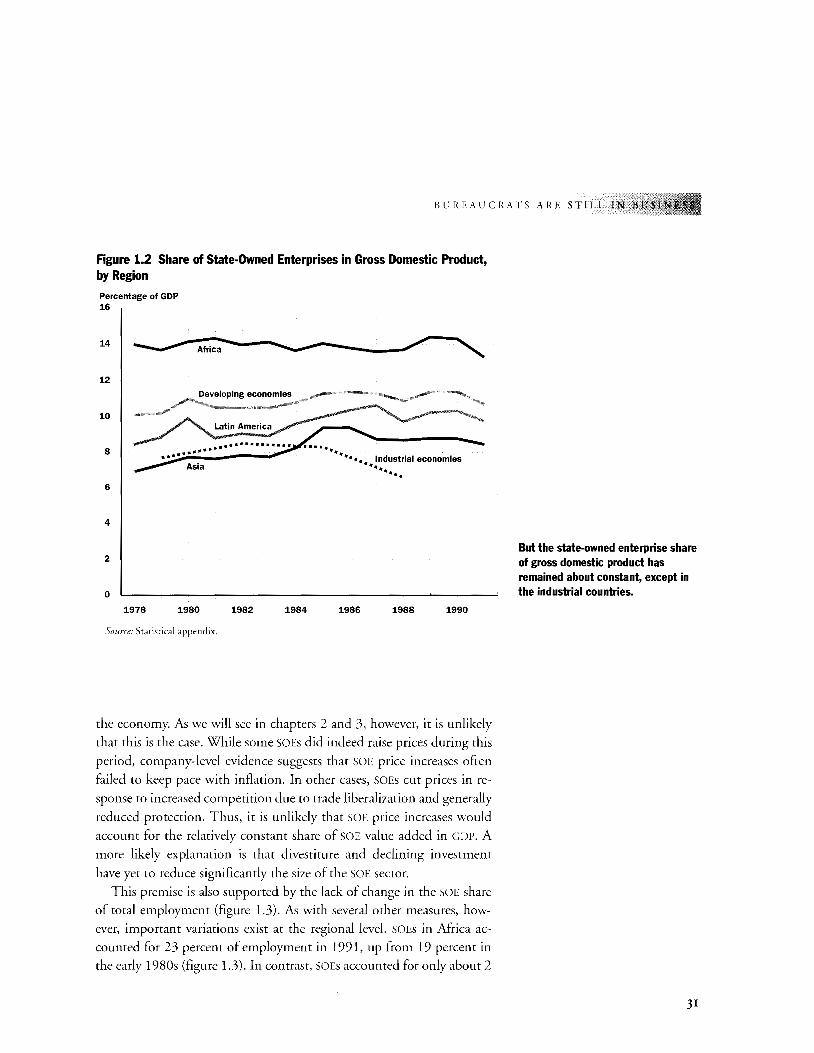
BUREAUCRATS ARE STILL IN BU
Figure 1.2 Share of State-Owned Enterprises in Gross Domestic Product, by Region
Percentage of GOP 16
14
I ____......- Africa
12
10
8
6
4
2
0
1978 1980
Source: Statistical appendix.
1982
..... ..
1984
• • • • • Industrial economies ······ ..
1986 1988 1990
the economy. As we will see in chapters 2 and 3, however, it is unlikely
that this is the case. While some SOEs did indeed raise prices during this
period, company-level evidence suggests that SOE price increases often
failed to keep pace with inflation. In other cases, SOEs cut prices in re
sponse to increased competition due to trade liberalization and generally
reduced protection. Thus, it is unlikely that SOE price increases would
account for the relatively constant share of SOE value added in GDP. A
more likely explanation is that divestiture and declining investment
have yet to reduce significantly the size of the SOE sector.
This premise is also supported by the lack of change in the SOE share
of total employment (figure 1.3). As with several other measures, how
ever, important variations exist at the regional level. SOEs in Africa ac
counted for 23 percent of employment in 1991, up from 19 percent in
the early 1980s (figure 1.3). In contrast, SOEs accounted for only about 2
But the state-owned enterprise share of gross domestic product has remained about constant, except in the industrial countries.
31
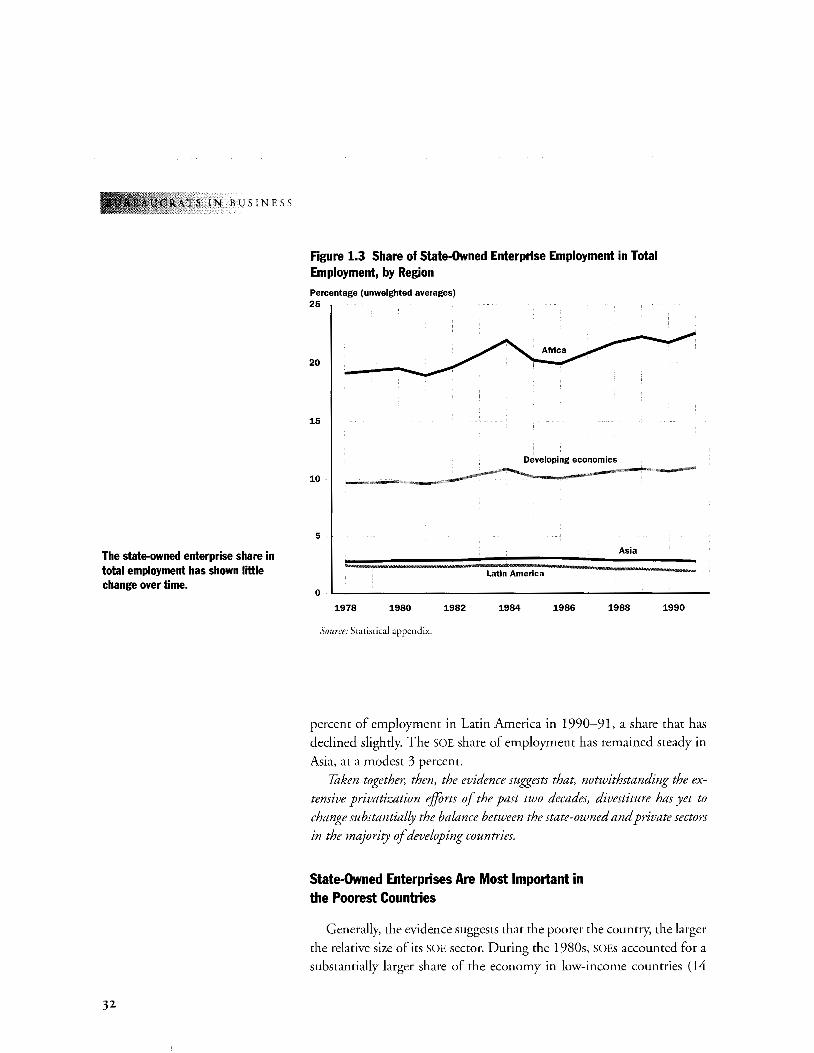
ATS IN BUSINESS
The state-owned enterprise share in total employment has shown little change over time.
32
Figure 1.3 Share of State-Owned Enterprise Employment in Total Employment, by Region Percentage (unwelghted averages) 25
20
15
10
5
0
1978 1980 1982
Source: Statistical appendix.
Developing economies
Asia
Latin America
1984 1986 1988 1990
percent of employment in Latin America in 1990-91, a share that has
declined slightly. The SOE share of employment has remained steady in
Asia, at a modest 3 percent.
Taken together, then, the evidence suggests that, notwithstanding the ex
tensive privatization efforts of the past two decades, divestiture has yet to
change substantially the balance between the state-owned and private sectors
in the majority of developing countries.
State-Owned Enterprises Are Most Important in the Poorest Countries
Generally, the evidence suggests that the poorer the country, the larger
the relative size of its SOE sector. During the 1980s, SOEs accounted for a
substantially larger share of the economy in low-income countries (14
BUREAUCRATS ARE STILL
percent of GDP, 18 percent of nonagricultural GDP, and 28 percent of in
vestment) than in middle-income countries (9 percent of GDP, 10 per
cent of nonagricultural GDP, and 17 percent of investment); while the
SOE share of the economy in high-income (industrial) countries was the
lowest of all (8 percent of GDP and 13 percent of investment). 3
Moreover, in contrast to the high- and middle-income economies,
where the average share of SOEs in the economy has declined, the share
of SOEs in the least developed economies-higher to begin with-has
held nearly constant (figure 1.4). In middle-income economies, the im
portance of SOEs in GDP, gross domestic investment, and employment
peaked in the mid-1980s and has fallen since. In the low-income
economies, the average share of SOEs in GDP climbed until 1989 before
dropping to mid-1980s levels; the SOE share of employment has re
mained nearly constant since the late 1970s. Of the three measures of
SOE importance in the low-income economies, only investment shares
have fallen, erratically, since the mid-1980s.
These measures clearly indicate that, despite divestiture efforts, SOEs
continue to play an important role in developing economies, especially
in the poorest countries. Whether or not this is a problem depends upon
the effect of SOEs on the economy. If that effect is negative, then reform
is vital, especially in least developed economies. We turn, therefore, to
an evaluation of the effect of SOEs on economic performance.
How SOEs Affect Economic Performance
WHILE A HANDFUL OF SOES UNDOUBTEDLY PERFORM VERY
well, there is a wealth of anecdotal evidence suggesting that
many more do not. Consider the following examples:
• In Turkey, Turkiye Taskorumu Kurmu, a state-owned coal mining
company, lost the equivalent of about $6.4 billion between 1986
and 1990. Losses in 1992 worked out to about $12,000 per worker,
six times the average national income. Yet health and safety condi
tions in the mine were so poor that a miners' life expectancy was
forty-six years, eleven years below the national average. In short,
the miners and the government would have been better off if the
government had imported coal and paid the miners to stay home.
33
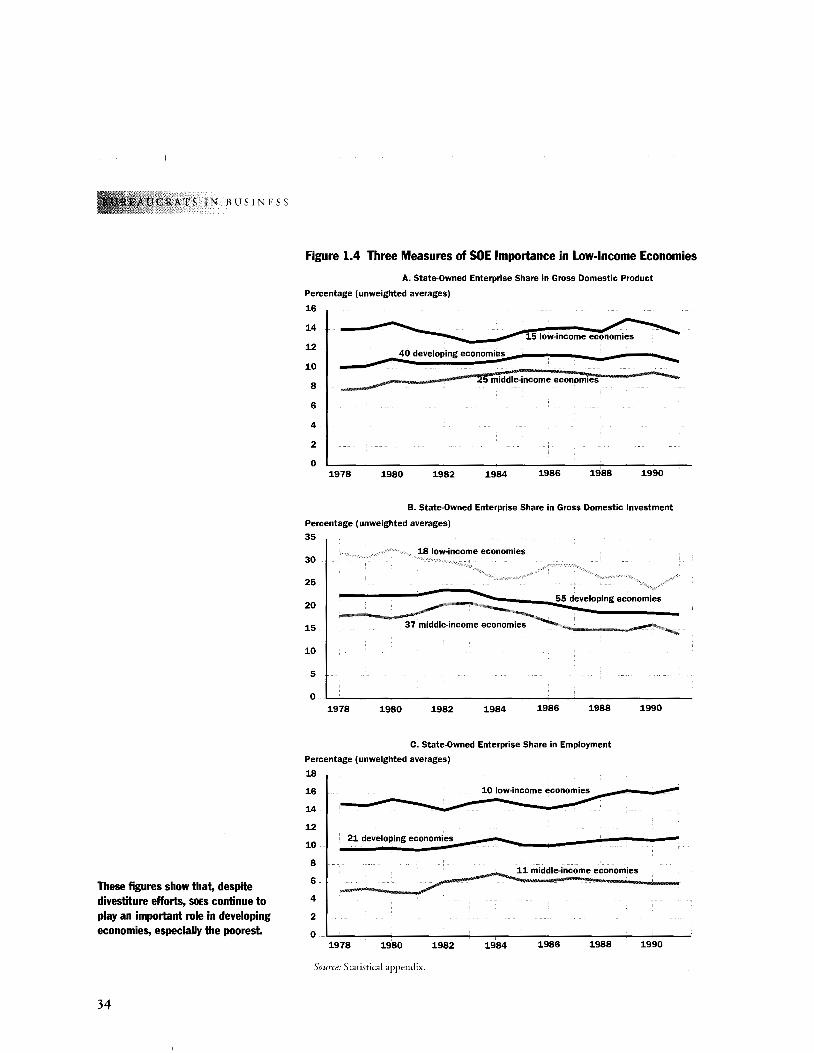
TC'RATS IN BUSINESS
These figures show that, despite divestiture efforts, SOES continue to play an important role in developing economies, especially the poorest.
34
Figure 1.4 Three Measures of SOE Importance in Low-Income Economies
A. State-Owned Enterprise Share in Gross Domestic Product
Percentage (unweighted averages)
16
14
12 _ 40 developing economies ~ __,-10
8
6
4
2
~~~-----·----~~~2~5rm~id~d;l;e-~in~c~o:m;;e~e~c~o~n~o~m~ieesr-------------~--
0 1978 1980 1982 1984 1986 1988 1990
B. State-Owned Enterprise Share in Gross Domestic Investment
Percentage (unweighted averages)
35
18 low-income economies 30
25
20
15
10
5
0 1978 1980 1982 1984 1986 1988
C. State-Owned Enterprise Share in Employment
Percentage (unweighted averages)
18
16
14
12
10
8
6
4
2
0
21 developing economies
1978 1980 1982
Source: Statistical appendix.
---11 middle-income economies
1984 1986 1988
1990
-
1990
BUREAUCRATS ARE STILL IN
• In the Philippines, the performance of the National Power Corpo
ration steadily deteriorated from 1985 until the early 1990s. In
1990 the capital region alone lost an estimated $2.4 billion in eco
nomic output due to power outages. By 1992-93, electricity was
shut off about seven hours a day in many parts of the countty.
• In Bangladesh, in 1992 the state sugar milling monopoly had
twice as many office workers as it needed, or about 8,000 extra
employees. Farmers near the outmoded state mills were required
to sell their sugar cane to the government at below-market prices,
with the result that many planted other crops, causing a shortage
of cane. Meanwhile, sugar cost twice as much on the open market
in Bangladesh as it did internationally.
• In Tanzania, the state-owned Morogoro shoe factory, built in the
1970s with a World Bank loan, never manufactured more than
about 4 percent of its supposed annual capacity. Designed to turn
out four million pairs of shoes a year, four times the international
norm, the factory planned to export three-quarters of its produc
tion to Europe, even though Tanzania lacked high-quality leather,
experienced designers, and shoe assembly-line workers. Ill-suited
to Tanzania's tropical heat, with steel pillars, aluminum walls, and
no ventilation system, the plant deteriorated quickly after it was
commissioned. Production ceased in 1990.
Of course such anecdotal evidence, no matter how disturbing, does
not in itself constitute a convincing argument for or against state own
ership; nor does it enable us to quantify the effect on the economy and
welfare oflarge SOE sectors. In this, the final section of this chapter, we
attempt such an assessment. We begin by presenting arguments and
empirical evidence at the microeconomic level that, on balance, pri
vate firms are more efficient than SOEs in markets that are competitive
or potentially competitive and that, under certain circumstances, the
same is true in monopoly markets as well. We include in this analysis
an assessment of the welfare consequences of privatizing SOEs and re
cent findings about the negative effect of SOEs on the environment.
We then turn to the way SOE sectors in the aggregate finance their op
eration and expansion, given that their finances may undermine fiscal
stability and fuel inflation. Finally, we draw on our microeconomic
and finance discussions to consider the impact of large SOE sectors on
growth.
35

SIN BUSINESS
36
The Impact of State Ownership at the Company Level
The argument for government ownership rests primarily on the as
sumption that governments can use SOEs to correct for various types of
market failure. Markets may fail where there are public goods (e.g.,
clean air or water, which no individual or group will fund for every
one), lumpy investments (e.g., large outlays such as roads or harbors
that the private sector is unwilling or unable to take on), failures in co
ordination (e.g., no market for steel unless there is a steel mill, and no
steel mill unless there is a market), or underdeveloped capital markets.
These conditions, arguably more prevalent in developing economies,
have often been cited to justify the creation and support of SOEs in de
veloping countries. (Arguments that SOEs can help achieve social objec
tives are also made; we address this issue in chapter 2.)
The argument against SOEs recognizes market failure but asserts that
the risk of government failure is often greater. Government is not a
monolithic entity; rather it answers to many constituencies and lacks
a unified chain of command. Because no individual or group owns a
state enterprise, no one has a clear stake in SOE returns, hence no one
has the responsibility and motivation to set clear performance goals and
assure they are attained. 4 Instead, politicians, bureaucrats, employees,
and other interest groups thrust upon SOEs multiple and often conflict
ing goals (e.g., profit maximization, employment maximization, and a
host of other social objectives) while simultaneously imposing a bewil
dering and sometimes contradictory collection of constraints (e.g.,
restricting layoffs, price increases, and the choice of suppliers or mar
kets). Multiple objectives and multiple constraints increase transaction
costs, distort the incentives facing SOE managers, and reduce manager
ial effort.5 If SOEs have access to subsidies, transfers, or government
guaranteed loans, as they often do, then there is, in addition, no threat
of bankruptcy to act as a check on inefficiency. 6
Both arguments accept that SOEs are less efficient than private firms
when markets work and when governments are able to provide credible
commitment to the private sector not to expropriate its assets. Where
markets fail, the choice of private versus state ownership is less clear cut
and will depend, case by case, on the tradeoffs between market failure
on one hand and government failure on the other. In monopoly or oli
gopoly markets, private firms may be more efficient than SOEs, but they
may exploit consumers and set prices so high that their products are
BUREAUCRATS ARE STILL IN B
available only to a wealthy few. For example, a poorly regulated private
water monopoly might price clean water out of reach of many house
holds. But a poorly managed and supervised water SOE may not do any
better. That is, it may also provide service only to a small proportion of
the population, not because of overpricing, but because its revenues
have been so eroded by underpricing, overstaffing, or mismanagement
that it has underinvested in expansion and maintenance. Both these
undesirable outcomes have remedies: better regulation for the private
enterprise, better pricing and incentive policies for the state-owned en
terprise. These tradeoffs and the conditions under which the balance
tips toward state or private ownership are a subject for further empiri
cal investigation, which we undertake in chapter 3. As we shall see, al
though the outcome varies according to sector and country circum
stances, the evidence suggests it more often tilts toward privatization,
especially in middle-income countries. In the remainder of this section,
we consider the available empirical evidence about the advantages of
state versus private ownership in competitive and monopoly markets.
The empirical literature that deals with the issue of private versus
public efficiency is of two types. Early studies compared the perfor
mance of state-owned and private enterprises in the same sector, across
sectors, and over time. (For surveys, see Borcherding, Pommerehne,
and Schneider 1982; Millward 1982).7 A general problem with most of
this literature is that it necessarily compares enterprises that, aside from
the obvious differences in ownership, have other differing characteris
tics. Although some studies attempted to adjust for the size of firms,
market structure, or enterprise objectives, it is almost impossible to
eliminate all interfirm differences. Indeed, Millward and Parker (1983)
assert the impossibility of reaching an unambiguous conclusion on the
basis of such comparisons. This problem is particularly acute in devel
oping countries, where most SOEs, even those in potentially competi
tive markets, have few comparable firms.
More recent work compares the performance of SOEs before and
after divestiture, divested with undivested SOEs, or divested firms with
a hypothetical counterfactual in which the same firm is assumed to
continue under state ownership. (For partial surveys of this literature,
see Galal and others 1994; Kikeri, Nellis, and Shirley 1992; Vickers
and Yarrow 1988).8 In competitive markets this literature gives the
edge to the private sector. Thus, Vickers and Yarrow (1988, 426) con
clude, "theoretical analysis and empirical evidence support the view
37
CRATS IN BUSINESS
38
that private ownership is most efficient-and hence privatization is
most suitable-in markets where effective (actual and potential) com
petition prevails." Where SOEs operate in noncompetitive markets, the
results and interpretations are less clear. However, one study (Gala! and
others 1994) analyzed twelve divestiture cases from Chile, Malaysia,
Mexico, and the United Kingdom (three telecommunications firms,
four airlines, two electricity companies, a container terminal, a truck
transport, and a lottery). The study finds that divestiture improved
world and domestic welfare in eleven of the twelve cases, as the figure
in box 1.2 shows. The gains came primarily from improved productiv
ity, increased investment, and better pricing; they occurred in both
competitive and monopoly markets, in part because the regulatory
framework for the monopolies was sound enough to allow private firms
to function efficiently and to protect consumers. The sample is small,
but the methodology is especially careful. The study measures the ef
fects of divestiture on the producers, consumers, workers, government,
and competitors and measures them over enough time to capture dy
namic effects. It isolates the effects of ownership from other factors by
asking: what would have happened in the absence of divestiture?
Although privatization can fail if not carried out properly, as we dis
cuss in chapters 2 and 5, the potential benefits from successful privat
ization are not confined to the measured gains to buyers, sellers, work
ers, and consumers. Divestiture can, in addition, stimulate new private
sector activities, help develop the capital market, and induce more
competitive behavior in general, none of which is readily measurable.
Similarly, although the economic effect is difficult to quantifY, recent
World Bank research indicates that divesting SOEs, especially older
ones, helps the environment, since state-owned plants tend to be more
polluting than their private sector counterparts.
Figure 1.5 illustrates the large gap in abatement activity between
state and private pulp and paper plants in four countries (Bangladesh,
India, Indonesia, and Thailand). In the study, private plants, whether
foreign or domestically owned, control pollution much better than
state-owned plants operating at similar scale and efficiency (Hettige
and others 1995).9 Of course, part of the problem is that state-owned
plants tend to be old, inefficient, and unprofitable. But even these fac
tors don't explain why state-owned plants pollute more. Figure 1.6 il
lustrates the public-private gap in water pollution per unit of output
that remained even after size, efficiency, and age were accounted for in
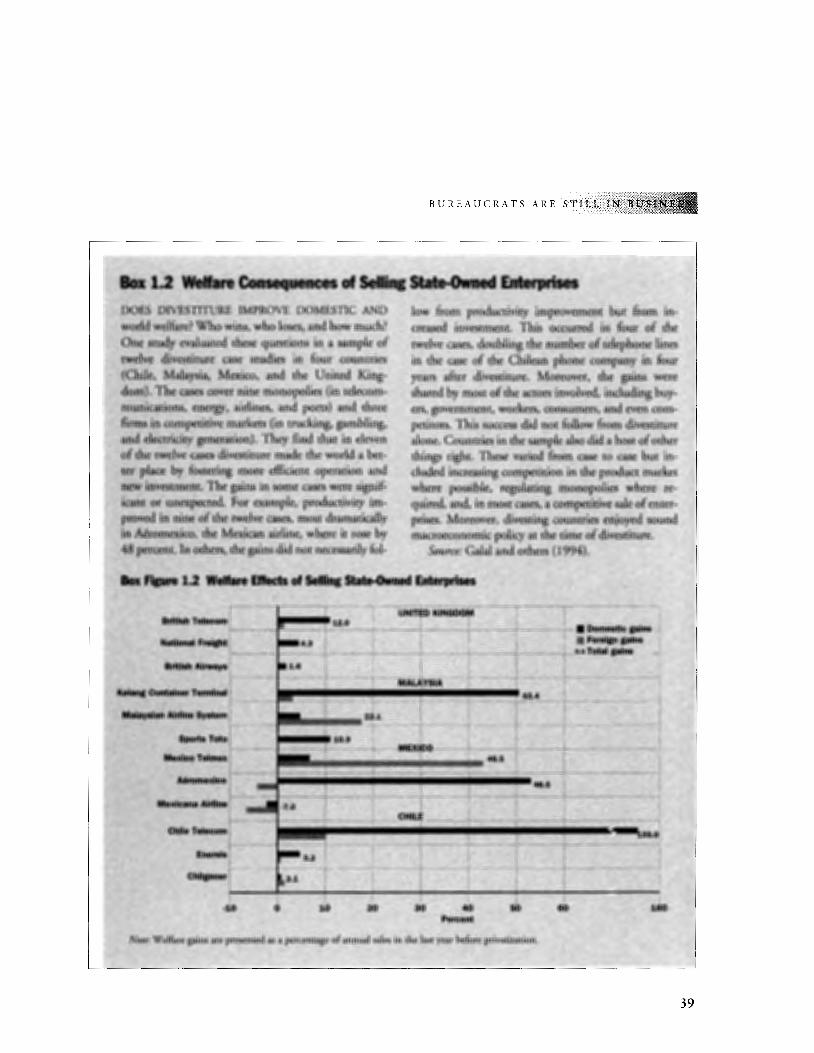
BUREAUCRATS ARE STILL IN B
laxl.2 WeHare Consequences of Selling State-Owned Enterprises DOES DIVESTITURE IMPROVE. DOMESTIC AND World welfare? Wh() wins, who loses, and how much? One srudy evaluated these questions in a sample of twelve divestiture case studies in four countries (Chile, Malaysia, Mexico, and the United King-do!n}. The cases cover nine monopolies (in telecom~ miulic;ations, energy, airlines, and ports) and three fmns in competitive markets (in trucking, .gambling, anc\. electricity ge!leration), They find that in eleven of the twelve cases divestiture made the world a bet-. ter place byfostering more efficient operation and · new inVestment. The gains in some cases were signifi~t or unexpected. For example. productivity im-
.·pr<Wedrn nine ofthe.twelve cases, most dramatically in Aerome)dco; the Mexican airline, where it rose by <ijl'. percent. In others, the gains did not necessarily fol-
low from productivity improvement but from increased investment. This occurred in four of the twelve cases, doubling the number of telephone lines in the case of the Chilean phone company in four years after divestiture. Moreover, the gains were shared by most of the actors involved, including buyers, government, workers, consumers, and even competitors. This success did not follow from divestiture alone. Countries in the sample also did a host of other things right. These varied from case to case but included increasing competition in the product market where possible, regulating monopolies where· required, and, in most cases, a competitive sale of enter~ prises. Moreover, divesting countries enjoyed sound macroeconomic policy at the time of divestiture.
Source: Gala! and others (1994).
··Box·~ 1.2 Welfare Effects of Selling State-Owned Enterprises
.Brltl$11 TeleCOm r··- ............ -··----r~·· ........... , ...... ,UNJT~ifKJNGDOJiif_, ........ _,T_,,_,._,,,_.r,·-·-·---·-·- .. ..
Natlcmat Freight 1,,...................... .. ............... ;. ... ,.j .. -~:!.. ··----r· ................ ,.-.. ; ......................... t ............... ; ..... -! .................. , .... ; .. . . . . . • . j-., ... ., ...... , ......... f ...... ,., ... - .... --.!---· ..... , ........... £............. ... • ... ,:·- ........................ ;. ...... .. .... , ........ !:.. • .............. ~ .... o.o 8rftlsll. Altway& t . .
l '~OontaJnltiT-natl
,",'I ' _,-;~,:.' ' l'"
t'c"'~' j_
St)OI't$ Toto I 10.9
~~e*<!r-.xr·-·-·-= .... : ... : ... s==*~~;~~:t~:~:.4~9~.·~~~:;.;--/·-.. -·.--............. _.,.~ ........ l ! ' : ' ' . ' '!' ..... ~""-"'"-~ ~~~ ....... , .., 48.6
·. ·. . ·, 't'""'''C"'"'"'""*'"'''·''"'"""'t'"'"''"''"'"''"'"''""""''"'""""+"''"'""''"·"''l'' ""'"'",_, ... ,.t'''"'"''"''"''"'"t"'"'''"-"'''''''"•'"''"""' '"! l!lkt~~:lcana Alltlnei . - . . ' -!
. t-................ , .......... 1 .. -" ........... --·+-·~ .................... t ......... , ....... "'i' ........................ l ........................ , .... r ........... ~ .......... :+· ..................................................... i
ChileTetecomL .... c···-·"•·'" L ............ ;.... .. ... J ................... L ........... ~...... ..... .L ........................... ~~~·~! Enerslsi .. · .. ' · ·
L ... Ohl...-j
$.2
~~------~------~----~------~------~------~-----+---------------~ 0 ~ ~ ~ ~ ~ 00 ~ Percent
Nate: Welfare gains ate presented as a percentage of annual sales in the last year before privatization.
39
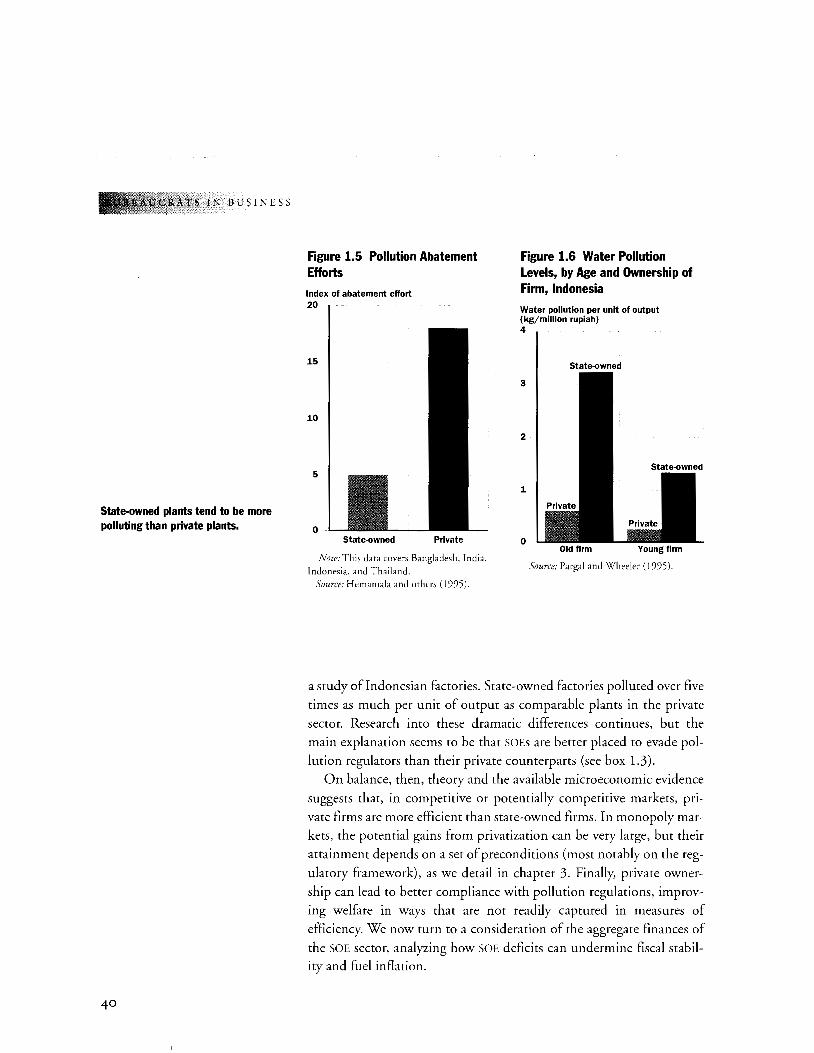
..\ TS IN BUSINESS
State-owned plants tend to be more polluting than private plants.
40
Figure 1.5 Pollution Abatement Efforts
Index of abatement effort 20
15
10
5
0 State-owned Private
Note: This data covers Bangladesh, India, Indonesia, and Thailand.
Source: Hemamala and others (1995).
Figure 1.6 Water Pollution Levels, by Age and Ownership of Firm, Indonesia
Water pollution per unit of output (kg/million rupiah) 4
State-owned
3
2
1
0 Old firm Young firm
Source: Parga! and Wheeler (1995).
a study ofindonesian factories. State-owned factories polluted over five
times as much per unit of output as comparable plants in the private
sector. Research into these dramatic differences continues, but the
main explanation seems to be that SOEs are better placed to evade pol
lution regulators than their private counterparts (see box 1.3).
On balance, then, theory and the available microeconomic evidence
suggests that, in competitive or potentially competitive markets, pri
vate firms are more efficient than state-owned firms. In monopoly mar
kets, the potential gains from privatization can be very large, but their
attainment depends on a set of preconditions (most notably on the reg
ulatory framework), as we detail in chapter 3. Finally, private owner
ship can lead to better compliance with pollution regulations, improv
ing welfare in ways that are not readily captured in measures of
efficiency. We now turn to a consideration of the aggregate finances of
the SOE sector, analyzing how SOE deficits can undermine fiscal stabil
ity and fuel inflation.
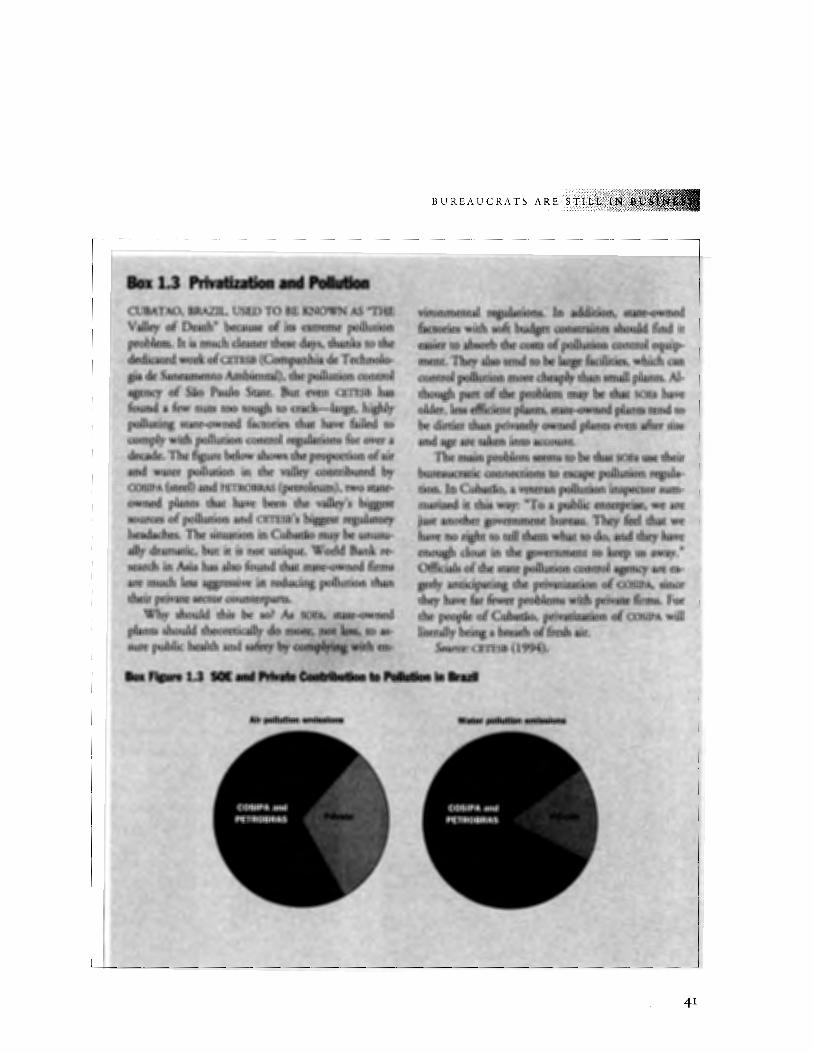
BUREAUCRATS ARE STILL 1
BOx ·1•3 Privatlzation,and·POJilll. CUl3ATAO, RltAZIL.··usEDTO.BE.;Klio~'M"t~E···.·. .. ~~~ental .r~~~~~.;~~N~~id~~ .• s~*~~wAed Valley (1f Death" because of .its ~trem~ pollution.··. • ~etorieswithsottliu~et.·i£o~~J!.should; find it ptol>lem. It is .tnU<ih cleaner these da)rs. thanks to th~ .. . ~iet;'to ll.bsoth the c~ts 6tpqtl\ttitlh eonttol equip-
.·. dedicated. work ofCETESB {Comparthia de Technolo~ .:tnent.Tiley~otend tO .b¢Jargefacil1ties, ~ich can · gia de Saneantento Ambiental), thepollut,loncontrol controlpolll.lti~~ ~~re ch~ply.~ sma,ll plants. AI~ agenqr of Sao . Paulo State. But eV;en ~~B has th9ugh p~~·ti~ttie:~rtsbl~.Jna)". be ~bat SO£s have .foUnd a ·few nuts roo tough. to .. erac;k_...htrge, .big~ oldiit, less ~ie}i~ ~t~; .ate:-&\vnel:lpl~~··teruho polluting state~wned factories. tha.t have failed to be dirtier ~ .pthtately tiW:n¢d plants e~en~Mter size romply with pollution control regulations for over i and • at(t$keninto ac~<ru.lu; · .. · ·.··•. 1 •. · ~· .. • •.·.··: •• .
decade. The figure below shows~ prorortion of air . The~ problem ~~itO •be diat:S()ES ~e their a~d water. pollution in the v.Uiey CQntrlbuted by f>uteau~tic cotitl~cti¥ns ~() ~~ poMution regt:tla~
.. ¢(?Sl!>A·(steel} and PETROBRAS (pett~l~). two state~. . .. ti<>n.ln CUbatiq,. av~t~tn poat\ti~n!~~r .~ owned plants .. that •. have .. been ·. the valley's .·biggest·· marized i~. this .-war: "j't>. a 'ptib~~ .ent.;i:prt$!~'We are S()ttrce$ of pqllution and CETES13'i btggesr regulatory Just another~ovei:run~nt bureati~ ·Til~ It::~l ~'we h~ches. The sit~tion in Cubatln ·m.ay.beunustt-' have no rlght to tell ~ \\fh~7.~ &o; Mid they .have ally dnunatic! but ids not unique. World Bankre~ enough clout in ill~ g<>\retfirtmiit' to ~ep us away." search i11,:Asia has also found tJlatsta;te~owned firm& Ofticials,¢fth~ sta~~.p9lll;ltion<:q~tt0ta~nq;are ea~
· are mudlleB$ ~shre in .reducltig pollution than gerly antidpatitll the pri+.i~t~~·q(·<J;.<?:~A;. since their private sector ¢ounterparts. . . .. . . . . . .. they have ~ &w¢tptob~ ~ pii~~~ty~ For
Why should· this be so?. As .~t';1~t;·~~~~wne,d the people t>fCub~tio~ privatiza~ion qf ¢0SIPA will ;:;::;::e~~o=~~4~~~-i~~~·. Jit;~!t~i~=e(jt:94~;t~h rot; ·· ·
41
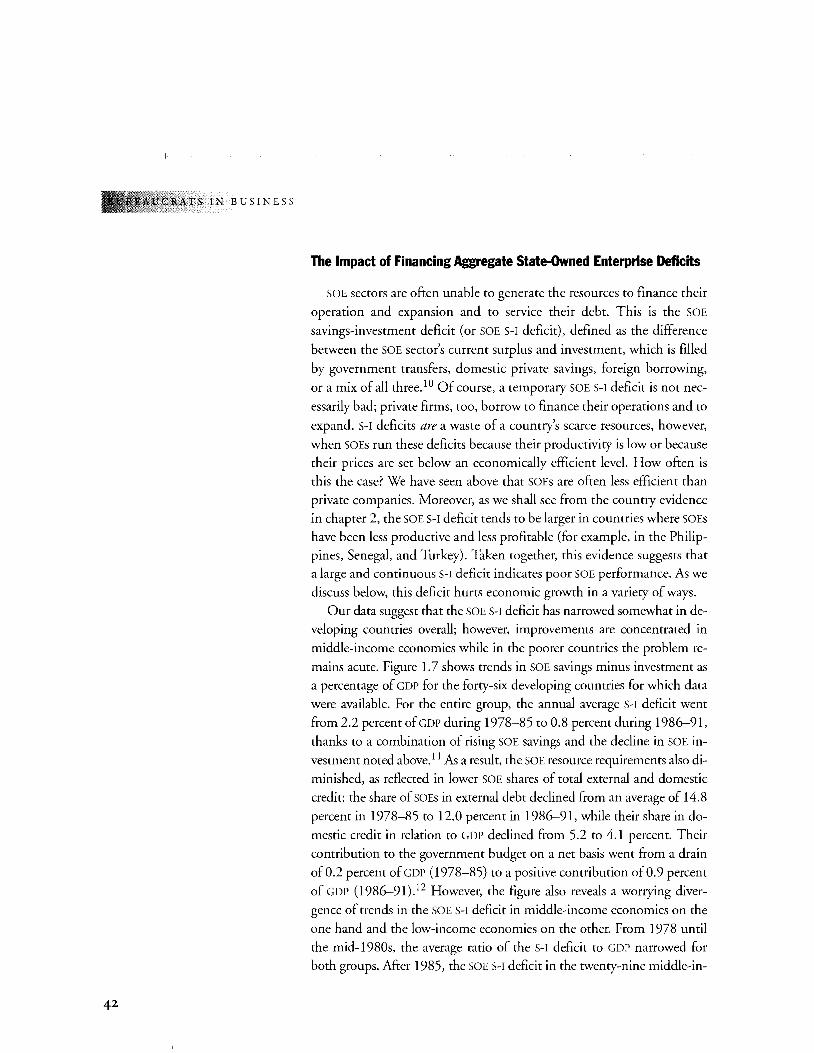
'RATS IN BUSINESS
42
The Impact of Financing Aggregate State-Owned Enterprise Deficits
SOE sectors are often unable to generate the resources to finance their
operation and expansion and to service their debt. This is the SOE
savings-investment deficit (or SOE S-I deficit), defined as the difference
between the SOE sector's current surplus and investment, which is filled
by government transfers, domestic private savings, foreign borrowing,
or a mix of all three. 10 Of course, a temporary SOE S-I deficit is not nec
essarily bad; private firms, too, borrow to finance their operations and to
expand. S-I deficits are a waste of a country's scarce resources, however,
when SOEs run these deficits because their productivity is low or because their prices are set below an economically efficient level. How often is
this the case? We have seen above that SOEs are often less efficient than
private companies. Moreover, as we shall see from the country evidence
in chapter 2, the SOE s-r deficit tends to be larger in countries where SOEs
have been less productive and less profitable (for example, in the Philip
pines, Senegal, and Turkey). Taken together, this evidence suggests that
a large and continuous S-1 deficit indicates poor SOE performance. As we
discuss below, this deficit hurts economic growth in a variety of ways.
Our data suggest that the SOE S-I deficit has narrowed somewhat in de
veloping countries overall; however, improvements are concentrated in
middle-income economies while in the poorer countries the problem re
mains acute. Figure 1. 7 shows trends in SOE savings minus investment as
a percentage of GDP for the forty-six developing countries for which data
were available. For the entire group, the annual average S-I deficit went
from 2.2 percent of GDP during 1978-85 to 0.8 percent during 1986-91,
thanks to a combination of rising SOE savings and the decline in SOE in
vestment noted above. 11 As a result, the SOE resource requirements also di
minished, as reflected in lower SOE shares of total external and domestic
credit: the share of SOEs in external debt declined from an average of 14.8
percent in 1978-85 to 12.0 percent in 1986-91, while their share in do
mestic credit in relation to GDP declined from 5.2 to 4.1 percent. Their
contribution to the government budget on a net basis went from a drain
of 0.2 percent of GDP (1978-85) to a positive contribution of 0.9 percent
of GDP (1986-91)_12 However, the figure also reveals a worrying diver
gence of trends in the SOE S-I deficit in middle-income economies on the
one hand and the low-income economies on the other. From 1978 until
the mid-1980s, the average ratio of the S-I deficit to GDP narrowed for
both groups. After 1985, the SOE S-I deficit in the twenty-nine middle-in-
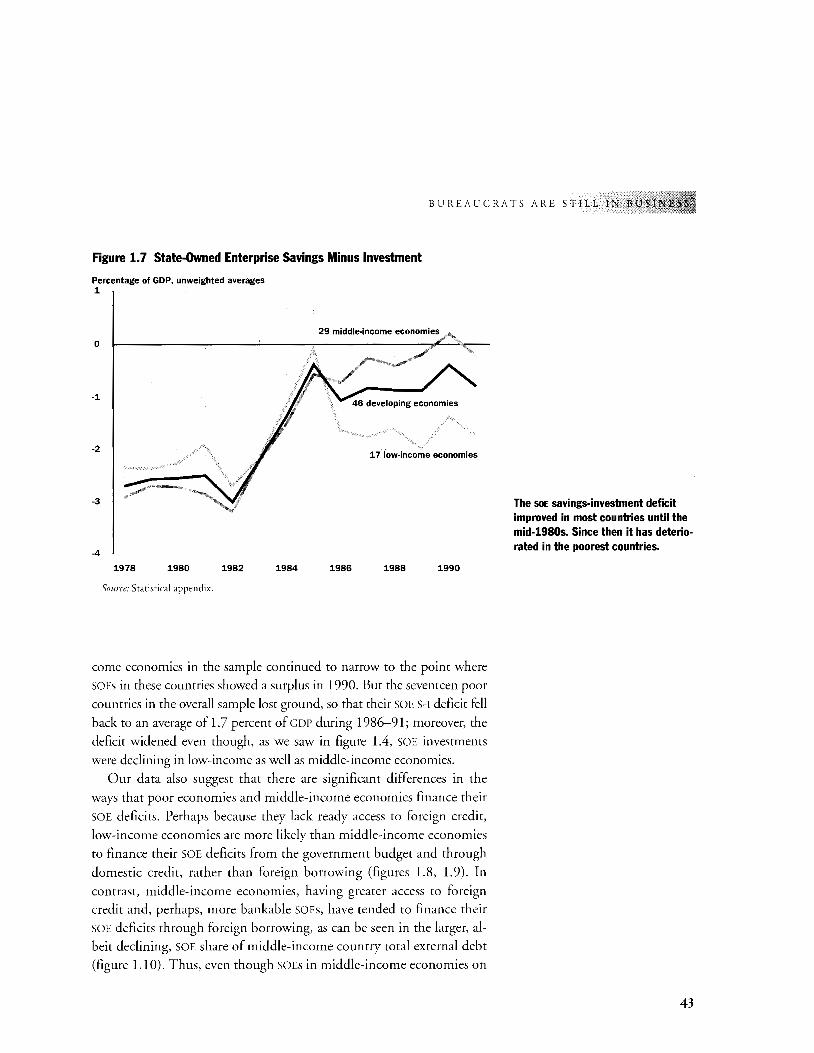
BUREAUCRATS ARE STILL IN BUS
Figure 1.7 State-Owned Enterprise Savings Minus Investment
Percentage of GOP, unweighted averages 1
0
-1
-2
-3
-4
1978 1980 1982
Source: Statistical appendix.
17 low-income economies
1984 1986 1988 1990
come economies in the sample continued to narrow to the point where
SOEs in these countries showed a surplus in 1990. But the seventeen poor
countries in the overall sample lost ground, so that their SOE S-1 deficit fell
back to an average of 1.7 percent of GOP during 1986-91; moreover, the
deficit widened even though, as we saw in figure 1.4, SOE investments
were declining in low-income as well as middle-income economies.
Our data also suggest that there are significant differences in the
ways that poor economies and middle-income economies finance their
SOE deficits. Perhaps because they lack ready access to foreign credit,
low-income economies are more likely than middle-income economies
to finance their SOE deficits from the government budget and through
domestic credit, rather than foreign borrowing (figures 1.8, 1.9). In
contrast, middle-income economies, having greater access to foreign
credit and, perhaps, more bankable SOEs, have tended to finance their
SOE deficits through foreign borrowing, as can be seen in the larger, al
beit declining, SOE share of middle-income country total external debt
(figure 1.1 0). Thus, even though SOEs in middle-income economies on
The SOE savings-investment deficit improved in most countries until the mid-1980s. Since then it has deteriorated in the poorest countries.
43
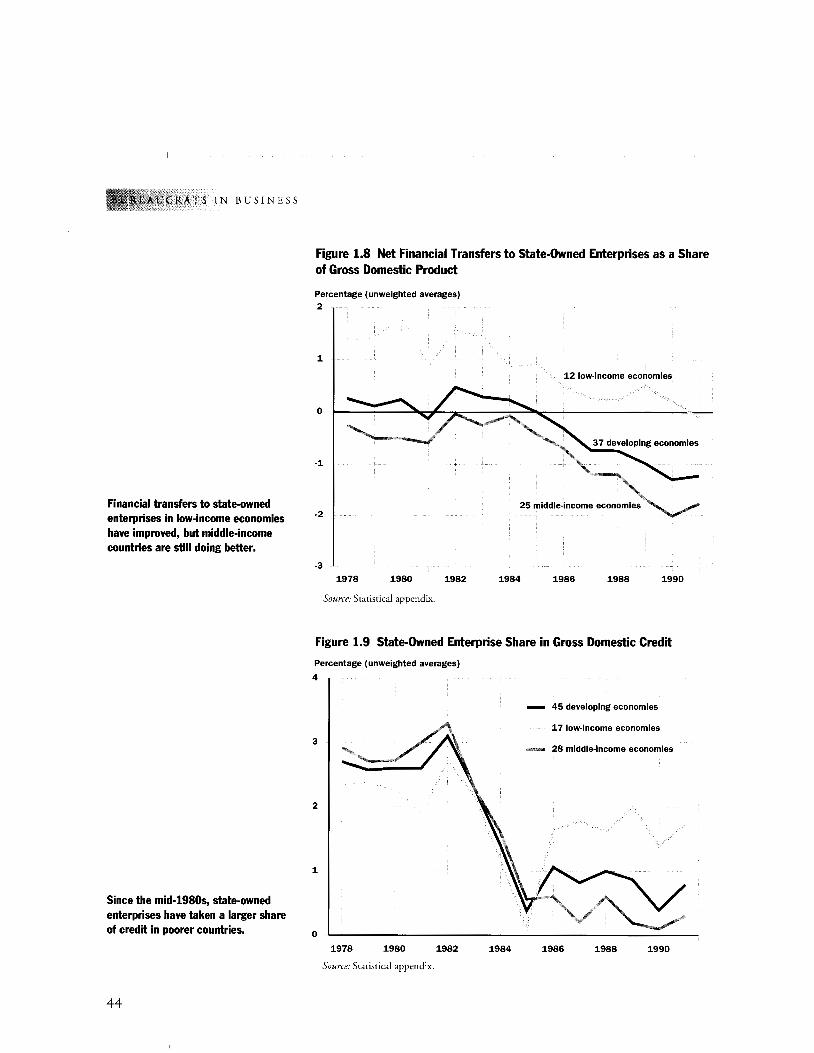
RATS IN BUSINESS
Financial transfers to state-owned enterprises in low-income economies have improved, but middle-income countries are still doing better.
Since the mid-1980s, state-owned enterprises have taken a larger share of credit in poorer countries.
44
Figure 1.8 Net Financial Transfers to State-Owned Enterprises as a Share of Gross Domestic Product
Percentage ( unweighted averages) 2
1
0
-1
-2
-3
1978 1980 1982
Source: Statistical appendix.
12 low-income economies
1984 1986 1988 1990
Figure 1.9 State-Owned Enterprise Share in Gross Domestic Credit
Percentage (unweighted averages)
4
3
2
1
0
1978 1980 1982
Source: Statistical appendix.
45 developing economies
17 low-income economies
28 middle-income economies
1984 1986 1988 1990
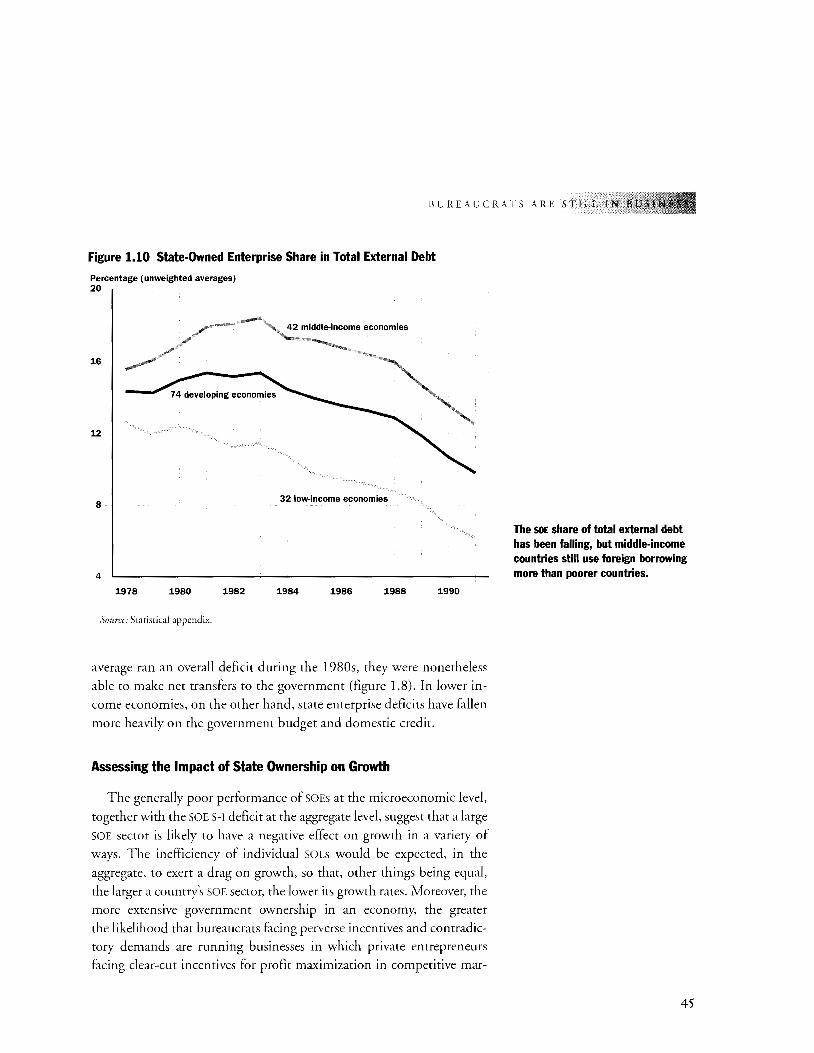
BUREAUCRATS ARE STILL IN
Figure 1.10 State-Owned Enterprise Share in Total External Debt
Percentage (unweighted averages) 20
16
12
8
4
1978 1980 1982
Source: Statistical appendix.
32 low-income economies
1984 1986 1988 1990
average ran an overall deficit during the 1980s, they were nonetheless
able to make net transfers to the government (figure 1.8). In lower in
come economies, on the other hand, state enterprise deficits have fallen
more heavily on the government budget and domestic credit.
Assessing the Impact of State Ownership on Growth
The generally poor performance of SOEs at the microeconomic level,
together with the SOE S-1 deficit at the aggregate level, suggest that a large
SOE sector is likely to have a negative effect on growth in a variety of
ways. The inefficiency of individual SOEs would be expected, in the
aggregate, to exert a drag on growth, so that, other things being equal,
the larger a country's SOE sector, the lower its growth rates. Moreover, the
more extensive government ownership in an economy, the greater
the likelihood that bureaucrats facing perverse incentives and contradic
tory demands are running businesses in which private entrepreneurs
facing dear-cut incentives for profit maximization in competitive mar-
The SOE share of total external debt has been falling, but middle-income countries still use foreign borrowing more than poorer countries.
45
TS IN BUSINESS
46
kets would be more efficient. Financially, the burden of SOE deficits can
hinder growth by crowding out expenditure on health and education,
by increasing fiscal deficits, and by contributing to inflation. Although
data limitations preclude a full assessment of the effect of SOEs on
growth, we conclude this chapter by exploring first the effect of the effi
ciency differential at the level of the firm and then the aggregate effect of
SOE deficits on growth. 13
One obvious piece of evidence of the impact of state ownership is the
dramatic collapse of the former centrally planned economies of Eastern
and Central Europe. This massive political, economic, and social transfor
mation is, of course, due to a host of factors, including some, such as dis
torted incentives, central planning, and excessive regulation, that could,
theoretically at least, be divorced from state ownership. But the fact re
mains that these economies were nearly fully state-owned. To be sure, these
economies were able to grow rapidly in the postwar period, thanks to high
investment rates. However, the relative inefficiency of the use of this in
vestment ultimately meant that SOEs were unable to deliver the goods and services, and, eventually, the economic growth, taken for granted by people
in market-oriented countries with similar resource and population endow
ments. In the 1970s and 1980s, growth in Eastern Europe slowed
markedly to, for example, an annual rate of only 1.0 percent in Poland dur
ing 1980-88. Since the late 1980s, these economies have been engaged in
a major transformation in which the private sector is playing a much more
important role. The story for China, which is also undergoing a plan-to
market transition, is more complex but in keeping with the premise that
extensive state ownership is an impediment to growth. 14
The evidence on the impact of state ownership in mixed economies,
is less dramatic than in the former centrally planned economies because
the size of the SOE sector was less significant; but it also supports the
premise that large SOE sectors are bad for growth. The study of 12 di
vestitures reported in Box 1.2 suggests that, if the experience of this
small sample holds more broadly, then divesting half the SOE sector in a
country where SOEs account for 10 percent of GDP-about typical for a
developing country-would increase GDP by 1 percent; and gains of a
similar magnitude in absolute terms would follow year after year (Galal
and others 1994). 15 In a country like Egypt, where the SOE sector ac
counts for one-third of the economy, the gains could be even higher.
As for large SOE S-I deficits, which we have shown above to be partic
ularly acute and persistent in the poorest countries, these have a negative
BUREAUCRATS ARE STILL lN
effect on growth in two specific ways. At the simplest level, money spent
to support a money-losing enterprise is then unavailable for growth
promoting social services, such as education and health. In a somewhat
more complex way, SOE deficits undermine fiscal stability and con
tribute to inflation, making it more difficult for governments to provide
a macroeconomic environment conducive to rapid, sustained growth.
Subsidies to SOEs are sometimes justified on social grounds, that they
provide jobs or inexpensive goods and services that would otherwise be
unavailable to the poor. Setting aside the question of whether or not SOEs
actually attain these goals (see chapter 2), our data suggest that in many
countries the explicit operating subsidies that SOEs absorb would provide
a very significant boost to government efforts to provide basic health and
education, which previous studies have shown to be closely correlated to
long-term growth. Diverting SOE operating subsidies to basic education,
for example, would increase central government education expenditures
by 50 percent in Mexico, 74 percent in Tanzania, 160 percent in Tunisia,
and 550 percent in India. Alternatively, diverting SOE subsidies to health
care would have allowed central governments to more than double health
expenditures in Senegal and increase them by threefold in Turkey, about
fourfold in Mexico and Tunisia, and fivefold in lndia. 16 Of course, in
countries where the SOE sector is smaller and/or SOEs are better run, very
little money is diverted to cover SOE operating subsidies. In Thailand, for
example, SOE subsidies are equivalent to only one-tenth of 1 percent of
government expenditures on education. Figure 1.11 shows the percent
age by which central governments could increase spending on education
and health if they eliminated direct SOE subsidies.
The other cost to growth of SOE deficits, the impact on fiscal stability
and inflation, is harder to quantify but perhaps ultimately more signifi
cant, given the abundant evidence of the importance of macroeconomic
stability to long-term growth. 17 A large SOE S-I deficit can be financed in
a variety of ways, all of which have a potentially negative effect on
growth. For example, a government may resort to central bank financ
ing, effectively printing money to pay SOE debts, with the attendant in
flationary pressures. Alternatively, the government may direct the bank
ing system to loan money to financially strapped SOEs, diverting credit
that would otherwise have gone to the private sector. Finally, govern
ments may borrow abroad to finance SOE deficits, thereby contributing
to a balance of payments deficit and hence the current account deficit,
and so exerting downward pressures on the real exchange rate.
47
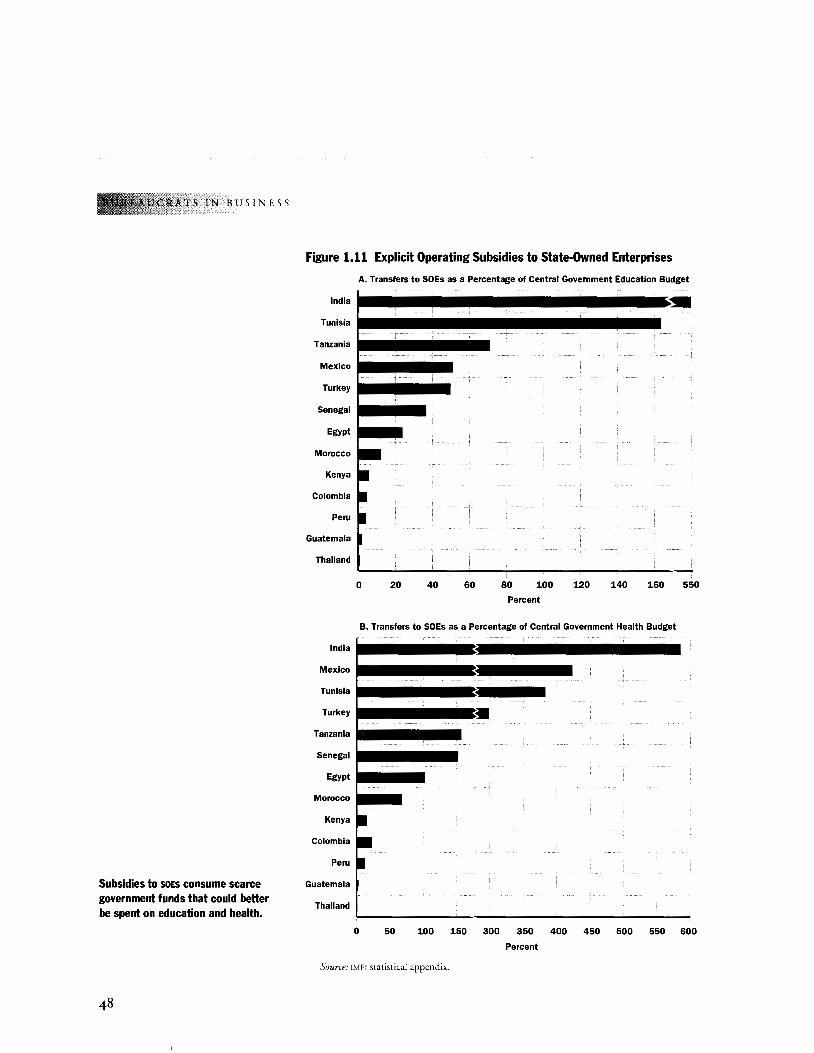
TS IN BUSINESS
Subsidies to soEs consume scarce government funds that could better be spent on education and health.
48
Figure 1.11 Explicit Operating Subsidies to State-Owned Enterprises
A. Transfers to SOEs as a Percentage of Central Government Education Budget
India ...................... ~ Tunisia
Tanzania
Mexico
Turkey ~ Senegal
Egypt
Morocco
Kenya
Colombia
Peru
Guatemala
Thailand
India
Mexico
Tunisia
Turkey
Tanzania
Senegal
Egypt
Morocco
Kenya
Colombia
Peru
Guatemala
Thailand
0 20 40 60 80 1.00 1.20 1.40 1.60 550
Percent
B. Transfers to SOEs as a Percentage of Central Government Health Budget
0 50 1.00 1.50 300 350 400 450 500 550 600
Percent
Source: IMF; statistical appendix.
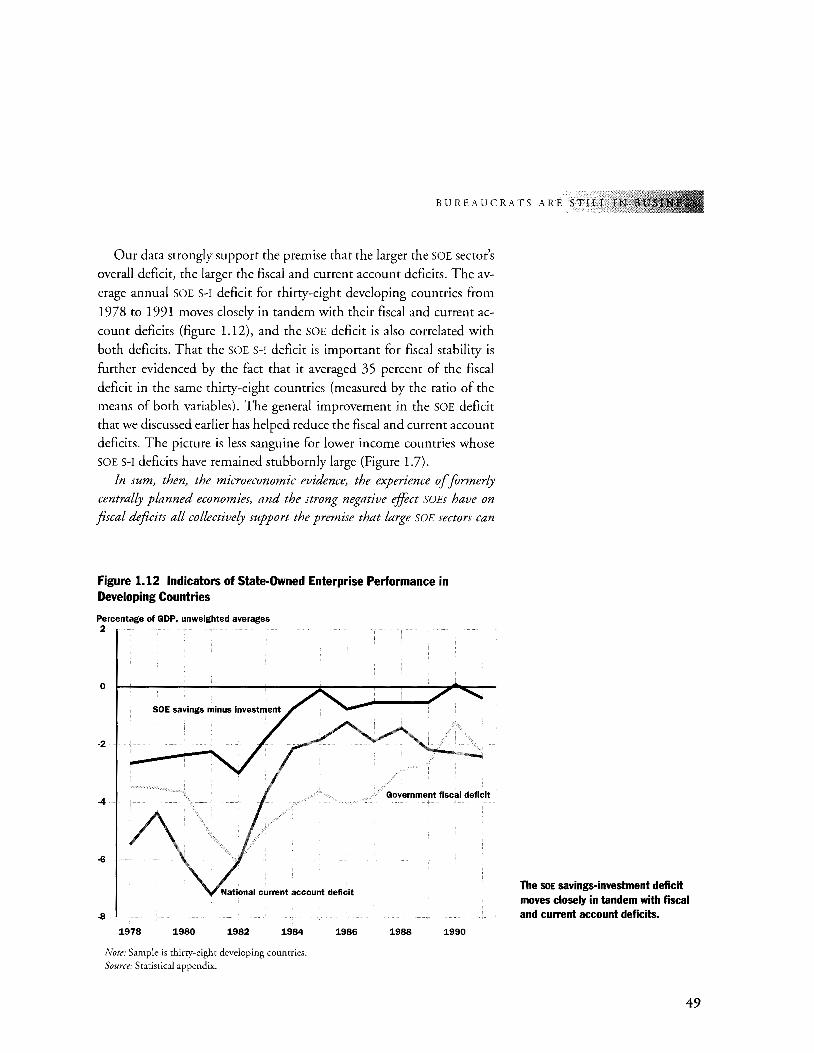
BUREAUCRATS ARE STILL IN
Our data strongly support the premise that the larger the SOE sector's
overall deficit, the larger the fiscal and current account deficits. The av
erage annual SOE S-I deficit for thirty-eight developing countries from
1978 to 1991 moves closely in tandem with their fiscal and current ac
count deficits (figure 1.12), and the SOE deficit is also correlated with
both deficits. That the SOE s-r deficit is important for fiscal stability is
further evidenced by the fact that it averaged 35 percent of the fiscal
deficit in the same thirty-eight countries (measured by the ratio of the
means of both variables). The general improvement in the SOE deficit
that we discussed earlier has helped reduce the fiscal and current account
deficits. The picture is less sanguine for lower income countries whose
SOE s-r deficits have remained stubbornly large (Figure 1.7).
In sum, then, the microeconomic evidence, the experience of formerly
centrally planned economies, and the strong negative effect SOEs have on
fiscal deficits all collectively support the premise that large SOE sectors can
Figure 1.12 Indicators of State-Owned Enterprise Performance in Developing Countries
Percentage of GOP, unweighted averages 2
0
SOE savings minus investment
·2
-4
-6
-8
1978 1980 1982 1984
Note: Sample is thirty-eight developing countries. Source: Statistical appendix.
Government fiscal deficit
1986 1988 1990
The SOE savings-investment deficit moves closely in tandem with fiscal and current account deficits.
49
TS IN BUSINESS
50
hinder growth. Moreover, because SOE sectors tend to be larger in low-in
come countries, SOEs are likely to be most costly in the countries that can
least afford them.
Conclusion
W E HAVE SHOWN THAT DESPITE A DECADE OF DIVESTI
ture, SOEs continue to dominate an important share of the
economy in a large number of developing-market econ
omies. The relative size of the SOE sector is much larger in the poorest
economies than in industrial and middle-income countries. Of course,
the relative size of the SOE sector would not matter if SOEs were effi
cient. However, we have presented evidence that SOEs are less efficient
than the private sector in competitive markets and, with effective regu
lation of private firms, in monopoly markets as well. Finally, we have
shown that large SOE sectors can be a drag on the economy because of
the aggregate impact of inefficient operation at the microeconomic
level and because large SOE sectors are typically associated with large fis
cal and current account deficits, which in turn have negative repercus
sions on growth.
In sum, although much has been written about the potential bene
fits of reforming SOEs, and leaders in nearly all developing countries
have said that they intend to reform, these efforts have not significantly
reduced the economic role of SOEs nor have they measurably improved
SOE performance. What explains this gap between rhetoric and results?
Given the high cost of preserving the SOE status quo, and the very sig
nificant benefits of reform, why have so few countries reformed suc
cessfully? To answer these questions, we need first to understand how
the policies affecting SOEs have differed between countries that re
formed successfully and those that did not. We turn to this inquiry in
our next chapter.
Notes
1. The two periods come from different data sets and may not be strictly comparable. No data are available on value of transactions for the earlier period. Data for the later period exclude East Germany and the voucher sales and privatization of small-scale enterprises in Eastern Europe.
2. If we had included the recent voucher privatization in Eastern Europe and former Soviet Union, it would have increased our total number of privatizations severalfold, but it would also have added many thousands of SOEs to the stock of enterprises that could have been divested.
3. There are fifteen low-income and twenty-five middle-income countries in our sample for SOE value added (eighteen low-income and thirty-seven middleincome economies for SOE investment) using the 1994 World Development Report's definitions of per capita income of $675 or less for lower-income and $676 to $8,355 for middle-income economies. Periods cited vary according to data availability: figures for low-income and middle-income economies are for 1978-91; figures for industrial economies are for 1979-88 (for SOE share of GOP) and 1978-88 (for SOE share of investment). See the statistical appendix for details.
4. This argument also applies to large private corporations where ownership is divorced from management, leading managers to try to maximize their utility at the expense of profit. For further elaboration, see Williamson (1975).
5. In the language of the principal-agent literature, the agent (SOE management in this case) has more information than the principal (government) and can choose how much effort to expend. The principal can only observe outcomes and cannot measure accurately the effort expended by the agent and sort it out from other factors affecting productivity. The challenge, then, is to design an efficient contract that motivates the agent to be productive, including a premium paid to the agent to compensate him or her for the added risk. The problem is that SOEs have multiple principals who may have neither the
BUREAUCRATS ARE STILL IN
authority, capacity, or motivation to monitor the SOE. At the same time, measuring performance is especially difficult because SOEs are typically expected to pursue a number of commercial and noncommercial objectives. (For a review of the theoretical arguments, see, for example, Ross 1991; Stiglitz 1974; Sappington 1991).
6. Jones and Mason (1982) go further, arguing that activities that require decentralized decisionmaking and rapid response to changes in markets and technology are especially ill-suited for state ownership. Such activities are typically small relative to the product and factor markets (restaurants or chocolate factories), produce differentiated products (women's clothing), and use rapidly changing technologies (computers) or labor-intensive techniques (textiles).
7. A number of studies from the earlier, comparative literature concludes that private enterprises perform better than SOEs (for example, Boardman and Vining 1989; Bennett and Johnson 1979; Boycko, Shleifer, and Vishny 1993). Others (for example, Caves and Christensen 1980; Aharoni 1986) argue that SOE inefficiency can be traced to the lack of competition or to the social and political demands imposed on them. Surveys of these studies reach different conclusions. For example, on the one hand, Milward (1982) finds "no evidence of a statistically satisfactory kind to suggest that SOEs in developing economies have a lower level of technical efficiency than private firms operating at the same scale of operation." On the other hand, an extensive review of studies comparing unit cost structures in public and private firms found that forty of the more than fifty studies surveyed attributed superior results to the private firms (Borcherding, Pommerehne, and Schneider 1982).
8. Bishop and Kay (1988) compare the performance of divested and undivested firms in the United Kingdom in different sectors over the same period of time. Although they find that divested as well as undivested firms improved their performance, they hypothesize that the reasons for this improvement could have been the business cycle or the threat of divestiture to the remaining SOEs. Vickers and Yarrow (1988) also analyze the United King-
51
TS IN BUSINESS
dam's divestiture experience, but their conclusion attributes improved performance to improved competition and regulation. Megginson, Nash, and Randenborgh (1994) analyze the effect of divestiture on performance, using a panel of forty-one divested firms from fifteen countries. They find that divestiture correlates significantly with higher profitability, better utilization of human and physical resources, company growth, and greater employment.
9. Submitted for publication, available in mimeo from the World Bank's Environment, Infrastructure, and Agriculture Department.
10. Thus, the identity of the SOE S-1 deficit can be stated as follows:
where (1-S)SOE
(1-S)SOE
(S-I)g
(S-1) pr
CA
(S-1) g + (s-I) pr + CA
SOE investment - SOE savings government savings - government investment private savings - private investment foreign borrowing (the counterpart of the current account deficit).
11. Savings are defined as the difference between SOE operating and nonoperating revenues (excluding all transfers, be it from the treasury or any other source) and all operating and nonoperating expenses (excluding all distribution of profit, such as dividends). Capital expenditures are total investments, including stock changes. The net budgetary transfers represent the flow of funds from the treasury to SOEs (e.g., subsidies, equity, loans) minus the flow of funds from SOEs to treasury (e.g., royalties, dividends, loan repayment). (This leaves out implicit transfers--for example, tax and import duty exemptions and cheap credit-which can be important in some cases.) Thus, a negative figure for transfers means the SOEs have transferred to the treasury more resources than they have received from it.
12. Although the averages for the SOE savings-investment deficit and for external and domestic credit cover more or less the same countries, the number of countries included in each variable varies. As shown in the statistical appendix, the averages for the SOE savings-investment deficit cover forty-five countries, those for external borrowing
52
cover seventy-four countries, and those for domestic credit cover thirty-seven countries. These variations in coverage were dictated by data availability.
13. We attempted to test the effect of state ownership on growth by adding a measure of the size of the SOE sector relative to GOP to Barra's (1991) growth variables. Although the results showed a significant negative correlation between the level of state ownership and growth, limited data meant that the results were not robust. In particular, there was insufficient time-series data on SOE sector size for enough countries over a sufficiently long time to conduct satisfactory growth regression analysis. Indeed, the data were not even sufficient to identifY the standard determinants of growth.
14. SOEs have been less important in China than in transition economies in Europe, mostly because agriculture is so much more important. Even so there is little to suggest that the dominant role of state ownership in the industrial and service sectors contributed to growth, and there is mounting evidence to the contrary. Although China averaged a seemingly respectable 5 percent annual GOP growth rate from 1955 to 1978, the average masks erratic swings; moreover, the growth that was achieved was due almost entirely to massive investment programs that at times, such as the 1958 Great Leap Forward, led to widespread deprivation. Significantly, the estimated growth in industrial total factor productivity during this period was close to zero (Gelb and Singh 1994). After 1978, China's growth rate spurted, due largely to agricultural reforms that restored family based farming and improved production incentives, particularly for smaller firms owned by townships and villages (see chapter 2). This growth appears to have occurred despite, rather than because of, the continued dominance of large-scale SOEs. For example, SOEs absorbed 61.5 percent of investment in industry and employed 43 percent of the industrial labor force but produced only 43 percent of industrial output in 1993. In the same year, the state-owned sector generated losses equivalent to 2.4 percent of GOP (Broadman 1995).
15. Gala! and others (1994) estimated the average annual gains in welfare from divestiture to be in the vicinity of 8 percent of predivestiture annual sales. Given that SOEs typically generate 10 percent of GOP and given that
sales are typically 2.5 times value added, the divestiture of half the sector would translate into a gain equivalent of about 1 percent of GDP, other things being equal. The estimated welfare gains themselves were derived as the difference between the net present value of the divested firm (to the producers and consumers) and the net present value of the firm (also to the producers and consumers) under the counterfactual scenario of continued state ownership. The annual component of the net gains to society was related to the sales of the respective enterprise to allow comparisons across firms.
16. Data periods vaty by countty within the overall period 1978-1991.
BUREAUCRATS ARE STILL IN B
17. Several studies have shown that large fiscal deficits negatively correlate with growth (see, for example, Fischer 1993; Easterly, Rodriguez, and Schmidt-Hebbel1995). It has also been shown that large fiscal deficits are a leading cause of high inflation, which in turn undermines economic growth (see, for example, Wijnbergen 1991; Bruno and others 1991; Edwards and Tabellini 1991). A negative relationship between inflation and growth has also been documented by de Gregorio (1993), Gylfason (1991), and Fischer (1993). More recently, Bruno and Easterly (1994) report a significant negative association between high inflation episodes and growth, more specifically where inflation exceeds 40 percent. Accordingly, to the extent that SOE savings-investment deficits are strongly correlated with fiscal imbalance, we can conclude that SOEs adversely affect economic growth.
53

ct4.fT>:rER 2
Success and Failure in SOE Reform
OST DEVELOPING COUNTRIES FACE THE
state-owned enterprise problems described in
chapter 1, and many have announced their in
tention to reform. A smaller but still significant
number have actually attempted reform pro
grams. A detailed assessment of all of these efforts
would be a gargantuan task, but the available information, analyzed at
length in this book, suggests that only a few of these countries have been
truly successful, a somewhat larger number have achieved mixed results,
and a still larger number, perhaps the majority, have made very limited
progress or none at all. What differences in policy distinguish the few suc
cessful countries from the many that have failed?
This chapter addresses this question by examining the experience of
twelve countries-nine developing-market countries and three former
socialist economies in transition. First, we assess the performance of
state-owned enterprises in these countries; then, having established
measures for success and failure, we analyze how the approach followed
by the successful countries differed from that of the unsuccessful coun
tries. In particular, we consider the extent to which each country used
five components of reform that economic theorists and reform practi
tioners widely endorse: divestiture, competition, hard budgets, finan
cial sector reform, and changes in the relationship between SOEs and
government. As we shall see, these five components are so closely inter
linked that the success of one often depends on doing another success
fully. Moreover, although it is difficult to attach specific weights to the
relative importance of these components, divestiture appears to be crit
ical to success, especially where the initial size of the SOE sector is much
larger than the world average of about 10 percent of GOP.
55
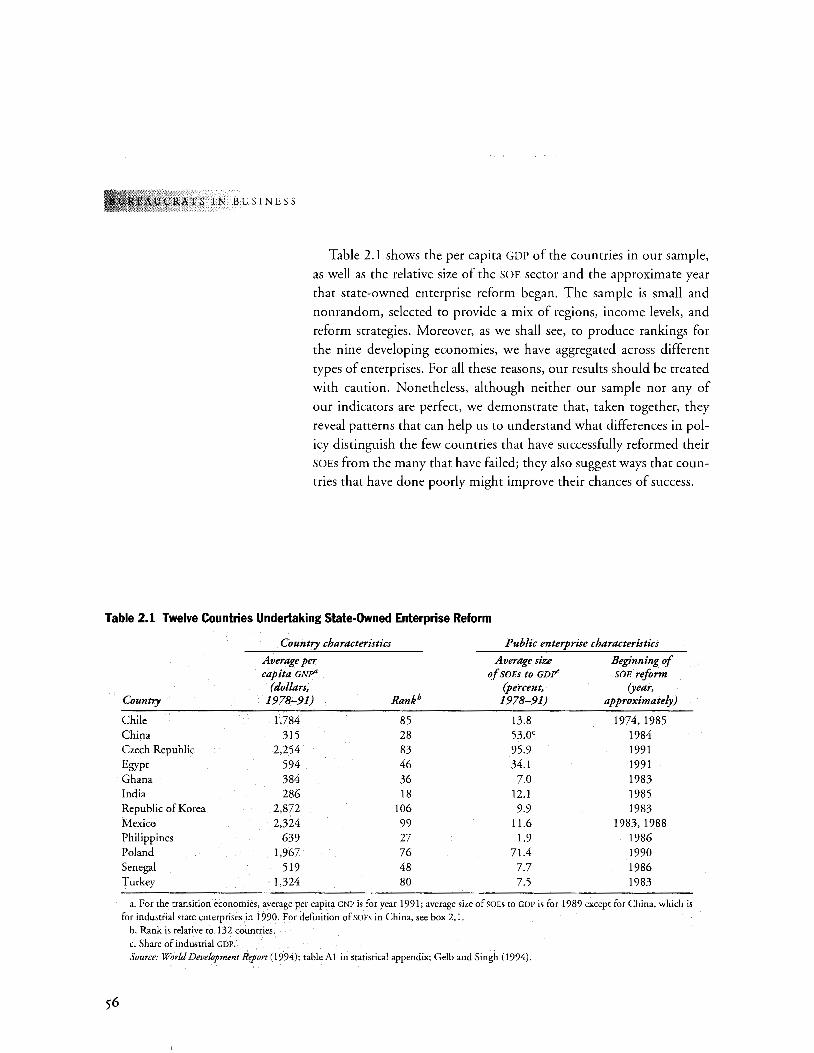
SIN BUSINESS
Table 2.1 shows the per capita GDP of the countries in our sample,
as well as the relative size of the SOE sector and the approximate year
that state-owned enterprise reform began. The sample is small and
nonrandom, selected to provide a mix of regions, income levels, and
reform strategies. Moreover, as we shall see, to produce rankings for
the nine developing economies, we have aggregated across different
types of enterprises. For all these reasons, our results should be treated
with caution. Nonetheless, although neither our sample nor any of
our indicators are perfect, we demonstrate that, taken together, they
reveal patterns that can help us to understand what differences in pol
icy distinguish the few countries that have successfully reformed their
SOEs from the many that have failed; they also suggest ways that coun
tries that have done poorly might improve their chances of success.
Table 2.1 Twelve Countries Undertaking State-Owned Enterprise Reform
Country characteristics Public enterprise characteristics
Average per Average size Beginning of capita GNpll of SOEs to GDr SOE reform
(dollars, (percent, (year, Country 1978-91) Rankb 1978-91) approximately)
Chile 1,784 85 13.8 1974, 1985 China 315 28 53.0c 1984 Czech Republic 2,254 83 95.9 1991 Egypt 594 46 34.1 1991 Ghana 384 36 7.0 1983 India 286 18 12.1 1985 Republic of Korea 2,872 106 9.9 1983 Mexico 2,324 99 11.6 1983, 1988 Philippines 639 27 1.9 1986 Poland 1,967 76 71.4 1990 Senegal 519 48 7.7 1986 Turkey 1,324 80 7.5 1983
a. For the transition economies, average per capita GNP is for year 1991; average size ofSOEs to GDP is for 1989 except for China, which is for industrial state enterprises in 1990. For definition of SOEs in China, see box 2.1.
b. Rank is relative to 132 countries. c. Share of industrial GDP.
Source: World Development Report (1994); table AI in statistical appendix; Gelb and Singh (1994).
56
SUCCESS AND FAILURE IN SOE
Measuring Success and Failure
W E ASSESS SUCCESS OR FAILURE OF REFORM EFFORTS IN
our sample on the basis of three types of results: SOE fi
nancial performance, productivity, and the savings
investment deficit. 1
• Financial performance. We gauge financial performance in two
ways: operating surplus to sales in current prices, which measures
the returns to all investors, owners, and creditors; and before-tax
profits in current prices, which measure the government's return
on its investment as if it were a private owner.2
• Productivity. To neutralize the effect of prices, we also estimate two
productivity measures: real variable unit costs and total factor pro
ductivity (TFP). Productivity improves when the real cost per unit
goes down or TFP goes up (i.e., the quantity of outputs increases by
more than the inputs used to produce them).3
• Savings-investment deficit. As in chapter 1, we define this as the
extent to which SOEs rely on outside sources to finance their op
erations, expansion, and debt service. While an occasional deficit
for a single enterprise, or for an entire sector over a relatively short
period, is not necessarily evidence of poor performance, a large
savings-investment deficit for the entire SOE sector over many
years exacerbates fiscal deficits, and ultimately long-term growth,
as we discussed in chapter 1. Moreover, a persistent deficit may
also reflect poor investment decisions, price controls, or ineffi
cient operations. As we see later in the country and company
cases, we find that a large S-1 deficit is generally associated with
poorer performance on the other measures. For the purposes of
this exercise, the larger the savings-investment deficit, the lower
the rating.
The remainder of this section looks at the sample countries' perfor
mance for each of these indicators from 1978 to 1991 and compares
changes in performance over the period. Since reforms cover many years
(Chile, for example, underwent major reforms starting in 1975 and
again in 1985), we could not simply compare before and after. We se
lected 1985 as an arbitrary midpoint. Nine of our sample of twelve
countries did reform their SOEs within two years of our midpoint.
57
IN BUSINESS
58
Where the start of reform is more than two years from the midpoint (as
it was in the Czech Republic, Egypt, and Poland), we explain the effects
in the discussion. Because we only measure the performance of enter
prises that remain in the state sector, divestiture, the first of the five re
form components we discuss, could, in theory, affect performance neg
atively or positively. If a country sells or liquidates its worst state-owned
enterprises, the performance for the sector would be expected to im
prove; if, on the other hand, a country sells its best-performing enter
prises, keeping only the poor performers, then the SOE sector's perfor
mance would be expected to deteriorate. In practice, as we shall see,
countries that divested the most also tended to improve SOE performance
the most. We will consider possible reasons for this seeming anomaly in
our discussion of divestiture. First, however, we assess the SOE perfor
mance of the countries in our sample using the three measures we set forth: finance, productivity, and the savings-investment deficit.
Assessing Financial Performance
The state-owned enterprise sectors in Chile, Mexico, and the
Republic of Korea outperformed the rest of the sample in both net
operating surplus and profits before taxes (figures 2.1A and 2.1 B),
while India, Turkey, and Senegal did least well. The performance of
the SOE sector in Ghana, Egypt, and the Philippines falls in between
these two groups, although the Philippines falls into last place by the
profitability measure (figure 2.1B).
If we take 1985 as an arbitrary midpoint, net operating surplus im
proved in all countries except Mexico and Senegal. Profitability im
proved in all but Turkey, Senegal, and the Philipines. Although the three
top performers were doing better than the rest of the sample to begin
with, they still managed to improve further. The deterioration in Mex
ico's operating surplus is due to the effects of oil prices on its large oil
company, PEMEX. If PEMEX is excluded Mexico's SOEs went from a 19
percent deficit in 1978-85 to a 10 percent surplus in 1986-91.4
The financial performance of SOEs in our sample improved for a va
riety of reasons. In Mexico, low prices for SOE products and services
were increased; for example, the Mexican electricity firm, Comisi6n
Federal de Electricidad, received real increases of7.7 percent in 1990.
In Ghana, enterprises reduced overstaffing through layoffs; for exam
ple, the Ghana Cocoa Board shed about 30,000 workers between 1985
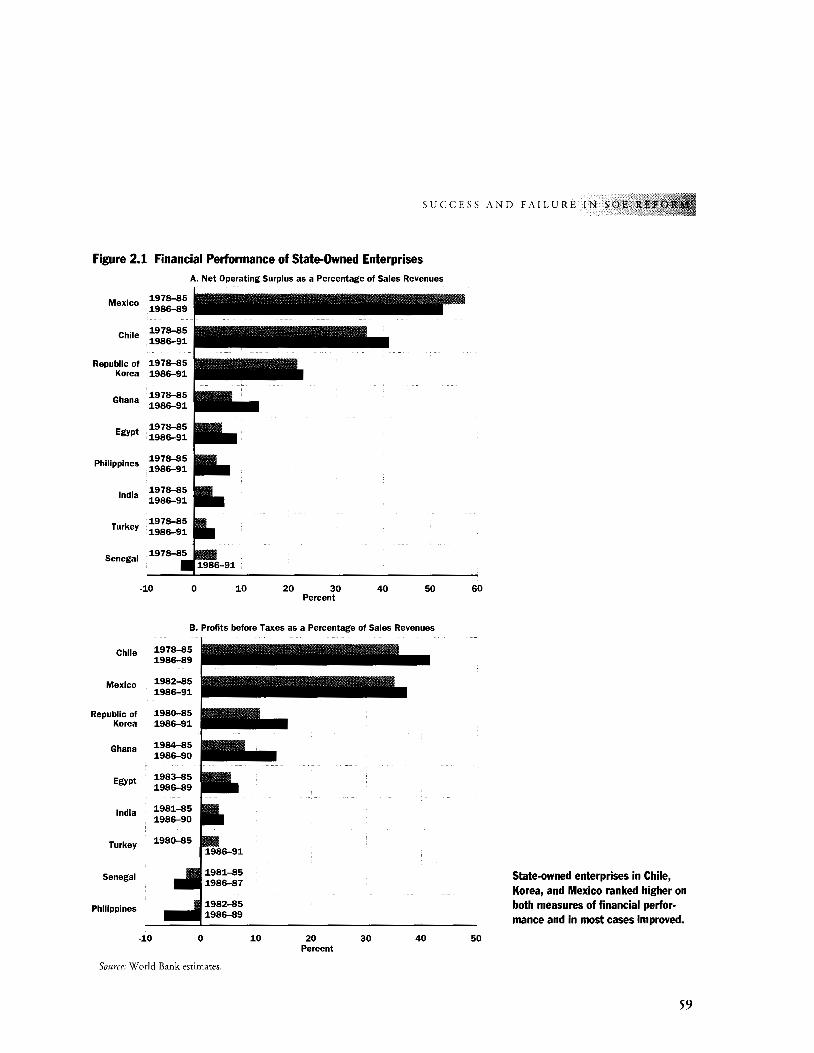
SUCCESS AND FAILURE IN SOE
Figure 2.1 Financial Performance of State-Owned Enterprises
Mexico
Chile
Republic of Korea
Ghana
Egypt
Philippines
India
Turkey
Senegal
Chile
Mexico
Republic of Korea
Ghana
Egypt
India
Turkey
Senegal
Philippines
-10
-10
A. Net Operating Surplus as a Percentage of Sales Revenues
0 10 20 30 40 50 Percent
B. Profits before Taxes as a Percentage of Sales Revenues
0 10 20 Percent
30 40
Source: World Bank estimates.
60
50
State-owned enterprises in Chile, Korea, and Mexico ranked higher on both measures of financial performance and in most cases improved.
59
RATS IN BUSINESS
6o
and 1987. Although reform in Egypt only began in 1991, performance
improved in the 1980s thanks to increases in the prices of some SOE
products and declines in real SOE wages. Finally, several countries, most
notably Chile, Korea, and Mexico, improved productivity (see produc
tivity discussion below).
Are these financial measures an appropriate indicator of SOE perfor
mance? Advocates of state ownership sometimes argue that some SOEs
show poor financial performance because they were created to achieve
noncommercial goals such as poverty reduction, job creation, or re
gional development. This being the case, a comprehensive calculation
of their returns should include any net benefits from pursuit of these
objectives. This argument has not been analyzed sufficiently to draw
robust conclusions, but its importance may be overstated for several
reasons. First, some noncommercial objectives are achieved when the investment is made (for example, locating an enterprise in a remote
area to promote regional development) so that subsequent trends in fi
nancial performance would be largely unaffected (even though the level of performance may be lower than in some other locale). Second, it is
doubtful that these noncommercial objectives are often achieved.
Holding selling prices below marginal cost or market-dearing values to
help the poor, a common rationale for SOE price controls, may help
poor people very little, if at all. For example, one study has shown that
low electricity prices intended to help the poor actually benefit the af
fluent more, since they own larger homes and appliances and therefore
use more electricity; moreover, electricity is often unavailable in rural
areas, where the poorest people live Qones 1985). Third, SOEs whose
social contribution is questionable may divert funds from programs
with broader benefits that also more directly assist the poor. For exam
ple, Pedro Aspe, Mexico's former minister of finance, has asserted that
part of the funding provided by the government to keep SIDERMEX (a
state steel conglomerate) afloat would have been sufficient to bring
drinkable water, sewerage, hospitals, and education to all the poor
communities in southeastern Mexico (Aspe 1991). Finally, even if we
assume that SOEs do achieve their noncommercial objectives, we would
still need to assess whether the cost of using SOEs to achieve these goals
is less or more than the cost of using alternative instruments, for exam
ple, taxes or direct subsidies. For these reasons, we regard the financial
measures to be useful indicators of SOE performance, even though they
do not include a calculation of net social benefits.
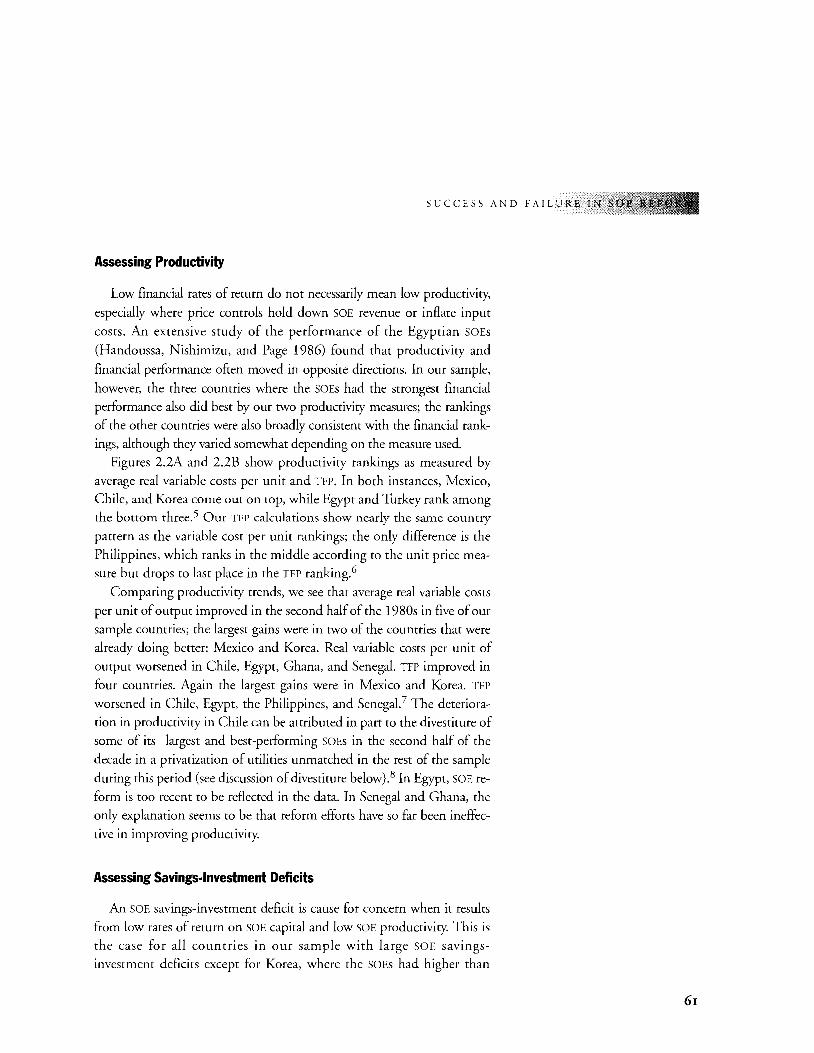
SUCCESS AND FAILURE INS
Assessing Productivity
Low financial rates of return do not necessarily mean low productivity,
especially where price controls hold down SOE revenue or inflate input
costs. An extensive study of the performance of the Egyptian SOEs
(Handoussa, Nishimizu, and Page 1986) found that productivity and
financial performance often moved in opposite directions. In our sample,
however, the three countries where the SOEs had the strongest financial
performance also did best by our two productivity measures; the rankings
of the other countries were also broadly consistent with the financial rank
ings, although they varied somewhat depending on the measure used.
Figures 2.2A and 2.2B show productivity rankings as measured by
average real variable costs per unit and TFP. In both instances, Mexico,
Chile, and Korea come out on top, while Egypt and Turkey rank among the bottom three. 5 Our TFP calculations show nearly the same country
pattern as the variable cost per unit rankings; the only difference is the
Philippines, which ranks in the middle according to the unit price mea
sure but drops to last place in the TFP ranking. 6
Comparing productivity trends, we see that average real variable costs
per unit of output improved in the second half of the 1980s in five of our
sample countries; the largest gains were in two of the countries that were
already doing better: Mexico and Korea. Real variable costs per unit of
output worsened in Chile, Egypt, Ghana, and Senegal. TFP improved in
four countries. Again the largest gains were in Mexico and Korea. TFP
worsened in Chile, Egypt, the Philippines, and Senegal? The deteriora
tion in productivity in Chile can be attributed in part to the divestiture of
some of its largest and best-performing SOEs in the second half of the
decade in a privatization of utilities unmatched in the rest of the sample
during this period (see discussion of divestiture below).8 In Egypt, SOE re
form is too recent to be reflected in the data. In Senegal and Ghana, the
only explanation seems to be that reform efforts have so far been ineffec
tive in improving productivity.
Assessing Savings-Investment Deficits
An SOE savings-investment deficit is cause for concern when it results
from low rates of return on SOE capital and low SOE productivity. This is
the case for all countries in our sample with large SOE savings
investment deficits except for Korea, where the SOEs had higher than
61
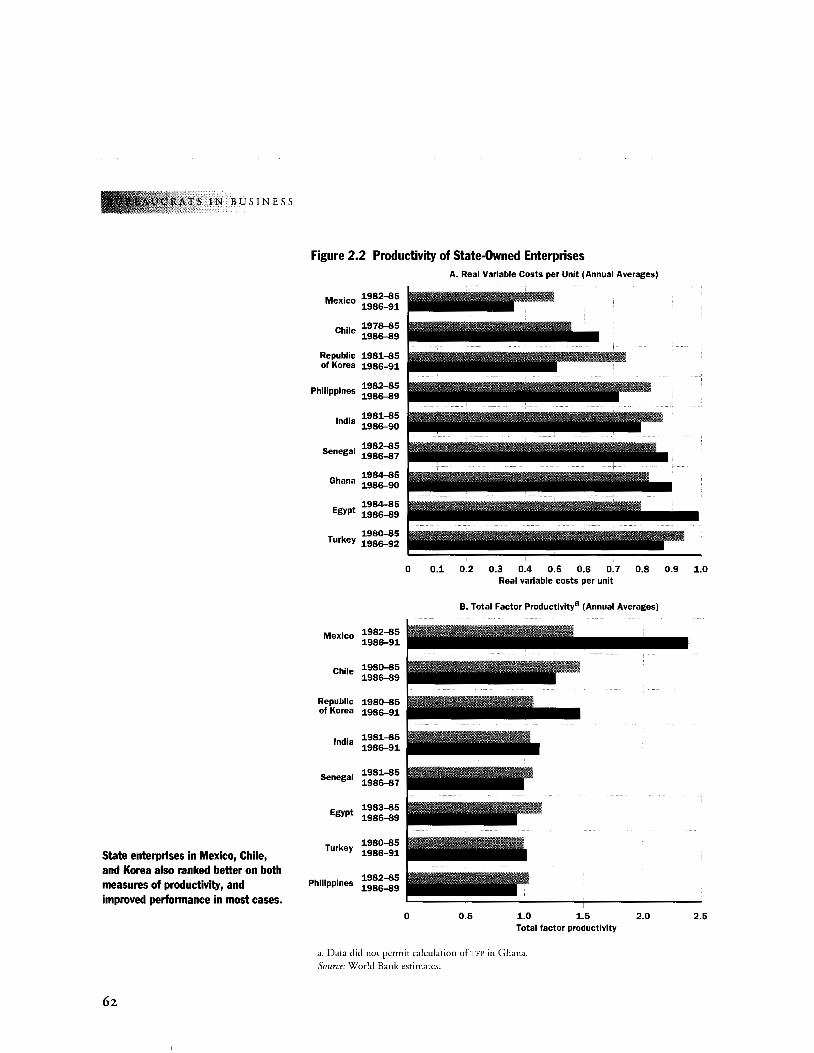
TS IN BUSINESS
State enterprises in Mexico, Chile, and Korea also ranked better on both measures of productivity, and improved performance in most cases.
62
Figure 2.2 Productivity of State-Owned Enterprises
Mexico 1982-85 1986-91
Chile 1978-85 1986-89
Republic 1981-85 of Korea 1986-91
1982-85 Philippines 1986-89
1981-85 India 1986-90
1982-85 Senegal 1986-87
1984-85 Ghana 1986-90
1984-85 Egypt 1986-89
1980-85 Turkey 1986-92
A. Real Variable Costs per Unit (Annual Averages)
0 M U U M U U U ~ U U Real variable costs per unit
B. Total Factor Productivitya (Annual Averages)
. 1982-85 Mexrco 1986-91
. 1980-85 Chile 1986-89
Republic 1980-85 of Korea 1986-91
. 1981-85 lndra 1986-91
1981-85 Senegal 1986-87
1983-85 Egypt 1986-89
1980-85 Turkey 1986-91
1982-85 Philippines 1986-89
0 0.5 1.0 1.5 Total factor productivity
a. Data did not permit calculation of TFP in Ghana. Source: World Bank estimates.
2.0 2.5
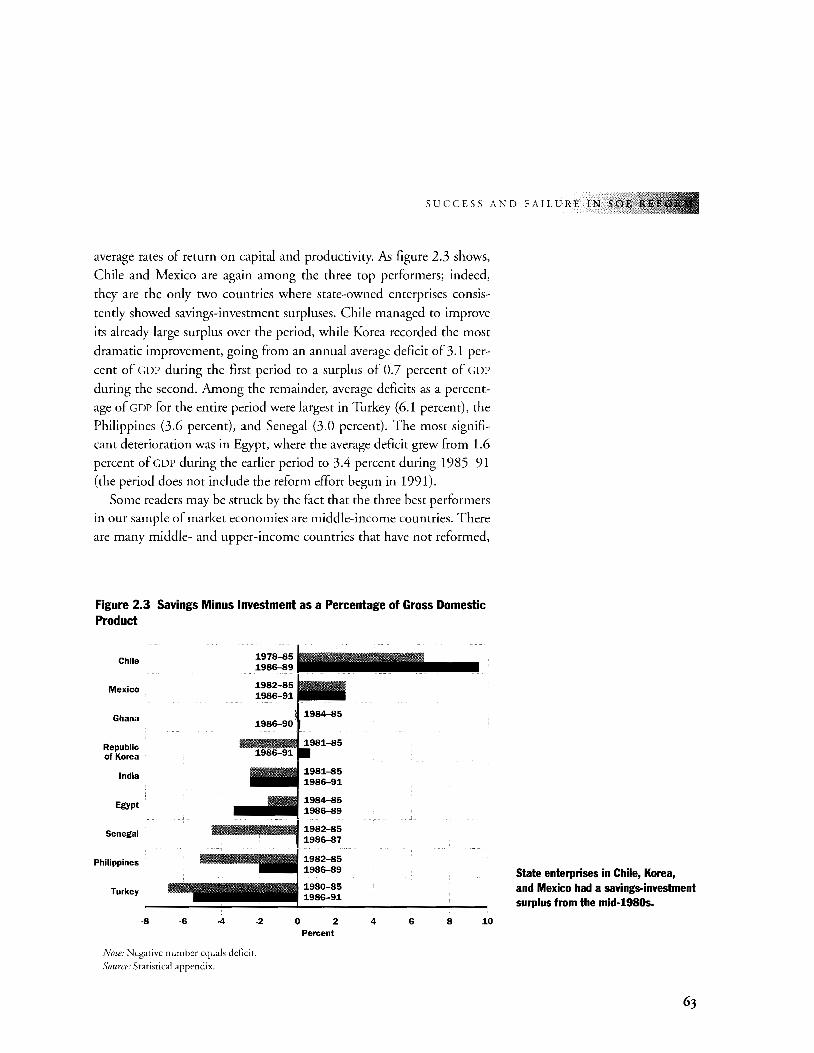
SUCCESS AND FAILURE IN SOF:''
average rates of return on capital and productivity. As figure 2.3 shows,
Chile and Mexico are again among the three top performers; indeed,
they are the only two countries where state-owned enterprises consis
tently showed savings-investment surpluses. Chile managed to improve
its already large surplus over the period, while Korea recorded the most
dramatic improvement, going from an annual average deficit of 3.1 per
cent of GOP during the first period to a surplus of 0.7 percent of GOP
during the second. Among the remainder, average deficits as a percent
age of GOP for the entire period were largest in Turkey (6.1 percent), the
Philippines (3.6 percent), and Senegal (3.0 percent). The most signifi
cant deterioration was in Egypt, where the average deficit grew from 1.6
percent of GOP during the earlier period to 3.4 percent during 1985-91 (the period does not include the reform effort begun in 1991).
Some readers may be struck by the fact that the three best performers
in our sample of market economies are middle-income countries. There
are many middle- and upper-income countries that have not reformed,
Figure 2.3 Savings Minus Investment as a Percentage of Gross Domestic Product
Chile
Mexico
Ghana
Republic of Korea
India
Egypt
Senegal
Philippines
Turkey
·8 ·6 4 ·2
Note: Negative number equals deficit.
Source: Statistical appendix.
0
1984-85 1986-89
1982-85 1986-89
2 Percent
4 6 8 10
State enterprises in Chile, Korea, and Mexico had a savings-investment surplus from the mid-1980s.
63
IN BUSINESS
64
however, including Turkey, which is part of our sample, and a number
of OECD and more developed market countries, which are not. The evi
dence presented in chapter 1 suggests that worldwide, most countries
are not reforming, regardless of income level, but that the problem
caused by unreformed SOEs is more acute in lower-income economies.
In sum, although none of the indicators is perfect and the ranking of the
SOE sector's performance varies slightly depending on which of the indi
cators we consider, a consistent pattern emerges:
• State-owned enterprises performed better in Chile, Korea, and Mexico
and showed substantial improvement in already good performance.
SOEs performed worse in India, Senegal and Turkey, although there
was slight improvement on some measures.
• The performance ofSOEs in Ghana, the Philippines, and Egypt either
foils somewhere in between or, by certain measures, in the bottom
third of the sample, with improvements in some measures offiet by de
teriorations in others.
We shall rely on these rankings to help us determine the associated charac
teristics of success and failure in SOE reform.9 First, however, we consider
briefly reform outcomes in the three transition economies in our sample.
Transition Economies
Transforming SOEs in the transition economies is obviously a much
larger undertaking than in the developing-market economies. In the
transition economies, state-owned enterprises until recently dwarfed all
other forms of ownership, whereas in the developing-market econo
mies, SOEs rarely account for more than 15 percent of GDP and fre
quently less. Moreover, precisely because the transition economies are
involved in broad, systemic reforms, and because their SOE data are
often not comparable over time, we did not try to rank the three tran
sition economies in our sample against the nine developing-market
economies. Thus, our evaluation of their success or failure is based on
broad indicators, partial evidence, and the reform process itself. In this
section, as elsewhere in this book, we consider the two Central
European countries in our sample first, then China.
Evaluating reform in Poland and the Czech Republic is especially dif
ficult. Reforms are relatively recent (launched in Poland in 1990 and in
the Czech Republic in 1991), and it is hard to separate their impact
SUCCESS AND FAILURE IN'
from wrenching changes in trade (the collapse of the Eastern and Cen
tral European trading block) and systemic transformation (devaluation
and currency convertibility, severe tightening of credit and increases in
interest rates to real positive levels, the shift from state profit retention to
taxation, etc.). 10 Both countries suffered large declines in industrial out
put following these reforms and shocks: in Poland industrial output fell
by 24 percent in 1990 and 12 percent in 1991 but has since begun to re
cover; in the Czech Republic it fell by 3.5 percent in 1990, almost 25 precent in 1991, and 15 percent in 1992.
Microeconomic evidence indicates that reform is leading to industrial
transformation, which would eventually lead to better performance. 11
SOEs have been shedding workers (SOE industrial employment fell by 20 percent in four years in Poland and by slightly less in the Czech Repub
lic), with the largest firms (those with more than 5,000 workers) shrink
ing the most (Gelb and Singh 1994). Firms in both countries have re
sponded to increased competition with internal restructuring designed to
improve marketing, control costs, and improve management of fi
nances.12 Thus, while we cannot rank these countries systematically,
early impressions are that, despite the very rough start, reform is resulting
in significant improvements in state-owned enterprises.
China's approach to economywide reform has been slower and less
wrenching than the upheavals in Eastern Europe. Reform began in the
countryside in 1978 with a reversion to household farming and the
"open door" policy. This was extended in 1984 to the industrial sector
and included the liberalization of prices and markets and an easing of re
strictions on private businesses and the nonstate, collective enterprises
known as Township and Village Enterprises (TVEs). These reforms al
lowed market forces to emerge in many sectors of the economy; as a re
sult, economic growth has been very rapid. Against this backdrop and
bolstered by generous credit from China's state-owned banking system,
real industrial production of state enterprises, which are roughly analo
gous to state-owned enterprises in other countries (see box 2.1), ex
panded by an impressive 7.8 percent a year on average during 1980-91; however, this was lower than the industrial growth of any other form of
ownership in China.13
What of our three measures of SOE performance: financial perfor
mance, productivity, and the savings-investment deficit? Available data
permit only very rough estimations. State enterprise losses, although de
creasing, were still almost 2.5 percent of GDP in 1993 (Broadman
65
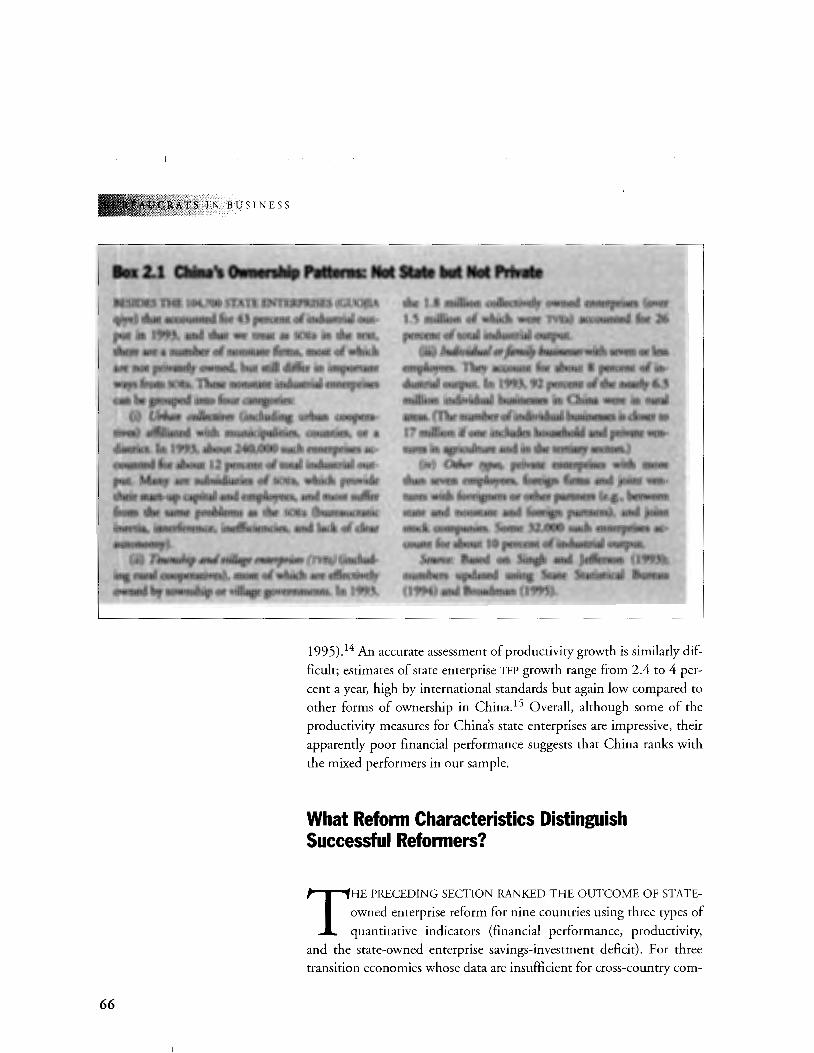
66
SIN BUSINESS
·.··· \'~··· f.A&.r...;.t,·< ..... ~ ... ..jld ~ ............ U.d. C&.d;i.; .... ;.. M..d.·&.:.. • ...&;i,; ·. ~· \f,IIJ.,_ $,; ""'''•••P ·FiiJ~WIIRtir ftVl liOJMII.V ~li nvt.:~~l~GJF •.··
· · · ~.~~t12~~f~f~t,lt'2~r~tatin,~u~rial o~~-
(1Q94}·1Uld,»r6;~~u (1995J;.:: ..
1995).14 An accurate assessment of productivity growth is similarly dif
ficult; estimates of state enterprise TFP growth range from 2.4 to 4 per
cent a year, high by international standards but again low compared to
other forms of ownership in China. 15 Overall, although some of the
productivity measures for China's state enterprises are impressive, their
apparently poor financial performance suggests that China ranks with
the mixed performers in our sample.
What Refonn Characteristics Distinguish Successful Reformers?
THE PRECEDING SECTION RANKED THE OUTCOME OF STATE
owned enterprise reform for nine countries using three types of
quantitative indicators (financial performance, productivity,
and the state-owned enterprise savings-investment deficit). For three
transition economies whose data are insufficient for cross-country com-
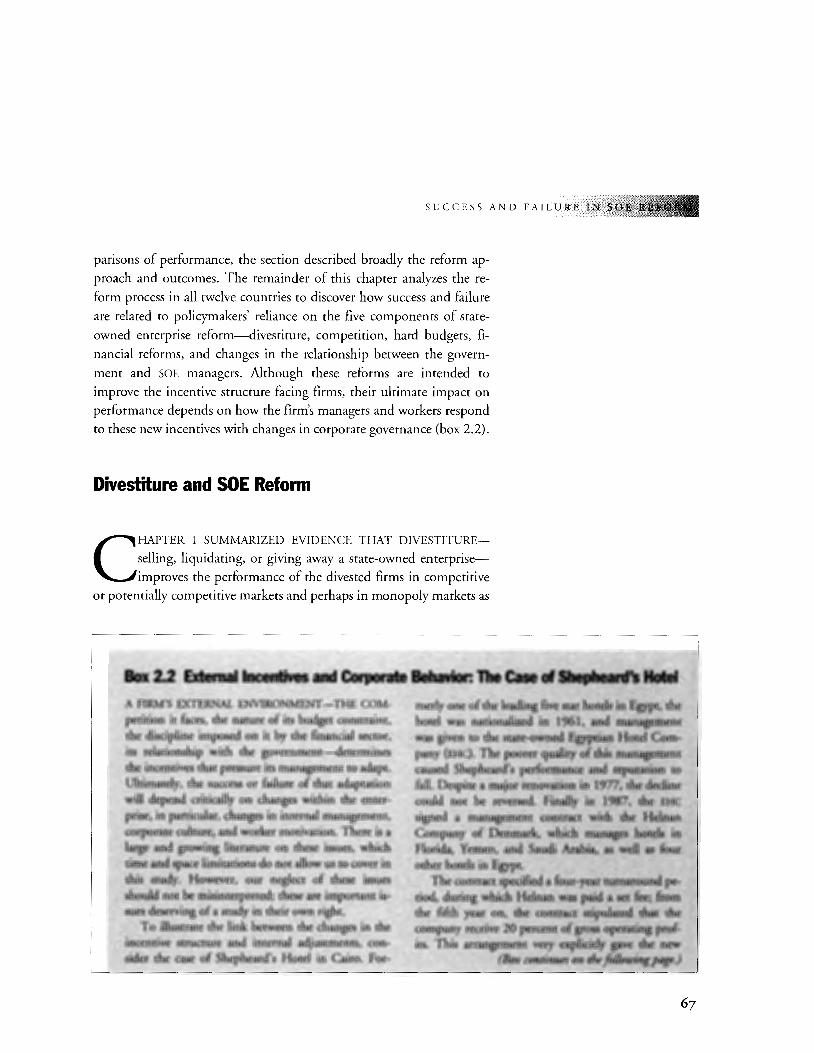
SUCCESS AND FAILURE IN
parisons of performance, the section described broadly the reform ap
proach and outcomes. The remainder of this chapter analyzes the re
form process in all twelve countries to discover how success and failure
are related to policymakers' reliance on the five components of state
owned enterprise reform-divestiture, competition, hard budgets, fi
nancial reforms, and changes in the relationship between the govern
ment and SOE managers. Although these reforms are intended to
improve the incentive structure facing firms, their ultimate impact on
performance depends on how the firm's managers and workers respond
to these new incentives with changes in corporate governance (box 2.2).
Divestiture and SOE Reform
CHAPTER 1 SUMMARIZED EVIDENCE THAT DIVESTITURE
selling, liquidating, or giving away a state-owned enterprise
improves the performance of the divested firms in competitive
or potentially competitive markets and perhaps in monopoly markets as
Box 2.2 External Incentives and Corporate Behavior: The Case'-'~.., • .._ . '_, .,;/· -: ,,
A FIRM'S EXTERNAL ENVIRONMENT-THE COMpetition it faces, the nature of its budget constraint, the discipline imposed on it by the flnancial sector, irs relationship with the government-determines the incentives that pressure its management to adapt. Ultimately, the success or faUure of that adaptation wUt depend critically .on changes within the enterprise, in particular, changes in internal management, corporate culture, and worker motivation. There is a large and growing literature on these issues, which time and space limitations do not allow us to cover in this study. However, our neglect of these issues should not be misinterpreted; these are important i$sues deserving of a study in their own right.
merly one of the leading five star hotqls in Egypt! the hotel was nationaliied in 1961, !lnd fil~Ulageinetu .· was given to the state~owned. Egyptial,ll:l()telCompany (EHC). The poorer quality qf this fi1aQageitient caused Shepheard's perl'ormance and repntati~n to fall. Despite a rnajot rettovation in 1977, ili,e d.e.::line · could not .be reversed. Finally in 1?87, ~ E}IC ·
signed a management contract with ·tile. Help.an Company of De~l4 w~c~ ~.~ibt>~l$; i~, ; Florida, Yemen, and Saudi Afabijh ~ wcll~four:c.·.·
other hotels in Egypt. •··· .. • . .·· ·· · .. ·· ..•. ··••··• . · i . .• . ; )
To illustrate the link between the changes in the incentive structure and internal adjustments, consider the case of Shepheard's Hotel in Cairo. For-
The contract specifl¢<l a four~year tll;tl}a~ug:dpe~ riod; during which Hematl.~as .~9. •. a &et'f~~ ...• ~m · the fifth y~ on, the cortttact stiylllate$ ~fthe company receive 20~rcent qf~o~ op~rati~gpt;of.its. This arrangement very ~licitly t;av~ ~e. ~
(Box corriin'Uiior: .. tlie:foll.oW.ingpage.)
67
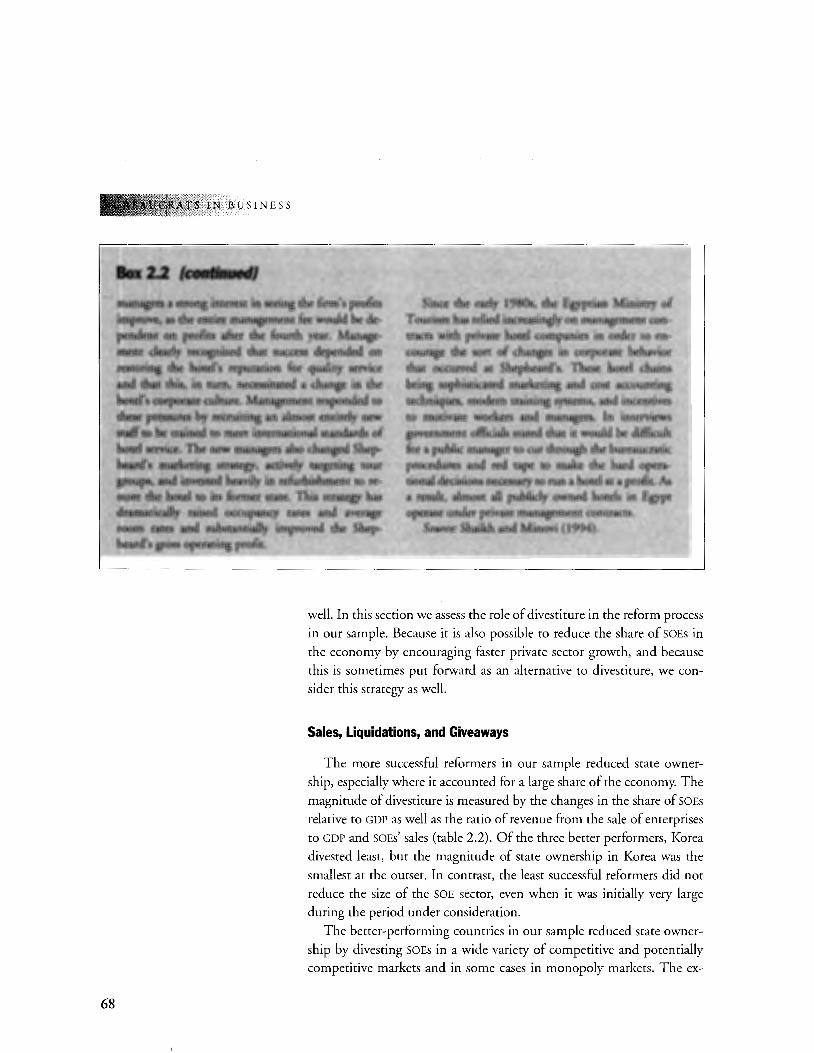
'TS IN BUSINESS
68
well. In this section we assess the role of divestiture in the reform process
in our sample. Because it is also possible to reduce the share of SOEs in
the economy by encouraging faster private sector growth, and because
this is sometimes put forward as an alternative to divestiture, we con
sider this strategy as well.
Sales, Liquidations, and Giveaways
The more successful reformers in our sample reduced state owner
ship, especially where it accounted for a large share of the economy. The
magnitude of divestiture is measured by the changes in the share of SOEs
relative to GDP as well as the ratio of revenue from the sale of enterprises
to GDP and SOEs' sales (table 2.2). Of the three better performers, Korea
divested least, but the magnitude of state ownership in Korea was the
smallest at the outset. In contrast, the least successful reformers did not
reduce the size of the SOE sector, even when it was initially very large
during the period under consideration.
The better-performing countries in our sample reduced state owner
ship by divesting SOEs in a wide variety of competitive and potentially
competitive markets and in some cases in monopoly markets. The ex-
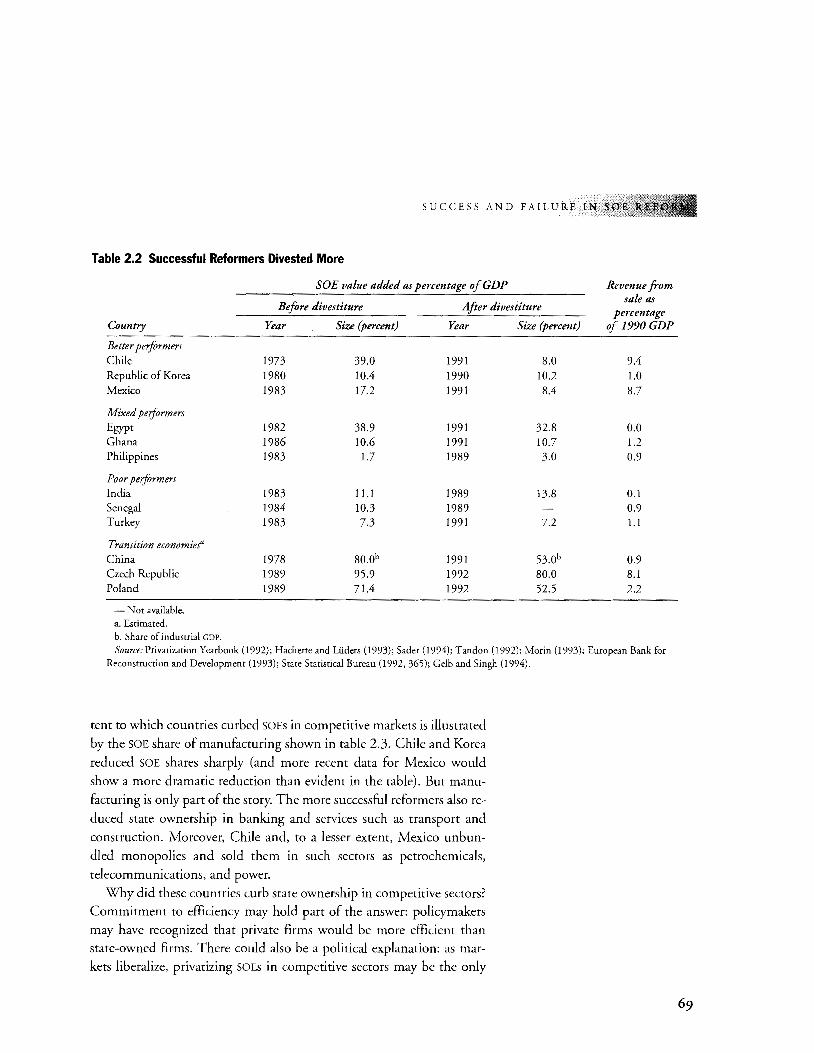
SUCCESS AND FAILURE IN SO
Table 2.2 Successful Reformers Divested More
SOE value added as percentage ofGDP Revenue from
Before divestiture After divestiture sale as
percentage Country Year Size (percent) Year Size (percent) of 1990GDP
Better performers Chile 1973 39.0 1991 8.0 9.4 Republic of Korea 1980 10.4 1990 10.2 1.0 Mexico 1983 17.2 1991 8.4 8.7
Mixed performers Egypt 1982 38.9 1991 32.8 0.0 Ghana 1986 10.6 1991 10.7 1.2 Philippines 1983 1.7 1989 3.0 0.9
Poor performers India 1983 11.1 1989 13.8 0.1 Senegal 1984 10.3 1989 - 0.9 Turkey 1983 7.3 1991 7.2 1.1
Transition economief' China 1978 8o.ob 1991 53.0b 0.9 Czech Republic 1989 95.9 1992 80.0 8.1 Poland 1989 71.4 1992 52.5 2.2
-Not available. a. Estimated. b. Share of industrial GDP.
Source: Privatization Yearbook (1992); Hachette and Lliders (1993); Sader (1994); Tandon (1992); Morin (1993); European Bank for Reconstruction and Development (1993); State Statistical Bureau (1992, 365); Gelb and Singh (1994).
tent to which countries curbed SOEs in competitive markets is illustrated
by the SOE share of manufacturing shown in table 2.3. Chile and Korea
reduced SOE shares sharply (and more recent data for Mexico would
show a more dramatic reduction than evident in the table). But manu
facturing is only part of the story. The more successful reformers also re
duced state ownership in banking and services such as transport and
construction. Moreover, Chile and, to a lesser extent, Mexico unbun
dled monopolies and sold them in such sectors as petrochemicals,
telecommunications, and power.
Why did these countries curb state ownership in competitive sectors?
Commitment to efficiency may hold part of the answer: policymakers
may have recognized that private firms would be more efficient than
state-owned firms. There could also be a political explanation: as mar
kets liberalize, privatizing SOEs in competitive sectors may be the only
69
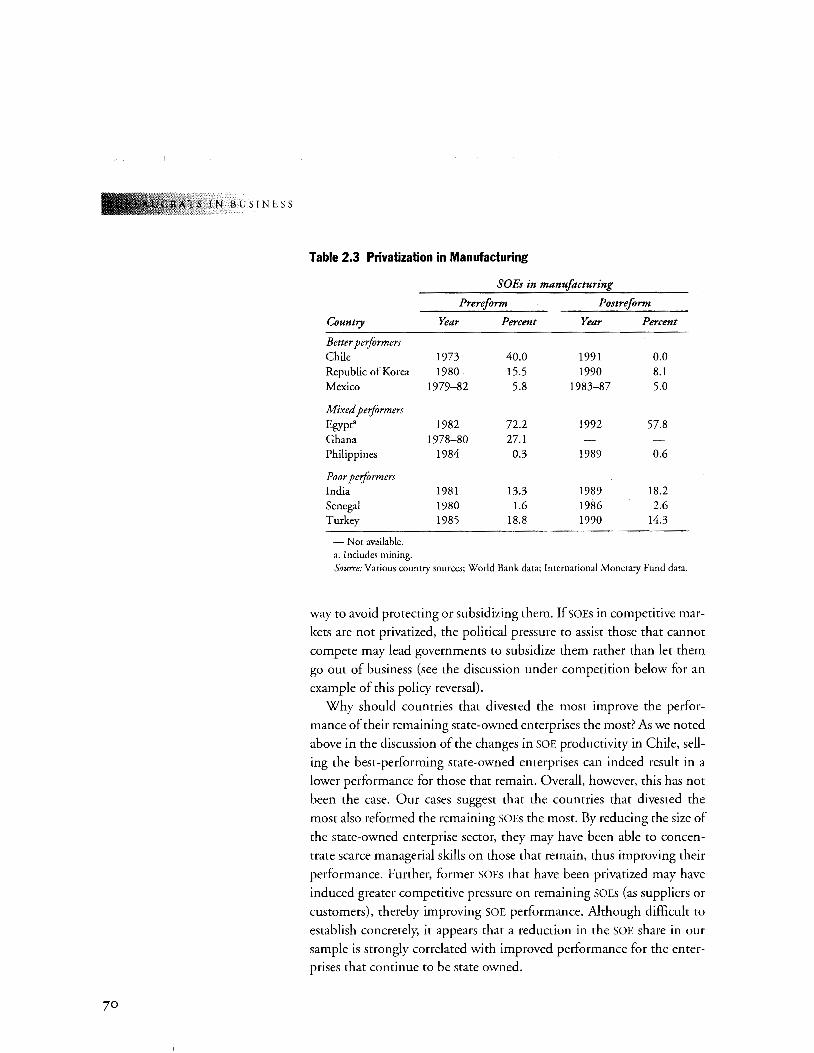
IN BUSINESS
70
Table 2.3 Privatization in Manufacturing
SOBs in manufacturing
Prereform Postreform
Country Year Percent Year Percent
Better performers Chile 1973 40.0 1991 0.0 Republic of Korea 1980 15.5 1990 8.1 Mexico 1979-82 5.8 1983-87 5.0
Mixed performers Egypt" 1982 72.2 1992 57.8 Ghana 1978-80 27.1 Philippines 1984 0.3 1989 0.6
Poor performers India 1981 13.3 1989 18.2 Senegal 1980 1.6 1986 2.6 Turkey 1985 18.8 1990 14.3
-Not available. a. Includes mining. Source: Various country sources; World Bank data; International Monetary Fund data.
way to avoid protecting or subsidizing them. If SOEs in competitive mar
kets are not privatized, the political pressure to assist those that cannot
compete may lead governments to subsidize them rather than let them
go out of business (see the discussion under competition below for an
example of this policy reversal).
Why should countries that divested the most improve the perfor
mance of their remaining state-owned enterprises the most? As we noted
above in the discussion of the changes in SOE productivity in Chile, sell
ing the best-performing state-owned enterprises can indeed result in a
lower performance for those that remain. Overall, however, this has not
been the case. Our cases suggest that the countries that divested the
most also reformed the remaining SOEs the most. By reducing the size of
the state-owned enterprise sector, they may have been able to concen
trate scarce managerial skills on those that remain, thus improving their
performance. Further, former SOEs that have been privatized may have
induced greater competitive pressure on remaining SOEs (as suppliers or
customers), thereby improving SOE performance. Although difficult to
establish concretely, it appears that a reduction in the SOE share in our
sample is strongly correlated with improved performance for the enter
prises that continue to be state owned.
SUCCESS AND FAILURE INS
Two of the transitional economies in our sample, the Czech Repub
lic and Poland, have also divested, the Czech Republic extensively. In
just four years, the Czech Republic sold or gave away almost all of its
competitive SOEs in one of the most extensive privatization programs
ever undertaken. Among the divested enterprises were 120,000 retail
shops, restaurants, and service business and 13,000 small manufactur
ing enterprises auctioned in 1991-92; 80,000 to 100,000 businesses
were returned to former owners; and close to 5,000 medium to large
state-owned enterprises were privatized in 1993-94 partly by exchang
ing shares for vouchers distributed to all adult citizens for a small fee and
partly through trade sales and other transactions. Poland has also di
vested nearly all retail services but has made slower progress on large
firms. Of more than 8,000 medium to large enterprises owned by the
government in 1990, less than one-third were in the process of privat
ization or liquidation in 1993, and fewer than 100 had been turned into
corporations and sold; 852 smaller firms had been privatized through
liquidation; and 1,013 firms had been bankrupted and their assets
sold. 16 As for China, bankruptcies and privatization of SOEs have been
virtually nonexistent. 17 The increase in the proportion of the nonstate
sector in China's economy, shown in table 2.2, is almost entirely due to
its rapid growth rather than to a reduction in the size of the state sector,
which, as we have seen, has continued to grow.
Judging from our sample, divestiture is a useful tool for reducing the
size of the state-owned enterprise sector, especially when the sector is
large. Moreover, evidence at the company level from other sources sug
gests that efficiency and welfare gains from divestiture can be substantial.
(See, for example, box 1.2.) These gains are not automatic, however. Sur
veys of privatization experience have identified several elements of suc
cessful divestiture efforts. These are noted in box 2.3.
Outgrowing State-Owned Enterprises: An Alternative to Divestiture?
SEVERAL COUNTRIES HAVE MANAGED TO REDUCE THE RELATIVE
size of their state-owned enterprise sector by outgrowing it-that is,
achieving very rapid growth of the private sector-rather than
through divestiture. Korea, which relied less on divestiture than either
71
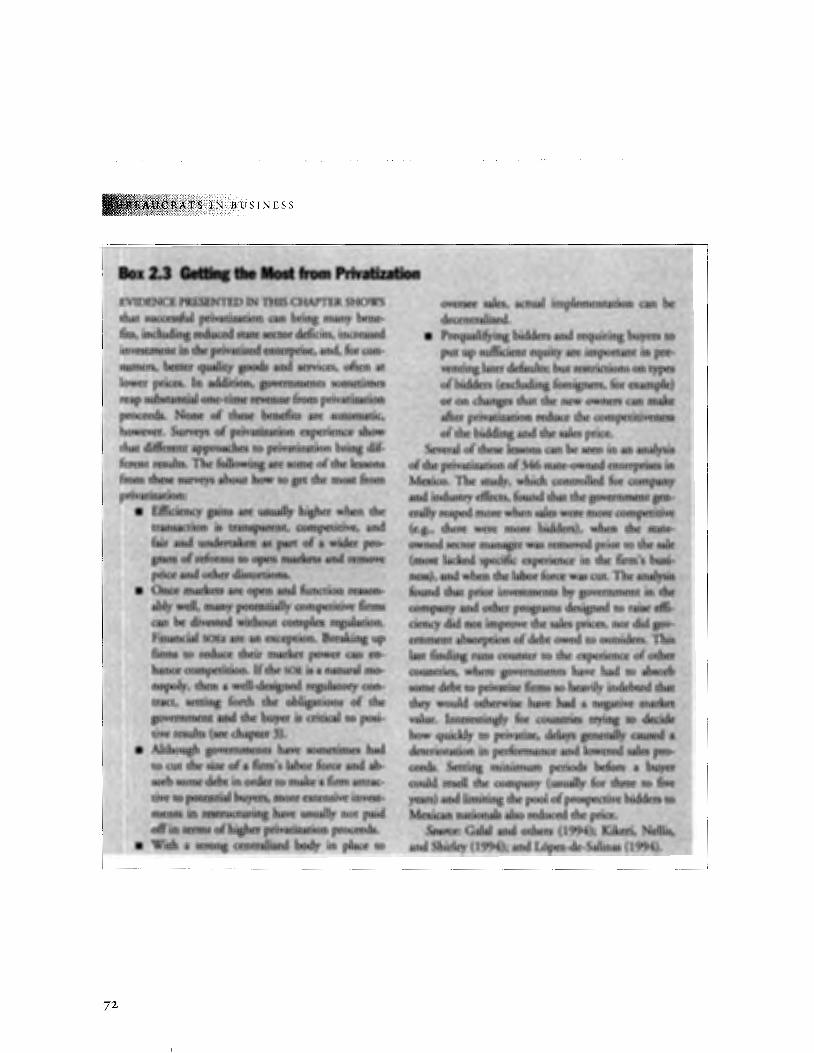
72
'TS IN BUSINESS
Box~·~eB·;~~~m PrMitization EVID~cE'P~.tN¥ftts¢~TER SHO\Vs·. ovet$ee.· sales, .. actu3l. itilplementa:rlon .· cl~Jl. ·I>~•······ th~tsl:':~$~ p~iv~t~~?W caa hJ;lllg many bette. cleC~e?t;rali~d. . . ·. ·. . . >< ... fits, in~<litl&~~~~~~qr~~Cits, incr~~d • .. Preq~if)iing biddet$and requir¥gbuyel'$.f.:t inves~~tUit;A~~pm'i~i¥:~n,~rptise. arid, fon:on~. put up suifident'equitr: at~ j~port<Ultinpte~ sumer~:~et .q#li:o/ ~~· and $¢J'Vices, often at venting later defaults;.hut r~trk,ti()ns,oit~. . lower ~?ti~~· til ~i~~~·~eJ:~e.nts so~es othkiders .(ex<;lu(iJng foreigner$, .for examp*e) .•.· .....
d~1~~~ . *:St:i~~;; that dif{e~;#~~p.P(~e~ ·t~;P!rlv~ti~tion br}.ug rut~. . Swu~ ofthesele$Sb~ can· be seen in an ~llly~i$ · • fer~t.t~~~~~~·t,~!}t>~~~$~e~O:~~ of~·le4sons oftlleprivarltation of_346$(ate .. owned~terpr~~in.••·· from tb;~s\ttV~~b~t·.~~t() $~the m9g ~ M~co· f1le stu9n which ~ontroUed ~tcti~l'~}"<
r~i·~~ ~~jiB~;:, < ·••· • .nf!SS),andwhen the labor fqr~ was (;Qt. 'I'he~~i*;.'J •.
• fo\10d. th~t prioi i~v~ptents lly govemment. in:r~~· .. · d!~y.Jind:9ilie~ p~~msdesigned .to .. ~~~·!'. ciency (ijd ~(lt'ill}prove the sates prices,. no,r 4i#.g9y;\ .. ernmeni ~bSOtp~ion of debt owed to outside~tll~is. .. ~t ttn~ng tUns. co~ef' tb ~he aperien~ of: ~~f>
··countries, w~re governtnehtli' have had i:o libso.t$ /: • some def)t to t'rivatize.fi~ ~o heavUy indebted; tit«r
·" . .. •..... .•.. • .... · .. ··· ·"··· .. · ... . .. ·.· they would ofh~ ha~ kd ~ ·11egarive·~!k~.[ ~retAtll~1lt~ tl1e l>~ef.ill critical ,t<J posi- · value, Interatingly fut co~~. ~~ J~·.~~.
·~1:"i·~~~ ~~tE~~--: iorbS()ntei{ebti~~~:~o tn~e~iflrtna~rac-: . wuld. J:eSeUt~e coJ;nplU\y (usually for thre~ ~five > 1iyeto~#lti~in#~Jt!tlre~nsi~einv~:'· ~) an<Hbniring the p~l.ofprospectiye f)idders tt1 ..
..•. ;~~~~~iJ~~~~~=~a· Me;;.;~~Mt<>::~:~~4~ri~et~.·N~l~s~~·~·~ .. a• <Woi~h a ~~$ng ~ntra1izea: .Qbdr iri place. to and Shirley (f994); and L6pez~de-5alinas (1994). ·· · ·· ·· ·
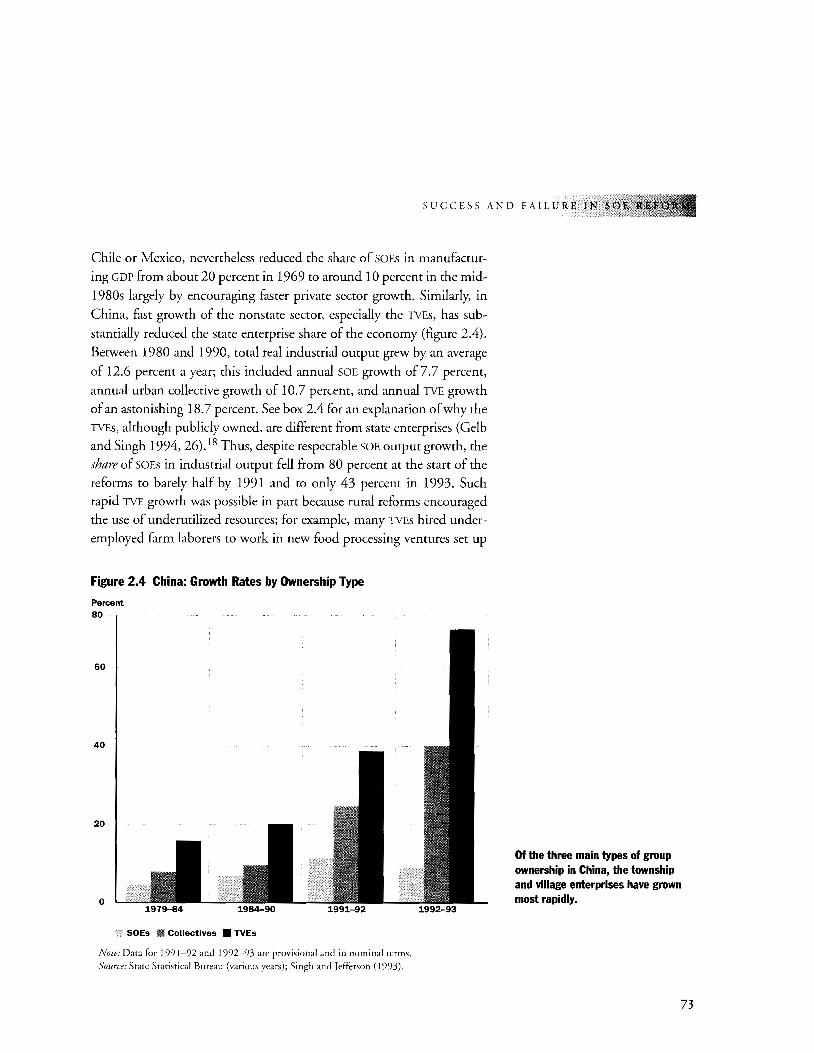
SUCCESS AND FAILURE !N S
Chile or Mexico, nevertheless reduced the share of SOEs in manufactur
ing GDP from about 20 percent in 1969 to around 10 percent in the mid-
1980s largely by encouraging faster private sector growth. Similarly, in
China, fast growth of the nonstate sector, especially the TVEs, has sub
stantially reduced the state enterprise share of the economy (figure 2.4).
Between 1980 and 1990, total real industrial output grew by an average
of 12.6 percent a year; this included annual SOE growth of 7. 7 percent,
annual urban collective growth of 10.7 percent, and annual TVE growth of an astonishing 18.7 percent. See box 2.4 for an explanation of why the TVEs, although publicly owned, are different from state enterprises (Gelb and Singh 1994, 26). 18 Thus, despite respectable SOE output growth, the share of SOEs in industrial output fell from 80 percent at the start of the
reforms to barely half by 1991 and to only 43 percent in 1993. Such rapid TVE growth was possible in part because rural reforms encouraged the use of underutilized resources; for example, many TVEs hired under
employed farm laborers to work in new food processing ventures set up
Figure 2.4 China: Growth Rates by Ownership Type
Percent 80
60
40
20
0
SOEs Ill Collectives • TVEs
Note: Data for 1991-92 and 1992-93 are provisional and in nominal terms. Source: State Statistical Bureau (various years); Singh and Jefferson (1993).
Of the three main types of group ownership in China, the township and village enterprises have grown most rapidly.
73
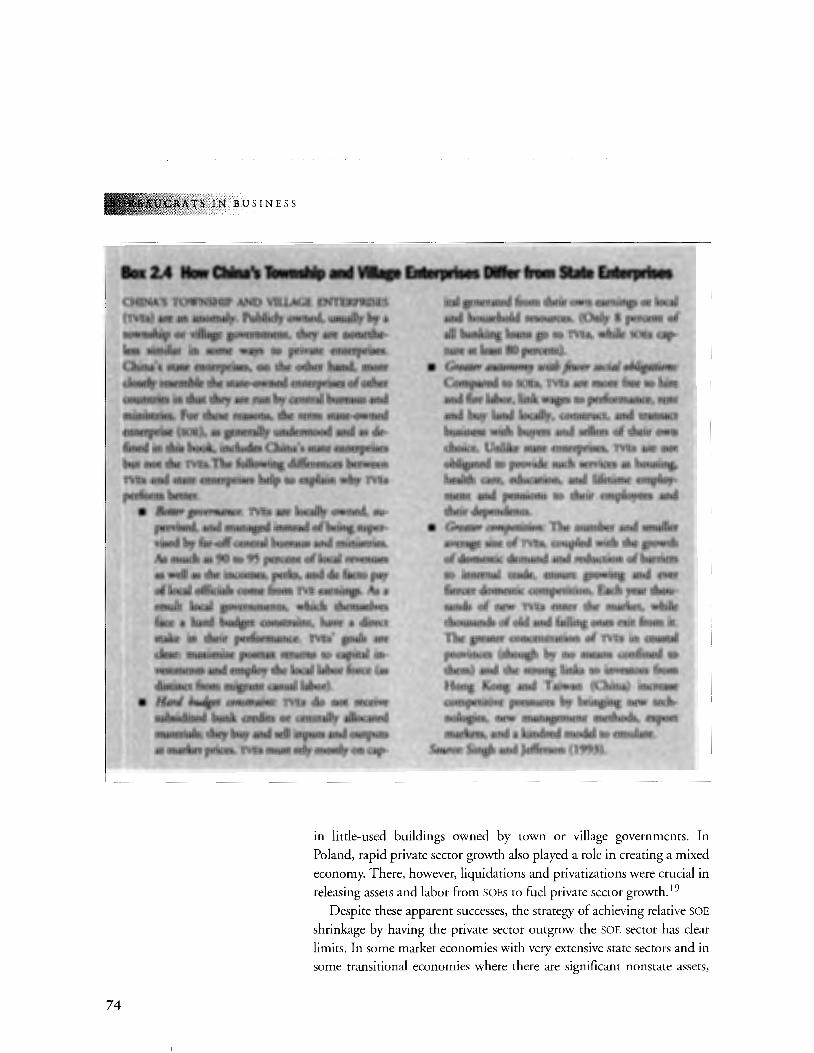
SIN BUSINESS
74
•·· · ~ncff\~~!~~rilif1kw~ iQ petfoiman¥, l'#ti
...• t~1~J~~!!~~·d:n~~;{~~; • ch0Ece.·lJ~Ike Stat~ entetpr(ses; T\fEs ~ t}Ot .
obligated t6 /pf()vide such servires ;tS holl5ipg, ·· heal~ are; ed,u.cation, and Jifet~lll;e el'llploy~ .· .. ntent ~~1 pensi()nS to their employees an~ their d~pe11<lents. . ·. . .. ·.. .. . . . . · ··
•. Grtf!ter r;ottipet:itio~: The nwnber and ~~er ·. ave*ase size <;~f TV!s' roupled with the gromh
·· otdonie8tkdemand and reduction ofbarrl~ts i6 inte,tnal trade, ensure gtowing at1d e\rer
. fiercer domestic .roil\petiriotl;. Each year tlwu" sands 6f n~ !'YES enter the . market, w:hile thousands .of old and failing ories ~t from it; The greater concentration .Of 'IVES. in coastal provinces (though by no means confined. t.O · them) and the strong links to investOrs fi:oJI~: Hong Kong and Taiwan (China) increase
· competitive pressures by bringing new. tech~· ·nologies, ·new management. methods, exp()rt·• mar~eu, and a kinclred model to emulate.
Source: Singh and]e~tson {199.3). . .
m little-used buildings owned by town or village governments. In
Poland, rapid private sector growth also played a role in creating a mixed
economy. There, however, liquidations and privatizations were crucial in
releasing assets and labor from SOEs to fuel private sector growth. 19
Despite these apparent successes, the strategy of achieving relative SOE
shrinkage by having the private sector outgrow the SOE sector has clear
limits. In some market economies with very extensive state sectors and in
some transitional economies where there are significant nonstate assets,
SUCCESS AND FAILURE INS
this strategy could reduce the state share. But in most developing
economies, businesses where new private entry is easy (trade, construc
tion, small manufacturing) have long been open to the private sector so
that, barring divestiture, the potential for sudden rapid growth is not
large. As for the transition economies, the private sector must grow very
rapidly indeed to begin to overshadow the huge SOE sector, but there are
limits to how fast and how much the private sector can grow when a much
larger state-owned sector absorbs substantial amounts of resources and
performs at lower efficiency. As one study points out, as long as subsidies
to SOEs are large enough to offset the productivity difference with the non
state sector, resources remain in the state sector rather than flow to the
nonstate sector (Sachs and Woo 1993, 16-17). This traps a large amount
of resources in the least productive sector of the economy. Moreover,
many new private businesses in the transition economies are too small to
compete with or take over large-scale activities of the SOEs. For example,
despite the impressive performance of China's TVEs, one study found that
these enterprises were only one-tenth the size of their SOE competitors
Qefferson 1993). Thus, even though China's nonstate enterprises have
been able to grow rapidly for over fifteen years without privatization or
liquidation of SOEs, the limits of this strategy may be approaching. Indeed,
state subsidies to money-losing SOEs have recently created inflationary
pressures that threaten to undermine nonstate as well as state expansion.
Divestiture Alone Is Seldom Enough
EVEN COUNTRIES THAT HAVE EXTENSIVELY SOLD, LIQUIDATED,
and shrunk the relative share of SOEs are often left with a sub
stantial proportion of the economy under state ownership, as
can be seen for our sample in table 2.2. As we discussed in chapter 1,
widespread attention to divestiture has yet to have a major effect on the
SOE share in many countries. Moreover, even if the SOE share in an
economy is brought down significantly, this is no guarantee that the
country's remaining SOEs will perform well, or that their burden on the
economy and government finances will be light. Indeed, several coun
tries in our sample with relatively small SOE sectors at times devoted a
disproportionate share of resources to state-owned enterprises. For ex
ample, in the Philippines during the first half of the 1980s, the SOE
75
ATS IN BUSINESS
76
savings-investment deficit was greater than 5 percent of GDP, even
though the state-owned enterprises themselves accounted for only 2
percent of GDP. Similarly, in Turkey during the 1980s, the SOE savings
investment deficit averaged about 6 percent of GDP, only slightly less
than the 7.5 percent of GDP that the SOEs produced. For these reasons,
measures to improve the performance of SOEs that are not divested have
an important role to play in the overall reform strategy. The remainder
of this chapter considers four-competition, hard budgets, financial
reforms, and changes in the relationship between SOE managers and
government-to see what role each played in the reform process of the
countries in our sample.
Improving SOE Performance through Competition
COMPETITION IMPROVES THE PERFORMANCE OF SOES, NOT
only because competitors push state-owned (and private) firms
to do better, but also because competition makes explicit the
costs of allowing SOEs to operate inefficiently or of using SOEs to pur
sue social and political goals. Competition also provides information
about managerial performance; governments can assess the level of
managerial effort by comparing an SOE's efficiency with that of its com
petitors (Vickers and Yarrow 1988).2° Competition's beneficial effects
can be seen clearly in analysis of provincial data for China: the larger
the nonstate share of a province's industrial output, the higher the TFP
of its state enterprises (figure 2.5).
If governments used SOEs primarily to correct market failures, then
the prospects for competition improving performance would be quite
limited. In practice, however, SOEs are found in many potentially com
petitive activities. To name just a few especially egregious examples from
our sample: a glue factory, a casino, and a shipping line (in Ghana);
pharmaceuticals, glass, vegetable oil, and earth-moving equipment (in
India); hotels, building materials, baked goods, and electric motors (in
Egypt); housing and chemicals (in Korea); a coal mine, sugar, tobacco,
and alcohol (in Turkey); edible oils, phosphate, and the import and dis
tribution of films (in Senegal); and poultry, dairy products, and furni
ture (in the Philippines). In each of these instances, there would seem to
be no economic justification for government ownership. Divestiture,

SUCCESS AND FAILURE IN
Figure 2.5 China: Response of State Sector to Competition from Nonstate Enterprises
Index of state sector TFP (max. = 100) 100
Shanghai •
95
90
85
80
75
70
65
10
Qiunghai
•
20
• Yunnan
•
Gansu •
•
• • Inner Mongolia
30
•
• Beijing
•
• Hubei
•
• Sichuan
• •
• Liaoning
40
• Guangdong
1 Fujian
50 60
Nonstate sector share of industrial output (percent)
Source: Singh, Xiao, and Ratha (1994).
therefore, makes the most sense economically, but exposing these enter
prises to competition and thus making explicit any inefficiencies would
be a good first step.
This is, in fact, what the successful reformers have done: they increased
domestic competition by removing price controls and barriers to entry,
and they increased international competition by liberalizing foreign trade.
Tables 2.4a and b illustrate changes in the degree of domestic competition
as revealed by the extent of price controls and government-imposed mo
nopolies in eleven activities frequently reserved for SOEs. Comparison of
the two tables shows the striking extent to which all the countries in our
sample reduced price controls and eased entry. Not surprisingly, the
three countries that had the best overall SOE performance ratings (Chile,
Korea, and Mexico) are among those that eased barriers to internal com-
Among China's provinces, the larger the nonstate share of industrial output, the higher the total factor productivity of the state enterprise sector.
70
77
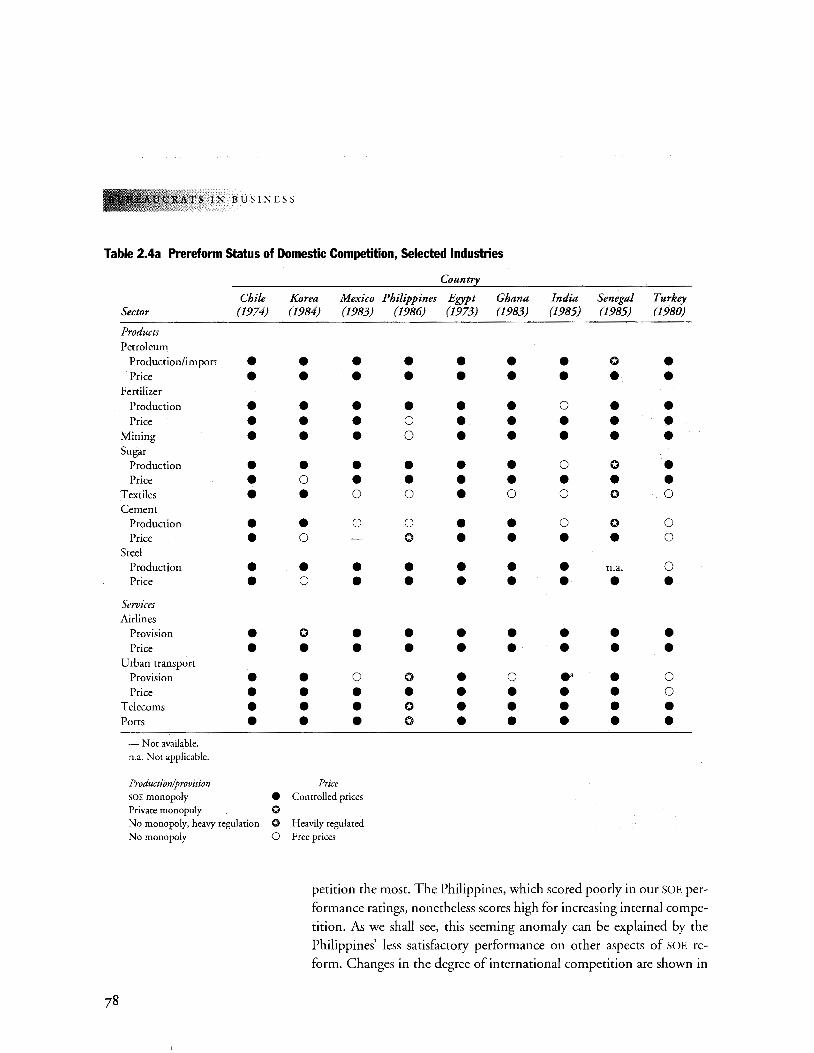
TS IN BUSINESS
Table 2.4a Prereform Status of Domestic Competition, Selected Industries
Coun
Chile Korea Mexico Philippines Egypt Ghana India Senegal Turkey Sector (1974) (1984) (1983) (1986) (1973) (1983) (1985) (1985) (1980)
Products Petroleum
Production/import • • • • • • • 0 • Price • • • • • • • • •
Fertilizer Production • • • • • • 0 • • Price • • • 0 • • • • •
Mining • • • 0 • • • • • Sugar
Production • • • • • • 0 0 • Price • 0 • • • • • • •
Textiles • • 0 0 • 0 0 0 0 Cement
Production • • 0 0 • • 0 0 0 Price • 0 - 0 • • • • 0
Steel Production • • • • • • • n.a. 0 Price • 0 • • • • • • •
Services Airlines
Provision • 0 • • • • • • • Price • • • • • • • • •
Urban transport Provision • • 0 0 • 0 ea • 0 Price • • • • • • • • 0
Telecoms • • • 0 • • • • • Ports • • • 0 • • • • •
--Not available. n.a. Not applicable.
Production/provision Price SOE monopoly • Controlled prices Private monopoly 0 No monopoly, heavy regulation 0 Heavily regulated No monopoly 0 Free prices
petition the most. The Philippines, which scored poorly in our SOE per-
formance ratings, nonetheless scores high for increasing internal compe-
tition. As we shall see, this seeming anomaly can be explained by the
Philippines' less satisfactory performance on other aspects of SOE re-
form. Changes in the degree of international competition are shown in
78
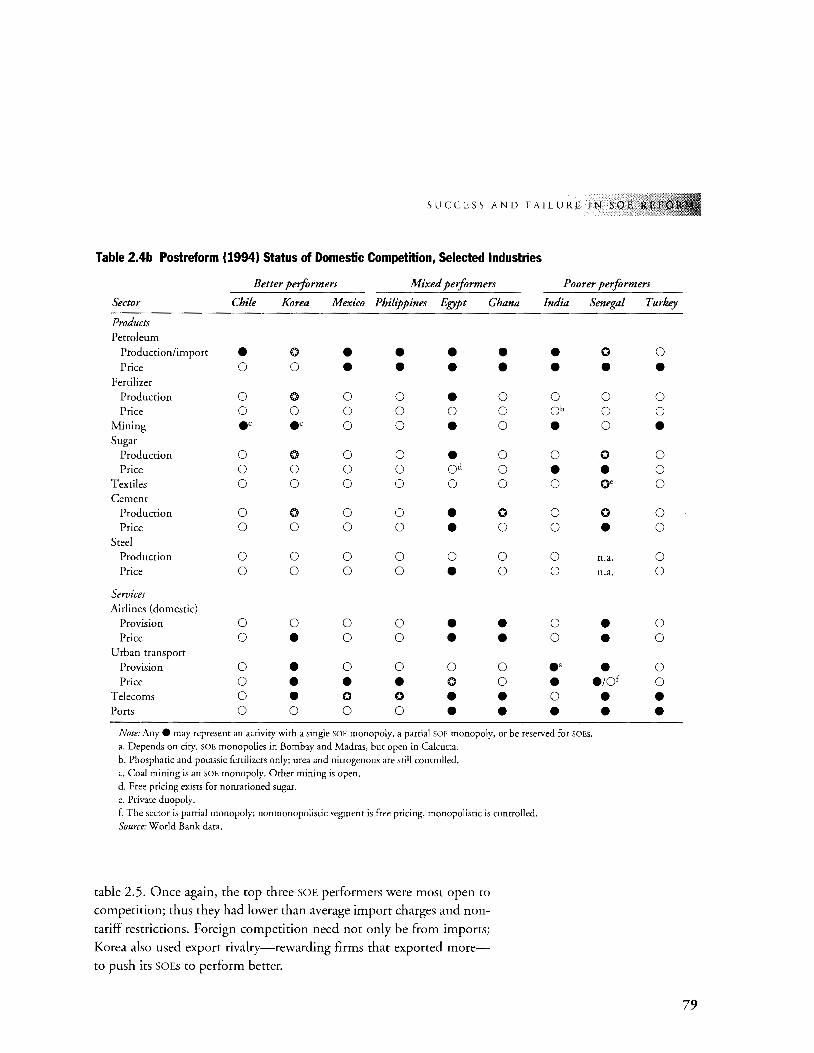
SUCCESS AND FAILURE IN SOE
Table 2.4b Postreform (1994) Status of Domestic Competition, Selected Industries
Better performers Mixed performers Poorer performers
Sector Chile Korea Mexico Philippines Egypt Ghana India Senegal
Products Petroleum
Production/import • 0 • • • • • 0 Price 0 0 • • • • • •
Fertilizer
Production 0 0 0 0 • 0 0 0 Price 0 0 0 0 0 0 Qb 0
Mining .c .c 0 0 • 0 • 0 Sugar
Production 0 0 0 0 • 0 0 0 Price 0 0 0 0 od 0 • •
Textiles 0 0 0 0 0 0 0 oe Cement
Production 0 0 0 0 • 0 0 0 Price 0 0 0 0 • 0 0 •
Steel Production 0 0 0 0 0 0 0 n.a. Price 0 0 0 0 • 0 0 n.a.
Services Airlines (domestic)
Provision 0 0 0 0 • • 0 • Price 0 • 0 0 • • 0 •
Urban transport
Provision 0 • 0 0 0 0 •• • Price 0 • • • 0 0 • e/of
Telecoms 0 • 0 0 • • 0 • Ports 0 0 0 0 • • • •
Note: Any e may represent an activity with a single SOE monopoly, a partial SOE monopoly, or be reserved for SOEs. a. Depends on city. SOE monopolies in Bombay and Madras, but open in Calcutta. b. Phosphatic and potassic fertilizers only; urea and nitrogenous are still controlled. c. Coal mining is an SOE monopoly. Other mining is open. d. Free pricing exists for nonrationed sugar. e. Private duopoly. f. The sector is partial monopoly; nonmonopolistic segment is free pricing, monopolistic is controlled. Source: World Bank data.
table 2.5. Once again, the top three SOE performers were most open to
competition; thus they had lower than average import charges and non
tariff restrictions. Foreign competition need not only be from imports;
Korea also used export rivalry-rewarding firms that exported more
to push its SOEs to perform better.
Turkey
0
• 0 0
• 0 0 0
0 0
0 0
0 0
0 0
• •
79
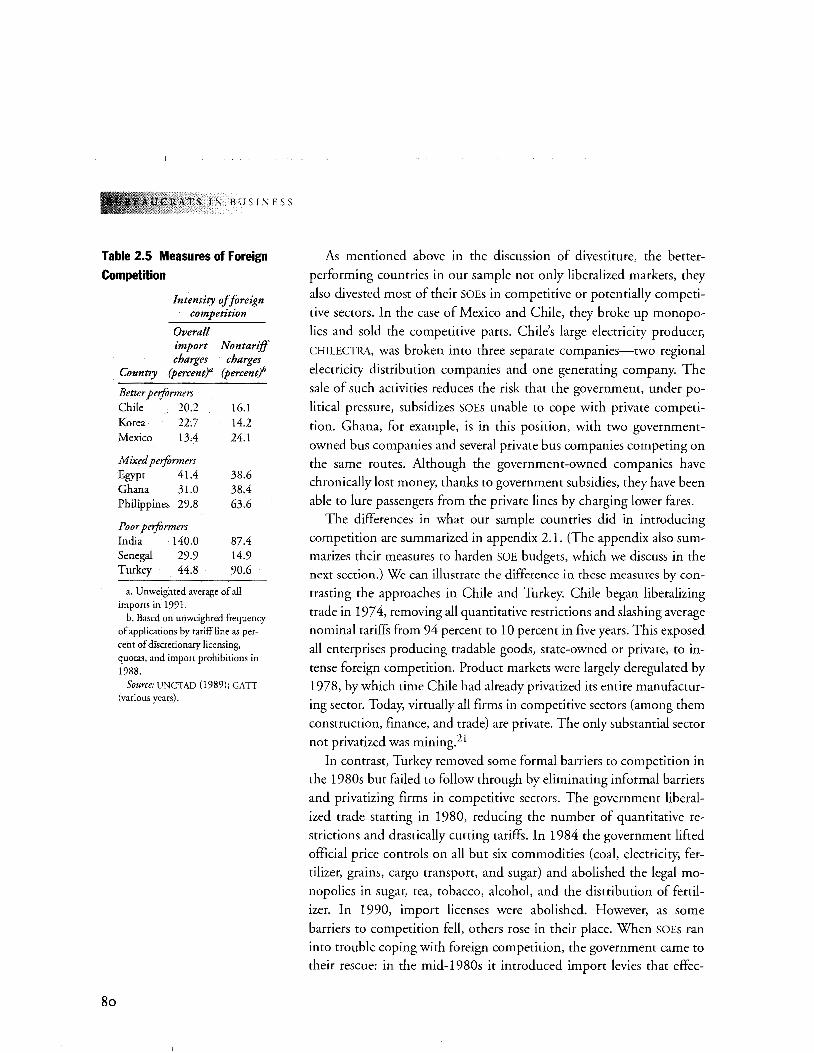
TS IN BUSINESS
Table 2.5 Measures of Foreign Competition
8o
Intensity of foreign competition
Overall import Nontariff charges charges
Country (percent}" (percent/
Better performers Chile 20.2 16.1 Korea 22.7 14.2 Mexico 13.4 24.1
Mixed performers Egypt 41.4 38.6 Ghana 31.0 38.4 Philippines 29.8 63.6
Poor performers India 140.0 87.4 Senegal 29.9 14.9 Turkey 44.8 90.6
a. U nweighted average of all imports in 1991.
b. Based on unweighted frequency of applications by tariff line as percent of discretionary licensing, quotas, and import prohibitions in 1988.
Source: UNCTAD (1989); GATT (various years).
As mentioned above in the discussion of divestiture, the better
performing countries in our sample not only liberalized markets, they
also divested most of their SOEs in competitive or potentially competi
tive sectors. In the case of Mexico and Chile, they broke up monopo
lies and sold the competitive parts. Chile's large electricity producer,
CHILECTRA, was broken into three separate companies-two regional
electricity distribution companies and one generating company. The
sale of such activities reduces the risk that the government, under po
litical pressure, subsidizes SOEs unable to cope with private competi
tion. Ghana, for example, is in this position, with two government
owned bus companies and several private bus companies competing on the same routes. Although the government-owned companies have
chronically lost money, thanks to government subsidies, they have been
able to lure passengers from the private lines by charging lower fares. The differences in what our sample countries did in introducing
competition are summarized in appendix 2.1. (The appendix also summarizes their measures to harden SOE budgets, which we discuss in the next section.) We can illustrate the difference in these measures by con
trasting the approaches in Chile and Turkey. Chile began liberalizing
trade in 197 4, removing all quantitative restrictions and slashing average
nominal tariffs from 94 percent to 10 percent in five years. This exposed
all enterprises producing tradable goods, state-owned or private, to in
tense foreign competition. Product markets were largely deregulated by 1978, by which time Chile had already privatized its entire manufactur
ing sector. Today, virtually all firms in competitive sectors (among them
construction, finance, and trade) are private. The only substantial sector
not privatized was mining.21
In contrast, Turkey removed some formal barriers to competition in
the 1980s but failed to follow through by eliminating informal barriers
and privatizing firms in competitive sectors. The government liberal
ized trade starting in 1980, reducing the number of quantitative re
strictions and drastically cutting tariffs. In 1984 the government lifted
official price controls on all but six commodities (coal, electricity, fer
tilizer, grains, cargo transport, and sugar) and abolished the legal mo
nopolies in sugar, tea, tobacco, alcohol, and the distribution of fertil
izer. In 1990, import licenses were abolished. However, as some
barriers to competition fell, others rose in their place. When SOEs ran
into trouble coping with foreign competition, the government came to their rescue: in the mid-1980s it introduced import levies that effec-
SUCCESS AND FAILURE IN S()i!,'
tively raised the average tarifffrom 7.4 percent in 1984 to 12.5 percent
in 1988, offsetting much of the effect of the earlier tariff reductions; it
also allowed SOEs to increase debt to sustain operations (World Bank
1992, 36-39; World Bank 1993). Import levies, plus nontariffbarriers
(such as quality controls) and measures forcing SOEs to purchase goods
from one another, explain why in 1990 the average price of goods pro
duced by Turkish SOEs was 44 percent higher than the import CIF
prices.22 Although Turkey has since sold some SOEs in competitive
markets, it still owns textile, paper and printing, fertilizer, and elec
tronics firms.
Among transitional economies, Poland moved quickly to open mar
kets to domestic and foreign competition, introducing low average tariffs
(18 percent) and removing most quantitative restrictions on trade. The
Czech Republic continued to apply the already low tariffs inherited from
the previous system. China, which began earlier, gradually removed re
strictions on domestic competition so that by 1993 only about 6 percent
of state industrial production was still sold at controlled prices. China has
also gradually liberalized trade. As with the restraints on domestic com
petition, however, openness seems not to have reached the levels of the
Czech Republic and Poland. Imports remain controlled, and tariff levels,
although lower, remain high for many key SOE products.
Hard Budgets
COMPETITION ONLY PRESSURES STATE-OWNED ENTERPRISES
to improve performance if they face a hard budget constraint,
that is, if they do not have access to subsidies, privileges, or
other forms of soft capital that enable them to compete without im
proving efficiency. 23 Hard budgets, therefore, are crucial to reforming
SOEs in competitive markets. They are also key to reforming monopo
lies: only when soft finance is curbed can regulators judge a monopoly's
performance and require that it perform up to commercial standards.
An SOE could be said to have a hard budget when:
• It gets no subsidies, transfers, or special privileges, such as tax ex
emptions, procurement set-asides, or favorable access to foreign
exchange, and must pay its bills or debts on time.
8r
:RATS IN BUSINESS
82
• Its access to credit is decided by independent banks on the basis of
commercial principles, without government guarantee, and on
market-determined terms.
• Its prices are set by the market or, for monopolies, through regula
tions that approximate economic prices so that the firm does not
earn monopoly rents.
But hard budgets are difficult to measure, which in turn makes them
difficult to implement-and to evaluate. This section first describes the
difficulties in measuring hard budgets, then provides an estimate of this
measure for SOEs in the countries in our sample to see whether the im
position of hard budgets is, as we expect, associated with improved
performance.
Whether a state-owned enterprise faces a hard budget or not depends
on any direct or indirect subsidies it receives from the government. But
subsidies are often hidden and cannot be uncovered without detailed in
vestigation of the individual firm (box 2.5). Moreover, capital transfers
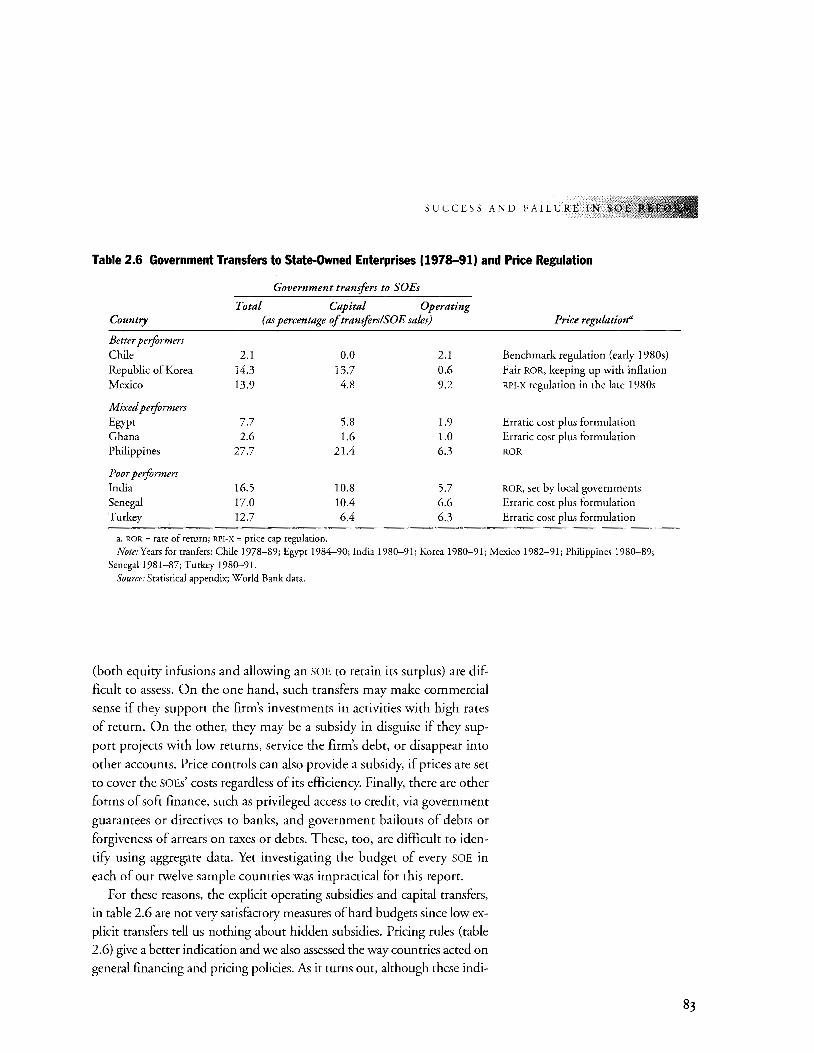
SUCCESS AND FAILURE IN
Table 2.6 Government Transfers to State-Owned Enterprises (1978-91) and Price Regulation
Government transfers to SOEs
Total Capital Operating Country (as percentage oftransfers!SOE sales) Price regu!dtion"
Better performers Chile 2.1 0.0 2.1 Benchmark regulation (early 1980s) Republic of Korea 14.3 13.7 0.6 Fair ROR, keeping up with inflation Mexico 13.9 4.8 9.2 RPI-X regulation in the late 1980s
Mixed performers
Egypt 7.7 5.8 1.9 Erratic cost plus formulation Ghana 2.6 1.6 1.0 Erratic cost plus formulation Philippines 27.7 21.4 6.3 ROR
Poor performers India 16.5 10.8 5.7 ROR, set by local governments Senegal 17.0 10.4 6.6 Erratic cost plus formulation Turkey 12.7 6.4 6.3 Erratic cost plus formulation
a. ROR = rate of return; RPI-X = price cap regulation. Note: Years for tranfers: Chile 1978-89; Egypt 1984-90; India 1980-91; Korea 1980-91; Mexico 1982-91; Philippines 1980-89;
Senegal1981-87; Turkey 1980-91. Source: Statistical appendix; World Bank data.
(both equity infusions and allowing an SOE to retain its surplus) are dif
ficult to assess. On the one hand, such transfers may make commercial
sense if they support the firm's investments in activities with high rates
of return. On the other, they may be a subsidy in disguise if they sup
port projects with low returns, service the firm's debt, or disappear into
other accounts. Price controls can also provide a subsidy, if prices are set
to cover the SOEs' costs regardless of its efficiency. Finally, there are other
forms of soft finance, such as privileged access to credit, via government
guarantees or directives to banks, and government bailouts of debts or
forgiveness of arrears on taxes or debts. These, too, are difficult to iden
tifY using aggregate data. Yet investigating the budget of every SOE in
each of our twelve sample countries was impractical for this report.
For these reasons, the explicit operating subsidies and capital transfers,
in table 2.6 are not very satisfactory measures of hard budgets since low ex
plicit transfers tell us nothing about hidden subsidies. Pricing rules (table
2.6) give a better indication and we also assessed the way countries acted on
general financing and pricing policies. As it turns out, although these indi-
83
IN BUSINESS
84
cators are less than comprehensive, they add up to a pretty dear picture of
whether budgets tend to be hard or soft.
Some of the more successful reformers in our group had lower subsi
dies and transfers, particularly operating subsidies, but the picture is
mixed; Ghana also kept transfers low. More important, successful re
formers also improved price regulation, introducing pricing mechanisms,
such as benchmark pricing (discussed in chapter 3), that motivated SOE
managers to reduce costs more than the widely used cost-plus or rate of
return regulation. Improved pricing mechanisms helped regulators set
prices closer to scarcity values and gave monopoly SOEs an incentive to
improve their performance. They also curbed hidden subsidies and easy
access to credit (see the next section). Chile went the farthest of the three,
ending virtually all SOE subsidies and privileges, overt and covert, soon
after reforms began in 1974. SOE borrowing no longer received a state
guarantee, and SOEs were required to pay dividends (in most cases equiv
alent to 100 percent of profits). Companies that could not break even
were denied subsidies but encouraged to improve efficiency and allowed to sell assets; for example, Chile's railroad reacted to the phasing out of
subsidies by reducing overstaffing from 27,000 in 1971 to 7,000 in
1984, selling off its real estate and other assets unrelated to railways, and
by dosing down some uneconomic services. Thus, Chile's railroad re
duced, and in some years eliminated, its operating loss.
The mixed performers have begun to phase out overt transfers, but pricing regulations fail to encourage efficiency, remaining fixed for long
periods, then moving up erratically. They have made little progress in
curbing hidden subsidies and privileged SOE access to soft financing.
This has reduced the effectiveness of their efforts to increase competi
tion. Egypt, for example, began to phase out budgeted payments to
SOEs in 1991 but by the mid-1990s continued to allow money-losing
SOEs to exist on overdrafts and foreign loans, periodically writing off
their domestic debts. In some instances, even such support isn't enough
to make a firm competitive. Egypt's Public Battery Company, which
lost money even when it had a monopoly, has fared poorly since its
market was opened to competition in 1984. Technically insolvent since
1986, the state company has lost 91 percent of its market and contin
ues to exist only because of overdrafts and the government's assumption
of all outstanding liabilities (Sherif 1992; Sherif and Soos 1993).
The countries with poor-performing SOEs had little success in hardening SOE budgets. Transfers and subsidies were large, and efforts to reduce
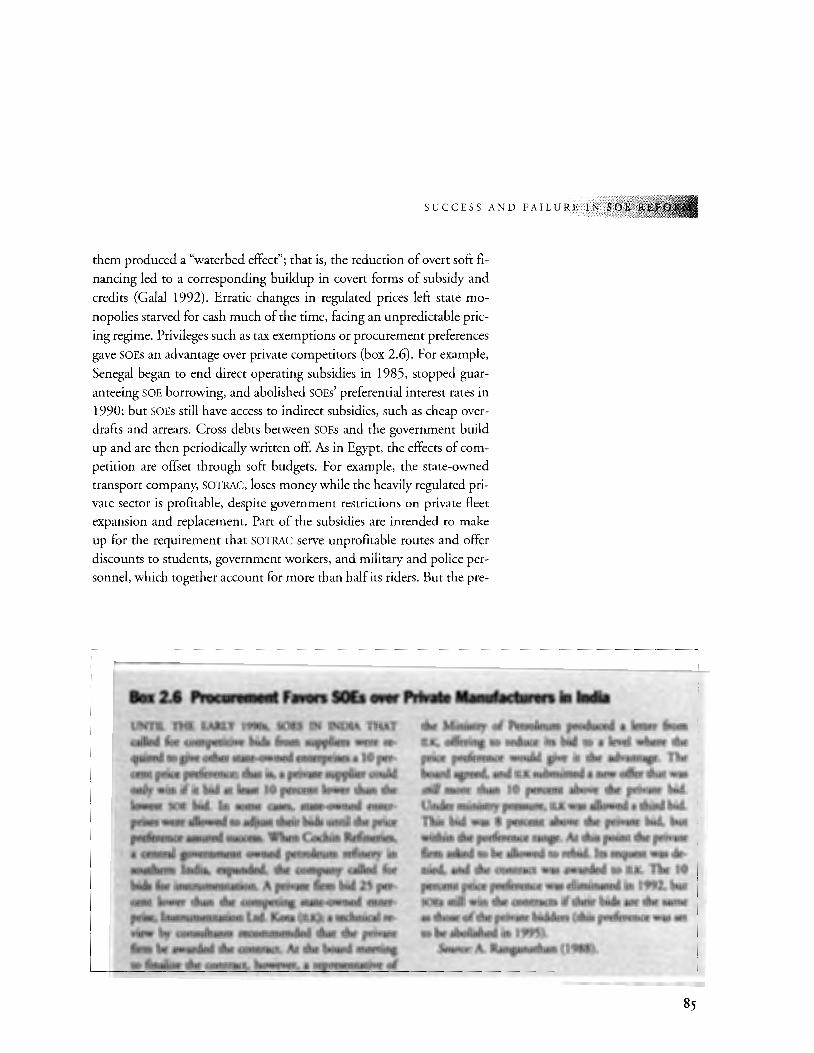
SUCCESS AND FAILURE IN SOE
them produced a "waterbed effect"; that is, the reduction of overt soft fi
nancing led to a corresponding buildup in covert forms of subsidy and
credits ( Galal 1992). Erratic changes in regulated prices left state mo
nopolies starved for cash much of the time, facing an unpredictable pric
ing regime. Privileges such as tax exemptions or procurement preferences
gave SOEs an advantage over private competitors (box 2.6). For example,
Senegal began to end direct operating subsidies in 1985, stopped guar
anteeing SOE borrowing, and abolished SOEs' preferential interest rates in
1990; but SOEs still have access to indirect subsidies, such as cheap over
drafts and arrears. Cross debts between SOEs and the government build
up and are then periodically written off. As in Egypt, the effects of com
petition are offset through soft budgets. For example, the state-owned
transport company, SOTRAC, loses money while the heavily regulated pri
vate sector is profitable, despite government restrictions on private fleet
expansion and replacement. Part of the subsidies are intended to make
up for the requirement that SOTRAC serve unprofitable routes and offer
discounts to students, government workers, and military and police per
sonnel, which together account for more than half its riders. But the pre-
Box 2.8 Procurement FaYOrS SOE$ over Private Manufacturers in India UNTIL THE EARLY 1990s, SOES IN INDIA THAT called for competitive bids from suppliers were re~ quired to give other state-owned enterprises a 10 percent price preference; that is. a private supplier could only win if it bid at least 10 percent lower than the
10\lVesr SOE bid. In some cases, state-owned enterprise$ were illowed to adjust their bids until the price preference assured success. When Cochin Refineries. a c,enttal government owned petroleum refinery in southern India, expanded, the company. called for bids for instrumentation. A private fir~ bid 25 pertent lower than the .competins·.state~owned enterprise. Instrumentation Ltd. Kota (ILK}; a technical revi~ by consultants recommended that the private firm· be awa~;ded the contract.· At the board meeting to finalize the oontract, however, a representative of
the Ministry of Petroleum produced a letter from lLK, offering to reduce its bid to a level where the price preference would give it the advantage. The board agreed, and ILK submitted a new offer that was still more than 10 percent .above the private bid. Under ministry pressure, ILK was allowed a third bid. This bid was 8 percent above the private bid, but within the preference range. At this point the private firm asked ro be allowed to rebid. Its request was denied, and the contract was awarded to ILK. The 10 percent price preference was eliminated in 1992, but SOEs still win the contracts if their bids are the same as those of the private bidders (this preference was set to be abolished in 1995).
Source: A. Ranganathan (1988).
85
SIN BUSINESS
86
cise link between the costs of these requirements and the subsidies is not
made clear. Moreover, in addition to direct subsidies, SOTRAC receives
low interest loans to purchase new vehicles and parts, tax exemptions for
some imports, and tax deferments. The deferred liability is usually can
celed after it accumulates. Between 1989 and 1991 SOTRAC received an
estimated 32.1 billion CFA ($113.8 million at 1991 exchange rates) in
subsidies, loans, and advances from the state, yet in 1993 the company
was insolvent, with negative working capital (Etievent 1993).
Among the transition economies, the Central European countries
have taken important steps toward hard budgets. Budgetary subsidies
were almost eliminated in Poland after 1990 and in the Czech Republic after 1991, and both have moved to curb access to soft credits
(Poland has gone even farther; see box 2.9 below). In contrast, China
has not yet hardened its budgets for its SOEs, as we discussed above. In
stead, their large losses are financed through budget subsidies, although
increasingly the burden has shifted to the banking system. (Subsidies financed 78 percent of losses in 1986 and only 55 percent by 1993.) This has contributed to a rising stock of bad debt, estimated in the
mid-1990s at 10 to 20 percent of outstanding bank loans (Hwa 1992).
Another sign of soft budgets in China is the fact that SOEs continue to
receive the lion's share of bank credit (most of which is subsidized),
even though their productivity is lower than that of other forms of
ownership. 24
Financial Sector Reform
AS WE HAVE SEEN, HARD BUDGETS CANNOT BE FULLY IMPLE
mented without a sound financial sector to prevent well
connected SOEs from simply replacing government transfers
with soft credits. Of course, a sound financial sector is important in its
own right, and there is a valuable and growing literature on the impor
tance of financial sector reforms to development. It is not our intention
to review that literature here. Rather, we examine the ways that financial
sector reforms-or the absence of them-influence SOEs. These reforms
include improving supervision and regulation, reducing directed credit
programs and direct government control over financial intermediaries, and reducing interest rate controls and similar measures designed to
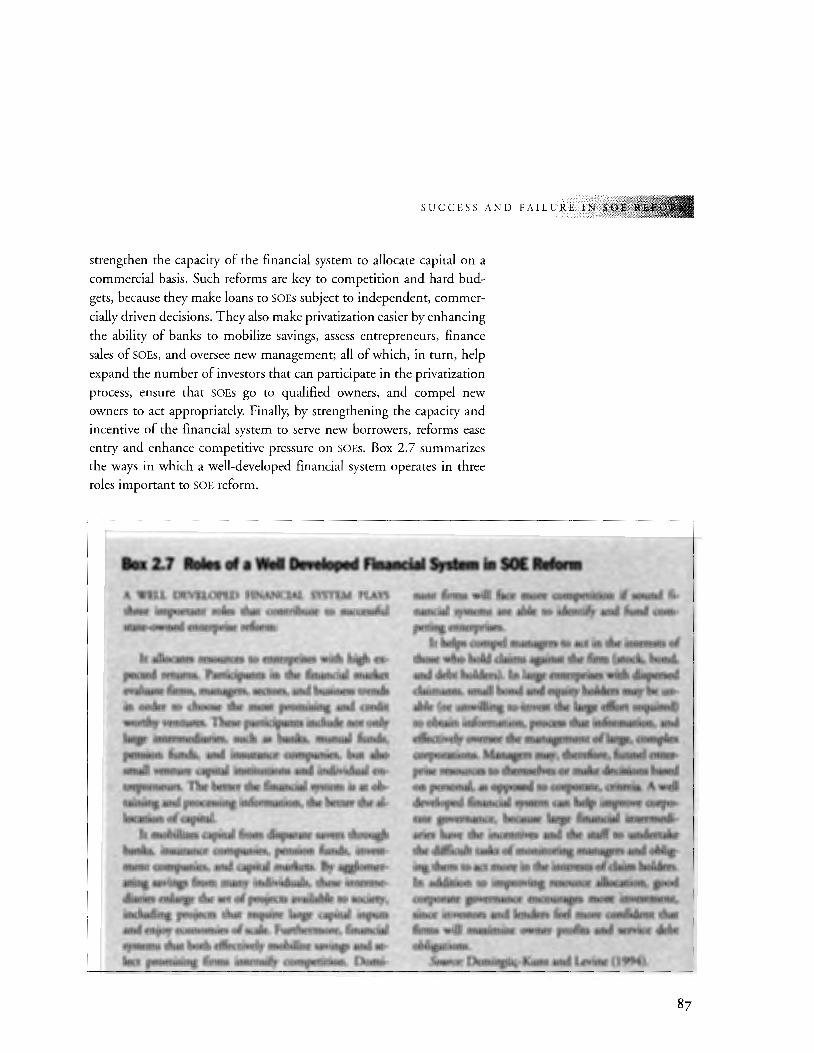
SUCCESS AND FAILURE INS
strengthen the capacity of the financial system to allocate capital on a
commercial basis. Such reforms are key to competition and hard bud
gets, because they make loans to SOEs subject to independent, commer
cially driven decisions. They also make privatization easier by enhancing
the ability of banks to mobilize savings, assess entrepreneurs, finance
sales of SOEs, and oversee new management; all of which, in turn, help
expand the number of investors that can participate in the privatization
process, ensure that SOEs go to qualified owners, and compel new
owners to act appropriately. Finally, by strengthening the capacity and
incentive of the financial system to serve new borrowers, reforms ease
entry and enhance competitive pressure on SOEs. Box 2.7 summarizes
the ways in which a well-developed financial system operates in three
roles important to SOE reform.
Box 2.7 Roles of a Well Developed Financial System in SOE Reform
A WELL DEVELOPED FINANCIAL SYSTEM PLAYS three important roles that contribute to successful state~wned enterprise reform:
It allocates resources to enterprises with high expected returns. Participants in the financial market evaluate firms, managers, sectors, and business trends in order to choose the most promising and credit worthy ventures. These participants include not only large intermediaries, such as banks,. mutual funds, pension funds, and insurance companies, but also small venture capital institutions and.individual en~ trepreneurs. The better the financial system is at obtaining and processing infOrmation, the better the.allocation of capital.
It mobilizes capital from disparate savers througll banks, insurance companies, pension funds, investment companies, and capital.markets. By agglomerating savings from many individuals, these intermediaries enlarge the set of projects available to society, including projects that require large capital inputs and enjoy economies of scale. Furthermore, financial systems that both effectively mobilize savings and select promising firms intensifY competition. Domi-
nant firms will face more (:Ompetition if sound financial systems are able to identifY and fu11d rom-' peting .enterprises;
It helps compel managers to act in the interests of those who hold claims againstthe firm (stock, bond, and debt holders).ln large enterprises with dispersed claimants, small bond and equity hol~ may be .unable (or unwilling to·inve&t the large effort ~:equired) to obtain information, process thatinformaciOP., and effectively oversee the management oflar~, romp lex corporations. Managers maY• tberefciie, fun,hefenter-prise resources to. themselves. or malw ded.slon$ basea on personal, .as opposed to corpCirate~ cri~e~~ .. AweU developed financial system: can hel~ impro.v~corporate governance, because ·large financial interm¢di.:. aties have the incentives and the staB:' to urlderiake the diffirult tasks of monitoring managers.and ()bligingthem to acrmore in theim:ere~C~fclahn holders. In addition to improving resout« allocation; good corporate governance encourages mot~ it'):vestment, since investors and lenders feel more confident that firms will. maximize· owner profits. and service debt obligations.
Source: Demirgiiy~Kunt and Levine (1994).
87
RATS IN BUSINESS
88
Although conventional wisdom about SOE reform has not generally
stressed the importance of establishing a sound financial sector, analysis
of our sample suggests that successful financial reform greatly enhances
the chances for success in SOE reform. A comparison of financial reforms
in our sample (appendix 2.2) shows that the better performers strength
ened their financial systems' ability to allocate capital on a commercial
basis, to mobilize savings for investment, and to assess which entrepre
neurs would repay loans. Reforms often proceeded in a two-track man
ner. Initially, governments took steps to enhance supervisory and regu
latory capacity, cut back on directed credit programs, and reduced direct
government control of financial intermediaries. They varied in how well
they matched deregulation with better supervision and regulation. Chile
in the early 1980s and Mexico in the mid-1990s liberalized before a
strong enough supervisory structure was in place, contributing to a fi
nancial crisis, but both moved promptly to correct the problem. They
also varied in their treatment of interest rates, but when real rates were negative, all moved toward positive real rates. These reforms were fol
lowed by a reduction in the importance of state banks, bank privatiza
tion, and the strengthening of private financial intermediaries. Thanks to
these efforts, the better performers in our sample have more developed fi
nancial systems with greater depth, a larger role for nonbank financial in
termediaries, a higher level of stock market capitalization relative to GOP,
and more private banks. We illustrate this graphically with a composite
indicator of financial sector development for the sample countries in fig
ure 2.6; box 2.8 explains how these indicators were derived.
To understand what the better performers did to improve their finan
cial sectors, consider the example of Korea. In the early 1980s, Korea lib
eralized interest rates, reduced directed credits, lowered barriers to entry,
and formalized the curb market into an important private nonbank fi
nancial intermediary sector. It also strengthened supervision of both banks
and non banks. Liberalization and improvements in the regulatory systems
set the stage for privatization ofbanks in 1983. Although the government
still retains some control over bank lending decisions, bank lending stag
nated as a share of GOP in the 1980s, while nonbank credit boomed, ris
ing as a share of GOP from around 10 percent in 1976 to close to 40 per
cent by the end of the 1980s. By the mid-1990s these programs had laid
the basis for a more developed financial system.
In contrast, in most of the mixed and all of the poor performers, promising recent reforms have not yet overcome a history of underde-
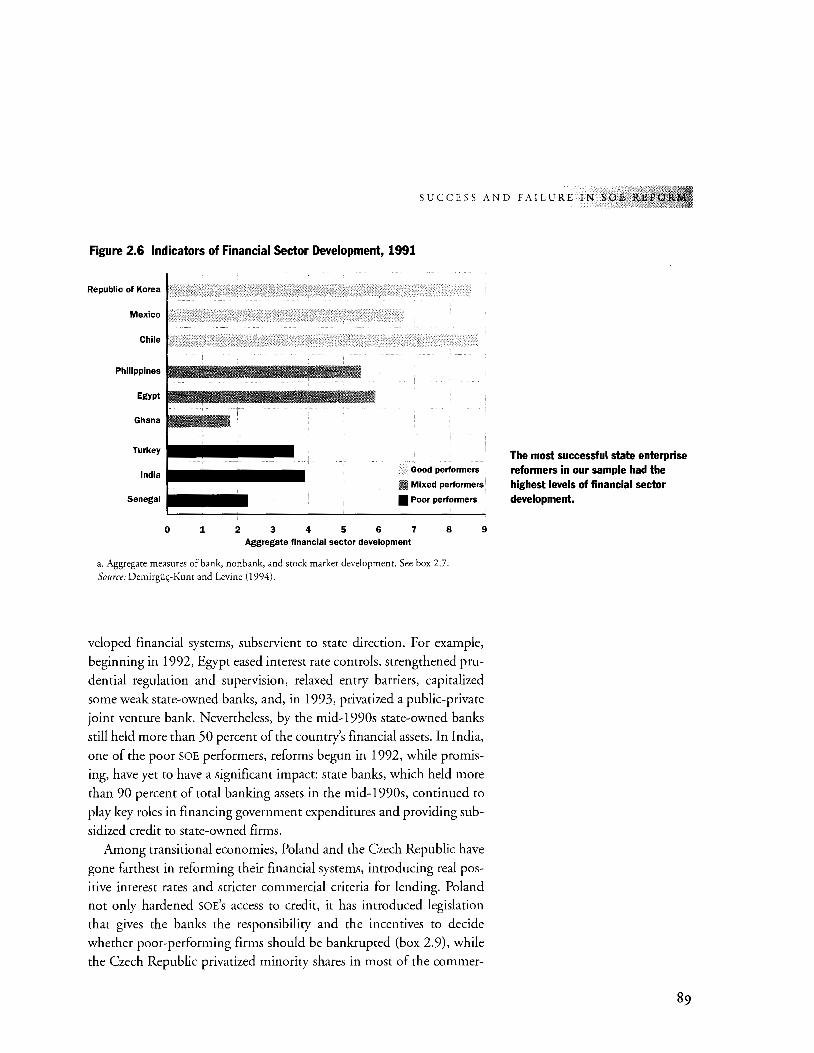
SUCCESS AND FAILURE IN SOE REF
Figure 2.6 Indicators of Financial Sector Development, 1991
Republic of Korea
Mexico
Chile
Philippines ~~~~~~~~~~~~~~~~~~~~~~~~~~~~~~~~~ E~pt PIIIIIIIIIIIIIIIIIIIIIIIIIIIIIIIB
Ghana
Turkey ~1111111111111111111111 India .11111111111111111111•
Senegal
Good performers
Ill Mixed performers
• Poor performers
0 1 2 3 4 5 6 7 8 Aggregate financial sector development
a. Aggregate measures of bank, nonbank, and stock market development. See box 2. 7.
Source: Demirgiic;-Kunt and Levine (1994).
9
veloped financial systems, subservient to state direction. For example,
beginning in 1992, Egypt eased interest rate controls, strengthened pru
dential regulation and supervision, relaxed entry barriers, capitalized
some weak state-owned banks, and, in 1993, privatized a public-private joint venture bank. Nevertheless, by the mid-1990s state-owned banks
still held more than 50 percent of the country's financial assets. In India,
one of the poor SOE performers, reforms begun in 1992, while promis
ing, have yet to have a significant impact: state banks, which held more
than 90 percent of total banking assets in the mid-1990s, continued to
play key roles in financing government expenditures and providing sub
sidized credit to state-owned firms. Among transitional economies, Poland and the Czech Republic have
gone farthest in reforming their financial systems, introducing real positive interest rates and stricter commercial criteria for lending. Poland not only hardened SOE's access to credit, it has introduced legislation
that gives the banks the responsibility and the incentives to decide
whether poor-performing firms should be bankrupted (box 2.9), while the Czech Republic privatized minority shares in most of the commer-
The most successful state enterprise reformers in our sample had the highest levels of financial sector development .
89
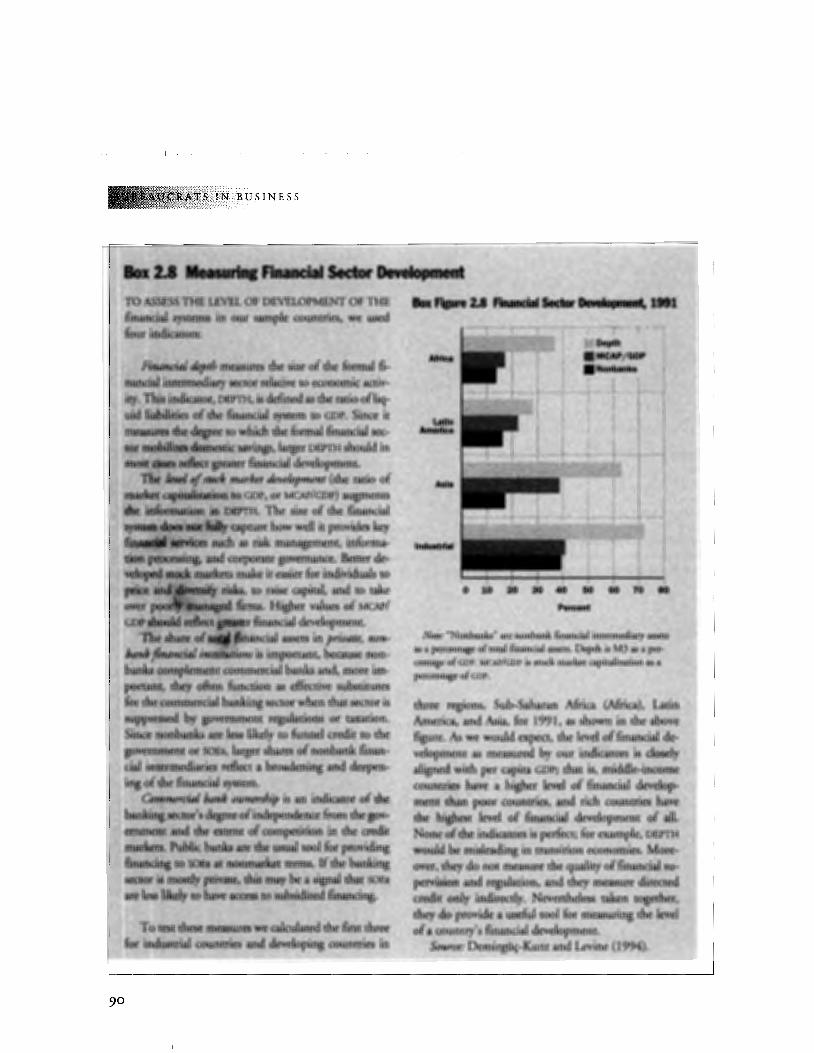
IN BUSINESS
90
-- -
'-fi&We._2,1_-Finanelid-~~·!·1
Percent
Note: "Nonbanks" art: nonbank financial inter~nediaty asseu as a per<;entage of total financial assetS. Depth is M3 a5 a percentage ofGDP. MCAP/GDP is stock lnllrket capitalization as a percentage of GOP.
thr~ _regions, Sub~Saharan Africa _(Africa), Latin America, and Asia, for 1991, as shown_ in the above figure. As we would expect, the level pf.fmanciald~· velopment as meas\lred b,y our_ indiclirors is ¢1~e1y • aligned with per c~pita GJ.iP; that is, middle~qu;Gme countri~ have a hither le~ of financial develop;.
·- rnent dWt p()(Jr co~t(~, ~d rich· coun~ies fiav.e the )jfgh¢5t .level. of fin~,gcial development ()f alL Non~-flf.rhe indita.~()tsis perfect; for ~plt;:,pEPTH. '\'VOtild b~ misleading i11 transition economies~ MbJ:C.. over, ~eydo 1lot.measure the quality offinanci~s~ perv~rin -and .regtilation, and tiler nreasw:e dite<:ted cr~if. ~lily_ indirectly. Nevertheless· taken together, . they 4oprovide 1\ useful toolfor m~uri11g th~ level of a _®unto/ s financial development.. . ... --
Source: Demirgus;.;Kunt and Levine (1994).
SUCCESS AND FAILURE IN SOE
;Do~~(~ Ttte~at-Ud SOE Refomi: The Case of Poland - ' -" ~, ~
..• ji( ~T EcclNOMtJi& yVI't'ij · t\ DlWELOPED fin~nd;ai. sec~oi anglega{ ~ew~rk; cteditors are .o~ b1 a stl:on:g poSition ~o decide the fate of poor-· ~J,9~min~ firms. Jn: ttaj~tinp: ~notnies with hlJ~ured$ .{)( iState~o\vned ernemr!~s, ·hlany of
. wh;,~n ~re p<>nr performe~;s, the financW sector and legalfr~ework are oftentoawe,ikt9en<tble creditP"~;tQ play~is ~- Moreove~, ~n>.~n creditors, thr .~a~; are often stat~~owned e~terpdses them~ves,. subj~ct' to the sain~ dis~~e~ .incentive struc-
.• tt1res ~ .the• e11re9]riset t<pv~¢11 t:he.y- i,enu. . . .·· ...• lt\.J~o~nd~e g<Werfi~ent ha$ <},~tempted to addtiss tbi~> problem by. restm~t:mg anit ultimately privatizing .. state-owned banks, while . tJiving the
~··· incen~ives to play tU). i.flC~e<Umgly assertive J:ole fit selling .nr liquidating pnor~performing
. fir~ .. The p:t;oceas got Under way in l 992, when . the government •. ordet:ed t::be nine state-owned batlksto ~top lending to poorly performing firms. In 1.993'; the ~:tllts jVere teqmred to wrap up their oldest nonperformin~ ldans by having . the loans fully repaid or. tful:p~yntet\ts br:ought up to date; by w~rijng qui, a tle\!i ~~ib~e repa,nnent schedule witli t4e fit~; oi', where diis ~s not possible, by tiquitJ.ating · the· fitm to €!ollec:t oti the .loan .. With b~. h~an« s~eetS' thus it1 ~he proce$s of being cleaned UF•. the g()vernm¢nt~oved to privatize the l>anl(s th~lves •• Three' had . been privatized by m.id-.1995, atul .. a fourth \vas scheduled for sale by the end of the ~'at .. B,an:k e!!,tplo}'ees, who . have
· • pret'erenti;al.a~s !;o ban:k.~res during privatization, have a. Sttong.Sta~ in seeing that the banks <in llOt lend again tO pogr perforroers, especially Sin(:'e. the· .. gov~~l,).men:t will recapitalize the banks prior to:~e oUfy on the ~is (,lf w~t their condi~
· · rio!l 'Was it'l. .l99L'fhe banks'. ~ore stringent lend~ ing. ~rireria a;e ~r:dfig changes in poorly perform~ ing sbES, whkh can .. no longer expect easy credit
from the ·!:Yanks or elsewhere. (Ready loans from nonbank trade creditors have also dried up, since the trade creditors no longer receive subsidies or easy credit themselves.) ·
From the creditots' standpoint, Poland's legal framework is far from ideal. Bank daims on collar~ eral have low priority, foreclosure is slow and cumberso.me, and liquidation is inefficient and leaves bank and trade creditors in arr u~v()rable position. To overcome these probltfiu, tbe Polish government gavebanks the tight to neg6ti~teworkout agreements with debtor firms 9llibeh!1lf ofall creditors, if creditors holding at least 50 Percent of the debt agree. Under this proces~! .~<l'l:Unu of nongovetnment creditors· get hiSher pii~ thllll:·be-:fore; nongovernment creditors can tetmitiate the a~reement if the SOE fails to impl~Q:~.ent "the promised reorganization, and cr~i~~ ~~uire shares in the firm by swappi.U-~th~~#<»i:fo,K¢~ruty.
Although it is too early ~-;~,s~c~s of Poland's approach, eatly si·~~~isi.ng. By mid-1994, of the 775 state-o~:'e~erprlses that had bank loans classified as nbnpt;rforming in 1991, about 16 percent bad been liquidated, 27 percent had fully repaid their loans, and another 13 percent had brought their payments up to date. Most of the remaining firms had been reorganized, and in about a quarter of these cases the creditors received shares through debt-equity swaps. There l:tave been some notable successes. For example, the Szczin shipyard, reorganized in 1992, is now profitable, bas full order books, and is in the process of being privatized. By giving creditors the right incentives and control, Poland seems to have found a decentralized way to propel troubled firms to restructure and privatize more rapidly and to push inviable firms to liquidate,
Source.; Baer and Gray (1994).
91
TS IN BUSINESS
92
cial banks and transferred management control to the new private own
ers. In contrast, financial sector reform lags in China, where credit is ad
ministratively allocated with no clear link to performance, and there is a
plethora of nonmarket and negative interest rates.
The sequencing of financial reforms and their coordination with
state-owned enterprise reform is a complex issue, in part because it
raises questions about how quickly financial markets should be liberal
ized and state-owned banks should be privatized. Decontrolling interest
rates, freeing entry, and privatizing banks before there are strong super
visory and regulatory institutions and procedures to deal with bad SOE
debts could create perverse incentives and so are risky measures. For ex
ample, banks with large exposure to troubled SOEs might imprudently
bid up deposit interest rates to attract funds to prop up weak SOEs so
that the SOEs would not immediately default and cause the bank to fail.
The banks would make the loans, hoping either that the SOEs would be
come profitable or, more likely, that the government would ultimately
pay SOE debts. Another risk is that undercapitalized banks facing increased competition will have both the incentives and means to attract
resources for excessively risky projects. Thus, overly aggressive privatiza
tion and interest rate liberalization without sufficiently strong supervi
sion and regulation and without a policy for coping with bad SOE debts
may stymie SOE reform and set the stage for financial crisis.
Korea and, on its second try, Chile substantially improved the financial
infrastructure-legal codes, regulations, supervision, and enforcement
early in the reform process. Once these measures and SOE reform were
under way, policymakers began fostering the development of private fi
nancial intermediaries. They did this by reducing the funds directed from
state-owned banks to SOEs on less than market terms under less than mar
ket conditions, by gradually removing impediments to the expansion of
private financial institutions, and by ultimately privatizing state-owned
banks. The costs of moving too quickly with bank privatizations are evi
dent from Chile's first attempt at financial and SOE reform, when under
capitalized banks were quickly privatized despite shortcomings in the reg
ulatory and supervisory system. Box 2.10 describes this attempt during
the late 1970s and early 1980s and the financial crisis that resulted, as well
as Chile's recovery to a second, much more successful effort. The financial
problems in Mexico in early 1995 may indicate that it, too, liberalized in
terest rates and privatized its financial system before a sufficiently strong
supervisory and regulatory system was in place.
SUCCESS AND FAILURE IN SO
Bo• 2.10 Weitk FlnaiiCUIJRegulatiCJa C$n Undermine Privatization: The Case of Chile · · ·
CHILE TWICE PRIVATIZED A lARGE NUM:SER OF stare;,.owned·enterprises. Probl~ encqunte;ed dur~ ing the fint attempt (1974-82)/ill~r:lte the importance of establishing adequate fmancial sectonegula.tion . and supervision. Chile began :the first period with deregulation: the goveriunent abolished interest ntte ceilings, eliminated credit .al¥>c;,ttion contto!i, re· duced banks' reserve requirements, freed c11pital controls, and allowed· new entry. The authorixi~ also priva.tized stare~· Manywen;pw:c~ed by business conglomerates,. with a mere 20 percent down payment..· The conglom~ateS then ·t.lsedloans .·from the banks tO finance the plQ:'chase of.nontlnancial· firms with down payments of only 10 to 40 percent. These highly leverage9: purchases coneentrated finan~ial and industrial·power in .the.same hands. Under such circumstances, the ineffective, understaffed, and underfunded bank supervisory system was unable to prevent insider lending. 'When domestic .economic problems, external shocks, and an . overvalued exchange rate caused a depression in 1992, the con·
glomerates used their banks to. prop up their failing firms; so that banks and firms alike were quiddy in se-: rious troul>le. Ouring the resulting financial crisis, the
··government took back control. of some ftfty previously privatized enterprises, indudingbanks thatac~ counted for 60 percent of total bank deposits.
Following the lSISZ crisis, Chile strengthened .the role, staffmg, and funding of its bank supervisory sysrem;jt then r~capiralized and reprivarized the banks and sold off the nonfinancial enterprises for a second time. Regulations prohibited the son of highly concentrated, highly leveraged ptuchases and. insider lending .rhat had characterized the first reform effon. Today, Chile's private financial system is well devel~ oped, with .• a large number· of nonbank: intermedi~ aries, and supports a booming private industrial sec~ tor. Chile's. experience suggests that countries undertaking bank privatization and liberalization of interest rates and credit controls should make sure that sound supervisiol:l and regulation mechanisms ate in place nrst.
Changing the Relationship between Governments and SOE Managers
DIVESTITURE WHEREVER POSSIBLE, COMBINED WITH IN
creased competition, hard budgets, and financial sector re
forms create substantial pressures for SOEs to improve perfor
mance. How SOEs respond depends on whether SOE managers have the
freedom and incentives to improve performance. Many governments do
not give SOE managers the power to react to competition with appropri
ate measures, such as laying off excess workers, seeking cheaper sup
pliers, stopping money-losing services, or searching for new markets.
93
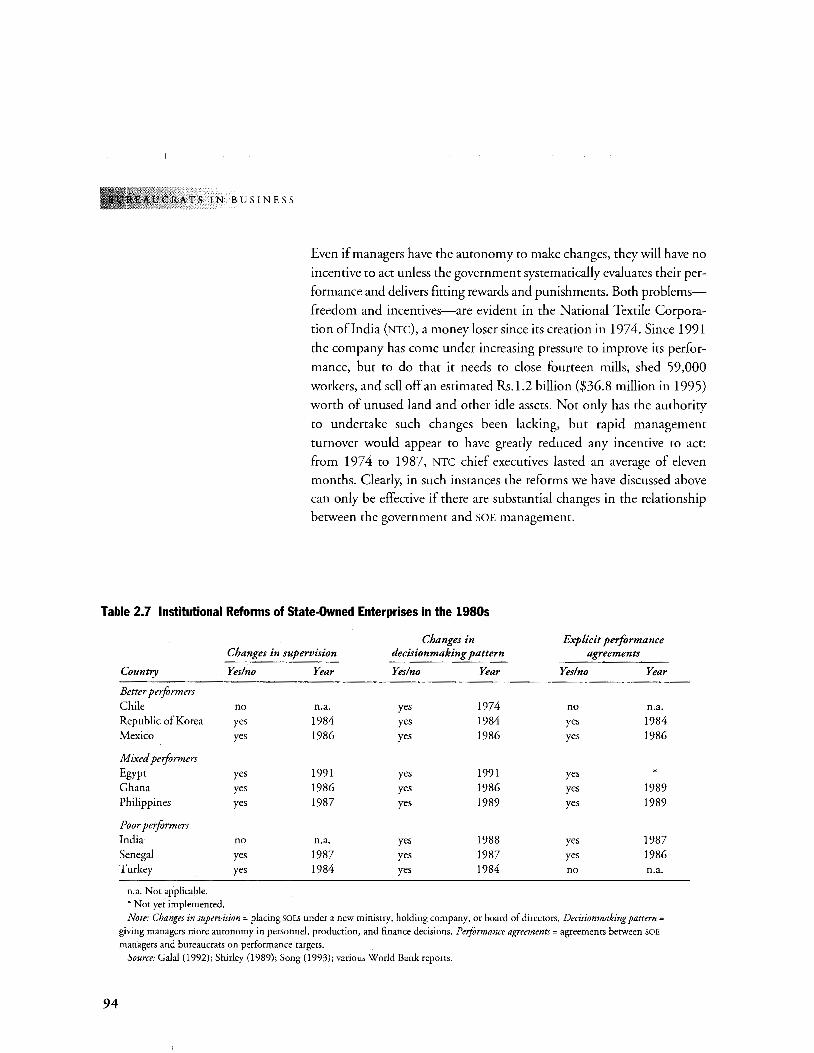
RATS IN B U S I N E S S
Even if managers have the autonomy to make changes, they will have no
incentive to act unless the government systematically evaluates their per
formance and delivers fitting rewards and punishments. Both problems
freedom and incentives-are evident in the National Textile Corpora
tion ofindia (NTC), a money loser since its creation in 1974. Since 1991
the company has come under increasing pressure to improve its perfor
mance, but to do that it needs to close fourteen mills, shed 59,000
workers, and sell off an estimated Rs.1.2 billion ($36.8 million in 1995)
worth of unused land and other idle assets. Not only has the authority
to undertake such changes been lacking, but rapid management
turnover would appear to have greatly reduced any incentive to act:
from 197 4 to 1987, NTC chief executives lasted an average of eleven
months. Clearly, in such instances the reforms we have discussed above can only be effective if there are substantial changes in the relationship
between the government and SOE management.
Table 2.7 Institutional Reforms of State-Owned Enterprises in the 1980s
94
Changes in Explicit performance Changes in supervision decisionmaking pattern agreements
Country Yes/no Year Yes/no Year Yes/no Year
Better performers Chile no n.a. yes 1974 no n.a. Republic of Korea yes 1984 yes 1984 yes 1984 Mexico yes 1986 yes 1986 yes 1986
Mixed performers Egypt yes 1991 yes 1991 yes * Ghana yes 1986 yes 1986 yes 1989 Philippines yes 1987 yes 1989 yes 1989
Poor performers India no n.a. yes 1988 yes 1987 Senegal yes 1987 yes 1987 yes 1986 Turkey yes 1984 yes 1984 no n.a.
n.a. Not applicable. * Not yet implemented. Note: Changes in supervision= placing SOEs under a new ministry, holding company, or board of directors. Decisionmaking pattern=
giving managers more autonomy in personnel, production, and finance decisions. Performance agreements = agreements between SOE managers and bureaucrats on performance targets.
Source: Gala! (1992); Shirley (1989); Song (1993); various World Bank reports.
SUCCESS AND FAILURE IN SOE.
Strikingly, all the countries in our sample, successful and unsuccessful,
attempted to change government-SO£ management relations (table 2.7).
These reforms included introducing new oversight bodies, increasing
managerial autonomy, and signing explicit performance agreements. New
supervisory bodies were created in Egypt (the Public Investment Office
headed by the prime minister), the Philippines (Government Corporation
Monitoring Coordinating Committee), Ghana (the State Enterprise
Commission), and Senegal (the Delegation for the Parapublic Sector Re
form). The composition of SOE boards of directors was changed to include
representatives of consumers or professionals in, for example, Korea, Mex
ico, the Philippines, and Turkey. All the countries expanded the power of
SOE managers (formally, if not always in practice) over such matters as
pricing, procurement, production, and personnel. Most adopted explicit, performance-based agreements with SOE managers.
Since all countries made broadly similar attempts to alter the relation
ship between the government and SOE managers, what accounts for the
differences in outcome? We have argued throughout this chapter that the
five components of state-owned enterprise reform are closely interdepen
dent. It would therefore be reasonable to conclude that the differences in
achievement in the first four components go a long way to explaining
why some countries had better-performing SOE sectors than others. Yet
theory and common sense suggest that changes in the relationship be
tween the government and SOE managers are probably important in their
own right, and that differences in such changes may not show up in
country-level data. To understand why institutional reforms seem to have
worked in some countries and not in others, we need to distinguish be
tween reforms that are mere formalities and those that genuinely alter the
incentives for government and management, thus changing behavior and
outcomes. To do so we need to go beyond country-level analysis and con
sider the relationship between managers and governments in individual
firms. This is the subject of the next chapter.
Conclusion
THIS CHAPTER HAS ARGUED THAT FIVE ELEMENTS OF STATE
owned enterprise reform-divestiture, competition, hard bud
gets, financial sector reform, and changes in the relationship be-
95
.1' S IN B U S I N E S S
96
tween government and SOE managers-are closely interdependent.
Countries with the best peiforming SOE sectors not only tended to do better
on each of the first four elements (and perhaps the fifth); they also followed a
more C(lmprehensive approach, in which success in one area supported success
in the others. Countries with SOE sectors that peiformed less well frequently
undertook broadly similar reform efforts; but these differed ftom those of the
successful countries in degree and in design. Not only did the less successful
countries achieve less in each individual reform element, they also followed
less comprehensive strategies overall.
SUCCESS AND FAILURE INS
Appendix 2.1 Refonns to Open SOE Markets to Competition and Introduce Hard Budget Constraints
This matrix defines the measures taken for market reform in our sample countries. Reforms are ranked by coun
try in relation to the degree of hardness in their budgets, and success is defined by the degree to which competition is
encouraged.
Better Performers
Chile-Year of Reform, 1974.
Market reforms: Removed all quantitative restric
tions on imports and reduced average nominal tar
iffs from 94 percent to 10 percent in five years. (Tar
iffs have subsequently risen slightly.) SOE product
markets almost totally deregulated by 1978. Priva
tized all competitive SOEs except in mining.
Mexico-Year of Reform, 1983.
Market reforms: Reduced tariffs from a maximum
100 percent to a maximum 20 percent and import
licensing requirements, which covered 83 percent of
imports in mid-1985, to 20 percent by 1988 and 9
percent by 1991. Price controls in most SOE sectors
reduced or abolished. Private entry allowed into sec
tors that were previously the preserve of state-owned
enterprises, such as petrochemicals, fertilizer, ports,
rail transport, and power. All but a few SOEs in com
petitive sectors were sold; exceptions are petroleum,
paper, and salt.
Republic of Korea-Year of Reform, 1982.
Market reforms: By 1985 had liberalized imports for
90 percent of its manufactured goods. However,
has relied more on export rivalry (requiring that
SOEs compete abroad) than on import competition
to spur SOE performance. Share of SOEs in manu
facturing and other competitive sectors reduced,
partly through sales and partly by restraining the
growth of SOEs in the face of rapidly expanding pri
vate enterprises.
Hard budget: Ended virtually all subsidies, transfers,
privileges, guarantees on lending. SOEs required to
pay dividends, in most cases 100 percent of profits.
Increasingly hard budget: Reduced operating subsi
dies to about 4 percent of sales in 1991.
Somewhat hard budget: Low operating subsidies, but
SOEs allowed to retain sizable earnings to reinvest
and government guaranteed loans.
97
TS IN BUSINESS
Mixed Performers
Egypt-Year of Refonn, 1990.
Market reforms: Reduced nontariff barriers from 25
percent in March 1990 to 9 percent by June 1991
(nontariff barriers for the private sector fell to 1 per
cent). Tariffs reduced from a maximum 120 percent
in 1990 to 70 percent by 1994, and SOE quotas on
foreign exchange ended in 1 991. Price controls being
phased out, as are SOE monopolies over distribution
of products such as cement and fertilizer. In 1992 Egypt had SOEs in such potentially competitive sec
tors as hotels, food products, textiles, tourism, build
ing materials, electric motors, and transport; SOEs
were responsible for dose to 60 percent of manufac
turing value added in 1992. Privatization has recently
begun to accelerate. Ghana-Year of Refonn, 1983.
Market reforms: Tariffs harmonized at 25 to 30 per
cent, but imports face higher sales taxes than domes
tic goods. Price controls still exist for some products
(e.g., textiles and wheat flour). Sold, leased, or liqui
dated forty-four SOEs by mid-1994 in competitive
sectors but has retained some competitive firms, es
pecially in transport.
Philippines-Year of Refonn, 1986.
Market reforms: Removed quantitative restrictions on
trade and began to ease restrictions on entry. Average
nominal tariffs have declined from about 43 percent in
1980 to just over 5 percent in 1991, but foreign ex
change controls were liberalized only in 1992. Has few
SOEs in competitive markets and has sold, or plans to
sell, all manufacturing SOEs except a petroleum refinery.
Poor Performers
Senegal-Year of Refonn, 1986.
Market reforms: Reduced and rationalized tariffs and
removed most quantitative restrictions between
98
Not yet a hard budget: Subsidies and transfers being
phased out, but SOEs have had easy access to over
drafts and foreign credits and government has peri
odically written off arrears. Past policies of allowing
money-losing SOEs to subsist on bank debt have
weakened the impact of competition on SOEs; it is
too early to tell how the recent reforms will play out.
Not a hard budget: Has curbed operating subsidies,
but SOEs have had preferences in bidding, reduced
taxes, and priority access to credit from government
owned financial institutions. Little to no systematic
monitoring of credit to SOEs, and nonpayment has
been a serious problem.
Not a hard budget: Transfers and subsidies have been
large, averaging almost 25 percent of SOE sales in the
second half of the 1980s.
Not a hard budget: Began to end direct operating subsidies in mid-1980s, stopped guaranteeing SOE
1986 and 1988 and removed price controls on most
products in 1987; but some of these reforms were
subsequently reversed in the late 1980s. As a result,
average effective rate of protection fell from 165 per
cent in 198 5 to 90 percent in 1988 but rose again to
98 percent in 1990. Has relatively few manufactur
ing SOEs; most of its SOEs in competitive markets are
in services, such as transport or tourism. Between
1980 and 1991 divested about four dozen small
SOEs in banking, hotels and tourism, and agricul
ture, privatizing twenty-six and liquidating twenty
one. But state-owned enterprises remain active in
several potentially competitive sectors, including ed
ible oils, textiles, tourism, and transport.
India-Year of Reform, 1985.
Market reforms: Allowed private investment in previ
ously restricted sectors and delicensed some imports.
However, although reduction in coverage of open
general licenses raised import penetration rates in
1980s in intermediate materials and capital equip
ment, products mainly produced by SOEs, subse
quent analysis showed that only about 5 percent of
imported products were in direct competition with
domestic production. Reforms deepened with deval
uations of the exchange rate in mid-1980s and
1991, reduction of quantitative restrictions, and
adoption of a liberalized system for managing the
exchange rate in 1991. Price controls and restric
tions on private investments are being phased out
(for example, a list of industries reserved for SOEs has
been reduced to six: armaments, atomic energy, coal,
mineral oils, other minerals of use in atomic energy,
and rail transport). Many SOEs in competitive sec
tors; SOEs responsible for over 18 percent of manu
facturing in 1989.
Turkey-Year of Reform, 1980.
Market reforms: Quantitative restrictions reduced
and import tariffs cut, further cuts in 1984. In 1990,
import licenses abolished. However, import levies
SUCCESS AND FAILURE IN SOE
borrowing, and abolished SOE preferential interest
rates in 1990. However, SOEs have had many indi
rect subsidies, such as overdrafts and arrears, tax ex
emptions, and deferments. Cross debts with govern
ment and other SOEs periodically written of£
Not a hard budget: Loss-making SOEs subsidized-as
are loss-making private firms-although subsidies
are declining. Government equity support and loans
are scheduled to decline. SOEs have enjoyed privi
leges that private firms did not. For example, until
1992 SOEs enjoyed a 10 percent price preference
over their private competitors in government pro
curement; since 1992 SOEs get preference if their bid
is equal to a private bidder (this scheme to be abol
ished in 1995). SOEs rely heavily on subsidized bor
rowing from state-owned banks with government
guarantees to cover s-r deficit.
Not a hard budget: SOEs that have trouble competing
subsidized. SOEs received equity injections, pay
ments for losses from noncommercial objectives,
99
'!:SIN BUSINESS
on goods competing with SOEs raised from 7.4 per
cent in 1984 to 12.5 percent in 1988, offsetting
much of effect of earlier tariff reductions. Nontariff
barriers also introduced, such as quality control on
steel. In 1984 lifted official price controls on all but
six commodities; abolished legal monopolies in
sugar, tea, tobacco, alcohol, and fertilizer distribu
tion. Sold some competitive SOEs but continues to
own SOEs in such activities as textiles, paper and
printing, fertilizer, and electronics.
Transition Economies
Czech Republic-Year of Reform, 1991.
Market reforms: Liberalized most prices by 1992,
made currency convertible and pegged to a basket,
reduced average tariff to 5 percent, and eliminated all but a few quantitative restrictions. Domestic entry
controls relaxed.
Poland-Year of Reform, 1989.
Market reforms: Ninety percent of all prices decon
trolled by January 1990, made currency convertible
(crawling peg), and reduced average tariffs to 18
percent. (They have subsequently risen somewhat.)
Eliminated quantitative restrictions on imports. Re
moved most restrictions on entry.
China-Year of Reform, 1979.
Market reforms: Gradually liberalized trade, decen
tralizing from twelve or so foreign trade corpora
tions to over 3,500 state-owned companies. Two
tier foreign exchange market developed, and
devaluations have shrunk the parallel premium (to a
low of 10 percent by 1991). Import controls remain
and tariff rates still high for many SOE products.
Prices liberalized; market prices now play central
role in allocating resources. Competition high in ac
tivities where nonstate sector active.
roo
and "aid" to cover losses that equaled 3 percent of
GOP in 1993. SOEs also receive government guaran
tees for foreign borrowing and loans and rediscounts
from central bank. SOEs run up arrears to the trea
sury, social security administration, commercial
banks, and suppliers.
Increasingly hard budget: Most budgetary subsidies
eliminated by 1991 and privatized enterprises now have to seek credit on commercial terms.
Increasingly hard budget: Budgetary subsidies elimi
nated after 1990. Moved to positive real rates; intro
duced incentives to subject SOE credit decisions to
commercial criteria and motivate banks to push
SOEs to restructure. (See box 2.9 in text.)
Not a hard budget: Losses, at 2.4 percent of GOP, are
financed through budget subsidies and the banking
system.
SUCCESS AND FAILURE INS
Appendix 2.2 Financial Sector Reform
This comparison of financial reforms in our sample shows that the better peiformers strengthened their financial
systems' ability to allocate capital on a commercial basis, to mobilize savings for investment, and to assess which en
trepreneurs would repay loans.
Better Performers
Chile-Period of Reform, from 1974. Financial liber
alization started in 197 4 with interest rate liberal
ization. Banks were privatized (1975-77). Entry
restrictions were relaxed, credit ceilings were elimi
nated, permitted scope of activities expanded.
Pension funds were privatized in 1980. Restrictions
on foreign capital inflows were gradually lifted in
1977, and capital account was completely liberal
ized in 1980. Financial crisis came in 1982, and the
government had to clean up and bail out the banks.
After the crisis, prudential regulation and supervi
sion were strengthened, culminating in the passage
of a new banking law in 1986. Mexico-Period of Reform, from 1988. Financial sec
tor reform started in 1988 with liberalization of
interest rates. Exchange controls were abolished,
forced investment in government securities was
eliminated, and most of the restrictions on commer
cial bank activity were lifted during 1989. Regu
lation and supervision were strengthened during
1989-90. Banks' privatization started in 1991 and
was completed in 1992. Republic of Korea-Period of Reform, from 1980. A
gradual reform started in 1980. Deposit rates were
partially liberalized to establish positive real rates.
Preferential lending rates were abolished in 1982. Privatization of the state-owned city banks started
in 1982 and was completed by 1983. Restrictions
on nonbank financial institutions were relaxed.
New domestic entry into the financial system was
allowed. A gradual opening up to international
competition started. Capital markets were also grad
ually opened to foreign participation. Lending rates
were officially deregulated in 1988. In 1991 govern
ment announced a plan to completely deregulate
money market and deposit rates by 1997.
Mixed Performers
Egypt-Period of Reform, from 1992. Financial sector
reform only started in 1992. Interest rates were lib
eralized, and prudential regulation and supervision
were strengthened. Banks were recapitalized, and
entry barriers were relaxed. In 1993, one private/
state-owned joint-venture bank was privatized.
Ghana-Period of Reform, from 1987. The financial
reform initiated in 1987 included a strengthening
of the regulatory framework, liberalization of gov
ernment controls, and bank restructuring. Interest
rates were liberalized in 1988. 1989 banking law
strengthened bank regulation and supervision. In
1990, banks were restructured, and government
announced plans to privatize banks in 1993. Philippines-Period of Reform, from 1980. Financial sec
tor reform focused on strengthening the banking sys
tem, reducing taxation, and increasing competition.
Banks were allowed to expand into new areas of activi
ty, and loan and deposit rates were freed. The share of
state-owned banks in total banking assets was reduced
from 28 percent in 1980 to 1.4 percent in 1990.
101
IN BUSINESS
Poor Perfonners
Senegal-Period of Reform, from 1989. Financial
reform program started in 1989 and included
restructuring of state-owned banks, increasing capi
tal requirements, and improving banking supervi
sion. Government ownership in each bank was
decreased to less than 25 percent.
India-Period of Reform, from 1992. Financial sector
reform started quite late, in 1992. Entry and expan
sion conditions have been made less restrictive.
Interest rates on term loans and most debt instru
ments were recently decontrolled and increased. Reform efforts to improve prudential and regulatory
102
environment, to recapitalize weak institutions, and
to promote greater private sector participation and
further financial policy liberalization are continuing.
Turkey-Period of Reform, from 1980. Financial sec
tor reform started with interest liberalization on
deposit and loan rates in 1980. Commercial banks
were deregulated, and foreign bank entry was
allowed. Financial crisis came in 1982. Interest ceil
ings were reimposed, and a deposit insurance
system was established. Later reforms emphasized
prudential regulation and improved supervision,
leading to a new banking law in 1985. Interest rates
were partially liberalized in 1988. Recently several state-owned banks were slated for privatization.
Notes
1. Even though SOE reform also has macroeconomic effects, we chose to focus on its microeconomic results since these are more clearly outcomes of the reform measures.
2. Specifically we used the ratio of operating surplus (or quasi rents) and before-tax profit to sales for 1980-91. Sales are used in the denominator as a proxy for revalued capital because consolidated capital stock for SOEs was not available for all countries. Not all countries have data for all indicators for all years in the period; see footnotes to graphs for specifics. Operating surplus is defined as operating revenues (principally sales) minus operating expenditures (wages, intermediate inputs, and other costs of operation) and is gross (i.e., depreciation is not included as an operating expenditure). Profits before taxes is defined as the operating surplus net of depreciation and interest expenses, plus nonoperating revenue minus nonoperating expenses.
3. Real variable unit costs are estimated as the ratio of total real variable costs (i.e., the cost of labor and intermediate inputs) to real output, expressed in constant 1985 prices. A decline in the real variable cost per unit of output over time implies improved productivity, other things being equal. Also, lower real variable cost per unit of output in country A compared with country B implies that SOEs perform better in country A than in country B.
TFP is estimated as TFP = QIV
where Q is a quantity index of all outputs and Vis a quantity index of all inputs (including labor, intermediate inputs, and capital). In the absence of information on capital stock in all countries, the cost of capital was measured by the sum of interest and depreciation. A TFP ratio greater than one means that more real output is produced than real outputs used. An increase in TFP over time means that more real output is produced with the same level of real inputs (or the same level of output is produced with fewer inputs). And, a higher level ofTFP in absolute terms in country A compared with country B means that SOEs are more productive in country A than in country B.
SUCCESS AND FAILURE IN SOE
Outputs and inputs were disaggregated into major items and deflated by specific price indexes wherever possible, or by relevant general price indexes where specific indexes were unavailable. For example, wages were deflated by wage indexes where available; otherwise by the CPl.
As calculated, unit variable cost and TFP have to be interpreted with caution. Because they are derived in part using general price indexes, the deflators may or may not coincide with the changes in the prices of SOE outputs and inputs. To the extent that SOEs selling prices fall behind these general indexes, real variable unit costs and TFP will underestimate productivity and vice versa.
4. If we exclude Chile's large copper company, CODELCO, from the analysis, Chile's ranking does not change. If we exclude Ghana's Cocoa Marketing Board, however, Ghana falls into the poor-performing group. PEMEX, CODELCO, and the Cocoa Marketing Board were included in the calculations for figures 2.1 to 2.3.
5.The ranking for real variable costs per unit changes when we exclude these large SOEs where savings in international prices might skew results. Excluding Mexico's oil company PEMEX and Ghana's Cocoa Marketing Board causes Mexico to become a mixed performer and Ghana to fall into the lowest performing category. Excluding Chile's state-owned copper industry, CODELCO, does not change Chile's rank.
6. These findings are consistent with other studies analyzing changes in SOE productivity in the sample countries over time or in comparison with the private sector. See, for example, Dekle and Sokoloff (1990) for Korea, and Martin del Campo and Winkler (1991) for Chile and Mexico. The ranking does not change if we exclude the large exporting SOEs such as CODELCO.
7. Data limitations precluded the calculation ofTFP in Ghana.
8. For example, Chile divested its phone and power companies during this period . When the phone company and rwo of the power companies (CHILGENER and ENDESA) are excluded from the analysis, TFP increases rather than falls. (Mexico's sale of its phone company occurred too late to affect the period under consideration.)
103
TS IN BUSINESS
9. Countries within each subgroup are ranked alphabetically because data are not detailed enough to permit more specific rankings. Egypt is classified as a mixed performer despite its poor and deteriorating performance on three of the five indicators because of improvements resulting from reforms in 1991 that are too recent to be captured by our data.
10. One study estimates the negative impact of the collapse of Soviet and CMEA trade alone was in the range of 8.5 percent of GDP in the Czech Republic and 6.3 percent in Poland (Rosati 1993). See also Brada and King (1991).
11. See Gelb and Singh (1994) for a detailed analysis of the increasing differentiation between more and less successful firms in these countries. Microeconomic evidence is largely for Poland and is taken from Gelb, Jorgensen, and Singh (1992); Estrin, Schaffer, and Singh (1993); Pinto, Belka, and Krajewski (1992 and 1993); Dabrowski, Federowicz, and Szomberg (1992); Gora (1993); Schaffer (1993); Gomulka (1993); Dittus (1993); Estrin, Gelb, and Singh (1993); and Brada, King, and Ma (1993).
12. SOEs responded to the opening of markets by creating sales departments, setting up distributorships, and searching for foreign partners with marketing expertise (Gelb, Jorgensen, and Singh 1992; Estrin, Gelb, and Singh 1993). They introduced cost accounting, profit centers, management information systems, and improved financial management in general. In Poland a number of managers have been replaced and are earning higher salaries linked to company performance (Gelb, Jorgensen, and Singh 1992).
13. See Sachs and Woo (1993), 22, table 6. See also box 2.1 in this chapter for ownership types in China.
14. Losses may be underreported due to accounting practices; some estimates place actual losses almost twice as high as those reported (Gelb and Singh 1994, 24-25).
15. Jefferson, Rawski, and Zheng (1992) found that TFP for the state sector grew by 2.4 percent a year from 1980 to 1988, while for the collective sector (of which TVEs are the largest part) it rose at an annual rate of 4.6
104
percent. Xiao, using a smaller sample for 1980-85, found TFP growth was 4 percent for SOEs and 8.8 percent for TVEs. Even when allowances are made for differences in starting point, size, type of industry, and institutional factors, TVE had a significantly higher productivity growth Qefferson and Rawski 1992; Jefferson 1993). TFP levels comparable to the rest of the sample countries were not available.
16. Much of the actual privatizations in transitional economies have been spontaneous or unofficial; for example, SOE assets are sometimes leased to private businesses owned by SOE managers.
17. By mid-1993 some 100 SOEs had issued shares on the stock markets in Shanghai and Shenzhen, and sixteen were listed on foreign exchanges; a few SOEs have become limited liability companies whose shares are held by employees, local residents, or (much rarer) the general public. An estimated 1 0 percent of SOEs have been leased to individuals, collectives, and local governments. Mergers and takeovers are an allowed form of exit, but the number of mergers is very small compared to the total number of SOEs (Gelb and Singh 1994, 23; Bank staff estimates).
18. See box 2.4 for a description of ownership types.
19. From 1989 to 1991 the number of sole proprietorships grew from by 78 percent to 1.42 million, private firms quadrupled (to 45,000), joint ventures grew tenfold (to almost 5,000), and cooperatives went from 15,000 to 17,000. While many new private enterprises are small trading firms, the number of industrial companies is also expanding (by 35 percent in 1992). These manufacturing firms are small: 60 percent had fewer than twenty employees in 1991 (Webster 1993).
20. We only consider competition in product markets. Competition for corporate control (through takeovers, for example) can also have incentive effects on firms.
21. Chile privatized most of its state-owned enterprises between 197 4 and 1978, but many of these firms were acquired by banks when they defaulted on their loans. When the banking crisis hit in 1981-83, the gov-
ernment "intervened" in the banks and resold both the enterprises and the banks from 1985 to 1989. The few SOEs that remain are in water and sewage, copper and coal mining, petroleum, railways, the Santiago metro, and shipping.
22. Products include paper, cement, iron, coal, fertilizer, sugar, meat, tea, and copper (World Bank 1993).
SUCCESS AND FAILURE IN SOE
23. The phrase "hardening the budget constraint" was coined by Janos Kornai (1980).
24. In the first half of 1993, industrial investments grew by 71 percent and SOEs accounted for 62 percent of these investments-a clear case of industrial credits not going to the most productive sectors of the economy.
105

•. ) 1 CHAf"PTER 3
Contracting: What Works, What Doesn't, and Why
N CHAPTER 2 WE FOUND THAT COUNTRIES THAT REFORMED
their state-owned enterprises successfully and those that did
not both attempted to change the relationship between the
government and SOE managers. Successful and unsuccessful
reformers alike introduced new oversight bodies and, on paper
at least, expanded managers' power over pricing, procurement,
production, and personnel. Most also adopted explicit, performance
based agreements with SOE managers. Many countries have attempted
such reforms, but only a few have improved SOE performance. Do
differences in the design and implementation-in particular, the ways
that reforms affected incentives of the government and firm managers
help explain the differences in outcome?
To find out, we analyzed relationships between governments
and SOE managers, between government and private managers of
state enterprises, and between governments and the owners of reg
ulated monopolies. Each of these relationships is founded on a
contract, that is, an agreement between the government and an
other party based on shared expectations about obligations and
outcomes. These contracts are often written, although they need
not be, and in fact we found that even when contracts are written,
crucial provisions affecting incentives are frequently only implicit.
We identified three types of contracts important to state-owned
enterprise reform:
• Performance contracts define the relationship between govern
ment and public managers; we found over 550 such contracts
in thirty-two developing countries, and more than 100,000 in
China.
107
SIN BUSINESS
I08
• Management contracts define the relationship when government
contracts management of the firm to private managers; we
found 202 management contracts in forty-nine developing
countries.
• Regulatory contracts define the relationship between a govern
ment and a regulated monopoly. Such contracts may include
explicit agreements about pricing or performance and implicit
expectations about, for example, the powers of regulators. Regu
latory contracts are being increasingly used as monopolies in
telecoms, electricity, and transport are privatized; we found
seven such contracts for basic telecoms service, the sector we
investigated.
It will be immediately apparent that formal contract arrangements
have been established for only a small proportion of the SOEs worldwide;
however, countries often use contracts for important and problematic
activities, such as infrastructure monopolies (electricity, water, and tele
coms) and major exporters and revenue earners (tea in Sri Lanka, gold
in Ghana, and hotels in Egypt). Moreover, the use of contracts has been
increasing and is likely to continue to grow as governments, recognizing
the costs of poor SOE performance, attempt various remedies. Yet little is
known empirically about what distinguishes successful from unsuccessful
contracts or what type of contract works best in which circumstances. As we shall see, the findings of this chapter, the first systematic, empirical
evaluation of the three main forms of SOE contracting worldwide, form a
crucial component of our recommendations in chapter 5 about the de
sign and implementation of a successful SOE reform strategy.
We begin by surveying three factors that determine the incentives
that contracting parties face: information, rewards and penalties, and
commitment. 1 Next we analyze available data for the three types of con
tracts, moving from contracts with the greatest degree of government in
volvement to the least. We find that, in general, the greater the involve
ment of the private sector, the better enterprise performance. We argue
that this is because private managers and owners, unlike public man
agers, can readily capture the returns when enterprise performance im
proves. They therefore have greater incentives than public managers to
exert effort to improve performance and to enter into contracts only
when government manifests credible commitment to keeping its side of
the bargain.
CONTRACTING: WHAT WORKS, WHAT DOESN'T,
How Incentive Factors Interact to Influence Outcomes
BEFORE INDIVIDUALLY CONSIDERING THE THREE INCENTIVE
factors-information, rewards and penalties, and commitment-it
is useful to sketch the relationship between them. Information prob
lems arise because contracting agents (government on one hand and pub
lic or private managers or owners of a monopoly on the other) have differ
ent sets of information; thus, each side can use the information it holds
exclusively to improve its position at the expense of the other. At the same
time, neither side knows everything, so it is impossible to design a contract
that will cover all eventualities. To alleviate the information problems, con
tracts usually include promises of rewards and penalties to induce the con
tracting parties to reveal information and comply with contract provisions.
But promises of rewards and penalties alone are not enough. Each party
needs to be convinced of the commitment of the other to deliver.
Thus, like a chain with three strong links, contracts that include effective mechanisms to handle problems arising from information, rewards and penalties, and commitment are more effective than those with one or more weak links in attaining the desired outcome-improved enterprise performance.
Addressing Information Problems
How do information problems arise, and how can they be addressed? En
terprises have a great deal of information-for example, about input costs,
demand, and productivity-that the government supervisory or regulatory
body lacks. Moreover, these government bodies cannot know everything
about how a firm performs. These two problems-information asymmetry
and imperfect observability of performance-give company managers the
leeway to pursue interests that are at odds with the government's interests.
Of the various mechanisms to reveal information, competition is the
most effective and least expensive. Competition can uncover informa
tion in a variety of ways, as we discussed in chapter 2, thus strengthen
ing the government's hand. Competition also helps to align the in
centives of the contracting parties with the desired outcome-more
efficient performance. If technology or other factors do not permit direct
competition in product markets, governments can adopt other mecha
nisms to introduce competitive pressures. These include the following:
I09
;RATS IN BUS I N E S S
IIO
• Yardstick competition. Comparing the performance of two or more
regional monopolies operating in similar environments gives gov
ernments a way to assess the performance of firms. For example,
the Argentine government broke its telecom monopoly into two
regional monopolies, north and south, that can now be compared.
• Auctions. When competing interests bid for the right to provide
goods or services, the government obtains information that can be
incorporated into the contract. For example, the management
contract for water supply in Guyana was awarded to the bidder of
fering the lowest prices for each new water connection and cubic
meter of forecast water sales.
• Threat of competition. After the contract is awarded, the threat of
competition can help induce the contractor to operate efficiendy.
For example, the monopoly on basic phone service enjoyed by the privatized Mexico telephone company will end in 2026, but it
could be ended sooner if the company fails to meet its perfor
mance targets under the contract.
Designing Rewards and Penalties
For a contract to improve performance, it must include rewards and
penalties that persuade management and government not to use infor
mation opportunistically, bur rather to strive toward the contract goal
of improving firm performance.
The importance of rewards and penalties for managers is obvious and
widely understood. These may take the form of bonus schemes (for pub
lic managers), contracting fees (for private managers), or price adjust
ments (for private owners of regulated monopolies). They work best when
improvements in performance are clearly linked to higher rewards, while
failure to improve, or a deterioration in performance, is punished by cut
ting or withholding rewards. Some contracts incorporate more effective
rewards and penalties than others. For example, the contract for the Cairo
Sheraton promises management success fees that are paid only when the
hotel makes a profit. In contrast, the contract for Nwia Sugar mill in
Kenya provides the contractor a fixed fee that covers all costs; there are no
penalties for poor performance and no rewards for good performance.
The need for rewards and penalties to motivate government compli
ance with contracts is often overlooked, but governments, responding
to diverse and contradictory demands, behave in ways that reduce firm
CONTRACTING: WHAT WORKS, WHAT DOESN'T,
efficiency; for example, governments often prohibit SOEs from shed
ding excess workers or require that they purchase inputs from other
SOEs, even when these are not priced competitively. As we explain
below, lack of effective rewards and penalties to ensure government
support for the goal of improved firm performance leads to problems
of commitment. For example, governments may be less motivated to
adhere to the contract if they are not risking their reputation with im
portant constituents or risking adverse press reports.
Ensuring Commitment
The third factor, commitment, arises because it is impossible to in
clude all possible contingencies in the contract. The rewards may look
good, but what assurances do contracting parties have that they will be
forthcoming? Commitment problems are particularly acute with con
tracts governing SOEs and regulated monopolies, because it may be dif
ficult or impossible to find a neutral third party with the power to com
pel the government (or its successor) to meet its promises. Faced with
such a situation, management may protect its interests by taking ac
tions that work against the contract's objectives. Thus, a public man
ager who doubts that government will pay its bills may run up arrears
on government guaranteed debt or withhold payment from public sup
pliers. 2 For example, the government of Senegal failed to keep its
promise to pay Senegal Electricity for power and to force state-owned
electricity users to do the same; Senegal Electricity, in turn, ran up ar
rears with its suppliers and on taxes and government loans. In the case
of privatized, regulated monopolies, new buyers who doubt govern
ment commitment may withhold needed investments because they fear
that their assets will be expropriated. Such problems are difficult to
overcome and are, therefore, common in the contracts we examined.
One way to overcome these problems is to specify a neutral conflict
resolution mechanism, clarifying when and how it can be invoked and
how it will be enforced. Enforcing agencies may include the courts
(where they are strong and independent of politics), a new oversight or
regulatory commission, the executive branch, or outside arbitration.
International tribunals or arbitrators and donors who may withhold
funds if a government reneges can sometimes partly substitute for do
mestic mechanisms if the courts and other government bodies are per
ceived as biased or weak. Less formally, the press and informed public
III
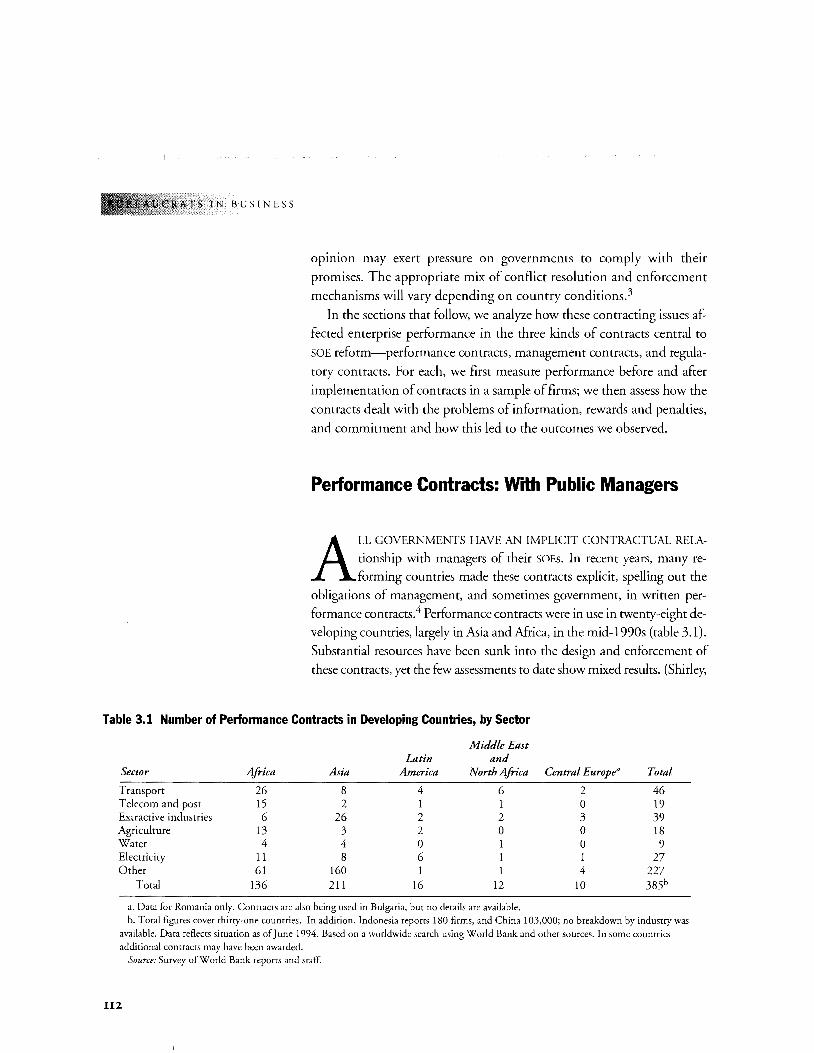
!!i~;~~aTS IN BUSINESS
opmwn may exert pressure on governments to comply with their
promises. The appropriate mix of conflict resolution and enforcement
mechanisms will vary depending on country conditions.3
In the sections that follow, we analyze how these contracting issues af
fected enterprise performance in the three kinds of contracts central to
SOE reform-performance contracts, management contracts, and regula
tory contracts. For each, we first measure performance before and after
implementation of contracts in a sample of firms; we then assess how the
contracts dealt with the problems of information, rewards and penalties,
and commitment and how this led to the outcomes we observed.
Performance Contracts: With Public Managers
ALL GOVERNMENTS HAVE AN IMPLICIT CONTRACTUAL RELA
tionship with managers of their SOEs. In recent years, many re
forming countries made these contracts explicit, spelling out the
obligations of management, and sometimes government, in written per
formance contracts. 4 Performance contracts were in use in twenty-eight de
veloping countries, largely in Asia and Africa, in the mid-1990s (table 3.1).
Substantial resources have been sunk into the design and enforcement of
these contracts, yet the few assessments to date show mixed results. (Shirley,
Table 3.1 Number of Performance Contracts in Developing Countries, by Sector
Sector Africa
Transport 26 Telecom and post 15 Extractive industries 6 Agriculture 13 Water 4 Electricity 11 Other 61
Total 136
Latin Asia America
8 4 2
26 2
3 2 4 0 8 6
160 1
211 16
Middle East and
North Africa
6 1 2 0
12
a. Data for Romania only. Contracts are also being used in Bulgaria, but no details are available.
Central Europe" Total
2 46 0 19 3 39 0 18 0 9 1 27 4 227
10 385b
b. Total figures cover thirty-one countries. In addition, Indonesia reports 180 firms, and China 103,000; no breakdown by industry was available. Data reflects situation as of]une 1994. Based on a worldwide search using World Bank and other sources. In some countries additional contracts may have been awarded.
Source: Survey of World Bank reports and staff.
II2
CONTRACTING: WHAT WORKS, WHAT DOESN'T,
1989, 1991; Nellis 1989; Trivedi 1990). We set out to assess whether ex
plicit performance contracts improve economic performance and the rea
sons for success or failure. First we examined the evidence from twelve case
studies on how performance contracts affect outcomes. As we shall see, the
empirical results suggest that explicit performance contracts have fre
quently been a waste of time and effort. When we considered why these
contracts so often failed to improve performance, we found that they gen
erally did not significantly improve incentives in the three crucial areas of
information, rewards and penalties, and commitment.
How Performance Contracts Perform
Did enterprise performance change in ways that can be attributed to the contract (or, more weakly, did enterprise performance change in
ways that mean the contract cannot be ruled out as an explanatory fac
tor)? We address this question by investigating performance before and
after implementation of contracts in twelve companies in six countries,
as shown in table 3.2 (Dyer Cisse 1994). (For ease of reading we have
used simplified enterprise names; see table 3.2.)
The available sample is small and not random, so care must be used
in generalizing from the results. 5 Also there are weaknesses in the data:
we relied on the firm's own audited accounts, which are weak in
Ghana and Senegal. In some cases our precontract period is short and
the length of the postcontract period varies, which makes it hard to
measure trends. 6 Even so, the sample does include countries at very
different levels of income that employed varying approaches to perfor
mance contracting. An improvement in postcontract performance
across such differing country and contract experiences would suggest
that contracts can work (unless some other factor was at work, some
thing we also investigated),?
To assess the companies' economic performance, we compared trends
in profitability (return on assets, or ROA), labor productivity (LP), and
total factor productivity (TFP) before and after the introduction of the
contract.8 To explore the underlying factors, we used a questionnaire
and interviews with people in the country and World Bank staff knowl
edgeable about the enterprises. Box 3.1 addresses concerns about the va
lidity of these measures.
Some readers may ask: "Why didn't you simply judge each firm's per
formance by its attainment of the economic targets specified in the con-
II3
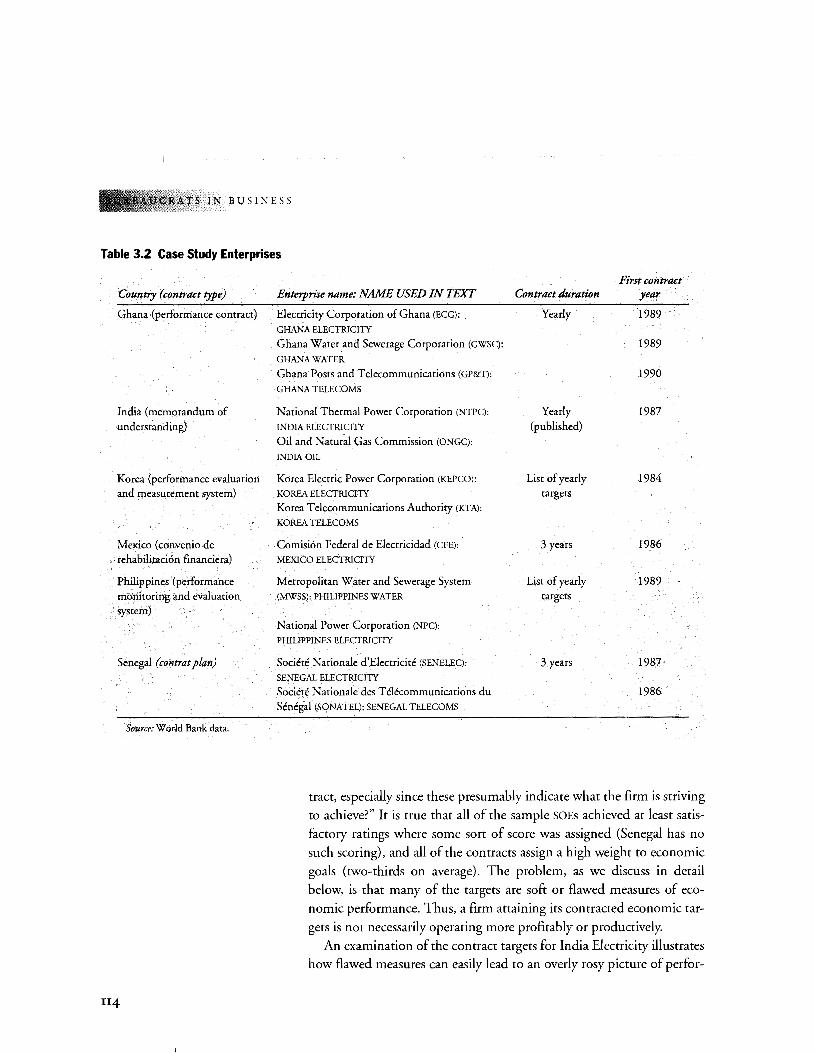
A.TS IN BUSINESS
Table 3.2 Case Study Enterprises
Country (contract type) Enterprise name: NAME USED IN TEXT Contract duration First contract
year
Ghana (performance contract) Electricity Corporation of Ghana (ECG): Yearly 1989
India (memorandum of understanding)
Korea (performance evaluation and measurement system)
Mexico (convenio de rehabilitacion financiera)
Philippines (performance monitoring and evaluation system)
Senegal (contrat plan)
Source: World Bank data.
Il4
GHANA ELECTRICITY
Ghana Water and Sewerage Corporation (GWSC):
GHANA WATER
Ghana Posts and Telecommunications (GP&T):
GHANA TELECOMS
National Thermal Power Corporation (NTPC):
INDIA ELECTRICITY
Oil and Natural Gas Commission (ONGC):
INDIA OIL
Korea Electric Power Corporation (KEPCO):
KOREA ELECTRICITY
Korea Telecommunications Authority (KTA):
KOREA TELECOMS
Comision Federal de Electricidad (CFE):
MEXICO ELECTRICITY
Metropolitan Water and Sewerage System (MWSS): PHILIPPINES WATER
National Power Corporation (NPC):
PHILIPPINES ELECTRICITY
Societt! Nationale d'Electricite (SENELEC):
SENEGAL ELECTRICITY
Societe Nationale des Telecommunications du Senegal (SONATEL): SENEGAL TELECOMS
Yearly (published)
List of yearly targets
3 years
List of yearly targets
3 years
1989
1990
1987
1984
1986
1989
1987
1986
tract, especially since these presumably indicate what the firm is striving
to achieve?" It is true that all of the sample SOEs achieved at least satis
factory ratings where some sort of score was assigned (Senegal has no
such scoring), and all of the contracts assign a high weight to economic
goals (two-thirds on average). The problem, as we discuss in detail
below, is that many of the targets are soft or flawed measures of eco
nomic performance. Thus, a firm attaining its contracted economic tar
gets is not necessarily operating more profitably or productively.
An examination of the contract targets for India Electricity illustrates how flawed measures can easily lead to an overly rosy picture of perfor-
CONTRACTING: WHAT WORKS, WHAT DOESN'T,
!-~~~ .. ;sO~AR~tmTHATSTAT&OWNW!tfliRPlUSESWBRBCRFATBD .. ·.. . 1 goals rather rb~tt ~~· pxofits .aud that theyshould b~.iudg¢d accordin:gty; Even t)y tih~ sta,ndar~ the th,ree indicators
assets; ~ ... p~duttivlty,. ~d .total ~r ~l~ute;o£ qi;m~.iu nrm perfor~
n~~i s~ we. ®1\0t co~~~.th~to an ~Jut¢: standard but to
mance improvements. In 1991-92, 30 percent of India Electricity's
score depended on the volume of electricity generated; output indeed
went up, but the use of material inputs rose even faster. The target was
flawed: it could be achieved by increasing inputs without any increase
indeed, even with a decrease-in the firm's efficiency. Thus, although
India Electricity achieved its target under the contract and received a
rating of excellent, total factor productivity actually fell below precon
tract levels. To varying degrees, all of the contracts in our sample in
cluded similarly flawed targets. Since our goal is to test whether the contracts improved SOE performance, we have therefore preferred the three
performance measures below.
Profitability. The profitability trends in our sample do not support the
notion that contracts improve performance. None of the twelve com-
II5
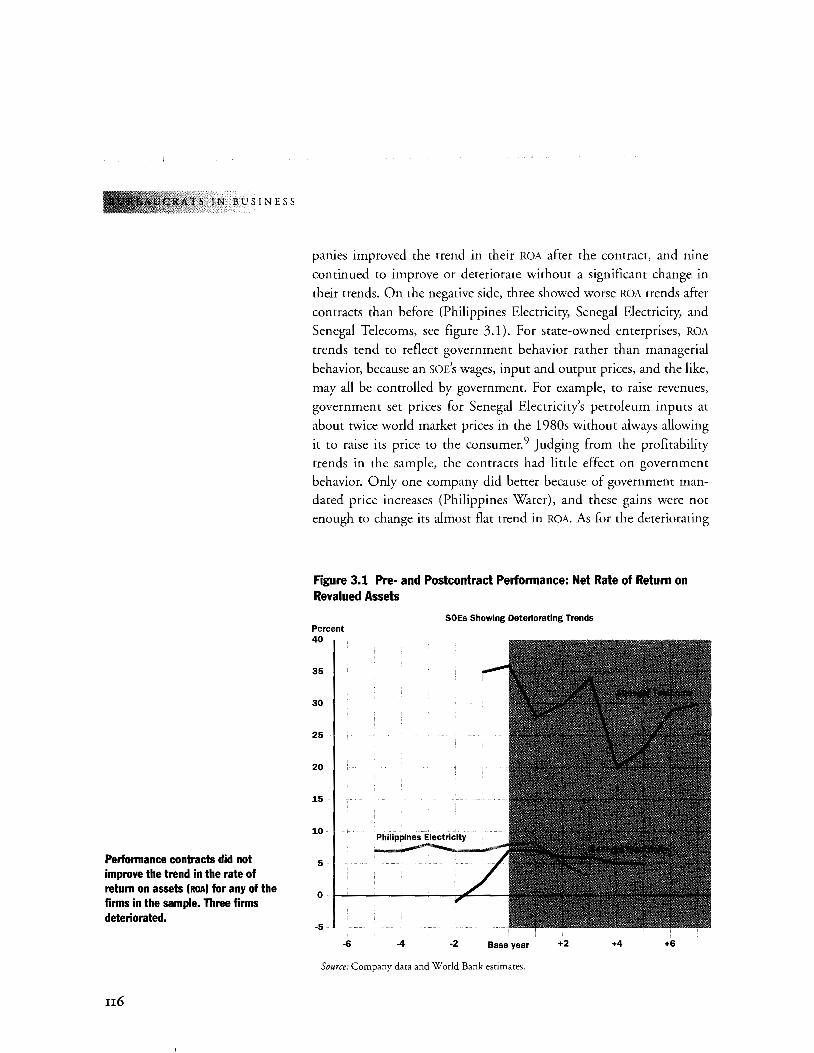
IN BUSINESS
Performance contracts did not improve the trend in the rate of return on assets (ROA) for any of the firms in the sample. Three firms deteriorated.
u6
panies improved the trend in their ROA after the contract, and nine
continued to improve or deteriorate without a significant change in
their trends. On the negative side, three showed worse ROA trends after
contracts than before (Philippines Electricity, Senegal Electricity, and
Senegal Telecoms, see figure 3.1). For state-owned enterprises, ROA
trends tend to reflect government behavior rather than managerial
behavior, because an soE's wages, input and output prices, and the like,
may all be controlled by government. For example, to raise revenues,
government set prices for Senegal Electricity's petroleum inputs at
about twice world market prices in the 1980s without always allowing
it to raise its price to the consumer.9 Judging from the profitability
trends in the sample, the contracts had little effect on government
behavior. Only one company did better because of government mandated price increases (Philippines Water), and these gains were not
enough to change its almost flat trend in ROA. As for the deteriorating
Figure 3.1 Pre- and Postcontract Performance: Net Rate of Return on Revalued Assets
SOEs Showing Deteriorating Trends Percent 40
35
30
25
20
15
10
5
0
-5
-6 -4 -2 Base year +2 +4 +6
Source: Company data and World Bank estimates.
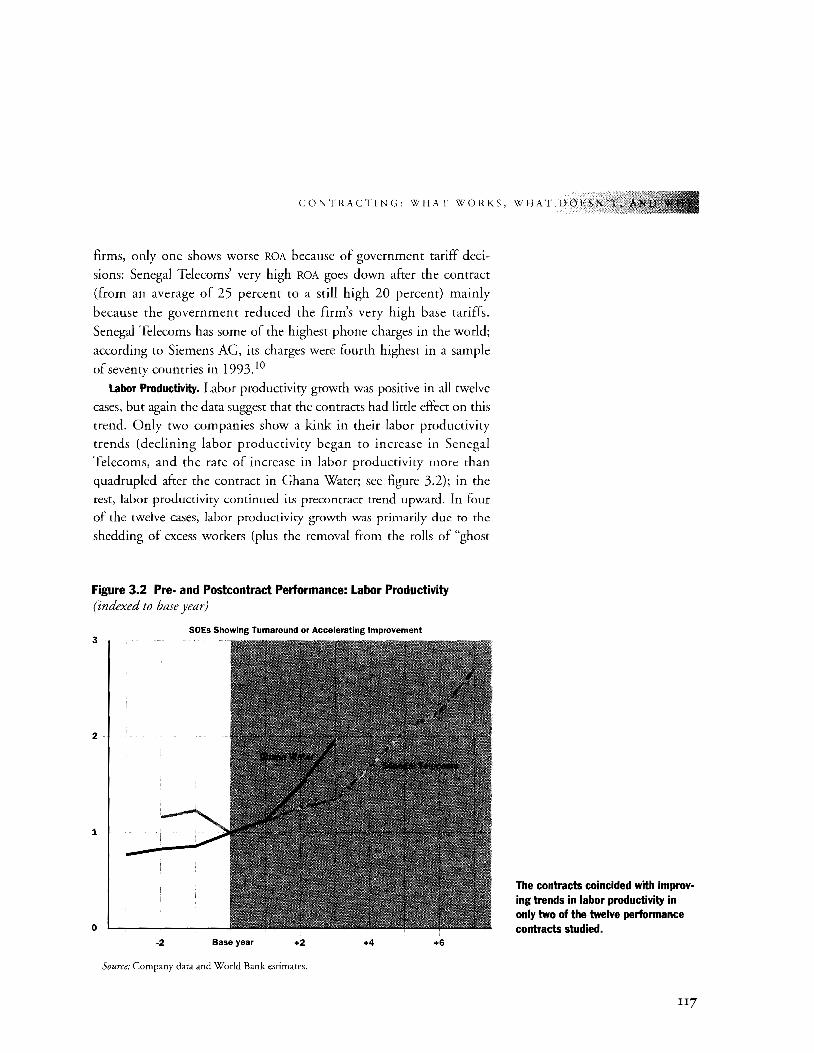
CONTRACTING: WHAT WORKS, WHAT DOESN'T,.
firms, only one shows worse ROA because of government tariff deci
sions: Senegal Telecoms' very high ROA goes down after the contract
(from an average of 25 percent to a still high 20 percent) mainly
because the government reduced the firm's very high base tariffs.
Senegal Telecoms has some of the highest phone charges in the world;
according to Siemens AG, its charges were fourth highest in a sample
of seventy countries in 1993.10
labor Productivity. Labor productivity growth was positive in all twelve
cases, but again the data suggest that the contracts had little effect on this
trend. Only two companies show a kink in their labor productivity
trends (declining labor productivity began to increase in Senegal
Telecoms, and the rate of increase in labor productivity more than
quadrupled after the contract in Ghana Water; see figure 3.2); in the
rest, labor productivity continued its precontract trend upward. In four
of the twelve cases, labor productivity growth was primarily due to the
shedding of excess workers (plus the removal from the rolls of "ghost
Figure 3.2 Pre- and Postcontract Performance: Labor Productivity (indexed to base year)
SOEs Showing Turnaround or Accelerating Improvement 3
2
1
0
·2 Base year +2 +4 +6
Source: Company data and World Bank estimates.
The contracts coincided with improving trends in labor productivity in only two of the twelve performance contracts studied.
II?
ATS IN BUSINESS
n8
workers"). In the rest, production gains outstripped employment
increases. These data suggest that there had been a change in govern
ment's labor practices in SOEs, but in most cases it preceded the contract.
Total Factor Productivity. Partial measures such as labor productivity
can be misleading: if labor productivity improved because the compa
ny increased output by using more material inputs, then the overall
efficiency of the firm has not improved. Total factor productivity mea
sures the efficiency with which all factors are used and is our most reli
able indicator of whether the contracts were associated with perfor
mance improvements.
Performance on TFP is mixed: in three of the twelve companies
(Ghana Water, Mexico Electricity, and Senegal Telecoms) declining TFP
began to increase after the contracts were introduced, while in six others
precontract trends continued upward. The three remaining firms (India Electricity, Philippines Water, and Senegal Electricity; see figure 3.3)
suffered a downturn in what had been an improving TFP trend, suggest
ing that, in these cases, the contracts may actually have contributed to a deterioration in performance.
Perfonnance Contracts Had Little Positive Impact
Our performance measures show that contracts had little positive im
pact on most of our sample (see figure 3.4). Total factor productivity is
the most reliable performance indicator we used; by that measure the
contracts seem to be doing as much harm as good. We assessed whether
the mixed and generally negative outcomes we measured could have
been determined by factors other than the contracts by checking for
major changes in markets, prices, natural or man-made disasters, and
the like during the period under investigation. In each case we con
cluded that exogenous factors did not rule out the contracts as a possi
ble source of performance changes. For example, we compared trends in
company TFP with trends in GOP growth and found no acceleration or
deceleration in growth (and thus demand) that could explain changes in
firm performance. Nor could we find any exceptional developments in
the companies' markets or major work stoppages that could fully ac
count for the results. In fact, exogenous factors seemed important in
only two cases-Philippines Electricity and Senegal Telecoms. Even for
these, however, their magnitude was not so large as to rule out the contracts as a significant explanatory factor. 11
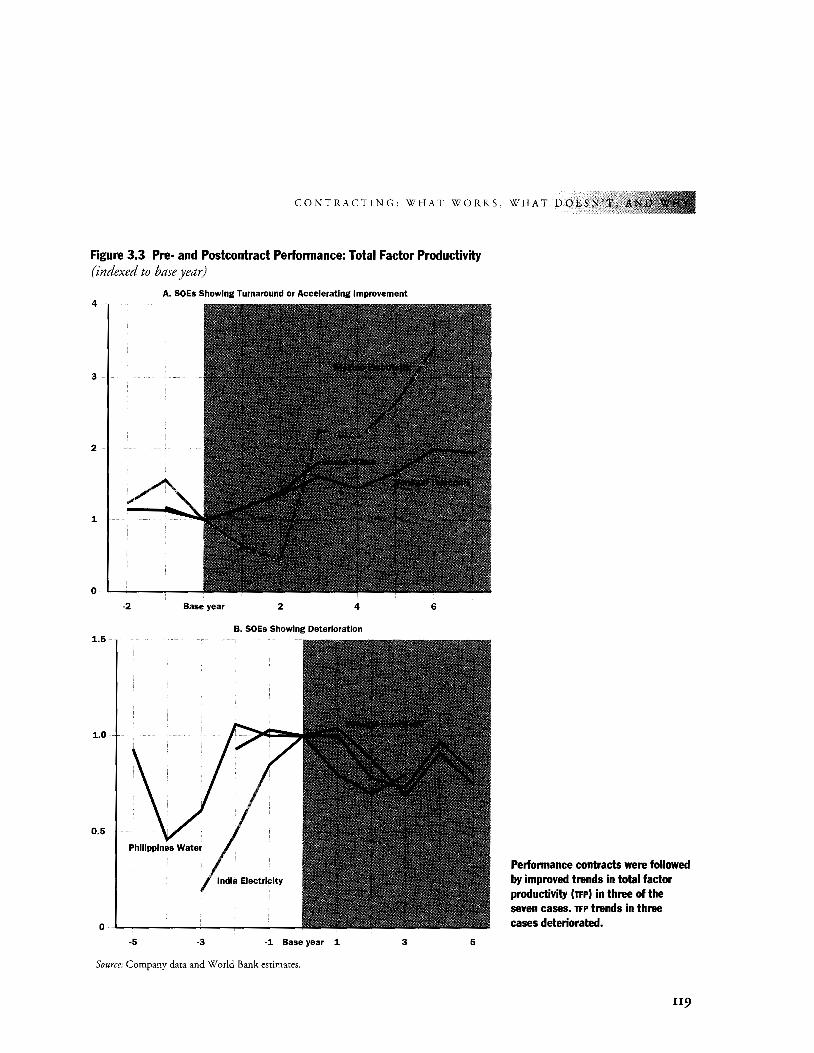
CONTRACT! N G: WHAT WORKS, WHAT DOESN'T
Figure 3.3 Pre· and Postcontract Performance: Total Factor Productivity (indexed to base year)
A. SOEs Showing Turnaround or Accelerating Improvement 4
3
2
1
0
-2 Base year 2 4 6
B. SOEs Showing Deterioration 1.5
1.0
0.5
0
-5 -3 -1 Base year 1 3 5
Source: Company data and World Bank estimates.
Performance contracts were followed by improved trends in total factor productivity (TFP) in three of the seven cases. TFP trends in three cases deteriorated.
119
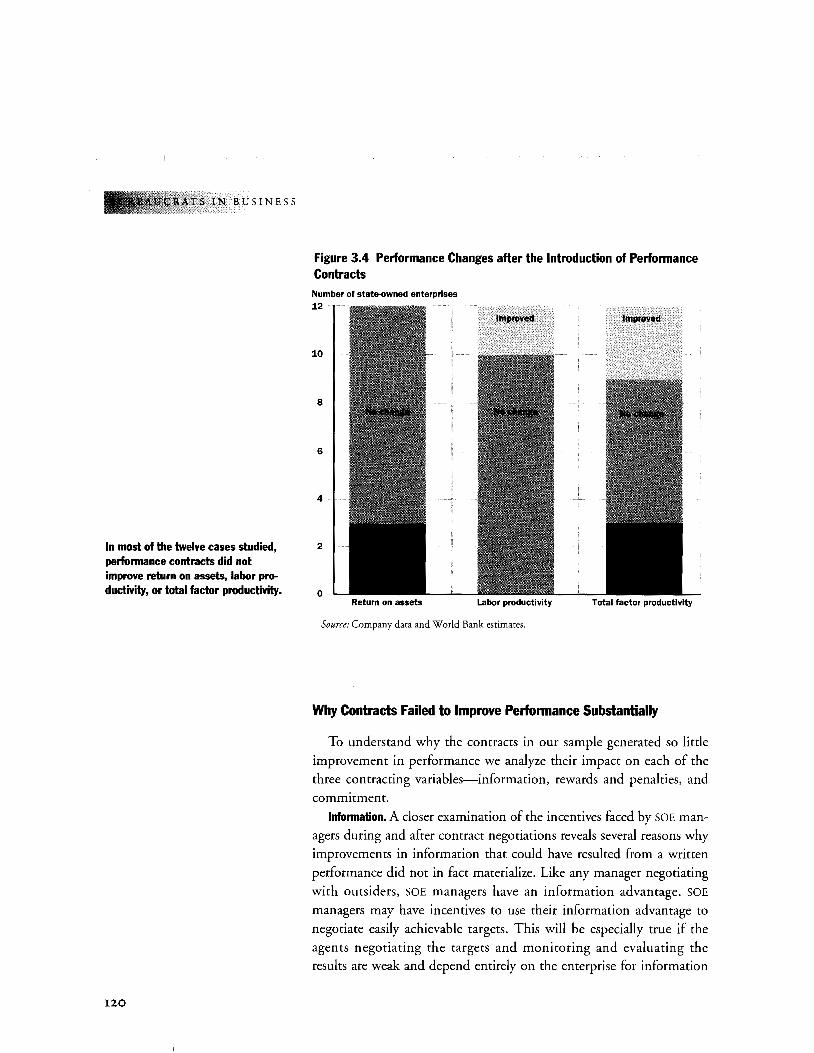
TS IN BUSINESS
Figure 3.4 Performance Changes after the Introduction of Performance Contracts Number of state-owned enterprises 12
Improved Improved
10
8
6
4
In most of the twelve cases studied, 2
perfonnance contracts did not improve return on assets, labor pro· ductivity, or total factor productivity. 0
120
Return on assets Labor productivity Total factor productivity
Source: Company data and World Bank estimates.
Why Contracts Failed to Improve Performance Substantially
To understand why the contracts in our sample generated so little improvement in performance we analyze their impact on each of the three contracting variables-information, rewards and penalties, and commitment.
lnfonnation. A closer examination of the incentives faced by SOE managers during and after contract negotiations reveals several reasons why improvements in information that could have resulted from a written
performance did not in fact materialize. Like any manager negotiating
with outsiders, SOE managers have an information advantage. SOE
managers may have incentives to use their information advantage to
negotiate easily achievable targets. This will be especially true if the agents negotiating the targets and monitoring and evaluating the results are weak and depend entirely on the enterprise for information
CONTRACTING: WHAT WORKS, WHAT DOESN'T,
on its performance. Under such circumstances, managers have an
incentive to negotiate easily attained targets; they may also seek
numerous and changing targets, since this maximizes their information
advantage by forcing government monitors to learn many new and dif
ferent indicators. Each time a new criterion is added, monitors must
decide on the criterion value-what constitutes a good, fair, or poor
performance. Learning which values are hard and which are soft is
more difficult when the criteria are constantly changing.12
The government agents in our sample often operated at a disadvan
tage. They were usually middle- or low-level civil servants while the
SOE's representatives tended to be better paid and have higher status.
One expert who advised Ghana on SOE contracts observed that the SOEs
were often represented by a managing director with status similar to a
cabinet minister (and even better pay), while the government supervi
sory agency was usually represented by a low-level functionary. 13
Asymmetry in the status of the negotiators was aggravated in some of
our sample contracts, because the agencies responsible for negotiating
targets and monitoring and evaluating results were weakened by fre
quent changes in responsibilities and authority. For example, the agency
negotiating, monitoring, and evaluating contracts in Senegal has moved
twice since contracting began (from the president's office to the prime
minister's office to the ministry of finance). According to field inter
views, these moves diluted its authority vis-a-vis the enterprises; respon
dents to our survey (in both the SOEs and the government) said that the
evaluations in Senegal are largely done by the firms themselves. Similar
changes undermined the authority of monitoring agencies in the Philip
pines (where the agency also has a high rate of staff turnover) and
Ghana. 14 Poor data further disadvantaged the government actors. For
example, the monitors in Ghana rely on evaluations by the firms them
selves, and the information they receive from the firms is usually late
and unreliable. In 1991, twelve of the seventeen SOEs that the State En
terprise Commission (SEC) monitored were seven weeks late in deliver
ing their 1990 fourth-quarter results. Only five of the firms had current
audited accounts; the most recent audited accounts for the others
ranged from one to three years old (State Enterprises Commission
1991). In contrast, the contracts in India, Mexico, and Korea were mon
itored by stronger, more stable agencies. In Korea the strength of moni
toring was enhanced by the use of outsiders, something we explore
below under commitment.
121
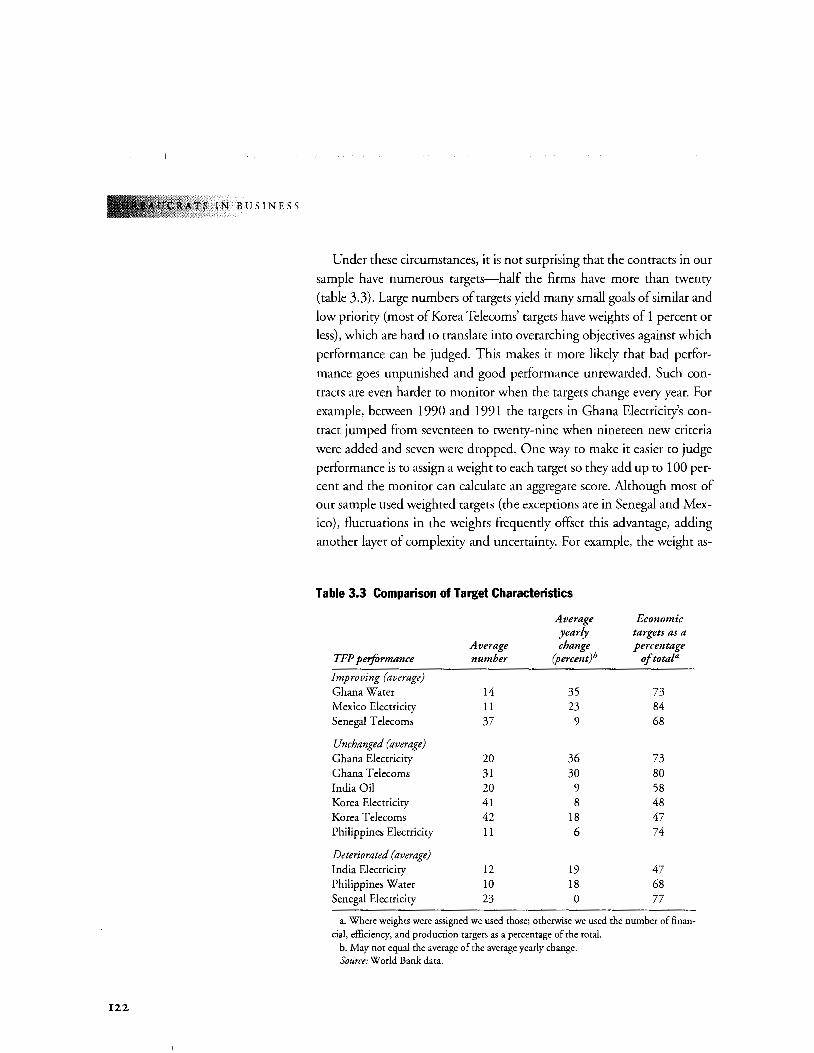
.TS IN BUSINESS
122
Under these circumstances, it is not surprising that the contracts in our
sample have numerous targets-half the firms have more than twenty
(table 3.3). Large numbers of targets yield many small goals of similar and
low priority (most of Korea Telecoms' targets have weights of 1 percent or
less), which are hard to translate into overarching objectives against which
performance can be judged. This makes it more likely that bad perfor
mance goes unpunished and good performance unrewarded. Such con
tracts are even harder to monitor when the targets change every year. For
example, between 1990 and 1991 the targets in Ghana Electricity's con
tract jumped from seventeen to twenty-nine when nineteen new criteria
were added and seven were dropped. One way to make it easier to judge
performance is to assign a weight to each target so they add up to 100 per
cent and the monitor can calculate an aggregate score. Although most of
our sample used weighted targets (the exceptions are in Senegal and Mex
ico), fluctuations in the weights frequently offset this advantage, adding
another layer of complexity and uncertainty. For example, the weight as-
Table 3.3 Comparison of Target Characteristics
Average Economic yearly targets as a
Average change percentage TFP performance number (percentJb oftotala
Improving (average) Ghana Water 14 35 73 Mexico Electricity 11 23 84 Senegal Telecoms 37 9 68
Unchanged (average) Ghana Electricity 20 36 73 Ghana Telecoms 31 30 80 India Oil 20 9 58 Korea Electricity 41 8 48 Korea Telecoms 42 18 47 Philippines Electricity 11 6 74
Deteriorated (average) India Electricity 12 19 47 Philippines Water 10 18 68 Senegal Electricity 23 0 77
a. Where weights were assigned we used those; otherwise we used the number of finan
cial, efficiency, and production targets as a percentage of the total. b. May nor equal the average of the average yearly change. Source: World Bank data.
CONTRACTING: WHAT WORKS, WHAT DOESN'T, .A
signed to India Oil's financial targets went from 20 percent in 1989 to 12 percent in 1990, then climbed to 40 percent by 1992.
There is also evidence that targets are soft. As we mentioned, all the
firms in our sample were rated at least satisfactory (scores were not as
signed for the two firms in Senegal), yet very few show marked improve
ment in their trends in profitability or productivity. Company evidence
supports the view that some managers were able to negotiate targets that
were easy to achieve. 15 Indeed, in some instances, even when a firm sub
stantially exceeded a target in one year, the target was reduced the follow
ing year. 16 The following examples drawn from our case studies illustrate
some of the ways in which performance contracts may be flawed:
• In Senegal, survey respondents described Senegal Telecoms as an
effective negotiator of targets it could easily achieve. One impor
tant target, call completion rates, was lower in the 1986 perfor
mance contract than in the company's business plan of ten years
before. In 1992 the call completion rate was a mere 55 percent in
Dakar and less than 40 percent for inter-urban calls, about half the
international industry standard.
• In India, negotiations on targets have sometimes dragged on so long
that the targets were set to be the same as actual performance. 17
• In Ghana, contract targets are set by the companies themselves;
the monitoring and evaluating agency (the SEC) considers many
targets too low and has established a penalty for under-targeting
(State Enterprises Commission 1991). • In the Philippines, one of Philippines Electricity's most important
and difficult challenges is to improve its reliability, but its reliabil
ity indicator (the percentage of electricity its customers have con
tracted for but the company never supplied) has become less im
portant in its performance score, falling from 30 percent of total
targets in 1990 to 10 percent in 1991 and 15 percent in 1992. This is not because the firm became more reliable; on the contrary,
by 1992-93 outages of seven hours per day were common in
many parts of the country.
• In Korea there are indications that managers seek to soften their
most meaningful target; Korea uses one of the best comprehensive
targets for assessing performance of the sample: public profitabil
ity in constant prices. 18 This measure follows a trend very close to
TFP, is easier for accountants and managers to understand than
123
ATS IN BUSINESS
124
TFP, and can be calculated using shadow prices to account for price
distortions. Yet the share of public profitability in Korean targets
has been falling: for telecoms and electricity it fell from 20 percent
in 198 5 to 12 percent in 1992. Field interviews suggest that SOE
managers have successfully negotiated the addition of other targets
at the expense of public profitability.
Targets are flawed in all the contracts, but contrary to what we
might expect, firms with improving TFP have less stable targets and a
lower rate of economic target achievement than firms where TFP dete
riorated.19 This could imply that some managers successfully negoti
ated such soft targets that their performance deteriorated or that some
targets were at odds with improved performance and that the firms re
ceiving the clearest signals were most likely to pursue these wrong tar
gets. There is some evidence of targets with perverse effects. For exam
ple, Philippines Electricity, a company that badly needs to upgrade its
infrastructure, achieved two 1991 targets by cutting capital expenditures by more than one-fifth.20 India Oil can achieve its target of num
ber of meters drilled regardless of whether it strikes oil or not. This
might encourage riskier drilling and, in fact, the number of non
producing wells has been increasing since 1990.21 Thus, it could be
that the clearer the targets, the worse the performance.
In sum, the contracts largely failed to solve the information problem,
as evidenced by the flaws in the targets and the fact that the only associ
ation between the achievement of contract targets and performance is a
negative one.
Rewards and Penalties. One reason managers use their information
advantage to act opportunistically is that the rewards and penalties in the
contract do not motivate them to try to improve performance. Managers
(and staff) could get pecuniary bonuses as a reward for good achieve
ment in only five of the twelve sample companies (three in Ghana and
two in Korea); the two Indian firms could get an award in a public cere
mony. Moreover, because bonuses are based on the achievement of the
contract targets, if the targets are soft or poor measures of performance,
bonuses will not motivate efficiency. This may explain why bonuses are
not necessarily associated with improvements in TFP (although none of
the firms that received a bonus showed a deterioration; table 3.4).
As for explicit management penalties, only in the Korean contracts is there any evidence that management achievements under contracts have
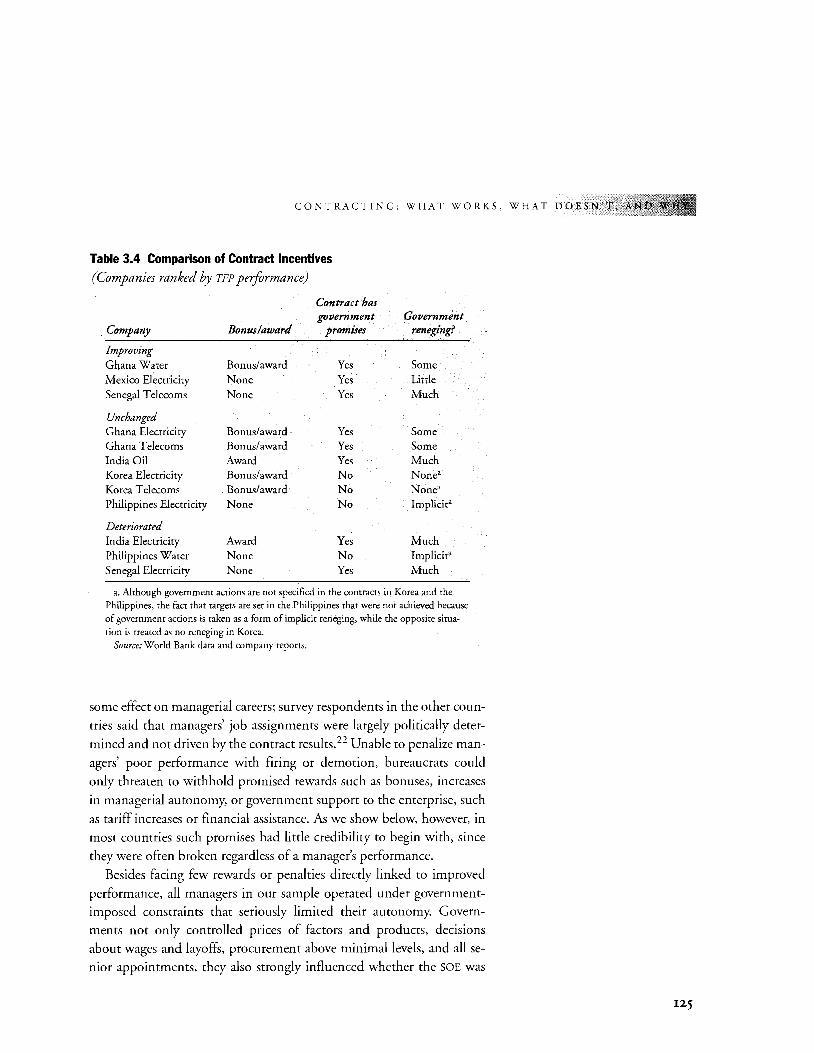
CONTRACTING: WHAT WORKS, WHAT DOESN'T,
Table 3.4 Comparison of Contract Incentives
(Companies ranked by TFP performance)
Contract has government Government
Company Bonus/award promises reneging?
Improving Ghana Water Bonus/award Yes Some Mexico Electricity None Yes Little Senegal Telecoms None Yes Much
Unchanged Ghana Electricity Bonus/award Yes Some Ghana Telecoms Bonus/award Yes Some India Oil Award Yes Much Korea Electricity Bonus/award No None• Korea Telecoms Bonus/award No None• Philippines Electricity None No Implicit"
Deteriorated India Electricity Award Yes Much Philippines Water None No Implicit" Senegal Electricity None Yes Much
a. Although government actions are not specified in the contracts in Korea and the Philippines, the fact that targets are set in the Philippines that were not achieved because of government actions is taken as a form of implicit reneging, while the opposite situation is treated as no reneging in Korea.
Source: W odd Bank data and company reports.
some effect on managerial careers; survey respondents in the other coun
tries said that managers' job assignments were largely politically deter
mined and not driven by the contract results.22 Unable to penalize man
agers' poor performance with firing or demotion, bureaucrats could
only threaten to withhold promised rewards such as bonuses, increases
in managerial autonomy, or government support to the enterprise, such
as tariff increases or financial assistance. As we show below, however, in
most countries such promises had little credibility to begin with, since
they were often broken regardless of a manager's performance.
Besides facing few rewards or penalties directly linked to improved
performance, all managers in our sample operated under government
imposed constraints that seriously limited their autonomy. Govern
ments not only controlled prices of factors and products, decisions
about wages and layoffs, procurement above minimal levels, and all se
nior appointments, they also strongly influenced whether the SOE was
125
TS IN BUSINESS
126
paid by its customers and had to pay its suppliers or creditors. Reduc
tions in this type of government interference were explicitly promised in
all but four of the contracts (the exceptions are the two Korean and two
Philippines contracts). But these promises often were broken. Although
in theory a contract can be written to motivate and measure managerial
behavior in isolation, in practice it proved impossible to isolate SOE per
formance from the impact of these government actions. In any event,
broken government promises were so frequent-and such a significant
disincentive-that it seems likely they contributed to the deterioration
in total factor productivity (table 3.4).
Although significant reneging was evident in all cases except Mexico
Electricity, in two of the four cases where the government kept at least
some important promises, TFP improved (see table 3.4).23 For example, although the government of Ghana did not always approve Ghana Water's
tariff increases promptly and required the company to serve some non
paying customers, it did increase tariffs in real terms and support management in reducing the work force. Furthermore, all three contracts in Ghana provide for recalculation of targets if government reneges on its
contractual obligations. Although this betrays a disconcerting expectation
that government will renege, it also means that SOEs were not penalized
for government misbehavior. Reneging was more apparent in the two
contracts in Senegal, where the government's failure to honor its obliga
tions to Senegal Telecoms evoked this comment in a 1989 company re
port: "It must be remembered that the contract plan was never considered
a binding contract by the public powers." Even so, Senegal Telecoms did
benefit from the contract, which was part of the process that separated it
from the post office, thus enabling it to focus more on commercial opera
tions. This may account for the firm's TFP improvement.
Companies that faced more extensive government reneging did not
improve TFP. The two Indian SOEs in our sample were required to serve
nonpaying customers and were not given promised tariff increases or all
promised reductions in cumbersome and slow processes for approval of
procurement, investment, and other expenditures (table 3.5). For exam
ple, every year the contract for India Electricity promised government
help in enforcing prompt payment from its customers, the State Elec
tricity Boards, yet circumstances have not improved. (Accounts receiv
able went from 149 days in 1986, the year before the contract was in
troduced, to 207 in 1990; in 1991 they fell to 150 days when a power plant was turned over to the SOE in partial payment of arrears.) Senegal
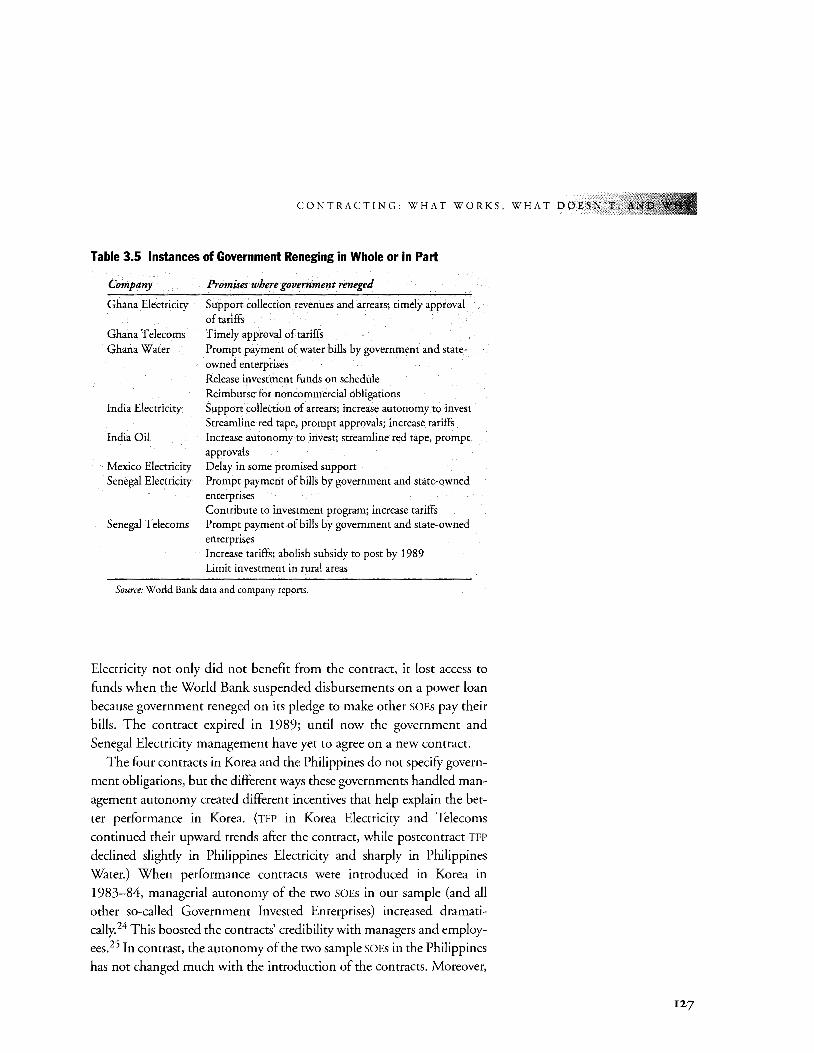
CONTRACTING: WHAT WORKS, WHAT DOESN'T,
Table 3.5 Instances of Government Reneging in Whole or in Part
Company
Ghana Electricity
Ghana Telecoms
Ghana Water
India Electricity
India Oil
Mexico Electricity
Senegal Electricity
Senegal Telecoms
Promises where government reneged
Support collection revenues and arrears; timely approval
of tariffs
Timely approval of tariffs
Prompt payment of water bills by government and state
owned enterprises
Release investment funds on schedule Reimburse for noncommercial obligations
Support collection of arrears; increase autonomy to invest
Streamline red tape, prompt approvals; increase tariffs
Increase autonomy to invest; streamline red tape, prompt
approvals Delay in some promised support Prompt payment of bills by government and state-owned
enterprises Contribute to investment program; increase tariffs Prompt payment of bills by government and state-owned
enterprises Increase tariffs; abolish subsidy to post by 1989
Limit investment in rural areas
Source: World Bank data and company reports.
Electricity not only did not benefit from the contract, it lost access to
funds when the World Bank suspended disbursements on a power loan
because government reneged on its pledge to make other SOEs pay their
bills. The contract expired in 1989; until now the government and
Senegal Electricity management have yet to agree on a new contract.
The four contracts in Korea and the Philippines do not specifY govern
ment obligations, but the different ways these governments handled man
agement autonomy created different incentives that help explain the bet
ter performance in Korea. (TFP in Korea Electricity and Telecoms
continued their upward trends after the contract, while postcontract TFP
declined slightly in Philippines Electricity and sharply in Philippines
Water.) When performance contracts were introduced in Korea in
1983-84, managerial autonomy of the two SOEs in our sample (and all
other so-called Government Invested Enterprises) increased dramati
cally.24 This boosted the contracts' credibility with managers and employ
ees.25 In contrast, the autonomy of the two sample SOEs in the Philippines
has not changed much with the introduction of the contracts. Moreover,
127
TS IN BUSINESS
128
some of the Philippine SOE targets (such as return on assets) are directly de
pendent on government decisions. By setting targets that can only be
achieved through government actions, the government makes an implicit
commitment, which, if violated, reduces the contract's credibility. In con
trast, almost all of the Korean SOEs' targets-transmission losses, thermal
efficiency, minutes of outages per household, and profitability in constant
prices-are independent of government pricing decisions.
Commitment. As the problems with rewards and penalties described
above suggest, the failure of contracts in our sample adequately to
address the commitment problem may be the most important expla
nation for the evident failure to improve performance. None of the
contracts specify an enforcement mechanism in the sense of a neutral
third party, insulated from politics, with the power and information
to compel both parties to comply. In several cases government obliga
tions were potentially enforceable by an outside party. The World
Bank included government contractual obligations as covenants in its loans for SOEs in Ghana, Mexico, and Senegal, although these
covenants were drawn up on the basis of project or sector needs rather
than because they were part of the contracts. Although this outside
involvement may have helped reduce reneging in Ghana and Mexico,
its does not appear to have enhanced, and may even have reduced, the
system's credibility in Senegal. Survey respondents and other observers
agree that the contracts in Senegal were viewed by the signatories as
donor driven and not as serious obligations. The suspension of dis
bursement of a World Bank loan to Senegal Electricity after govern
ment reneged on its contract obligations to settle arrears did not
change government behavior and penalized the company as much as,
if not more than, the government.
For the two Korean contracts, the participation of private individuals
(nongovernment accountants, lawyers, and academics) and a prestigious
government think tank, the autonomous Korea Development Institute,
may have improved monitoring and evaluation. Knowledgeable out
siders not only bring additional skills, they may informally supervise the
government monitors and act as a check on government actions that vi
olate the contract. According to Korean SOE managers, public opinion
was also an important incentive to improve performance: performance
ratings are widely reported in the Korean press (Shirley 1991).
More commonly, contracts' vulnerability to the political process undermined government commitment and increased reneging, thus hurt-
CONTRACTING: WHAT WORKS, WHAT DOESN'T,
ing performance. To make the contracts work, governments would need
to meet numerous obligations to the firms, both explicit and implicit.
Governments reneged on these obligations because it was politically too
costly to meet them. These obligations include relinquishing control
over the company labor force, diverting revenues from other uses to pay
government bills to the firm and help fund government mandated in
vestments, allowing the firm to pursue its creditors and apply legal
penalties if they do not pay, and regulating monopoly prices according
to clear and fair rules. Without setting prices excessively high in order to
generate rents for the government, the rules would allow enough revenue for the firm to maintain and improve service, to upgrade its tech
nology, and to expand to meet growing demand.
As this list suggests, a good contracting system is as demanding as a
good system to regulate private monopolies; it requires impartial and in
formed regulators who have some discretion but also face checks on ar
bitrary actions, and it requires mechanisms to enforce rules and resolve
disputes. Few of the governments in our sample were willing or able to
pay the political price.
For those that were, the picture is mixed. Some examples:
• Ghana, which has had contracts only since 1989, showed spotty
government compliance with the three contracts we studied, and
the decision to suspend the awards ceremony because of the 1992
elections is worrying for the future credibility of performance con
tracts there.
• Korea has the oldest (ten years) and by far the best system we ana
lyzed, but the two contracts don't seem to have changed the com
panies' already good performance trends. Furthermore, some of
those interviewed cited waning government commitment to per
formance contracting in Korea, raising doubts about the contracts'
sustainability even under very favorable circumstances.26
• Mexico has shown promising commitment to its electricity con
tract for eight years with good results. But Mexico Electricity's ex
perience under the contract differs from that of other SOEs in Mex
ico in that the government followed through on its commitments
under the contract.27 A World Bank assessment of Mexico's stan
dard performance contracts with five other SOEs concluded that
the results were disappointing. The study attributed the poor out
comes to a lack of adequate consultation between government and
129
TS IN BUSINESS
130
SOE, government attempts to treat the contracts as one more in
strument of control among many, and targets that lack coherence,
simultaneously overlapping and leaving gaps (World Bank 1992).
The mixed results from contracts in these market economies were
also found in one of the transition economies we investigated (see box
3.2 on performance contracts in China). Indeed, during Communist
rule in Central and Eastern Europe, most enterprises were governed by
performance contracts; these suffered from problems similar to those we
found in market economies, but much larger.
Performance Contract Findings
Only three of the twelve case study companies showed a turnaround
in TFP after contracts were introduced, six continued their past trends,
and three performed substantially worse under contracts than before.
Labor productivity improved at a faster pace in four cases and deteriorated in none, but for most SOEs, the improvement long predates the
contracts. ROA deteriorated for three firms; the rest showed little change.
Thus, the evidence from this sample gives little support to the premise that
explicit contracts help improve SOE performance.
Most of the contracts fell victim to information asymmetries that
were not overcome by mechanisms to persuade managers to comply; in
stead weak rewards and penalties and lack of credible mechanisms for
enforcement compounded the information problems (see table 3.6).
Gains in productivity occurred only when government offered man
agers credible incentives (performance bonuses and increased autonomy
or removal of constraints) and signaled their own commitment by fol
lowing through on at least some government promises.
The deteriorating performers faced extensive government reneging
on written promises, sometimes every year. The annual or triennial eval
uation and negotiation exercises drew attention to governments' consis
tent noncompliance and may have resulted in worse morale and perfor
mance than before. Such repeated government reneging may well have
increased managers' incentives to use their information advantage to ne
gotiate targets they could easily achieve, even if they perform less well
than before. Although we do not have enough information to say with
confidence that contracts contributed to deteriorating trends in TFP, the results suggest that this possibility cannot be excluded.
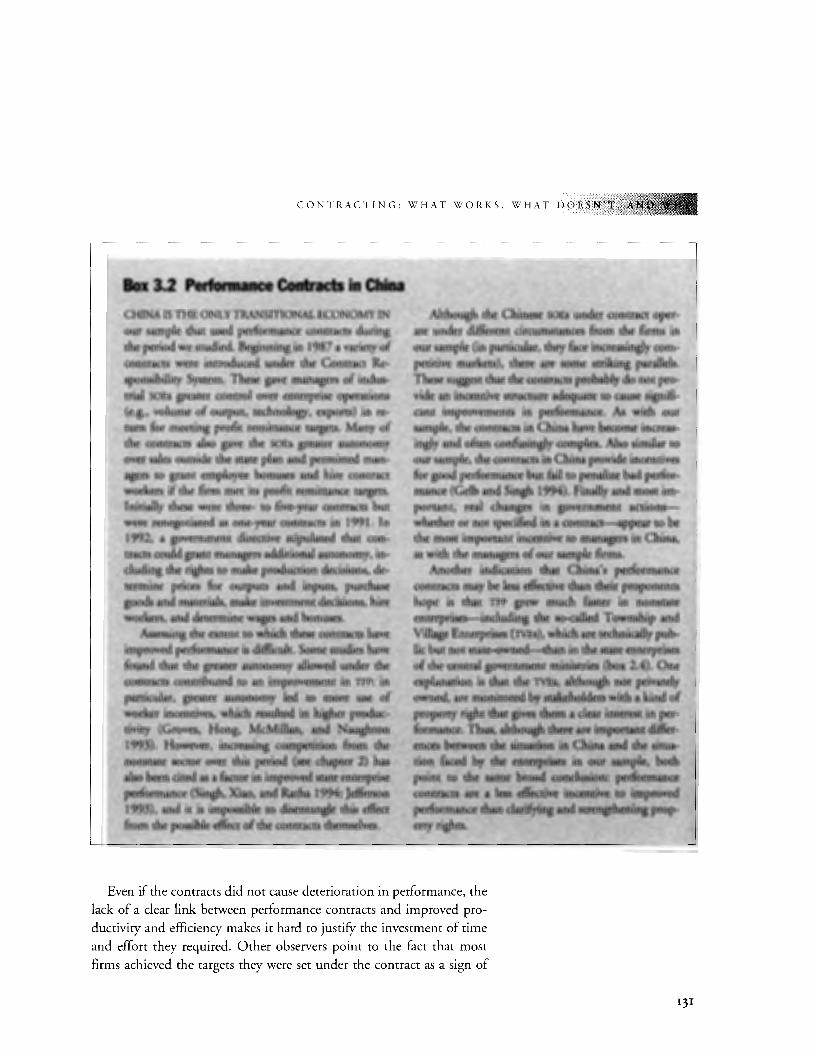
CONTRACTING: WHAT WORKS, WHAT DOESN'T,
Box 3.2 Perfo1111ance Contracts .in China CHINA IS THEONLY~SITIONJ\L ECONOMY IN. 0111' sample that used performance contracts during the period we studied. Begi:;l11fug .in 1987 a variety of · COtJ,trac~s. were introduced .under the <Anttact:. Re- .. sp<;>nsibility S~m. These gave ma~agers of industri#: SOEs greater con;rol over enterprise<opcrations (e*, volume of (lut}.mt, u:chn~l~.c~p!l~)in re-. tu¥n for mee~ing profit remitt;UI~ tarfjets, Many of th~ rontta(;ts alSO gave the sptsgreaier. aU,tonomy ov~~ sales outside m!;l s~te plan and permitted man-, ~ts· to grant employee ~nuses and hite. contract; 'VOfKet$ if the firm tt1et its prdfit rl'!mi~nt¢ targets. Init!~y these We'£e three- to five:cyear ~n~crshut. were ·retl~tiated as one~y.eat (;'orit{acts in 1991. .In 1~92; .a govern~ent . ..
· tr~ct:scouldgran; managers ~diti~~ autOnomy, ~l~ng ·tb¢ .righu~o.~ pt~up;ion
Althorighthe.C~ sol!& under con traer· oper-·. ate Jllldet different cir~tancesfn>m the firms in
O!ll' sample (in.p~kul¥, tht;:y fac:e ill\]1reasingly competiiive ~kets), there <tfe snnie striking parallels. These suggest thatthet:Ontt~ ~f~bah\y cit? not proyi~ ~ ince?tive sr~~fe ~a~ w ~use signlficant; improveQ1elif'$ i1f ~J;forrnlu'tce. ~ ~th our' sample,. me <;\ln~ra~ ~ Ghj~~ve~!)~ lnglyand o(ttil ~~iP:ltlY~tlll'~~. Also$~rtlllar oqi'!lll,~pi~ t:h~.con~~tsin ~nil.£>l'Qvide forg<>olJ V¢r(()rm~~~~ttfa:~:.-,:o p~2<e ~dperfur.:
Even if the contracts did not cause deterioration in performance, the
lack of a clear link between performance contracts and improved pro
ductivity and efficiency makes it hard to justifY the investment of time
and effort they required. Other observers point to the fact that most
firms achieved the targets they were set under the contract as a sign of
131
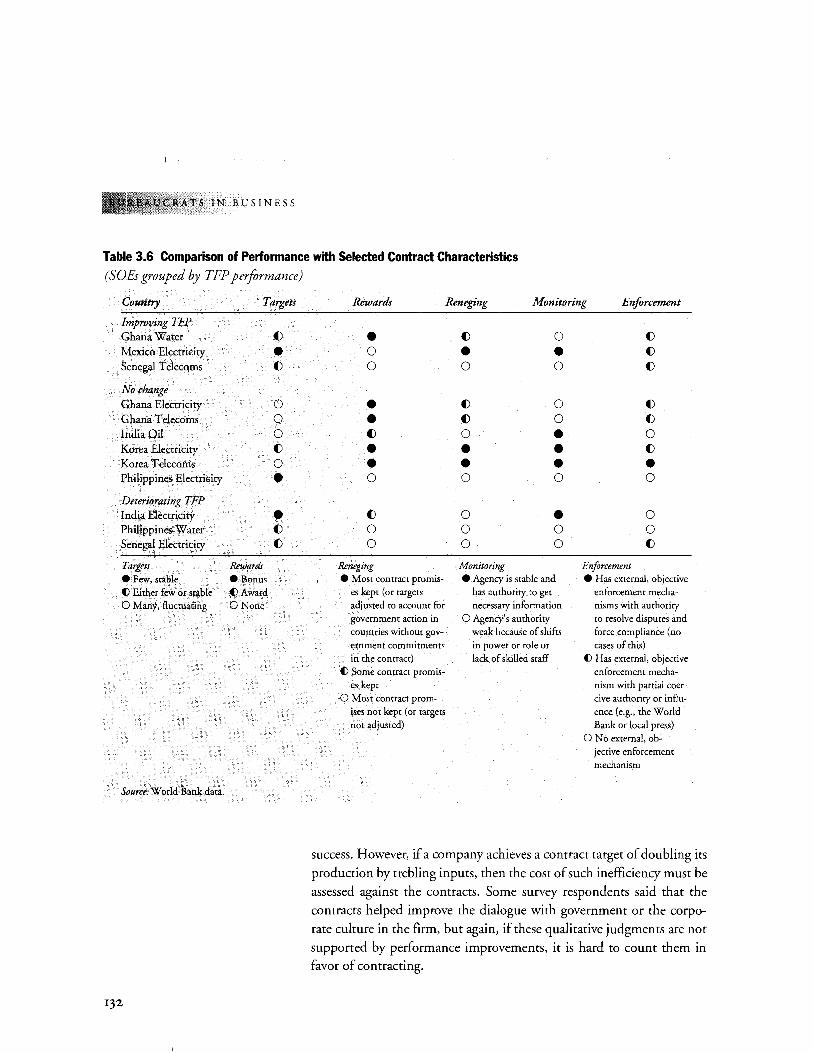
TS IN BUSINESS
Table 3.6 Comparison of Performance with Selected Contract Characteristics (SOEs grouped by TFP performance)
Country
Improving TFP Ghana Water
Mexico Electricity Senegal Telecoms
No change Ghana Electricity Ghana Telecoms India Oil Korea Electricity Korea Telecoms Philippines Electricity
Deteriorating TFP India Electricity Philippines Water Senegal Electricity
Targets • Few, stable () Either few or stable 0 Many, fluctuating
Source: World Bank data.
132
Targets
Rewards • Bonus ()Award
ONone
()
• ()
0 0 0 ()
0
• • ()
()
Rewards Reneging Monitoring Enforcement
• 0 0
• • ()
• • 0
()
0 0
Reneging • Most contract promis
es kept (or targets adjusted to account for government action in countries without government commitments in the contract)
() Some contract promises kept
0 Most contract promises not kept (or targets not adjusted)
()
• 0
()
()
0
• • 0
0 0 0
Monitoring
0
• 0
0 0
• • • 0
• 0 0
• Agency is stable and has authority to get necessary information
0 Agency's authority weak because of shifts in power or role or lack of skilled staff
Enforcement
()
()
()
()
()
0 ()
• 0
0 0 ()
• Has external, objective enforcement mechanisms with authority to resolve disputes and force compliance (no cases of this)
() Has external, objective enforcement mechanism with partial coercive authority or influence (e.g., the World Bank or local press)
0 No external, objective enforcement mechanism
success. However, if a company achieves a contract target of doubling its
production by trebling inputs, then the cost of such inefficiency must be
assessed against the contracts. Some survey respondents said that the
contracts helped improve the dialogue with government or the corpo
rate culture in the firm, but again, if these qualitative judgments are not
supported by performance improvements, it is hard to count them in favor of contracting.
CONTRACTING: WHAT WORKS, WHAT DOESN'
Analysis of the outcomes and incentive problems associated with the
performance contracts in our sample suggests some lessons:
• Performance contracts should be used sparingly and only when
government commitment is manifest, since the mere formality of
a performance contract wastes time and effort and could possibly
even harm performance. The idea that SOE performance can be
improved without any change in government behavior by design
ing a contract that provides targets and incentives directed at man
agers alone proved ephemeral. Managers' incentives depend on
government actions, whether or not these actions are specified in
a performance contract.
• Bonuses are associated with better performance, but they are only
as good as the targets. And bonuses mean little in the face of gov
ernment reneging on promises, especially when these promises di
rectly affect the manager's opportunity to attain the bonus.
• Contract outcomes depend not only on management incentives,
but also on the incentives of government negotiators, as well as
their power and the quality of information they command. Large
differences in status, income, and influence between government
and SOE negotiators contributed to weak and incoherent targets.
Frequent shifts in locale, staff, and responsibilities further weak
ened the position of government actors.
• The involvement of informed individuals outside government and
politics may help prevent reneging and improve the caliber of
monitoring. The involvement of donors as enforcement agents
had mixed results, working best when the agency was viewed as
helping rather than imposing the contract. But the role of outside
pressure in performance contracts is necessarily a limited one,
since outsiders are not party to the contract and have, at best, only
an indirect stake in the outcome.
Management Contracts: With Private Managers
CONTRACTING OUT SOE MANAGEMENT TO THE PRIVATE
sector is often recommended as a way to improve SOE perfor
mance and, where outright privatization is desirable, prepare an
133
TS IN BUSINESS
IJ4
enterprise for sale. (Hegstad and Newport 1987; Kikeri, Nellis, and
Shirley 1992; Roth 1987; World Bank 1994b; Berg 1993). Do manage
ment contracts work? Experience with these contracts has not been sys
tematically analyzed to determine whether, and under what circum
stances, they might improve SOE performance. This section aims to
begin to fill that gap, analyzing where management contracts are found,
how they have performed and why, and the factors that explain their
thus far limited use. As before, in explaining outcomes we look at how
the contracts affected the incentives in terms of information, rewards
and penalties, and commitment.
We define a management contract as an agreement between the gov
ernment and a private party to operate the firm for a fee (usually a suc
cess fee, but sometimes for a fixed fee as well). Under this definition, the
government does not receive a fixed rent (as it would with a lease), it is responsible for fixed investments (which it would not be with a conces
sion), and it holds majority ownership, ceding control only via an ex
plicit contract (as distinct from a joint venture in which the government owns only a minority). Our definition does encompass contracts in
which the private contractor provides working capital or owns a minor
ity equity share. A few of the contracts are called leases in the country of
signing, but we consider them management contracts when they do not
involve fixed payments to government.
How widely used are management contracts? Even employing our
broad definition, a worldwide search indicated that they are only com
monly used in the hotel industry. Of the more than 200 management
contracts we found in developing countries, 44 involved hotels managed
by one of the five major chains (see table 3. 7);28 and it seems likely that
other hotel management contracts not involving these chains also
exist.29 Although some transition economies, notably Poland and Roma
nia, are taking steps to introduce management contracts for a large
number of SOEs, so far no country has been relying on them extensively.
Sri Lanka has the most, with 24 contracts, 22 of which involve tea and
rubber plantations. Of the forty-nine other countries where contracts
were found, if the hotel industry is excluded, we found that only five
countries had more than 5 contracts and one country had more than 10.
Comparing regions, we found that management contracts are con
centrated in Mrica. Aside from the hotel contracts, which exist in all re
gions, and the Sri Lankan plantations, Mrica accounts for two-thirds of the remaining management contracts in our sample (91 out of 136).
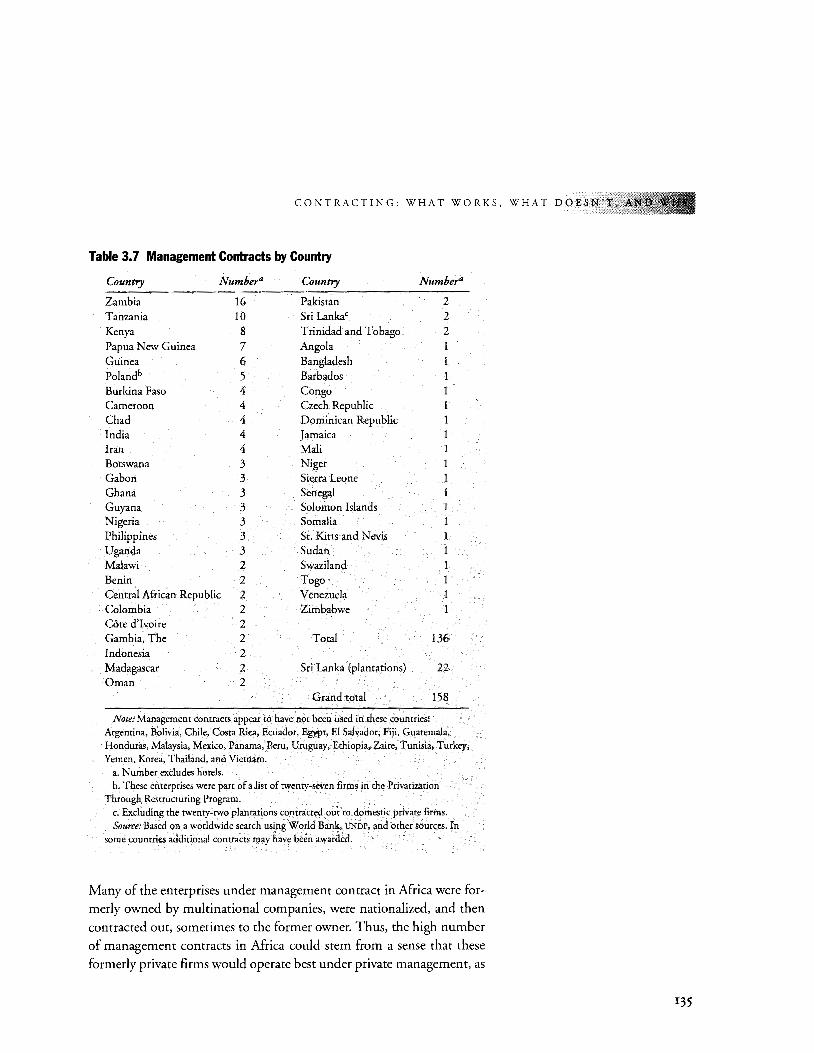
CONTRACTING: WHAT WORKS, WHAT DOESN'T,
Table 3.7 Management Contracts by Country
Country Numbera Country Numbera
Zambia 16 Pakistan 2 Tanzania 10 Sri Lankac 2 Kenya 8 Trinidad and Tobago 2 Papua New Guinea 7 Angola 1 Guinea 6 Bangladesh Polandb 5 Barbados Burkina Paso 4 Congo Cameroon 4 Czech Republic Chad 4 Dominican Republic India 4 Jamaica Iran 4 Mali Botswana 3 Niger Gabon 3 Sierra Leone Ghana 3 Senegal Guyana 3 Solomon Islands Nigeria 3 Somalia Philippines 3 St. Kitts and Nevis Uganda 3 Sudan Malawi 2 Swaziland Benin 2 Togo Central African Republic 2 Venezuela Colombia 2 Zimbabwe COte d'Ivoire 2 Gambia, The 2 Total 136 Indonesia 2 Madagascar 2 Sri Lanka (plantations) 22 Oman 2
Grand total 158
Note: Management contracts appear co have not been used in these countries: Argentina, Bolivia, Chile, Costa Rica, Ecuador, Egypt, El Salvador, Fiji, Guatemala, Honduras, Malaysia, Mexico, Panama, Peru, Uruguay, Ethiopia, Zaire, Tunisia, Turkey, Yemen, Korea, Thailand, and Vietnam.
a. Number excludes hotels. b. These enterprises were part of a list of twenty-seven firms in the Privatization
Through Restrucruring Program. c. Excluding the twenty-two plantations contracted out to domestic private firms. Source: Based on a worldwide search using World Bank, UNDP, and other sources. In
some countries additional contracts may have been awarded.
Many of the enterprises under management contract in Mrica were formerly owned by multinational companies, were nationalized, and then
contracted out, sometimes to the former owner. Thus, the high number
of management contracts in Mrica could stem from a sense that these formerly private firms would operate best under private management, as
135
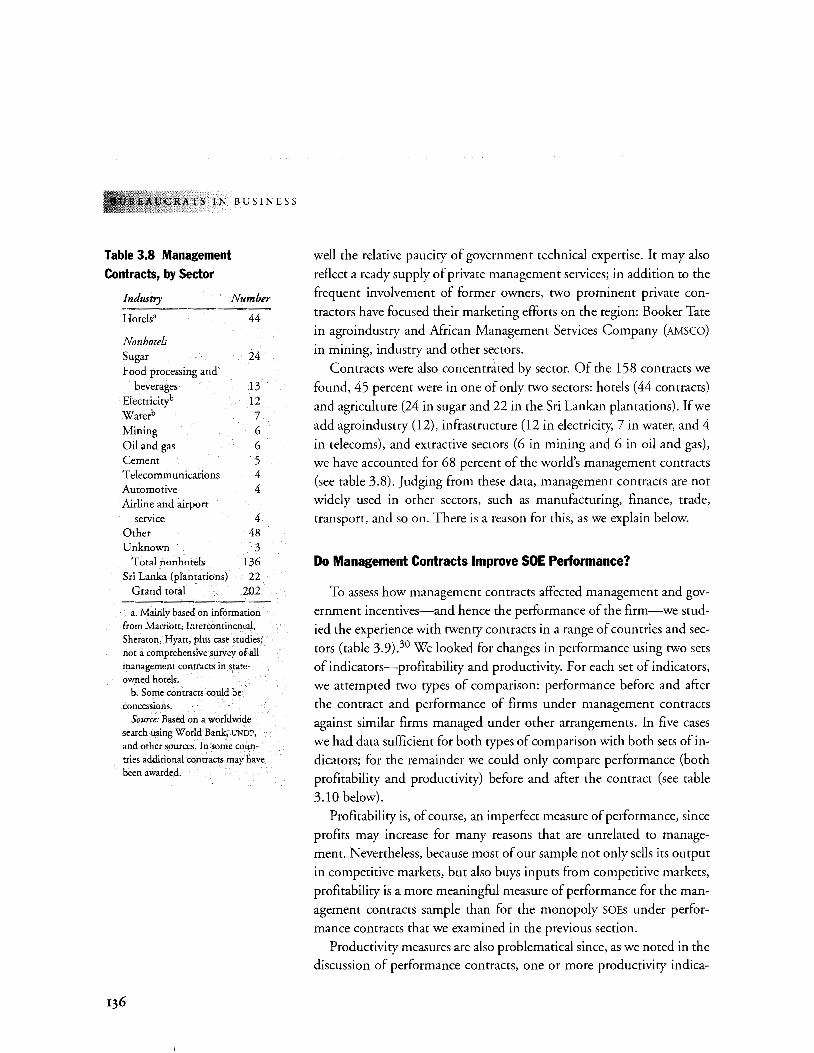
RAT S I N B US I N E S S
Table 3.8 Management Contracts, by Sector
Industry Number
Hotelsa 44
Nonhotels Sugar 24 Food processing and
beverages 13 Electrici o/' 12 Waterb 7 Mining 6 Oil and gas 6 Cement 5 Telecommunications 4 Automotive 4 Airline and airport
service 4 Other 48 Unknown 3
Total nonhotels 136 Sri Lanka (plantations) 22
Grand total 202
a. Mainly based on information from Marriott, Intercontinental,
Sheraton, Hyatt, plus case studies; not a comprehensive survey of all management contracts in stateowned hotels.
b. Some contracts could be concessions.
Source: Based on a worldwide search using World Bank, UNDP,
and other sources. In some countries additional contracts may have been awarded.
136
well the relative paucity of government technical expertise. It may also
reflect a ready supply of private management services; in addition to the
frequent involvement of former owners, two prominent private con
tractors have focused their marketing efforts on the region: Booker Tate
in agroindustry and African Management Services Company (AMSCO)
in mining, industry and other sectors. I
Contracts were also concentrated by sector. Of the 158 contracts we
found, 45 percent were in one of only two sectors: hotels (44 contracts)
and agriculture (24 in sugar and 22 in the Sri Lankan plantations). If we
add agroindustry (12), infrastructure (12 in electricity, 7 in water, and 4
in telecoms), and extractive sectors (6 in mining and 6 in oil and gas),
we have accounted for 68 percent of the world's management contracts
(see table 3.8). Judging from these data, management contracts are not widely used in other sectors, such as manufacturing, finance, trade,
transport, and so on. There is a reason for this, as we explain below.
Do Management Contracts Improve SOE Performance?
To assess how management contracts affected management and gov
ernment incentives-and hence the performance of the firm-we stud
ied the experience with twenty contracts in a range of countries and sec
tors (table 3.9).30 We looked for changes in performance using two sets
of indicators-profitability and productivity. For each set of indicators,
we attempted two types of comparison: performance before and after
the contract and performance of firms under management contracts
against similar firms managed under other arrangements. In five cases
we had data sufficient for both types of comparison with both sets of in
dicators; for the remainder we could only compare performance (both
profitability and productivity) before and after the contract (see table
3.10 below).
Profitability is, of course, an imperfect measure of performance, since
profits may increase for many reasons that are unrelated to manage
ment. Nevertheless, because most of our sample not only sells its output
in competitive markets, but also buys inputs from competitive markets,
profitability is a more meaningful measure of performance for the man
agement contracts sample than for the monopoly SOEs under perfor
mance contracts that we examined in the previous section.
Productivity measures are also problematical since, as we noted in the discussion of performance contracts, one or more productivity indica-
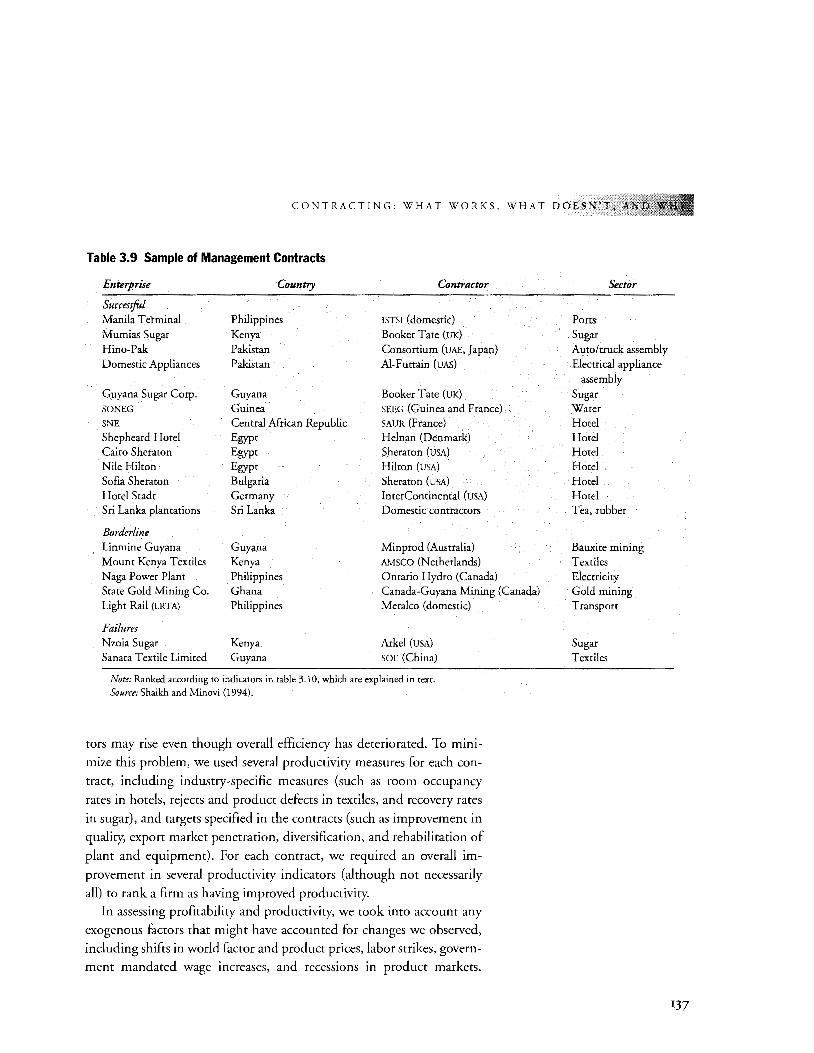
CONTRACTING: WHAT WORKS, WHAT DOESN'T, A
Table 3.9 Sample of Management Contracts
Enterprise Country Contractor
Successful Manila Terminal Philippines ISTSI (domestic) Mumias Sugar Kenya Booker Tate (UK)
Hino-Pak Pakistan Consortium (UAE, Japan) Domestic Appliances Pakistan Al-Futtain (VAS)
Guyana Sugar Corp. Guyana Booker Tate (UK)
SO NEG Guinea SEEG (Guinea and France) SNE Central African Republic SAUR (France) Shepheard Hotel Egypt Helnan (Denmark) Cairo Sheraton Egypt Sheraton (USA)
Nile Hilton Egypt Hilton (USA)
Sofia Sheraton Bulgaria Sheraton (USA)
Hotel Stadt Germany InterContinental (usA)
Sri Lanka plantations Sri Lanka Domestic contractors
Borderline Linmine Guyana Guyana Minprod (Australia) Mount Kenya Textiles Kenya AMSCO (Netherlands) Naga Power Plant Philippines Ontario Hydro (Canada) State Gold Mining Co. Ghana Canada-Guyana Mining (Canada) Light Rail (LRTA) Philippines Meralco (domestic)
Failures Nzoia Sugar Kenya ArkeJ (USA)
Sanata Textile Limited Guyana SOE (China)
Note: Ranked according to indicators in table 3.10, which are explained in text. Source: Shaikh and Minovi (1994).
tors may rise even though overall efficiency has deteriorated. To mini
mize this problem, we used several productivity measures for each con
tract, including industry-specific measures (such as room occupancy
rates in hotels, rejects and product defects in textiles, and recovery rates
in sugar), and targets specified in the contracts (such as improvement in
quality, export market penetration, diversification, and rehabilitation of
plant and equipment). For each contract, we required an overall im
provement in several productivity indicators (although not necessarily
all) to rank a firm as having improved productivity.
In assessing profitability and productivity, we took into account any
exogenous factors that might have accounted for changes we observed,
including shifts in world factor and product prices, labor strikes, govern
ment mandated wage increases, and recessions in product markets.
Sector
Ports Sugar Auto/truck assembly Electrical appliance
assembly Sugar Water Hotel Hotel Hotel Hotel Hotel Hotel Tea, rubber
Bauxite mining Textiles Electricity Gold mining Transport
Sugar Textiles
137
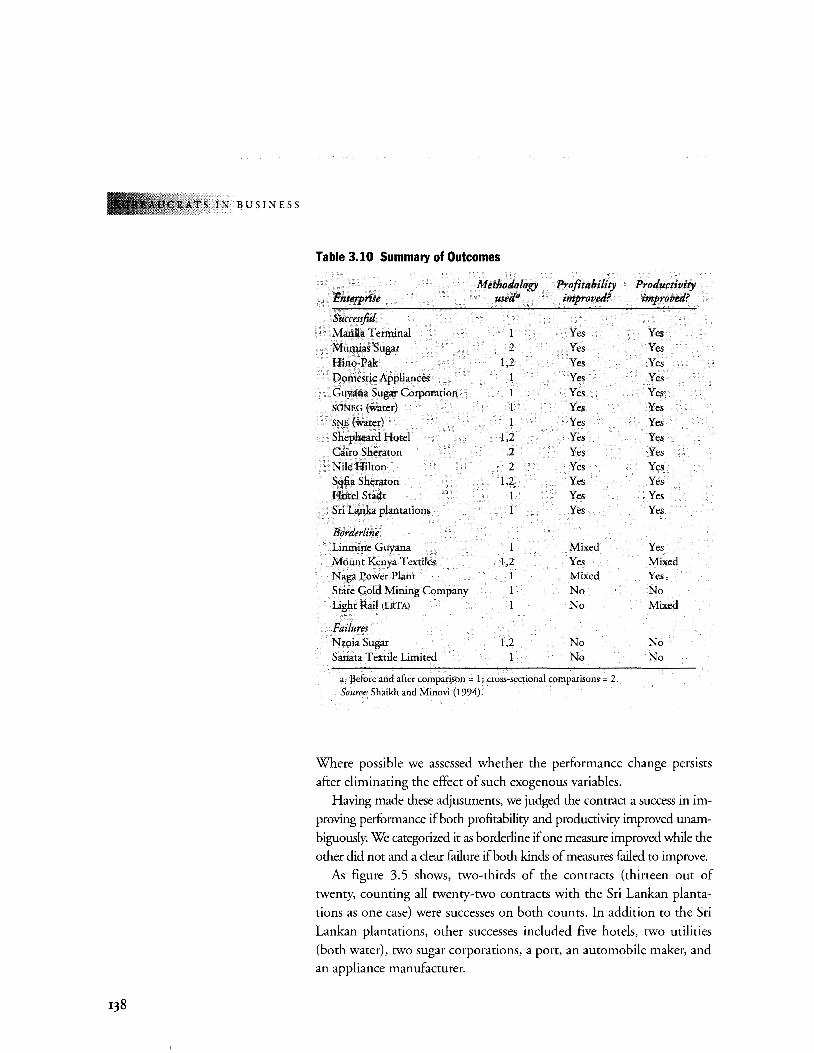
TS IN BUSINESS
138
Table 3.10 Summary of Outcomes
Methodology Profitability Productivity Enterprise used11 improved? improved?
Successfol Manila Terminal 1 Yes Yes Mumias Sugar 2 Yes Yes Hino--Pak 1,2 Yes Yes Domestic Appliances 1 Yes Yes Guyana Sugar Corporation I Yes Yes SONEG (water) 1 Yes Yes SNE (water) 1 Yes Yes Shepheard Hotel 1,2 Yes Yes Cairo Sheraton 2 Yes Yes Nile Hilton 2 Yes Yes Sofia Sheraton 1,2 Yes Yes Hotel Stadt 1 Yes Yes Sri Lanka planrations 1 Yes Yes
Borderline Linmine Guyana 1 Mixed Yes Mount Kenya Textiles 1,2 Yes Mixed Naga Power Plant 1 Mixed Yes State Gold Mining Company 1 No No Light Rail (LRTA) 1 No Mixed
Failures Nwia Sugar 1,2 No No Sanata Textile Limited I No No
a. Before and after comparison~ l; cross-sectional comparisons= 2.
Source: Shaikh and Minovi (1994).
Where possible we assessed whether the performance change persists
after eliminating the effect of such exogenous variables.
Having made these adjustments, we judged the contract a success in im
proving performance if both profitability and productivity improved unam
biguously. We categorized it as borderline if one measure improved while the
other did not and a clear failure if both kinds of measures failed to improve.
As figure 3.5 shows, two-thirds of the contracts (thirteen out of
twenty, counting all twenty-two contracts with the Sri Lankan planta
tions as one case) were successes on both counts. In addition to the Sri
Lankan plantations, other successes included five hotels, two utilities
(both water), two sugar corporations, a port, an automobile maker, and an appliance manufacturer.
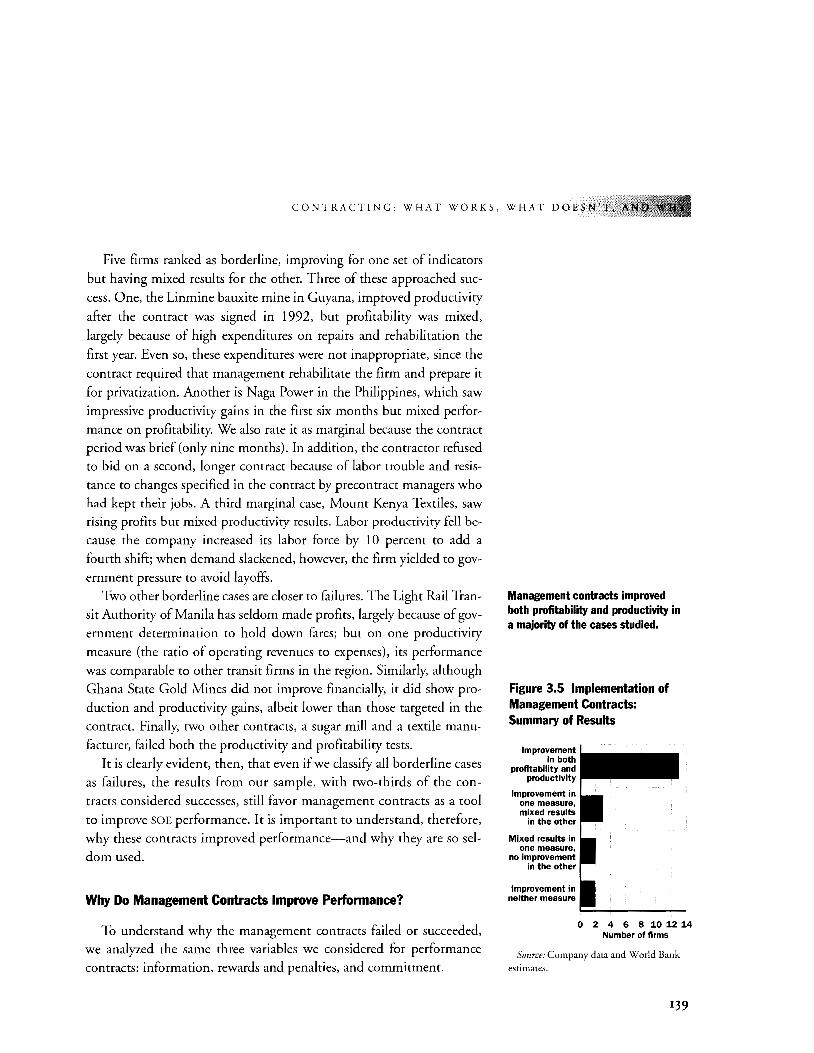
CONTRACTING: WHAT WORKS, WHAT DOESN'T,
Five firms ranked as borderline, improving for one set of indicators
but having mixed results for the other. Three of these approached suc
cess. One, the Linmine bauxite mine in Guyana, improved productivity
after the contract was signed in 1992, but profitability was mixed,
largely because of high expenditures on repairs and rehabilitation the
first year. Even so, these expenditures were not inappropriate, since the
contract required that management rehabilitate the firm and prepare it
for privatization. Another is Naga Power in the Philippines, which saw
impressive productivity gains in the first six months but mixed perfor
mance on profitability. We also rate it as marginal because the contract period was brief (only nine months). In addition, the contractor refused
to bid on a second, longer contract because of labor trouble and resis
tance to changes specified in the contract by precontract managers who had kept their jobs. A third marginal case, Mount Kenya Textiles, saw rising profits but mixed productivity results. Labor productivity fell be
cause the company increased its labor force by 10 percent to add a
fourth shift; when demand slackened, however, the firm yielded to gov
ernment pressure to avoid layoffs.
Two other borderline cases are closer to failures. The Light Rail Tran
sit Authority of Manila has seldom made profits, largely because of gov
ernment determination to hold down fares; but on one productivity
measure (the ratio of operating revenues to expenses), its performance
was comparable to other transit firms in the region. Similarly, although
Ghana State Gold Mines did not improve financially, it did show pro
duction and productivity gains, albeit lower than those targeted in the
contract. Finally, two other contracts, a sugar mill and a textile manu
facturer, failed both the productivity and profitability tests.
It is clearly evident, then, that even if we classify all borderline cases
as failures, the results from our sample, with two-thirds of the con
tracts considered successes, still favor management contracts as a tool
to improve SOE performance. It is important to understand, therefore,
why these contracts improved performance-and why they are so sel
dom used.
Why Do Management Contracts Improve Performance?
To understand why the management contracts failed or succeeded, we analyzed the same three variables we considered for performance
contracts: information, rewards and penalties, and commitment.
Management contracts improved both profitability and productivity in a majority of the cases studied.
Figure 3.5 Implementation of Management Contracts: Summary of Results
Improvement In both
profitability and productivity
Improvement in one measure, mixed results
in the other
Mixed results In one measure,
no improvement In the other
Improvement in neither measure
0 2 4 6 8101214 Number of firms
Source: Company data and World Bank estimates.
139
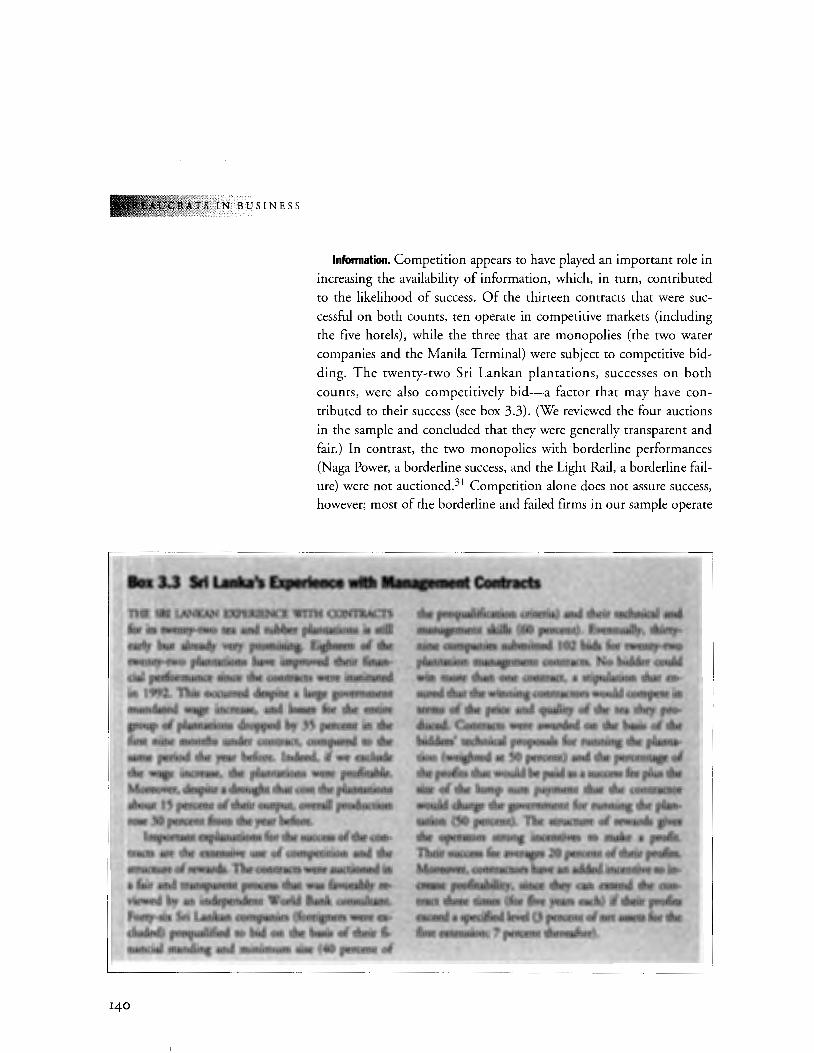
rg IN BUSINESS
lnfonnation. Competition appears to have played an important role in
increasing the availability of information, which, in turn, contributed
to the likelihood of success. Of the thirteen contracts that were suc
cessful on both counts, ten operate in competitive markets (including
the five hotels), while the three that are monopolies (the two water
companies and the Manila Terminal) were subject to competitive bid
ding. The twenty-two Sri Lankan plantations, successes on both
counts, were also competitively bid-a factor that may have con
tributed to their success (see box 3.3). (We reviewed the four auctions
in the sample and concluded that they were generally transparent and
fair.) In contrast, the two monopolies with borderline performances
(Naga Power, a borderline success, and the Light Rail, a borderline fail
ure) were not auctioned.31 Competition alone does not assure success,
however; most of the borderline and failed firms in our sample operate
······Ita•·~-.·~·~ .. ~~·~~-<~ ---,~~~·~~;,,
s ~v· ~~1lttf~•7·•••tu~ .• •' ·. · , •... ::J•d<it.t.Lc.;"j=~~t.JY····
f()n.tbar t<k~t
·~
!laficial:st:anding and.minimuill size (4o percent of ·
140
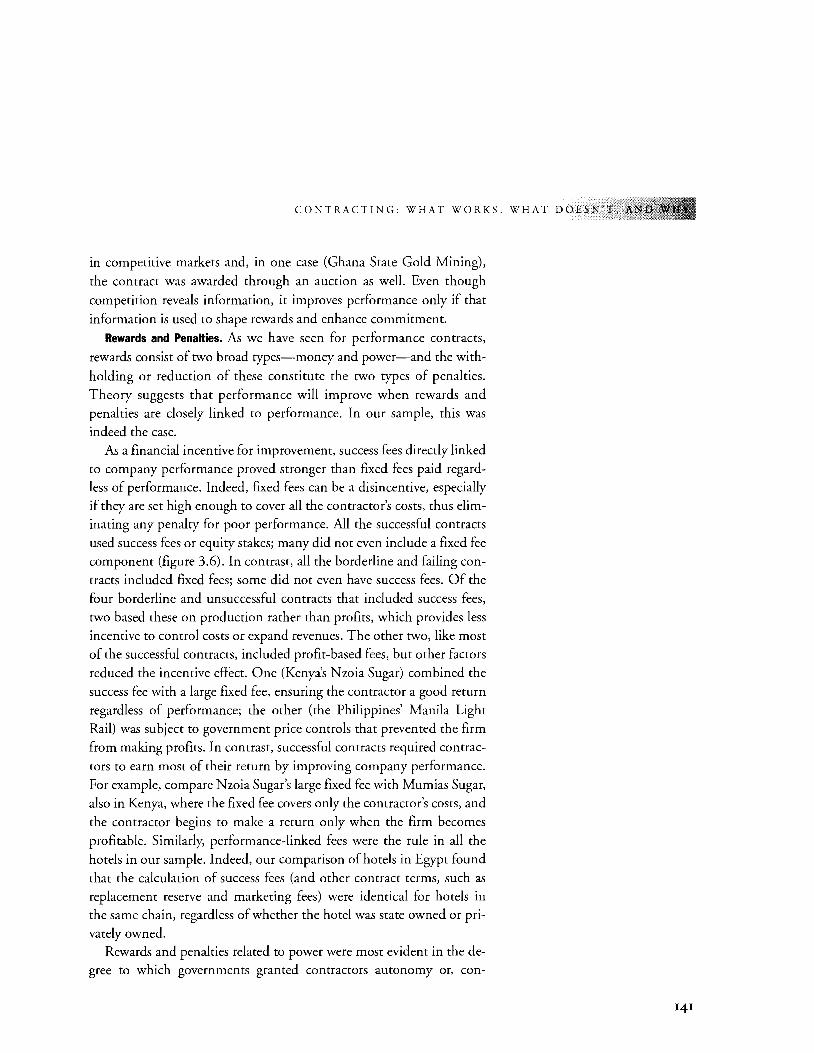
CONTRACTING: WHAT WORKS, WHAT DOESN'T,
in competitive markets and, in one case (Ghana State Gold Mining),
the contract was awarded through an auction as welL Even though
competition reveals information, it improves performance only if that
information is used to shape rewards and enhance commitment.
Rewards and Penalties. As we have seen for performance contracts,
rewards consist of two broad types-money and power-and the with
holding or reduction of these constitute the two types of penalties.
Theory suggests that performance will improve when rewards and
penalties are closely linked to performance. In our sample, this was
indeed the case.
As a financial incentive for improvement, success fees directly linked
to company performance proved stronger than fixed fees paid regardless of performance. Indeed, fixed fees can be a disincentive, especially
if they are set high enough to cover all the contractor's costs, thus elim
inating any penalty for poor performance. All the successful contracts
used success fees or equity stakes; many did not even include a fixed fee
component (figure 3.6). In contrast, all the borderline and failing con
tracts included fixed fees; some did not even have success fees. Of the
four borderline and unsuccessful contracts that included success fees,
two based these on production rather than profits, which provides less
incentive to control costs or expand revenues. The other two, like most
of the successful contracts, included profit-based fees, but other factors
reduced the incentive effect. One (Kenya's Nzoia Sugar) combined the
success fee with a large fixed fee, ensuring the contractor a good return
regardless of performance; the other (the Philippines' Manila Light
Rail) was subject to government price controls that prevented the firm
from making profits. In contrast, successful contracts required contrac
tors to earn most of their return by improving company performance.
For example, compare Nzoia Sugar's large fixed fee with Mumias Sugar,
also in Kenya, where the fixed fee covers only the contractor's costs, and
the contractor begins to make a return only when the firm becomes
profitable. Similarly, performance-linked fees were the rule in all the
hotels in our sample. Indeed, our comparison of hotels in Egypt found
that the calculation of success fees (and other contract terms, such as
replacement reserve and marketing fees) were identical for hotels in
the same chain, regardless of whether the hotel was state owned or pri
vately owned. Rewards and penalties related to power were most evident in the de
gree to which governments granted contractors autonomy or, con-
141
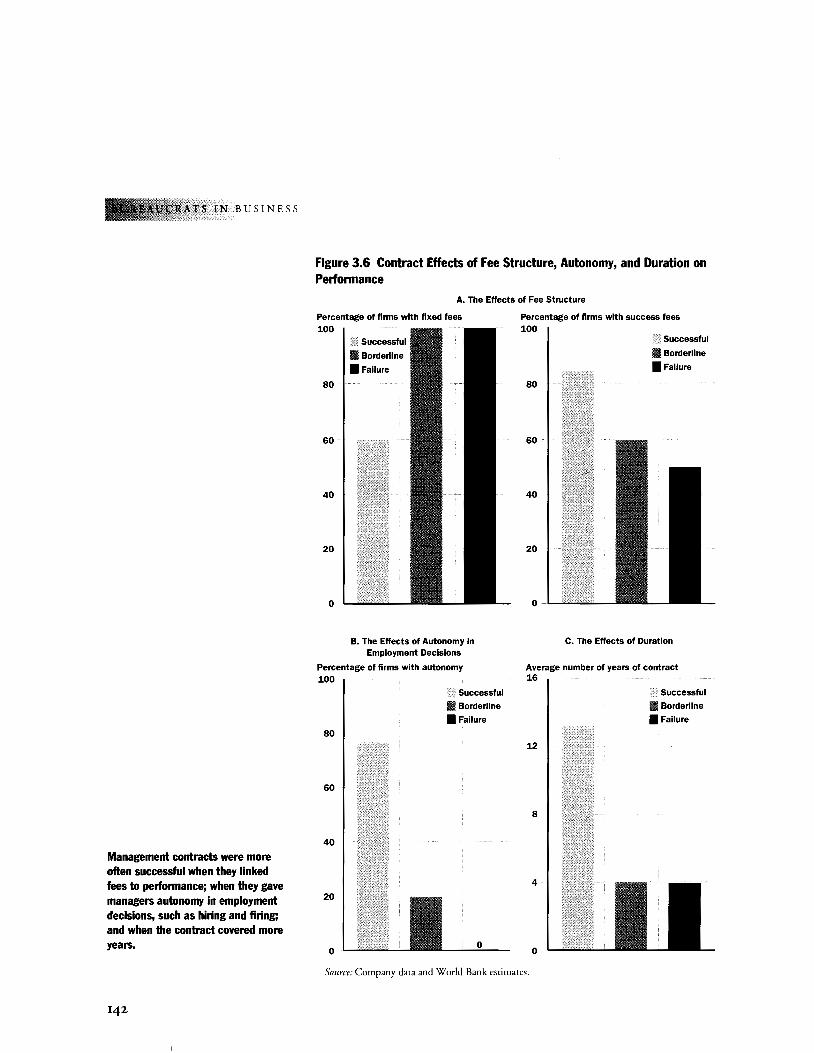
TS IN BUSINESS
Management contracts were more often successful when they linked fees to performance; when they gave managers autonomy in employment decisions, such as hiring and firing; and when the contract covered more years.
142
Figure 3.6 Contract Effects of Fee Structure, Autonomy, and Duration on Performance
A. The Effects of Fee Structure
Percentage of firms with fixed fees 100
80
60
40
20
0
Successful
Ill Borderline
Ill Failure
B. The Effects of Autonomy In Employment Decisions
Percentage of firms with autonomy 100
80
60
40
20
0
Successful
Ill Borderline
Ill Failure
0
Percentage of firms with success fees 100
80
60
40
20
0
Successful
Ill Borderline
Ill Failure
C. The Effects of Duration
Average number of years of contract 16
12
8
4
0
Successful
Ill Borderline
Ill Failure
Source: Company data and World Bank estimates.
C 0 NT R ACTIN G : WHAT W 0 R K S , WHAT D 0 E S N 'T, AN li'1
versely, constrained the contractor's autonomy in ways that raised costs
or lowered revenues. The role of power in these contracts differs from
that in the performance contracts of the previous section. For public
managers, greater autonomy and the removal of constraints on the SOEs
made their managerial task easier and may have enhanced their prestige;
in a few cases it also affected their ability to get a bonus. For private
managers, greater power affected their net earnings under the success
fee. In general, the more successful contracts enabled contractors to pur
sue contract objectives independent of government policy, while the less
successful contracts made returns to the contractors dependent on gov
ernment decisions outside their control. In cases where the contractors
were dependent, the government's role in determining outcomes was
often not explicitly stated in the contract.
We encountered many examples of this. Manila Light Rail's contract
specified a success fee equal to 5 percent of its profits, but the govern
ment policy of holding down fares precluded profits in most years. One
reason the contractor agreed to this arrangement was that all operating
expenses were covered by the government, so although the upside was
limited there was little downside. Similarly, the production targets for
Ghana's State Gold Mining Company and Kenya's Nzoia Sugar were
too high to meet without substantial new investment in the companies
new investments the governments were not prepared to make. In the
case of Nzoia Sugar, the contract explicitly confined the contractor to
managing the factory, with no authority over finances, supply of cane,
or marketing.
Governments intervened in personnel policies more than any other
area of decisionmaking. Here, too, enterprise autonomy was closely cor
related with improved performance. Most of the successful contracts gave
the manager significant autonomy to set wages and to hire and fire, while
all but one of the borderline or unsuccessful contracts limited manage
ment's authority over labor (figure 3.6B). In one extreme case, the con
tractor for Domestic Appliances Ltd. in Pakistan was allowed to fire the
entire labor force and recruit anew. In other cases, although the contract
promised autonomy, the government nonetheless intervened. For exam
ple, in 1993 the Sri Lankan plantations had to absorb a government
mandated wage increase that was double the average annual increase for
the five pervious years. The plantations improved performance despite
this increase, perhaps because managers do not expect such large wage in
creases in the future. Similarly, although Mount Kenya Textile's contract
143
TS IN BUSINESS
144
gave contractors the freedom to hire and fire, managers who hired extra
workers when demand surged found that the government did not allow
the company to lay them off when demand later fell. The added cost
contributed to the company's marginal performance.
Price regulation was not an issue for many of these management con
tracts, because the companies operated in competitive product markets
without price controls. As for the monopolies, better performance was
closely associated with pricing regulation that gave managers an incen
tive to increase efficiency. We have already seen with Manila's Light Rail
how adverse price regulations can be a disincentive to performance im
provements. On the positive side, the prices for the water companies in Guinea and the Central African Republic (SONEG and SNB) were set by
competitive auction (the contracts were awarded to the bidder offering
the lowest average price for a new water connection).
Commitment. Institutional mechanisms to resolve conflicts and enforce
terms seemed not to play a major role in engendering commitment in
our sample. None of the contracts specified a domestic third party that could be considered neutral or powerful enough to enforce the con
tract. In most of the contracts, monitoring was done by the board of
directors of the company under contract (which was appointed by the
government) or by the holding company that owned the assets, and it
used the same indicator as for the success fee. Many of the contracts
with foreign managers provide for international arbitration (by the
International Chamber of Commerce or ICSID, the International
Centre for Settlement of Investment Disputes), and some had provi
sions for domestic arbitration (for example, Manila's Light Rail could
appeal to the court system); but there is no evidence that these chan
nels were ever used. There were only three cases of default (where the
contract was canceled or terminated by either party prior to comple
tion) and, judging from these cases, termination was relatively simple
and preferred to arbitration.
The absence of effective third-party enforcement suggests that the
parties relied on other commitment mechanisms, such as longer con
tracts, the possibility of contract renewals, a high degree of contractor
concern with safeguarding reputation, and costly up-front actions by
government; this was indeed the case for the better performing enter
prises in our sample. Longer contracts with a greater possibility of
renewal motivate improved performance in several ways. Most obvi
ously, contractors have a greater incentive to upgrade an enterprise and
CONTRACTING: WHAT WORKS, WHAT DOESN'T;
invest in other changes (for example, improved marketing or seeking
out cheaper suppliers) if they expect to be around to reap the benefits.
Longer contracts also give government more information about perfor
mance and increase the contractors' concern about maintaining a good
reputation, since this will affect prospects for renewal. 32 Thus, other
things being equal, a longer contract with greater possibility of renewal
reduces the contractor's incentive to run down the assets, fail to serve
the market, or otherwise sacrifice the SOE's long-term health for short
run gains, at least until the contract nears its end. Our evidence sup
ports this. As figure 3.6C shows, specified contract periods varied
widely, from twenty-five years to nine months, and the more successful contracts were generally longer ones.
Contract duration and renewal possibilities aside, concern about
reputation can be instilled by other, perhaps more powerful, factors. This was most obvious in the case of hotels, where large chains such as
Sheraton or Hilton were strongly motivated to preserve the quality of
their highly visible product. Other large firms with worldwide con
tracts, such as Booker Tate in sugar (which had fifteen of the twenty
four sugar contracts in our inventory) or Societe d'Amenagement Ur
bain et Rural (SAUR) or Generale des Eaux in water, appeared to be
motivated by a similar concern about their international reputation. In
our sample, at least, all the contracts with large international contract
ing firms were successful.
In the successful cases, governments signaled their commitment in
many ways: by investing in the costs of finding a contractor and negoti
ating a contract (in one extreme case preparatory studies and negotia
tions cost over $300,000 and lasted many months), by paying fees, by
making new investments, or by taking politically costly steps such as al
lowing layoffs or giving partial equity to the contractor.
Strikingly, in most of the less successful contracts, governments did
not signal commitment. Instead, a donor government or multilateral
lender initiated the contract process and took over costly government
responsibilities, such as selecting the contractor and paying most costs,
including the contractor's fees (table 3.11). Such arrangements reduce
costs and risks to government and, hence, government's incentives to
enforce the contract. For the contractor, the need to ascertain govern
ment commitment is eroded, since fees are guaranteed by a depend
able third party. Moreover, aid agencies often restrict the pool of po
tential contractors (to firms headquartered in the donor country, for
145
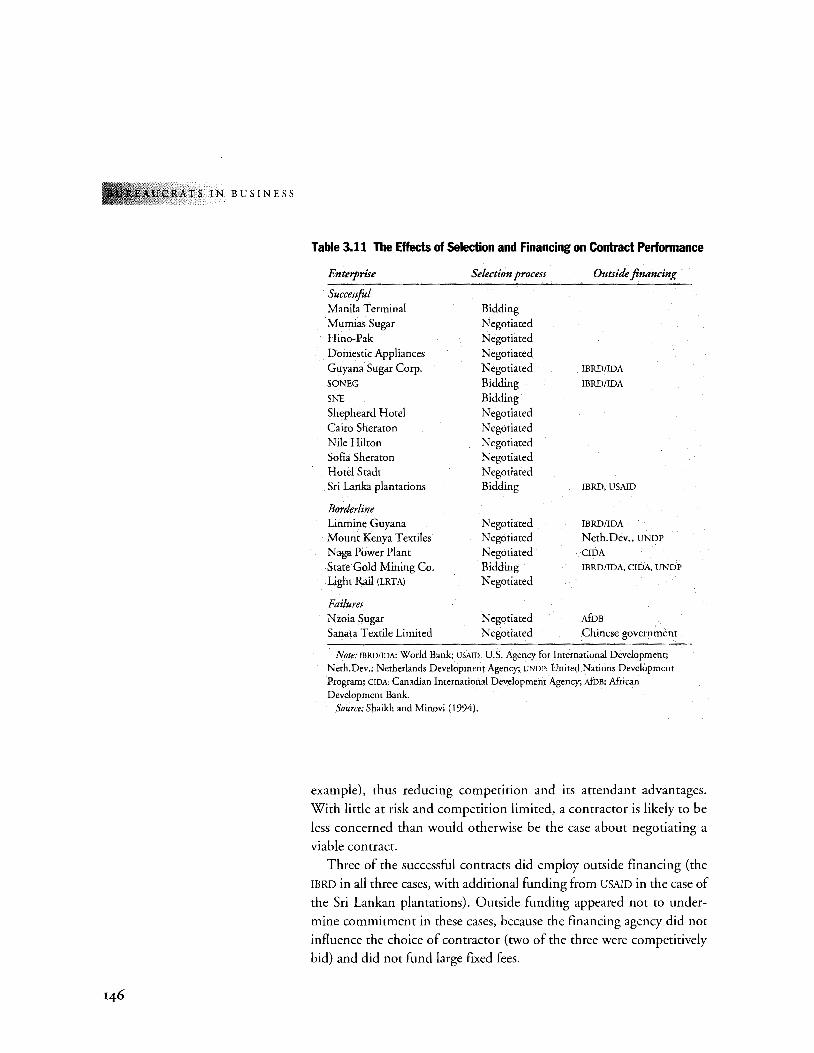
RAT S I N B U S I N E S S
146
Table 3.11 The Effects of Selection and Financing on Contract Perfonnance
Enterprise
Successful Manila Terminal Mumias Sugar Hino-Pak Domestic Appliances Guyana Sugar Corp. SO NEG
SNE
Shepheard Hotel Cairo Sheraton Nile Hilton Sofia Sheraton Hotd Stadt Sri Lanka plantations
Borderline Linmine Guyana Mount Kenya Textiles Naga Power Plant State Gold Mining Co. Light Rail (LRTA)
Failures Nzoia Sugar Sanata Textile Limited
Selection process
Bidding Negotiated Negotiated Negotiated Negotiated Bidding Bidding Negotiated Negotiated Negotiated Negotiated Negotiated Bidding
Negotiated Negotiated Negotiated Bidding Negotiated
Negotiated Negotiated
Outside financing
IBRD/IDA
!BRD/IDA
IBRD, USAID
IBRD/IDA
Neth.Dev., UNDP
CIDA
IBRD/IDA, CIDA UNDP
AfDB
Chinese government
Note: IBRDIJDA: World Bank; USA!D: U.S. Agency for International Development; Neth.Dev.: Netherlands Development Agency; UNDP: United Nations Development Program; C!DA: Canadian International Development Agency; AfDB: Mrican Development Bank.
Source: Shaikh and Minovi (1994).
example), thus reducing competition and its attendant advantages. With little at risk and competition limited, a contractor is likely to be
less concerned than would otherwise be the case about negotiating a
viable contract. Three of the successful contracts did employ outside financing (the
IBRD in all three cases, with additional funding from USAID in the case of
the Sri Lankan plantations). Outside funding appeared not to undermine commitment in these cases, because the financing agency did not
influence the choice of contractor (two of the three were competitively bid) and did not fund large fixed fees.
CONTRACTING: WHAT WORKS, WHAT DOESN'T,
Of the six other contracts with outside funding, lack of commitment
appears to have been a problem in four. For example, the Canadian aid
agency assisted in two contracts by paying the fees of Canadian contrac
tors. One of these contracts, with Ghana Gold Mines (also funded, in
part, by the IBRD, IDA, and UNDP), went forward even though a number
of government commitments crucial to the rehabilitation of the mines
never materialized, partly because the generous fixed portion of the
compensation package was not at risk.33 The other, Naga Power in the
Philippines, ended after a nine-month pilot phase when the contractor
refused to take on the second phase in the face of labor and management
opposition and lack of government backing. In the case of Mount Kenya Textiles, the contractor (AMSCO) raised
its own fees from its shareholders and development agencies, thus low
ering the government's risk; but, as we mentioned, the government later curbed AMSCO's freedom to lay off excess workers. Government com
mitment problems may also have been inherent in the way that the con
tract was initiated: impetus came not from the government, but from
the company's creditors, who feared that they would not be repaid if the
firm were liquidated.
One of the most troubled instances of outside financing involved the
Chinese government's role in the Sanata Textiles in Guyana. Under the
agreement that provided for Chinese financing, the Chinese govern
ment picked a Chinese management team, even though it was the
Guyanese government that contracted with the management. Commu
nication problems were exacerbated when two interpreters returned to
China, leaving the Chinese managers unable to communicate well with
the Guyanese managers and workers. Labor problems developed, and
there was a massive buildup of spare parts purchased from China, cou
pled with shortages of other spares.
Outside financing for the Nzoia Sugar contract from the African De
velopment Bank was not the main reason for its commitment problems.
Rather, this was a case where the contractor's large returns on a parallel
investment program made the incentives in the management contract
irrelevant. The contract for Nzoia Sugar was part of the second phase of
a larger enterprise rehabilitation project. The contractor for the first phase, ARKEL, successfully argued that the incompetency of Nzoia's
management had delayed the first phase of the rehabilitation. Hence the
government of Kenya agreed that ARKEL should manage the sugar plant while it also implemented the second phase of investments. In this case
147
RATS IN B U S I N E S S
148
the attraction of large returns on the (outside-financed) rehabilitation
program led ARKEL to propose the contract to government (which did no studies of the benefits or objectives of a contract); the contract to
which ARKEL agreed strictly limited management's control over the com
pany's finances, marketing, and even the supply of cane.
Outside financing did not harm the commitments of the govern
ment and the contractor to improve Linmine of Guyana. Rather, in
this case outside financing for rehabilitation (from the World Bank)
may be keeping alive a firm that cannot be profitable at current baux
ite prices. Thus, Linmine was technically bankrupt but was contracted
out, because the government wanted to continue to provide bauxite, while the World Bank required a management contract as a condition of its loan to rehabilitate the company.
Strikingly, of the seven contracts that were not fully successful, according to the two measurements of profitability and productivity, only one-Manila's Light Rail-did not involve outside funding of the costs to the contracting parties. In this case, the unusually close relationship between the government then in power and the contractor offers a ready explanation of the evidently poor commitment to improved performance: the contract went to a brother of Imelda Marcos, the influ
ential wife of President Ferdinand Marcos.
Why Are Management Contracts Not More Widely Used?
If the experience of our sample is typical, management contracts can work to improve the performance ofsoEs. Yet despite this success, most
countries have tried them only a few times and in relatively few sectors.
Our survey suggests the following explanations for this:
• Management contracts work better in some sectors than others.
They are most often applied to hotels, agriculture, and water for good
reasons. Governments find it less costly to monitor and enforce a contract where the supplier has an international reputation to protect, and
quality is easily compared, as with hotels; or where the technology is not changing rapidly; or where output is a single, homogeneous prod
uct, such as sugar or water. There were some exceptions; for example,
we found four management contracts for automobile production. However, these were relatively few probably because contracts are difficult to write and monitor for industries with rapidly changing technol-
CONTRACTING: WHAT WORKS, WHAT DOESN'T, AND
ogy and standards, multiple product lines, and segmented markets.
The likelihood that management contracts will be widely and success
fully implemented in such industries, especially in developing coun
tries where enforcement capacity is weak, is probably remote.
• Management contracts can have lower political costs than privatization, but they also have lower political gains.
Because management contracts are not as visible as outright sales, they
are somewhat less politically costly, but not much. Some special privi
leges of government officials may be left intact (membership on boards of directors, special rates at hotels under contract, etc.). Commonly,
however, management contracts require government actors to pay sub
stantial political costs: they must stop using the SOEs for patronage pur
poses, they must allow layoffs where appropriate, and frequently they must relinquish management control to foreigners (95 percent of the
management contracts in our inventory of 150 went to foreign firms;
the one big exception was the Sri Lankan plantations).
At the same time, many of the enterprises suitable for management
contracts are also potentially appropriate for privatization, which may
offer governments advantages not otherwise available. Many of these
contracts are with SOEs in potentially competitive sectors and could,
therefore, be sold without establishing extensive regulatory mechanisms
if market controls were abolished. Privatization gives the government
more ways to win support for reform than a contract, because it raises
more revenues and creates the potential to sell discounted shares to the
public or to workers (see chapter 4). Finally, transaction costs may be
higher with management contracts than with privatization: negotiating
and monitoring a successful contract is at least as difficult as privatizing
a competitive firm, and the costs are recurrent, since the contract must
be periodically monitored and renegotiated; a sale is final.
Management Contract Findings
Management contracts have the potential to improve SOE performance,
but they work well only in a limited number of circumstances and sectors. Our sample's experience suggests that, where the situation is right for a
management contract, they work best if the following conditions are met:
• The contract is competitively bid.
149
TS IN BUSINESS
150
• Most of the contractor's returns depend on a success fee based on
a composite measure of performance, such as profits, and the con
tractor has autonomy to take action needed to improve perfor
mance, including layoffs.
• Both parties face risks (which are not removed by outside financ
ing), hence each demands that the other take actions to prove
commitment. Government can signal commitment by agreeing to
a longer contract with the possibility for renewal and by allowing
the private manager the autonomy necessary to reap a reasonable
return. Contractors show that they are committed to making the
contract a success when they put their reputation at stake and
agree to base a significant part of their returns on performance.
• Finally, donors can help encourage the use of management con
tracts where appropriate by financing the search for a contractor
and negotiation costs, but should be careful not to dilute the stake
of either side in the success of the contract. In particular, they
should avoid putting restrictions on competition among contrac
tors or financing large fixed fees that overwhelm the incentive ef
fects of performance-based fees.
Regulatory Contracts: With Private Owners
REGULATORY CONTRACTS, THE THIRD AND FINAL CONTRACT
type we discuss in this chapter, define the relationship between
a government and the owners of a private, regulated monopoly.
These contracts typically arise when the government privatizes a state
monopoly; they represent an improvement over continued government
ownership when they provide incentives sufficient to persuade the new
owner to invest, expand service, and operate the firm efficiently, while
protecting consumers from monopoly exploitation.
Devising effective regulatory contracts has become increasingly im
portant as developing countries privatize a growing number of former
state monopolies in telecommunications, power, water, railroads, roads,
ports, and gas. The value of government sales of firms in these sectors
exploded from a mere $431 million in 1988 to nearly $6.5 billion in
1992 (table 3.12). Privatization has been tried for many types of infra
structure monopolies, but most sales have been concentrated in just two
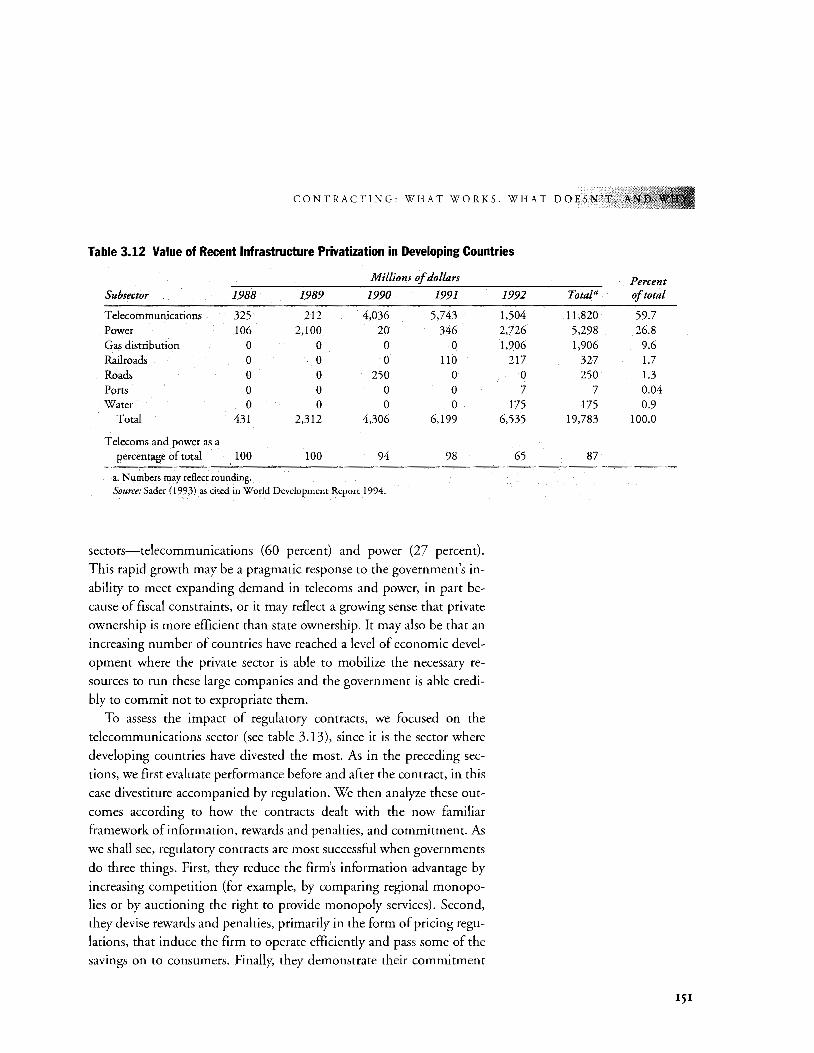
CONTRACTING: WHAT WORKS, WHAT DOESN'T,
Table 3.12 Value of Recent Infrastructure Privatization in Developing Countries
Millions of dollars
Sub sector 1988 1989 1990 1991
Telecommunications 325 212 4,036 5,743 Power 106 2,100 20 346 Gas distribution 0 0 0 0 Railroads 0 0 0 110 Roads 0 0 250 0 Ports 0 0 0 0 Water 0 0 0 0
Total 431 2,312 4,306 6,199
Telecoms and power as a percentage of total 100 100 94 98
a. Numbers may reflect rounding. Source: Sader (1993) as cited in World Development Repon 1994.
sectors-telecommunications (60 percent) and power (27 percent).
This rapid growth may be a pragmatic response to the government's in
ability to meet expanding demand in telecoms and power, in part be
cause of fiscal constraints, or it may reflect a growing sense that private
ownership is more efficient than state ownership. It may also be that an
increasing number of countries have reached a level of economic devel
opment where the private sector is able to mobilize the necessary re
sources to run these large companies and the government is able credi
bly to commit not to expropriate them.
To assess the impact of regulatory contracts, we focused on the
telecommunications sector (see table 3.13), since it is the sector where
developing countries have divested the most. As in the preceding sec
tions, we first evaluate performance before and after the contract, in this
case divestiture accompanied by regulation. We then analyze these out
comes according to how the contracts dealt with the now familiar
framework of information, rewards and penalties, and commitment. As
we shall see, regulatory contracts are most successful when governments
do three things. First, they reduce the firm's information advantage by
increasing competition (for example, by comparing regional monopo
lies or by auctioning the right to provide monopoly services). Second,
they devise rewards and penalties, primarily in the form of pricing regu
lations, that induce the firm to operate efficiently and pass some of the
savings on to consumers. Finally, they demonstrate their commitment
1992
1,504 2,726 1,906
217 0
7 175
6,535
65
Total a
11,820 5,298 1,906
327 250
7 175
19,783
87
Percent of total
59.7 26.8
9.6 1.7 1.3 0.04 0.9
100.0
151
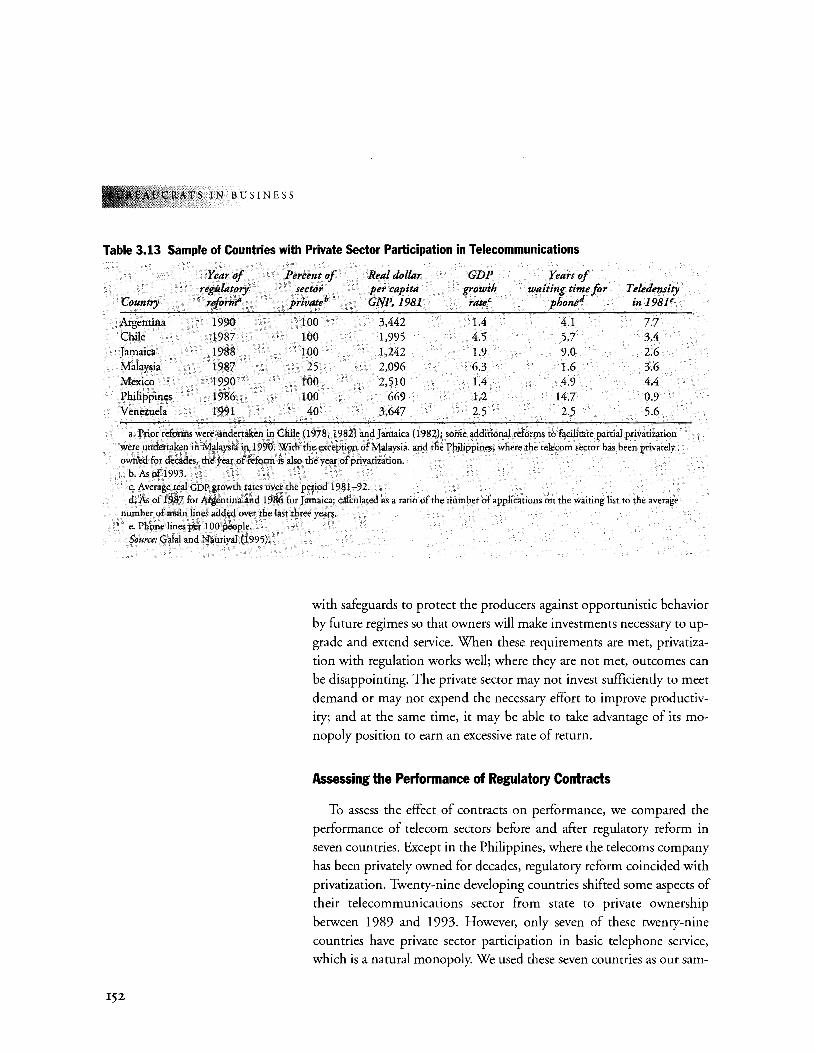
l!CI'W'"'-"'' SIN BUSINESS
Table 3.13 Sample of Countries with Private Sector Participation in Telecommunications
Year of Percent of Real dollar GDP Years of regulatory sector per capita growth waiting time for Teledensity
Country reform" privateb GNP, 1981 rate< phoned in 198le
Argentina 1990 100 3,442 1.4 4.1 7.7 Chile 1987 100 1,995 4.5 5.7 3.4 Jamaica 1988 100 1,242 1.9 9.0 2.6 Malaysia 1987 25 2,096 6.3 1.6 3.6 Mexico 1990 100 2,510 1.4 4.9 4.4 Philippines 1986 100 669 1.2 14.7 0.9 Venezuela 1991 40 3,647 2.5 2.5 5.6
a. Prior reforms were undertaken in Chile (1978, 1982) and Jamaica (1982); some additional reforms to facilitate partial privatization were undertaken in Malaysia in 1990. With the exception of Malaysia, and the Philippines, where the telecom sector has been privately owned for decades, the year of reform is also the year of privatization.
b. As ofl993. c. Average real GDP growth rates over the period 1981-92. d. As of 1987 for Argentina and 1986 for Jamaica; calculated as a ratio of the number of applications on the waiting list to the average
number of main lines added over the last three years. e. Phone lines per 100 people. Source: Gala! and Nauriyal (1995).
!52
with safeguards to protect the producers against opportunistic behavior
by future regimes so that owners will make investments necessary to up
grade and extend service. When these requirements are met, privatiza
tion with regulation works well; where they are not met, outcomes can
be disappointing. The private sector may not invest sufficiently to meet
demand or may not expend the necessary effort to improve productiv
ity; and at the same time, it may be able to take advantage of its mo
nopoly position to earn an excessive rate of return.
Assessing the Performance of Regulatory Contracts
To assess the effect of contracts on performance, we compared the
performance of telecom sectors before and after regulatory reform in
seven countries. Except in the Philippines, where the telecoms company
has been privately owned for decades, regulatory reform coincided with
privatization. Twenty-nine developing countries shifted some aspects of
their telecommunications sector from state to private ownership
between 1989 and 1993. However, only seven of these twenty-nine
countries have private sector participation in basic telephone service,
which is a natural monopoly. We used these seven countries as our sam-
CONTRACTING: WHAT WORKS, WHAT DOESN'T,
ple. Although the sample is small and not random, its diversity in terms
of economic development, rate of economic growth, initial telecoms'
development, the pace and timing of the regulatory reform, and the ex
tent of divestiture enables us to analyze different aspects of regulatory
design under a wide variety of circumstances.
We used the following indicators to assess performance: network
growth and labor productivity, rates of return to the producers, and sev
eral measures of consumer satisfaction. (Data were insufficient to assess
total factor productivity.) Our findings support the notion that private
ownership and regulation produce beneficial results to society, but the
results vary across countries. Chile, where the results were very positive, and the Philippines, where the results were negative, represent the two
extremes.
Expansion and Productivity. First we look at the contribution the contracts may have made to the economy by expanding service and im
proving productivity. Figure 3.7 shows the change in annual rates of
growth of main lines in service, and in labor productivity (as measured
by main lines in service divided by the number of employees), before
and after reform.
The figure suggests a clear pattern of improvement. Thanks to increased investment, the network expanded dramatically in the post
reform period in all countries except Malaysia and the Philippines.
Labor productivity also improved significantly in all countries, except
Jamaica (where productivity declined) and the Philippines (where pro
ductivity showed negligible improvement). The significant investment
in five of the seven countries implies private sector confidence that gov
ernment will not behave opportunistically. At the same time, the large
improvements in labor productivity (again in five countries out of
seven) suggests that regulatory reforms have been effective in inducing
firms to improve efficiency. As we shall see, where expansion and pro
ductivity stagnated or declined, as in the Philippines, the regulatory re
forms have not adequately resolved the information, rewards and penal
ties, and commitment problems.
Returns to Capital. Looking next at returns to producers, we find that
the average (aftertax) returns on net worth (figure 3.7) improved in all
countries, suggesting that assets were more productive under private
ownership than they had been under state ownership. (Net worth is used as a denominator because reliable data on revalued assets were not
available.) However, returns exhibit a large variance around the mean.
153
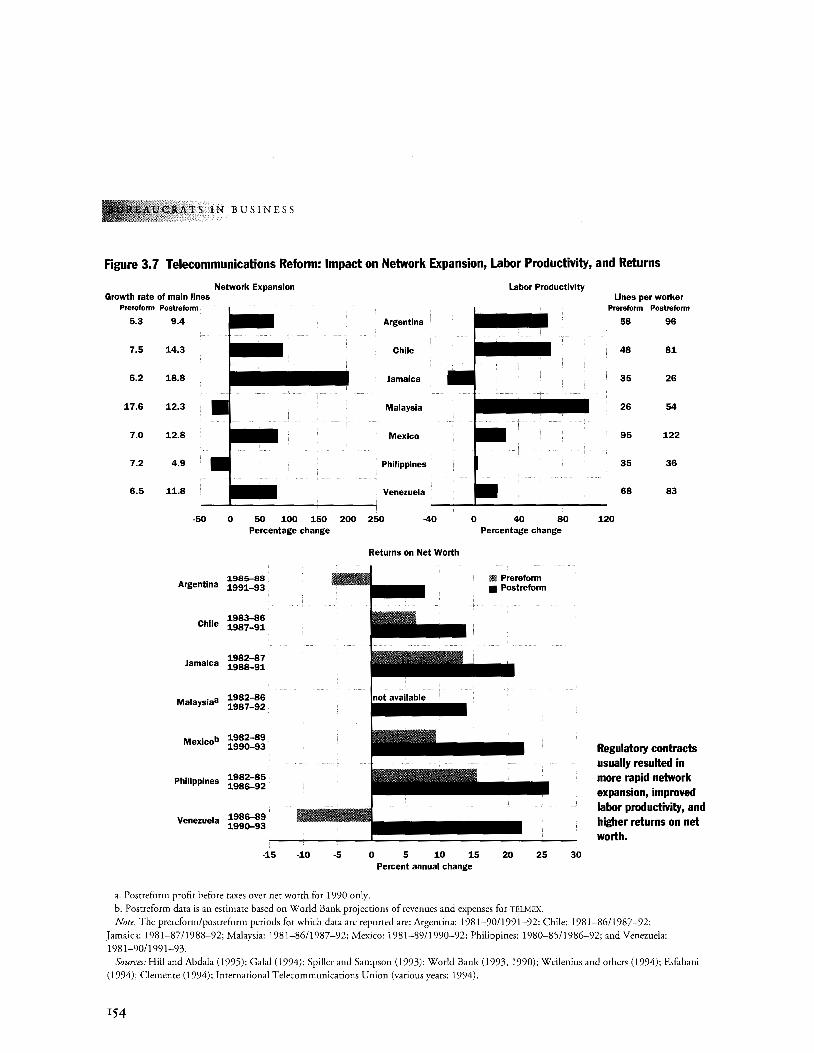
TS IN BUSINESS
Figure 3.7 Telecommunications Reform: Impact on Network Expansion, Labor Productivity, and Returns
Network Expansion Growth rate of main lines
Prereform Postreform
5.3 9.4 Argentina
7.5 1.4.3 Chile
6.2 18.8 Jamaica
1.7.6 1.2.3 Malaysia
7.0 1.2.8 Mexico
7.2 4.9 Philippines
6.5 1.1..8 Venezuela
·50 0 50 1.00 1.50 200 250 40 0 Percentage change
Returns on Net Worth
1985-88 Argentina 1.991.-93
1.983-86 Chile 1.987-91.
1.982-87 Jamaica 1.988-91.
Malaysiaa 1.982-86 1.987-92
1.982-89 Mexicob 1.990-93
1.982-85 Philippines 1.986-92
1.986-89 Venezuela 1990-93
·1.5 ·1.0 ·5 0 5 1.0 1.5 Percent annual change
a. Postreform profit before taxes over net worth for 1990 only.
Labor Productivity
40 80 Percentage change
VI Prereform • Postreform
20 25 30
b. Posrreform data is an estimate based on World Bank projections of revenues and expenses for TELMEX.
Lines per worker Prereform Postreform
58 96
48 81.
35 26
26 54
95 1.22
35 36
68 83
1.20
Regulatory contracts usually resulted in more rapid network expansion, improved labor productivity, and higher returns on net worth.
Note: The prereform/postreform periods for which data are reported are: Argentina: 198 I -90/1991-92; Chile: 1981-86/1987-92; Jamaica: I981-87/I988-92; Malaysia: 1981-86/[987-92; Mexico: 1981-89/1990-92; Philippines: 1980-85/1986-92; and Venezuela: I 981-90/I 991-93.
Sources: Hill andAbdala (1995); Gala! (1994); Spiller and Sampson (1993); World Bank (1993, 1990); Wellenius and others (1994); Esfahani (1994): Clemente (1994); International Telecommunications Union (various years; 1994).
154
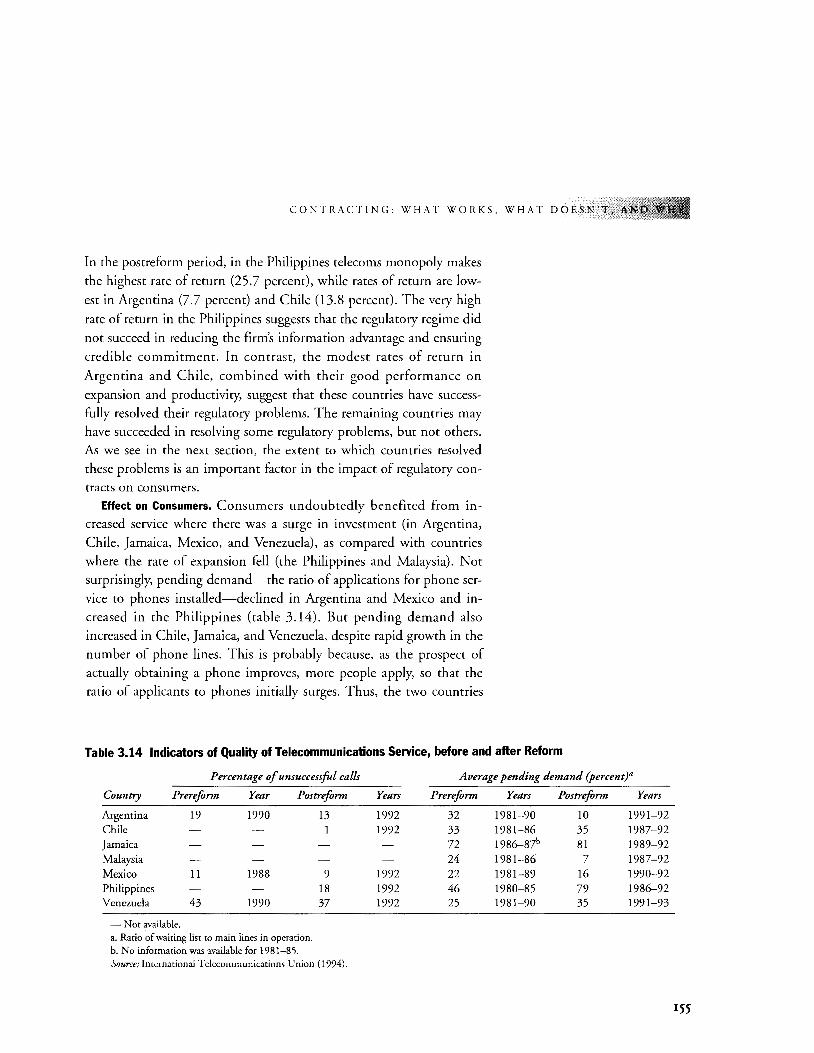
CONTRACTING: WHAT WORKS, WHAT DOESN'T, A
In the postreform period, in the Philippines telecoms monopoly makes
the highest rate of return (25.7 percent), while rates of return are low
est in Argentina (7.7 percent) and Chile (13.8 percent). The very high
rate of return in the Philippines suggests that the regulatory regime did
not succeed in reducing the firm's information advantage and ensuring
credible commitment. In contrast, the modest rates of return in
Argentina and Chile, combined with their good performance on
expansion and productivity, suggest that these countries have success
fully resolved their regulatory problems. The remaining countries may
have succeeded in resolving some regulatory problems, bur not others. As we see in the next section, the extent to which countries resolved
these problems is an important factor in the impact of regulatory con
tracts on consumers. Effect on Consumers. Consumers undoubtedly benefited from in
creased service where there was a surge in investment (in Argentina,
Chile, Jamaica, Mexico, and Venezuela), as compared with countries
where the rate of expansion fell (the Philippines and Malaysia). Not
surprisingly, pending demand-the ratio of applications for phone ser
vice to phones installed-declined in Argentina and Mexico and in
creased in the Philippines (table 3.14). But pending demand also
increased in Chile, Jamaica, and Venezuela, despite rapid growth in the
number of phone lines. This is probably because, as the prospect of
actually obtaining a phone improves, more people apply, so that the
ratio of applicants to phones initially surges. Thus, the two countries
Table 3.14 Indicators of Quality of Telecommunications Service, before and after Reform
Percentage of unsuccessful calls Average pending demand (percent}"
Country Prereform Year Postreform Years Prereform Years Postreform Years
Argentina 19 1990 13 1992 32 1981-90 10 1991-92 Chile - - 1 1992 33 1981-86 35 1987-92 Jamaica - - - 72 1986-87b 81 1989-92 Malaysia - - 24 1981-86 7 1987-92 Mexico 11 1988 9 1992 22 1981-89 16 1990-92 Philippines - 18 1992 46 1980-85 79 1986-92 Venezuela 43 1990 37 1992 25 1981-90 35 1991-93
-Not available. a. Ratio of waiting list to main lines in operation. b. No information was available for 1981-85. Source: International Telecommunications Union (1994).
I 55
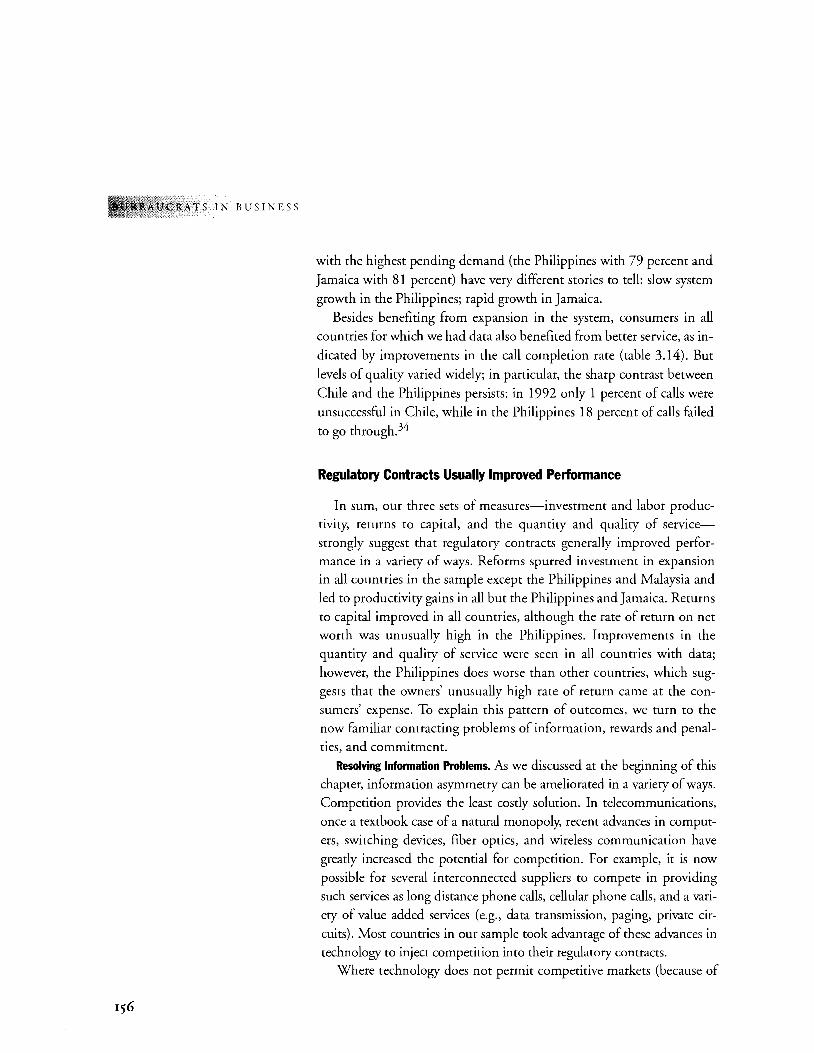
CRATS IN BUSINESS
I 56
with the highest pending demand (the Philippines with 79 percent and
Jamaica with 81 percent) have very different stories to tell: slow system
growth in the Philippines; rapid growth in Jamaica.
Besides benefiting from expansion in the system, consumers in all countries for which we had data also benefited from better service, as in
dicated by improvements in the call completion rate (table 3.14). But
levels of quality varied widely; in particular, the sharp contrast between
Chile and the Philippines persists: in 1992 only 1 percent of calls were
unsuccessful in Chile, while in the Philippines 18 percent of calls failed
to go through. 34
Regulatory Contracts Usually Improved Performance
In sum, our three sets of measures-investment and labor productivity, returns to capital, and the quantity and quality of service
strongly suggest that regulatory contracts generally improved performance in a variety of ways. Reforms spurred investment in expansion in all countries in the sample except the Philippines and Malaysia and
led to productivity gains in all but the Philippines and Jamaica. Returns to capital improved in all countries, although the rate of return on net worth was unusually high in the Philippines. Improvements in the quantity and quality of service were seen in all countries with data;
however, the Philippines does worse than other countries, which suggests that the owners' unusually high rate of return came at the consumers' expense. To explain this pattern of outcomes, we turn to the now familiar contracting problems of information, rewards and penalties, and commitment.
Resolving Information Problems. As we discussed at the beginning of this chapter, information asymmetry can be ameliorated in a variety of ways. Competition provides the least costly solution. In telecommunications,
once a textbook case of a natural monopoly, recent advances in comput
ers, switching devices, fiber optics, and wireless communication have
greatly increased the potential for competition. For example, it is now possible for several interconnected suppliers to compete in providing
such services as long distance phone calls, cellular phone calls, and a variety of value added services (e.g., data transmission, paging, private cir
cuits). Most countries in our sample took advantage of these advances in technology to inject competition into their regulatory contracts.
Where technology does not permit competitive markets (because of
CONTRACTING: WHAT WORKS, WHAT DOESN'T, AN
the economies of scale, for example, in laying the cable and wires for
local networks), there are other ways to introduce competition. Auc
tions for the right to provide basic telephone service can extract infor
mation, and the threat of competition after the contract is granted can
induce the provider to operate efficiently. Contracting with several sup
pliers in one country (even if each supplier is a regional monopoly) en
ables the regulator to compare performance across firms. Barring collu
sion between the firms, such so-called yardstick competition gives the
regulator a mechanism to verify information provided by individual
firms and to gather information about the impact of common environ
mental factors (e.g., weather) on relative performance. Finally, govern
ments can discipline firms by threatening to transfer contracts to rival
suppliers if the incumbents fail to meet contracted targets.
Table 3.15 shows the extent to which each country in the sample
used these mechanisms, as revealed by the market structure of their tele
com sectors, the process used to award the franchise, and the use of the
threat of competition to discipline incumbent firms. All countries in the
sample except Jamaica, which we discuss below, introduced competition
in the market for value added services. For basic services, all countries
except Argentina ended up essentially with a monopoly. Argentina in
troduced yardstick competition, splitting the market into two regional
monopolies-one in the north and another in the south. Although
Chile and the Philippines legally permit entry into the market for basic
services, in practice, the dominant firm in each country has a market
share of about 95 percent.
Table 3.15 Mechanisms for Revealing Information about Telecommunications
Market structure Bidding/auctions
Country Basic services Value added services Basic services
Argentina Duopoly" Competitive Yes Chile Free entry Competitive Yes Jamaica Monopoly Monopoly No Malaysia Monopoly Competitive No Mexico Monopoly Competitive Yes Philippines Free entryb Competitive No Venezuela Monopoly Competitive Yes
a. Regional monopolies-one confined to operations in the north and the other to the south.
Contestability
Basic services
Partial Full None None Partial Partial Partial
b. There are about sixty telecom service operators, but PLDT, the main operator, controls 94 percent of all telephones. Source: Gala! and Nauriyal (1995).
157
UCRATS IN BUSINESS
158
Four countries awarded contracts through international bidding: Ar
gentina, Chile, Mexico, and Venezuela. Since all received at least two
bids from potential suppliers, it is likely that the auctions provided in
formation that limited the ability of the winners to extract information
rents. The three other countries in our sample did not use competitive
bids to compel firms to reveal information. The costs of not holding an
auction are least evident in Malaysia, where the government sold only
25 percent of the telecoms monopoly assets to the private sector and
management continued to be dominated by the state bureaucracy. Even
so, the lack of an auction, combined with the minority equity sold to the
private sector, may explain why Malaysia was one of the few countries
where private investment did not increase after the contract. Jamaica ne
gotiated an exclusive concession with Cable & Wireless for basic and
value added services for twenty-five years. As for the Philippines, the Philippine Long Distance Telephone Company has operated as a private
monopoly for decades. In such a case, even if the initial process of
awarding the license involved competitive bidding, technology has since changed so much that the value of that information to the regulator is
likely to have evaporated.
Our sample countries also varied in the extent to which they used
performance targets as a mechanism to discipline the behavior of firms.
On the one hand, Argentina, Chile, Jamaica, Mexico, and Venezuela all
included provisions in the operator's license, sector regulation, or sales
contract requiring the private operator to meet specific network expan
sion and service quality targets. Also included was a stipulation that fail
ure to meet these obligations is grounds for the government to revoke
the concession and award it to another supplier. In contrast, Malaysia
and the Philippines did not explicitly state such a threat in their regula
tory framework.
The different ways our sample countries used competition helps ex
plain the relatively high rate of return in the Philippines and Jamaica
and the relatively low rates of return in Chile and Argentina. However,
rates of return also depend on the pricing regime and the credibility of
government commitment. We deal with the pricing regime next.
Price Regulation as a Mechanism for Rewards and Penalties. Price regulation
is the most important mechanism that governments have for rewarding
or penalizing the owners of private, regulated monopolies such as those
in our sample. An ideal price regulating system will provide owners with incentives to invest and improve service and will reward improvements
C ONT RACTI N G: WHAT WORKS, WHAT DOESN'T, AN
in efficiency, while at the same time passing on the largest possible share
of the resulting savings to consumers. In short, ideal price regulation will
achieve outcomes very similar to a competitive market. In this section,
we briefly describe the strengths and weaknesses of various types of price
regulation in telecommunication, then analyze how the use of particular
schemes in the countries in our sample influenced outcomes.
Schemes to regulate the price of basic telephone services include rate
of return, price caps, and benchmark regulations. Each of these pricing
schemes has its own incentive properties, which have been discussed at
length elsewhere. Briefly, under rate of return regulation, prices are set so
that the firm can recover its costs and make a fair rate of return. This
scheme has been criticized on the grounds that it induces a firm to in
flate costs, invest excessively, and engage in cross subsidization by shift
ing costs from services in which it faces competition to those regulated
services in which it does not.
Price caps and benchmark regulations both potentially work better
than rate of return in motivating producers to reduce their costs and pass
some of the savings on to consumers. Under price cap regulation, regula
tors impose a ceiling, often based on the retail price index, on the average
tariff increase for a prespecified basket of services in which the firm has a
monopoly. The regulator can periodically change the pricing formula so
that improvements in efficiency are passed on to the consumers. In the
ory, this avoids the problems inherent in rate of return regulation, since
firms are protected from inflation and have no incentive to expand their
asset base inefficiently; but, to the contrary, they can capture any benefits
from improved efficiency that lowers costs below the price ceiling in the
period between adjustments in the pricing formula. Benchmark regula
tion works on a similar principle, except that prices are set according to
the costs of a similar firm elsewhere or a hypothetical efficient firm.
Again, management has an incentive to improve efficiency, because the
firm reaps the benefits until prices are renegotiated. Too frequent down
ward adjustments in the pricing formula under either system reduce the
incentive for the firm to curb costs in order to reap any savings until the
next adjustment; they are also costly and cumbersome to administer. Box
3.4 describes how these two forms of regulation operate and some of the
advantages and potential problems with each.
Table 3.16 shows the pricing regimes, the frequency of their revi
sions, the adjustment for inflation, and the parameter for setting prices
(explained in box 3.4) for our sample. Only Jamaica and the Philippines
159
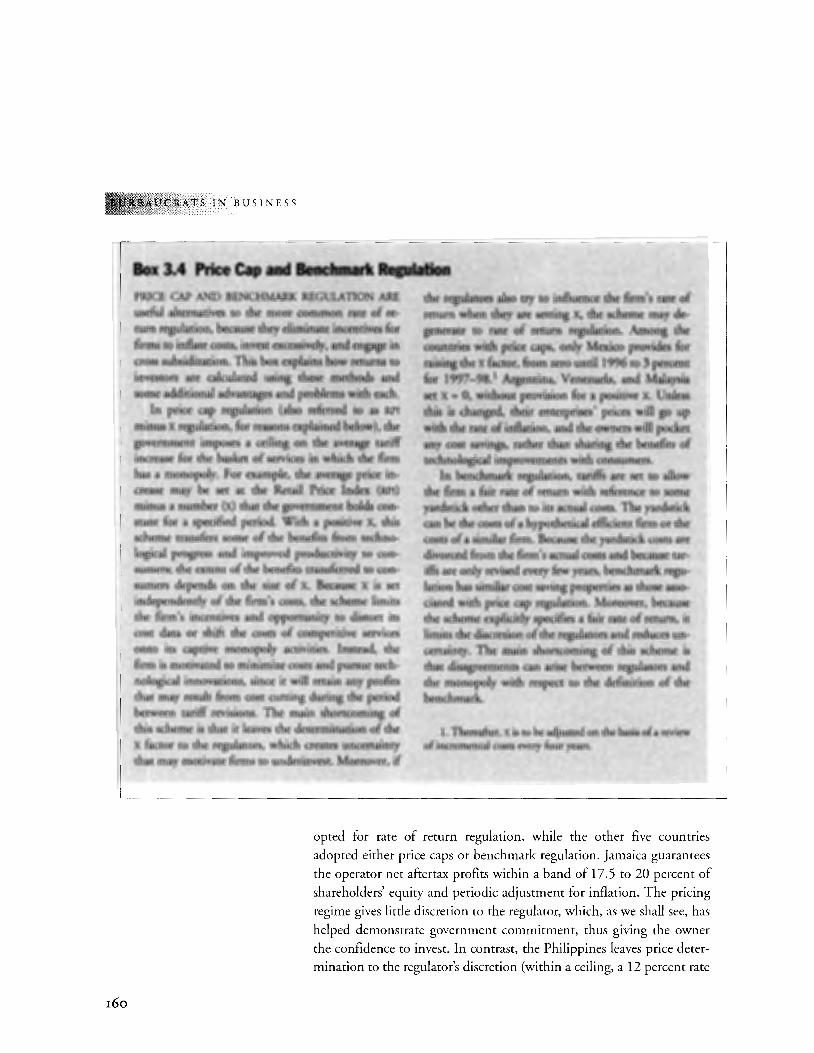
160
RATS IN BUSINESS
Box 3.4 Price Cap aad Benchmark Regulation PRICE CAP AND BENCHMARK REGULATION ARE useful alternatives to the more common rate of return regulation, because they eliminate incentives for firms to inflate costs, invest excessively, and engage in cross subsidization. This box explains how returns to investors are calculated using these methods· and some additional advantages and problems with each.
In price cap regulation (also referred to as RPI minus x regulation, for reasons explained below), the government imposes a ceiling on the average tariff increase for the basket of services in whi:ch the firm has a monopoly. For example, the average price increase may be set at the Retail Price Index {RPI) minus a number (X) that the government holds constant for a specified period. With a positive x, this scheme transfers some of the benefits from technological progress and improved productivity to consumers; the extent of the benefits transferred to consumers depends on the size ·of X. Because X is set independently of the firm's costs, the scheme limits the firm's incentives and opponunity to distort its cost data or shift the costs of competitive services onto its captive monopoly activities. Instead, the firm is motivated to minimize costs and pursue technological innovations, since it will retain any profits that may result from cost cutting during the period between tariff revisions. The main shoncoming of this scheme is that it leaves the determination of the X factor ro the regulators, which creates uncenainty that may motivate firms to underinvest. Moreover, if
the regulators also try to influence the firm's rate of return when they are setting x, the scheme may degenerate to rate of return regulation. Among the countries with price caps, only Mexico provides for raising the X factor, from zero untill996 to 3 percent for 1997-,98. 1 Argentina, Venezuela, and M;Uaysia set X "' 0, without provision for a. positive X. Unless this is changed, their enterprises' prices will go up with the rate of inflation, and the owners witl pocket any cost savings, rather than. sharing the benefits of technological improvements with consumers.
In benchmark regulation, tariffs are set to allow the firm a fair rate of rerurn with reference to some yardstick other .than. to its actual costs. The yardstick can be the costs of a hypothetical efficient firm or the costs of a similar firm. Because the yardstick costs are divorced from the firm's actual costs and because tar· iffs are only revised every few years, benchmark regu· lation has similar cost saving properties as those associated with price cap regulation. Moreover, because the scheme explicitly specifies a fair rate of return, it limits the discretion of the regulators and reduces uncertainty. The main shortcoming of this scheme is that disagreements can arise between regulators and the monopoly with respect to the definition of the benchmark.
I. Thereafter, xis to be adjusted on the basis of a review of incremental costs every four years.
opted for rate of return regulation, while the other five countries
adopted either price caps or benchmark regulation. Jamaica guarantees
the operator net aftertax profits within a band of 17.5 to 20 percent of
shareholders' equity and periodic adjustment for inflation. The pricing
regime gives little discretion to the regulator, which, as we shall see, has
helped demonstrate government commitment, thus giving the owner
the confidence to invest. In contrast, the Philippines leaves price deter
mination to the regulator's discretion (within a ceiling, a 12 percent rate
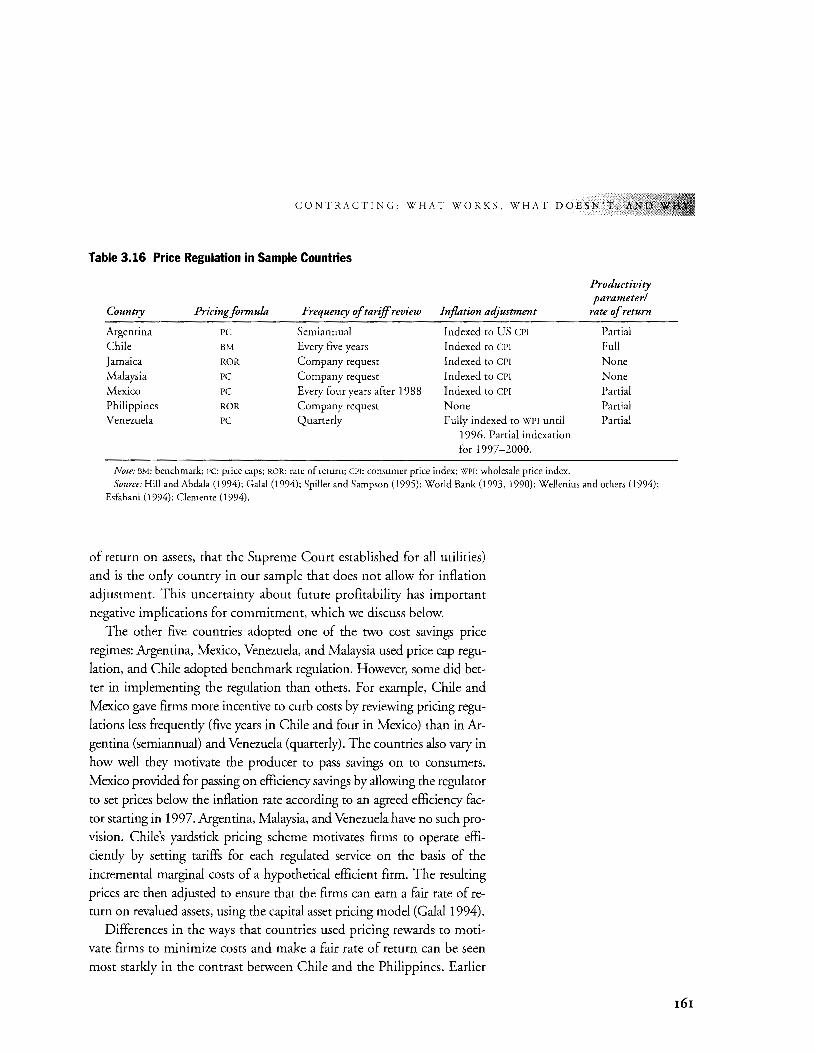
CONTRACTING: WHAT WORKS, WHAT DOESN'T, AN
Table 3.16 Price Regulation in Sample Countries
Productivity parameter/
Country Pricing formula Frequency of tariff review Inflation adjustment rate of return
Argentina PC Semiannual Indexed to US CPI Partial Chile BM Every five years Indexed to CPI Full Jamaica ROR Company request Indexed to CPI None Malaysia PC Company request Indexed to CPI None Mexico PC Every four years after 1988 Indexed to CPI Partial Philippines ROR Company request None Partial Venezuela PC Quarterly Fully indexed to WPI until Partial
1996. Partial indexation for 1997-2000.
Note: BM: benchmark; PC: price caps; ROR: rate of return; CPI: consumer price index; WPI: wholesale price index. Source: Hill and Abdala (1994); Gala! (1994); Spiller and Sampson (1995); World Bank (1993, 1990); Wellenius and others (1994);
Esfahani (1994); Clemente (1994).
of return on assets, that the Supreme Court established for all utilities)
and is the only country in our sample that does not allow for inflation
adjustment. This uncertainty about future profitability has important
negative implications for commitment, which we discuss below.
The other five countries adopted one of the two cost savings price
regimes: Argentina, Mexico, Venezuela, and Malaysia used price cap regu
lation, and Chile adopted benchmark regulation. However, some did bet
ter in implementing the regulation than others. For example, Chile and
Mexico gave firms more incentive to curb costs by reviewing pricing regu
lations less frequently (five years in Chile and four in Mexico) than in Ar
gentina (semiannual) and Venezuela (quarterly). The countries also vary in
how well they motivate the producer to pass savings on to consumers.
Mexico provided for passing on efficiency savings by allowing the regulator
to set prices below the inflation rate according to an agreed efficiency fac
tor starting in 1997. Argentina, Malaysia, and Venezuela have no such pro
vision. Chile's yardstick pricing scheme motivates firms to operate effi
ciently by setting tariffs for each regulated service on the basis of the
incremental marginal costs of a hypothetical efficient firm. The resulting
prices are then adjusted to ensure that the firms can earn a fair rate of return on revalued assets, using the capital asset pricing model (Galall994).
Differences in the ways that countries used pricing rewards to moti
vate firms to minimize costs and make a fair rate of return can be seen
most starkly in the contrast between Chile and the Philippines. Earlier
r6r
RATS IN BUSINESS
162
we discussed how Chile, one of the best performers on our measures of
productivity and service, allocated the franchise to the private sector.
Chile used international bidding and included provisions in the bench
mark regulation to revoke the license if the firm did not meet agreed tar
gets. It also used benchmark regulation for setting prices, which pro
vided an incentive for the firm not to behave opportunistically. In
contrast, the Philippines, one of the worst performers, did not utilize
these information-extracting mechanisms. Nor did the Philippine gov
ernment use rewards to counter the firm's information advantage; it
merely put a ceiling on the operator's returns. Of the remaining coun
tries, Argentina and Mexico fall closer to Chile, Jamaica and Venezuela
fall closer to the Philippines. The Malaysian experience is still in its in
fancy in the sense that the private sector only has a minority sharehold
ing and that the regulation is still dominated by bureaucratic control.
Resolving the Commitment Problem
As noted earlier, monopoly owners who fear that the government will
expropriate their assets or set prices in ways that preclude a reasonable
profit minimize risk by underinvesting. Governments that count on pri
vate monopoly owners to make the investments necessary to expand ser
vice, particularly in a crucial sector like telecommunications, therefore,
have a strong incentive to demonstrate commitment to abide by the con
tract. Even so, some governments did this much more successfully than
others. In this section, we consider how the countries in our sample es
tablished their commitment by specifYing conflict resolution mecha
nisms, assigning enforcement of regulation to appropriate agencies, and
insulating the regulatory regime from capricious political behavior.
Conflict Resolution Mechanisms. All countries in the sample anticipated
conflicts over pricing, entry, and interconnection and devised rules to
deal with them. But some stated the rules more clearly than others.
Theory suggests that the rules will be more credible, and investors
more confident, when the rules are explicit. Although we cannot
directly measure this relationship, the evidence from our sample sug
gests that this is the case. Rules were spelled out most dearly in Chile
and Jamaica and were vaguest in Argentina, Malaysia, and Venezuela,
with Mexico falling somewhere in between. In the Philippines, conflict
resolution procedures were relatively clear, but uncertainty about basic regulations offset this potential advantage.
CONTRACTING: WHAT WORKS, WHAT DOESN'T, AND'\Wl
Chile's regulation defines step-by-step procedures for arbitration and
appeals. For example, disputes between the firm and regulator over pric
ing are resolved through a three-member arbitration committee, with
one member selected by each of the two parties and the third by mutual
agreement. Disputes over entry are resolved by a government appointed
antitrust commission, with possible appeal to the Supreme Court. Dis
putes over interconnection are subject to binding arbitration. Similarly,
in Jamaica, conflicts pertaining to tariff adjustments are subject to bind
ing arbitration. In addition, the operating license explicitly grants the
firm the right to appeal any breach of the terms of the agreement on the
part of the government to the Supreme Court, whose ruling can be subjected to review by the Judicial Committee of the Privy Council in Lon
don. The combination of granting the operator a specific license and the
possible appeal outside the country make the regulatory regime credible in Jamaica. Although the courts are known for their independence, em
bodying the regulation in a law as in Chile would not have worked be
cause in a parliamentary system such as Jamaica's, a new government
may overturn laws enacted under a previous government.
In contrast, although firms in Argentina have the right to bring dis
putes concerning pricing, entry, or interconnection to the attention of
the newly established regulatory agency (CNT), the latter's decisions can
only be appealed to the national executive (the Minister of Economy). In
Malaysia, conflicts are first referred to the regulatory agency; beyond that
the procedure is not well defined and often results in ad hoc processes
that culminate in decisions by the minister. In Venezuela, disputes over
interconnection are resolved through arbitration at the request of either
party without further appeal. However, disputes regarding tariffs can
only be brought to the attention of the regulatory agency ( CONATEL), and
it is unclear what recourse the company has beyond that.
In the Philippines, there is an explicit procedure to appeal to the
Supreme Court to restrain regulatory discretion and resolve conflicts
over tariffs, entry, and interconnections. However, because the regula
tory rules themselves are not clearly defined, the process lacks the basis
on which to make such appeals. Nowhere is this more apparent than in
price regulation, which, as we have seen, just sets a ceiling on the rate of
return without explicit provisions for inflation adjustment. Enforcement. Enforcement is most effective when it is in the hands of
a neutral agency with the power to enforce and the capacity to process
the necessary information (table 3.17 defines the agencies in our sam-
163
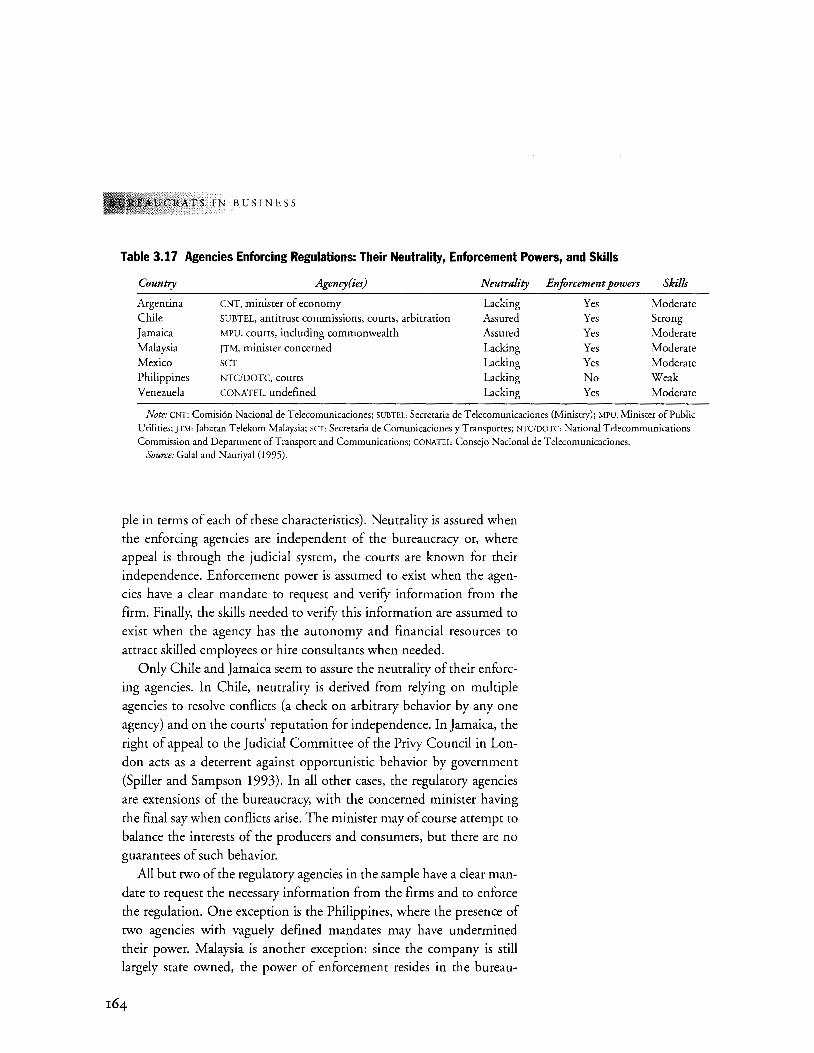
C RATS I N B U S I N E S S
Table 3.17 Agencies Enforcing Regulations: Their Neutrality, Enforcement Powers, and Skills
Country Agency(ies} Neutrality Enforcement powers Skills
Argentina CNT, minister of economy Lacking Yes Moderate Chile SUBTEL, antitrust commissions, courts, arbitration Assured Yes Strong Jamaica MPU, courts, including commonwealth Assured Yes Moderate Malaysia ]TM, minister concerned Lacking Yes Moderate Mexico SCT Lacking Yes Moderate Philippines NTC/DOTC, courts Lacking No Weak Venezuela CONATEL, undefined Lacking Yes Moderate
Note: CNT: Comisi6n Nacional de T elecomunicaciones; SUB TEL Secretaria de Telecomunicaciones (Ministry); MPu, Minister of Public
Utilities; JTM: Jab a tan T elekom Malaysia; SCT: Secretaria de Comunicaciones y Transportes; NTC/DOTC: National Telecommunications Commission and Department ofTransport and Communications; CONATEL: Consejo Nacional de Telecomunicaciones.
Source: Gala! and Nauriyal (1995).
ple in terms of each of these characteristics). Neutrality is assured when the enforcing agencies are independent of the bureaucracy or, where appeal is through the judicial system, the courts are known for their independence. Enforcement power is assumed to exist when the agen
cies have a clear mandate to request and verifY information from the firm. Finally, the skills needed to verifY this information are assumed to exist when the agency has the autonomy and financial resources to
attract skilled employees or hire consultants when needed.
Only Chile and Jamaica seem to assure the neutrality of their enforcing agencies. In Chile, neutrality is derived from relying on multiple agencies to resolve conflicts (a check on arbitrary behavior by any one
agency) and on the courts' reputation for independence. In Jamaica, the
right of appeal to the Judicial Committee of the Privy Council in London acts as a deterrent against opportunistic behavior by government
(Spiller and Sampson 1993). In all other cases, the regulatory agencies are extensions of the bureaucracy, with the concerned minister having
the final say when conflicts arise. The minister may of course attempt to balance the interests of the producers and consumers, but there are no guarantees of such behavior.
All but two of the regulatory agencies in the sample have a clear man
date to request the necessary information from the firms and to enforce the regulation. One exception is the Philippines, where the presence of
two agencies with vaguely defined mandates may have undermined their power. Malaysia is another exception: since the company is still largely state owned, the power of enforcement resides in the bureau-
164
CONTRACTING: WHAT WORKS, WHAT DOESN'T, AND
cracy. Thus, although Malaysia's regulatory agency is modeled after the
United Kingdom's telecom regulatory agency and headed by a director
general, the minister still approves all tariffs and licensing decisions.35
Finally, it appears that the regulatory agencies are generally at a disadvantage compared with the firms they regulate. In large measure, this is
because of low civil service salaries, which makes it hard to attract and
keep employees with the necessary skills to process the information and
negotiate with their better-paid, better-informed, and probably bettermotivated counterparts. In Chile, Mexico, and Argentina, these problems
were resolved in part by relying on external consultants to prepare proposals, for example, for tariff revisions. Venezuela's regulatory agency was
not as successful. It was supposed to finance its operations from licensing and other fees. In reality, however, these resources proved inadequate. This has constrained its capacity to review tariffs quarterly, delaying tariff increases promised to the firm under its pricing regulation for 1993.
Insulating Regulators from Politics. Finally, our sample countries attempted, with varying degrees of success, to insulate their regulatory regimes against arbitrary changes arising from political turnover. Chile
and Jamaica seem to have succeeded the most, while the Philippines has been the least successful. Chile resolved this problem by enacting
its regulation in a detailed law. The country has a long history of a divided legislature where the executive branch seldom has a majority, which means that laws are difficult to change. Moreover, the judicial
system and constitution historically upheld private property rights, for example, against nationalization during the Allende administration in
the early 1970s and land expropriation in the 1960s. Both factors seem to have made credible the government commitment not to behave
opportunistically. In Jamaica, the commitment problem was resolved differently. The
regulatory regime was incorporated in an explicit license that stipulated
a specific rate of return and other terms of operations as well as the conditions under which both parties (firm and regulator) can change the li
cense. To make this agreement binding or costly for the government to
renege, it was stipulated that any rulings by the supreme court regarding violations of the terms of the license would be subject to review by the Judicial Committee of the Privy Council in London. This solution was more credible in Jamaica than Chile's approach would have been, because laws can be frequently overturned in Jamaica's parliamentary system, as new administrations enjoy a majority in congress.
165
RATS IN B U S I N E S S
!66
The Philippines, on the other hand, illustrates how politics can erode
the credibility of regulation. Between 1972 and 1986, power was con
centrated in the executive branch, and there were few constraints on ad
ministrative discretion. The independence of the judiciary was compro
mised because the president was empowered to remove any judge. As a
result, the Marcos government could not credibly commit that it would
adhere to certain policies and not behave opportunistically (Esfahani
1994). Mter 1986, although the Marcos government had lost power,
business allies of the old regime who benefited from the status quo in
telecommunications retained enough influence through political insti
tutions (such as Congress) to forestall the introduction of competition or other reforms in the sector.
Mexico, Argentina, Venezuela, and Malaysia were more successful
than the Philippines but less successful than Chile and Jamaica in creat
ing credible commitment mechanisms. They regulated by decree or sale
contracts, left conflict resolution ill defined, and allowed the concerned minister wide discretion. The greater the chance that presidential decrees and sale contracts can be reversed, the weaker the credibility of a con
tract's safeguards against opportunistic behavior on the part of successive
governments. It has been suggested that reputation and concern for the
success of economic reform may mitigate the negative effect of this
arrangement, but the long-term effect remains uncertain. For example,
Mexico's concern about establishing its reputation as a reformer and its
commitment to signing NAFTA, plus the widespread distribution of shares
in TELMEX, may have reassured investors that government would sustain
the contract, at least in the medium term. However, Venezuela seems to
have been able to overcome the adverse effects of dubious commitment
on investment by providing companies with relatively large returns,
which can be viewed as a premium against the risk of adverse regulatory
decisions in the longer term. Logically, one would expect Argentina to
have to offer higher returns as well; there, yardstick competition may
have helped to minimize rates of return. Malaysia only sold minority
shares, and its reputation as a responsible majority partner in other com
panies may have given it credibility with investors. Malaysia's bureau
cratic solution seems to have kept returns at a reasonable level, but in
vestment has declined rather than increased with private involvement.
In sum, the different levels of investment reflect the different degrees
of success that governments have had in convincing investors that they are committed to their contracts and that this commitment would be
CONTRACTING: WHAT WORKS, WHAT DOESN'T, A
sustained even when the government changed. Chile and Jamaica found
the most credible commitment mechanisms, which helps explain the
upsurge in investment in these rwo countries. Chile explicitly provided
for conflict resolution and assigned the enforcement of the regulation to
multiple agencies, many of which have a reputation for independence.
It also encoded the telecoms regulations in a law, which is difficult to
change in Chile. Similarly, Jamaica prespecified how conflicts would be
resolved and incorporated these covenants in an explicit license that al
lows disputes to be appealed in London. Mexico, Argentina, and
Venezuela did less well but made up for it in other ways, and Malaysia's
partial sale of shares was not enough to spur new investment. Finally,
commitment to regulation in the Philippines leaves the most to be de
sired. Although disputes are referred to the court system, the regulatory rules are not stated explicitly, the enforcing agencies do not have clear mandates, and the judiciary is weakened by the influence of the presi
dent through the appointment of judges.
Regulatory Contract Findings
Although our sample is small and not random, it includes all devel
oping countries that have recently privatized state monopolies in basic
telephone service. Our analysis of the outcomes in these seven countries
shows significant expansion of the nerwork and improved productivity
in the majority of cases after reform. Although we could not compare
this outcome with a counterfactual, one study that did so for Chile and
Mexico (among others) attributed substantial gains to the privatization
(Galal and others 1994).
Norwithstanding this success, there was a wide range of country out
comes. The variance can be traced to differences in the regulatory con
tracts. On the one hand, Chile was able to resolve the information and
rewards problem (by increasing competition and adopting benchmark
pricing) as well as the commitment problem (by embodying the detailed
regulation in a law to insulate it from political changes); the result was
positive outcomes for producers and consumers. On the other hand, the
Philippines failed to resolve all three problems, leading to disappointing performance. The experience of the remaining five countries falls in be
rween. For example, Jamaica resolved the commitment problem but
could have done better on competition and pricing, while Venezuela re
solved the information and pricing problems but came up short on com-
167
UCRATS IN BUSINESS
I68
mitment. In both cases, the new owners invested and expanded service
but received relatively high rates of return, at the expense of consumers.
These findings have some lessons for other countries:
• Successful regulatory contracts addressed the information, rewards
and penalties, and commitment problems simultaneously. Resolv
ing one problem but not one or both of the others led to under
investment or excessive rates of return, at the expense of consumers.
• Some differences are due to country characteristics that are not
easily changed in the short run, such as courts that are not inde
pendent or a legislature that easily overturns laws. But some coun
tries have designed contracts that overcame such constraints.
• Regulatory contracts are tough to design but not impossible; even
though compromises were necessary and there were many imper
fections in design, important gains were still achieved.
Conclusion
0 UR CASE STUDIES SUGGEST THAT MANAGEMENT AND REGU
latory contracts with the private sector do a better job of im
proving company performance than contracts with public
managers. One explanation for this lies in the concept of "residual
claimant"; that is, the agent who has claims on whatever residual bene
fits remain after other claims are met has the greatest incentive to im
prove performance. Thus, because private owners and, to a somewhat
lesser extent, private managers have greater claims on enterprise returns
than public managers, they have a much larger stake in the outcome and
hence greater incentives to improve performance. Although public man
agers may be allocated a small share of the returns, by definition they
lack the property rights of a private party. Moreover, in our sample at
least, public managers were not penalized for poor performance and
were seldom rewarded for good results. In contrast, a private investor
who purchases an SOE with highly specific assets can claim large returns
if performance improves and faces a significant penalty-perhaps even
the loss of the investment-if things go wrong. A private manager under
contract to the government has less of a stake than a private owner; but
the contract can be written to include incentives and penalties that give the private manager a much bigger and more direct interest in improved
CONTRACTING: WHAT WORKS, WHAT DOESN'T, AND.W
enterprise performance than public managers typically have. If the pri
vate party has a reputation at stake, the incentive effect is even stronger.
A contract with a private party also changes the incentives of govern
ment bureaucrats. Such contracts are more prone to scrutiny by the
press, public, and politicians than a performance contract with SOE
managers. The increased fear of censure arising from this situation gives
bureaucrats an incentive to select the contractor carefully, to demand
simpler, more easily monitored targets, to monitor results scrupulously,
and to enforce the contract. Of course there is a risk that such scrutiny
may work against the interests of owners and managers, especially for
eign owners and managers, if it fosters opposition to price increases or to
layoffs that are reasonable under the contract. Private parties therefore
demand evidence that a government is prepared to abide by the contract
before they will undertake such risks. Similarly, private contractors,
whether managers or owners, are often willing to agree to simple, easily
measured standards that are more easily defended against critics; such
targets reduce the likelihood of costly disputes or, if a dispute is un
avoidable, make it easier to appeal to arbitration or courts when possi
ble. This is a sharp contrast to the preference of public managers, who
try to increase the complexity of contract targets in order to improve
their chances of a satisfactory rating.
In management and regulatory contracts, some governments used
competition, auctions, or yardstick competition to resolve information
asymmetries. In theory this could be done with SOE performance con
tracts (for example, by allowing different teams of public managers to
bid); but it was not tried in any of the performance contracts in our sam
ple or indeed by most of the performance contracts we encountered in
our search. Similarly, SOE pricing regulation could in theory be designed
and implemented as it was for the more successfully regulated privatized
monopolies (such as Chile's telecom monopolies); again, this was not
done for any of the performance contracts we investigated in detail.
These observations suggest that the process of contracting with private
actors motivated bureaucrats to use information-revealing mechanisms
that they rarely, if ever, apply to SOE managers (who may be fellow bu
reaucrats). In designing performance contracts for SOEs, then, govern
ments tended to rely on hierarchical approaches rather than markets; in
designing management and regulatory contracts, governments more
often attempted market solutions. And where market solutions were
tried, they produced better outcomes.
169
RATS IN BUSINESS
170
Commitment was the Achilles' heel of all three types of contracts, al
though performance contracts suffered from this the most. As we have
seen, commitment problems are compounded when one of the parties is
the government because of the obvious difficulties the other party faces
in forcing the government to comply. Unlike public managers, private
parties have the option of not agreeing to a contract. This forces gov
ernments to signal commitment or to offer some sort of bond or risk
premium. The availability of outside finance for management contracts
undermined this advantage by insuring the private managers' risk. Man
agement contracts with such external financing were therefore generally
less effective than management contracts where the two contracting par
ties were required to manage the risk themselves.
There is a drawback to contracts with private parties, however: the
stronger private stake in outcomes may also give private managers and
owners stronger incentives to behave opportunistically. Where govern
ment's negotiating and monitoring skills are weak, this could lead to ex
ploitation. Safeguards can be designed to reduce the risk of exploitation,
and where that was done successfully, the gains from private involve
ment were significant.
How do management contracts compare with regulatory contracts,
that is, with privatization and regulation? Management contracts have
been used most often for competitive firms when many contracting
problems could have been overcome by opening markets and privatizing,
without the need to regulate. When management contracts are used for
infrastructure, they do not generate the large, privately financed invest
ments that are possible with privatization (Galal and others 1994). Since
management contracts have many of the same problems and costs of reg
ulatory contracts, they thus demand similar effort for smaller returns.
The bottom line of this analysis is that contracting can work for SOE re
form but only if incentives are aligned so that government and firm man
agement both strive to achieve greater efficiency More fundamentally, our
surveys have revealed how seldom any of these three types of contracts
has been tried, given the many thousands of state-owned enterprises op
erating in developing countries. This conforms to our earlier conclusion
that, although SOE reform can work, many countries are not reforming.
Why this is so is the subject of the next chapter.
CONTRACTING: WHAT WORKS, WHAT DOESN'T, AND V/;
Notes 1. Caillaud, Guesnerie, Rey, and Tirole (1988), Sap
pington and Stiglitz (1986), and Besanko and Sappington (1987) survey the literature on regulation under incomplete information. Romer and Rosenthal (1985) survey the political dimension of regulatory research. Baron (1989) provides an overview of the theory.
2. For example, if a private manager does not believe that government will let the contract run its full duration and allow the firm the contracted rate of return, the contractor may run down the assets; or if a private owner believes that the government will regulate away its profits, the buyer of a privatized SOE may under invest.
3. Guarantees of noncommerical risk by a third party, such as a multinational institution, might also serve this purpose (see box 5.3).
4. We define performance contracts as negotiated agreements between government and SOE wherein quantifiable targets are explicitly specified for a given period and performance is measured against the targets at the end of the period. Our definition includes agreements that are not labeled as performance contracts in the country in question.
5. It is not random because we selected contracts from our sample countries, and we included one electricity company from each country to test for industry effects (none was found).
6. Korea Telecoms was created as a separate company only two years before its contract started. Senegal T decorns was created in the same year that it signed its first contract; we extrapolated backward two years, using data from prereorganization telecom units.We included Senegal Electricity's second contract (starting in 1990), even though it was never signed. The conclusions would not change if that period were omitted. We also took 1987 as the start date for India Oil's contracts, even though it signed a pilot form of contract in 1986 (based on the multiyear French contrat plan). The government later switched to a very different sort of contract (closer to the Korean model, using yearly weighted targets). The conclusions would not change if the earlier contract period were included.
7. Performance improvement should not be confused with good performance in some absolute sense. For example, Ghana Water and Sewerage increased TFP by an average of 12.5 percent a year during the three years of contracts for which we have data (1990, 1991, and 1992). Yet this is still a company with almost 50 percent of its water unaccounted for and only about two-thirds of the population served with water.
8. Data were taken from enterprise audited accounts and the contracts and evaluation reports, supplemented by World Bank file data. In addition, a survey of key government and enterprise officials, using a standardized questionnaire and interviews with knowledgeable persons in the country and World Bank, provided further background. See Dyer Cisse (1994) for the sample questionnaire. Although every effort was made to verify the accuracy of the data, in some cases the underlying information systems are weak. However, it seems plausible that errors are not correlated over time and do not greatly affect the trend analysis. Where assets were not revalued by the company, we revalued them, using company figures for depreciation and the GDP deflator for inflation. For total factor productivity, which is calculated as the constant value of production over the constant cost of all production factors, we used company volume data to construct company-specific price indices for each factor and output where available; otherwise we used the relevant countryspecific price indices. Return on assets was calculated as sales minus cost of goods sold and depreciation over revalued fixed assets.
9. Its prices are nevertheless about one-third less than those charged to the private sector, but private producers usually have more freedom to change producer prices.
10. The charges are overstated because of exchange rate effects (the comparisons are in deutschemarkes), but Senegal would still rank in the top third of countries even if its rates were half as high.
11. The postcontract return on assets of Philippines Electricity was adversely affected by increases in the cost of imported oil, but this cannot explain its poor performance in constant priced TFP. TFP might have been ad-
171
UCRATS IN BUSINESS
versely affected by disruptions caused by the Luzon earthquake, plus devastating typhoons in 1989 and 1990; however, observers knowledgeable about the company regard its performance as consistently weak. Moreover, other disasters (the Mt. Pinatubo eruption and Ormoc flood in 1991) did not prevent the firm from recovering its productivity levels. Senegal Telecoms may have benefited from the fact that it was split off from the postal service in 1986, the first year of the contract. Although we have tried to isolate the telecommunications side prior to this split, that may not always have been possible and could cause the period before the contract to look worse than it otherwise would. (The split itself is not exogenous, even though it is not explicitly part of the comract.)
12. See Jones (1993) for more on the concepts of criterion and criterion values and an excellent review of the issues of performance contracting.
13. Interview with Hafeez Shaikh (1994).
14. In Ghana, government negotiators and monitors in tne State Enterprises Commission (SEC) lost power when responsibility for energy contracts was shifted to the sector agencies. Although the shift only affected rwo SOEs directly (including one of the three in our sample), staff in the SEC believe that the change adversely affected the credibility of all monitoring and negotiating. According to an SEC report, "This situation tends to create considerable unce:rtainty about who can require performance information from the SOEs. This has affected the ability of the Commission to perform its reporting and evaluation function" (SEC 1991).
15. Interviews with government evaluators and knowledgeable observers also suggest that the managers in our sample negotiated for more and softer targets and were often responsible for changes in the criteria.
16. The targets are for new lines, main lines, and income. Delays in getting information on achievements may also be a reason why government agents agreed to set targets well below the previous year's achievements. Philippines Electricity's targets for return on revalued assets and power generation per employee also fell even after they'd been exceeded.
172
17. Field interviews.
18. Public profits are private profits adjusted to measure returns to society as a whole and to exclude factors beyond the control of managers Qones 1981).
19. Data on target achievement were not available for all targets. The differences in achievement of economic targets are offset by the different weights assigned to these targets. If we weight the achievement scores with the weights assigned to economic targets in table 3.3, there is little difference among the groups ofTFP performers.
20. The decline in capital spending allowed it to exceed its targets for self-financing and debt service; the combined scores on these two criteria exactly canceled out the company's poor performance on its capital project target.
21. This is partly due to shutdowns of older wells as well as new drilling.
22. In Korea, evaluations of how different departments, divisions, and offices contributed to contract achievements are taken into account in internal promotions (Shirley 1991).
23. The information on reneging in this section and in table 3.5 is from survey responses, field interviews, and company and Bank reports.
24. Standing boards of directors were replaced by executive boards; government representation on the boards was reduced to two members; only board approval of the budget was required when previously the supervising ministry, the Economic Planning Board, and the cabinet also had to approve; responsibility for most personnel decisions was shifted from the supervising ministry to the enterprise; procurement through a centralized office was made voluntary instead of compulsory; all oversight was centered in the contract with one yearly inspection, instead of the extensive system of controls and inspections used previously (in one year before the contracts Korea Power had eight different inspections lasting 108 days); preference was shifted to internal candidates for senior positions (previously over half of all such appointments were from outside the firm); and an explicit merit assessment was introduced (Shirley 1991, 11-12).
CONTRACTING: WHAT WORKS, WHAT DOESN'T, AN•
25. An opinion survey of750 employees in all ranks of the SOEs under contract found that 93 percent thought that management had improved, thanks to the performance evaluation system; 55 percent saw substantial improvement; 94 percent of the executive directors said that there had been substantial or significant improvement (Song 1988).
26. A sign of this waning commitment may be the move away from public profitability, as mentioned earlier.
27. The Mexican government distinguishes between such Financial Restructuring Pacts and performance contracts.
28. See statistical appendix for a detailed listing. Some contracts may have been missed or signed since the search was conducted in 1993.
29. The chains were Hyatt, Marriott, Holiday Inn, Intercontinental, and Sheraton.
30. Because contracts for the twenty-two Sri Lankan plantations are very similar, we treated them as a single case study.
31. Light Rail was awarded to a contractor with connections to the then president of the Philippines (the contractor was the brother oflmelda Marcos).
32. Of course, if technology is uncertain or changing rapidly, the contractor may demand to renegotiate the contract after a short period, citing unexpected costs as an explanation. Uncertain technology could allow the contractor to use his or her private information to behave opportunistically and hence reduce the incentive effects of repeated transactions. See Williamson (197 6).
33. The government failed to provide all the local currency originally designated for the rehabilitation program. The contractor used 75 percent of the foreign exchange designated for the rehabilitation for "minor" rehabilitation, leaving the "major" rehabilitation underfunded.
34. It was not possible to measure how consumers fared with respect to prices. Compiling comparable data in this area proved to be difficult. Even where it was feasible to distinguish calls by customers and peak from offpeak periods, apportioning fixed costs to different services and exchange rate fluctuations was so complex that it reduced the value and comparability of the data.
35. Tariffs have not changed since 1985, although the company is allowed to adjust them for inflation under the price cap regulation.
173

4
The Politics of SOE Reform
E HAVE SHOWN THAT STATE-OWNED
enterprises remain an important obstacle to
better economic performance in developing countries, that the benefits of divesti
ture and other reforms are substantial, but
that only a few countries have attempted
these reforms and even fewer have succeeded. Clearly, factors other
than economic efficiency determine the nature, pace, and extent of SOE
reform. The most important of these factors is politics. State-owned
enterprise reform can cost a government its support base. Conse
quently, politicians everywhere carefully weigh any changes in state
owned enterprise policy, naturally preferring policies that benefit their
constituencies and help them remain in office over policies that under
mine support and may precipitate their removal. While some excep
tional leaders may be able to change their support base and mobilize
new constituents for reform, most are necessarily responsive to the sup
porters who put them in office.
What are the political obstacles to reform? In countries that have re
formed successfully, how have these obstacles been overcome? How can pol
icymakers in developing countries, as well as institutions providing foreign
assistance, decide beforehand whether SOE reforms can succeed? And finally,
where conditions for successful reform do not exist, what can be done to
bring them about? To address these questions and to make sense of the dy
namics of policymaking, we examined the validity of three suppositions re
garding successful SOE reform:
• Reform must be politically desirable-the benefits to the leadership
and its constituencies must outweigh the costs.
175
SIN BUSINESS
!76
• Reform must be politically feasible-the leadership must be able to
enact reform and overcome opposition.
• Reform must be credible-promises that the leadership makes to com
pensate losers and protect investors' property rights must be believable.
Using objective and usually quantitative indicators to evaluate the ev
idence from our twelve country case studies, we found that each of these
conditions was in fact necessary for successful SOE reform. Countries
that reformed successfully satisfied all three at least partially; less suc
cessful reformers failed to meet at least one of them.
Our categorization of countries into more successful, mixed, and less
successful reformers draws on the analysis in chapter 2. There, we first
sorted countries by measures of SOE performance and then showed that good performance was associated with more extensive and sustained re
form efforts. Our categorization in this chapter, therefore, reflects both
reform efforts and reform outcomes. In chapter 2 we also used 1985 as
a midpoint for the analysis because for most countries, except those undergoing the transition from central planning, this was close to the year
that reforms started. We continue this practice in the analysis in this
chapter. This analysis is not a judgment about the countries or their govern
ments. Rather, it assesses the obstacles that may prevent even the most
effective and selfless leaders from undertaking SOE reform. Nor does the
analysis in this section assess a country's actual reform record, which we
have already done in previous chapters. Rather, it is an attempt to dis
cover how countries that successfully reformed overcame obstacles that
elsewhere stymied reform. In order to achieve this objective, we employ
a methodology with three important characteristics. First, our measures
of desirability, feasibility, and credibility, and the conclusions that we
reach, are transparent and can be checked for accuracy and consistency.
Most of our indicators are quantifiable, and six of the eleven are apolit
ical. Second, we use measures that can be observed independent of and
prior to SOE reform attempts. In principle, this allows them to be used
for prediction. Finally, we look at every indicator in every country. This
marks a break with previous analysis, in which different criteria have
been applied to different countries, making generalization difficult.
Nevertheless, the analysis still has limitations. Like all behavioral sci
ences, the study of political decisionmaking is complex. Variables, such as
the intensity of constituent opinion or the qualities of individual leaders
THE POLITICS OF SOE:
can change outcomes, but are difficult to measure and to use in a consis
tent, generalizable fashion. Political analyses that depend on such vari
ables cannot therefore be easily tested to see if they are true or false, or if
they have predictive power. Compared to such analyses, the approach
pursued here focuses on variables that can be measured consistently and
ex ante. Despite these advantages, however, the analysis, given its present
state of development, will not always lead to unambiguous conclusions
and predictions. We return to this point in chapter 5. For reasons of space and clarity of argument, we have limited our
selves in this chapter to presenting selected examples of the ways in
which the countries in our case studies met or failed to meet each of the three conditions. Our conclusions are not based on these examples
alone but on the finding that the three conditions of reform readiness
and the indicators we devised to measure them consistently explain the reform outcomes for our entire sample. For this reason, and be
cause the country case studies are interesting in their own right, we
have included material that could not be readily contained in the main
text in an appendix to this chapter. Readers who wish to undertake
similar analysis of countries not in our sample, as well as those inter
ested in particular countries or conditions, are encouraged to consult
the appendix. As will be seen, our case studies suggest that if the mini
mum requirements for any one of these three conditions-political desir
ability, political feasibility, and credibility-are lacking, state-owned en
terprise reform is not likely to succeed. 1
That all these conditions have to be met suggests the wisdom of
avoiding simplistic conclusions. For example, the analysis provides no
support for the frequently voiced opinion that SOE reform is more likely
in authoritarian regimes than in democratic ones. In our sample, au
thoritarian governments exhibit both good and bad performance in the
SOE sector. Chile under General Augusto Pinochet pursued SOE reforms
that helped to lay the foundation for future rapid growth, albeit at great
social cost. The Philippines under President Ferdinand Marcos went in
the opposite direction, nationalizing private firms and putting up barri
ers to competition that contributed to economic stagnation and deeper
poverty. Nor is there any clear link between democracy and SOE reform. During the period we examine, reform was slow in India, but rapid in
the Czech Republic and Poland. In fact, these mixed results are to be expected. While reforms may be more feasible in authoritarian regimes,
where the leadership need not achieve consensus before acting, the in-
177
ATS IN BUSINESS
178
stitutions that require consensus-building in democracies increase the
credibility of the resulting policies, as we discuss below.
Assessing Condition 1: Political Desirability
WE BEGIN WITH THE PROPOSITION THAT STATE-OWNED
enterprise reform becomes desirable when the political
benefits to the leadership and its constituencies outweigh
the political costs. We would expect this to happen in two circum
stances: either there are changes in the leadership and its constituen
cies, or there is an economic shock or crisis that alters the calculation
of costs and benefits. 2
The first circumstance arises when groups that benefit from the ex
isting SOE policy and have the power to block reform lose their influ
ence. This can happen because of a change in the regime or because of
a shift in the composition of the governing coalition. These shifts lower the political costs of reforming SOEs that benefited the con
stituencies of earlier regimes.3 The second circumstance involves
shocks such as drought, a decline in foreign aid, or a sudden deterio
ration in the terms of trade that make it harder for the government to
continue subsidizing inefficient SOEs. The size of the economic down
turn needed to make reform politically desirable depends on how
much the government relies on SOE support. 4 If groups that would
lose from SOE reform are not a significant component of the leader
ship's support base, then the costs of reform to government decision
makers are low, and even a relatively minor economic downturn may
be sufficient to make reform desirable to them (as in Korea in 1980).
More frequently, however, beneficiaries of the SOE status quo who
stand to lose are a crucial element of the leadership's support base (as
in Egypt, India, and Turkey). In these cases, a crisis must be extremely
large before the political benefits of reform outweigh the costs or be
fore the constituencies opposed to reform suspend their resistance. In
deed, there was no instance in our sample where an economic shock
alone was large enough to make SOE reform desirable to a government
that relied heavily on SOE support.
For these reasons, we rate countries as having satisfied Condition I when they experience one of three circumstances:
THE POLITICS OF SOE
• A regime change in which SOE interests are not part of the new
leadership support base
• A coalition realignment with a similar effects
• An exogenous shock, provided that the leadership does not de
pend on the SOE sector for support.
Evidence for these indicators ranges from electoral results to historical
information on the role of SOEs in the political life of the country. In
most cases, this evidence was available at the time reforms were being
considered and could therefore, in principle, have been used to assess the
political desirability of SOE reform. The record of the sample countries
is summarized in table 4.1. Notes to the table describe the indicators
that are used to measure the components of Condition I. In our sample, the three most successful reformers among the non
transition economies, as well as the three transition economies, at least
partially met Condition I; that is, reform was desirable to the leadership
and its supporters. None of the countries with the poorer reform records
met the condition. The remainder of this section describes the circum
stances that made reform desirable in some countries bur not in others.
Successful SOE Reformers: Chile, Mexico, and Korea
All three countries with more successful SOE reform records-Chile,
Mexico, and the Republic of Korea-met Condition I. Chile and Mex
ico are described below. Korea, where both the costs and benefits to
leaders and their constituents were low, is described in the appendix to
this chapter.
Chile exhibited both a regime change and an economic crisis in
1973. There is no dispute that the military ouster of the Allende gov
ernment and its replacement by the Pinochet regime in 1973 consti
tuted a regime change. Moreover, a significant economic crisis accom
panied, and perhaps precipitated, the military takeover. From 1972 to
1973, GDP declined 5.6 percent and real wages dropped 26 percent
(Arriagada and Graham 1994).
Significant SOE reform could occur because, as Valenzuela (1978)
documents, groups that benefited from the SOE status quo, particularly
SOE employees, were not part of the new military government's support
base. Although there were obviously no electoral results to document
the sources of support of the Pinochet regime, its approach to state-
179
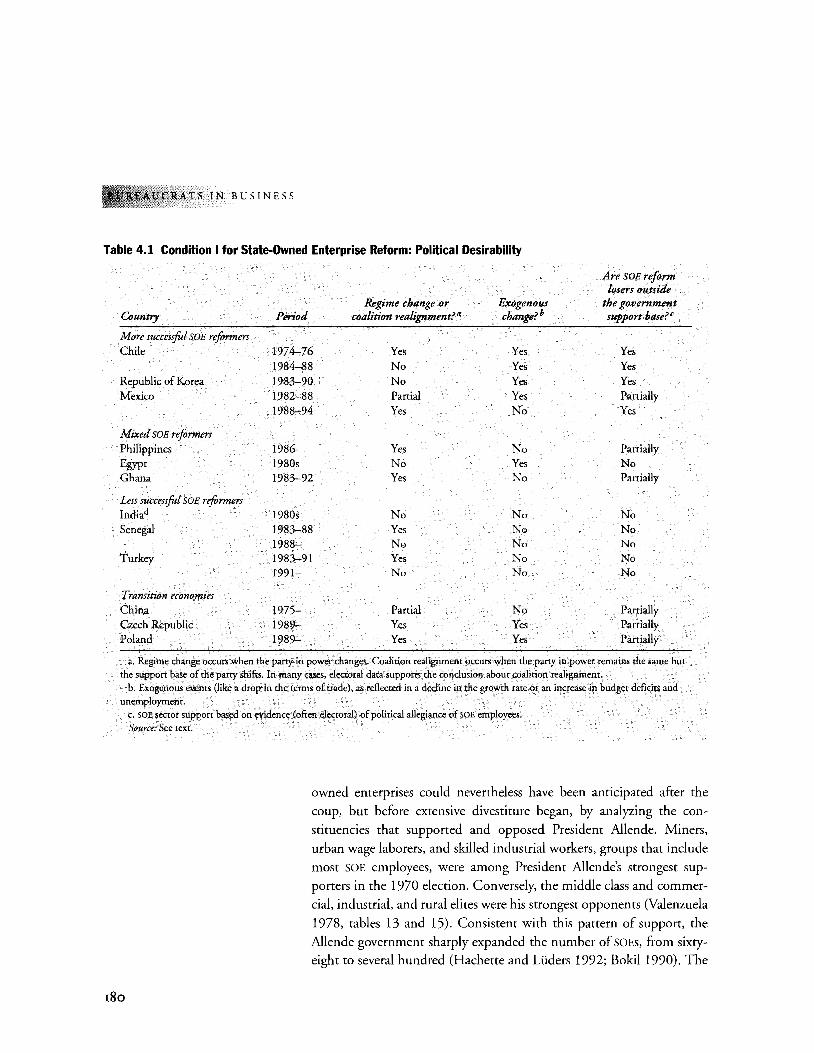
TS IN BUSINESS
Table 4.1 Condition I for State-Owned Enterprise Reform: Political Desirability
Are SOE reform losers outside
Regime change or Exogenous the government Country Period coalition realignmentfa changefb support base?c
More successfol SOE reformers Chile 1974-76 Yes Yes Yes
1984-88 No Yes Yes Republic of Korea 1983-90 No Yes Yes Mexico 1982-88 Panial Yes Partially
1988-94 Yes No Yes
Mixed SOE reformers Philippines 1986- Yes No Partially Egypt 1980s No Yes No Ghana 1983-92 Yes No Partially
Less successfol SOE reformers Indiad 1980s No No No Senegal 1983-88 Yes No No
1988- No No No Turkey 1983-91 Yes No No
1991- No No No
Transition economies China 1975- Panial No Panially Czech Republic 1989- Yes Yes Partially Poland 1989- Yes Yes Panially
a. Regime change occurs when the party in power changes. Coalition realignment occurs when the party in power remains the same but
the suppon base of the party shifts. In many cases, electoral data supports the conclusion about coalition realignment.
b. Exogenous events (like a drop in the terms of trade), as reflected in a decline in the growth rate or an increase in budget deficits and
unemployment.
180
c. SOE sector support based on evidence (often electoral) of political allegiance of SOE employees.
Source: See text.
owned enterprises could nevertheless have been anticipated after the coup, but before extensive divestiture began, by analyzing the con
stituencies that supported and opposed President Allende. Miners,
urban wage laborers, and skilled industrial workers, groups that include most SOE employees, were among President Allende's strongest supporters in the 1970 election. Conversely, the middle class and commer
cial, industrial, and rural elites were his strongest opponents (Valenzuela
1978, tables 13 and 15). Consistent with this pattern of support, the
Allende government sharply expanded the number of SOEs, from sixtyeight to several hundred (Hachette and Li.iders 1992; Bokil1990). The
THE POLITICS OF SOE REFO~~
Pinochet regime subsequently privatized all but about thirty state
owned enterprises.6 It also reformed the remaining SOEs to make them
operate as if they were private firms, as discussed in chapter 2.
The evolution of Mexican SOE policy spans two presidential elections
the 1982 vote that brought Miguel de la Madrid to power and the 1988
election that Carlos Salinas won. Throughout this period, Mexico expe
rienced economic crises and a gradual coalition realignment that dimin
ished the SOE sector's importance to the leadership's support base. The
pace of SOE reform reflected these economic and political changes.
Economic problems that raised the costs of not reforming were evident throughout President de la Madrid's 1982-88 term. The debt crisis of
1982 triggered a 17.5 percent drop in real manufacturing wages and in
creased the budget deficit to 15.6 percent of GDP (Kaufman, Bazaresch,
and Heredia 1994). These economic events, combined with the coalition realignment that was under way in Mexico (box 4.1), created a political
opening for the newly elected president to bring in a group of technocrats
(among them Carlos Salinas), reducing the influence of SOEs in the party
(the Partido Revolucionario lnstitucional, or PRI). Economic crisis rein
forced the need for reform in 1986, when oil prices plummeted from $25
to $12 a barrel and the deficit rose from 8 to 15 percent of GDP, undoing
earlier macroeconomic stabilization efforts.
Crisis preceded the decision to divest more than 600 of the country's
nearly 1,200 state-owned enterprises between 1982 and 1988 and to introduce reforms in some of the remaining SOEs. Nonetheless, because SOE
interests, particularly unions, continued to be important to the PRI's sup
port base, the reforms the de la Madrid administration undertook were
limited in scope. Few of the enterprises privatized were large; government
revenues from privatization were highest during his final year in office, at
$524 million (Cordon 1993b).
Reforms accelerated under the Salinas presidency following the cul
mination of the coalition realignment in the 1988 elections, in which
many of the opponents of SOE reform supported a new party, the Partido
Revolucionario Democratico (box 4.1). Since opponents of SOE reform
were not part of President Salinas' winning coalition, the political costs of
SOE reform were lower than they had been during the period 1982-88. This made it easier for the Salinas government to divest 200 SOEs between 1988 and 1992, selling off such large firms as TELMEX and the two
state airlines. Privatization revenues during the first three years of the
Salinas administration totaled $15 billion ( Galal and others 1994).
181
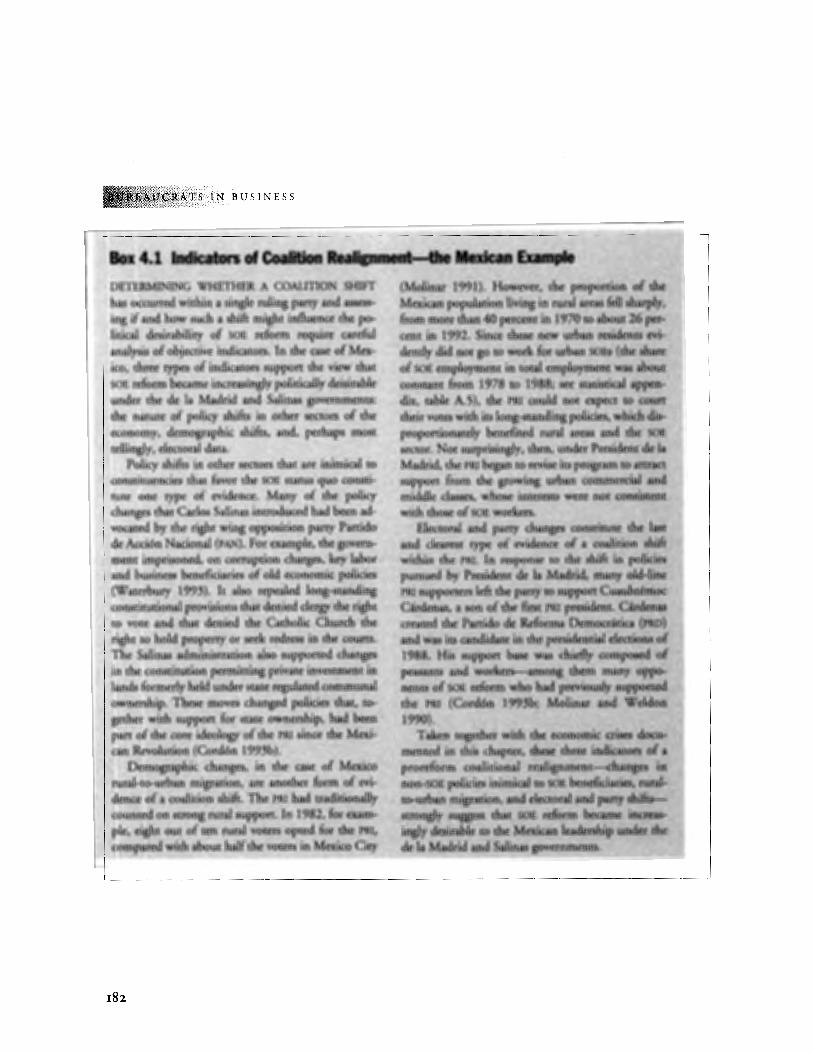
\"'i!0"""'"'"".n T S IN BUS IN E S S
Box 4.1 Indicators of CoalitiOIJ.ReJiigament~M·Q~ple
182
DETERMINING WHETHER A COALmON. SHIFT has occurred within a single ruling party and assess.. ing if and how such a shift might influence the political desirability of SOE reform require careful analysis. of objective indicators. In the case of Mexico, three types of indicators support the view that SOE reform became increasingly politically deisirable under the de la Madrid and Salinas governments: the nature of policy shifts in other sectors of the economy, demographic shifts, and, perhaps most tellingly, electoral data.
Policy shifts in other sectors that are injmical to constituencies that favor the SOE status quo consti· tute one type of evidence. Many of the policy changes that Carlos Salinas introduced had been advocated by the right wing opposition party Partido de Accion Nadonal (PAN}. For example, the government imprisoned, on corruption charges, key labor and busmess·ber,.eficiaries .of old economic policieS. (Waterbwy 1993). It also· repealed long-standjng constitutional· provisions that denied dergy.the right to vote. and that denied the Catholic Church the .. right to. hold propertY or seek.ted~s in the courts. The Salinas .adm:in.istration .also supported changes ln the constitution.permitting priv11:re ir,.vesttnentlll. lands formerly held under state regulated oo:mmunal ownership. These nioves changed policies that.. to~ gether with support for state ownership, had been part of the core ideology of the PlU since the¥~ om Revolution (Cordon 1993b). · ·
Demog.(aphic change$,. in· the.· case. of .Mexico rutal~to-urban migrati<ln, are another forni. of evidence of a coal~tion shift+. The Pruhad t:raditionally COUUJ:ed on StrOll$ ri.t~ Support.Jn 19&.i,~r ~tnf. pie, eight o!-lt (If ten· rural voters opted for th~ t>rur 'compared with about halfthe voters inMeX:ico City
(Molinar 199l). ·How~et, the R~dpord(l~~'dle ) M~iom populationliving,in nirafareas (e~tslti?Jif• · fromtn()re tban 4Q pettent 1nj9.7Qto~~"l~~.f>F~{ , cent in 1992. Since these n~ urtijti'resideiii$,:ev~~, dently di.lnot gO to W'ark ·'l'· uiQ~n stills'{(li~j~;of so£ employtnentin tot:a{ einpfqy~entWil$~~t.: < constant froni 197$ to 1988; see Statls~ a -.. • . , ~table A,5}, .tbepru. cotild,not~e~;to~1< their votes with its lon~standingp9licieS,~di$~< proportionately benefited rutal a~ ~~ *~stf111i.· sector; Not ~urprisingfy, thenJ.l,tn(;lei Presi~nt.:d~~ Madrid, the PRI began to ~iseits Pf68t:~'t(t~~ support from the gt;oWhtJurl>an ~~~tct~~#a~- · middle, dasses' wh~>seintere$ts were n~ ~~m.~.: with tboseofSOE workers. • ·,•·· .· .•....•. · .•.•.• · '. •/;,·0;
ElectOraL and .Jlilnr changt:l' ~~pi,t,UJ:~ .. ~:~~~ .•.·
=t:~~Ta~;s~~· PJtisuppo~rtleft~~!~fftttrl .·· . · ·· ' ... , ...
--~4~t the PRI (COrdolt 199~b't• .. m~ . . . • . . . ..... , .
r~e~ t.O,getlt~ tt~ .in,thi~ ell ~¢toitn c;~li~iti 'r$(1E ~licie~ l1
~-~,~~:'••
THE POLITICS OF SOE REFO
Mixed SOE Reformers: Egypt, Ghana, and the Philippines
Of the three countries that exhibited mixed success in implementing
SOE reforms in the 1980s, Egypt did not meet Condition I according to
any of our indicators: there was neither a regime change nor a coalition
shift and SOE employees were an important part of the leadership's sup
port base. The other two countries with mixed reform records, Ghana
and the Philippines, at least partially met Condition I because they ex
perienced both significant political shifts that reduced the importance of
SOE interests and economic crises that increased the costs of delaying re
form. Even so, neither government abandoned entirely the use of SOEs
as sources of patronage, thus limiting their motivation to reform. More
over, as we shall see, reform feasibility was problematic in both coun
tries. We discuss Egypt below and Ghana and the Philippines in the chapter appendix.
During the 1980s, Egypt faced increasingly serious economic diffi
culties: the fiscal deficit averaged about 10 percent of GOP, the highest
among countries in our sample, and real per capita GOP growth averaged
less than 2 percent per year. These problems, which might have made
SOE reform politically desirable, did not for two reasons: first, the state
owned enterprise sector was large and important to the leadership's sup
port base, so downsizing SOEs would have been politically costly; sec
ond, foreign aid may have helped to lighten the economic burden of
state-owned enterprise subsidies.
It is difficult to use electoral data in Egypt to judge the role of SOEs in
the government's support base. We therefore look to less readily quan
tifiable evidence to assess the political desirability of SOE reform. (For an
example of similar methodology in very different circumstances, see the
Condition I discussion of Korea in the chapter appendix.) According to
Banerji and Sabot (1994), the Egyptian government has long used state
owned enterprises to provide jobs to college graduates to generate elite
support. In the 1980s, SOEs accounted for about 14 percent of total em
ployment (statistical appendix, table A.5), while total public sector em
ployment approached 40 percent (Ayubi 1991)-some of the highest
percentages in our sample. Ibrahim (1994) reports that by the 1980s, the General Confederation of Labor, a powerful alliance that included
most SOE unions, had gained de facto veto power over government policy decisions affecting SOEs. On the other hand, there was no strong
constituency in favor of SOE reform in the country.
183
TS IN BUSINESS
184
Although these political obstacles raised the costs of SOE reform,
Waterbury (1993) suggests that foreign capital inflows, mostly in the form of grants and highly concessionalloans to the government, lowered
the cost of maintaining the status quo, reducing the pressure to reform.
From 1980 to 1989, partly due to these concessionalloans, Egypt's debt
increased from $20 billion to $49 billion. Most of these loans were not
tied to economic reforms; instead, they were linked to political consider
ations arising from conflict in the Middle East. During this period, ef
forts to improve the SOE sector were few and minor. For example, SOEs
were reorganized under holding companies, but this produced no funda
mental changes in the way the firms operated. Real wages were allowed to decline by 50 percent from 1980-89. Although this decline was associated with a modest increase in profitability of the SOE sector in Egypt, productivity continued to deteriorate (see figures 2.1 and 2.2).
Toward the end of the decade, foreign loans and aid declined sharply, and this picture began to change. Net foreign aid inflows fell from more than 5 percent of GDP in 1980 to zero in 1988 and turned negative in 1989 (figure 4.1). Even so, the political influence of the SOE sector has caused the government to try to adjust without cutting back on support to state firms. While the government reduced the fiscal deficit from around 15 percent in the 1980s to around 5 percent in 1993, devalued
its currency by 10 percent, and significantly raised petroleum and elec
tricity prices, only a few small state-owned enterprises were privatized (Ibrahim 1994). By the early 1990s, the government had yet to sell or liquidate a significant number of SOEs or to make a meaningful reduction in the level of redundancy in the SOE work force.
Less Successful SOE Reformers: India, Senegal, and Turkey
None of the less successful reformers in our sample met Condition I. SOE reform was undesirable to significant segments of the support base of the leaders in each of these three countries-India, Senegal, and Turkey. India did not experience a regime change or coalition realign
ment. Moreover, neither the governing party nor any other major party
in India had a support base that favored SOE reform. An economic crisis
might have altered this picture, but India did not experience a sharp economic crisis in the 1980s that would have led any of these constituent groups to reverse their opposition to SOE reform. Senegal and Turkey experienced significant changes of government but, as in India, the SOE
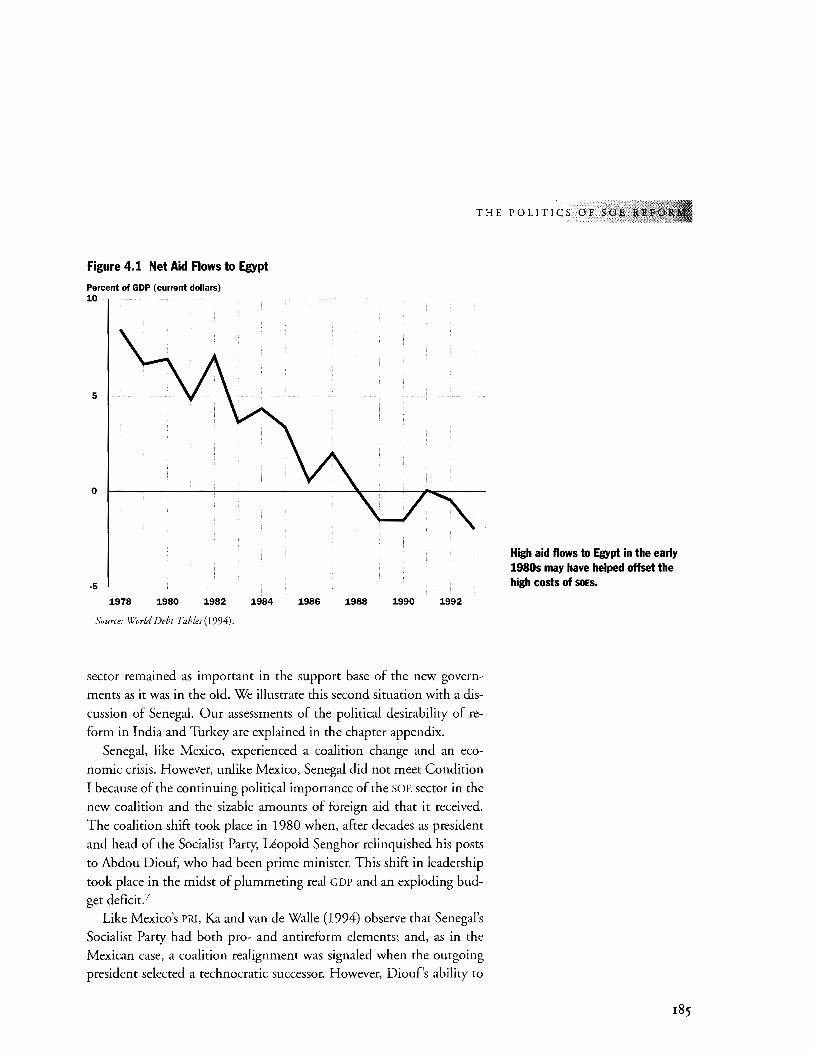
THE POLITICS OF SOE
Figure 4.1 Net Aid Flows to Egypt
Percent of GOP (current dollars) 10
5
0
-5
1978 1980 1982 1984 1986 1988 1990 1992
Source: World Debt Tables (1994).
sector remained as important in the support base of the new govern
ments as it was in the old. We illustrate this second situation with a dis
cussion of Senegal. Our assessments of the political desirability of re
form in India and Turkey are explained in the chapter appendix.
Senegal, like Mexico, experienced a coalition change and an eco
nomic crisis. However, unlike Mexico, Senegal did not meet Condition
I because of the continuing political importance of the SOE sector in the
new coalition and the sizable amounts of foreign aid that it received.
The coalition shift took place in 1980 when, after decades as president
and head of the Socialist Party, Leopold Senghor relinquished his posts
to Abdou Diouf, who had been prime minister. This shift in leadership
took place in the midst of plummeting real GDP and an exploding bud
get deficit? Like Mexico's PRI, Ka and van de Walle (1994) observe that Senegal's
Socialist Party had both pro- and antireform elements; and, as in the
Mexican case, a coalition realignment was signaled when the outgoing president selected a technocratic successor. However, Diouf's ability to
High aid flows to Egypt in the early 1980s may have helped offset the high costs of soEs.
185
''iUREAUCRATS IN BUSINESS ~Ji'fiY-~"-', "": ·
186
mold a technocratic government was initially more constrained than
that of President Salinas, since President Diouf had not been popularly
elected and was therefore more dependent on the party apparatus for
political support. To consolidate his influence, he held multiparty leg
islative and presidential elections in 1983, which he won with more
than 80 percent of the vote. Ka and van de Walle (1994) describe a con
vincing signal of coalition change when they relate that after the elec
tion, the president replaced many of the party old guard with more technically qualified officials.
The election and economic crisis were sufficient to allow the Diouf
government to undertake a series of important economic reforms.8 The role of SOEs in these reforms was relatively modest, however; although twenty-eight of the country's eighty-five SOEs were sold or liquidated by 1991, the largest and costliest remained in state hands. Budget support for all SOEs declined only slightly, from 6.3 percent of government expenditures in 1988-89 to 5 percent in 1990-91 (Ka and van de Walle 1994).
As chapter 2 demonstrates, SOE performance in Senegal continued to lag other countries in the sample.
Two of the reasons why these political changes did not result in SOE reforms becoming desirable to the leadership in Senegal could have been observed beforehand. First, in contrast with Mexico, the SOE sector re
mained a key supporter of the dominant party. President Diouf consis
tently pursued a policy of co-optation, of bringing competing elements, including the SOE sector, into the political base of the government (Ka and van de Walle 1994); this effectively raised the cost of SOE reform compared with Mexico, making it less likely. Second, substantial foreign aid cushioned Senegal from the full effect of the crisis (figure 4.2). For
example, foreign grants-in-aid were sufficient to reduce the 1986-87
budget deficit from 4 percent to 2 percent of GDP (Haggard and Webb 1994). Aid did not relieve Senegal of the necessity to undertake some
type of reform; both the policy conditionality that donors placed on Senegal and the depths of its crisis required that broad economic policy
reforms be attempted. However, inadequately conditioned aid allowed
the government to postpone or moderate politically difficult SOE reforms that might otherwise have been seen as necessary.9 The sharp fall in net aid flows in the mid-1980s coincided with the initiation of a new
reform effort, but the continued importance of those who would lose from SOE reform in the government's support base meant that reform was still not seen as politically desirable.
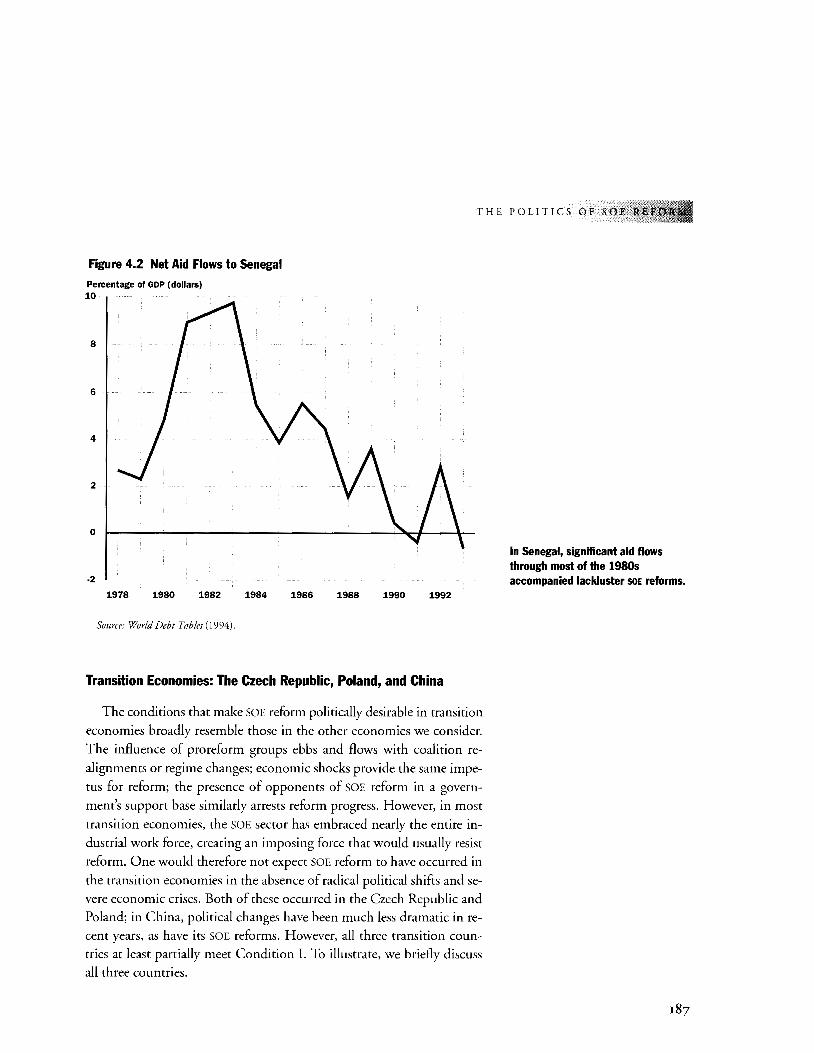
THE POLITICS OF SOE
Figure 4.2 Net Aid Flows to Senegal
Percentage of GOP (dollars) 10
8
6
4
2
0
-2
1978 1980 1982 1984 1986 1988 1990 1992
Source: World Debt Tables (1994).
Transition Economies: The Czech Republic, Poland, and China
The conditions that make SOE reform politically desirable in transition
economies broadly resemble those in the other economies we consider.
The influence of proreform groups ebbs and flows with coalition re
alignments or regime changes; economic shocks provide the same impe
tus for reform; the presence of opponents of SOE reform in a govern
ment's support base similarly arrests reform progress. However, in most
transition economies, the SOE sector has embraced nearly the entire in
dustrial work force, creating an imposing force that would usually resist
reform. One would therefore not expect SOE reform to have occurred in
the transition economies in the absence of radical political shifts and se
vere economic crises. Both of these occurred in the Czech Republic and
Poland; in China, political changes have been much less dramatic in re
cent years, as have its SOE reforms. However, all three transition coun
tries at least partially meet Condition I. To illustrate, we briefly discuss
all three countries.
In Senegal, significant aid flows through most of the 1980s accompanied lackluster SOE reforms.
!87
AUCRATS IN BUSINESS
188
In the Czech Republic and Poland, the political transition away from
the Communist regime constituted a fundamental rejection of totalitar
ian government and state control of daily life. Because the SOE sector
was closely associated with the deposed governments, SOE reform has
faced fewer obstacles-even from workers in the sector-than it has in
countries that did not experience such a dramatic social and political
change. Although we rank all three transition countries as meeting Con
dition I at least partially, differences in the ways and degree to which SOE
reforms became politically desirable help us to understand the different
courses that reform has so far taken in these three countries.
Consider the contrast between the Czech Republic and Poland. In
the Czech Republic, the primary reform vehicle has been rapid, mass
privatization through vouchers (see below, in box 4.4), without prefer
ential considerations for SOE workers. In Poland, ownership changes
have proceeded more slowly, and SOE workers have retained a greater
stake in the privatized enterprises, even though the budget constraints
imposed on Poland's SOEs are at least as hard as those faced by newly privatized and state-owned enterprises in the Czech Republic. These
distinctions are explained in part by the differing abilities of SOE work
ers and management in the two countries to impose costs on leaders in
clined toward SOE reform. Unions did not play a significant role in end
ing Communist rule in the Czech Republic. As a consequence, the
unions have not had a strong voice in policymaking and were unable to
prevent a form of voucher privatization that gave SOE workers no ad
vantage in the final distribution of SOE ownership rights. In contrast,
the Polish trade federation Solidarnosc was instrumental in ending
Communist rule and was influential in early transition governments.
Even though the political coalition that emerged from Solidarnosc
splintered into different parties, the influence of SOE employees has de
clined only gradually (Milor 1994). SOE workers in Poland, conse
quently, have been able to claim a greater share of the ownership in pri
vatized enterprises.
China's movement toward SOE reform has been more incremental,
and is motivated by coalition changes analagous to those that occurred
in some of the nontransition countries that undertook reforms. Follow
ing the death of Mao Zedong in 1975, an internecine political conflict
began between the "Gang of Four" and Deng Xiaoping from which the
latter emerged triumphant in 1978. His victory marked a significant coalition shift. Evidence for this shift is the rise in the number of retired
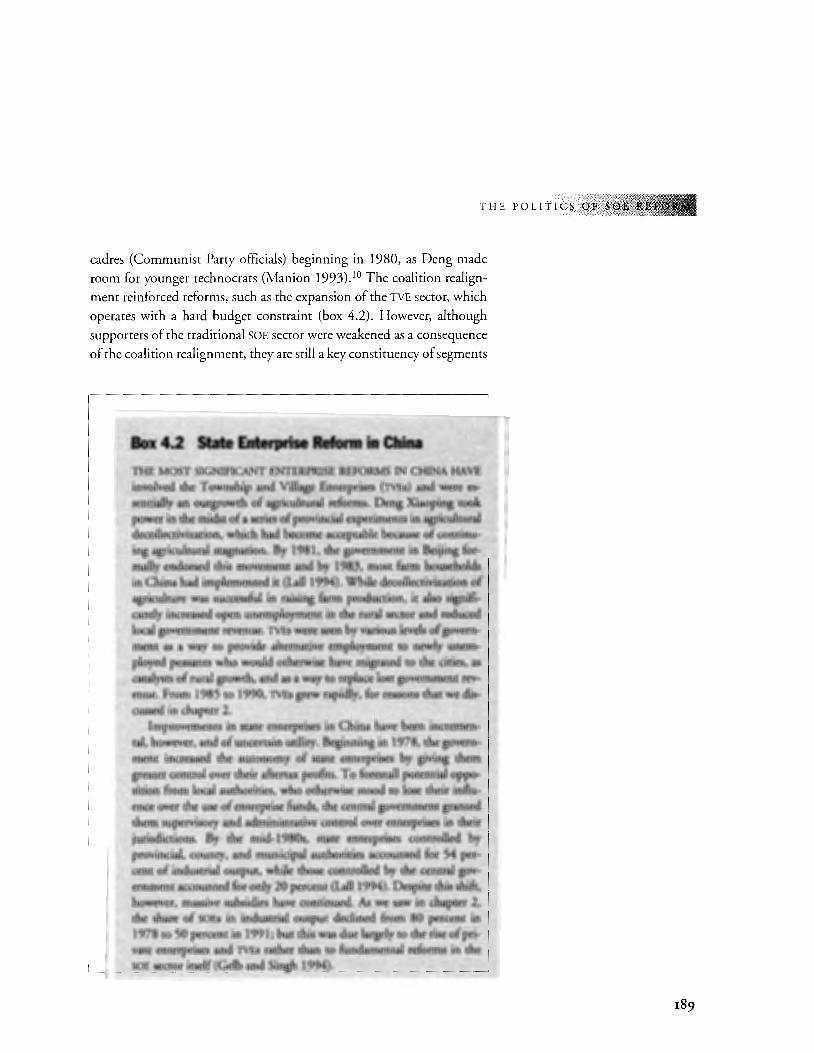
THE POLITICS OF
cadres (Communist Party officials) beginning in 1980, as Deng made
room for younger technocrats (Manion 1993).10 The coalition realign
ment reinforced reforms, such as the expansion of the TVE sector, which
operates with a hard budget constraint (box 4.2). However, although
supporters of the traditional SOE sector were weakened as a consequence
of the coalition realignment, they are still a key constituency of segments
Box 4.2 State Enterprise Reform in China THE MOST SIGNIFICANT ENTERPRISE REFORMS IN CHINA HAVE involved the Township and Village Enterprises (TVEs} and were essentially an outgrowth of agricultural refutros. Deng Xiaoping rook power in the midstofa series of provincial experiments in agricultural decollectivizadon, which had become acceptable because of continuing agricultural stagnation. By 1981, the government in Beijing formally endorsed this movement and by 1983, most f.trm households in China had implemented it (Lalll994). While decollectivization of agriculture was successful in raising f.trm production, it also signifLcantly increased open unemployment in the rural sector and reduced local government revenue. TVEs were seen by various levels of government as a way to provide alternative employment to newly unemployed peasants who would otherwise have migrated to the cities, as catalysts of rural growth, and as a way to replace lost government revenue. From 1985 to 1990, TVEs grew rapidly, for reasons that we discussed in chapter 2.
Improvements in state enterprises in China have been incremental, however, and of uncertain utility. Beginning in 1978, the government increased the autonomy of state enterprises by giving them greater control over their aftertax profits. To forestall potential opposition from local authorities, who otherwise stood to lose their influence over the use of enterprise funds, the central government granted them supervisory and administrative control over enterprises in their jurisdictions. By the mid-1980s, state enterprises controlled by provincial, county, and municipal authorities accounted for 54 percent of industrial output, while those controlled by rhe central government accounted for only 20 percent (Lall1994). Despite this shift:, however, massive subsidies have continued. As we saw in chapter 2, the share of SOBs in industrial output declined from 8Q percent in 1978 to 50 percent in 1991; but this was due largely to the rise of private enterprises and TVEs rather than to fundamental reforms in the SOE sector itself(Gelb and Singh 1994).
!89
' RATS IN B U S I N E S S
190
of the Communist Party (Shirk 1993). Moreover, there continues to be
only limited acceptance, even among the ruling coalition, of private own
ership. Reforms in the SOE sector have therefore been limited to perfor
mance contracts, greater autonomy, and other management innovations.
These reforms and competitive pressures from TVEs have increased pro
ductivity (chapter 2), but a large flow of subsidies to state-owned enter
prises continues, and there is little to suggest that the problem of over
staffing has diminished. Because of the coalition realignment and the fact
that some supporters of the SOE sector were eased out of the governing
coalition, however, China partially meets Condition I.
Assessing Condition II: The Political Feasibility of SOE Reform
WE HAVE SHOWN THAT STATE-OWNED ENTERPRISE RE
form only succeeds if the leadership or governing coalition
considers it desirable. But desirability is only the first step.
Reform must also be politically feasible. This requires that the leader
ship be able to implement reform, first by securing the approval and
support of other parts of government whose cooperation is critical to
success-legislatures, bureaucracies, and the state or provincial govern
ments that are responsible for formulating policy or carrying out the re
form. Even if the leadership's constituencies support reform, making re
form desirable, constituencies of these other parts of government may
not, creating obstacles for the feasibility of reform. Second, the leader
ship must be able to withstand opposition to reform. Although reform
becomes desirable when reform opponents are no longer important
constituents, that does not mean that the leadership can ignore the
losers altogether, especially if they are a vocal minority prepared to en
gage in strikes and protests.
If a reform-minded leadership controls all parts of the government re
sponsible for making and implementing policy, it will, by definition,
have no trouble securing their approval and support. This can be deter
mined in several ways. Obviously, reformers in democracies are likely to
dominate policymaking when they control a majority of the seats in the
legislature and have the power to appoint and remove bureaucrats and state governors. But when the leadership lacks a legislative majority or is
THE POLITICS OF SOE
unable to control the bureaucracy or state and local governments, and
these entities oppose SOE reform, then the process becomes more com
plex and perhaps slower. Reformers must then attempt to forge a coali
tion in favor of change, and this is not always possible. 11
Control of policymaking and policy implementation may not be
enough, however, if SOE employees or other groups who stand to lose
from SOE reform are so determined in their opposition that they go
outside the usual political process and resort to strikes, demonstrations,
or other forms of civil disobedience. Such resistance is more likely
when opponents are organized and numerous, when they have previ
ously staged strikes to block earlier government policy changes, and when they stand to lose a great deal from SOE reforms. The last situa
tion exists when SOE staffing or wage levels are significantly higher than
they would be if the enterprises were divested or otherwise reformed. In some cases, resistance is so costly to the leadership, economically and
politically, that reform becomes unfeasible. This risk is greater if em
ployees in strategic sectors, such as telecommunications or electricity,
engage in work stoppages.
Leaders can offset resistance through a combination of compensation
and compulsion-for example, by offering fired workers severance pay
ments and by banning strikes in strategic industries or otherwise reduc
ing labor union power. However, these actions are also costly, and not
only in economic terms. 12 Compulsion, in particular, often exacts high
social costs. Moreover, policies implemented through coercion are often
not sustainable.
These considerations are especially germane for authoritarian govern
ments. The leadership in an authoritarian regime may have more control
over policymaking than the leadership in a nonauthoritarian regime;
whether a country has a more or less authoritarian form of government is
therefore a strong indicator of feasibility (although not of desirability or
credibility). Even so, authoritarian regimes, like democracies, face trade
offs in overcoming resistance to SOE reforms. While authoritarian
regimes are more likely than democracies to ignore or suppress opposi
tion, they also bear social, political, and economic costs from doing so,
particularly when opposition is strong and well organized.
How can we predict the extent of opposition to reform? One clue is
the extent of overstaffing in state-owned enterprises targeted for reform.
If we define overstaffing as the employment of a work force larger than
some efficient level, the extent of overstaffing tells us what fraction of
191
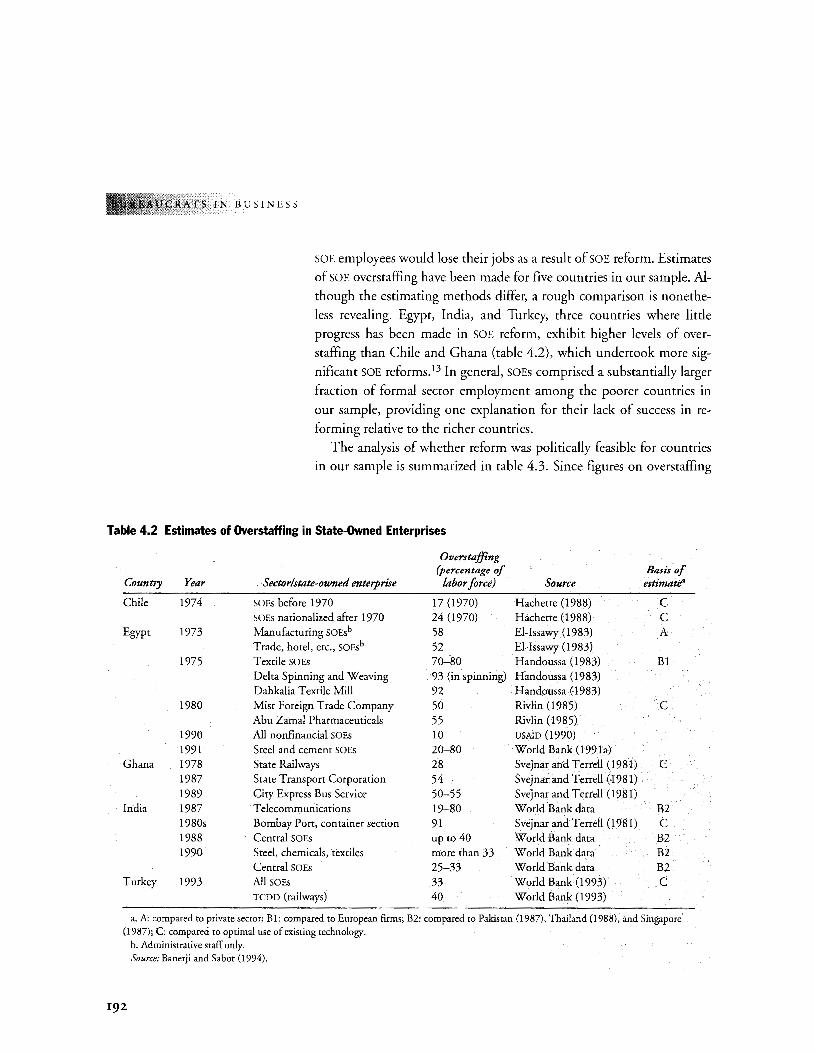
RATS IN BUSINESS
SOE employees would lose their jobs as a result of SOE reform. Estimates
of SOE overstaffing have been made for five countries in our sample. Al
though the estimating methods differ, a rough comparison is nonethe
less revealing. Egypt, India, and Turkey, three countries where little
progress has been made in SOE reform, exhibit higher levels of over
staffing than Chile and Ghana (table 4.2), which undertook more sig
nificant SOE reforms. 13 In general, SOEs comprised a substantially larger
fraction of formal sector employment among the poorer countries in
our sample, providing one explanation for their lack of success in re
forming relative to the richer countries.
The analysis of whether reform was politically feasible for countries in our sample is summarized in table 4.3. Since figures on overstaffing
Table 4.2 Estimates of Overstaffing in State-Owned Enterprises
Overstaffing (percentage of Basis of
Country Year Sector/state-owned enterprise labor force) Source estimate"
Chile 1974 SOEs before 1970 17 (1970) Hachette (1988) c SOEs nationalized after 1970 24 (1970) Hachette ( 1988) c
Egypt 1973 Manufacturing SOEsb 58 El-Issawy (1983) A Trade, hotel, etc., SOEsb 52 El-Issawy (1983)
1975 Textile SOEs 70-80 Handoussa (1983) B1 Delta Spinning and Weaving 93 (in spinning) Handoussa (1983) Dahkalia Textile Mill 92 Handoussa (1983)
1980 Misr Foreign Trade Company 50 Rivlin (1985) c Abu Zamal Pharmaceuticals 55 Rivlin (1985)
1990 All nonfinancial SOEs 10 USAID (1990) 1991 Steel and cement SOEs 20-80 World Bank (1991a)
Ghana 1978 State Railways 28 Svejnar and Terrell (1981) c 1987 State Transport Corporation 54 Svejnar and Terrell (1981) 1989 City Express Bus Service 50-55 Svejnar and Terrell (1981)
India 1987 Telecommunications 19-80 World Bank data B2 1980s Bombay Port, container section 91 Svejnar and Terrell (1981) c 1988 Central SOEs up to 40 World Bank data B2 1990 Steel, chemicals, textiles more than 33 World Bank data B2
Central SOEs 25-33 World Bank data B2 Turkey 1993 All SOEs 33 World Bank (1993) c
TCDD (railways) 40 World Bank (1993)
a. A: compared to private sector; Bl: compared to European firms; B2: compared to Pakistan (1987), Thailand (1988), and Singapore (1987); C: compared to optimal use of existing technology.
b. Administrative staff only. Source: Banerji and Sabot (1994).
192
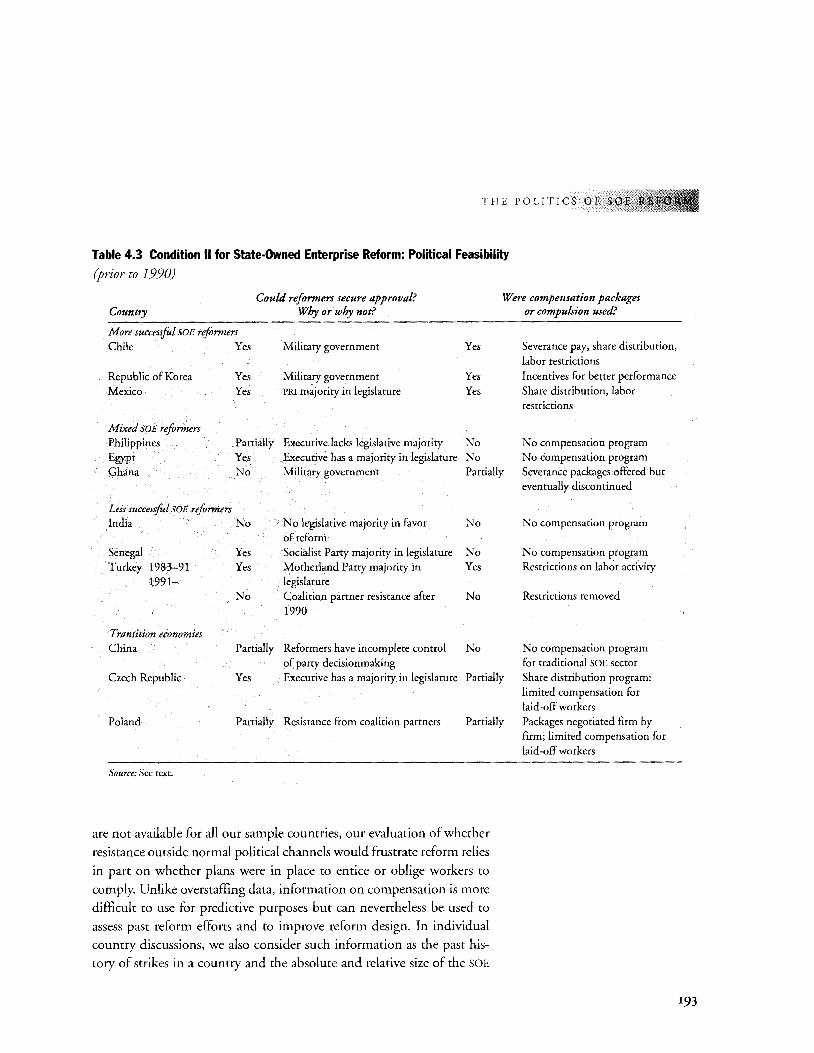
THE POLITICS OF S
Table 4.3 Condition II for State-Owned Enterprise Reform: Political Feasibility
(prior to 1990)
Could reformers secure approval? Country Why or why not?
Were compensation packages or compulsion used?
More successfol SOE reformers Chile Yes Military government Yes
Republic of Korea Mexico
Mixed SOE reformers Philippines Egypt Ghana
Less successful SOE reformers
Yes Yes
Partially Yes No
Military government PRJ majority in legislature
Yes Yes
Executive lacks legislative majority No Executive has a majority in legislature No Military government Partially
India No No legislative majority in favor of reform
No
Senegal Turkey 1983-91
1991-
Transition economies China
Czech Republic
Yes Socialist Parry majority in legislature No Yes Motherland Parry majority in Yes
legislature No Coalition partner resistance after No
1990
Partially Reformers have incomplete control No of party decisionmaking
Yes Executive has a majority in legislature Partially
Severance pay, share distribution, labor restrictions Incentives for better performance Share distribution, labor restrictions
No compensation program No compensation program Severance packages offered but eventually discontinued
No compensation program
No compensation program Restrictions on labor activity
Restrictions removed
No compensation program for traditional SOE sector Share distribution program: limited compensation for laid-off workers
Poland Partially Resistance from coalition partners Partially Packages negotiated firm by firm; limited compensation for laid-off workers
Source: See text.
are not available for all our sample countries, our evaluation of whether
resistance outside normal political channels would frustrate reform relies
in part on whether plans were in place to entice or oblige workers to
comply. Unlike overstaffing data, information on compensation is more
difficult to use for predictive purposes but can nevertheless be used to
assess past reform efforts and to improve reform design. In individual
country discussions, we also consider such information as the past his
tory of strikes in a country and the absolute and relative size of the SOE
193
RATS IN BUSINESS
194
work force as indicators of the potential for significant opposition. We
considered reform politically feasible in countries that show a "yes" in
both columns; that is, reformers were able to secure the agreement of all
relevant policymaking entities in the state, and they were able to over
come resistance from the SOE sector to the policy through some combi
nation of compensation and compulsion. As the table indicates, the
three more successful reformers in our sample all fulfilled Condition II,
as did, at least partially, all three transition economies.
Successful SOE Reformers
Chile, Mexico, and Korea, the three countries in our sample of non
transition economies that had more successful records of SOE reform, all
fulfilled Condition II. It happens that these countries concentrated
most or all political authority in the hands of the executive branch. This
is not necessary for reform, however, as the Polish and Czech examples amply demonstrate. Because authority in these three countries rested with the executive branch, however, legislatures did not play a signifi
cant policymaking role in any of these countries at the time of reform.
Consequently, the leadership of all three controlled the state-owned en
terprise policymaking apparatus. Gaining consensus among policymak
ing entities was therefore not a significant constraint on carrying out SOE
reforms. In addition, where necessary, these countries were successful in
designing policies to overcome resistance from SOE employees and oth
ers outside the policy process. The discussion below focuses on how
Chile overcame SOE resistance. The Mexican and Korean cases are de
scribed in the chapter appendix.
General Pinochet's military government had full control of SOE poli
cymaking (and other types of policymaking) from the time of the 1973
coup. It also avoided and suppressed resistance with both compensation
and compulsion, often using harsh measures. As figure 4.3 reveals, SOE
reforms resulted in substantial layoffs, suggesting that overstaffing in
some SOEs was significant and that resistance to the reform measures
could have been severe. 14 Moreover, the demonstrations and strikes that
occurred under the Allende government, for whatever reason, were evi
dence that such forms of opposition could arise in Chile.
The first round of SOE reforms, during the 1970s, centered on the
reprivatization of enterprises that had been effectively nationalized during Salvatore Allende's rule. 15 In returning these enterprises to their
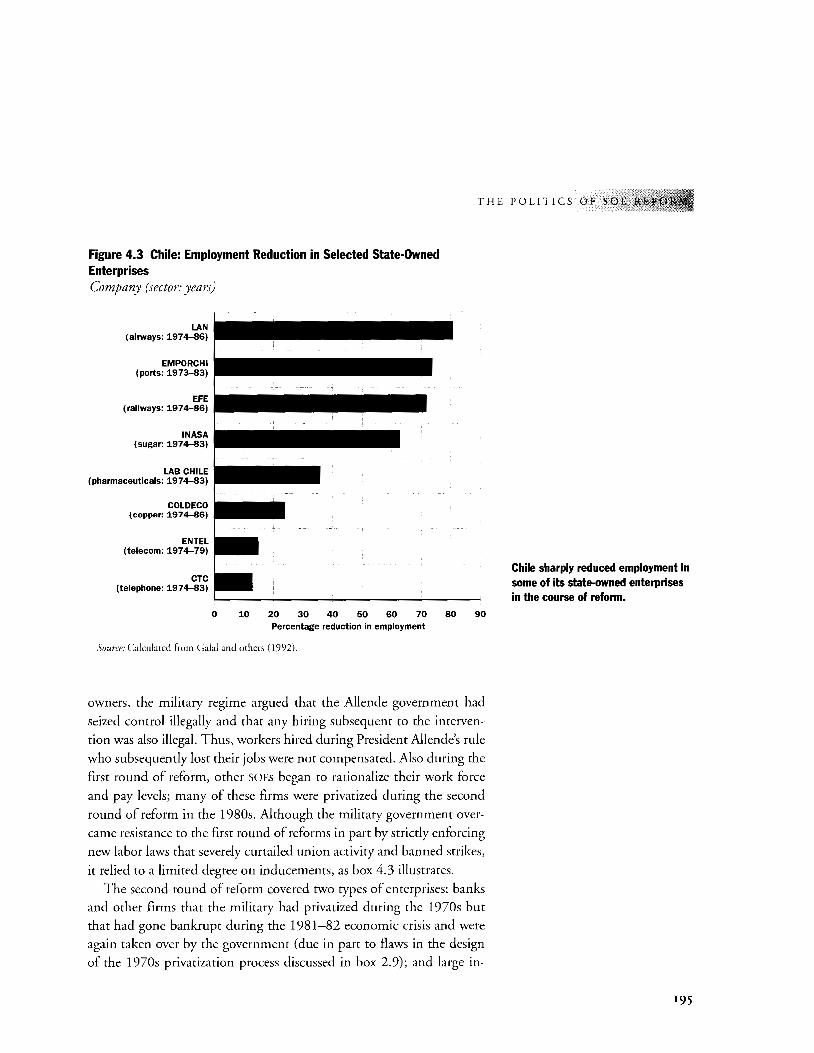
THE POLITICS OF SOE
Figure 4.3 Chile: Employment Reduction in Selected State-Owned Enterprises Company (sector: years)
LAN (airways: 1974-86)
EMPORCHI (ports: 1973-83)
EFE (railways: 1974-86)
I NASA (sugar: 1974-83)
LAB CHILE (pharmaceuticals: 1974-83)
COLDECO {copper: 1974-86)
EN TEL (telecom: 1974-79)
CTC (telephone: 1974-83)
o w w ~ ~ ~ ~ ro M ~
Percentage reduction in employment
Source: Calculated from Gala! and others (1992).
owners, the military regime argued that the Allende government had
seized control illegally and that any hiring subsequent to the interven
tion was also illegal. Thus, workers hired during President Allende's rule
who subsequently lost their jobs were not compensated. Also during the
first round of reform, other SOEs began to rationalize their work force
and pay levels; many of these firms were privatized during the second
round of reform in the 1980s. Although the military government over
came resistance to the first round of reforms in part by strictly enforcing
new labor laws that severely curtailed union activity and banned strikes,
it relied to a limited degree on inducements, as box 4.3 illustrates.
The second round of reform covered two types of enterprises: banks
and other firms that the military had privatized during the 1970s but
that had gone bankrupt during the 1981-82 economic crisis and were
again taken over by the government (due in part to flaws in the design
of the 1970s privatization process discussed in box 2.9); and large in-
Chile sharply reduced employment in some of its state-owned enterprises in the course of reform.
195
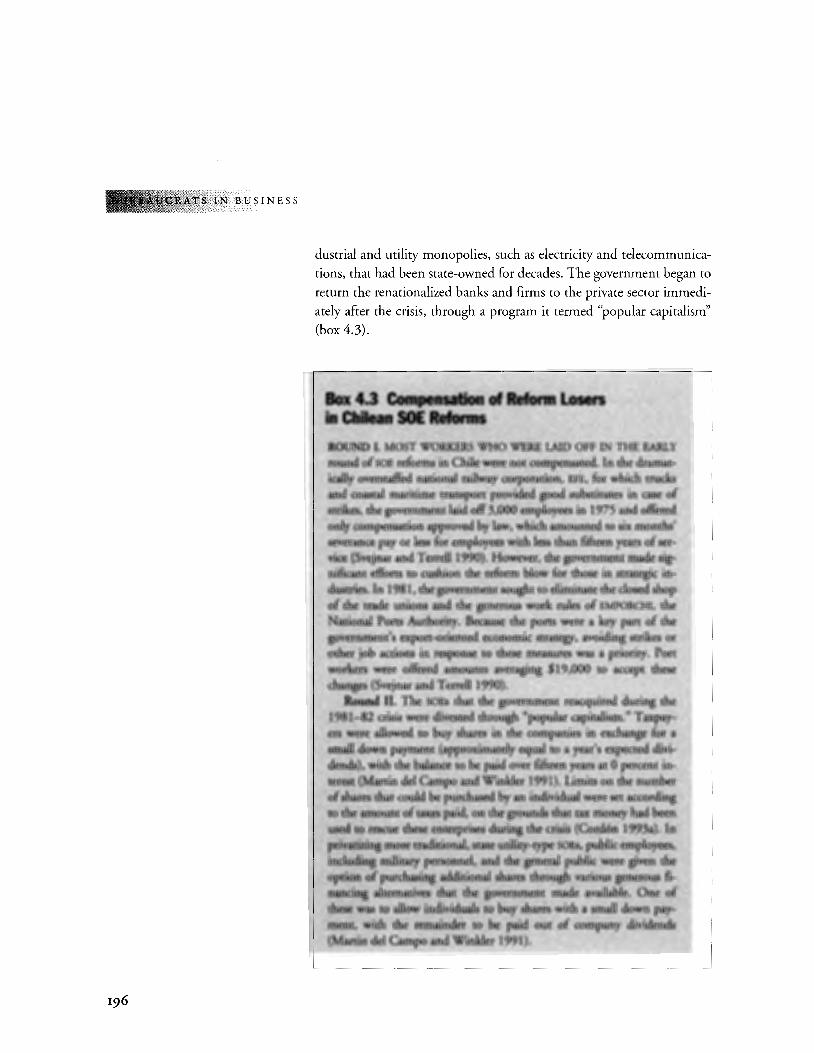
IN BUSINESS
196
dustrial and utility monopolies, such as electricity and telecommunica
tions, that had been state-owned for decades. The government began to
return the renationalized banks and firms to the private sector immedi
ately after the crisis, through a program it termed "popular capitalism"
(box 4.3).
Box 4.3 Cotllpeasation •• RefOrm Losers ill Cltileaa SOE Reforms · ROUND L MOST WOltKERS \VHO WERE LAID OFF IN THE EARLY rottnd of SOE reforms in Chile were not compensated. In thedramat~
·· ica.llyoverstaffed national railway corporation, EFE, for whkh trucks and Coastal maritime t:tansport provided. good substi.tutes. in case of strikes, the government laid off 3,000 employees in 1975 and offeted only compensation approved, bylaw.: which amounted to six months' severance pay or less fur employees with less than fifteen years of ser· Vice (Svt:jnar and Terrell 1990). However, the government made sig.; nific;ant efforts to cushion the refurm blow for those in strategic in~ dustries. In 198 I, the government sought to eliminate the dosed shop of the .trade unions and the genetous work rules of EMPORCHI, the· N~tional Ports Authority; Because the ports were a key part of the government's export~otiented economic straregy, avoiding strikes or oth<it job actions in response to these measures was a priority. Port wotkeis were offered amoun.ts averaging $19,000 to acc;ept these ~ange8{Svejnar and Terrell1990).
Ro:UOO It The SOEs that the government reacquired during the 19~~,...S2 crisis were dh>:ested tllrough "popular eapitalism." T~ay': ers were allowed to buy shares in the companies in exchange for a -~(down pa)l'lllent (~pproximately equalto a year's expected divi~
.. ·. dendt\), with the ba1an~ to be paid over fifteen years at 0 percent intere$r(M\ll,'tin del <;an1po;.and Wit;tijer 1991). Limits on .the nu•r
·.• qfshares that oould l>e pur~ased l>y an individual were set according . to~ ~nt oftal!:~ pai(i; ~ th~ gtt>lln(is:.thJt taimone1 had been
· ./ ·~~. t:~~ the# enterprise$ during the c;risis {Cordon 1993a). In .. / ·pt;i~f,{i~:more ~itiorial?' state 1ltilitr':typeSO£stpul,iliaemployees,
·• ~tt~ltt<lj{!g tniliW:y perspt;tJ1el~ an+f tb,~ ~en~~ Public \.,ere given the "op~:ofputc;h~i}lj a~tio!l~ sh~ tlJr<;u~ various· ~n~ous tl!l.~~~ a,lt~rnatives ~t ~lie gqvet:llll}elit · rn1tde avaihtbJt,, One .. of
··. t}i~ ~as to allQ\Vi~iyi<l\liUS to .liuf's~ with a small down pP.y~ flt~ut,' Withe the. mnaJ!ldei-. 'to ·.bt: .. ~d otit. of compat'ly dividt:llds (fv{artitl del campo an(J Winlder 1991).
THE POLITICS OF SOf:
In 1984, the government began to privatize large, monopoly SOEs.
Of these, Cordon (1993a) reports that utilities posed a particular chal
lenge to the regime, in part because many Chileans considered govern
ment ownership of such firms appropriate. For example, he writes that
within the junta itself, the air force expressed substantial reservations
about the privatization of telecommunications. In addition, these re
forms took place after the considerable social unrest that began during
the 1982 economic crisis: demonstrations occurred for the first time
under the military government, and armed opposition groups began to
operate (Cordon 1993a). The government responded to these difficul
ties by allowing workers, inhabitants of regions where the SOEs were located, and the general public to acquire shares on favorable terms. These
policies defused much of the opposition to the second round of SOE reforms and increased support for the government's policies generally (Cordon 1993a).16 Box 4.3 provides a brief description of them.
Mixed SOE Reformers
Among the countries that exhibited mixed success in SOE reform, the
Philippines could not satisfY the feasibility requirement, and Ghana and
Egypt fulfilled it only partially. We leave a description of Egypt's ability
to meet Condition II to the chapter appendix. Our discussion here fo
cuses on Ghana, which met Condition I and partly met Condition II,
and the Philippines, which fulfilled Condition I but not Condition II
because reformers lacked control of the legislature and bureaucracy.
President Rawlings' government controlled policymaking in Ghana
through most of the 1980s and into the 1990s. However, it was only in
1985, after the government took steps to defuse opposition, that SOE
reforms accelerated. First, as Ninsin (1991) documents, the govern
ment strengthened its ability to exercise compulsion by bringing senior
army officers into government; it subsequently reorganized the labor
unions, reducing the power of the Industrial and Commercial Workers
Union, which represented most SOE workers, and detained labor lead
ers critical of SOE reform. During this period, reform was at least par
tially feasible. By 1988, however, reforms became less feasible and the costs of sup
pressing dissent and compensating losers became too great. As figure 4.4 illustrates, actual SOE layoffs (called "redeployments" in Ghana) dropped
below planned layoffs in 1987, and reform eventually stopped alto-
197
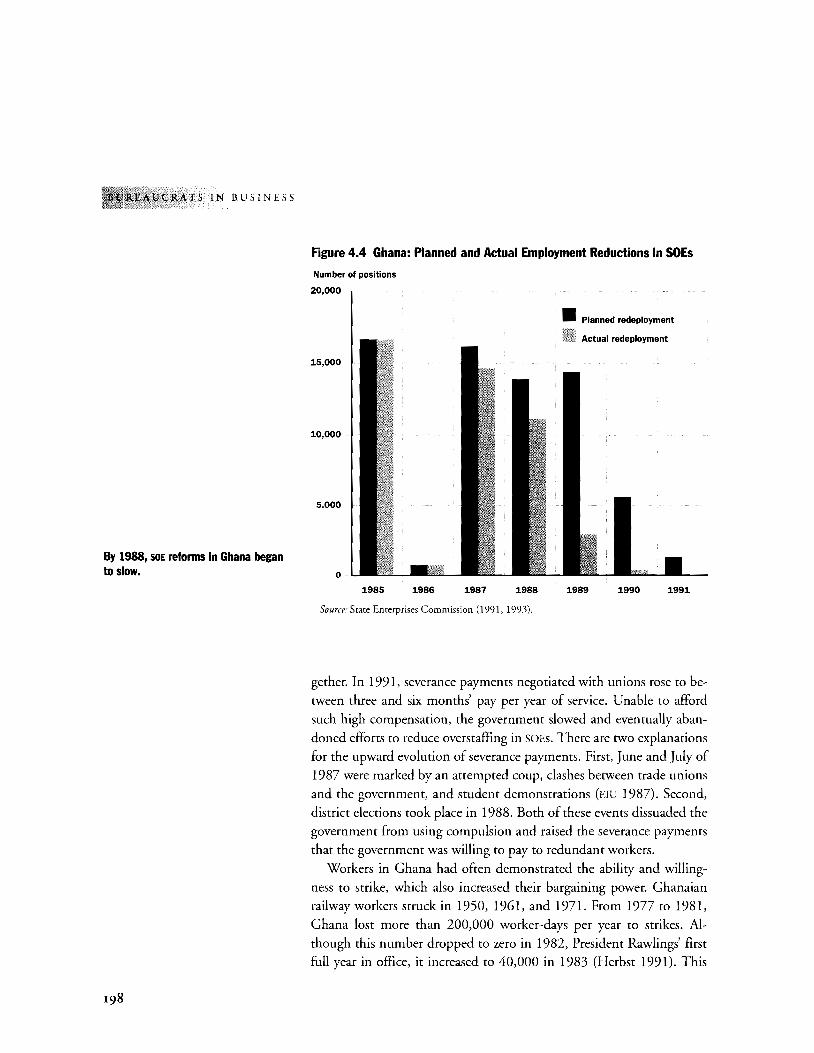
-::i!AUCRATS IN BUSINESS
By 1988, SOE reforms in Ghana began to slow.
198
Figure 4.4 Ghana: Planned and Actual Employment Reductions in SOEs
Number of positions
20,000
15,000
10,000
5,000
0
1985 1986 1987 1988
Source: State Enterprises Commission (1991, 1993).
• Planned redeployment
Actual redeployment
1989 1990 1991
gether. In 1991, severance payments negotiated with unions rose to between three and six months' pay per year of service. Unable to afford
such high compensation, the government slowed and eventually abandoned efforts to reduce overstaffing in SOEs. There are two explanations
for the upward evolution of severance payments. First, June and July of 1987 were marked by an attempted coup, clashes between trade unions and the government, and student demonstrations (EIU 1987). Second,
district elections took place in 1988. Both of these events dissuaded the government from using compulsion and raised the severance payments
that the government was willing to pay to redundant workers.
Workers in Ghana had often demonstrated the ability and willingness to strike, which also increased their bargaining power. Ghanaian
railway workers struck in 1950, 1961, and 1971. From 1977 to 1981, Ghana lost more than 200,000 worker-days per year to strikes. Although this number dropped to zero in 1982, President Rawlings' first full year in office, it increased to 40,000 in 1983 (Herbst 1991). This
THE POLITICS OF S
indicator of potential opposition, known prior to the onset of SOE re
form, could in principle be used as an ex ante indicator that SOE reforms
would be less than completely feasible.
In Ghana, the executive controls policymaking, but SOE reform faces
a substantial risk of resistance outside policymaking channels. In the
Philippines, in contrast, obstacles to the feasibility of reform arose from
the executive's partial control of the policymaking and implementing
apparatus. Since the end of the Marcos regime and the restoration of democracy in 1986, neither President Aquino nor President Ramos has
had control over the legislature, the bureaucracy, or the courts. As in
the U.S. system, the Filipino legislature can block policy reforms, and
neither post-Marcos president has headed a party with a majority in the
legislature. Instead, each has had to rely on an often fragile coalition of several parties to pass initiatives through the legislature. President Aquino headed a coalition made up of more than six parties, but this
coalition disintegrated well before the end of her six-year term. Presi
dent Ramos heads a party that took only 33 of 200 seats in the House
and 2 of 24 in the Senate. Although he has since had some success in
forging stronger legislative coalitions, opponents of SOE reform in the
legislature have been able to slow its pace and reduce its scope. Taken together with the absence of a compensation scheme, this suggests that
SOE reform was not politically feasible in the Philippines in the late
1980s and early 1990s.
Less Successful Reformers
All three countries in our sample with poor records of SOE reform did
not meet Condition I-that is, the leadership did not consider SOE re
form to be politically desirable. Here we note briefly how each country
ranked on Condition II (see the chapter appendix for details).
• India did not meet the requirements of Condition II. There was
legislative resistance to SOE reform and a high potential for resis
tance to reform outside political channels.
• Turkey met Condition II during the 1980s but did not meet Condition I-that is, reform was politically feasible but not po
litically desirable. Accordingly SOE reforms were not implemented. During the 1990s, new leadership that might have favored SOE reform was able to govern only with the support of a
199
UCRATS IN BUSINESS
200
coalition partner opposed to reform, making reform both politically undesirable and politically infeasible.
• Senegal, like Turkey, met Condition II only during the early part of the period. While there was no change of leadership, shifting
coalition arrangements and social unrest reduced the power of the
leadership so that the political conditions for SOE reform were
worse at the end of the period than at the beginning.
Transition Economies
The political feasibility of SOE reform in Central Europe differs from that in the developing-market economies in a fundamental respect. In most of the countries in our sample, SOEs were established after independence from colonial powers, as in Ghana, or as part of an ongoing effort to reaffirm nationalist goals, as in Egypt or India. They were therefore associated with political developments that many citizens, particularly intellectuals, enthusiastically favored. These positive associations increase resistance to SOE reform, making it less feasible. In the Czech Republic
and Poland, on the other hand, SOEs are associated with imposed Communist regimes, so despite the very large SOE sector, resistance to reform has been comparatively modest. Therefore, we class the Czech Republic
and Poland as meeting Condition II at least partially, despite the un
precedented magnitude of the reforms and the fact that the leadership in these countries did not enjoy parliamentary majorities. China more closely resembles the other countries in our sample. State enterprises were established as part of a movement that had broad support, and there is
little indication that the leadership favors significant SOE reform. This
means that China only partially meets Condition II. This section summarizes some of the main considerations for each of these countries. Ad
ditional analysis of Poland is supplied in the chapter appendix.
Both Polish and Czech leaders had to contend with coalition governments. These can make reform difficult by increasing the chances
that opponents of SOE reform will be part of the government. However, as the discussion of political desirability above suggests, the leadership
in the Czech Republic has enjoyed firmer control over the policymak
ing entities and has confronted less organized resistance from SOE workers than the leadership in Poland. The first privatization law was
approved in Czechoslovakia in 1991, before the dissolution of the Czechoslovak federation, when the Slovakian representatives in the
THE POLITICS OF SOE REFO
parliament were almost as numerous as the Czechs. 17 Passage occurred
despite the tepid support of Slovakia for privatization (which was
widely known at the time and confirmed by the subsequent slowdown
of privatization in Slovakia after the dissolution). Subsequently, legisla
tive support in the Czech Republic for SOE reform has only strength
ened. Since the 1992 elections, after dissolution, the Civic Democratic
Union, led by Vaclav Klaus, has held a significant legislative plurality of
76 out of 200 seats. In Poland, on the other hand, coalition partners often opposed SOE
reform. Securing legislative approval of voucher privatization was therefore easier in the Czech Republic than in Poland. Unable to establish a
legislative consensus for Czech-style mass ownership changes, reformoriented policymakers in Poland have instead imposed hard budget constraints and allowed so-called "spontaneous" privatizations, neither of which requires legislative approval. In Poland, as in most other coun
tries, hard budget constraints can be imposed by finance ministries and central banks without legislative agreement. Similarly, "spontaneous" privatizations, in which SOE assets are transferred to workers after nego
tiations with supervisory agencies, need not be approved by the legislature. Thus the overall approach to reform in each country has been shaped by what was politically feasible.
The contrasting compensation schemes adopted in the two countries also reflect differences in political feasibility. In the Czech Republic, SOE
managers have been able to influence the style of SOE reform (although
not the pace of it) in two ways. First, as Milor (1994) notes, some Ministry of Industry officials, who had a voice in approving privatization
plans for companies, were themselves former SOE managers and sympa
thetic to the concerns of SOE managers. Second, plans for individual SOE
privatizations were often prepared by enterprise managers (Milor 1994). The government's strategy of universal share distribution (box 4.4) not only increased popular support for privatization, but also overcame the
objections of managers. It opened the possibility that the ownership of
the divested enterprises would be diffuse, allowing managers to retain
control, even if their ownership shares in the company were small. 18 In Poland, on the other hand, not only have SOE employees had greater influence in policy formulation (see political desirability above), they have also had greater legal rights to the state-owned enterprises where they work. Consequently, they have been able to extract a higher level of compensation-typically in the form of ownership rights in the privat-
201
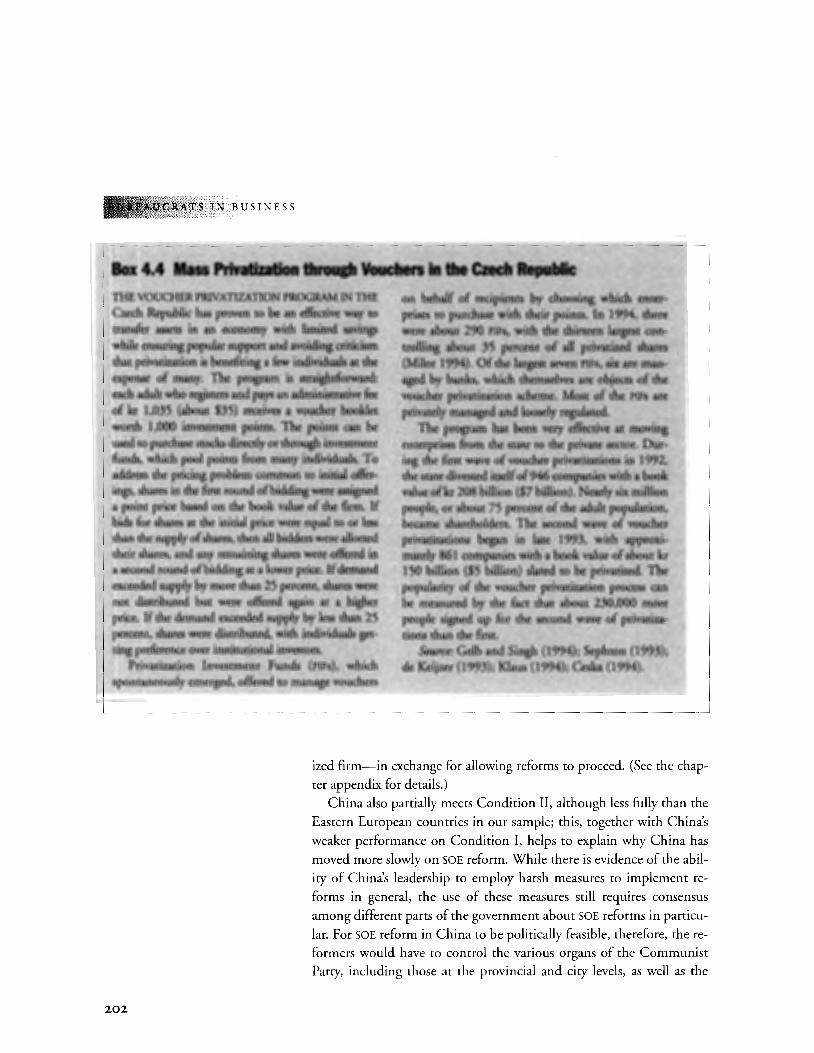
TS IN BUSINESS
. ._.4.4; -..:~·~;~~;r.;M;·\--.,~~L·· -r~m voucasaP~v~T~-rr¢il;~tio~~J~rarr.· .
. ings. ~lrith¢fi~tro~4.&fbi#1t~#:~l1~~~
bi~~~~~~=~~,ij~;: than th¢ supply of s~ ilieh.a1H1idder~:w"enti¥lotiid ·.
· th~~,·~~tmnaining~~off:ete<liti . a ~nd t()Wld ()fbidding.ataf~))t:i~.~~~~d
exceaiedsupply hymtlre thm;25.~t. s~~ ·not d:isttibuted but wen{Cltr~/~ atj~~¢r price. lfthedenlalltJ; ex;ce~~pP!r hfle$ ~ll:2' percent, s1tates ~te <ljSttihPt~ with ~tid~ get--
ring pr~ere4ce6ver ~tti~~f>!lalm~fB·:.········ .. ·. ··•.·. ··Privatization Invesrpie~t Pun& &llis}i • ~4ich
spontaneously emerged, offered to manage.VOudlers
202
ized firm-in exchange for allowing reforms to proceed. (See the chapter appendix for details.)
China also partially meets Condition II, although less fully than the
Eastern European countries in our sample; this, together with China's
weaker performance on Condition I, helps to explain why China has
moved more slowly on SOE reform. While there is evidence of the ability of China's leadership to employ harsh measures to implement reforms in general, the use of these measures still requires consensus
among different parts of the government about SOE reforms in particular. For SOE reform in China to be politically feasible, therefore, the reformers would have to control the various organs of the Communist Party, including those at the provincial and city levels, as well as the
THE POLITICS OF SOE REFOtl. ' ', '' .:~O:,::!,'rtJj~
party's governing bodies at the center. The incomplete coalition re
alignment noted in the discussion of Condition I suggests that this
control does not yet prevail. Resistance outside political channels to sig
nificant reform of the large SOE sector is also likely to be strong, given
the tens of millions of well organized and potentially disruptive state
owned enterprise workers whose jobs or pay levels could be threatened
by reform. Under these conditions, it is perhaps not surprising that the
government has taken a gradual approach to SOE reform and has
avoided the privatization of any major state enterprise.
Assessing Condition Ill: The Credibility of State-Owned Enterprise Reform
THE THIRD AND FINAL CONDITION FOR SUCCESSFUL STATE
owned enterprise reform is government credibility. The ability
of the leadership to minimize resistance and to marshal the sup
port of investors depends in large part on the expectation that govern
ment will keep its promises. These promises are of two types: promises
to compensate people, particularly SOE workers, who stand to lose from
SOE reform; and promises to investors that the government will establish
a policy regime conducive to profitable operations and refrain from re
nationalizing or otherwise expropriating privatized assets.
• Promises to SOE reform losers: As we have seen in the discussion of
political feasibility, SOE workers and managers, and others who
stand to lose their jobs or suffer wage cuts due to SOE reform, often
seek immediate compensation for their losses. But governments
commonly lack the resources to make immediate payments, par
ticularly when, as is frequently the case, they have initiated SOE re
form in response to fiscal crisis (Dewatripont and Roland 1993).
If governments can credibly promise future compensation, they
can overcome this shortage of current resources. However, govern
ments whose promises are not regarded as credible face much higher immediate costs and may be forced to reduce the scope and
speed of reform or even to abandon reform altogether. Thus, the government's ability to credibly promise foture compensation to likely
losers is crucial to successful reform.
203
RATS IN BUSINESS
204
• Promises to investors: The success of SOE reform frequently depends
on the willingness of private investors to buy state-owned enter
prises and to commit capital to the modernization or expansion of
privatized firms. The profitability of these investments depends on
a wide array of economic policies, including secure property
rights, the tax regime, and the prices that investors are allowed to
charge for their output. Because investors cannot easily withdraw
the capital that they commit to privatized state-owned enterprises,
they must rely on government promises that these policies will re
main stable. When they do not regard the promises as credible,
they require a steep discount on any state assets that they purchase
(or, in the case of regulated monopolies, a high guaranteed rate of
return). Significant discounts and high guaranteed rates of return
to investors make reform more difficult, because they open the
way to allegations that the government is giving away the nation's
assets and they reduce the resources available to increase local sup
port for reform. Thus, the government's ability to commit credibly to foture economic policies is crucial to successfUl reform.
Three factors, discussed below, increase a government's credibility: its
reputation for keeping promises; domestic restraints on policy reversal,
such as laws or constitutional restrictions; and international restraints,
such as treaties or loan covenants.
• Reputation. Reputation allows governments to buy support more
cheaply (by promising losers future compensation) and persuades
investors to pay a higher price for SOE assets. If governments renege
on promises and devalue their reputations, they lose these advan
tages and face greater costs in the future. Those countries in our
sample with the greatest credibility relied heavily on reputation.
• Domestic restraints on policy reversaL Domestic restraints that make
it harder for governments to renege on prior commitments are of
three broad types: (1) constitutional provisions that explicitly
make reneging more difficult, such as a stipulation that property
rights can only be altered by a two-thirds majority of the legisla
ture; (2) checks and balances that require leadership decisions to
be endorsed by an independent judiciary, legislature, or profes
sional bureaucracy regulated by strict internal performance standards; and (3) the design of the SOE reform policies themselves-
THE POLITICS OF SOE
in particular, the use of wide share distribution-which reduces
the likelihood of reversal by broadly sharing the long-term bene
fits of reform in ways that create a large proreform constituency,
increasing the political costs to governments of reversing poli
cies.19 Countries such as India and the Philippines, with political
systems that make reform both difficult to enact and to overturn,
sometimes had problems meeting Condition II. However, they
did better on Condition III, suggesting that reforms in countries
with political checks and balances are less vulnerable to reversal.
Domestic restraints were less important than reputation in estab
lishing credibility in the nontransition countries that meet Condi
tion III, since the executive branch had great discretion in these
countries, but have been substantially more important in Poland
and the Czech Republic. However, Chile and Korea each took
steps after reform to adopt domestic restraints that make the re
versal of SOE reforms more difficult and therefore less likely.
• International restraints. A country's international commitments
can restrain at least two types of SOE reform backsliding. First, gov
ernments may restore subsidies or trade protection to state-owned
enterprises. They are less likely to do this if their countries belong
to trading groups, such as WTO, NAFTA, and the European Union,
which explicitly restrict signatories from assisting domestic com
panies, including state firms, with subsidies and tariff and quota
protection. 20 Second, governments may renege on agreements
with foreign investors who have purchased SOE assets. They are
less likely to do this if the country relies heavily on trade and is
therefore vulnerable to the trade sanctions that foreign govern
ments might impose in retaliation. 21 Covenants in loan agree
ments with multilateral lending institutions can also impede re
form reversals.
As we shall see, the greater a government's credibility, the more likely
it is to reform its SOEs successfully; moreover, no government that lacked
credibility reformed its SOEs successfully. However, governments need
not use all three mechanisms to establish credibility. In our sample, rep
utation achieved through intensive and sustained implementation of
macroeconomic adjustment and liberalization programs was key to the
credibility of the three successful nontransition reformers; domestic re
straints counted for much less. Overall, we find that for countries that
205
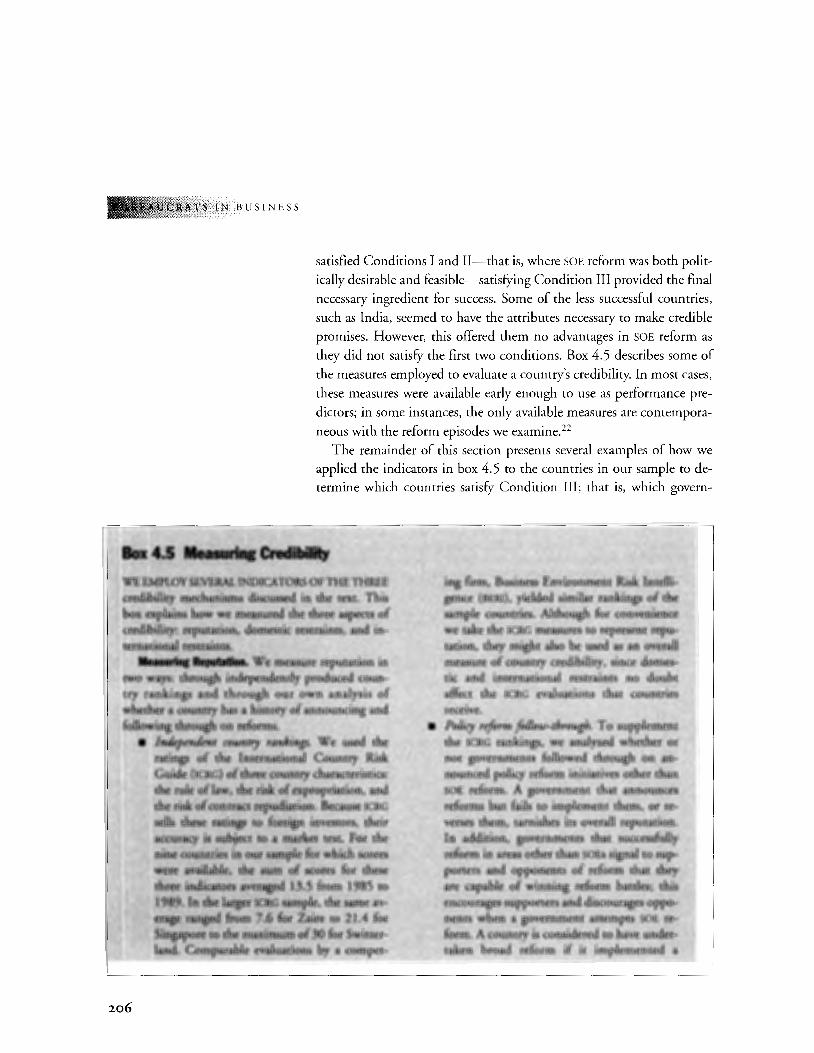
TS IN BUSINESS
satisfied Conditions I and II-that is, where SOE reform was both polit
ically desirable and feasible-satisfYing Condition III provided the final
necessary ingredient for success. Some of the less successful countries,
such as India, seemed to have the attributes necessary to make credible
promises. However, this offered them no advantages in SOE reform as
they did not satisfY the first two conditions. Box 4.5 describes some of
the measures employed to evaluate a country's credibility. In most cases,
these measures were available early enough to use as performance pre
dictors; in some instances, the only available measures are contempora
neous with the reform episodes we examine. 22
The remainder of this section presents several examples of how we
applied the indicators in box 4.5 to the countries in our sample to de
termine which countries satisfY Condition III; that is, which govern-
•:~•~,.~ .... .,., .. wt~PLOY~~{~mCb.toRSOF'rHETHREE . cre4ibllity mecharti~s ruse~ .r.n the text. This b(,)~·~hti,n~ k9w we ~<!Sllred the three aspects of credibilit!y:.teputati.o.t\, domestic restraints, and in-
terttat~~n~t~~ints. .···.· ....• •· .. .· .· ..... ,..~ •. Wemeasure reputation in
nvo ways:· through ifl.depeMenrly produced country rankings and through our.own anafysis of wheth~r a ooun.;ty has a his:toly of announcing and ·following tht0ugh tih reforms. . . .·
206
• ltltkpeflllent ·country tttnkings. We used the ... rat~ngs .. cif die International Country Risk • Guide(I~JtG}ofthrr;e <;Ountry characteristics: · the tu}e'.oflaw.J~e risk:ofeltpropriation, and theriSk'<i~con¥re.P~:Jdfa:ti9n; 'Because ICRG
.. ·.sellj th~e rati~.t(tfqreigti investors, their ... a~~tJ~c.:r.i~~~bject i:P.·<\ tj;1~~er .test. For the
. :::~~~~~~~~t~;!::::~~=: tfiteeJndtC<\(?is ~ve~~ J.?S from 1~85 to
.(IL·lt~~!rr;!~ Ian~t Compru:abte eVai.uations by a compet-
ing firm, Business Environment Risk Intelligence {BERI), yielded similar rankings of the sample countries. Although for convenience we take the ICRG measures to represenneputation, they might atso be used as an overall measure of country credibility, since domestic and international restraints no doubt affect the ICRG evaluations that countries receive.
• Policy reform follow-through. To supplement the ICRG rankings, we analyzed whether or not governments followed through on announced policy reform initiatives other than SOE reform.. A government that announces reforms but fails to implement them, or reverses them, tarnishes hs overall reputation . In .. addition, governments that successfully reform in areas other than SOEs signal to supporters and opponen.ts of reform that they are capable of winning reform battles; this encourages supporters and discourages oppo-nentS when a government attempts SOE reform. A country is considered to have undertaken broad reform if it implemented a
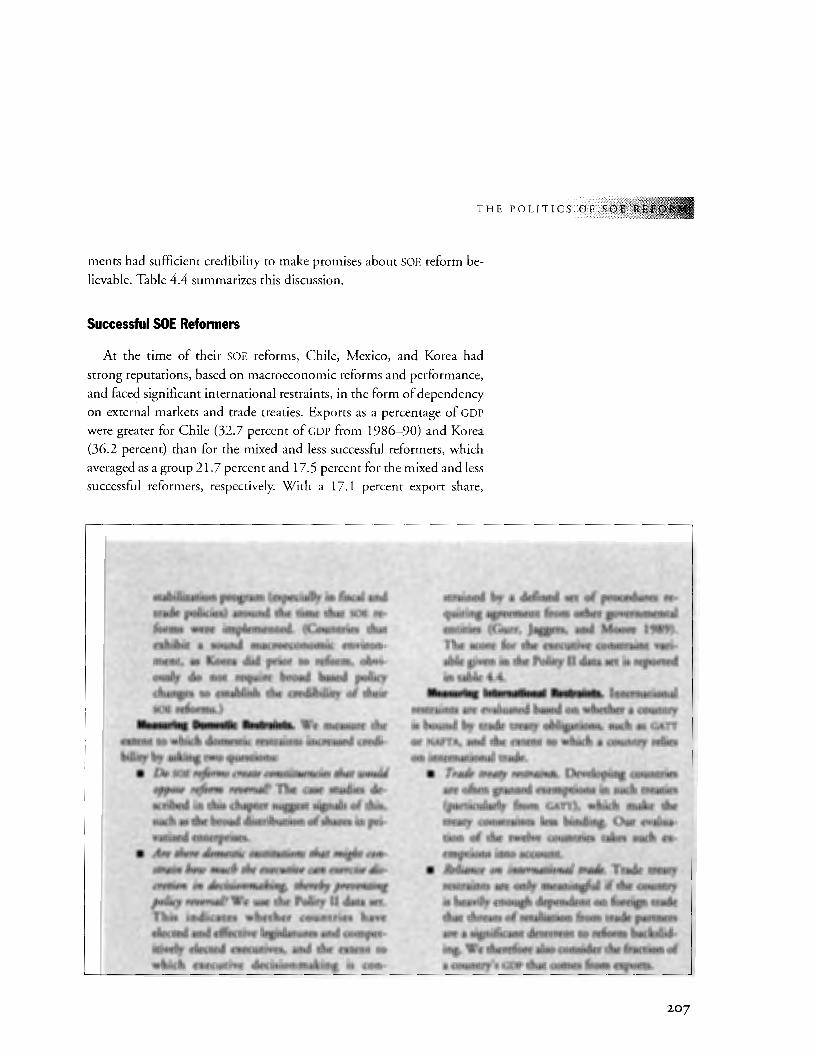
THE POLITICS OF SOE
ments had sufficient credibility to make promises about SOE reform be
lievable. Table 4.4 summarizes this discussion.
Successful SOE Refonners
At the time of their SOE reforms, Chile, Mexico, and Korea had
strong reputations, based on macroeconomic reforms and performance,
and faced significant international restraints, in the form of dependency
on external markets and trade treaties. Exports as a percentage of GOP
were greater for Chile (32.7 percent of GOP from 1986-90) and Korea
(36.2 percent) than for the mixed and less successful reformers, which
averaged as a group 21.7 percent and 17.5 percent for the mixed and less
successful reformers, respectively. With a 17.1 percent export share,
stabilization program (especially in fiscal and trade policies) around the time that SOE reforms were implemented. (Countries that exhibit a sound macroeconomic environment, as Korea did prior to reform, obviously do not require broad based policy changes to establish the. credibility of their SOE reforms.)
Measuring Domestic Restraints. We measure the extent to which domestic restraints increased credibility by asking two questions:
• Do SOE reforms create constituencies that would oppose reform reversal? The case studies described in this chapter suggest signals of this, such as the broad distribution of shares in privatized enterprises.
• Are there domestic institutions that might constrain bow much the executive can exercise discretion in decisionmaking, thereby preventing policy reversal? We use the Polity II data set. This indicates whether countries have elected and effective legislatures and competitively elected executives, and the extent to which executive decisionmaking is con-
strained by a defined set of procedures requiring agreement from other governmental entities (Gurr, Jaggers; and Moore 1989). The score for the executive constraint variable given in the Polity II data set is reported in table 4.4.
Measuring International Restraints. International restraints are evaluated based on whether a country is bound by trade treaty obligations, such as GATI
or NAFTA, and the extent to which a country relies on international trade.
• Trade treaty restraints. Developing countries are often granted exemptions in such treaties (particularly from GATI), which make the treaty constraints less binding. Our evaluation of the twelve countries takes such exemptions into account.
• Reliance on international trade. Trade treaty restraints are only meaningful if the country is heavily enough dependent on foreign trade that threats of retaliation from trade partners are a significant deterrent to reform backsliding. We therefore also considerthe fraction of a country's GDP that comes from·exports.
207
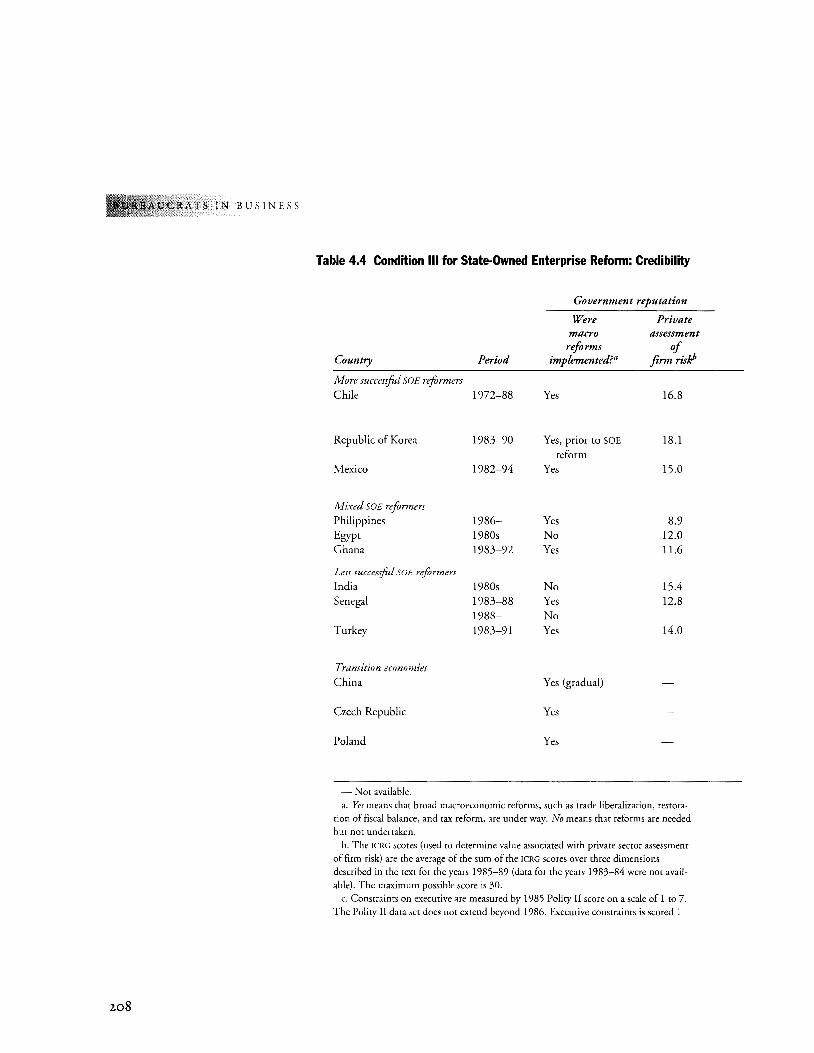
CRATS IN BUSINESS
208
Table 4.4 Condition Ill for State-Owned Enterprise Reform: Credibility
Country Period
More successfUl SOE reformers
Chile 1972-88
Republic of Korea 1983-90
Mexico 1982-94
Mixed SO£ reformers Philippines 1986-Egypt 1980s Ghana 1983-92
Less successfol SOE reformers India 1980s Senegal 1983-88
1988-Turkey 1983-91
Transition economies
China
Czech Republic
Poland
-Not available.
Government reputation
Were Private macro
reforms implemented?a
Yes
Yes, prior to SOE
reform Yes
Yes No Yes
No Yes No Yes
Yes (gradual)
Yes
Yes
assessment of
firm risfi
16.8
18.1
15.0
8.9 12.0 11.6
15.4 12.8
14.0
a. Yes means that broad macroeconomic reforms, such as trade liberalization, restoration of fiscal balance, and tax reform, are under way. No means that reforms are needed but not undertaken.
b. The !CRG scores (used to determine value associated with private sector assessment of firm risk) are the average of the sum of the !CRG scores over three dimensions described in the text for the years 1985-89 (data for the years 1983-84 were not available). The maximum possible score is 30.
c. Constraints on executive are measured by 1985 Polity II score on a scale of I to 7. The Polity II data set does not extend beyond 1986. Executive constraints is scored I
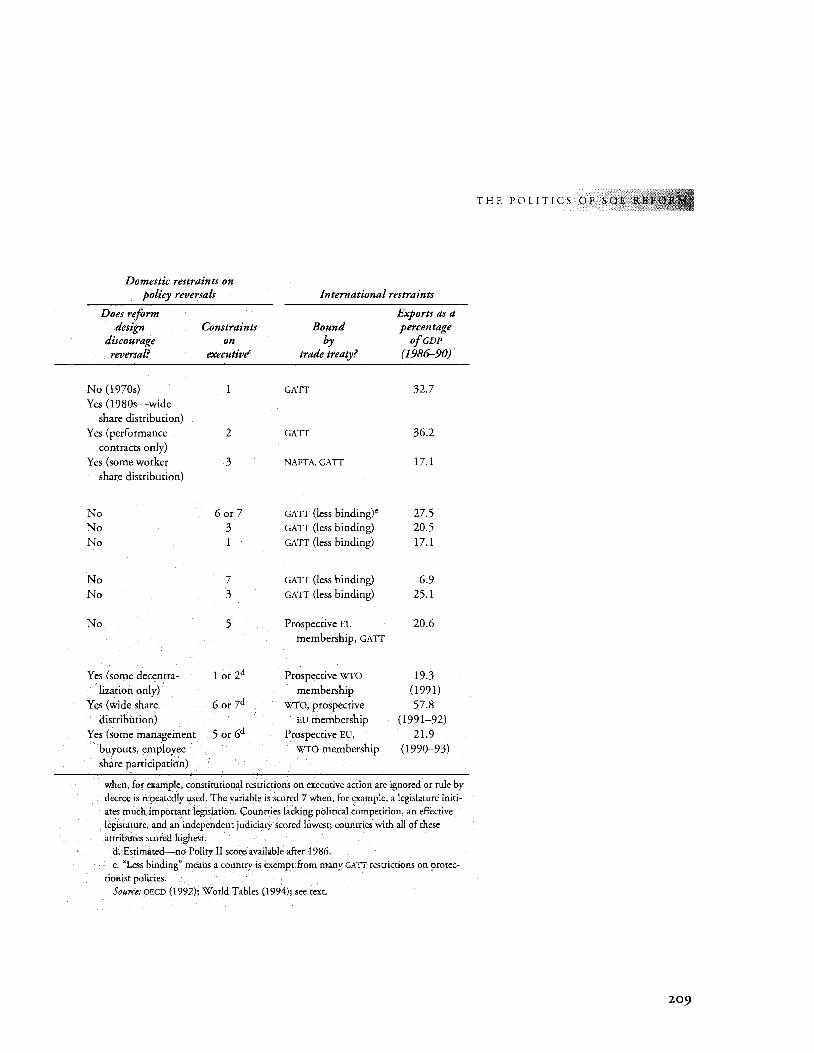
Domestic restraints on policy reversals International restraints
Does reform Exports as a design Constraints Bound percentage
discourage on by ojGDP reversal? executivtf trade treaty? (1986-90)
No (1970s) 1 GAIT 32.7 Yes (1980s-wide
share distribution) Yes (performance 2 GAIT 36.2
contracts only) Yes (some worker 3 NAFTA,GAIT 17.1
share distribution)
No 6or 7 GAIT (less binding)e 27.5 No 3 GAIT (less binding) 20.5 No 1 GAIT (less binding) 17.1
No 7 GAIT (less binding) 6.9 No 3 GATT (less binding) 25.1
No 5 Prospective EU 20.6 membership, GAIT
Yes (some decentra- 1 or 2d Prospective wro 19.3 lization only) membership (1991)
Yes (wide share 6or7d wro, prospective 57.8 distribution) EU membership (1991-92)
Yes (some management 5 or6d Prospective EU, 21.9 buyouts, employee wro membership (1990-93) share participation)
when, for example, constitutional restrictions on executive action are ignored or rule by decree is repeatedly used. The variable is scored 7 when, for example, a legislature initiates much important legislation. Countries lacking political competition, an effective legistature, and an independent judiciary scored lowest; countries with all of these artributes scored higbest.
d. Estimated-no Polity II score available after 1986. e. "Less binding" means a country is exempt from many GAIT restrictions on protec
tionist policies. Source: OECD (1992); World Tables (1994); see text.
THE POLITICS OF SOE R
209
TS IN BUSINESS
210
Mexico was an exception among the successful reformers, but was likely
to have been constrained by NAFTA negotiations and obligations. The
more successful reformers ranked less well in terms of domestic re
straints; wide share distribution was an important part of SOE reform
only in Chile, and none of the three had significant constitutional or
procedural provisions to prevent policy reversals (this has since changed
in Chile and Korea). Even so, by scoring well in rwo of the three sets of
indicators, the governments of these countries can be said to have par
tially met Condition III. We illustrate this with a discussion of Chile;
Mexico and Korea are discussed in the chapter appendix.
The credibility of Chile's SOE reforms rested on the strength of the
government's reputation gained from broader policy reforms, and the
widely recognized fact that opponents of reform had little or no oppor
tunity to slow or reverse the government's policy initiatives. Chile also exhibited an increasing dependence on international markets; exports
as a percentage of GOP rose from 15 percent in 1970 to 21 percent in
197 4 and more than 30 percent in the 1980s. 23 Both rounds of SOE reform (in the 1970s and 1980s) were closely associated with ambitious
macroeconomic programs that included tighter fiscal policies and an
easing of trade and financial restrictions. The impact of these reforms
on government reputation in Chile can be seen in the improvements in
Chile's BERI scores for nationalization risk and contract enforceability.
From 1973, right after the coup that brought the military regime to
power, to 1982, the sum of Chile's scores on these rwo kinds of risk rose
from 0.6 to 4.9. Chile's credibility in the second round was also high,
as indicated by its ICRG score in the 1980s, which is the second highest
in the sample.
Policy design and constitutional restrictions on policy reversal con
tributed little to the credibility of reforms in the 1970s. Both had a
greater role in the 1980s, however. We have already described how the
Chilean government, as part of the design of SOE reform, promoted
mass ownership of shares. Here we note only that mass ownership con
tributed to both Condition II and Condition III; that is, it assisted the
political ftasibility of reform (Condition II) by building support for im
plementation, and it strengthened the credibility of reform (Condition
III) by creating a constituency that would defend the reforms in the fu
ture, making it more difficult for any subsequent administration to re
nationalize privatized firms. Other domestic restraints are described in box 4.6.
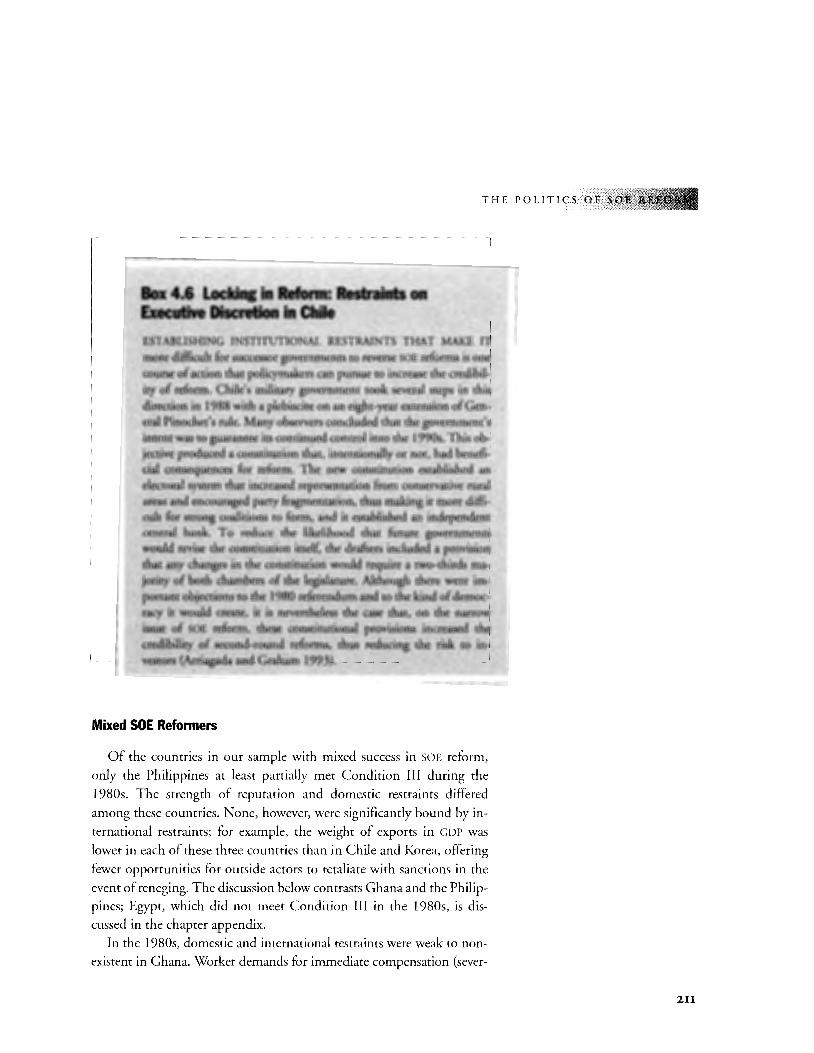
Box 4.6 . Locking in Reform: Restraints on Executive Discretion in Chile ESTAl)LlSHING INSTITUT.IONAL RESTRAINTS THAT MAKE IT more difficult for successor governments to reverse SOE refurms is one course of action that policymakers can pursue to increase the credlbility ofrefurm. Chile's military government took several sreps in this direction in 1988 with a plebiscite on an eight-year extension of General Pinochet's rule. Many observers concluded that the government's intent was to guarantee its continued control into the 1990s. This objective produced a constitution that, intentionally or not, had beneficial consequences for reform. The new constitution established an electo;ral system rhat increased representation· from conservative rural arC45 and encOuraged party fragmentation, rhus making it mote difficQit for strong coolitiollS to fOrm, and it established an independent central bank To reduce the likelihood that future governments WoUld revise the COh$titution itself,. the drafters included a provision that ~ changes in the constitution would require a rwo.:rhirds inajo.rit}t of both chambers of the legislature. Although there were im~ pQtrartt objections to the 1980 referendum and to the kind of democracy it would create, it: is neverrhel~the case that, 6ri t:he narrow issue of SOl!. refi:mu, these .. constitutional •. provisiQns • increased the credibility ofsc:cond-rbund refortns, thus reducing the risk to in-v:estors (Arriagitda and Graham 1993).
Mixed SOE Reformers
THE POLITICS OF S
Of the countries in our sample with mixed success in SOE reform,
only the Philippines at least partially met Condition III during the
1980s. The strength of reputation and domestic restraints differed
among these countries. None, however, were significantly bound by in
ternational restraints; for example, the weight of exports in GOP was
lower in each of these three countries than in Chile and Korea, offering
fewer opportunities for outside actors to retaliate with sanctions in the
event of reneging. The discussion below contrasts Ghana and the Philippines; Egypt, which did not meet Condition III in the 1980s, is dis
cussed in the chapter appendix.
In the 1980s, domestic and international restraints were weak to non
existent in Ghana. Worker demands for immediate compensation (sever-
2II
,ATS IN BUSINESS
212
ance pay) meant that compensation plans did not increase future support
for the continuity of SOE reforms. Ghana's economic policy reforms in the
1980s included a major currency devaluation, civil service cuts, and a large
reduction in the fiscal deficit. These should have boosted the govern
ment's reputation, but a low ICRG score of 11.6 indicates that other coun
tervailing factors were at work. One of these was the extent to which the
economy had been allowed to deteriorate before the reforms. By 1983, the
fiscal deficit was 60 percent of current government expenditures and cap
ital payments, higher than Mexico's worst deficit during the period and
four times Korea's deepest deficit.24
In addition, some government statements during the 1980s were
hostile to private enterprise. This is in sharp contrast to Mexico under
President Salinas, where the rhetoric was probusiness and the govern
ment actively consulted with business leaders about economic policy
decisions. More damaging to Ghana's credibility than these statements
were actions that the government took against some businesses. In
1987-88, for example, the government took the principal domestic tobacco company from one set of private owners and gave it to another,
changing the name from International Tobacco to Meridian in the
process. This episode coincided with the slowing pace ofSOE reform in
Ghana. Moreover, as Leith and Lofchie (1993) report, in the early years
of the Rawlings regime, people's defense committees and workers'
defense committees were set up to monitor and arrest business people
suspected of "counterrevolutionary" activity. Actions such as these
would have severely undermined the credibility of a government with
investors.
The Philippines had a strong set of domestic restraints on policy re
versal during the period, which explains why it met Condition III, at
least partially, despite its weak reputation. The 1986 Constitution con
tained numerous checks and balances that limited the power of any gov
ernment entity alone to overturn existing policies. As we noted above,
the legislature has been powerful and has not been controlled by the
president since the end of the Marcos regime. Once all major players
have accepted reforms, they are difficult to reverse and are therefore
credible. However, the Philippines had a low ICRG score, perhaps be
cause of the continued threats of coups in the late 1980s and early
1990s. In addition, the Philippines was less consistent than others in the
sample in the implementation of sound macro policies, and its external treaty obligations were slight.
THE POLITICS OF SOE RE
Less Successful SOE Reformers
The credibility of Senegalese SOE reforms was low during the 1980s,
but Turkey and India at least partially fulfilled Condition III. Although
the fraction of GOP from exports was lower for the three less successful
SOE reformers than the average for the other developing market
economies in our sample, some other credibility indicators, particularly
constitutional restraints on policy reversal, were actually stronger for this group. While this may seem surprising, it reinforces the central message
of this chapter, that reform cannot succeed until countries fulfill each of
the three readiness conditions. Credibility alone is not enough. To suc
ceed, reform must also be politically desirable and feasible. The rela
tively high credibility of India and Turkey suggests that if they were to
satisfy Conditions I and II, the prospects for SOE reform would be promising. In this chapter, we illustrate the credibility ratings for the less
successful SOE reformers with a discussion oflndia; Turkey and Senegal
are discussed in the chapter appendix.
Compared with other countries with a similar income level, India en
joys a relatively good reputation among investors, despite the absence
until recently of a broad macroeconomic reform program. Policy reversals
to the detriment of investors have been few, and the country has avoided
the broad macroeconomic imbalances that have afflicted, for example,
Ghana, Senegal, and Turkey. Moreover, like the Philippines after President
Marcos, India has a constitution that imposes significant restraints on the
executive branch, making policy reversals less likely. Among the countries in our sample, India ranks highest on the Polity II executive constraints di
mension with the maximum score, seven (see table 4.4). On the other
hand, international restraints have had only limited impact; India has not
fully embraced international trade treaty obligations.
Failure to deliver promised compensation to those who lose in the
course of SOE reform may have also hurt the government's credibility. In
one textile factory, dismissed workers did not receive promised compen
sation for four years. Such problems have contributed to sometimes
fierce opposition to reform. Mukul (1991) reports on an attempt by the
state government of Uttar Pradesh to sell 51 percent of a money-losing cement plant in 1991, which ended in violence that killed forty workers.
Although the sales agreement stipulated that all 8,000 employees would be retained, workers feared that at least half would be laid off with a lump
sum severance pay they regarded as inadequate. They also objected to
213
TS IN BUSINESS
214
selling the firm at book value, although the firm's annual losses averaged
$700,000 between 1985 and 1991. Partly as a result of this incident,
Mukul concludes, the state government was turned out of office; its suc
cessor scuttled the deal.
The Transition Economies
The limited evidence available suggests the transition economies that
have successfully reformed their SOEs, such as the Czech Republic, have
enjoyed at least as much credibility for SOE reform as any country in our
sample, through a combination of sound reputation built on macroeco
nomic reforms and domestic restraints on policy reversal. This is im
pressive progress given the exceptional challenges that the transition
economies face in building credibility. In their accomplishments, the
most successful countries illustrate the effectiveness of moving decisively
to establish a sound reputation while at the same time putting in place
domestic restraints that make policy reversal more difficult and therefore less likely. China has fewer domestic restraints; the partial credibil
ity it exhibits therefore depends heavily on the reputation derived from
macroeconomic reforms and growing exports. We discuss the Czech Re
public and Poland below, and China in the chapter appendix.
Both Poland and the Czech Republic have undertaken dramatic
macroeconomic reforms as part of their overall efforts at systemic trans
formation. As in Chile and Mexico, these macroeconomic reforms oc
curred prior to privatization and could have been observed in advance of
SOE reform decisions by investors and those expecting compensation
from the government. As the discussion of political feasibility reveals,
both countries exhibit domestic restraints on policy reversal. In each
country, executive discretion is limited by significant legislative author
ity over the policymaking process and by electoral processes that make it
difficult for single parties to achieve absolute legislative majorities.
These constraints have sometimes affected the pace of reform, consis
tent with the earlier analysis of reform feasibility. Although the continu
ity of government in the Czech Republic has allowed it to pursue SOE re
form consistently, in Poland, political instability has led to occasional
temporary reversals, as when Waldemar Pawlak suspended the privatiza
tion initiative passed by the previous government.
In addition, SOE reforms have been designed to create constituencies that favor the long-term success of the reformed enterprises. In Poland,
THE POLITICS OF SOE
this was done through share distributions to SOE employees (or through
"spontaneous privatizations" discussed above), thus making them long
term supporters of reform. In the Czech Republic, share distribution
was much wider, effectively making the public at large a pro reform con
stituency. Finally, the governments of both countries had a strong desire
(since realized with their entry into the World Trade Organization, or
WTO) to enter the European Union, the WTO, and NATO, providing an
external check on policy backsliding.
Explaining and Predicting Reform Success
THE FRAMEWORK AND EVIDENCE PRESENTED IN THIS CHAPTER
offer a basis for analyzing when and where SOE reform can suc
ceed and be sustained. The analysis rests on the premise, set
forth at the beginning of the chapter, that countries only implement
state-owned enterprise reform successfully when they meet three condi
tions: first, reform must be politically desirable; second, reform must be
politically feasible; and, third, promises crucial to reform (to compen
sate losers and to protect the property rights of investors) must be cred
ible. Analyzing SOE reform experiences in twelve countries, we found
that this was indeed the case: countries that reformed their state-owned
enterprises successfully met or partially met all three conditions; coun
tries that did not reform successfully failed to meet at least one condi
tion. Although our sample is small, it is economically and geographi
cally diverse. Moreover, the findings are consistent for more than one
reform episode in countries such as Chile, Mexico, and Turkey.
Could reform readiness have been predicted beforehand? Prediction,
of course, requires that the indicators be known prior to the reform at
tempt. The indicators used in table 4.5 have that property. For example,
to estimate the desirability of reform, we consider whether there has
been a regime change, a coalition shift, or an economic crisis, and we
identifY the support base of government decisionmakers. To judge re
form feasibility, we take into account such characteristics as the consti
tutional or procedural requirements that make reform more or less fea
sible, and the distribution of political power among the various entities
of government. For credibility, we have relied on such indicators as rep
utation assessments by investor risk services, the design of the reform,
215
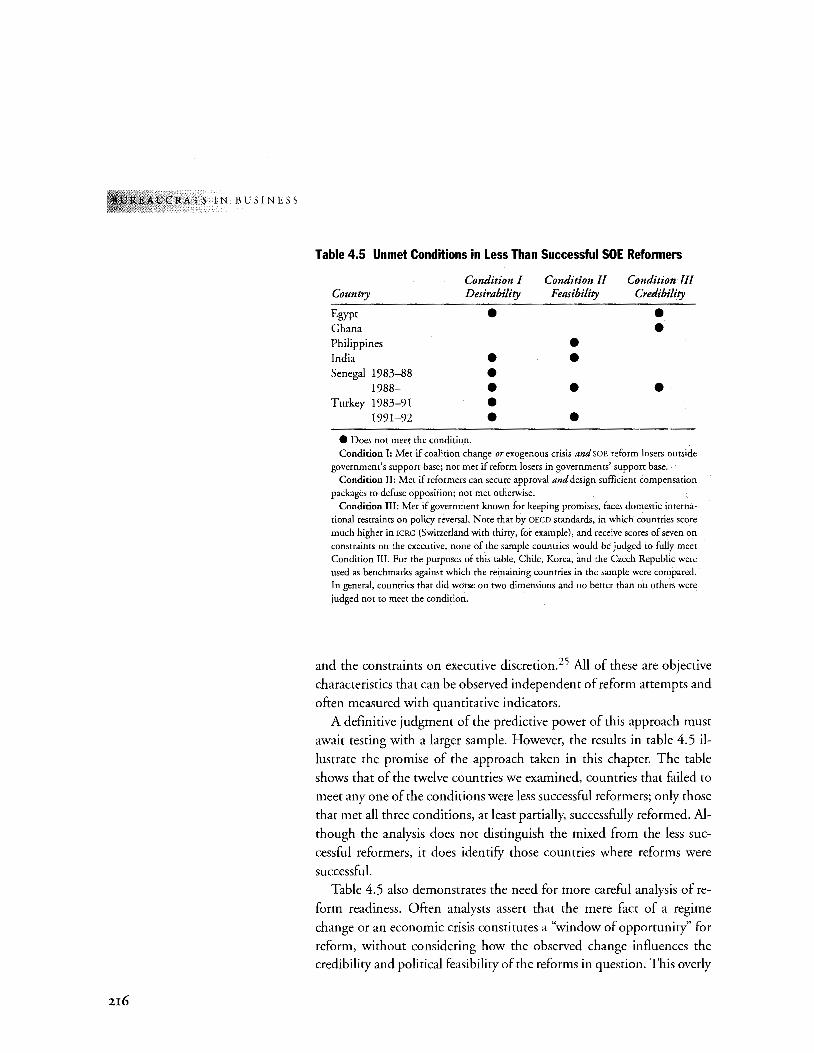
CRATS IN BUSINESS
216
Table 4.5 Unmet Conditions in Less Than Successful SOE Reformers
Condition I Condition II Condition III Country Desirability Feasibility Credibility
Egypt • • Ghana • Philippines • India • • Senegal 1983-88 •
1988- • • • Turkey 1983-91 •
1991-92 • • e Does not meet the condition. Condition 1: Met if coalition change or exogenous crisis and SOE reform losers outside
government's support base; not met if reform losers in governments' suppon base. Condition II: Met if reformers can secure approval and design sufficient compensation
packages to defuse opposition; not met otherwise. Condition III: Met if government known for keeping promises, faces domestic interna
tional restraints on policy reversal. Note that by OECD standards, in which countries score much higher in ICRG (Switzerland with thirty, for example), and receive scores of seven on constraints on the executive, none of the sample countries would be judged to fully meet Condition III. For the purposes of this table, Chile, Korea, and the Czech Republic were used as benchmarks against which the remaining countries in the sample were compared. In general, countries that did worse on rwo dimensions and no better than on others were judged not to meet the condition.
and the constraints on executive discretion. 25 All of these are objective
characteristics that can be observed independent of reform attempts and
often measured with quantitative indicators.
A definitive judgment of the predictive power of this approach must
await testing with a larger sample. However, the results in table 4.5 il
lustrate the promise of the approach taken in this chapter. The table
shows that of the twelve countries we examined, countries that failed to
meet any one of the conditions were less successful reformers; only those
that met all three conditions, at least partially, successfully reformed. Al
though the analysis does not distinguish the mixed from the less suc
cessful reformers, it does identify those countries where reforms were
successful. Table 4.5 also demonstrates the need for more careful analysis of re
form readiness. Often analysts assert that the mere fact of a regime
change or an economic crisis constitutes a "window of opportunity" for
reform, without considering how the observed change influences the credibility and political feasibility of the reforms in question. This overly
THE POLITICS OF SOE RE:fOl~.:t~l >':i'Pi
simple approach would have led analysts to predict, for example, that
successful SOE reform was likely during the period we studied in Egypt
and Ghana (both of which experienced an economic crisis), and in the
Philippines (which experienced an economic crisis and a regime
change). In fact, as the table shows, consideration of the other compo
nents of political desirability (the composition of the government's
coalition and its support base), as well as of the feasibility and credibil
ity of SOE reform efforts, would have painted a less optimistic and more
accurate picture of the likelihood of reform success in those countries.
Conclusion
ALTHOUGH THIS CHAPTER HAS DOCUMENTED MANY BARRIERS
to reform, its message, and indeed the overall message of our find
ings, is essentially optimistic. All the countries that successfully re
formed their state-owned enterprises lacked at the outset one or more of
the three conditions we have identified as necessary for reform success. All
eventually acquired them and went on to correct the inefficiencies in their
state-owned enterprise sectors. Moreover, the successful reformers satisfied
these three conditions in different political environments-in the context
of significant political liberalization (the Czech Republic and Poland) and
in more authoritarian settings (Chile and Korea); in different ways
through extensive distribution of enterprise shares (the Czech Republic and
Poland) and through more moderate redistribution (Mexico); and through
varying credibility mechanisms-sound macroeconomic policies (Chile
and Korea), international trade agreements (Mexico), and domestic re
straints on policy reversal (the Czech Republic and Poland). The case stud
ies demonstrate that where reforms are politically desirable, committed
leadership can indeed take steps to increase their feasibility and to establish
the necessary credibility. How to implement reforms once the three neces
sary political conditions are in place-and what to do when they are not
is the topic of our final chapter.
217
UCRATS IN BUSINESS
Appendix 4.1 The Politics of State-Owned Enterprise Reform: Additional Evidence
THIS APPENDIX PRESENTS EVIDENCE FOR
AN assessment of the role of the three con
ditions for successful state-owned enterprise
reform-political desirability, political feasibility,
and credibility-that we excluded from chapter 4
for reasons of space and clarity of argument. The
appendix will be of particular interest to policymak
ers and development experts who intend to under
take similar analysis and therefore want further ex
amples of how we evaluated the various ways that
countries in our sample met, or failed to meet, each condition. It will also interest readers who want
more detail about a specific country in our sample.
The appendix follows the organization of chapter 4 without repeating the main arguments of each sec
tion. Readers can therefore begin with the chapter
and turn to the appendix as their interest dictates.
Assessing Condition 1: Political Desirability
The chapter text analyzes in detail the political
desirability of reform for two successful reformers,
Chile and Mexico, and one mixed, Egypt. It also
summarizes the reasons why the three least successful
reformers failed to meet Condition I. Here we pre
sent additional evidence for our assessment of the
political desirability of SOE reform in Korea, a suc
cessful reformer; Ghana and the Philippines, mixed
reformers; India and Turkey, less successful
reformers; and Poland.
Republic of Korea. Korea is unique among the coun
tries in the sample in that both the costs and the ben
efits to the leadership and their constituencies of SO£
reform were low. Dramatic economic and political
events, such as those in Chile and Mexico, were there
fore not necessary to trigger reform. There was, for ex-
2!8
ample, no regime change or coalition realignment
during the period of analysis. Instead, slowing per
capita GDP growth and increasing SOE losses that
might not have been considered serious problems in
other countries were sufficient to make SOE reform
politically desirable. In 1980, GDP growth, which had
averaged about 7 percent in the late 1970s, dropped
to -4.5 percent. In 1982, the number of state-owned
enterprises losing money increased from two to five,
and the aggregate SOE deficit rose. This deficit was small, however, amounting to only 1.5 percent of the
central government's total fiscal deficit in 1982 (Song
1988).
Why were a temporary dip in the country's very respectable growth rate and a relatively mild increase
in SOE deficits enough to trigger reform? The politi
cal motivations for SOE reform are more difficult to
identifY in Korea than in Chile and Mexico, but there
are two likely explanations. First, the Korean govern
ment had a strong commitment to fiscal discipline.
From 1980 to 1991, Korea's budget deficit averaged
4.5 percent of current government expenditures and
capital payments, compared to more than 15 percent
for Egypt, Ghana, India, Mexico, the Philippines,
Senegal, and Turkey. Rising SOE deficits, however
small compared to the government's overall budget
deficit, were at odds with this commitment.
Second, SOE reforms had low political costs. The
enterprises were being run relatively efficiently and,
in contrast with the situation in many other coun
tries, had not been used to generate jobs. Since over
staffing was not an issue, more efficient SOE manage
ment did not impose significant costs on workers.
Indeed, workers may not have suffered at all. State
sector employment as a percentage of total employ
ment in Korea actually rose from 1982 to 1990. The
average number of employees per SOE increased from
3,350 in 1983 to 3,420 in 1988; and SOE wages
grew, on average, at rates similar to those in the pri
vate sector, lagging only from 1982 to 1985. Thus,
Korea's unusual experience nonetheless illustrates
our paradigm: for reform to be politically desirable,
the political benefits must outweigh the political
costs. This was the case in Korea, even though both
costs and benefits were relatively low.
Ghana. From 1981 to 1983, the government of
Ghana pursued neither macroeconomic nor SOE re
forms. At that time, opponents of SOE reform were
in the government's support base. After 1983, moti
vated in part by severe economic crisis, the govern
ment began to change its base of support and Ghana
met Condition I. SOE reforms accelerated during this
period. Employment in the 42 largest state firms
dropped from 241,000 in 1984 to 83,000 in 1991
(see statistical appendix, table 5). However, toward
the end of the 1980s, they once again slowed, a de
velopment explained in greater detail in the discus
sion of Condition II.
By 1983, the policies that the government ini
tially pursued, such as extensive wage and price con
trols, had further worsened the performance of an
economy that had already experienced a decade-long
decline in income per capita. Drought, two coup at
tempts in 1982, and the return in 1983 of 1 million
Ghanaians expelled from Nigeria, provided further
impetus for a dramatic change in overall economic
policies: the government devalued the currency by
1,000 percent, introduced hospital fees, more than
doubled water and electricity fees, and eliminated
most of the 6,000 price controls (Herbst 1991).
The 1983 economic crisis in Ghana was, ar
guably, the worst in our sample, and the information
it provided the Rawlings government and its con
stituencies about the real costs and benefits of its
economic policies might by itself have been suffi-
THE POLITICS OF SOE
Clent to motivate the reversal in economic policy
that took place. However, there is also evidence that
the adjustment policies that the government
adopted were consistent with a changing political
base of support. The heaviest burden of these poli
cies fell on urban wage earners, including SOE em
ployees, who were among the early supporters of the
regime. The political impact on the regime was re
duced, however, because the government had a
growing military and rural base of support after
1983.26
The Philippines. There are a number of circum
stances that suggest that SOE reform could have been
politically desirable in the Philippines. The country
clearly experienced a regime shift with the popular re
volt that ousted Ferdinand Marcos and installed
Corazon Aquino as president in 1986. Moreover,
economic conditions had been rapidly deteriorating.
Per capita economic growth in the first half of the
1980s had been negative, inflation had been very
high (peaking at an annual rate of about 50 percent
in 1984), and the fiscal deficit continued to worsen,
hitting about 34 percent of expenditures in 1987. Fi
nally, because state-owned enterprises during the
Marcos years were instruments of "crony capital
ism" -dispensing favors in exchange for support of
the Marcos regime-SOE employees and managers
would have been unlikely supporters of the Aquino
government.
Consistent with this, the Aquino government
tried to move quickly to institute SOE reform. Soon
after taking office, President Aquino established an
interagency committee on privatization (cor) to
oversee the sales of state assets. 27 However, actual
progress was slow. By June 1990, the COP had rec
ommended the sale of about one-third of the coun
try's 300 SOEs, but only thirty-nine had actually been
offered for sale and thirty-two had been sold (Man
asan and Intal 1992). Moreover, as chapter 2 indi-
219
AUCRATS IN BUSINESS
cates, those state-owned enterprises that were not di
vested showed continuing poor performance
throughout the decade. As in Ghana, the slow pace
of reform in the Philippines is likely related to the in
ability of the Philippines to satisfy Condition II, po
litical feasibility, and also, again as in Ghana, to the
tendency of the government to use state-owned en
terprises that were not privatized to increase political
support.
India. India met none of the prerequisites for Con
dition I in the 1980s, so it is not suprising that little
SOE reform was accomplished. On the contrary, state
owned enterprises employed a fairly constant 8.5 per
cent of the work force through the 1980s, and the real wages of SOE workers actually rose during the pe
riod by approximately 25 percent. India did not exhibit a worsening of the deficit or inflation that would have made it more difficult for the govern
ment to continue subsidizing SOE inefficiencies. In
flation remained in single digits for most of the
decade, and the fiscal deficit (including the govern
ment capital account) did not diverge significantly
over the period from an average of 7.5 percent of
GOP. Economic growth varied little over the period,
as well; real per capita GOP growth never dropped
below 1.5 percent per year. In addition, there was no regime change or coali
tion shift that would have favored SOE reform-in
fact there was no party that had a dominant faction
in flVor of SOE reform. Ganguly and Ganguly (1982)
and Waterbury (1993) report that SOE workers were
important supporters of Congress-led governments,
which held a majority in the Lok Sabha from 1980
to 1989. Moreover, state control of the economy had
been a fundamental tenet of the Congress Party
nearly since its beginnings (Waterbury 1993). Be
cause Congress' control of the government was not
necessarily assured, particularly in the late 1980s, deviations from its SOE policy, which risked losing this
220
support base, were unlikely to have been pursued
(indeed, the number of seats held by the Congress
Party in the Lok Sabha temporarily dropped from
401 in 1985 to 197 after the 1989 elections). There
were, therefore, few indications that SOE reform was
considered politically desirable in India in the
1980s.28
Turkey. The military takeover of the Turkish gov
ernment in 1980 constituted a regime change that
brought to power a government interested in pursu
ing extensive economic liberalization. The architect
of the economic reforms that occurred under the mil
itary government, Turgut Chal, retained control of
economic policy when civilian government was rein
troduced in 1983. He led the Motherland Party
(ANAl') to victory in the presidential elections of that year. Although ANAP won again in the general elections of 1987, its support steadily declined (Onis and
Webb 1992). It came in third in the municipal elec
tions of 1989 and in 1991 lost control of the national
government to a coalition led by the True Path Party
(headed at the time by Suleyman Demirel), which
was also favorable to market-based economic policies
(EIU, 1993). Nonetheless, neither government pur
sued significant SOE reform, because SOE employees
and other SOE supporters were an important con
stituency for both. Like India and Egypt, Turkey did
not meet Condition I; that is, despite regime
changes; reform of SOE was not considered politically
desirable to the leadership, for two reasons.
First, state-owned enterprise employees and other
SOE supporters were an important constituency for
ANAP and the True Path parties. The Ozal govern
ment did pursue a series of broad economic reforms
and passed a law in 1986 that provided a framework
for privatization. 29 However, Onis and Webb ( 1992)
conclude that implementing the law could have
been politically undesirable, because the SOE sector
was part of the government's support base. There
was no economic crisis significant enough to push
the government to take actions that would have
alienated this important constituency in a highly
competitive political environment. Even when the
government deficit as a percentage of GDP rose from
4.2 percent in 1983 to 10 percent in 1984, the Ozal
government reduced it to 3.2 percent by 1986 with
out resorting to SOE reforms. Instead, as in Egypt,
measures to contain SOE expenditures were largely
limited to allowing real SOE wages to erode over the
period 1981-86. Further strong evidence of the im
portance of SOE employees to the ANAP support base
is that in the period leading to the 1989 and 1991 elections, real SOE wages more than doubled.
Second, various sources document that the mili
tary opposed SOE reform, although its power declined
in the 1980s (EIU 1993). These sources further note
that the military has long been regarded as the chief
conservator of the economic and social changes that
Kemal Attaturk precipitated. Among these was state
ownership of much of the industrial sector that began
in the 1930s and eventually extended to sectors such as textiles, metal industries, aircraft, electronics, ma
chine tools, and animal foodstuffs. Even today state
owned factories often display a plaque inscribed with
a quote from Attaturk: "Every factory is a castle to be
defended."30 Although the military backed the Ozal
government in other areas of economic reform, it was
more difficult for it to allow the reversal of decades
long policies regarding state-owned enterprises (EIU
1993).
Poland. The chapter text notes the difficulties that
governments in Poland have had in passing and im
plementing SOE reform. Some examples of these dif
ficulties are noted here. The government of Hanna Suchocka, which took office in May 1992, succeeded
in passing a law on mass privatization in June 1993,
gaining parliamentary approval for the first 195 firms to enter the program. However, this success was fleet-
THE POLITICS OF SOE
ing; her government fell in October 1993 and was re
placed by a coalition of parties in which opponents of
SOE reform were influential. An early demonstration
of their influence came in 1994, when the new prime
minister, Waldemar Pawlak, refused to approve the
participation of 100 firms in the mass privatization
scheme (EIU 1994-95). Only in 1995 did opposition
to the mass privatization of all400 firms fade. In con
trast, by 1993 the mass privatization program in the Czech Republic had transferred nearly 1,000 firms to
private ownership and slated 500 others for divesti
ture (Gelb and Singh 1994).
Assessing Condition II: Political Feasibility
The chapter presents detailed evidence on Chile,
Ghana, the Philippines, and the three transition
economies. This section of the appendix supple
ments the chapter with greater detail on the feasibil
ity of reform in two of the good reformers (Korea
and Mexico), one mixed (Egypt), all three of the less
successful reformers, and Poland.
Mexico. SOE reforms were politically feasible in
Mexico because reformers controlled the relevant
policymaking entities and had the means to over
come resistance. Although in each case the situation
was less clear cut than in Chile, Mexico at least par
tially met Condition II. The president's office had
nearly complete control of the formulation of SOE
(and other) policies (Kaufman, Bazdresch, and
Heredia 1994). Nevertheless, the opponents of re
form in the PRI still exercised influence. Moreover,
several state-owned enterprises targeted for reform
were strategic enterprises (telecommunications and
airlines), where worker resistance to reform could have been very costly.
The Salinas administration offset this potential
opposition with a mix of compensation and com
pulsion. In part to win over potential opponents
221
RATS IN BUSINESS
and to address the concerns of the PRJ reform oppo
nents, President Salinas established the National
Solidarity Program, PRONASOL. Funded with the
proceeds of privatization, the program provided
grassroots, project-related assistance, particularly to
poor areas where the opposition had gained ground
in the 1988 elections (Waterbury 1993).
The administration also used compulsion, in par
ticular by arresting key labor leaders on corruption
charges. Subsequently, as Cordon (1993b) con
cludes, the relative weights of compensation and
compulsion that the government used depended on
the ability of opponents to disrupt the reforms. For example, when privatizing TELMEX, the government
won support of the powerful telephone workers'
union by allotting TELMEX employees 4.4 percent of the firm's shares and permitting workers to pay for the shares from future dividends. In contrast, faced
with a strike at Aeromexico airline by employees try
ing to block privatization, the government declared
the company bankrupt, fired most of the workers,
then sold the company. Here, too, however, the gov
ernment offered compensation as necessary to keep
the airline running: pilots were not only permitted
to keep their jobs, they were offered discount shares
in the privatized airline (Cordon 1993b).
Republic of Korea. The Korean executive branch
controlled the policymaking entities in the country
during the period in which SOE reform was initiated
and carried out. Korea also had the capacity to min
imize SOE sector resistance to reform with some
combination of compensation and compulsion.
However, apart from performance contracts, which
rewarded managers for achieving various perfor
mance goals, neither compensation nor compulsion
were needed, because reform was not associated
with dramatic retrenchment and opposition to re
form was not significant. Korea, therefore, met Condition II because of the absence of opposition,
222
although it had the capacity to overcome resistance
to SOE reforms.
Egypt. Egypt did not meet Condition I in the
1980s (reform was not seen by the leadership as po
litically desirable); nevertheless, reform in Egypt did
seem at least partially feasible. Like most of the coun
tries in the sample, the Egyptian government con
trolled the policymaking entities in the country. As in
Mexico, the president in Egypt directs the dominant
political party, which has a large majority in the legis
lature. However, unlike more successful reformers,
who either confronted minimal resistance to reform or had the means to overcome it, a reform-oriented
regime in Egypt during the 1980s would have faced
strong resistance, making it difficult for the Egyptian government to have mounted the combination of
compensation and compulsion necessary to pursue reform successfully.
The potential for resistance to SOE reform was evi
dent from the share of SOE employment in total em
ployment in Egypt, which was several times higher
than in Mexico or Korea. And unlike in Chile, where
high SOE employment under Allende was a recent (and
short-lived) phenomenon, in Egypt this had been the
case for decades. Finally, overstaffing seems to be ex
tensive in Egyptian SOEs, suggesting that reforms
would require more painful adjustment than in the
successful reformers in our sample. Both indicators
the share of SOE employment in total employment and the level of overstaffing-suggest that resistance to SOE
reform in Egypt would have been greater than that ex
perienced in the successful reformers.
India. SOE reform does not appear to have been politically feasible in India in the 1980s, because of both
opposition in the legislature and the prospect of stiff
resistance to policy changes. Moreover, extensive
labor unrest suggests that the potential for costly resis
tance to SOE reform was high (Waterbury 1993). Through the 1980s, India experienced thirty times as
many workdays lost, and twenty times as many work
ers involved in job actions as Mexico, which has one
tenth of the population (ILO various years). This,
combined with the high degree of overstaffing in In
dian state-owned enterprises and the large absolute
number of SOE employees, suggests that, as with
Egypt, even if reform had been politically desirable it
probably would not have been feasible in the absence
of other social and economic changes.
Turkey. The ANAP government ofTurgut Chal did
not confront problems controlling Turkey's policy
making entities, since ANAP not only held a majority
in the legislature, but by 1990 Prime Minister Chal
could spend half of government revenues without
parliamentary approval. Moreover, prior to 1987, his
government benefited from strong rules that inhib
ited resistance to SOE reforms, such as one banning all
strikes (Onis and Webb 1992). Under the Ozal gov
ernment, therefore, Turkey seems to have met Con
dition II. Since, as is discussed below, Turkey partially
met Condition III, its failure to undertake SOE re
forms during the 1980s seems to be rooted in its in
ability to meet Condition I, political desirability.
The coalition that succeeded ANAP in power in
1991, led by the True Path Party, did not meet Con
dition II, however. This government (led first by
Prime Minister Demirel and later, after Demirel be
came president, by Tansu Ciller) had to contend
with the opposition to SOE reforms of its coalition
partner, the Social Democratic Populist Party, which
advocates greater state intervention in industry (EIU
1993). In addition, the costs of opposing SOE reform
have dropped since 1987, when restrictions on labor
activity were relaxed. Consequently, although
Turkey met Condition II under the Ozal govern
ment, reform was not politically feasible under the
True Path government.
Senegal. After the elections of 1983, when Presi
dent Diouf consolidated his power, until the 1988
THE POLITICS OF SOE
elections, he controlled the policymaking apparatus
in the country and confronted little resistance in the
form of riots, strikes, or demonstrations. However,
relatively little state-owned enterprise reform took
place, an outcome that is probably related to the dif
ficulties of developing a compensation package for
the large SOE sector in Senegal. Over the period from
1978 to 1991, SOE employment averaged 22 percent
of total formal sector employment in the country. It was this obstacle that prevented Senegal from more
than partially meeting Condition II prior to 1988.
In 1988, President Diouf's control over the poli
cymaking apparatus weakened, and resistance to re
forms dramatically increased; at this point, Senegal
could not meet Condition II. In the 1988 elections,
the chief opposition party, the Senegalese Democra
tic Party, drew 25 percent of the vote, up from 14
percent in the 1983 elections. This party that at
tracted votes from the proreform wing of the Social
ist Party, leaving the antireform wing of the party in a
stronger position with respect to President Diouf, the
party's leader. The president was therefore unable to
secure support for more rapid SOE reform.31 The po
tential for resistance outside political circles also in
creased. Ka and van de Walle (1994) report that a
wave of civil unrest swept the country beginning in
1987, when schools closed due to student protests. In
1988, SUTELEC, the union of electricity workers,
struck the energy parastatal, SENELEC, hospital work
ers struck for two days a week, and riots took place in
Dakar. SOE reforms came almost to a halt after 1988.
Poland. The chapter notes that the costs of com
pensating opponents of SOE reform are greater in
Poland than in the Czech Republic, principally be
cause SOE employees have greater rights to participate
in decisionmaking in SOEs. In the waning years of
Communist rule, workers and managers of Polish
state-owned enterprises enjoyed increasingly strong
property rights over the firms, as workers' councils
223
RATS I N BUS I N E S S
were granted greater authority. In 1981, Polish law
defined SOEs as autonomous, self-managed, and self
financing (Milor 1994). Enterprise managers have
therefore had the legal leverage to demand firm-by
firm reforms, which are incompatible with mass pri
vatization programs. This influence helps explain
why, by October 1993, 852 enterprises had been sold
to SOE managers and workers, while only 92 enter
prises had been sold in direct sales to buyers or
through public offerings (Gelb and Singh 1994).
Assessing Condition Ill: Credibility
The chapter text presents detailed evidence on the
credibility of reform for Chile, Ghana, the Philip
pines, India, the Czech Republic, and Poland. Here
we present the additional evidence for Korea, Mexico, Egypt, Senegal, Turkey, and China.
Republic of Korea. Korean SOE reforms did not re
quire the government to make promises to losers or
to investors, since there were few losers and privati
zation was not the chief SOE reform instrument.
Credibility issues were confined to government
promises to punish or reward SOE managers accord
ing ro the terms of their performance contracts. Two
characteristics probably helped to convince man
agers that the government was serious about im
proving SOE performance and therefore prepared to
follow through on these performance contract
promises. First, the government had a reputation for
fiscal discipline, which SOE mismanagement would
have undermined. Second, the government had
adopted an export led growth strategy, which SOE in
efficiencies would have handicapped.
Mexico. Mexico's SOE reform was at least partially
credible. Like Chile, Mexico relied heavily on the
reputation gained from comprehensive macroeco
nomic reforms, although these were not as thorough or systematic as in Chile. However, unlike Chile, in-
224
ternational restraints seem also to have contributed
significantly to the ability of Mexican governments to
commit credibly. Domestic restraints were limited to
occasional instances of share distribution to SOE em
ployees, particularly in the case of strategic industries
like TELMEX (discussed in this chapter under Condi
tion II).
Both the de la Madrid and Salinas governments
implemented a broad set of macroeconomic reforms
that improved the reputation of the country. These
included sharp changes in fiscal policy, from heavy
deficits to a balanced budget, trade liberalization, and
the lifting of many price controls. According to
Cordon (1993b), the Salinas government also im
proved its reputation by establishing regular channels
of communication with representatives of the private sector (Kaufman, Bazdresch, and Heredia 1994).
These channels provided the government with a way
to announce its future plans to the private sector and
to confirm when it had complied with its promises.
The measures taken by the Salinas government were
reflected in a relatively high average ICRG score over
the period, as well as the fact that Mexico's ICRG score
rose from twelve in 1986 to seventeen in 1989, when
the largest privatizations were undertaken.
International restraints were also important. Mex
ico's accession to more rigorous GATT requirements
in 1986 and the prospect of its accession to NAFTA
contributed to government credibility. These pro
vided vehicles for international actors to apply sanc
tions to Mexico if it reversed reforms that protected
the property rights of foreign investors.
Egypt. During the 1980s, the Egyptian govern
ment did not satisfY any of the three indicators of
credible reform. There were no significant, sus
tained economic reform initiatives that would have
improved Egypt's reputation and signaled the deter
mination or ability of the government to carry out
SOE reform. The modest reputation of the Egyptian
government during the 1980s is reflected in a low
ICRG score of twelve. Moreover, there were few do
mestic restraints since the president enjoyed consid
erable authority over the governing political party
and the various branches of government. Finally, al
though Egypt was a GATT signatory, it was bound
only to the less restrictive provisions reserved for
lower-income countries. Overall, then, Egypt did
not meet Condition III, although this situation may
be changing with the broader economic reforms in
troduced in the 1990s.
Senegal. Senegal has a mixed reputation for policy
reform, a modest degree of domestic restraint on
policy reversals, and the same lack of binding GATT
requirements as Ghana and Egypt. Senegal's macro
economic reforms have included such broad efforts
as improved fiscal discipline and currency devalua
tion, but occasional reversals have undermined the
benefits to its reputation that might otherwise have
been gained. Its reputation for not expropriating or
repudiating contracts, however, is higher than that of
the mixed-performing SOE countries, according to
the ICRG ratings.
The leadership appears to face few internal re
straints, given the dominance of the government and
the legislature by the Socialist Party. However, be
cause the party is not monolithic and the authority
of the president over the party is partial, the legisla
ture offered some restraint on policy reversal in the
1980s. Gain sharing has not been employed in SOE
reform attempts. Overall, therefore, Senegal demon
strates partial ability to meet Condition III.
Turkey. Turkey met Condition III at least partially.
On the one hand, in the 1980s, Turkey enacted the
series of macroeconomic reforms discussed earlier, it
had competitive elections after 1983 for which the
Polity II ratings on executive constraints assign it a score of five out of seven, and it took concrete steps
to enter the European Union. Its ICRG score of four-
THE POLITICS OF SOE
teen out of thirty for the period lies between that of
Egypt and those of more successful reformers. In the
late 1980s, Turkey continually reaffirmed commit
ments to the European Union to harmonize its trade
policies with those of the European Union by 1995
and took steps to that end. In fact, formalization of
Turkish entry into the customs union of the Euro
pean Union was initiated in 1994, despite Turkey's
conflict with Greece concerning Cyprus.
Turkey's credibility was not complete, however.
Although the Ozal government embarked on signif
icant fiscal, trade, and exchange rate reforms, these
were subject to occasional reversals: fiscal goals were
missed by a significant margin with the renewal of export subsidies and the reduction of revenues from
the value added tax in 1985-86; the country over
shot its inflation targets in 1984, when inflation
reached 48 percent instead of the targeted 10 percent
(Onis and Webb 1992). Nor were domestic re
straints complete: the prospect of elections was the
only significant constraint on the prime minister in
the 1980s. Before 1987, the prime minister had ex
tensive decree powers and substantial discretion over
the government budget. The activities of interest
groups, such as business and labor associations, were
restricted, and political activity by them was forbid
den so that there was little oversight of government
actions in the political arena. 32
Strategies to link the interests of reform losers to
the long-term success of reform were little developed
and sometimes failed. For example, in 1988, the
government privatized TELETAS, a maker of telecom
munications equipment, in one of the country's first
major attempts at privatization through widespread
share sales. Shares were sold in small lots through commercial bank branches; the offer was fully sub
scribed and began trading on the Istanbul stock exchange. Soon afterward, TELETAS' biggest customer, the state-owned telecoms company, sharply cut its
225
RATS I N B U S I N E S S
investment program-and, by implication, its pur
chases of TELETAS products. This news, combined
with a general decline in the stock market, caused
TELETAS' share values to fall by half (Kjellstrom
1990). To avoid a public outcry, the government
subsequently bought shares to raise the price, par
tially reversing privatization. This episode damaged
public confidence in the government's ability to fol
low through on gain sharing promises.
China. The foundations of China's credibility are
less compelling than those of the other two transition economies, relying mostly on the reputational effect of China's liberalization program, which has progressed steadily since 1978. In addition, like Korea, China is increasingly dependent on international trade. Exports as a percentage of GNP rose from 9.5 percent in 1985 to 19.3 percent in 1991. Consistent with a strategy of growth through trade, China is seeking entry into the WTO and has
226
changed its initial position on a number of issues
(intellectual property rights, for example) in an ef
fort to gain membership.
However, China has also confronted limits on its
credibility. There are few domestic restrictions on
the ability of Chinese authorities to reverse reforms.
The basic legal tenets of a market system, such as
corporate and contract laws, are only now being put
in place, and there is considerable uncertainty about
the applicability and enforceability of the laws that
do exist. Legal protections available to investors to
avoid contract repudiation or expropriation are unclear and seem to vary unpredictably. This may be one reason for the predominance of ethnic Chinese
among foreign investors in China, since, apart from language and cultural ties and geographic proximity, this group enjoys the informal ties that help to protect their property rights in an uncertain legal environment.
Notes
1. This framework for analyzing the conditions under which SOE reform takes place can be applied to most economic reforms. However, details of the analysis will differ from one reform to another. For example, political desirability is calculated in part by weighing constituency interests; the relevant constituencies, and the relevant decisionmakers, often differ from policy to policy. Accordingly, some countries in our sample, such as Ghana and Turkey, undertook significant macroeconomic reforms without substantially altering their SOE policies.
2. If nothing else, a crisis may alter the calculation of costs and benefits simply by changing the information available to decisionmakers about the relative costs of different policy options.
3. Leaders may also be reluctant to privatize when they suspect that political rivals will manipulate the privatization process to their advantage. Among the cases we study, the Philippines may provide one possible example of this (see the appendix to this chapter).
4. It can also depend on the cloudier issue of how central SOEs are to a government's ideology.
5. These political changes make reform more likely but do not assure it. Even when the regime shift is dramatic, as were the shifts to President Corazon Aquino in the Philippines and President Jerry Rawlings in Ghana, the new regime may be torn between the temptation to reform SOEs that exist primarily to satisfy the constituencies of the prior regime and to use SOEs to solidify their own political support (Ghana and the Philippines show evidence of doing both).
6. The Allende government's policies represented a sharp turn toward greater state intervention in the economy, a sharper turn than could be supported by the slight electoral plurality with which President Allende took office-36 percent of the total vote, compared with 35 percent for the candidate of the right and 28 percent for the left-center candidate (Cordon 1993). One possible indicator of the severity of the policy shift is that these and other policies triggered unprecedented strikes by white-
THE POLITICS OF SOE
collar workers (Cordon 1993). Ironically, the sudden shift to the left created room for more extensive privatization than might otherwise have been the case.
7. Between 1977 and 1982, real GNP declined by an annual average of 5.3 percent. By 1981, the budget deficit had risen to 9.3 percent of GDP (Ka and van de Walle 1994).
8. The current account deficit was cut from 17 percent of GDP in 1983-84 to less than 10 percent in 1988-89. Government expenditures were reduced from 32 percent of the GDP in fiscal 1981-82 to 21 percent in 1989-90 (Ka and van de Walle 1994). The average protection rate declined from 165 percent in 1985 to 98 percent in 1988.
9. Senegal received, on average, more foreign assistance as a percentage of GDP during the 1980s than Egypt but still made greater progress on reforms (limited though they might have been with respect to SOEs). Unlike Senegal, however, Egypt's aid was not conditioned on economic reforms, and Egypt did not experience a regime or coalition shift. Mexico, which did experience both crisis and political change, did not receive signficant amounts of aid relative to its GDP, and its SOE reforms were greater.
10. In 1980, Deng introduced mandatory retirement ages, which forced out large numbers of older officials. This movement was accelerated by retirements of officials who had not reached the statutory retirement age.
11. This is not an unambiguously bad outcome, however, as the discussion below on credibility suggests. Policy reforms produced by governments that require the assent of multiple entities with independently selected membership are more likely to be sustainable or credible than policy reforms that are instituted by a single individual.
12. The greater the inefficiencies that SOE policy incurs, the greater the net gains from reform. These net gains could, in principle, be used to make losers from SOE
227
.RP..TS IN BUSINESS
reform better off than they were before, raising the likelihood of successful reform. For a number of reasons, it is difficult to use these net gains to reduce opposition. For example, the gains are often realized in the future, after SOE reform losers have acquiesced to the reform. Consequently, reform losers would be required to depend on promises by the country's leadership. As the discussion of credibility in the next section suggests, these promises may not be credible. Other gains may not be available to compensate losers directly. For example, if a more efficient enterprise provides better service at lower prices, the economy and the firm's consumers benefit, but these gains are difficult to apportion to the losers.
13. These estimates may not necessarily mean that redundancy exists in all types of jobs. Usually, most overstaffing occurs in administrative and clerical positions, not in the more technically skilled jobs for which there is sufficient demand in the economy.
14. The numbers in this figure seem to be much higher than the entries for Chile in table 4.2, which were used to substantiate the claim that Chilean overstaffing might have been less than in other countries. However, table 4.2 referred to an average of all firms and the time periods are different between the table and the figure.
15. Strictly speaking, these enterprises were subject to "intervention," a Chilean legal concept in which the government takes over control of a company but not its ownership.
16. The government's policies of wide share distribution were also intended to make the privatizations difficult to reverse by subsequent governments. In this sense, wide share distribution also promoted the credibility of the SOE reforms, as we discuss later.
17. Prior to 1992, the Civic Democratic Party had only thirty-seven seats, only four more than the Movement for Democratic Slovakia, which was not a strong supporter of SOE reforms (EIU 1992; Europa World Yearbook 1994).
18. To the extent that this has occurred, the efficiency gains of divestiture may have been reduced.
228
19. If recipients of these shares subsequently sell them, and ownership becomes concentrated, this advantage is reduced.
20. Enforcement of these provisions is not perfect, since GATT and the European Union restrictions on subsidies are frequently violated. Nonetheless, such provisions raise the cost of maintaining or increasing subsidies to local industries, including SOEs.
21. Although we do not consider this dimension in detail, countries that are heavily dependent on external, particularly private, capital flows are also likely to be more credible, since policy reversals or setbacks can lead to dramatic changes in the direction of those flows.
22. We are only able to use International Country Risk Guide (ICRG) evaluations, for example, from 1985 onward. We do not expect that SOE reforms alone bias these evaluations upward, which would cause these ratings to reflect rather than to predict reform. However, the ratings do seem sensitive, as we would expect, to significant policy reforms across a broad spectrum. Mexico, for example, experienced an increase in its ICRG rating from twelve in 1986 to seventeen in 1989. Nevertheless, even with the reforms undertaken by Chile and Mexico, their ICRG scores were still significantly below Singapore's rating of over twenty-one over the period and Switzerland's top rating of thirty. This suggests that these evaluations are affected by more than sound policies.
23. Chile bound itself to strict GATT requirements as well. (Its own trade reforms in fact exceeded GATT requirements.)
24. Policy reversal was also a concern in Ghana, as later events were to verifY. Prior to the 1992 elections, government spending surged to create a fiscal deficit of 4.8 percent of GDP, compared with the surplus of 1.8 percent of GDP that prevailed in 1991.
25. The investor risk guide information is sometimes contemporaneous with reform in our sample, but it can be used as a predictor for all reforms after 1985.
26. Since President Rawlings came to power in a coup, there is no direct evidence dating from before the SOE re-
forms to describe his constituency. The section on feasibility describes government efforts to repress union and student leaders after 1983, however, which is consistent with the notion that he was less dependent on these groups for support. In addition, there is direct evidence for the strength of his rural support base from the 1992 elections, when he received nearly twice as many votes overall as his next closest rival, Albert Adu-Doahen, despite losing to him in most of the major urban-industrial areas of the country (Kwesi 1993; Dai!J Graphic 1992).
27. The SOE sector was never as large in the Philippines as in many of the other countries in the sample. Under President Marcos, the greatest rents seem to have been transferred through government authorized private monopolies. The Aquino government dismantled many of these: it lifted regulations, such as levies on coconut exports and prohibitions on new investment in coconut milling, that protected the coconut milling industry, which was controlled by President Marcos' supporters. It also abolished the Philippine Sugar Marketing Authority, which had the same effect in the sugar industry.
28. The political importance of SOE workers arises not because they constitute the major source of support for the Congress Party (which is in fact heavily rural), but because they are swing votes whose continued support is necessary to maintain the Congress Party in power.
THE POLITICS OF SOE .RE
29. Trade was significantly liberalized; for example, the goods on which import licenses were required dropped from 821 in 1983 to 33 in 1989. Tariffs were, in general, reduced (Orris and Webb 1992). A value added tax was introduced, and subsidies were moderated. These reforms followed other stabilization and liberalization measures that President Ozal had implemented when he formed a part of the military government.
30. William Willis, Australian Office of Employment, Education, and Training, speech at the World Bank, May 24, 1995.
31. It might also be argued that the 1988 elections triggered a coalition realignment in Senegal so that, after 1988, the country no longer fulfilled Condition I.
32. Since 1987, and particularly in the 1990s, restrictions on political activity have been relaxed, and electoral changes made coalition governments, which do not change policies easily, nearly inevitable (Esfahani 1994). These have increased the restraints on domestic policy reversal and increased the credibility of Turkish government decisions (although they have, as noted in the section on political feasibility, also increased the difficulty of securing SOE reform approval).
229

How to Spur Reforms and Improve Outcomes
I J4HIS REPORT HAS PRESENTED EVIDENCE THAT RE-
ducing the role of bureaucrats in business can bring a
country substantial economic gains. Yet, as we have
seen, reform has been slow and seldom successful. We
conclude by drawing on our findings and other
studies to suggest ways that the leaders and policy
makers in developing countries can foster more rapid and successful
SOE reform.
State-owned enterprise reform involves a multitude of choices, each
leading to a different set of problems and opportunities. The choices
made will inevitably vary from country to country, but to lead to the
optimum outcome, they must be made in a logical order. It might seem
obvious, for example, that countries will not reform until the leader
ship perceives reform as desirable. Yet, perhaps precisely because the
economic gains of reform are so impressive, well-intentioned outsiders,
including the World Bank, have sometimes attempted to prod devel
oping countries that are not ready for reform into acting. Similarly, de
veloping-country leaders and policymakers, persuaded of the benefits
of reforming state-owned enterprises, have sometimes attempted to do
so, only to choose an option that meets with failure. How can those
who rightly favor reform organize the multitude of choices they face in
a way that will increase the likelihood of success?
In thinking about the prerequisites of SOE reform, and the conditions
that are necessary for the success of various reform options, we have
found it useful to draw a decision tree (figure 5.1). At each juncture we
ask a question, the answer to which sends us to another juncture and
another question or to a recommended policy course. This chapter
traces the main branches of that decision tree, offering checklists that
231
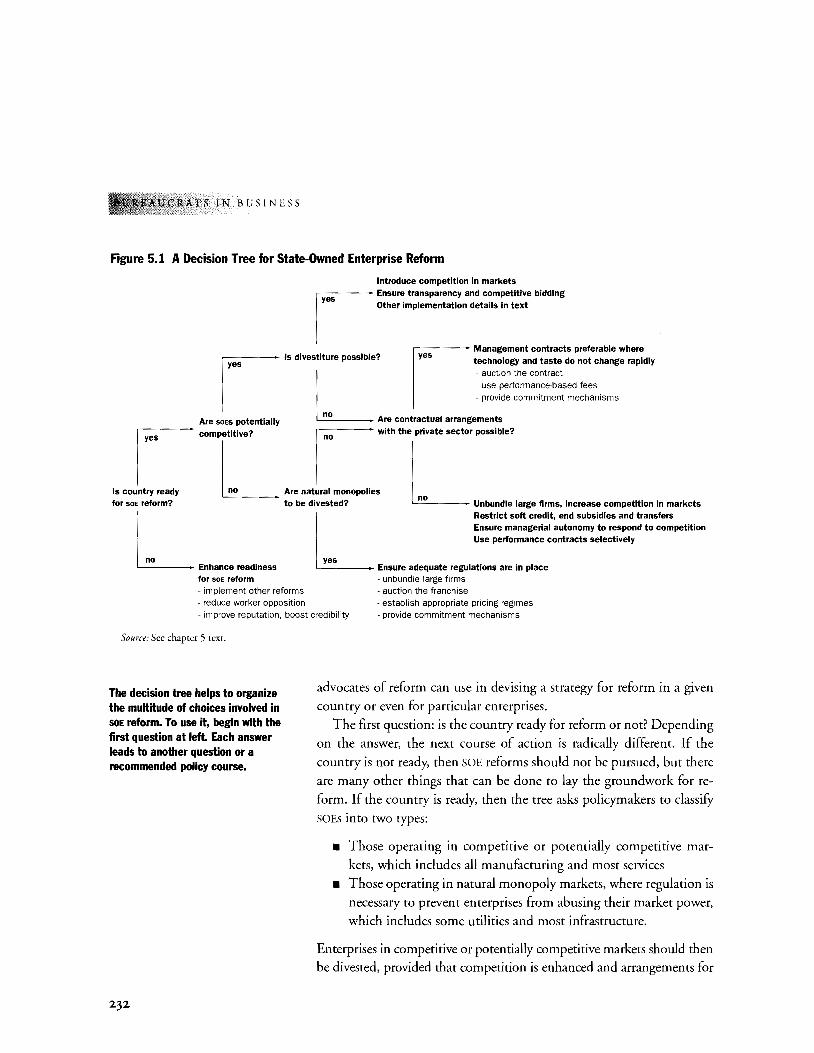
RATS IN BUSINESS
Figure 5.1 A Decision Tree for State-Owned Enterprise Reform
Introduce competition in markets rs---- Ensure transparency and competitive bidding I ...... ,, •• _,.,.,00 , ... , .. " ....
I Management contracts preferable where
lis divestiture possible? technology and taste do not change rapidly
L ~ auction the contract ~ use performance~based fees ~ provide commitment mechanisms
0 Are soEs potentially Are contractual arrangements
~ competitive? r with the private sector possible?
I . I ••
'' oOO""Y ""'' L Aro mrt•MI moo"'"''" L for SOE reform? to be divested? no Unbundle large firms, increase competition in markets
L L Restrict soft credit, end subsidies and transfers Ensure managerial autonomy to respond to competition Use performance contracts selectively
yes Enhance readiness Ensure adequate regulations are in place for soE reform
~implement other reforms ~ reduce worker opposition
~ unbundle large firms ~ auction the franchise
~improve reputation, boost credibility ~ establish appropriate pricing regimes ~ provide commitment mechanisms
Source: See chapter 5 text.
The decision tree helps to organize the multitude of choices involved in SOE reform. To use it, begin with the first question at left. Each answer leads to another question or a recommended policy course.
232
advocates of reform can use in devising a strategy for reform in a given
country or even for particular enterprises.
The first question: is the country ready for reform or not? Depending
on the answer, the next course of action is radically different. If the
country is not ready, then SOE reforms should not be pursued, but there
are many other things that can be done to lay the groundwork for re
form. If the country is ready, then the tree asks policymakers to classify
SOEs into two types:
• Those operating in competitive or potentially competitive mar
kets, which includes all manufacturing and most services
• Those operating in natural monopoly markets, where regulation is
necessary to prevent enterprises from abusing their market power,
which includes some utilities and most infrastructure.
Enterprises in competitive or potentially competitive markets should then be divested, provided that competition is enhanced and arrangements for
HOW TO SPUR REFORMS AND IMPROVE 0
the sale can be made transparent and open to the possibility of competi
tive bidding. Enterprises in natural monopoly markets can also be di
vested, provided again that the sale is transparent and open to competitive
bidding and that a credible regulatory structure can be put in place.
Even in countries where the leadership is committed to rapid and ex
tensive privatization, at least some SOEs in both types of markets are likely
to remain in public hands for a long time, for political if not for eco
nomic reasons. For enterprises that are not privatized, the next juncture
on the decision tree for policymakers to consider is whether contracts
with private management are possible and desirable. In general, we found
contracts with private managers to be very successful, but they are not ap
propriate for all types of enterprises, as we detail below. At the final branch of our decision tree, where neither privatization nor state owner
ship with private sector management is currently feasible, policymakers can move quickly to strengthen competition, harden SOE budget con
straints, and reform financial and institutional arrangements.
In the sections that follow, we provide more guidance on each branch
of our tree. First, we detail predictors of whether a country is ready to re
form or not and then map out actions for countries that are not ready.
To assist policymakers in reform-ready countries, we explore lessons of
experience in divestiture, in regulating private monopolies, and in re
forming SOEs that cannot be divested. This analysis has important im
plications for foreign assistance as well as for policymakers that are sum
marized in box 1 in the overview and discussed in detail in "Implications
for Foreign Assistance" at the end of the report.
How to Tell Whether a Country Is Ready to Reform
DETERMINING WHETHER A COUNTRY IS READY TO REFORM IS
not easy; many governments that promise reforms turn out to
be either unwilling or unable to deliver. Chapter 4 discussed in
detail the theoretical and empirical bases for three conditions of reform
readiness: reform must be politically desirable to leaders and their con
stituencies; reform must be politically feasible; and the government
must be able to promise credibly to stick to the reform in the future.
Drawing on that discussion, we present a brief checklist that helps to
distinguish whether or not a country is ready for reform. 1
233
IN BUSINESS
234
Political Desirability
Indications that reform has become politically desirable to the leaders
and their constituencies include:
• A change in regime or coalition. If the governing regime or coalition
changed, there may be a window of opportunity but only if the
new governing group does not depend so much on SOEs that its
survival would be threatened by reform. In assessing the extent to
which a government relies on SOEs, electoral results are especially
revealing. How much does the government owe its victory to
groups that would support (or at least not oppose) SOE reform
(such as the increasingly important urban commercial and middle
class in Mexico)? Early actions are another important indicator of
whether a new government sees SOE reform as desirable. A new
government that rewards supporters with SOE jobs or increases SOE
real wages across the board is likely to count on the support of
those who benefit from the status quo, while a government that sharply cuts SOE redundancies probably does not.
• A fiscal or economic crisis. Even governments that rely on SOEs for
support may still reform if a severe crisis makes the status quo unaf
fordable. Crisis may change the preferences of a government's con
stituency or persuade a government to build a new constituency that
favors reform (as in Ghana or Mexico). How serious does a crisis
need to be for change to become desirable? This unavoidably entails
subjective judgment; based on past experience, a significant devia
tion from past trends or sudden worsening of a bad situation (as
when Mexico's fiscal deficit doubled to 15 percent of GDP) can per
suade a government to take action that may injure some of its own
supporters. In some instances, however, even a very severe crisis will
not prompt reform: failure to reduce SOE deficits decisively during a
fiscal crisis is a strong sign that a country is not ready for SOE reform.
Political Feasibility
Indications that reform is politically feasible include:
• Control of the policymaking process. Do the reformers control the legislature, the bureaucracy, the state and local governments, and
HOW TO SPUR REFORMS AND IMPROVE 0
other relevant bodies that must approve SOE reforms? If the re
formers must form coalitions to control these policymaking bod
ies, who are the constituents of their coalition partners and what is
their view of SOE reforms? At varying times partners in intra- or in
terparty coalitions resisted reform efforts in Mexico, Turkey, Sene
gal, India and elsewhere.
• Ability to overcome resistance to reform. Even a reform-minded group
in complete control of the formal power apparatus may not be able
to change policies if informal, ad hoc resistance, often from SOE
workers, is sufficiently strong. Thus, another important signal that
reforms are feasible is the government's ability to withstand such re
sistance. Ideally, governments use compensation (by distributing
shares to the public or to workers in powerful unions). However,
some governments have resorted to compulsion (by limiting
strikes, preventing riots, and curbing union powers), sometimes in
curring high social costs in the process. No government that re
formed successfully used only compulsion, however. For example,
Mexico's reformers used compensation, assisting rural communi
ties with funds generated from privatization and distributing shares
to TELMEX employees; they also used compulsion, firing striking
employees at Aeromexico and then selling the airline. Because SOE
employees often stand to lose the most and are therefore the most
outspoken opponents of reform, reform advocates can assess the
potential magnitude of opposition by estimating the extent of SOE
overstaffing. Whether or not a country has a history of strikes and
demonstrations in opposition to economic policy changes provides
another clue to the likely strength of opposition, as does the extent
to which the military owns SOEs and serves on their boards.
Government Credibility
Signs that the government can credibly commit to upholding its
promises in the future include the following:
• Reputation. The ICRG evaluations we reviewed in chapter 4 are one
indicator of whether a government is considered a credible re
former. Another is whether a government with a weak reputation
is in the process of strengthening its credibility by announcing and
then implementing broad economic reforms. Fiscal and trade re-
235
"trCRATS IN BUSINESS
236
forms are particularly useful indicators, since these are difficult re
forms closely watched by investors. But over-reliance on macro
economic policy reforms in judging readiness for SOE reforms can
be misleading since the political desirability and feasibility of
macroeconomic reforms differ from those for SOE reforms, and
countries often do one set of reforms without the other.
• Domestic restraints. Government reform efforts are more credible
when there are domestic constraints that raise the cost of reversing
the reforms once they are put in place. Does the country have legal
restraints, such as a constitutional provision protecting private
property? Or institutional curbs on arbitrary action, such as a
strong legal system or legislature that can prevent sudden policy reversals by the executive? Has the government created new con
stituencies that would favor sustained reform, for example,
through wide distribution of shares in privatized SOEs? Legal and
institutional restraints must be judged carefully, however: on the one hand, they protect reforms already in place; on the other, they may make it difficult to achieve the consensus necessary to get re
forms under way. For example, in both Chile (since 1990) and the
Philippines, the executive's power is sharply circumscribed by the
legislature. In Chile this has helped to safeguard reforms and reas
sure investors; in the Philippines legislative opposition has slowed
enactment of reform.
• International restraints. Is the country adhering to the strictest pro
visions of GATT, or aspiring to join NAFTA, the European Union, or
other agreements that provide an incentive for reform and make it
more difficult to reverse reforms once they are in place? Loan
covenants with donor governments or multilateral institutions
and contracts with multinational firms may also help shore up a
government's credibility. International restraints are generally the
least compelling of the three signals of credibility; how strong a
signal they provide depends on how costly it would be for the gov
ernment to renege on its international obligation.
Countries that meet all three conditions-that is, countries where re
form may be considered politically desirable, feasible, and credible-are
ready to reform. Countries that fail to meet any one of the conditions are
not. Returning to our decision tree, we consider first how reform advocates could respond in countries that are not ready to reform.
HOW TO SPUR REFORMS AND IMPROVE
What to Do in Countries Not Ready for SOE Refonn
FAILED REFORM ATTEMPTS CAN BE VERY COSTLY IN TERMS OF
financial, human, and political capital. Money spent to restruc
ture SOEs and pay off their bad debts is wasted if the enterprises
fail to improve their performance or, having been privatized, collapse
back into the government's arms. More difficult to quantify, but no
less important, are the costs in wasted human and political capital.
Policymakers who spend months or years designing SOE reform programs when the prerequisites for success are lacking could devote their
scarce skills to other issues where success is more likely. Similarly, de
veloping-country leaders and donors that push SOE reforms with a
very scant or nonexistent chance of success draw down their political capital without achieving any significant returns.
Are we suggesting that nothing can be done in countries not yet
ready to reform their SOEs? Certainly not. Rather, policymakers in these
countries can begin laying the groundwork for future SOE reform. Steps
include macroeconomic reforms, which help create a constituency for
SOE reform, thereby making SOE reform more politically desirable; poli
cies to reduce the opposition to reform by SOE workers and others de
pendent on the SOE sector, thereby making SOE reform more politically
feasible; and improving the government's reputation, particularly with
domestic and foreign investors and other potential supporters of re
form, thereby enhancing credibility. We discuss each of these steps
below. Box 5.1 contains two action checklists-one for countries not
ready to reform SOEs and one for those that are ready for reform.
Make SOE Reform More Desirable by Implementing Reforms in Other Areas
In countries that are not ready for SOE reform, policymakers could
nonetheless pursue other economic reforms, particularly trade, fiscal
and monetary, and other market-oriented reforms, and take limited
steps to develop the financial sector. These reforms are not only valu
able in their own right, over time they also generate pressures to reduce SOE inefficiencies as discussed below, thus making reform more
politically desirable. Different reforms have different constituencies,
which explains why countries such as China, Ghana, or Turkey were
237
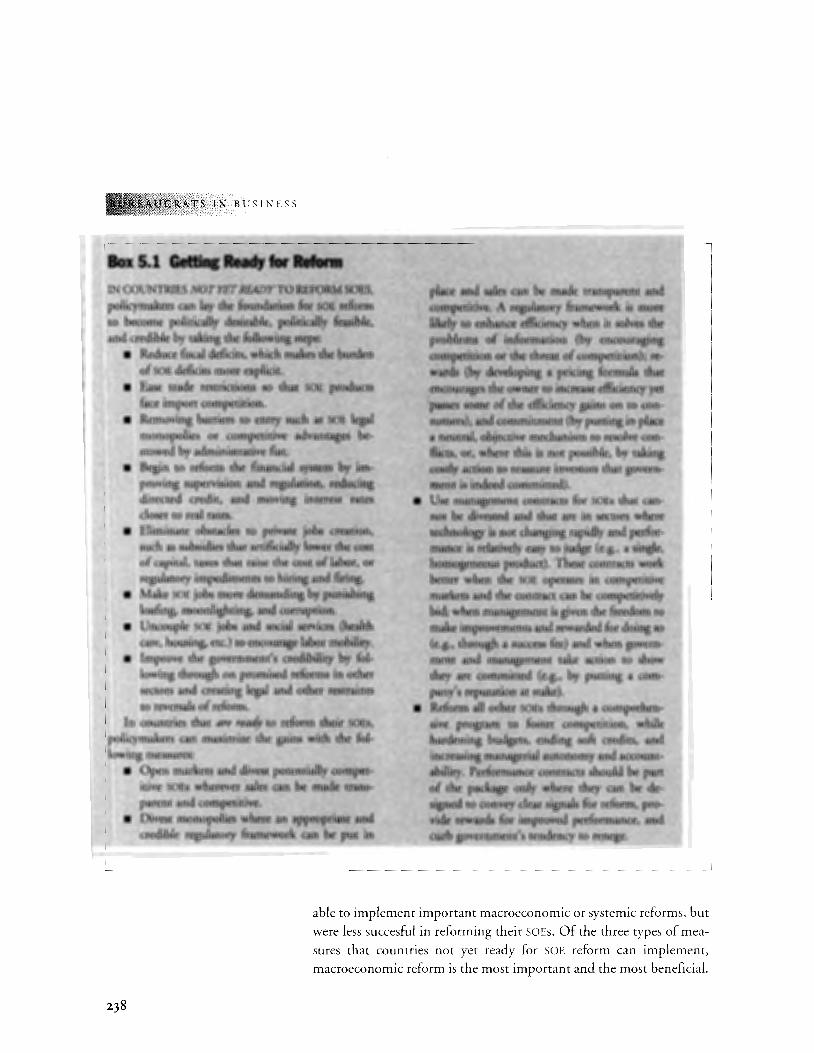
IN BUSINESS
238
---------- --~-~-----------~-- _ ____j
able to implement important macroeconomic or systemic reforms, but
were less succesful in reforming their SOEs. Of the three types of mea~
sures that countries not yet ready for SOE reform can implement,
macroeconomic reform is the most important and the most beneficial.
HOW TO SPCR RLJCORMS AND IMPROVE 0
Indeed, properly implemented, such reform programs not only en
hance the political desirability of future SOE reforms, they also help to
improve political feasibility and credibility. Steps that governments
can take as part of an overall reform program that have particular rel
evance to SOE reform include:
• Reducing fiscal deficits. Fiscal and monetary reforms that bring
revenues and expenditures into line also increase pressure for SOE
reform by making the burden of SOE deficits explicit, thus fuel
ing demands that they be reduced or eliminated. Such reforms
could have priority.
• Easing trade restrictions. Liberalized trade restrictions give ex
porters a stronger position in the economy. Exporters can then
become an important constituency for SOE reform, demanding
more efficient provision of goods and services that suEs supply.
• Removing barriers to entry. Removing barriers to entry increases
the number of voices calling for SOE reform. New entrants who
must rely on SOE goods and services, pay taxes to support SOE
operations, or compete with subsidized SOE products help en
large the constituency for reform.
• Initiatingfinancitll sector reform. Governments that are not ready
to reform SOEs may still be prepared to develop their financial
system. The first steps toward financial sector reform in these
countries could be to improve supervisory and regulatory capac
ity, to reduce directed credit and direct government control over
financial intermediaries, and to move interest rates closer to real
positive rates. This makes subsidies to SOEs more explicit and
helps reduce the risk that efforts to curb fiscal deficits will spread
the problem to the banking system. Privatization of banks and
further liberalization is risky before regulatory and SOF. reforms
are well underway, however. Where both are not present, the bad
debts of an unreformed SOE sector and the lack of appropriate
supervisory and regulatory reforms can lead to a crisis in the fi
nancial system, as happened in Chile in the early 1980s.
Make SOE Reform Feasible by Reducing Employee Opposition
Workers and managers in SOEs stand to lose the most from reform,
through layoffs or wage cuts, and are therefore frequently the most
239
TS IN BUSINESS
240
vocal and best organized opponents of reform. Even when inflation has
eroded SOE wages, as it has in many countries in recent years, many SOE
employees cling fiercely to their jobs. This is because they lack alterna
tive employment or because the effort demanded in their SOE jobs is
low, and the opportunities for moonlighting or corruption offset the
low wages. In transition economies and some developing countries,
SOE workers have a further incentive to cling to their jobs, since bene
fits ranging from housing to recreational opportunities are obtained
through the workplace. Governments that are not yet ready to reform
SOEs can take several steps to lessen this potential opposition, thereby
improving the political feasibility of future SOE reforms. They can:
• Eliminate obstacles to private job creation. The growth of private employment is not only one of the main benefits of an overall reform
program, it can also create alternatives for redundant SOE employees who might otherwise oppose SOE reform. Government obstacles to
private job creation include policies that artificially lower the cost of
capital, such as interest rate subsidies, because they encourage employers to substitute capital for labor, and government impediments
to hiring and firing, such as complex regulations and outright bans
on layoffs. These have been shown to inhibit private job growth
(Banerji and Sabot 1994). Finally, taxes that raise the cost oflabor,
such as payroll taxes, can be replaced with other taxes that do not dis
courage job creation. This, too, could be a priority area for action.
• Uncouple SOE jobs and social services. SOE workers who receive a
wide array of goods and social services through their jobs are espe
cially fearful of relinquishing them. In most transition economies,
for example, state firms have long provided housing, health care,
transport, educational assistance, and other benefits not otherwise
available. By creating public alternatives to some enterprise bene
fits, such as health care, bus transport, and education and private
alternatives in housing and recreation, governments can begin to
uncouple these services from the job. This will give SOE workers
greater mobility and reduce their resistance to reforms that may
force them to look for work in the private sector.
Improve Reputation and Create Restraints to Boost Credibility
Successful implementation of the reforms described above would go a long way to establish the credibility of any future SOE reform effort
HOW TO SPUR REFORMS AND IMPROVE
with investors and others whose support is necessary. Leaders and
policymakers in developing countries can enhance this effect by an
nouncing reform programs in advance and scrupulously adhering to
their announced plans. In addition, they can establish domestic re
straints, such as constitutional provisions guaranteeing the right to
property, to reassure investors that the government will honor its com
mitments and not expropriate their investments, either directly or
through confiscatory regulation. Finally, developing-country governments can enter into trade treaties or multilateral agreements that would
raise the cost of reversing future SOE reforms.
For countries not yet ready for SOE reform, these three types of mea
sures constitute a full agenda. Countries that implement it will find
themselves on the opposite branch of the decision tree, among the countries that are ready to reform their SOEs.
What to Do in Countries Ready for SOE Reform
HAVING DETERMINED THAT THEIR COUNTRY IS READY FOR
SOE reform, how should policymakers proceed? Our findings
about the conditions under which SOE reform succeeds suggest
that they could next classify SOEs into those in competitive or potentially
competitive markets, on the one hand, and those in natural monopoly
markets, on the other. Enterprises in competitive or potentially compet
itive markets can be divested, provided that competition is enhanced
and arrangements for the sale can be made transparent and competitive
or at least open to the possibility of competitive bidding. Some enter
prises in natural monopoly markets can also be divested, provided that
the sale is transparent and open to competitive bidding and that a cred
ible regulatory structure can be put in place. (These two outcomes cor
respond to the two outermost branches of our decision tree.) Decisions
about which firms belong in which category, and whether or not di
vestiture is possible, vary by country; they may shift over time, as a
country's capacity to divest and regulate improves and as technology increases the potential for competition in sectors once seen as natural mo
nopolies-a trend recently evident in telecoms and electrical power gen
eration. In the remainder of this chapter, we first discuss key questions
that policymakers face in deciding when and how to divest. We con-
241
ATS IN BUSINESS
242
dude with advice on what to do with SOEs that remain in government
hands.
The potential benefits of divestiture can be lost if the sale is not prop
erly managed. In this section, we first discuss issues that apply to privati
zation of firms in competitive and noncompetitive markets, examining
some of the potential pitfalls of privatization. We then turn to issues that
arise primarily when privatizing monopolies; in particular, the need for
a credible regulatory structure. We conclude with a discussion of firms
that cannot be divested.
How to Divest where Markets Can Be Made Competitive
This report has shown that many SOEs operate in potentially com
petitive markets but are protected from competition by legal barri
ers, government subsidies, and privileges. Governments can sell off
such enterprises with minimal regulation if they introduce competi
tion by liberalizing trade and price restrictions and by removing bar
riers to entry. Cutting off access to subsidies, privileges, and soft
credit is crucial to making privatization a true economic change and
not just a transfer of tide. In some cases, ensuring future competi
tion will also require that governments break up large monopolies
prior to sale and split potentially competitive activities, such as cel
lular phones or telephone equipment, from natural monopolies, like
local telephone service.
For all types of divestiture, competitive bidding of some form is
preferable to a negotiated sale. Competitive bidding not only improves
the government's selling price, it also creates pressures for a more trans
parent process, because competing investors insist on clear rules. The
precise form of competitive bidding will depend on the size of the firm.
For firms that are very small, open auctions, such as those held in the
Czech Republic and Estonia, offer a rapid, simple, and transparent way
to divest. For medium and large firms, where potential buyers invest
time and resources to determine the firm's value, sealed competitive
bids, opened publicly, may be more appropriate, provided that proce
dures can be put in place to ensure secrecy and fair dealing.
Privatizations can be administratively challenging, and it may be hard
to assure transparency in countries with weak legal and bureaucratic in
stitutions. Such problems are compounded if the country is not politi
cally ready to reform. If transparency and competition in the product
!!0\V TO SPLIR RL!-ORI\IS AND IMPROVE
market or appropriate regulation of monopolies cannot be assured, then
privatization must await market, institutional, and legal reforms; other
wise the cost to the economy could be high (box 5.2).
Privatization also needs to be harmonized with financial sector re
form. The allocation of credit according to commercial criteria rather
than by administrative fiat demands greater autonomy and competition
in the banking system. Financial liberalization is extremely risky, how
ever, unless sound regulation and supervision are in place. Another risk
to guard against is that privatization does not result in unhealthy ties be
tween banks and the businesses they finance. For example, in the first
wave of privatization in Chile in the 1970s, policymakers did not suffi
ciently scrutinize the buyers of enterprises and their sources of finance or
regulate the financial system closely enough (see box 2.1 0). Some of
these buyers purchased banks and used the banks as collateral to pur
chase other firms in highly leveraged sales. This led to a concentration of
ownership, overindebtedness, insider lending, and, during the economic
crisis of the early 1980s, the return of some fifty divested banks and their
firms to the government.
Assuming that these minimum conditions are in place for divestiture
to go ahead, policymakers will still face many questions that have differ
ent answers depending on country conditions and, in some instances,
on the size and condition of the enterprise being sold. We discuss nine
of these questions below, not to impose one-size-fits-all answers, but to
raise issues that policymakers will need to consider when planning their
strategy. 2
• Is it better to begin with small ente1prises, or with big enterprises, or to
sell SOFs in some sectors before others? The size of the firm and the
nature of the market (potentially competitive versus noncompeti
tive) are more important than the sector per se in deciding about
sequencing. Selling big firms first produces bigger welfare gains:
the bigger the firm, the bigger the benefits. In addition, the divesti
ture of a large enterprise, such as ENTEL in Argentina, signals the se
riousness of the reform effort. The proceeds may also help a coun
try weather a debt crisis. Finally, where large firms are privatized in
part via wide share distribution, policy reversal becomes costly, thus
signaling commitment to reforms. This strategy may be particu
larly useful where the capacity to handle privatization is high, but
the commitment to reform is uncertain. Argentina, for example,
243
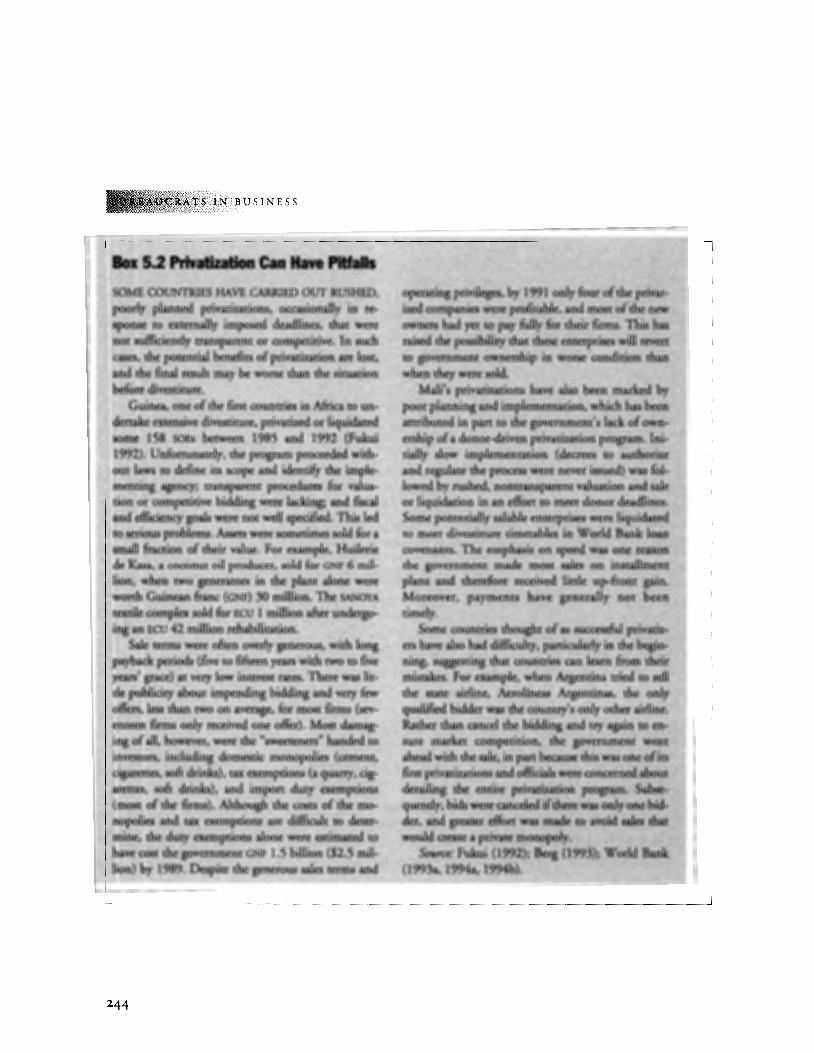
TS IN BUSINESS
Bu 5.2 Privatization Can Haye Pitfalls ~ .
~. SOMlHXJUN'flU~ HAVE CAR.RlEDOUT.lllJS!jED, p~rlr plan~· privatiJ.atiotJs; o«asiofiany in teo
·• :Sp(>t1Se. to c:xtemallyitnposed .Jl:adlines~ that were ·. no.t s.uffi£ient1y tta.nsp;;u:entor CO!llpdit~ve~ In sudt. ~es.; the pownrial benefits. of ptiwtizatjon are lost. and the· final tesult. may be worse. than .rJte situittion beftite JivestitUie. ··
Guinea,· on~ of the first coUtJtties in Afriea ro un~ d~ ·ext:ensive.div®rure. privatized or liquiilated son:xe 158 so&. between 1985 and l99l(Fukili t992).UnfottUnarely, the programprnc~eded with-
. ou~ lawg to define it8. scope and identify the imple..llle!lring ~tl.ey; ~ trnnsp!lfent ptoq<lutes fo.r. valuation, or ~mpetitive bidding .were la~ and fiscal
·. and eftleiency goals were not well specified. This led •• to serlops prO[,lefll$. Assets were sometimes sold for a ama1I &action oftheir.val~ .. For.~ample,Huilerie de .~J<a.Sa. a coconut oil. producet~ sold fctr GNF 6 mil-
. )ictn, when two generators in the plant alone 'Wete wo.tth Guinean franc (GNF) 30 million. The SANOYA
t¢tile<(:j)mplex sold for E(:u l . lllillionmer un.dergoingan EC\J 42 hilllion rehabilitation.~
Sale tenru were .often o\terly gener~us, With long payback perio& (five to fifteen years with tWo· to five years' grace) at very low interest rates~ There was lit.: de.publiciry aboq.t impenrung bidding andv.ery few ot.f¢rs. less than two on average, for nxost fums (sev.en~n firms only received on.e offer). Most damagittS of alt, however, were the "sweerenets." haiJ~d to inv~ot8? indudin~. JomeSt:ic monopolies. (cement, ci~ttes. Soft drinks), trot ~emptiot1S ·(a qtiarry,cig.are~es, sofl: dri~), and iJnpnrt dury ~emp#ons (m?st 9ft~¢ flt:ms). Al$ough 'the. ~ts ofthe monopQlies ·and • exemptions at:¢ dlffit:ul~ to ~te~
• Jl'l!ne1 the .du~.~ptiot1S alone w~e ~~!ltied. to .· haVe cOst: tfie government <;NF .1.5 bj!lion. ($2S mil~. ~4YnJ by f989. Despite the generous sales terms and
244
tSJ(iltt:~ lowedbt~Winontnt.nsp~tJ~+~l!~ti~~d~${ ·
~-··'~ plans, and therefru:e te<:~iV'etliittle 'ttWfro~t gai~;</ ·
&!t&i~; the . state airUne; Aeroftneas Argentinas, the onlY qualified biddet". the eou":tl'y's oidy t>th¢r: ai4i~e. ' ·.
:t~.,-~, '·· kil'$1: ptivatlz;t~j)S~
i&il~3~~ (199.3a 1994t 1994b); ; · · · · ····· · · ··· · ~ · · · · · __ , c >?-- "' J, ( -, ,','
HOW TO SPUR REFORMS AND IMPROVE OU
began its privatization program in the early 1990s with the airline
and the phone company; having thus raised needed funds, retired
debt, and shown its commitment to reform, it later moved on to
smaller enterprises (and other large firms). Mexico, on the other
hand, had success starting small and learning before selling big firms
and used wide share distributions in only a few cases. Since either
method seems to work, the choice could depend on whether poli
cymakers feel a stronger need to demonstrate commitment and raise capital or to improve their technical ability to handle divestiture.
• Should government make new investments to expand or improve the en
terprise before selling it? No. New investments prior to privatization are seldom recovered in the purchase price because bureaucrats' ideas
of appropriate investment often differ from the ideas of potential
buyers. Public investments also send mixed signals about whether the government actually intends to proceed with divestiture.
• Should the government financially restructure firms before selling
them? Judging from experience, governments need to be prepared
to write down some of the typically large SOE debt burden. For ex
ample, the governments of Argentina and Venezuela assumed
debts of $930 million and $471 million, respectively, prior to sale
of their telephone companies. Since it is politically unpalatable to
divest an enterprise by paying the buyer to take it over, assumption
of debt may be the only feasible way to unload a company whose
debt exceeds the sales value of its assets.
• Should the government lay off workers before selling an enterprise?
Countries as diverse as Argentina, Japan, Mexico, New Zealand,
Tunisia, and the United Kingdom have terminated state enterprise
employees prior to privatizations. Sometimes governments must
do so if an enterprise is to be sold, since investors shy away from
highly visible labor disputes. Moreover, governments are usually
better able than private investors to alleviate adverse social conse
quences and thus defuse worker opposition. As we saw in chapter
4, successful privatizers developed programs to inform and involve
the work force, to compensate laid off workers, and to encourage
worker share ownership in larger sales. In countries that did not
prepare workers for massive redundancies, worker opposition was
vocal and, in some cases, slowed or halted privatization.
• How can the social costs oflayoffi be reduced? Severance pay can play an important role in reducing risks faced by workers. In designing
245
TS fN BUSINESS
246
severance packages, governments often make the mistake of over
paying some workers to leave and of!osing many of the best work
ers. It would be better to tailor severance packages to the charac
teristics of different workers, so that no one gets a windfall and
able workers who are willing to work hard choose to remain.3 Re
training, job search assistance, and business start-up allowances are
generally not relevant to most developing economies, which lack
the necessary preconditions of high administrative capabilities and
growing labor demand.
• Should a company be sold through public offirings or via bids to a
consortium of investors? Public offerings are politically appealing,
since they result in broader share distribution and reduce criticism
that the sale was rigged or that the government is transferring as
sets to a tiny, wealthy elite. Despite these advantages, direct sales
accounted for the vast majority of privatizations in developing
countries from 1988 to 1993-58 percent by value and 80 per
cent by the number of transactions (Sader 1994). Direct sales are
attractive to developing countries for several reasons. For small to
medium firms, direct sale may be simpler and less costly than a
public offering. Developing countries tend to reserve public listing
for their larger privatizations: the average value of SOEs sold by
public offer during 1988-93 was $132 million, more than four
times the average value of SOEs sold directly. Direct sale may also
be more appropriate for troubled large firms that could benefit
from a strong owner and would be an inappropriate risk for gov
ernment to offer on a fledgling stock market. Direct sale is virtu
ally the only technique used in Sub-Saharan Africa, a reflection,
perhaps, of the low value of assets, the underdevelopment of local
capital markets, and the widespread use of privatization by liqui
dating the firm and selling the assets (Sader 1994). In contrast,
transition economies, with their need to privatize many large
firms, their concerns about equity, and their desire to develop their
financial systems, tend to favor public offerings.
• How much foreign participation should be allowed? Foreign partic
ipation has much to recommend it. Benefits include new capital
for investment, access to overseas markets, and infusions of man
agerial and technological knowledge. Moreover, foreign partici
pation can foster more competitive bidding, raising the sales
price. For some large enterprises in countries with a small private
H 0 W T 0 S P C R R E F 0 R M S AN 0 I M P R 0 V E 0 U T C~~,
capital base, privatization may not be possible without foreign
funds. These factors may explain why, despite lingering national
istic objections in many countries, foreign investment accounted
for one-third of the value of privatizations in developing coun
tries from 1988 to 1993 and for almost 40 percent of the pro
ceeds from sales in telecommunications and energy (Sader 1994).
Where opposition is strong and an enterprise is large, govern
ments can sometimes overcome objections by distributing some
of the shares widely but selling a minority with management con
trol to foreign investors. In some instances, of course, the politi
cal opposition to foreign investment may be so strong that it out
weighs the benefits.
• Should governments accept debt or only cash in exchange for public assets? When privatizing, cash is always preferable to debt, since cash
reduces the risk to government and prevents the new owners from
using their debt to government to exact protection or special priv
ileges. Nevertheless, many governments find themselves with no
choice but to accept a buyer's IOU as part of the financing, because
the asset being sold is so risky or the capital market so underdevel
oped that potential buyers could not otherwise raise the funds.
Policymakers can get out of this dilemma in one of two ways. One
way is to sell a firm in tranches (passing management control im
mediately to private, minority shareholders and allowing them
time to raise the funds to buy out the government gradually); or
the government can enter into a government-private joint venture
(private buyers make an equity investment in the enterprise and
become the managing partners). The welfare gains from selling
minority shares that give private investors management control
can be high. Research on two privatized enterprises in Malaysia
found that even small private minority shares can yield large eco
nomic gains if the private owner has management control (Galal
and others 1994).
• How should the proceeds from the sale be used? Privatization proceeds
are an exchange of a future income stream for cash; they can be
used to retire any obligation that depends on that future income
but not to start public projects that will run out of funds once the
proceeds are spent. For example, Mexico used some of the pro
ceeds to retire some of its foreign debt. Reducing debt not only in
creases credibility, it also reduces the fiscal deficit by the amount of
247
SIN BUSINESS
248
the debt service. Another important use is to compensate the
losers from reform, for example, by funding severance pay or the
distribution of shares to employees and others.
Divest Monopolies Where a Credible Regulatory Framework Can Be Put in Place
Selling monopolies can produce major welfare gains, especially
through new investment, as long as the sale is competitive and transpar
ent and a credible regulatory framework can be devised and imple
mented (Galal and others 1994; Levy and Spiller forthcoming). For example, the divestiture of Chilean telecoms brought estimated welfare gains of $1.3 billion (net present value in 1988 dollars; see Galal and others 1994), largely because of massive investments by the new owners. As a result of this investment, in the first five years after the sale, the an
nual growth in the total number of lines and the number of phones per 100 people more than quadrupled to 29 percent a year and 13 percent a year, respectively.
To achieve these gains, policymakers and regulators need to design a
regulatory contract that improves regulators' information about the firm's costs, induces the firm to operate efficiently while allowing it to make a fair rate of return on its investments, and protects the owners
against opportunistic government behavior in the future. In an ideal world, these would be achieved by perfect competition to eliminate the
information advantage of the firm; rewards (primarily pricing) designed
perfectly to motivate the firm to invest and operate optimally; and government commitment fully assured by anticipating all contingencies
and figuring out mechanisms to resolve conflicts. In reality, of course,
no contract is perfect. Policymakers must therefore be prepared to assess the tradeoffs between the compromises necessary to put a regulatory
contract in place and the advantages that can be gained by pushing ahead with divestiture. Such cost-benefit analysis is an uncertain busi
ness, especially since it is only useful when it is done before either the
costs or benefits are entirely clear. Even so, it remains the best way we have to think systematically about these tradeoffs. A form of cost-bene
fit analysis has been devised to assess the welfare effects of privatization
after the fact, and work is under way in the World Bank to turn that into a predictive tool. Taking the possibility for compromises into account, policymakers who conclude that divesture and regulation of monopolies
HOW TO SPUR REFORMS AND IMPROVE
suit the needs of their country will want to consider the following in de
ciding when and how to proceed.
• Regulatory contracts work better when governments reduce the firm's information advantage. Competition is the least costly route to im
prove the information on which the contract is based. It can be in
creased by splitting off the natural monopoly and regulating access
to it (for example, Chile split electricity generation from transmis
sion, organized generation into seven competing firms, and regu
lated access to the grid); other activities can be horiwntally un
bundled, allowing yardstick competition. For example, Japan and
Argentina split up their railways into regional operators (World Bank 1994d). Argentina split its telecoms monopoly into two re
gional companies. But even after efforts to increase competition are exhausted, segments of the market will remain monopolies
(electricity distribution and transmission and local basic telephone
services). To reduce the firm's information advantage in these
cases, policymakers could auction the franchise and require that
the incumbent meet certain targets or otherwise lose the conces
sion. As we saw in chapter 3, Argentina, Chile, and Mexico fol
lowed such procedures in the telecommunications sector and
ended up with significant expansion of the network and better
serv1ees.
• Rewards (primarily pricing) to the firm are more effictive in promoting efficient performance when they rely less on the cost estimates provided by the firm and when they are infrequently revised Price regu
lation can be designed so that firms are induced to invest and
operate efficiently, earning a fair rate of return while passing some
of the productivity gains to consumers. This can be done in sev
eral ways. Chile reduced reliance on the firm's information by
using the cost of a hypothetical, efficient firm as a yardstick for
pricing. Argentina, Mexico, and Venezuela followed the example
of the United Kingdom and set a cap on price increases that was
based on the inflation rate minus an adjustment for improvements
in efficiency. Chile and Mexico announced that they would wait five and four years, respectively, between price revisions; this mo
tivated the firms to reduce costs because they could retain the ben
efits in the interim. Where the United Kingdom-style, price cap
formula is followed, as in Mexico, it is possible to pass some ben-
249
*UCRATS IN BUSINESS
250
efits from efficiency gains to consumers by setting price increases
below inflation.
• Regulatory contracts induce private firms to invest when the rules are
believed to be credible. When governments were unable to signal
that they would uphold their side of the bargain-where, for ex
ample, contracts were based on presidential decrees that appeared
vulnerable to being overturned or lacked provision for neutral, ob
jective enforcement and conflict resolution-they had to offer
higher returns or greater monopoly powers to convince investors
that they were indeed committed. Jamaica, for example, gave
Cable & Wireless an exclusive concession over all segments of the
telecommunications markets and allowed the firm a 17.5 to 20
percent rate of return on net worth. In some cases, it may be too
costly to the economy to allow firms to make very high rates of re
turn in order to make up for the lack of credible commitment.
This occurs when a country's institutions cannot bond against
misbehavior-for example, when the judiciary is not seen as inde
pendent and objective, the legislature overturns laws frequently,
and a reputation for respecting property rights and rule of law is
lacking. In other cases, countries may only need a breathing space
while they are building their reputation (especially if the country
is undertaking significant reforms-for example, stabilization,
trade, foreign investment regulation, financial regulation, and
fiscal management-or are in the process of joining important
international agreements). In such cases, reform-minded policy
makers may find it attractive to seek outside guarantees to
strengthen their capacity to commit and to speed up the process of
privatization (box 5.3).
What to Do with SOEs That Cannot Be Divested
SOME SOES IN COMPETITIVE AND NONCOMPETITIVE MARKETS
cannot be divested, either for political reasons, or because the gov
ernment is currently unable to divest in a competitive and transpar
ent manner, or because it does not have the administrative capacity to reg
ulate private monopolies. Policymakers have two options in this situation:
management contracts-those between the government and private
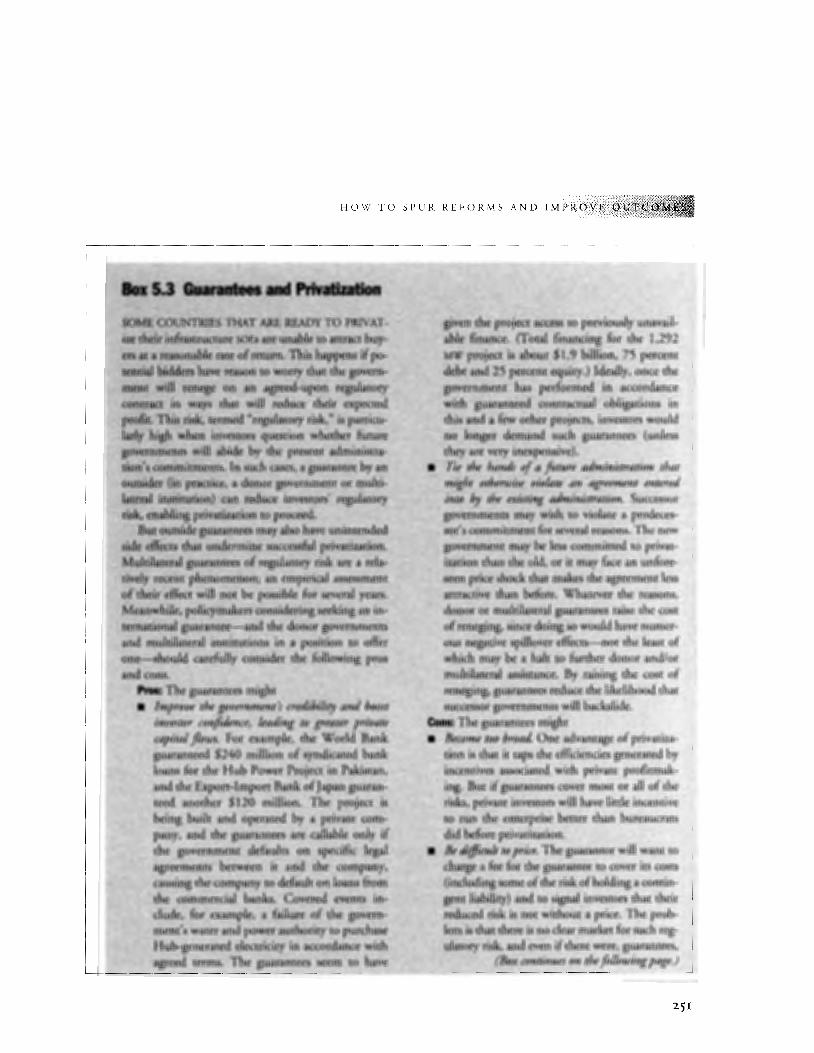
HOW TO Sl'UR REf'ORMS AND IMPROVE 0
--·------- ----- ------------,
·.. ~~".J;·'I • ._:_. .. PtiYatiZatlon -,-, ,~,~~:/\~,~,:-'':' '';
.·. ·jb~}~~~~nfA't~~Y,:O PRIVA1>
~-~~lS · <iltf>~~::rr~ ~!e. termed "r:egulatory risk,"-is'part:~cu~ ·. -~if;~hi~~-:~~il ~tive~tl)rs qu~pon ~bemer,. future ··. g<l)i~#~¥:~~~ abiqe by the p.resen~ ~'dminis~~-··{f~~:~~~~~P-~s.)t\~cast:s~a~mnte~by ~-·
·- · · r'(ifl•p!~i~~;~~Q~org~¢i1ltllerlt or~!llti-
··· ··~~-~~~j~~~~Z:ti~~~c~J;;;;rs·•·-reg@atory / .-~~t.t;lu~iJ~~ttar~~tees m!!Y ~<I have ~~tended
-•. ~~# ea'~~~ that' t}tipermine sn~ssful pri'Vatizapon ... _ ~t~ltilatei~&Uaiatt~s ()f regWatoty risk ru;e a rela~ ' tif~iy recel1't ph¢npt1letionum empirical assessment . ~f~:~r:~~ectwill;tlot be possible foi: several years. ¥dnWhile, pollCyrnakers·Cc>nsidering.seeklng an·in-
•. ~rn\itit)nal'gwr'~te~and ·the donor governments . <:~.nd · multilat~ral. • institutiO:ns in. a position to offer one--Bb.ould carefully cons_ider _rhe following pros and•cons;.
Ptus:- The guaranq:es might • lmpr(Jve the government's trerlibiiity and boost
investor confidence, leading to grel:ttt:r private capital flows. Pot example, the- World Bank guaranteed. $240 _milli()n of syndicated bank
.. loans for the Hub Power Project in Pakistan, and the &po~Import Bank of Japan guaranteed another $120 million. The project is being built arid operated by a private com.: pany, and the guarantees are callll.ble only if the government .defaults on specifidl~l agreem-ents between it arid the company, ~:a;using rhecompl!ny to default on loal):s from
.. the c:~nu-nercial banks .. · Coveted events incdude,, Jot example> a failure of the ~overn-• ment' s water and power authority to pur~ase Hub~genemred electridry in aq::or~I.Ulce with ilgreed tertn8. The guarantees seem to have
given the project ac~ to previously unavailable finance. (Total financing for the 1,292 MW p-rOject is about $1;9 billion; 75 percent debt and 25 percent equity.) Ideally, once the govern1Uent has performed in accordance with · guaranteed contractUal obligations in this and a few other projects, investors would rtt> longel' demand such guarantees (unless they are very inexpensive).
•. Tte the hands of a future administration that · -- might otherwise. r_iolate an agreement entered
tnto llJI the ex&ting administration. Successor governments· may wish to violate a_predeces
-sor' s commitment for several reasons. The new government may be less committed to privat~tion than the old, or it may face an unfore~en price shock that rnakes rhe agreement less attractive than before. Whatever the reasons, donor or multilateral guarantees raise the cost ofreneging, since doing so would have numerous negative spillover effectS--not the least of which may be a halt to further donor and/ or multilateral assistance. By raising the cost of reneging, guarantees reduce the likelihood that succesSor governments will backslide,
Cons: The guarantees might • Become too broad. One advantage of privatiza
tion is that it taps the efficiencies generated by incentives associated· with private profitmaking •. But if guarantees cover most or all of the risks, privat:e investors will have litde incentive to run the enterprise better than bureaucrats did before privatization.
• Be difficult to price. The guarantor will want to
charge a fee for the guarantee to cover its costs (including some of the risk of holding a contingent liability) and to signal investors that their reduced ~;isk is not without a price. The problem is that there is no dear market for such reg-
. ulatory risk, and even if there were, guarantees, (Box continues on the following page.)
251
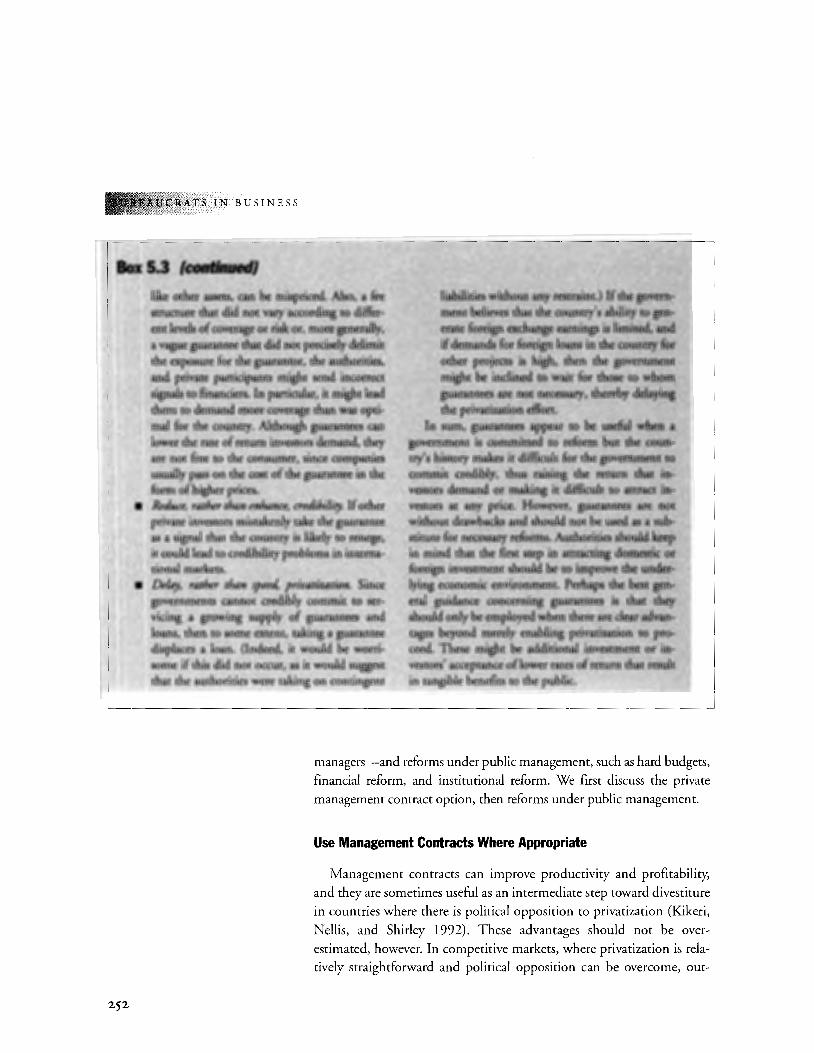
252
ATS IN BUSINESS
Box 5..3 lt:OIIIIIIllfHIJ. like othet assets, QUl he inispticed-.Afso, a fee structUre .that did not v.uy accordingto 4ifferent levels of coveragebt t~or, daotegeneraiJY~ ~ a vague .guarall~ tha~ did not precisely detintit the exposure for. the.guarantp:r, the aui:hotities, and p.dvare parti~pant$ might send incorrect $ignafs to fitianc(ers. In: pa:rdcular, it mightlead · ·· them to demand n1tire coverage th~ was opti.tna} fonhe rountt:y. Although gual"3.1ltees QW. Lower. the tate ofteturn 1.nvestorsdeimtt'ia, they are not free to the consll,mer, since companies usually pass on the. cost of the gua.ran~ in the· form of: higher prices.
• Reduje, rather than enhance, credibility. Ifot:her ptivate investorsmistakenJ:r .. rakethe. ~tee as a signal that the .country. is likely to renege, jt roUld.lead to credibility problems in inter11i:' :clonal markets.
• De/tty, rather than speetl priv~tion. Since governments cannot credibly commit to servicing a growing supply of guarantees and loans, then to some extent, taking a guarantee displaces a loan. (Indeed, it would he worri~ some if this did not occur, as it would suggest that the authorities were taking on contingent
without draw~~l\d shottld·ll;t:he~~·~fStib+\. s~tu;for ~;u;rcro~~.1\¥¥~~:l.~~.~f#~~~~¥it in Jnind that· the first sllql in. ;t~~~.~;ll\~!~'l>tt·~
~~7:S~~ll1, . should c;d;uybe.employ~wh~th~~r~:C~~v~~<·· rafS ~nd • mer«i ellaf,l.in~ .pti~~74tion~:~P,~~;. ceed. Th~se might be additional lpvesti,aeAt,~i'~ut. \ vestor$' aeceptanceoffo'Wer rates ofretU.tit ttmfresatf ': in tangible benefits to the public. · ··
managers-and reforms under public management, such as hard budgets,
financial reform, and institutional reform. We first discuss the private
management contract option, then reforms under public management.
Use Management Contracts Where Appropriate
Management contracts can improve productivity and profitability,
and they are sometimes useful as an intermediate step toward divestiture
in countries where there is political opposition to privatization (Kikeri,
Nellis, and Shirley 1992). These advantages should not be over
estimated, however. In competitive markets, where privatization is relatively straightforward and political opposition can be overcome, out-
HOW TO SPUR REFORMS AND IMPROV
right sale is likely to generate more benefits than management contracts
and without the cost of periodically renegotiating. Unlike sales, man
agement contracts do not generate sales revenue for the government and
may bring in little or no private investment for the firm. Moreover, al
though management contracts may be less costly politically than privat
ization, they do entail political costs: to make a management contract
successful, government must stop using the enterprise for political pur
poses and may have to allow layoffs or the hiring of foreign managers.
Finally, even in those instances where privatization is not possible, man
agement contracts are only a useful option for firms in certain types of
fields. Policymakers, taking these considerations into account, may
nonetheless conclude that management contracts are a useful tool in
their country's circumstances. In this event, they will want to consider
the following issues in deciding when and how to use them:
• Management contracts work better (and are found most frequently) in
activities with fiwer information problems. Government's informa
tion problems are less severe where the enterprises operate in com
petitive markets or where the contract can be competitively bid. In
formation problems are also less serious, and management contracts
less costly to design and monitor, in sectors where technology is not
changing rapidly, so they don't have to be renegotiated frequently.
This is also true if the output is a single, homogeneous product
(such as water) or a highly visible, easily compared product (such as
hotel services), so that performance can be easily judged.
• Rewards and management's freedom to make changes are important to
success. Management contracts do better when they provide re
wards that motivate managers to improve efficiency, such as equity
stakes or success fees linked to performance. Many of the success
ful management contracts in our sample had no or very low fixed
fees. Regardless of how well the rewards are designed, however, the
contract can only motivate management to improve efficiency if it
also provides the opportunity to make the needed changes. Free
dom to hire and fire proved an important factor in the successful
management contracts we reviewed.
• Government and management must be able to demonstrate commit
ment. Governments can signal their commitment by agreeing to
longer contracts and agreeing to explicit conflict resolution
mechanisms, including international arbitration. For its part,
253
CRATS IN BUSINESS
254
management can be seen as committed when the contractor has a
reputation to worry about (such as large chains in hotels or Booker
Tate in agriculture). While outside financing from donors or oth
ers may be appropriate to cover some transaction costs, such sup
port should not reduce risks to the point that either party escapes
the costly actions needed to signal commitment. Similarly, policy
makers must be careful that outside finance does not undermine
competition for the contract (by restricting bidders) or lessen
management's stake in performance (by funding large fixed fees).
Reform Nondivested SOES Comprehensively
What about firms in potentially competitive and noncompetitive
markets that cannot be divested, but are not suitable for management
contracts? For these firms, policymakers may have no choice but to at
tempt improvements within the existing ownership and management
arrangements. Essential specific measures include introducing competition, cutting government subsidies, reforming financial arrangements to
eliminate soft credits, and holding managers responsible for results
while giving them the freedom to make necessary changes. The perfor
mance of SOEs that are not divested can be improved through these ac
tions, but, as we saw in chapter 2, getting the details right is tough, be
cause each reform relies on the successful implementation of others.
Policymakers designing a package of reforms for firms that cannot be
privatized will want to keep in mind the following:
• Foster competition to create incentives for improved performance.
State-owned enterprise managers will be more motivated to exert
the effort needed to improve performance if pushed by competi
tion. Governments should therefore reduce trade protection and
ease barriers to entry. Chile provides a prime example. In 1974,
the government eliminated all quantitative restrictions on im
ports, introduced a 10 percent tariff rate on all imports, and al
lowed entry into all markets. This subjected state and private firms
in the tradable sector to immediate competition. (The Czech Re
public and Poland are also examples of this.)
• Require competitive SOEs to follow the same rules as private firms in
their commercial activities. This means abolishing special tax breaks, preferences under procurement, and exemptions from anticompet-
HOW TO SPUR REFORMS AND IMPROVE 0
itive restrictions or the like and subjecting SOEs to private commer
cial law on an equal footing with their private competitors.
• End subsidies and transfers. Fostering competition is fundamental
to improving the performance of SOEs in potentially competitive
markets. But competition can only be effective if government
transfers and subsidies are eliminated. Drawing on government
subsidies, transport SOEs in Ghana and Senegal and textile SOEs in
Egypt survived and even expanded despite the losses they incurred in a competitive market.
• Restrict access to soft credit. Cutting subsidies and transfers only re
sults in hard budgets if access to soft credit is also restricted. SOEs
in countries as diverse as China, Egypt, and Ghana, faced with
mounting competition and reductions in government subsidies,
turned to bank credit instead. Where such firms then fail to im
prove their performance, the buildup of bad debt may undermine
the entire financial system and hurt otherwise sound firms that
find it increasingly difficult to obtain credit.
• Give managers the autonomy to respond to competition and hold them accountable for results. If an SOE sets its output prices in competi
tive markets, is cut off from subsidies, must borrow at market
terms, and cannot run up arrears to its suppliers, then the situa
tion is ripe for management to take actions that raise efficiency.
This will not happen, however, if managers do not have the free
dom to act-to lay off workers, seek lower cost suppliers, end un
profitable activities, and pursue new markets. In addition, man
agers must have incentives to act, including the knowledge that
they are accountable for results (see below). Lacking autonomy
and incentives, managers may respond to increased competition
and a harder budget in ways that hurt the enterprise, such as cut
ting spending on maintenance, marketing, and even supplies.
• Use peiformance contracts with public managers selectively. Perfor
mance contracts can, in theory, hold SOE managers accountable to
better performance standards. But our findings suggest that they
should be used only when they can be designed to convey clear
signals for reform, provide rewards for improved performance,
and curb governments' tendency to renege. Signing a formal
agreement without these factors may do more harm than good.
Writing a contract with a few targets aimed at improving effi
ciency is a simple act in theory; in practice it is quite complex to
255
.BUSINESS
256
overcome the by now familiar problems of contracting informa
tion, rewards and penalties, and commitment. Competition could
be used to reveal information, by inviting SOE managers to bid to
supply a service for example, but, aside from the notable exception
of China, this has seldom happened. Similarly, the contract could
provide rewards, such as greater autonomy and bonuses, that are
large enough to make managers want to share information and
achieve the targets. But the effectiveness of government rewards is
often undermined because governments appoint and remove SOE
managers for reasons unrelated to performance. For example,
Egypt and India each have more than 5,000 SOE managers who are
political appointees (Waterbury 1993). Another requirement for
performance contracts to work is that the government negotiators
have the motivation, skills, and power to extract and understand
information about what the firm can (and did) accomplish and set
targets accordingly. This will be hard to achieve where civil service
pay is low and responsibilities are often shifted around for political reasons, a common situation in developing countries. Korea
was able to get unpaid volunteers from the private sector to serve
on ad hoc task forces by appealing to their civic mindedness; that
may not work in all countries, however.
Performance contracts are especially vulnerable to commitment
problems. Management and regulatory contracts benefit from a built-in
screening process-a private party that doubts the government will up
hold its side of the bargain can refuse to sign. Public managers, on the
other hand, have no choice but to participate. Involvement of third par
ties, such as donors, private monitors, or the press, may help enhance
government's commitment. In Korea, for example, the Korean Devel
opment Institute and private evaluators helped to increase the effective
ness of performance contracts; but, in the final analysis, these contracts
will only succeed if the government is willing to take costly actions to tie
its own hands. These may include settling arrears, increasing autonomy,
firing managers who do not perform, and giving monitors more pay and
power. Moreover, even if a government does all these things, the con
tract may be hard to sustain if the political circumstances change. Pri
vate parties have an incentive to negotiate some insulation from future
political reversals, something that public managers are not in a position
to do. This implies that performance contracts should be used sparingly and
HOW TO SPUR REFORMS AND IM
only where the right conditions can be created, especially since they may do harm as well as good.
Conclusion
WE HAVE SHOWN IN THIS BOOK THAT BUREAUCRATS STILL
run important segments of the economies in developing
countries and that large SOE sectors can be a significant impediment to economic growth. Yet reform is possible and offers poten
tially large benefits, including increased availability of resources for health,
education, and other social spending; more goods and services of better
quality at lower prices; and improved fiscal stability-all of which make it easier for economies to grow and for people to improve the quality of their
lives. Reforming SOEs isn't easy, of course, and reforms often entail politi
cal costs. Indeed, we found that political obstacles are an important reason
why state-owned enterprise reform has made so little headway in the last
decade. We hope that the evidence and analysis presented in this book, to
gether with the road map for successful reform, will give political leaders,
policymakers, and the broader development community a clearer picture
of the very substantial benefits that could result from state-owned enter
prise reform and, just as important, a better understanding of how the
many obstacles to successful reform can be overcome.
Notes
1. An attempt was made to use objective, quantifiable indicators wherever possible; see chapter 4 for details.
3. Research is currently under way in the World Bank to develop tools that will help governments make these calculations.
2. This note draws on Kikeri, Nellis, and Shirley (1992).
257

Implications for Foreign Assistance
IRTUALLY ALL SOE REFORM PROGRAMS PLANNED
and under way in developing countries are sup
ported by foreign assistance. Although much of this support is highly beneficial, our evidence suggests
that assistance can sometimes do harm as well as
good. Aid intended to promote SOE reform can be
counterproductive in several situations. First, ill-timed financial assis
tance to unready countries may undermine the pressure to reform. As we
have seen in at least two of our sample countries, Egypt and Senegal, for
eign assistance that helped ease the fiscal crisis may have made it easier to
preserve the SOE status quo. Second, formalistic SOE reform in the ab
sence of real change may cause a deterioration in SOE performance. For
malistic reforms are those that appear to be real but do not result in
meaningful improvements in practice. For example, we have seen how
signing a performance contract without changing incentives may have al
lowed managers to set multiple soft targets at odds with improved per
formance. Third, we have shown how governments that ended overt SOE
subsidies to meet aid conditions sometimes then expanded covert subsi
dies and bank credits, which are harder to identify and curb and which
spread SOE problems to the financial system. Fourth, we have also shown
how countries that rushed to implement poorly planned and designed
privatization to meet requirements set by foreign assistance agreements
struck bad bargains. And finally, although this is hard to document, sup
port for formalistic reforms that don't show results tarnishes the reputation of external assistance and undermines the credibility of reform. This suggests that foreign assistance follow a different course of action in countries that are ready to reform ftom those that are not. Specifically, assistance with SOE reform is more likely to achieve its goals in countries that satisfY the three
259
IN BUSINESS
260
conditions for SOE reform success: reform is politically desirable for the leadership; reform is politically feasible; and reform promises are credible.
Of course, foreign assistance already distinguishes committed from
uncommitted countries. w-e are recommending that this be done sys
tematically, using the indicators of readiness detailed in chapter 5. Given the uncertain nature of predictions, many countries will be
hard to categorize as ready or unready. In these cases, up-ftont actions can
distinguish countries where SOE reform is politically desirable and feasible and
governments are credible, .from those where they are not. A good indicator of
whether SOE reform is politically desirable to a new regime is when a government lays off redundant workers. Layoffs are also a sign that reform is feasible, since they demonstrate that a government is able to overcome re
sistance, for example, by designing severance packages to win over opponents. Another action that evidences both desirability and feasibility is the liquidation or sale of a large enterprise. Credibility is harder to test with a few up-front actions, since a government builds up believability by consistently fUlfilling its promises over time. However, such measures as the International Country Risk guide or domestic polls of investor con
fidence can signal that credibility may be weak. In such cases foreign assistance could help governments enhance their credibility by supporting
them in enacting domestic restraints on reform reversal (such as renationalization) or in the use of wide share distribution programs to give
beneficiaries a stake in the future of reforms. Foreign assistance can help governments of unready countries lay the
groundwork for SOE reform by assisting reform in other economic areas. As we have seen in chapter 5, this leaves a large agenda of action for exter
nal support, including the reduction of fiscal deficits and trade restrictions, the removal of barriers to entry, the implementation of initial fi
nancial sector reforms, the introduction of measures to enhance private
job creation, and the uncoupling of SOE jobs from social services. Exter
nal aid could also help lay the groundwork for reform by providing information on the costs of not reforming and the net benefits from reform and by helping familiarize countries with experiences elsewhere.
External assistance could help reform-ready governments attract private investors. A government that is just beginning to establish a reputation for being reform-minded may find it hard to attract private buyers for
large, asset-specific investments in regulated monopolies. In countries that meet the first two conditions, guarantees by international agencies could be explored as a way to attract initial private investments while the
IMPLICATIONS FOR FOREIGN
government is establishing its credibility. Guarantees have pros and cons
(see box 5.3) and should be approached cautiously.
Finally, design of foreign assistance needs to allow for the possibility
that readiness for SOE reform was overestimated or that circumstances
have deteriorated. As we document in chapters 2 and 3, SOE reform
components are interrelated: promised actions in one area can be un
dermined by backsliding in another. Examples of backsliding in our
sample include reinstituting measures to protect SOEs from competition,
such as import levies and nontariff barriers (Turkey); the write-off, or
government assumption, of SOE debts without measures to improve SOE
financial management or to address the underlying cause of over
indebtedness (in Egypt, the Philippines, and Senegal); arrears in pay
ments by public agencies to SOEs for goods and services rendered (as with the electricity companies in Senegal and India); and refusal to in
crease the prices of monopoly SOEs or privatized firms in line with
agreed pricing formulae (the Ghana and Senegal electricity companies).
In sum, by clearly distinguishing between assistance to reform-ready
and unready countries, foreign aid can reduce the risk of perverse effects
and improve the credence of SOE reform measures; it can also help
reform-minded governments build their reputation. If assistance for SOE
reform is provided only selectively, recipients will have greater credibil
ity with investors and potential supporters. Assistance for SOE reform
that goes only to governments that meet the three readiness conditions
would look different in volume and kind and so convey a positive signal
about the country's likely future actions. In essence, countries that
agreed to meet strict conditions for SOE reform assistance would be tak
ing external constraints similar to those involved with an important in
ternational treaty-and would be seen as doing so.
261

Statistical Appendix
~·2iiiii .. HIS NOTE EXPLAINS THE GENERAL METHODOLOGI
cal conventions employed in assembling the data re
ported in the following tables. The note also explains the limitations of the data, which were compiled from
more than one source, with different definitions and
coverage.
Definition and Methodology
State-Owned Enterprises. SOEs are defined here as government owned or
controlled economic entities that generate the bulk of their revenue
from selling goods and services. This definition limits the SOE set to
commercial activities in which the government is able to control man
agement decisions by virtue of its ownership stake alone. However, it
still encompasses enterprises directly operated by a government depart
ment and those in which the government holds a majority of the
shares, directly or indirectly, through its SOEs. It also encompasses
enterprises in which the state holds a minority of the shares if the dis
tribution of the remaining shares would leave the government with
effective control.
The data did not always fit this definition. In fact, not only do coun
tries vary as to what they consider an SOE, but such variations exist even within the same country over time. In exceptional cases, governments in
clude in their SOE set activities that do not have a commercial character
for example, agricultural research institutes. However, they more fre
quently omit activities that are clearly SOEs. The most frequent
263
BUSINESS
,,
/ I
v'
264
omissions occur when governments define SOEs narrowly-for example,
by excluding SOEs of a particular legal form (e.g., departmental enter
prises), SOEs owned by local governments (typically utilities), or SOEs
that are considered less important in terms of size or need for fiscal re
sources. Accordingly, data on SOEs tend, on average, to underestimate
their relative importance in economic activity.
In compiling the data, an attempt has been made to correct for any
omissions of SOEs. However, that attempt was not always successful.
Cases in which insufficient information compelled us to deviate from
our definition are noted in the country-specific notes. Finally, unless
specifically noted otherwise, the data cover only federal nonfinancial
SOEs.
SOE Value Added. Data availability dictated the use of two procedures to estimate the SOE contribution to economic activity. SOE value added
is estimated as the sales revenue minus the cost of intermediate inputs,
or as the sum of operating surplus (balance) and wage payments. SOE value added is then reported as a proportion of gross domestic product (GDP) at market prices. In recognition of the fact that the size of the
agricultural sector varies substantially across countries, although the
presence of SOEs in this sector is rarely large, SOE contribution to nona
gricultural GDP is also reported.
SOE Investment. Unless otherwise noted, investment in SOEs refers to
their fixed capital formation .reported as a share of both gross domestic
investment and GDP at market prices.
SOE Share in Employment. The figures here are not directly comparable.
For many countries, they refer to the share of full-time SOE employees
in total formal sector employment only. At times, they refer to all SOEs,
_ including financial SOEs. This is especially true for most of the Mrican
countries, for which we placed heavy reliance on Mrican Development
Indicators as our source. SOE Savings-Investment Gap. SOE savings (or current account balance)
are obtained as the sum of net operating and net nonoperating rev
enues. Unless otherwise noted, net operating revenue (or operating
surplus or balance) refers to gross operating profits, or operating rev
enue minus the costs of intermediate inputs, wages, factor rentals, and
depreciation. The sum of operating surplus and net nonoperating rev
enue is SOE savings (or current account balance). In turn, the SOE sav
ings-investment balance is obtained as SOE savings minus SOE net capital expenditure.
Excluded from SOE savings are all transfers, which include such
items on the revenue side as subsidies and such items on the expendi
ture side as dividends. The reason for excluding these transfers is
twofold: they are not part of SOE revenues or costs, and their inclusion
would cloud the very measure being captured, namely, the resources
they require from the economy.
Net Government Transfers to SOEs. These are defined as the difference
between all financial flows from the government to SOEs (including
government loans, equity, and subsidies) and all flows from SOEs to the
government (including dividends and taxes). Our measure differs from the one reported by Nair and Filippides (1989) because we treat taxes
paid by SOEs as a transfer of financial resources from the SOEs to the
government. The data are reported as a percentage of GOP at market
prices. J SOE Share of Domestic Credit. Domestic credit to SOEs is reported as
their share of both gross domestic credit and GOP. Unlike Nair and ·
Filippides (1989), we define gross domestic credit in the economy as
the sum of gross credit outstanding of the financial system to the pri
vate sector, and the SOE sector, and also to the government (i.e., not
net credit to the government). This facilitates a more consistent cross
country comparison and eliminates distortions and negative ratios that
may otherwise arise if government deposits with the central bank
exceed central bank credit to the government.
SOE Share of External Debt. These data refer to the total external bor
rowing of SOEs and include all debt outstanding and disbursed. They
generally do not include debt that may have been assumed or incurred
by the government on behalf of SOEs. Since these numbers are reported
in U.S. dollars, we report them as a share of total external debt as well
as a share of GOP at market prices in U.S. dollars.
Averages by Income and Regional Classification. For each indicator defined
above, both unweighted and weighted averages are reported for devel
oping economies classified into three broad regional groups (Latin
America and the Caribbean, Africa, and Asia) and by per capita
according to the World Bank 1992 gross national product (GNP) classi
fication (low-income, $675 or less; middle-income, $676-$8,355). All
weighted averages are obtained using GOP at market prices in U.S. dol
lars as weights. The group averages reported here are based on a subset of economies in each table for which there was a sufficiently long time
series for each indicator. Three-year moving average estimates were
ST ATISTI
~I
,
265
'UCRATS IN BUSINESS
266
used to extrapolate the desired value for those remaining years for
which observations were missing. Although these estimates were used
to generate the period and group averages reported in each table, they
are not reported in the respective country time series. Any country
specific exceptions to this rule are noted in the corresponding country
notes.
Finally, value added and investment shares for state-owned enter
prises in industrial economies (per capita GNP of more than $8,355)
are also reported. However, as there were not sufficiently long time
series for enough industrial economies, estimates are not extrapolated
for this group. Instead, group averages are reported for four dispersed
years spanning 1978-88. Lack of data made impossible a comprehen
sive comparison between the SOE sectors in industrial and developing
economies. Nevertheless, the measures of SOE value added and investment that are reported here provide a partial gauge for comparing the
size of public enterprise sectors in these economies and in developing
economies.
Data Sources
NUMEROUS COUNTRY-SPECIFIC SOURCES WERE CONSULTED,
and these are referenced in the Technical Notes immediately
following the tables. Other main sources of data were:
• World Bank country and sector reports, World Bank Economic
and Social Database (BESD), World Debt Tables, World Tables, and
African Development Indicators (ADI).
• International Monetary Fund Recent Economic Developments
(country reports) and International Financial Statistics
• Floyd, Gray, and Short (1984)
• Nair and Fillipides (1989)
• Centre europeen de 1' entreprise publique reviews-Statistics of
Public Enterprises in the EEC
• United Nations-Yearbook of National Accounts Statistics
• OECD-National Accounts Statistics.
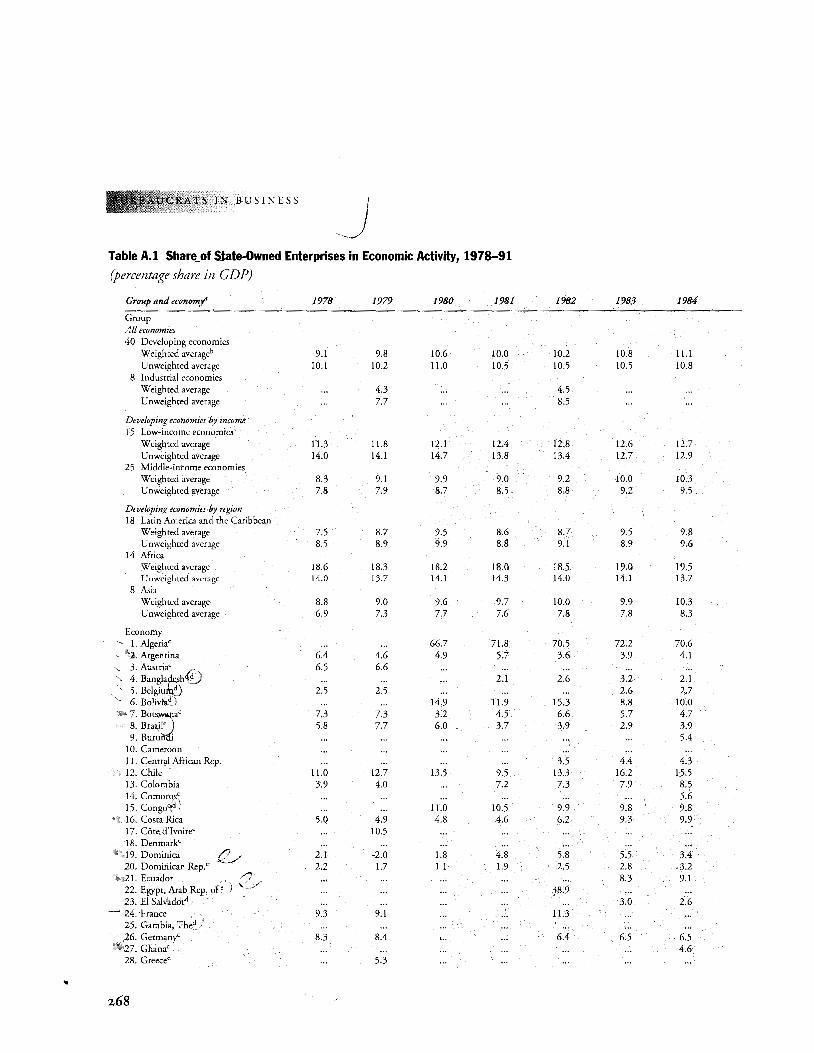
TS IN BUSINESS I
,,_) Table A.1 Share_ of State-Owned Enterprises in Economic Activity, 1978-91 (percentage share in GDP)
Group and economy" 1978 1979 1980 1981 1982 1983 1984
Group All economies 40 Developing economies
Weighted averageb 9.1 9.8 10.6 10.0 10.2 10.8 11.1 U nweighted average 10.1 10.2 11.0 10.5 10.5 10.5 10.8
8 Industrial economies Weighted average ... 4.3 ... . .. 4.5 Unweighted average ... 7.7 ... 8.5
Developing economies by income 15 Low-income economies
Weighted average 11.3 11.8 12.1 12.4 12.8 12.6 12.7 Unweighted average 14.0 14.1 14.7 13.8 13.4 12.7 12.9
25 Middle-income economies Weighted average 8.3 9.1 9.9 9.0 9.2 10.0 10.3 Unweighted average 7.8 7.9 8.7 8.5 8.8 9.2 9.5
Developing economies by region 18 Latin America and the Caribbean
Weigh ted average 7.5 8.7 9.5 8.6 8.7 9.5 9.8 U nweighted average 8.5 8.9 9.9 8.8 9.1 8.9 9.6
14 Africa Weighted average 18.6 18.3 18.2 18.0 18.5 19.0 19.5 Unweighted average 14.0 13.7 14.1 14.3 14.0 14.1 13.7
8 Asia Weighted average 8.8 9.0 9.6 9.7 10.0 9.9 10.3 U nweighted average 6.9 7.3 7.7 7.6 7.8 7.8 8.3
Economy I. Algeriac ... ... 66.7 71.8 70.5 72.2 70.6
'2. Argentina 6.4 4.6 4.9 5.7 3.6 3.9 4.1 ., 3. Austriac .- 6.5 6.6
4. Bangla~(U ... ... . .. 2.1 2.6 3.2 2.1 S. Belgiu ~/ 2.5 2.5 ... ... . .. 2.6 2.7 6. Boliv~) ... ... 14.9 11.9 15.3 8.8 10.0
7. Bot~fc 7.3 7.3 3.2 4.5 6.6 5.7 4.7 8. Bra~]' 5.8 7.7 6.0 3.7 3.9 2.9 3.9 9. Burun i ... ... . .. . .. . .. . .. 5.4
10. Cameroon 11. Central African Rep. ... ... . .. . .. 3.5 4.4 4.3 12. Chile 11.0 12.7 13.5 9.5 13.3 16.2 15.5 13. Colombia 3.9 4.0 ... 7.2 7.3 7.9 8.5 14. ComoroR ... ... . .. ... . .. . .. 5.6 15. Congoc0, ... . .. 11.0 10.5 9.9 9.8 9.8
• ;.16. Costa Rica 5.0 4.9 4.8 4.6 6.2 9.3 9.9 17. Cote d'lvoirec ... 10.5 18. Denmarkc
·,··19. Dominica 2.1 -2.0 1.8 4.8 5.8 5.5 3.4 20. Dominican Rep.' 2.2 1.7 1.1 1.9 2.5 2.8 3.2 '21. Ecuador ... ... . .. . .. ... 8.3 9.1 22. Egypt, Arab Rep. of: ) ... ... ... .. . 38.9 23. El SalvadQrd ' ... ... . .. ... ... 3.0 2.6
- 24.·France 9.3 9.1 ... ... 11.3 25. Gambia, The_d ·' 26. Germany< 8.3 8.4 ... .. . 6.4 6.5 6.5
... ,.:1.7. Ghanac ... ... ... ... ... ... 4.6 28. Greecec ... 5.3
~
268
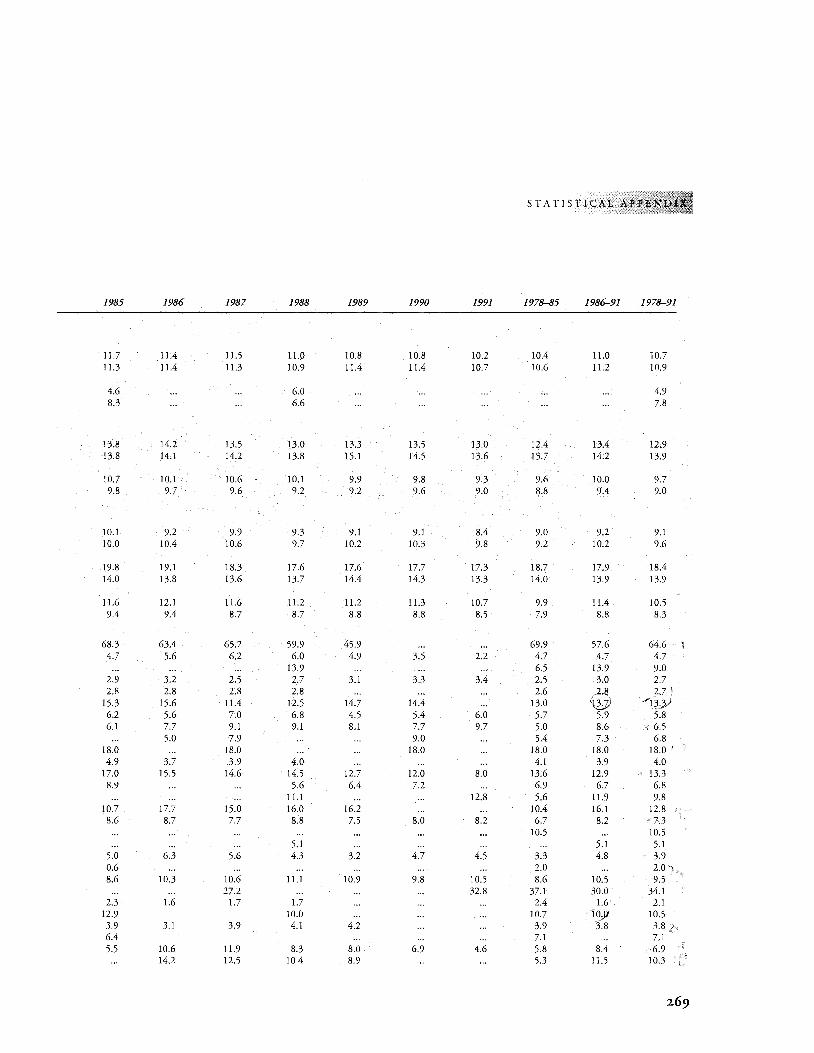
STATISTICAL APP
1985 1986 1987 1988 1989 1990 1991 1978-85 1986-91 1978-91
11.7 11.4 11.5 11.0 10.8 10.8 10.2 10.4 11.0 10.7 11.3 11.4 11.3 10.9 11.4 11.4 10.7 10.6 11.2 10.9
4.6 ... . .. 6.0 . .. ... . .. . .. . .. 4.9 8.3 ... . .. 6.6 ... . .. . .. . .. . .. 7.8
13.8 14.2 13.5 13.0 13.3 13.5 13.0 12.4 13.4 12.9 13.8 14.1 14.2 13.8 15.1 14.5 13.6 13.7 14.2 13.9
10.7 10.1 10.6 10.1 9.9 9.8 9.3 9.6 10.0 9.7 9.8 9.7 9.6 9.2 9.2 9.6 9.0 8.8 9.4 9.0
10.1 9.2 9.9 9.3 9.1 9.1 8.4 9.0 9.2 9.1 10.0 10.4 10.6 9.7 10.2 10.3 9.8 9.2 10.2 9.6
19.8 19.1 18.3 17.6 17.6 17.7 17.3 18.7 17.9 18.4 14.0 13.8 13.6 13.7 14.4 14.3 13.3 14.0 13.9 13.9
11.6 12.1 11.6 11.2 11.2 11.3 10.7 9.9 11.4 10.5 9.4 9.4 8.7 8.7 8.8 8.8 8.5 7.9 8.8 8.3
68.3 63.4 65.2 59.9 45.9 ... . .. 69.9 57.6 64.6 4.7 5.6 6.2 6.0 4.9 3.5 2.2 4.7 4.7 4.7
13.9 ... . .. 6.5 13.9 9.0 2.9 3.2 2.5 2.7 3.1 3.3 3.4 2.5 3.0 2.7 2.8 2.8 2.8 2.8 ... ... . .. 2.6 ?·& 2,,7 I
15.3 15.6 11.4 12.5 14.7 14.4 ... 13.0 ·~ /13j) 6.2 5.6 7.0 6.8 4.5 5.4 6.0 5.7 5.9 5.8 6.1 7.7 9.1 9.1 8.1 7.7 9.7 5.0 8.6 6.5
5.0 7.9 9.0 ... 5.4 7.3 6.8 18.0 ... 18.0 . .. . .. 18.0 ... 18.0 18.0 18.0 ' 4.9 3.7 3.9 4.0 ... . .. 4.1 3.9 4.0
17.0 15.5 14.6 14.5 12.7 12.0 8.0 13.6 12.9 13.3 8.9 ... ... 5.6 6.4 7.2 6.9 6.7 6.8
11.1 ... . .. 12.8 5.6 11.9 9.8 10.7 17.7 15.0 16.0 16.2 ... . .. 10.4 16.1 12.8 8.6 8.7 7.7 8.8 7.5 8.0 8.2 6.7 8.2 7.3
10.5 ... 10.5 5.1 ... . .. . .. . .. 5.1 5.1
5.0 6.3 5.6 4.3 3.2 4.7 4.5 3.3 4.8 3.9 0.6 ... . .. . .. . .. . .. . .. 2.0 . .. 2.0 ·~ 8.6 10.3 10.6 11.1 10.9 9.8 10.5 8.6 10.5 9.5
27.2 ... . .. . .. 32.8 37.1 30.0 34.1 2.3 1.6 1.7 1.7 ... 2.4 1.6 2.1
12.9 10.0 ... . .. . .. 10.7 .. 1~j}' 10.5 3.9 3.1 3.9 4.1 4.2 ... ... 3.9 3.8 3.8 6.4 ... . .. . .. 7.1 . .. 7.1 5.5 10.6 11.9 8.3 8.0 6.9 4.6 5.8 8.4 6.9
14.2 12.5 10.4 8.9 ... . .. 5.3 11.5 10.3
269
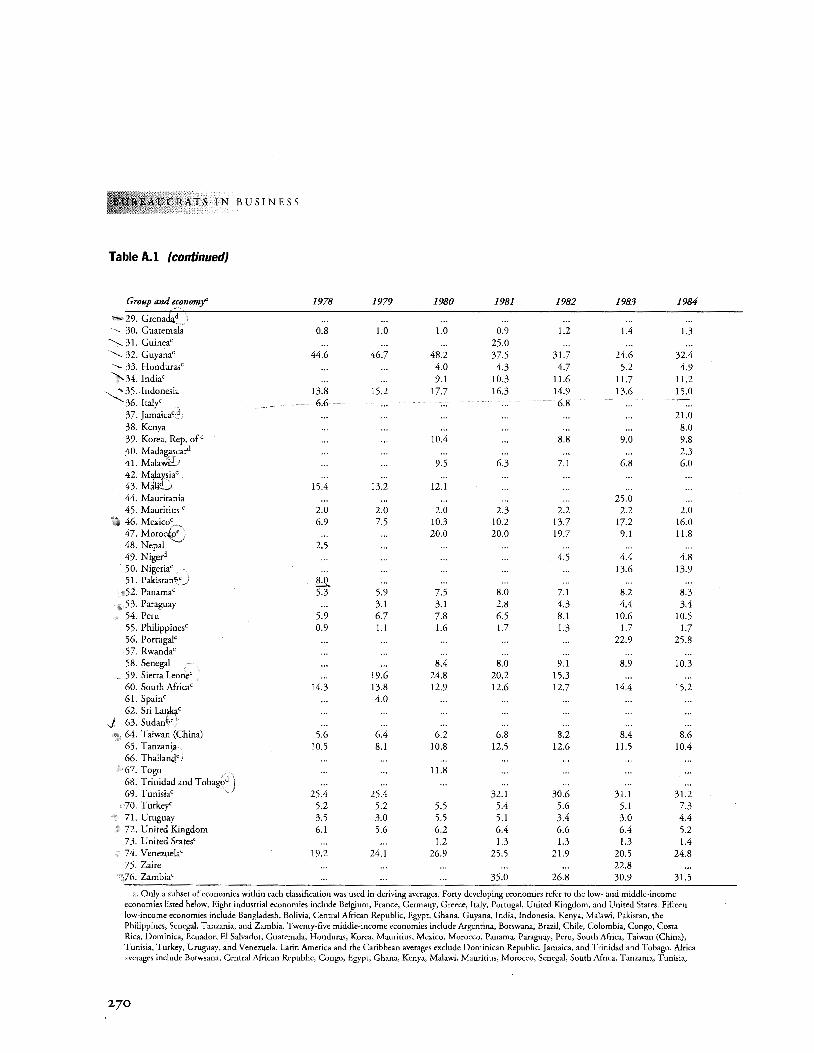
RATS IN B US I N E S S
Table A.l (continued}
Group and economj'
""'- 29. Grenada_d ,i
·-, ]0. Guatemal-;;· ., :l 1. Guinea' "'-. :\2. Guyana' ~ 3:\. Honduras' ""-]4. India'
~:\5.-lndonesia 36. Italy' . 37. Jamaica'·d 38. Kenya 39. Korea, Rep. of' 40. Madaga~ca~ 41. Malawi~.) 42. M~ia' 4:\. M~..) 44. Mauritania 45. Mauritius' 46. Mexico~ •.•. 47. Moroc.{oe) 48. Nepal '-··
49. Nige~ 50. Nigeria' , 51. Pakistan!:", l
-52. Panamac : ,5:\. Paraguay
54. Peru 55. Philippinesc 56. Portugalc 57. Rwandac 58. Senegal 59. Sierra Leon;;< : 60. South Africa<' 61. Spainc 62. Sri Lankac
,j 63. Sudan~:<} 64. Taiwan (China) 6.5. Tanzania 66. Thailand.:) 67. Togo _. 68. Trinidad and Tobag(,d 69. Tunisiac
, 70. Turkey' 71. Uruguay 72. United Kingdom 73. United States'
.: 74. Venezuela' 75. Zaire
•;)76. Zambiac
1978
0.8
44.6
13.8 ~.~
15.4
2.0 6.9
2.5
8.0 5.3
5.9 0.9
14.3
5.6 10.5
25.4 5.2 3.5 6.1
19.2
1979
1.0
46.7
15.2
13.2
2.0 7.5
5.9 3.1 6.7 1.1
19.6 13.8 4.0
6.4 8.1
25.4 5.2 3.0 5.6
24.1
1980
1.0
48.2 4.0 9.1
17.7
10.4
9.5
12.1
2.0 10.3 20.0
7.5 3.1 7.8 1.6
8.4 24.8 12.9
6.2 10.8
11.8
5.5 5.5 6.2 1.2
26.9
1981
0.9 25.0 37.5 4.;\
10.3 163
6.3
2.3 10.2 20.0
8.0 2.8 6.5 1.7
8.0 20.2 12.6
6.8 12.5
32.1 5.4 5.1 6.4 1.3
25.5
35.0
1982
1.2
31.7 4.7
11.6 14.9 6.8
8.8
7.1
2.2 13.7 19.7
4.5
7.1 4.3 8.1 1.3
9.1 15.3 12.7
8.2 12.6
30.6 5.6 3.4 6.6 u
21.9
26.8
1983
1.4
24.6 5.2
11.7 13.6
9.0
6.8
25.0 2.2
17.2 9.1
4.4 13.6
8.2 4.4
10.6 1.7
22.9
8.9
14.4
8.4 11.5
31.1 5.1 3.0 6.4 1.3
20.5 22.8 30.9
1984
1.3
32.4 4.9
11.2 15.0
21.0 8.0 9.8 2.3 6.0
2.0 16.0 11.8
4.8 13.9
8.3 3.4
10.5 1.7
25.8
10.3
15.2
8.6 10.4
31,2 7.3 4.4 5.2 1.4
24.8
31.5
a. Only a subset of economies within each classification was used in deriving averages. Forty developing economies refer to the low- and middle-income economies listed below, Eight industrial economies include Belgium, France, Germany, Greece, Italy, Portugal, United Kingdom, and United States. Fifteen low-income economies include Bangladesh, Bolivia, Central African Republic. Egypt, Ghana, Guyana, India, Indonesia, Kenya, Malawi, Pakistan, the Philippines, Senegal, Tanzania, and Zambia. Twenty-five middle-income economies include Argentina, Botswana, Brazil, Chile, Colombia, Congo, Costa Rica, Dominica, Ecuador, El Salvador, Guatemala, Honduras, Korea, Mauritius, Mexico, Morocco, Panama, Paraguay, Peru, South Africa, Taiwan (China), Ttmisia, Turkey, Uruguay, and Venezuela. Latin America and the Caribbean averages exclude Dominican Republic, Jamaica, and Trinidad and Tobago. Africa averages include Botwsana, Central African Republic, Congo, Egypt, Ghana, Kenya, Malawi, Mauritius, Morocco, Senegal, South Africa, Tanzania, Tunisia,
270
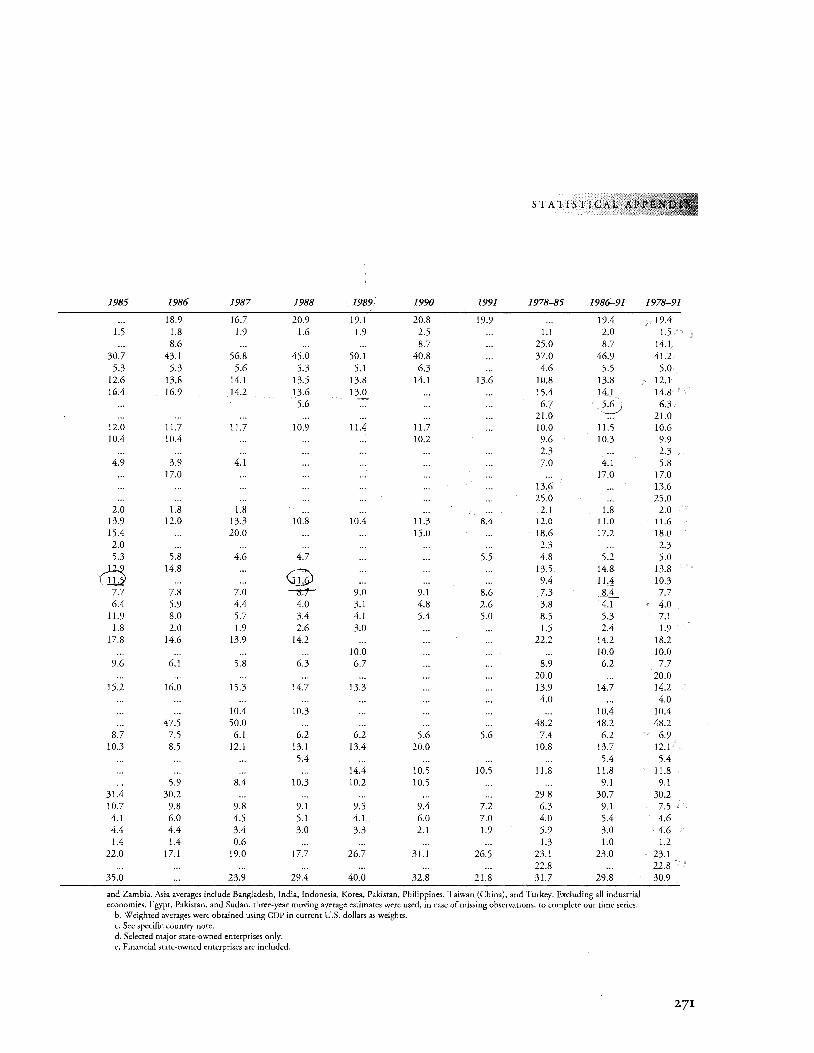
STATISTICAL A
1985 1986 1987 1988 1989. 1990 1991 1978-85 1986-91 1978-91
18.9 16.7 20.9 1CJ.1 20.8 19.9 ... 19.4 19.4 1.5 1.8 1.9 1.6 1.9 2.5 ... 1.1 2.0 1.5
8.6 ... . .. ... 8.7 ... 25.0 8.7 14.1 30.7 43.1 56.8 45.0 50.1 40.8 ... 37.0 46.9 41.2
5.3 5.3 5.6 5.3 5.1 6.3 ... 4.6 5.5 5.0 12.6 13.8 14.1 13.5 13.8 14.1 13.6 10.8 13.8 12.1 16.4 16.9 14.2 13.6 13.0 ... ... 15.4 14.1 14.8
5.6 ... ... ... 6.7 ,5:~_) 6.3 21.0 ... 21.0
12.0 11.7 11.7 10.9 11.4 11.7 ... 10.0 11.5 10.6 10.4 10.4 ... ... ... 10.2 9.6 10.3 9.9
2.3 ... 2.3 4.9 3.9 4.1 ... ... ... ... 7.0 4.1 5.8
17.0 ... ... ... ... 17.0 17.0 13.6 ... 13.6 25.0 ... 25.0
2.0 1.8 1.8 ... . .. ... ... 2.1 1.8 2.0 13.9 12.0 13.3 10.8 10.4 11.3 8.4 12.0 11.0 11.6 15.4 ... 20.0 ... ... 15.0 ... 18.6 17.2 18.0 2.0 ... ... ... ... . .. ... 2.3 2.3 5.3 5.8 4.6 4.7 ... ... 5.5 4.8 5.2 5.0
Q 14.8 ... Q
... ... . .. 13.5 14.8 13.8 ... ... ... ... .. . 9.4 11,1 10.3
7.7 7.8 7.0 --s:r· 9.0 9.1 8.6 7.3 S.d._ 7.7 6.4 5.9 4.4 4.0 3.1 4.8 2.6 3.8 4.1 4.0
11.9 8.0 5.7 3.4 4.1 5.4 5.0 8.5 5.3 7.1 1.8 2.0 1.9 2.6 3.0 ... ... 1.5 2.4 1.9
17.8 14.6 13.9 14.2 ... ... 22.2 14.2 18.2 10.0 ... ... ... 10.0 10.0
9.6 6.1 5.8 6.3 6.7 ... ... 8.9 6.2 7.7 20.0 ... 20.0
15.2 16.0 15.3 14.7 13.3 ... ... 13.9 14.7 14.2 4.0 ... 4.0
10.4 10.3 ... ... ... 10.4 10.4 47.5 50.0 ... ... ... ... 48.2 48.2 48.2
8.7 7.5 6.1 6.2 6.2 5.6 5.6 7.4 6.2 6.9 10.3 8.5 12.1 13.1 13.4 20.0 10.8 13.7 12.1
5.4 ... ... ... 5.4 5.4 14.4 10.5 10.5 11.8 11.8 11.8
5.9 8.4 10.3 10.2 10.5 ... . .. 9.1 9.1 31.4 30.2 ... ... . .. ... ... 29.8 30.7 30.2 10.7 9.8 9.8 9.1 9.5 9.4 7.2 6.3 9.1 7.5 4.1 6.0 4.5 5.1 4.1 6.0 7.0 4.0 5.4 4.6 4.4 4.4 3.4 3.0 3.3 2.1 1.9 5.9 3.0 4.6 1.4 1.4 0.6 ... ... ... . .. 1.3 1.0 1.2
22.0 17.1 19.0 17.7 26.7 31.1 26.5 23.1 23.0 23.1 22.8 ... 22.8
35.0 ... 23.9 29.4 40.0 32.8 21.8 31.7 29.8 30.9
and Zambia. Asia averages include Bangladesh, India, Indonesia, Korea, Pakistan, Philippines, Taiwan (China), and Turkey. Excluding all industrial economies, Egypt, Pakistan, and Sudan, three-year moving average estimates were used, in case of missing observations, to complete our time series.
b. Weighted averages were obtained using GDP in current U.S. dollars as weights. c. See specific country note. d. Selected major stare-owned enterprises only. e. Financial stare-owned enterprises are included.
271
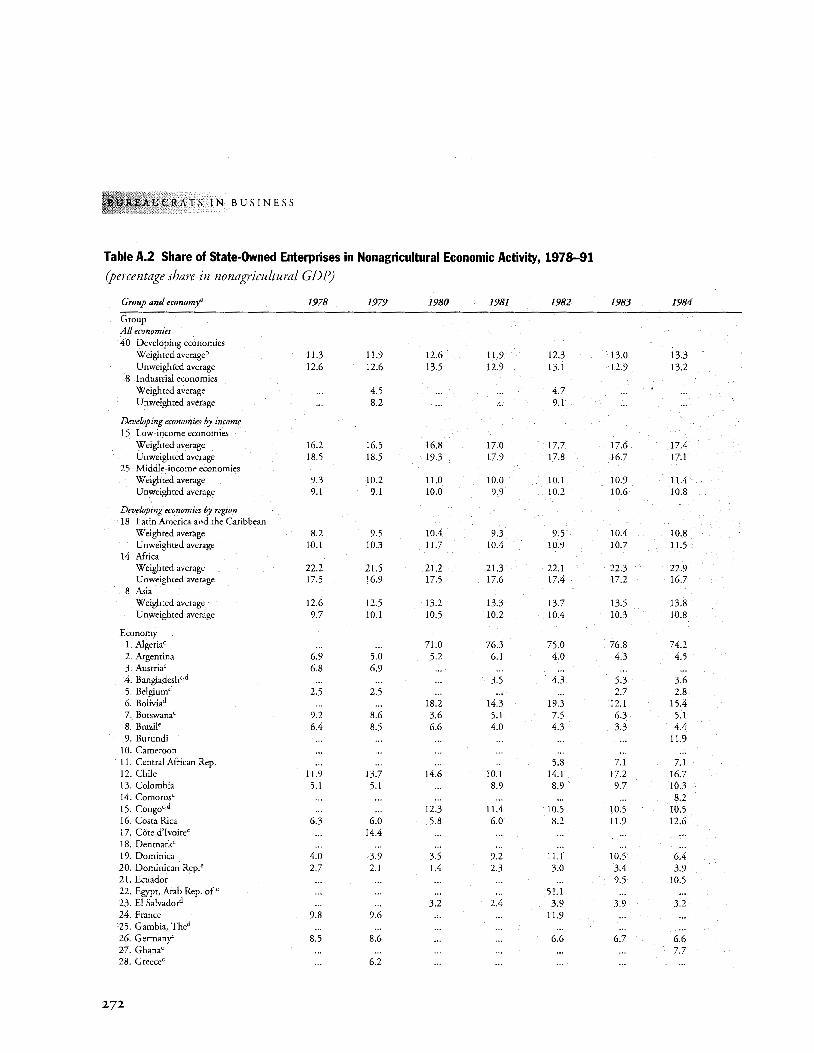
CRATS IN BUSINESS
Table A.2 Share of State-Owned Enterprises in Nonagricultural Economic Activity, 1978-91 (percentage share in nonagricultural GDP)
Group and economj' 1978 1979 1980 1981 1982 1983 1984
Group All economies 40 Developing economies
Weighted averageb 11.3 11.9 12.6 11.9 12.3 13.0 13.3 Unweighted average 12.6 12.6 13.5 12.9 13.1 12.9 13.2
8 Industrial economies Weigh ted average ... 4.5 ... ... 4.7 U nweighted average ... 8.2 ... ... 9.1
Developing economies by income 15 Low-income economies
Weighted average 16.2 16.5 16.8 17.0 17.7 17.6 17.4 Unweighted average 18.5 18.5 19.3 17.9 17.8 16.7 17.1
25 Middle-income economies Weigh ted average 9.3 10.2 11.0 10.0 10.1 10.9 11.4 Unweighted average 9.1 9.1 10.0 9.9 10.2 10.6 10.8
Developing economies by region 18 Latin America and the Caribbean
Weighted average 8.2 9.5 10.4 9.3 9.5 10.4 10.8 Unweighted average 10.1 10.3 11.7 10.4 10.9 10.7 11.5
14 Africa Weighted average 22.2 21.5 21.2 21.3 22.1 22.3 22.9 Unweighted average 17.5 16.9 17.5 17.6 17.4 17.2 16.7
8 Asia Weighted average 12.6 12.5 13.2 13.3 13.7 13.5 13.8 U nweighted average 9.7 10.1 10.5 10.2 10.4 10.3 10.8
Economy I. Algeria' ... ... 71.0 76.3 75.0 76.8 74.2 2. Argentina 6.9 5.0 5.2 6.1 4.0 4.3 4.5 3. Austria' 6.8 6.9 4. Bangladesh'•d ... . .. ... 3.5 4.3 5.3 3.6 5. Belgiumd 2.5 2.5 ... ... ... 2.7 2.8 6. Boliviad ... ... 18.2 14.3 19.3 12.1 15.4 7. Botswana' 9.2 8.6 3.6 5.1 7.5 6.3 5.1 8. Brazil' 6.4 8.5 6.6 4.0 4.3 3.3 4.4 9. Burundi ... ... ... . .. ... ... 11.9
10. Cameroon 11. Central African Rep. ... ... ... . .. 5.8 7.1 7.1 12. Chile 11.9 13.7 14.6 10.1 14.1 17.2 16.7 13. Colombia 5.1 5.1 ... 8.9 8.9 9.7 10.3 14. Comoros' ... ... ... . .. ... ... 8.2 15. Congo''d ... . .. 12.3 11.4 10.5 10.5 10.5 16. Costa Rica 6.3 6.0 5.8 6.0 8.2 11.9 12.6 17. Cote d'Ivoire' ... 14.4 18. Denmark' 19. Dominica 4.0 -3.9 3.5 9.2 11.1 10.5 6.4 20. Dominican Rep! 2.7 2.1 1.4 2.3 3.0 3.4 3.9 21. Ecuador ... ... . .. ... ... 9.5 10.5 22. Egypt, Arab Rep. of c ... ... ... ... 51.1 23. El Salvado~ ... ... 3.2 2.4 3.9 3.9 3.2 24. France 9.8 9.6 ... ... 11.9 25. Gambia, Thed 26. Germany' 8.5 8.6 ... ... 6.6 6.7 6.6 27. Ghana' ... ... ... .. . ... ... 7.7 28. Greece' ... 6.2
272
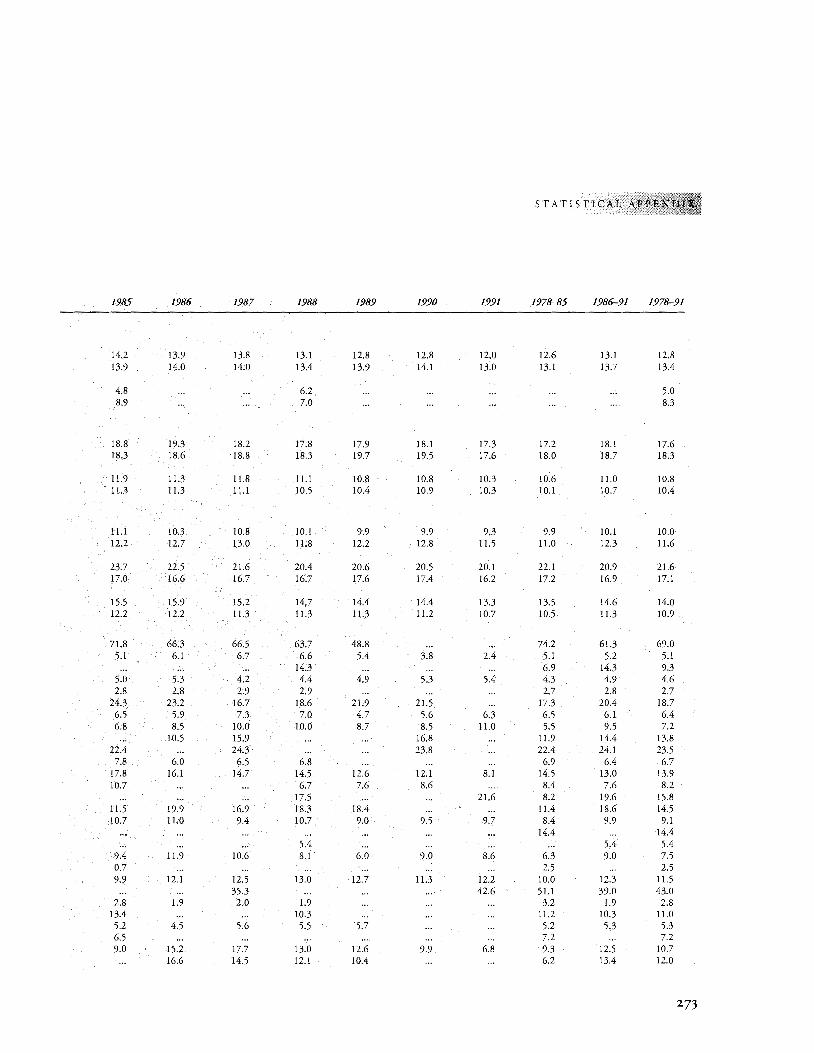
STATISTICAL AP
1985 1986 1987 1988 1989 1990 1991 1978--85 1986-91 1978-91
14.2 13.9 13.8 13.1 12.8 12.8 12.0 12.6 13.1 12.8 13.9 14.0 14.0 13.4 13.9 14.1 13.0 13.1 13.7 13.4
4.8 ... ... 6.2 ... ... ... ... .. . 5.0 8.9 ... ... 7.0 ... ... .. . ... ... 8.3
18.8 19.3 18.2 17.8 17.9 18.1 17.3 17.2 18.1 17.6 18.3 18.6 18.8 18.3 19.7 19.5 17.6 18.0 18.7 18.3
11.9 11.3 11.8 11.1 10.8 10.8 10.3 10.6 11.0 10.8 11.3 11.3 11.1 10.5 10.4 10.9 10.3 10.1 10.7 10.4
11.1 10.3 10.8 10.1 9.9 9.9 9.3 9.9 10.1 10.0 12.2 12.7 13.0 11.8 12.2 12.8 11.5 11.0 12.3 11.6
23.7 22.5 21.6 20.4 20.6 20.5 20.1 22.1 20.9 21.6 17.0 16.6 16.7 16.7 17.6 17.4 16.2 17.2 16.9 17.1
15.5 15.9 15.2 14.7 14.4 14.4 13.3 13.5 14.6 14.0 12.2 12.2 11.3 11.3 11.3 11.2 10.7 10.5 11.3 10.9
71.8 66.3 66.5 63.7 48.8 ... ... 74.2 61.3 69.0 5.1 6.1 6.7 6.6 5.4 3.8 2.4 5.1 5.2 5.1
14.3 ... ... .. . 6.9 14.3 9.3 5.0 5.3 4.2 4.4 4.9 5.3 5.4 4.3 4.9 4.6 2.8 2.8 2.9 2.9 ... ... .. . 2.7 2.8 2.7
24.3 23.2 16.7 18.6 21.9 21.5 ... 17.3 20.4 18.7 6.5 5.9 7.3 7.0 4.7 5.6 6.3 6.5 6.1 6.4 6.8 8.5 10.0 10.0 8.7 8.5 11.0 5.5 9.5 7.2
10.5 15.9 ... ... 16.8 ... 11.9 14.4 13.8 22.4 ... 24.3 ... ... 23.8 ... 22.4 24.1 23.5
7.8 6.0 6.5 6.8 ... ... ... 6.9 6.4 6.7 17.8 16.1 14.7 14.5 12.6 12.1 8.1 14.5 13.0 13.9 10.7 ... ... 6.7 7.6 8.6 .. . 8.4 7.6 8.2
17.5 ... 21.6 8.2 19.6 15.8 11.5 19.9 16.9 18.3 18.4 ... ... 11.4 18.6 14.5 10.7 11.0 9.4 10.7 9.0 9.5 9.7 8.4 9.9 9.1
14.4 14.4 5.4 ... ... ... ... 5.4 5.4
9.4 11.9 10.6 8.1 6.0 9.0 8.6 6.3 9.0 7.5 0.7 ... ... . .. ... ... 2.5 .. . 2.5 9.9 12.1 12.5 13.0 12.7 11.3 12.2 10.0 12.3 11.5
35.3 ... ... ... 42.6 51.1 39.0 43.0 2.8 1.9 2.0 1.9 ... ... ... 3.2 1.9 2.8
13.4 ... ... 10.3 ... .. . 11.2 10.3 11.0 5.2 4.5 5.6 5.5 5.7 ... ... 5.2 5.3 5.3 6.5 ... ... ... .. . ... ... 7.2 7.2 9.0 15.2 17.7 13.0 12.6 9.9 6.8 9.3 12.5 10.7
16.6 14.5 12.1 10.4 ... ... 6.2 13.4 12.0
273
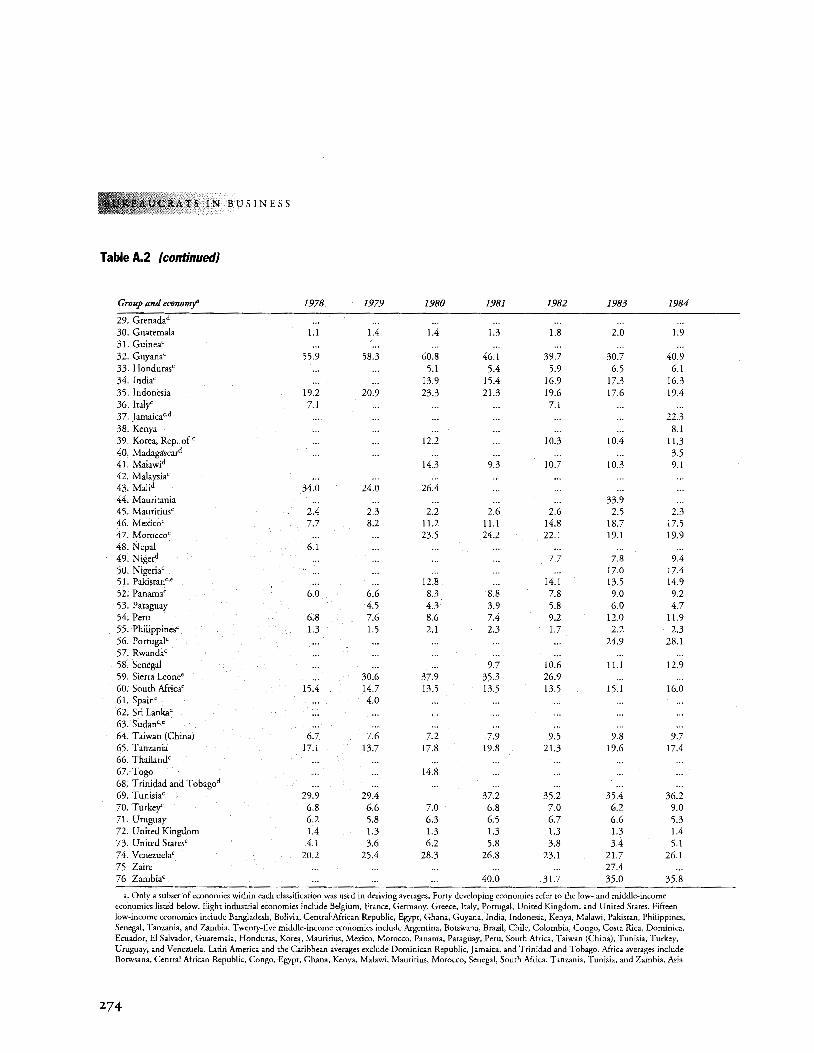
RATS IN BUSINESS
Table A.2 (continued}
Group and economj' 1978 1979 1980 1981 1982 1983 1984
29. Grenadad 30. Guatemala 1.1 1.4 1.4 1.3 1.8 2.0 1.9 31. Guinea' 32. Guyana' 55.9 58.3 60.8 46.1 39.7 30.7 40.9 33. Honduras' ... . .. 5.1 5.4 5.9 6.5 6.1 34. India' ... . .. 13.9 15.4 16.9 17.3 16.3 35. Indonesia 19.2 20.9 23.3 21.3 19.6 17.6 19.4 36. Italy' 7.1 ... ... ... 7.1 37. Jamaica'·d ... ... ... ... ... .. . 22.3 38. Kenya ... ... ... ... . .. ... 8.1 39. Korea, Rep. of' ... . .. 12.2 ... 10.3 10.4 11.3 40. Madagasca~ ... ... ... . .. . .. .. . 3.5 41. Malawid 14.3 9.3 10.7 10.3 9.1 42. Malaysia' 43. MaJid 34.0 24.0 26.4 44. Mauritania ... ... ... .. . . .. 33.9 45. Mauritius' 2.4 2.3 2.2 2.6 2.6 2.5 2.3 46. Mexico' 7.7 8.2 11.2 11.1 14.8 18.7 17.5 47. Morocco' ... . .. 23.5 24.2 22.1 19.1 19.9 48. Nepal 6.1 49. Nige~ ... ... ... 7.7 7.8 9.4 50. Nigeria' ... ... ... 17.0 17.4 51. Pakistan'·' ... ... 12.8 .. . 14.1 13.5 14.9 52. Panama' 6.0 6.6 8.3 8.8 7.8 9.0 9.2 53. Paraguay 4.5 4.3 3.9 5.8 6.0 4.7 54. Peru 6.8 7.6 8.6 7.4 9.2 12.0 11.9 55. Philippines' 1.3 1.5 2.1 2.3 1.7 2.2 2.3 56. Portugal' ... ... ... .. . ... 24.9 28.1 57. Rwanda' 58. Senegal ... ... ... 9.7 10.6 11.1 12.9 59. Sierra Leone' ... 30.6 37.9 35.3 26.9 60. South Africa' 15.4 14.7 13.5 13.5 13.5 15.1 16.0 61. Spain' ... 4.0 62. Sri Lanka' 63. Sudan'·' 64. Taiwan (China) 6.7 7.6 7.2 7.9 9.5 9.8 9.7 65. Tanzania 17.1 13.7 17.8 19.8 21.3 19.6 17.4 66. Thailand' 67. Togo ... ... 14.8 68. Trinidad and Tobagod ... ... .. . 69. Tunisia' 29.9 29.4 37.2 35.2 35.4 36.2 70. Turkey' 6.8 6.6 7.0 6.8 7.0 6.2 9.0 71. Uruguay 6.2 5.8 6.3 6.5 6.7 6.6 5.3 72. United Kingdom 1.4 1.3 1.3 1.3 1.3 1.3 1.4 73. United States' 4.1 3.6 6.2 5.8 3.8 3.4 5.1 74. Venezuela' 20.2 25.4 28.3 26.8 23.1 21.7 26.1 75 Zaire ... ... ... 27.4 76 Zambia' ... ... . .. 40.0 31.7 35.0 35.8
a. Only a subset of economies within each classification was used in deriving averages. Forty developing economies refer to the low- and middle-income economies listed below. Eight industrial economies include Belgium, France, Germany, Greece, Italy, Portugal, United Kingdom, and United States. Fifteen low-income economies include Bangladesh, Bolivia, Central African Republic, Egypt, Ghana, Guyana, India, Indonesia, Kenya, Malawi, Pakistan, Philippines, Senegal, Tanzania, and Zambia. Twenty-five middle-income economies include Argentina, Botswana, Brazil, Chile, Colombia, Congo, Costa Rica, Dominica, Ecuador, El Salvador, Guatemala, Honduras, Korea, Mauritius, Mexico, Morocco, Panama, Paraguay, Peru, South Mrica, Taiwan (China), Tunisia, Turkey, Uruguay, and Venezuela. Latin America and the Caribbean averages exclude Dominican Republic, Jamaica, and Trinidad and Tobago. Africa averages include Borwsana, Central Mrican Republic, Congo, Egypt, Ghana, Kenya, Malawi, Mauritius, Morocco, Senegal, South Mrica, Tanzania, Tunisia, and Zambia. Asia
274
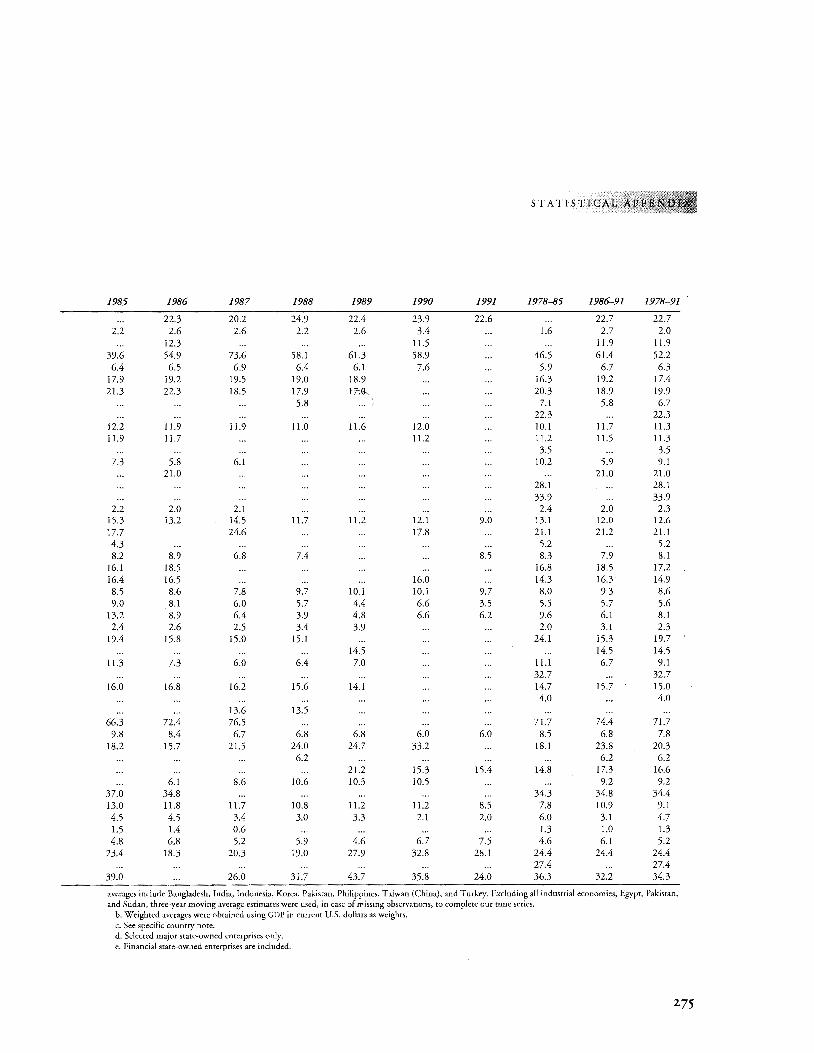
STATISTICAL APP
1985 1986 1987 1988 1989 1990 1991 1978--85 1986-91 1978-91
22.3 20.2 24.9 22.4 23.9 22.6 ... 22.7 22.7 2.2 2.6 2.6 2.2 2.6 3.4 ... 1.6 2.7 2.0
12.3 ... . .. . .. 11.5 . .. ... 11.9 11.9 39.6 54.9 73.6 58.1 61.3 58.9 ... 46.5 61.4 52.2
6.4 6.5 6.9 6.4 6.1 7.6 ... 5.9 6.7 6.3 17.9 19.2 19.5 19.0 18.9 ... . .. 16.3 19.2 17.4 21.3 22.3 18.5 17.9 17.0 ... ... 20.3 18.9 19.9
5.8 ... ... 7.1 5.8 6.7 22.3 ... 22.3
12.2 11.9 11.9 11.0 11.6 12.0 ... 10.1 11.7 11.3 11.9 11.7 ... ... ... 11.2 ... 11.2 11.5 11.3
3.5 3.5 7.3 5.8 6.1 ... ... ... .. . 10.2 5.9 9.1
21.0 ... ... ... ... 21.0 21.0 28.1 ... 28.1 33.9 33.9
2.2 2.0 2.1 ... ... 2.4 2.0 2.3 15.3 13.2 14.5 11.7 11.2 12.1 9.0 13.1 12.0 12.6 17.7 24.6 17.8 ... 21.1 21.2 21.1 4.3 ... ... ... ... .. . ... 5.2 .. . 5.2 8.2 8.9 6.8 7.4 ... ... 8.5 8.3 7.9 8.1
16.1 18.5 ... ... ... .. . 16.8 18.5 17.2 16.4 16.5 ... ... ... 16.0 14.3 16.3 14.9 8.5 8.6 7.8 9.7 10.1 10.1 9.7 8.0 9.3 8.6 9.0 8.1 6.0 5.7 4.4 6.6 3.5 5.5 5.7 5.6
13.2 8.9 6.4 3.9 4.8 6.6 6.2 9.6 6.1 8.1 2.4 2.6 2.5 3.4 3.9 ... ... 2.0 3.1 2.3
19.4 15.8 15.0 15.1 ... 24.1 15.3 19.7 14.5 ... ... 14.5 14.5
11.3 7.3 6.0 6.4 7.0 ... ... 11.1 6.7 9.1 32.7 ... 32.7
16.0 16.8 16.2 15.6 14.1 ... ... 14.7 15.7 15.0 4.0 ... 4.0
13.6 13.5 ... ... ... ... ... 66.3 72.4 76.5 ... ... ... 71.7 74.4 71.7
9.8 8.4 6.7 6.8 6.8 6.0 6.0 8.5 6.8 7.8 18.2 15.7 21.5 24.0 24.7 33.2 ... 18.1 23.8 20.3
6.2 ... ... ... .. . 6.2 6.2 21.2 15.3 15.4 14.8 17.3 16.6
6.1 8.6 10.6 10.3 10.5 ... ... 9.2 9.2 37.0 34.8 ... ... ... 34.3 34.8 34.4 13.0 11.8 11.7 10.8 11.2 11.2 8.5 7.8 10.9 9.1 4.5 4.5 3.4 3.0 3.3 2.1 2.0 6.0 3.1 4.7 1.5 1.4 0.6 ... ... ... ... 1.3 1.0 1.3 4.8 6.8 5.2 5.9 4.6 6.7 7.5 4.6 6.1 5.2
23.4 18.3 20.3 19.0 27.9 32.8 28.1 24.4 24.4 24.4 27.4 ... 27.4
39.0 ... 26.0 31.7 43.7 35.8 24.0 36.3 32.2 34.3
averages include Bangladesh, India, Indonesia, Korea, Pakistan, Philippines, Taiwan (China), and Turkey. Excluding all industrial economies, Egypt, Pakistan, and Sudan, three-year moving average estimates were used, in case of missing observations, to complete our time series.
b. Weighted averages were obtained using GOP in current U.S. dollars as weights. c. See specific country note. d. Selected major state-owned enterprises only. e. Financial state-owned enterprises are included.
275
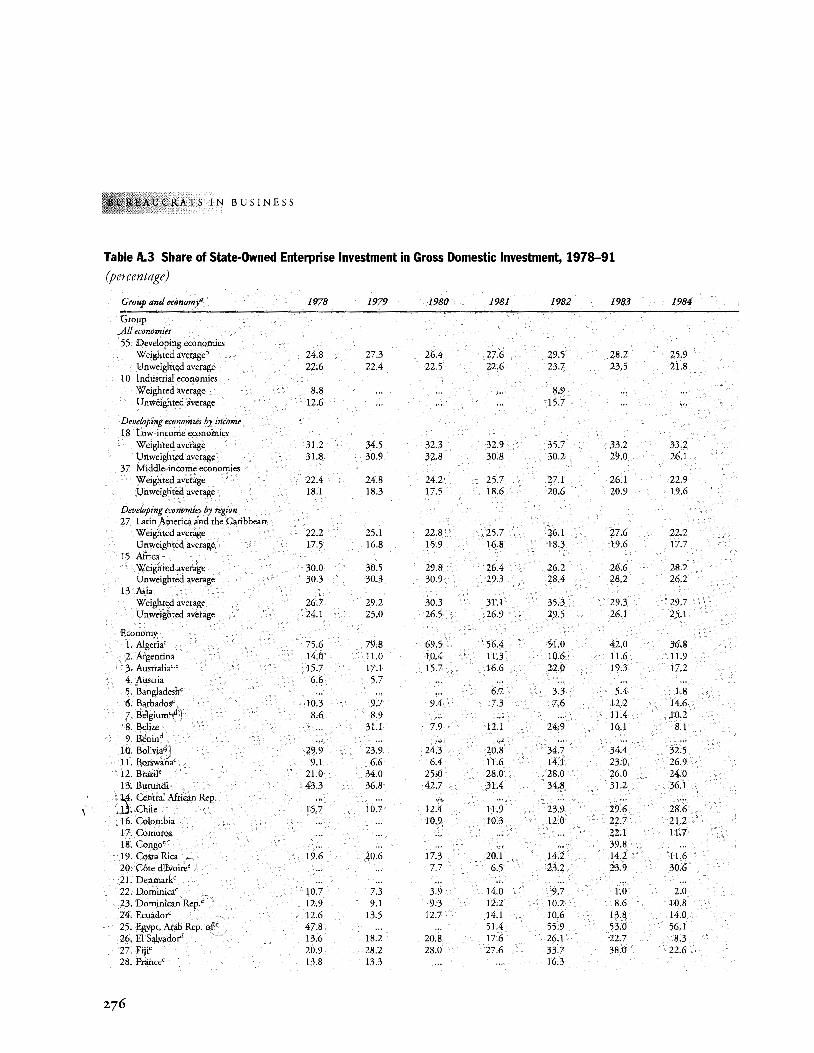
RATS IN BUSINESS
Table A.3 Share of State-Owned Enterprise Investment in Gross Domestic Investment, 1978-91
(percentage)
Group and economj' 1978 1979 1980 1981 1982 1983 1984
Group All economies 55 Developing economies
Weighted averageb 24.8 27.3 26.4 27.6 29.5 28.2 25.9 Unweighted average 22.6 22.4 22.5 22.6 23.7 23.5 21.8
10 Industrial economies Weighted average 8.8 ... ... .. . 8.9 U nweighted average 12.6 ... ... .. . 15.7
Developing economies by income 18 Low-income economies
Weighted average 31.2 34.5 32.3 32.9 35.7 33.2 33.2 U nweigh ted average 31.8 30.9 32.8 30.8 30.2 29.0 26.1
37 Middle-income economies Weighted average 22.4 24.8 24.2 25.7 27.1 26.1 22.9 Unweighted average 18.1 18.3 17.5 18.6 2o.6 20.9 19.6
Developing economies by region 27 Latin America and the Caribbean
Weighted average 22.2 25.1 22.8 25.7 26.1 27.6 22.2 Unweighted average 17.5 16.8 15.9 16.8 18.3 19.6 17.7
15 Africa Weighted average 30.0 30.5 29.8 26.4 26.2 26.6 28.2 Unweighted average 30.3 30.3 30.9 29.3 28.4 28.2 26.2
13 Asia Weighted average 26.7 29.2 30.3 31.1 35.3 29.3 29.7 Unweighted average 24.1 25.0 26.5 26.9 29.5 26.1 25.1
Economy l. Algeria< 75.6 79.8 69.5 56.4 5!.0 42.0 36.8 2. Argentina 14.0 11.0 10.4 11.3 10.6 11.6 11.9 .}. Australia'·' 15.7 17.1 15.7 16.6 22.0 19.3 17.2 4. Austria 6.6 5.7 5. ·Bangladesh' ... . .. . .. 6.7 3.3 5.4 1.8 6. Barbadosd ' 10.3 9.7 9.4 7.3 7.6 12.2 14.6 7. Belgium~) 8.6 8.9 ... . .. ... 11.4 10.2 8. Belize ... 3Ll 7.9 12.1 24.9 16.1 8.1 9. Benind ... . .. ... ... ... .. . ...
10. Boliviad : 29.9 23.9 24.3 20.8 34.7 34.4 32.5 1 I. Botswaii'ac 9.1 6.6 6.4 11.6 14.1 23.0 26.9 12. Brazil' 21.0 34.0 25.0 28.0 28.0 26.0 24.0 13. Burundi 43.3 36.8 42.7 31.4 34.8 31.2 36.1
. ~· Central African Rep. ',1 , Chile 15.7 10.7 12.4 11.9 23.9 29.6 28.6
16. Colombia ... ... 10.9 10.3 12.0 22.7 21.2 17. Comoros ... ... ... ... .. . 22.1 11.7 18. Congo' ... ... ... ... . .. 39.8 19. Costa Rica 19.6 20.6 17.3 20.1 14.2 14.2 11.6 20. Cote d'Ivoite') ... . .. 7.7 6.5 23.2 23.9 30.6 21. Denmark' 22. Dominica' 10.7 7.3 3.9 14.0 9.7 1.0 2.0 23. Dominican Rep.' 12.9 9.1 9.3 12.2 10.2 8.6 10.8 24. Ecuador 12.6 13.5 12.7 14.1 10.6 13.8 14.0 25. Egypt, Arab Rep. of' 47.8 ... ... 51.4 55.9 53.0 56.1 26. El Salvadord 13.6 18.2 20.8 17.6 26.1 22.7 8.3 27. Fiji' 20.9 28.2 28.0 27.6 33.7 38.0 22.6 28. France' 13.8 13.3 ... . .. 16.3
276
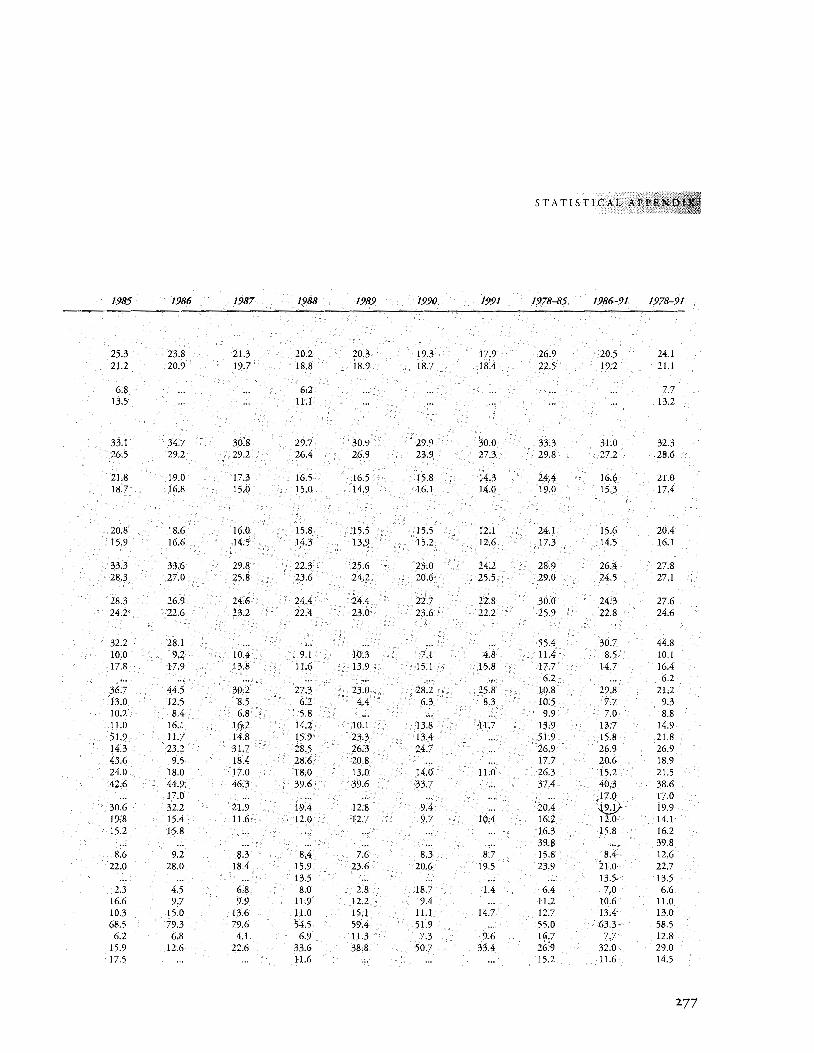
STATISTICAL APPEN
1985 1986 1987 1988 1989 1990 1991 1978-85 1986-91 1978-91
25.3 23.8 21.3 20.2 20.3 19.3 17.9 26.9 20.5 24.1 21.2 20.9 19.7 18.8 18.9 18.7 18.4 22.5 19.2 21.1
6.8 ... . .. 6.2 ... ... . .. .. . ... 7.7 13.5 ... ... 11.1 ... ... ... ... ... 13.2
33.1 34.7 30.8 29.7 30.9 29.9 30.0 33.3 31.0 32.3 26.5 29.2 29.2 26.4 26.9 23.9 27.3 29.8 27.2 28.6
21.8 19.0 17.3 16.5 16.5 15.8 14.3 24.4 16.6 21.0 18.7 16.8 15.0 15.0 14.9 16.1 14.0 19.0 15.3 17.4
20.8 18.6 16.0 15.8 15.5 15.5 12.1 24.1 15.6 20.4 15.9 16.6 14.5 14.3 13.9 15.2 12.6 17.3 14.5 16.1
33.3 33.6 29.8 22.3 25.6 23.0 24.2 28.9 26.4 27.8 28.3 27.0 25.8 23.6 24.2 20.6 25.5 29.0 24.5 27.1
28.3 26.9 24.6 24.4 24.4 22.7 22.8 30.0 24.3 27.6 24.2 22.6 23.2 22.4 23.0 23.6 22.2 25.9 22.8 24.6
32.2 28.1 ... ... . .. ... .. . 55.4 30.7 44.8 10.0 9.2 10.4 9.1 10.3 7.1 4.8 11.4 8.5 10.1 17.8 17.9 13.8 11.6 13.9 15.1 15.8 17.7 14.7 16.4
6.2 ... 6.2 36.7 44.5 30.2 27.3 23.0 28.2 25.8 10.8 29.8 21.2 13.0 12.5 8.5 6.2 4.4 6.3 8.3 10.5 7.7 9.3 10.2 8.4 6.8 5.8 ... ... ... 9.9 7.0 8.8 11.0 16.1 16.2 14.2 10.1 13.8 11.7 15.9 13.7 14.9 51.9 11.7 14.8 15.9 23.3 13.4 ... 51.9 15.8 21.8 14.3 23.2 31.7 28.5 26.3 24.7 ... 26.9 26.9 26.9 43.6 9.5 18.4 28.6 20.8 ... ... 17.7 20.6 18.9 24.0 18.0 17.0 18.0 13.0 14.0 11.0 26.3 15.2 21.5 42.6 44.9 46.3 39.6 39.6 33.7 ... 37.4 40.3 38.6
17.0 ... ... ... ... .. . ...
·~ 17.0
30.6 32.2 21.9 19.4 12.8 9.4 ... 20.4 9.1 . 19.9 19.8 15.4 11.6 12.0 12.7 9.7 10.4 16.2 12.0· 14.1 15.2 15.8 ... ... ... ... ... 16.3 15.8 16.2
39.8 ··~ ~ 39.8 8.6 9.2 8.3 8.4 7.6 8.3 8.7 15.8 8.4· 12.6
22.0 28.0 18.4 15.9 23.6 20.6 19.5 23.9 21.0· 22.7 13.5 ... ... .. . ... 13.> 13.5
2.3 4.5 6.8 8.0 2.8 18.7 1.4 6.4 7.0 6.6 16.6 9.7 9.9 11.9 12.2 9.4 ... 11.2 10.6· 11.0 10.3 15.0 13.6 11.0 15.1 11.1 14.7 12.7 13.4- 13.0 68.5 79.3 79.6 54.5 59.4 51.9 ... 55.0 63.3· 58.5
6.2 6.8 4.1 6.9 11.3 7.3 9.6 16.7 7.7· 12.8 15.9 12.6 22.6 33.6 38.8 50.7 33.4 26.9 32.0' 29.0 17.5 ... . .. 11.6 . .. ... .. . 15.2 11.6. 14.5
277
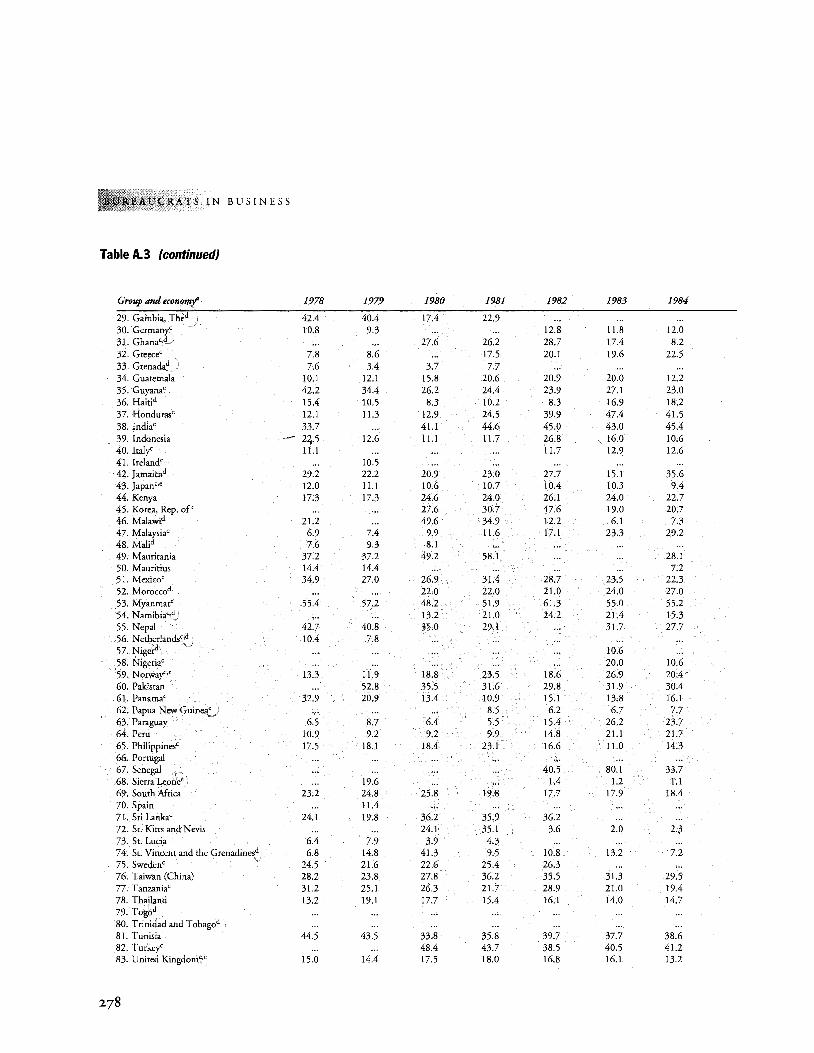
I,JCRATS IN BUSINESS
Table A.3 (continued)
Group and econom.j' 1978 1979 1980 1981 1982 1983 1984
29. Gambia, Th,d 42.4 40.4 17.4 22.9 30. German:f 10.8 9.3 ... ... 12.8 11.8 12.0 31. Ghana<4.) ... ... 27.6 26.2 28.7 17.4 8.2 32. Greece< . 7.8 8.6 ... 17.5 20.1 19.6 22.5 33. Grenadad) 7.6 3.4 3.7 7.7 34. Guatemala 10.1 12.1 15.8 20.6 20.9 20.0 12.2 35. Guyanac 42.2 34.4 26.2 24.4 23.9 27.1 23.0 36. Haitid 15.4 10.5 8.3 10.2 8.3 16.9 18.2 37. Hondurasc 12.1 11.3 12.9 24.5 39.9 47.4 41.5 38. Indiac 33.7 ... 41.1 44.6 45.0 43.0 45.4 39. Indonesia •. - 2~.5 12.6 11.1 11.7 26.8 \ 16.0 10.6 40. Italy< 11.1 ... . .. ... 11.7 12.9 12.6 41. lrelandc ... 10.5 42. JamaicaL' 29.2 22.2 20.9 23.0 27.7 15.1 35.6 43. Japanc,e 12.0 11.1 10.6 10.7 10.4 10.3 9.4 44. Kenya 17.3 17.3 24.6 24.0 26.1 24.0 22.7 45. Korea, Rep. ofc ... ... 27.6 30.7 47.6 19.0 20.7 46. Malawid 21.2 ... 49.6 34.9 12.2 6.1 7.3 4 7. Malaysiac 6.9 7.4 9.9 I !.6 17.1 23.3 29.2 48. MaJid 7.6 9.3 8.1 49. Mauritania 37.2 37.2 49.2 58.1 ... ... 28.1 50. Mauritius 14.4 14.4 ... ... ... 7.2 51. Mexicoc 34.9 27.0 26.9 31.4 28.7 23.5 22.3 52. Moroccod ... ... 22.0 22.0 21.0 24.0 27.0 53. Myanmar' 55.4 57.2 48.2 51.9 61.3 55.0 55.2 54. Namibia<.~.' ... ... 13.2 21.0 24.2 21.4 15.3 55. Nepal 42.7 40.8 35.0 29.1 ... 31.7 27.7 56. Netherlands< .. d . 10.4 7.8 57. Nigerd · ... ... ... ... .. . 10.6 58. Nigeria< ... ... ... ... .. . 20.0 10.6 59. Norway<•' 13.3 11.9 18.8 23.5 18.6 26.9 20.4 60. Pakistan ... 52.8 35.5 31.6 29.8 31.9 30.4 61. Panamac 32.9 20.9 13.4 10.9 15.1 13.8 16.1 62. Papua New Guinea' ... ... .. . 8.5 6.2 6.7 7.7 63. Paraguay 6.5 8.7 6.4 5.5 15.4 26.2 23.7 64. Peru 10.9 9.2 9.2 9.9 14.8 21.1 21.7 65. Philippinesc 17.5 18.1 18.4 23.1 16.6 11.0 14.3 66. Portugal 67. Senegal ... ... ... .. . 40.5 80.1 33.7 68. Sierra Leon<:''; ... 19.6 ... ... 1.4 1.2 1.1 69. South Mrica 23.2 24.8 25.8 19.8 17.7 17.9 18.4 70. Spain ... 11.4 71. Sri Lankac 24,1 19.8 36.2 35.9 36.2 72. St. Kitts and Nevis ... ... 24.1 35.1 3.6 2.0 2.3 73. St. Lucia 6.4 7.9 3.9 4.3 74. St. Vincent and the Grenadinesd 6.8 14.8 41.3 9.5 10.8 13.2 7.2 75. Sweden< 24.5 21.6 22.6 25.4 26.3 76. Taiwan (China) 28.2 23.8 27.8 36.2 35.5 31.3 29.5 77. Tanzaniac 31.2 25.1 26.3 21.7 28.9 21.0 19.4 78. Thailand 13.2 19.1 17.7 15.4 16.1 14.0 14.7 79. Togod 80. Trinidad and Tobagod 81. Tunisia 44.5 43.5 33.8 35.8 39.7 37.7 38.6 82. Turkey< ... ... 48.4 43.7 38.5 40.5 41.2 83. United Kingdomc,e 15.0 14.4 17.5 18.0 16.8 16.1 13.2
278
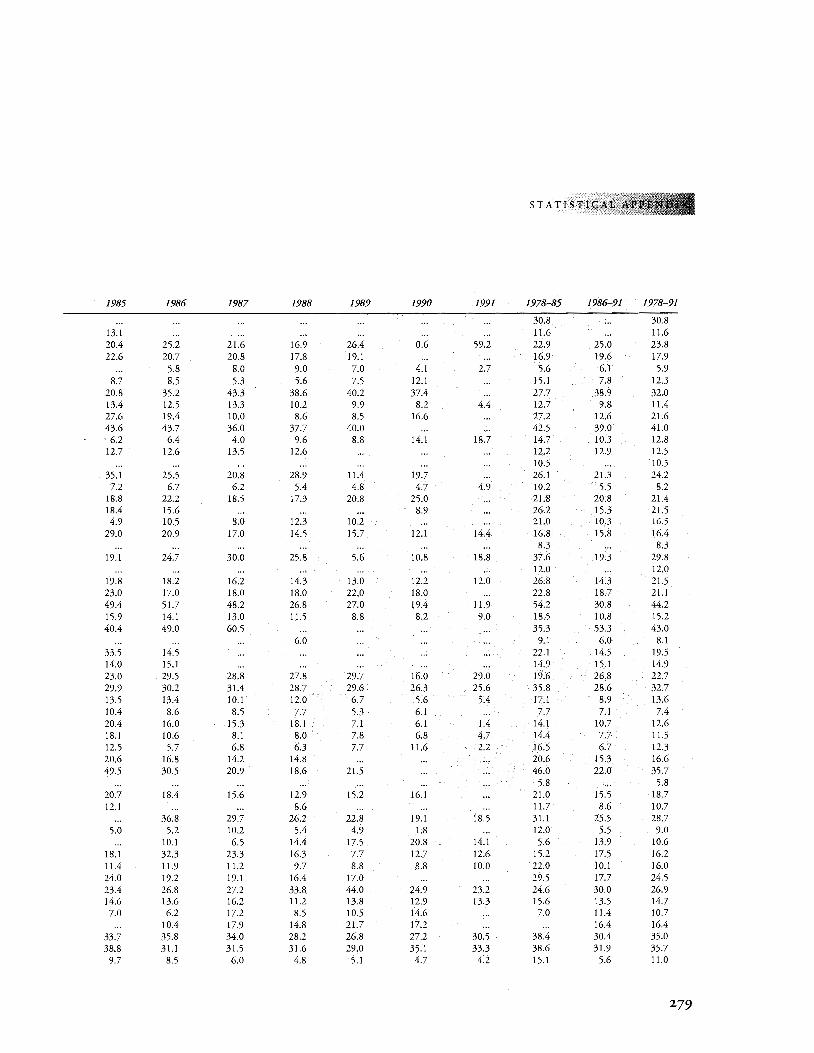
STATISTICA
1985 1986 1987 1988 1989 1990 1991 1978-85 1986-91 1978-91
30.8 ... 30.8 13.1 ... ... ... ... ... ... 11.6 .. . 11.6 20.4 25.2 21.6 16.9 26.4 0.6 59.2 22.9 25.0 23.8 22.6 20.7 20.8 17.8 19.1 ... ... 16.9 19.6 17.9
5.8 8.0 9.0 7.0 4.1 2.7 5.6 6.1 5.9 8.7 8.5 5.3 5.6 7.5 12.1 ... 15.1 7.8 12.3
20.8 35.2 43.3 38.6 40.2 37.4 ... 27.7 38.9 32.0 13.4 12.5 13.3 10.2 9.9 8.2 4.4 12.7 9.8 11.4 27.6 19.4 10.0 8.6 8.5 16.6 ... 27.2 12.6 21.6 43.6 43.7 36.0 37.7 40.0 ... ... 42.5 39.0 41.0
6.2 6.4 4.0 9.6 8.8 14.1 18.7 14.7 10.3 12.8 12.7 12.6 13.5 12.6 ... ... . .. 12.2 12.9 12.5
10.5 ... 10.5 35.1 25.5 20.8 28.9 11.4 19.7 ... 26.1 21.3 24.2 7.2 6.7 6.2 5.4 4.8 4.7 4.9 10.2 5.5 8.2
18.8 22.2 18.5 17.3 20.8 25.0 ... 21.8 20.8 21.4 18.4 15.6 ... ... 8.9 ... 26.2 15.3 21.5 4.9 10.5 8.0 12.3 10.2 ... ... 21.0 10.3 16.5
29.0 20.9 17.0 14.5 15.7 12.1 14.4 16.8 15.8 16.4 8.3 ... 8.3
19.1 24.7 30.0 25.8 5.6 10.8 18.8 37.6 19.3 29.8 12.0 12.0
19.8 18.2 16.2 14.3 13.0 12.2 12.0 26.8 14.3 21.5 23.0 17.0 18.0 18.0 22.0 18.0 ... 22.8 18.7 21.1 49.4 51.7 48.2 26.8 27.0 19.4 11.9 54.2 30.8 44.2 15.9 14.1 13.0 11.5 8.8 8.2 9.0 18.5 10.8 15.2 40.4 49.0 60.5 ... ... .. . ... 35.3 53.3 43.0
6.0 ... ... .. . 9.1 6.0 8.1 33.5 14.5 ... ... ... ... .. . 22.1 14.5 19.5 14.0 15.1 ... ... ... ... .. . 14.9 15.1 14.9 23.0 29.5 28.8 27.8 29.7 16.0 29.0 19.6 26.8 22.7 29.9 30.2 31.4 28.7 29.6 26.3 25.6 35.8 28.6 32.7 13.5 13.4 10.1 12.0 6.7 5.6 5.4 17.1 8.9 13.6 10.4 8.6 8.5 7.7 5.3 6.1 ... 7.7 7.1 7.4 20.4 16.0 15.3 18.1 7.1 6.1 1.4 14.1 10.7 12.6 18.1 10.6 8.1 8.0 7.8 6.8 4.7 14.4 7.7 11.5 12.5 5.7 6.8 6.3 7.7 11.6 2.2 16.5 6.7 12.3 20.6 16.8 14.2 14.8 ... ... .. . 20.6 15.3 16.6 49.5 30.5 20.9 18.6 21.5 ... ... 46.0 22.0 35.7
5.8 ... 5.8 20.7 18.4 15.6 12.9 15.2 16.1 ... 21.0 15.5 18.7 12.1 ... ... 8.6 ... . .. ... 11.7 8.6 10.7
36.8 29.7 26.2 22.8 19.1 18.5 31.1 25.5 28.7 5.0 5.2 10.2 5.4 4.9 1.8 12.0 5.5 9.0
10.1 6.5 14.4 17.5 20.8 14.1 5.6 13.9 10.6 18.1 32.3 23.3 16.3 7.7 12.7 12.6 15.2 17.5 16.2 11.4 11.9 11.2 9.7 8.8 8.8 10.0 22.0 10.1 16.0 24.0 19.2 19.1 16.4 17.0 ... ... 29.5 17.7 24.5 23.4 26.8 27.2 33.8 44.0 24.9 23.2 24.6 30.0 26.9 14.6 13.6 16.2 11.2 13.8 12.9 13.3 15.6 13.5 14.7 7.0 6.2 17.2 8.5 10.5 14.6 ... 7.0 11.4 10.7
10.4 17.9 14.8 21.7 17.2 ... 16.4 16.4 33.7 35.8 34.0 28.2 26.8 27.2 30.5 38.4 30.4 35.0 38.8 31.1 31.5 31.6 29.0 35.1 33.3 38.6 31.9 35.7
9.7 8.5 6.0 4.8 5.1 4.7 4.2 15.1 5.6 11.0
279
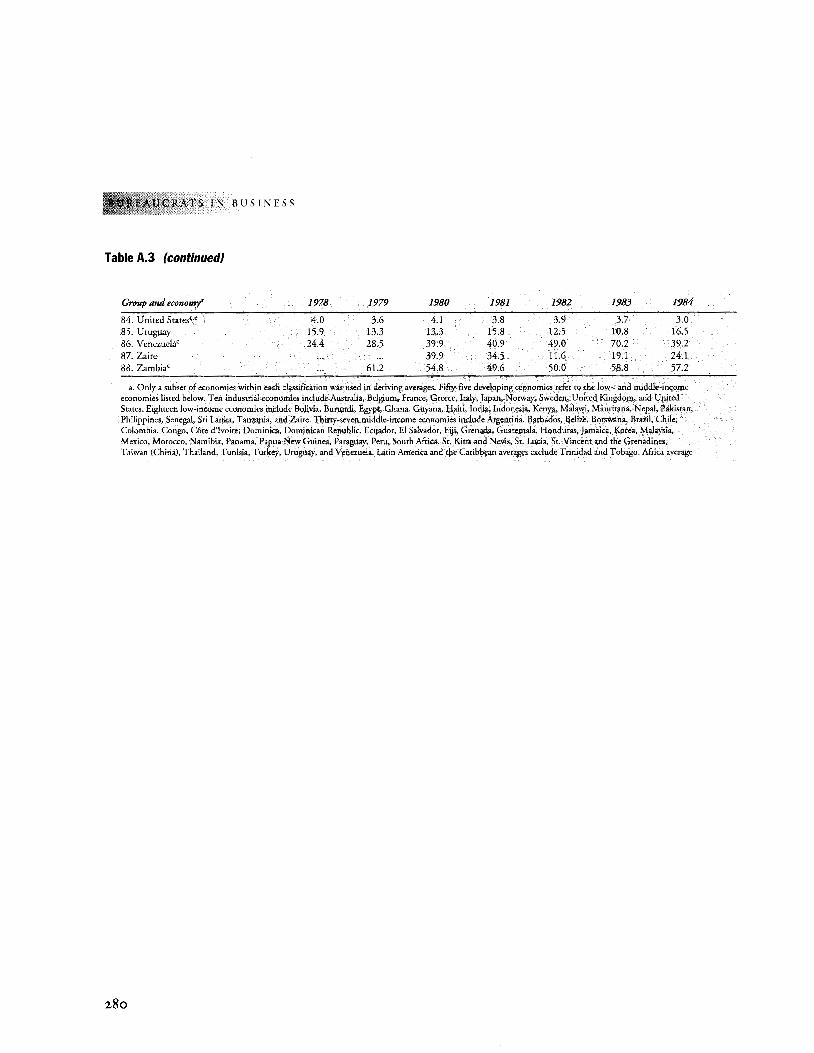
SIN BUSINESS
Table A.3 (continued}
Group and economj' 1978 1979 1980 1981 1982 1983 1984
84. United States~:: · 4.0 3.6 4.1 3.8 3.9 3.7 3.0 85. Uruguay 15.9 13.3 13.3 15.8 12.5 10.8 16.5 86. Venezuela' 24.4 28.5 39.9 40.9 49.0 70.2 39.2 87. Zaire ... ... 39.9 34.5 11.6 19.1 24.1 88. Zambia' ... 61.2 54.8 49.6 50.0 58.8 57.2
a. Only a subset of economies within each classification was used in deriving averages. Fifiy-five developing economies refer to the low- and middle-income economies listed below. Ten industrial economies include Australia, Belgium, France, Greece, Italy, Japan, Norway, Sweden, United Kingdom, and United States. Eighteen low-income economies include Bolivia, Burundi, Egypt, Ghana, Guyana, Haiti, India, Indonesia, Kenya, Malawi, Mauritana, Nepal, Paltistan, Philippines, Senegal, Sri Lanka, Tanzania, and Zaire. Thirty-seven middle-income economies include Argentina, Barbados, Belize, Botswana, Brazil, Chile, Colombia, Congo, COte d'Ivoire, Dominica, Dominican Republic, Ecuador, El Salvador, Fiji, Grenada, Guatemala, Honduras, Jamaica, Korea, Malaysia, Mexico, Morocco, Namibia, Panama, Papua New Guinea, Paraguay, Peru, South Mrica, St. Kitts and Nevis, Sr. Lucia, St. Vincent and the Grenadines, Taiwan (China), Thailand, Tunisia, Turkey, Uruguay, and Venezuela. Latin America and tbe Caribbean averages exclude Trinidad and Tobago. Africa average
280
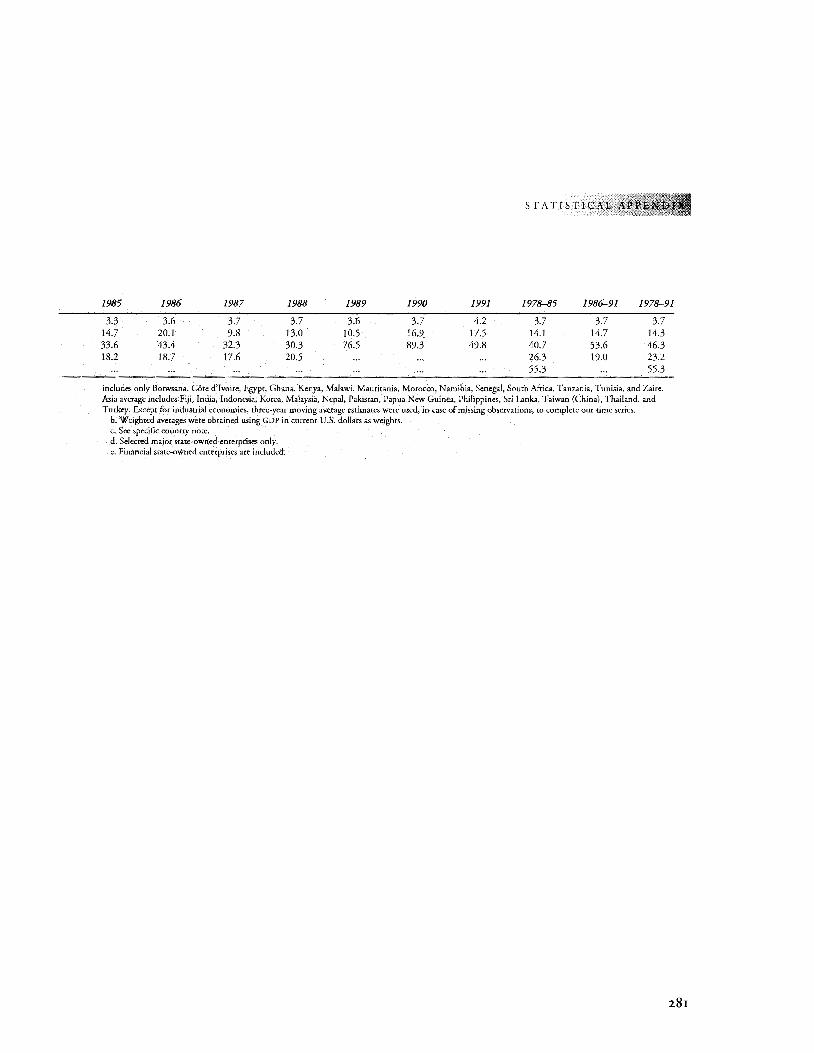
STATISTICAL
1985 1986 1987 1988 1989 1990 1991 1978--85 1986-91 1978-91
3.3 3.6 3.7 3.7 3.6 3.7 4.2 3.7 3.7 3.7 I4.7 20.1 9.8 13.0 10.5 16.9 17.5 14.1 14.7 14.3 33.6 43.4 32.3 30.3 76.5 89.3 49.8 40.7 53.6 46.3 18.2 18.7 17.6 20.5 ... . .. . .. 26.3 19.0 23.2
55.3 ... 55.3
includes only Botwsana, Cote d'Ivoire, Egypt, Ghana, Kenya, Malawi, Mauritania, Morocco, Namibia, Senegal, South Africa, Tanzania, Tunisia, and Zaire. Asia average includes Fiji, India, Indonesia, Korea, Malaysia, Nepal, Pakistan, Papua New Guinea, Philippines, Sri Lanka, Taiwan (China), Thailand, and Turkey. Except for industrial economies, three~year moving average estimates were used, in case of missing observations, to complete our time series.
b. Weighted averages were obtained using GDP in current U.S. dollars as weights. c. See specific country note. d. Selected major state~owned enterprises only. e. Financial state-owned enterprises are included.
281
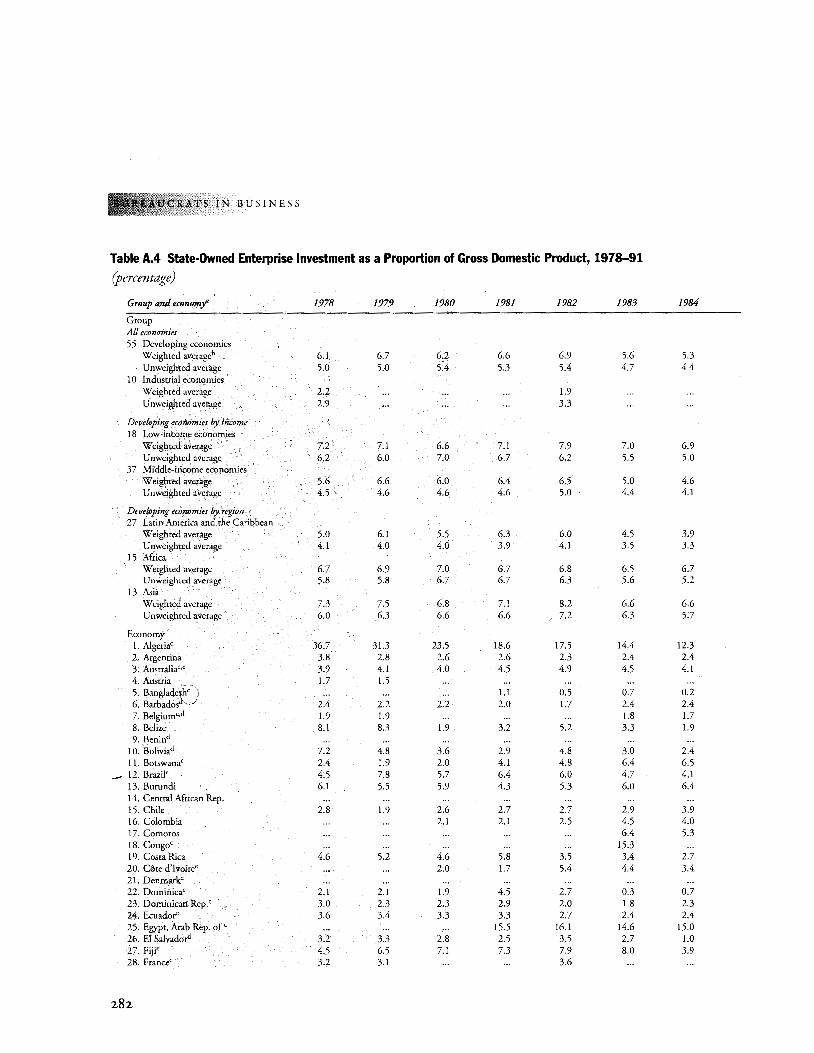
TS IN BUSINESS
Table A.4 State-Owned Enterprise Investment as a Proportion of Gross Domestic Product, 1978-91
(percentage)
Group and economj' 1978 1979 1980 1981 1982 1983 1984
Group All economies 55 Developing economies
Weighted averageb 6.1 6.7 6.2 6.6 6.9 5.6 5.3 U nweighted average 5.0 5.0 5.4 5.3 5.4 4.7 4.4
10 Industrial economies Weighted average 2.2 ... ... ... 1.9 Unweighted average 2.9 ... . .. . .. 3.3
Developing economies by income 18 Low-income economies
Weighted average 7.2 7.1 6.6 7.1 7.9 7.0 6.9 U nweighted average 6.2 6.0 7.0 6.7 6.2 5.5 5.0
37 Middle-income economies Weighted average 5.6 6.6 6.0 6.4 6.5 5.0 4.6 Unweighted average 4.5 4.6 4.6 4.6 5.0 4.4 4.1
Developing economies by region 27 Latin America and the Caribbean
Weighted average 5.0 6.1 5.5 6.3 6.0 4.5 3.9 Unweighred average 4.1 4.0 4.0 3.9 4.1 3.5 3.3
15 Mrica Weighted average 6.7 6.9 7.0 6.7 6.8 6.5 6.7 U nweighted average 5.8 5.8 6.7 6.7 6.3 5.6 5.2
13 Asia Weighted average 7.3 7.5 6.8 7.1 8.2 6.6 6.6 Unweighted average 6.0 6.3 6.6 6.6 7.2 6.3 5.7
Economy 1. Algeria' 36.7 31.3 23.5 18.6 17.5 14.4 12.3 2. Argentina 3.8 2.8 2.6 2.6 2.3 2.4 2.4 3. Ausrralia'·e 3.9 4.1 4.0 4.5 4.9 4.5 4.1 4. Austria 1.7 1.5 5. Banglade¥h' 1 ... .. , ... 1.1 0.5 0.7 0.2 6. Barbados•k/ 2.4 2.2 2.2 2.0 1.7 2.4 2.4 7. Belgium'·d 1.9 1.9 ... ... ... 1.8 1.7 8. Belize 8.1 8.3 1.9 3.2 5.2 3.3 1.9 9. Benind
10. Boliviad 7.2 4.8 3.6 2.9 4.8 3.0 2.4 11. Botswana' 2.4 1.9 2.0 4.1 4.8 6.4 6.5
__. 12. Brazil' 4.5 7.8 5.7 6.4 6.0 4.7 4.1 13. Burundi 6.1 5.5 5.9 4.3 5.3 6.0 6.4 14. Central Mrican Rep. 15. Chile 2.8 1.9 2.6 2.7 2.7 2.9 3.9 16. Colombia ,,, ... 2.1 2.1 2.5 4.5 4.0 17. Comoros ... ... ... ... . .. 6.4 5.3 18. Congo' ... . .. . .. ... 15.3 19. Costa Rica 4.6 5.2 4.6 5.8 3.5 3.4 2.7 20. Core d'Ivoire' ... ... 2.0 1.7 5.4 4.4 3.4 21. Denmark' 22. Dominica' 2.1 2.1 1.9 4.5 2.7 0.3 0.7 23. Dominican Rep.e 3.0 2.3 2.3 2.9 2.0 1.8 2.3 24. Ecuador' 3.6 3.4 3.3 3.3 2.7 2.4 2.4 25. Egypt, Arab Rep. of' ... ... .. . 15.5 16.1 14.6 15.0 26. El Salvado~ 3.2 3.3 2.8 2.5 3.5 2.7 1.0 27. Fiji' 4.5 6.5 7.1 7.3 7.9 8.0 3.9 28. France' 3.2 3.1 ... ... 3.6
282
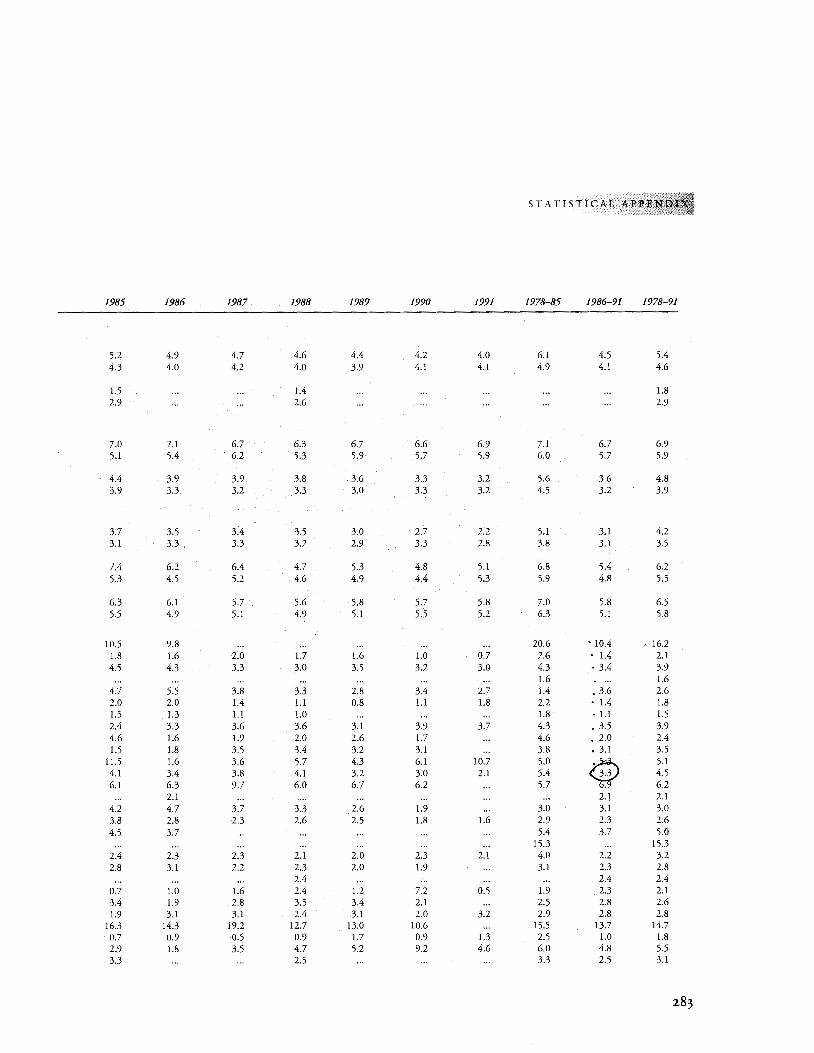
STATISTICAL APP
1985 1986 1987 1988 1989 1990 1991 1978-85 1986--91 1978-91
5.2 4.9 4.7 4.6 4.4 4.2 4.0 6.1 4.5 5.4 4.3 4.0 4.2 4.0 3.9 4.1 4.1 4.9 4.1 4.6
1.5 ... ... 1.4 ... . .. ... ... .. . 1.8 2.9 ... ... 2.6 ... ... ... ... .. . 2.9
7.0 7.1 6.7 6.3 6.7 6.6 6.9 7.1 6.7 6.9 5.1 5.4 6.2 5.3 5.9 5.7 5.9 6.0 5.7 5.9
4.4 3.9 3.9 3.8 3.6 3.3 3.2 5.6 3.6 4.8 3.9 3.3 3.2 3.3 3.0 3.3 3.2 4.5 3.2 3.9
3.7 3.5 3.4 3.5 3.0 2.7 2.2 5.1 3.1 4.2 3.1 3.3 3.3 3.2 2.9 3.3 2.8 3.8 3.1 3.5
7.4 6.2 6.4 4.7 5.3 4.8 5.1 6.8 5.4 6.2 5.3 4.5 5.2 4.6 4.9 4.4 5.3 5.9 4.8 5.5
6.3 6.1 5.7 5.6 5.8 5.7 5.8 7.0 5.8 6.5 5.5 4.9 5.1 4.9 5.1 5.5 5.2 6.3 5.1 5.8
10.5 9.8 ... ... ... ... .. . 20.6 • 10.4 . 16.2 1.8 1.6 2.0 1.7 1.6 1.0 0.7 2.6 • 1.4 2.1 4.5 4.3 3.3 3.0 3.5 3.2 3.0 4.3 • 3.4 3.9
1.6 .... 1.6 4.7 5.5 3.8 3.3 2.8 3.4 2.7 1.4 . 3.6 2.6 2.0 2.0 1.4 1.1 0.8 1.1 1.8 2.2 • 1.4 1.8 1.5 1.3 1.1 1.0 ... ... . .. 1.8 ·1.1 1.5 2.4 3.3 3.6 3.6 3.1 3.9 3.7 4.3 • 3.5 3.9 4.6 1.6 1.9 2.0 2.6 1.7 ... 4.6 • 2.0 2.4 1.5 1.8 3.5 3.4 3.2 3.1 ... 3.8 • 3.1 3.5
11.5 1.6 3.6 5.7 4.3 6.1 10.7 5.0
<W 5.1
4.1 3.4 3.8 4.1 3.2 3.0 2.1 5.4 4.5 6.1 6.3 9.7 6.0 6.7 6.2 ... 5.7 6.2
2.1 ... ... ... ... .. . ... 2.1 2.1 4.2 4.7 3.7 3.3 2.6 1.9 ... 3.0 3.1 3.0 3.8 2.8 2.3 2.6 2.5 1.8 1.6 2.9 2.3 2.6 4.5 3.7 ... ... ... ... .. . 5.4 3.7 5.0
15.3 ... 15.3 2.4 2.3 2.3 2.1 2.0 2.3 2.1 4.0 2.2 3.2 2.8 3.1 2.2 2.3 2.0 1.9 ... 3.1 2.3 2.8
2.4 ... ... . .. ... 2.4 2.4 0.7 1.0 1.6 2.4 1.2 7.2 0.5 1.9 2.3 2.1 3.4 1.9 2.8 3.5 3.4 2.1 ... 2.5 2.8 2.6 1.9 3.1 3.1 2.4 3.1 2.0 3.2 2.9 2.8 2.8
16.3 14.3 19.2 12.7 13.0 10.6 ... 15.5 13.7 14.7 0.7 0.9 0.5 0.9 1.7 0.9 1.3 2.5 1.0 1.8 2.9 1.8 3.5 4.7 5.2 9.2 4.6 6.0 4.8 5.5 3.3 ... ... 2.5 ... .. . ... 3.3 2.5 3.1
283
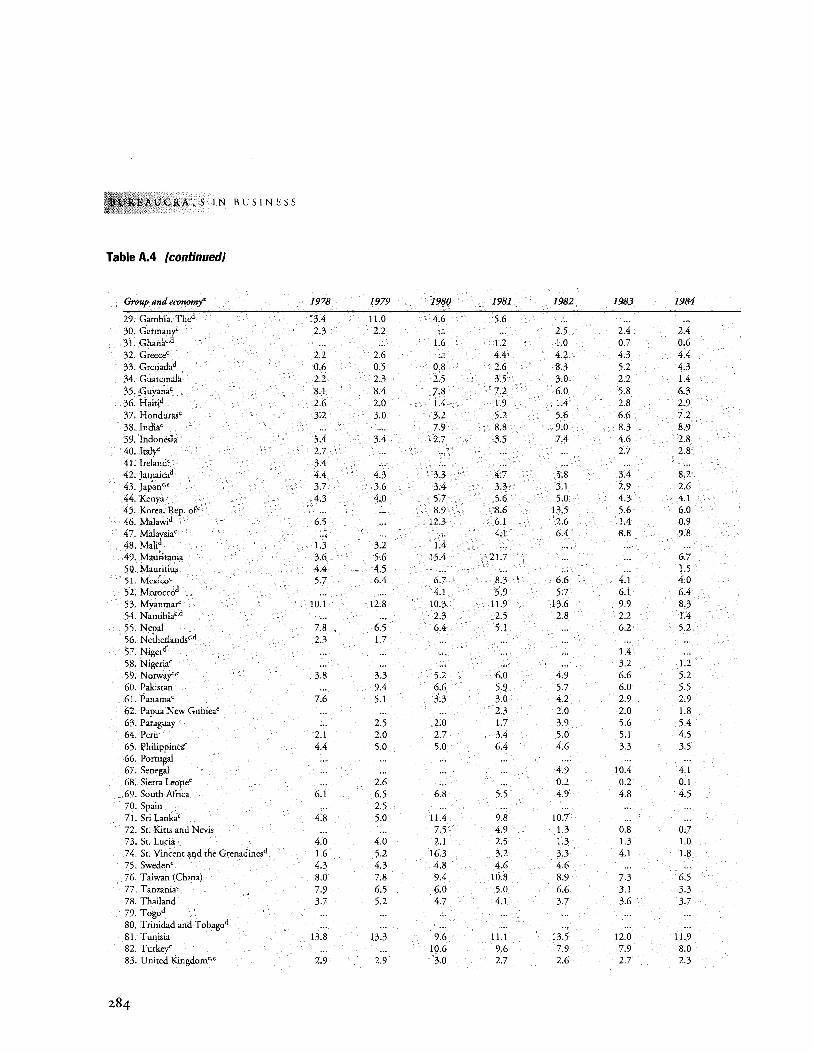
CRATS IN BUSINESS
Table A.4 (continued)
Group and economj' 1978 1979 1980 1981 1982 1983 1984
29. Gambia, Thed 13.4 11.0 4.6 5.6 30. Germanf 2 . .3 2.2 ... ... 2.5 2.4 2.4 31. Ghana'·d ... ... 1.6 1.2 1.0 0.7 0.6 32. Greece' 2.2 2.6 ... 4.4 4.2 4.3 4.4 33. Grenadad 0.6 0.5 0.8 2.6 8..3 5.2 4 . .3 34. Guatemala 2.2 2.3 2.5 3.5 3.0 2.2 1.4 35. Guyana' 8.1 8.4 7.8 7.2 6.0 5.8 6.3 36. Haitid 2.6 2.0 1.4 1.9 1.4 2.8 2.9 37. Honduras' 3.2 3.0 3.2 5.2 5.6 6.6 7.2 38. India' ... ... 7.9 8.8 9.0 8.3 8.9 39. Indonesia 5.4 3.4 2.7 3.5 7.4 4.6 2.8 40. Iralf 2.7 ... ... .. . ... 2.7 2.8 41. Ireland' 3.4 42. Jamaicad 4.4 4.3 3.3 4.7 5.8 3.4 8.2 43. Japan'·• 3.7 3.6 3.4 3.3 3.1 2.9 2.6 44. Kenya 4.3 4.0 5.7 5.6 5.0 4.3 4.1 45. Korea, Rep. of< ·•· ... 8.9 8.6 13.5 5.6 6.0 46. Malawid 6.5 ... 12.3 6.1 2.6 1.4 0.9 47. Malaysia< ... ... ... 4.1 6.4 8.8 9.8 48. MaJid 1.3 3.2 1.4 49. Mauritania 3.6 5.6 15.4 21.7 ... ... 6.7 50. Mauritius 4.4 4.5 ... ... ... .. . 1.5 51. Mexicoc 5.7 6.4 6.7 8.3 6.6 4.1 4.0 52. Moroccod ... ... 4.1 5.9 5.7 6.1 6.4 5.3. Myanmar 10.1 12.8 10.3 11.9 13.6 9.9 8.3 54. Namibia<,d ... ... 2.3 2.5 2.8 2.2 1.4 55. Nepal 7.8 6.5 6.4 5.1 ... 6.2 5.2 56. N etberlands"·d 2.3 1.7 57. Nigerd ... ... ... . .. ... 1.4 58. Nigeria' ... . .. . .. ... ... 3.2 1.2 59. Norwar• 3.8 3.3 5.2 6.0 4.9 6.6 5.2 60. Pakistan ... 9.4 6.6 5.9 5.7 6.0 5.5 61. Panama' 7.6 5.1 3.3 3.0 4.2 2.9 2.9 62. Papua New Guinea• ... ... ... 2.3 2.0 2.0 1.8 63. Paraguay ... 2.5 2.0 1.7 3.9 5.6 5.4 64. Peru 2.1 2.0 2.7 3.4 5.0 5.1 4.5 6 5. Philippines' 4.4 5.0 5.0 6.4 4.6 3.3 3.5 66. Portugal 67. Senegal ... ... . .. ... 4.9 10.4 4.1 68. Sierra Leone• ... 2.6 ... . .. 0.2 0.2 0.1 69. South Africa 6.1 6.5 6.8 5.5 4.9 4.8 4.5 70. Spain ... 2.5 71. Sri Lanka' 4.8 5.0 11.4 9.8 10.7 72. St. Kitts and Nevis ... ... 7.5 4.9 1.3 0.8 0.7 73. St. Lucia 4.0 4.0 2.1 2.5 1.3 1.3 1.0 74. St. Vincent and the Grenadinesd 1.6 5.2 16.3 3.2 3.3 4.1 1.8 75. Sweden• 4.3 4.3 4.8 4.6 4.6 76. Taiwan (China) 8.0 7.8 9.4 10.8 8.9 7.3 6.5 77. Tanzania< 7.9 6.5 6.0 5.0 6.6 3.1 3.3 78. Thailand 3.7 5.2 4.7 4.1 3.7 3.6 3.7 79. Togod 80. Trinidad and Tobagod 81. Tunisia 13.8 13.3 9.6 11.1 13.5 12.0 11.9 82. Turkef ... ... 10.6 9.6 7.9 7.9 8.0 83. United Kingdom'•• 2.9 2.9 3.0 2.7 2.6 2.7 2.3
284
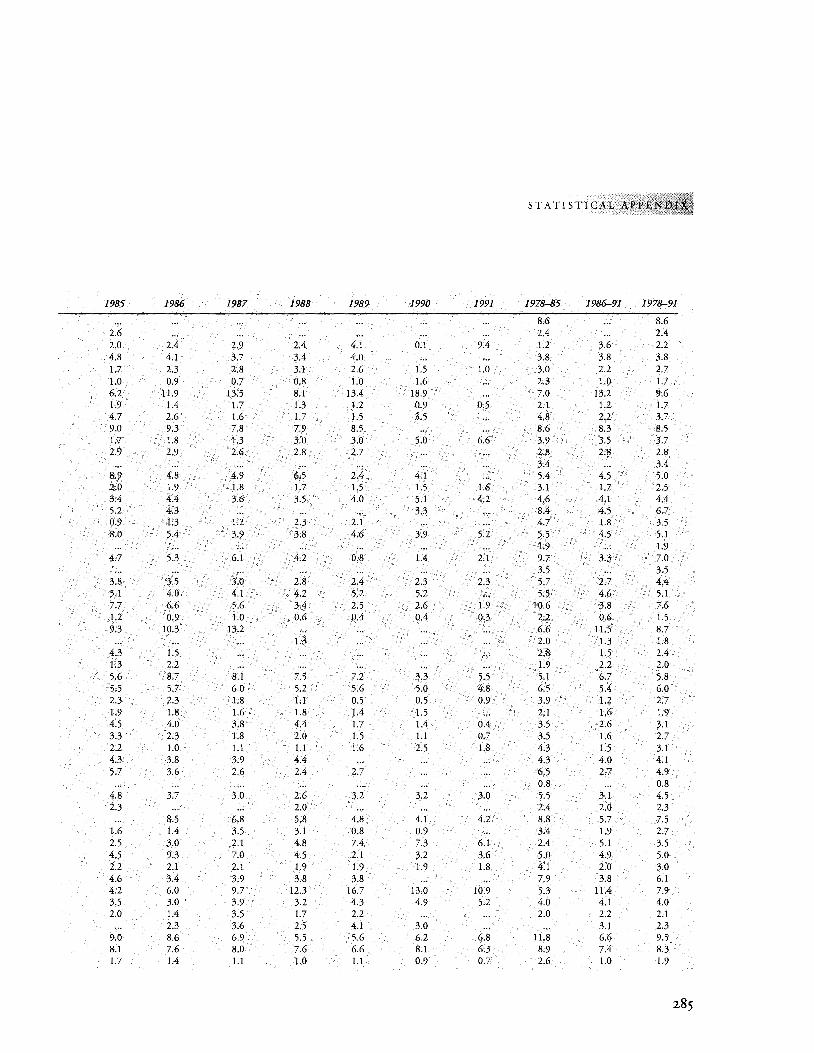
STATISTICAL AP
1985 1986 1987 1988 1989 1990 1991 1978-85 1986-91 1978-91
8.6 ... 8.6 2.6 ... ... . .. ... ... ... 2.4 .. . 2.4 2.0 2.4 2.9 2.4 4.1 0.1 9.4 1.2 3.6 2.2 4.8 4.1 3.7 3.4 4.0 ... . .. 3.8 3.8 3.8 1.7 2.3 2.8 3.1 2.6 1.5 1.0 3.0 2.2 2.7 1.0 0.9 0.7 0.8 1.0 1.6 ... 2.3 1.0 1.7 6.2 11.9 13.5 8.1 13.4 18.9 ... 7.0 13.2 9.6 1.9 1.4 1.7 1.3 1.2 0.9 0.5 2.1 1.2 1.7 4.7 2.6 1.6 1.7 1.5 3.5 ... 4.8 2.2 3.7 9.0 9.3 7.8 7.9 8.5 ... . .. 8.6 8.3 8.5 1.7 1.8 1.3 3.0 3.0 5.0 6.6 3.9 3.5 3.7 2.9 2.9 2.6 2.8 2.7 ... . .. 2.8 2.8 2.8
3.4 ... 3.4 8.9 4.8 4.9 6.5 2.4 4.1 ... 5.4 4.5 5.0 2.0 1.9 1.8 1.7 1.5 1.5 1.6 3.1 1.7 2.5 3.4 4.4 3.6 3.5 4.0 5.1 4.2 4.6 4.1 4,4 5.2 4.3 ... ... ... 3.3 . .. 8.4 4.5 6.7 0.9 1.3 1.2 2.3 2.1 ... . .. 4.7 1.8 3.5 8.0 5.4 3.9 3.8 4.6 3.9 5.2 5.5 4.5 5.1
1.9 ... 1.9 4.7 5.3 6.1 4.2 0.8 1.4 2.1 9.7 3.3 7.0
3.5 ... 3.5 3.8 3.5 3.0 2.8 2.4 2.3 2.3 5.7 2.7 4.4 5.1 4.0 4.1 4.2 5.2 5.2 ... 5.5 4.6 5.1 7.7 6.6 5.6 3.4 2.5 2.6 1.9 10.6 3.8 7.6 1.2 0.9 1.0 0.6 0.4 0.4 0.3 2.2 0.6 1.5 9.3 10.3 13.2 ... ... ... . .. 6.6 11.5 8.7
1.3 ... . .. ... 2.0 1.3 1.8 4.3 1.5 ... ... . .. . .. . .. 2.8 1.5 2.4 1.3 2.2 ... ... . .. ... . .. 1.9 2.2 2.0 5.6 8.7 8.1 7.5 7.2 3.3 5.5 5.1 6.7 5.8 5.5 5.7 6.0 5.2 5.6 5.0 4.8 6.5 5.4 6.0 2.3 2.3 1.8 1.1 0.5 0.5 0.9 3.9 1.2 2.7 1.9 1.8 1.6 1.8 1.4 1.5 ... 2.1 1.6 1.9 4.5 4.0 3.8 4.4 1.7 1.4 0.4 3.5 2.6 3.1 3.3 2.3 1.8 2.0 1.5 1.1 0.7 3.5 1.6 2.7 2.2 1.0 1.1 1.1 1.6 2.5 1.8 4.3 1.5 3.1 4.3 3.8 3.9 4.4 ... . .. ... 4.3 4.0 4.1 5.7 3.6 2.6 2.4 2.7 ... . .. 6.5 2.7 4.9
0.8 ... 0.8 4.8 3.7 3.0 2.6 3.2 3.2 3.0 5.5 3.1 4.5 2.3 ... ... 2.0 ... ... .. . 2.4 2.0 2.3
8.5 6.8 5.8 4.8 4.1 4.2 8.8 5.7 7.5 1.6 1.4 3.5 3.1 0.8 0.9 ... 3.4 1.9 2.7 2.5 3.0 2.1 4.8 7.4 7.3 6.1 2.4 5.1 3.5 4.5 9.3 7.0 4.5 2.1 3.2 3.6 5.0 4.9 5.0 2.2 2.1 2.1 1.9 1.9 1.9 1.8 4.1 2.0 3.0 4.6 3.4 3.9 3.8 3.8 ... ... 7.9 3.8 6.1 4.2 6.0 9.7 12.3 16.7 13.0 10.9 5.3 11.4 7.9 3.5 3.0 3.9 3.2 4.3 4.9 5.2 4.0 4.1 4.0 2.0 1.4 3.5 1.7 2.2 ... ... 2.0 2.2 2.1
2.3 3.6 2.5 4.1 3.0 ... . .. 3.1 2.3 9.0 8.6 6.9 5.5 5.6 6.2 6.8 11.8 6.6 9.5 8.1 7.6 8.0 7.6 6.6 8.1 6.3 8.9 7.4 8.3 1.7 1.4 1.1 1.0 1.1 0.9 0.7 2.6 1.0 1.9
285
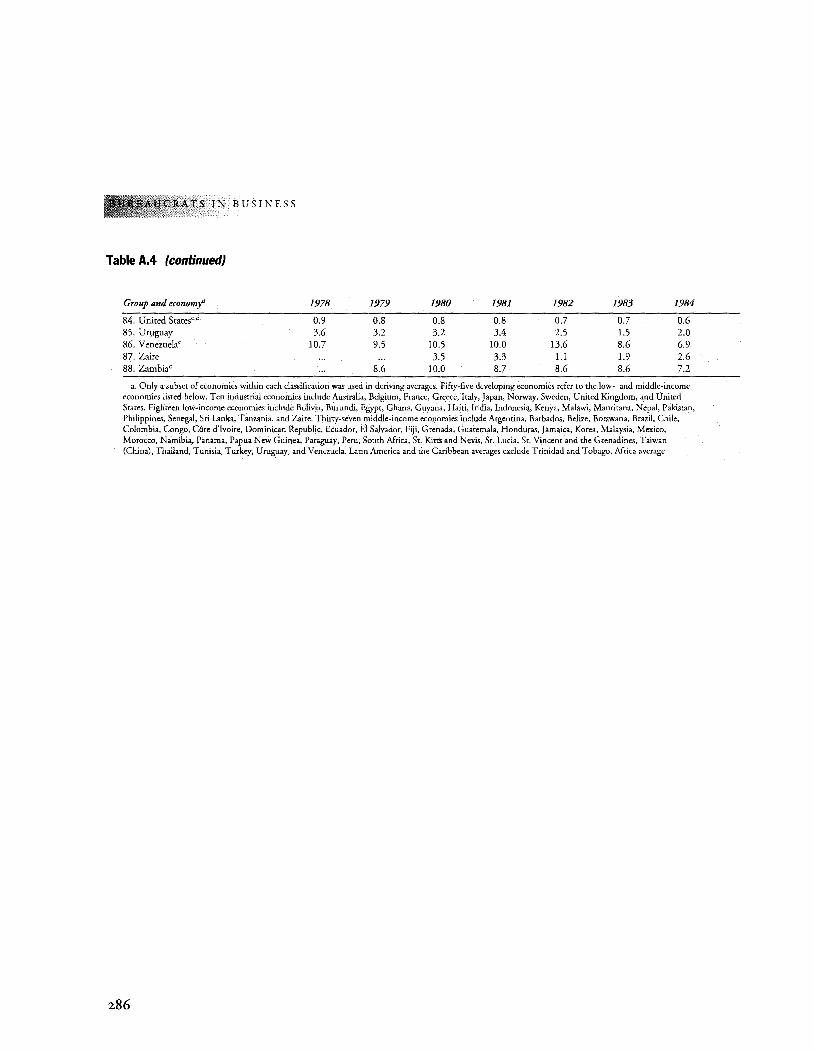
TS IN BUSINESS
Table A.4 (continued)
Group and economj' 1978 1979 1980 1981 1982 1983 1984
84. United States<·' 0.9 0.8 0.8 0.8 0.7 0.7 0.6
85. Uruguay 3.6 3.2 3.2 3.4 2.5 1.5 2.0 86. Venezuela< 10.7 9.5 10.5 10.0 13.6 8.6 6.9 87. Zaire ... 3.5 3.3 1.1 1.9 2.6 88. Zambia< ... 8.6 10.0 8.7 8.6 8.6 7.2
a. Only a subset of economies within each classification was used in deriving averages. Fifty-five developing economies refer to the low- and middle-income economies listed below. Ten industrial economies include Australia, Belgium, France, Greece, Italy, Japan, Norway, Sweden, United Kingdom, and United States. Eighteen low-income economies include Bolivia, Burundi, Egypt, Ghana, Guyana, Haiti, India, Indonesia, Kenya, Malawi, Mauritana, Nepal, Pakistan, Philippines, Senegal, Sri Lanka, Tanzania, and Zaire. Thirty-seven middle-income economies include Argentina, Barbados, Belize, Botswana, Brazil, Chile, Colombia, Congo, Cote d'lvoire, Dominican Republic, Ecuador, El Salvador, Fiji, Grenada, Guatemala, Honduras, Jamaica, Korea, Malaysia, Mexico, Morocco, Namibia, Panama, Papua New Guinea, Paraguay, Peru, South Africa, St. Kitts and Nevis, St. Lucia, St. Vincent and the Grenadines, Taiwan (China), Thailand, Tunisia, Turkey, Uruguay, and Venezuela. Larin America and the Caribbean averages exclude Trinidad and Tobago. Africa average
286
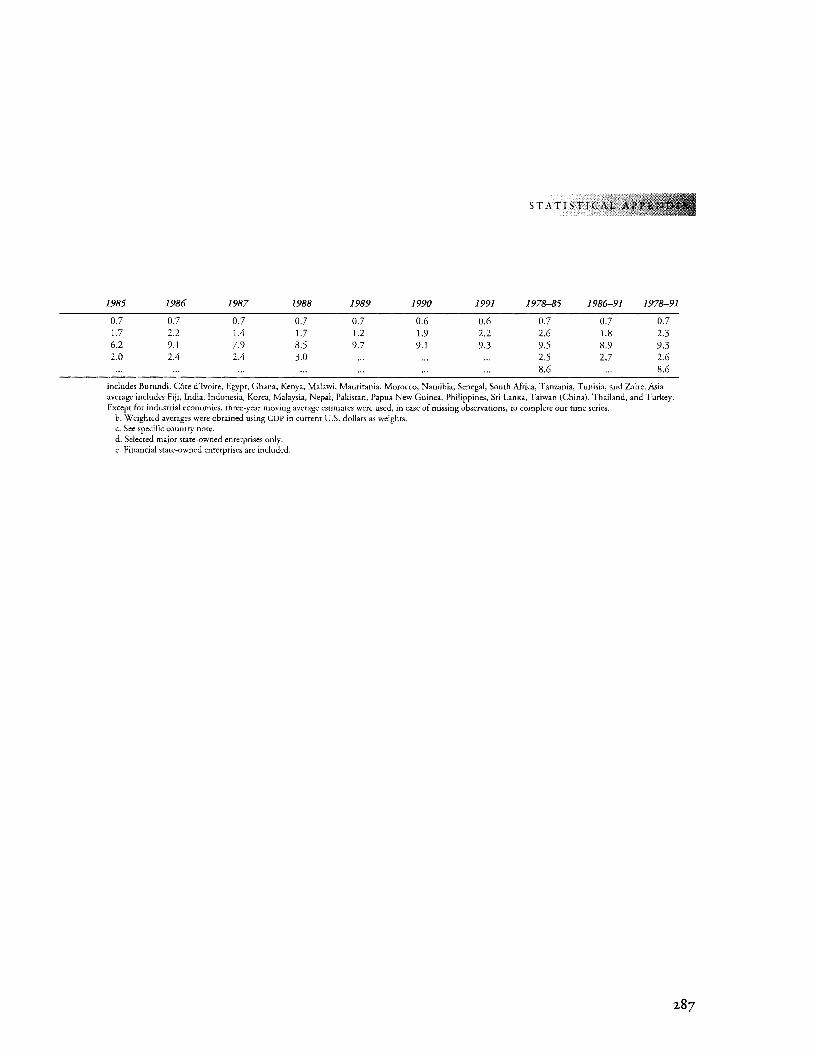
STATISTICAL
1985 1986 1987 1988 1989 1990 1991 1978-85 1986---91 1978-91
0.7 0.7 0.7 0.7 0.7 0.6 0.6 0.7 0.7 0.7 1.7 2.2 1.4 1.7 1.2 1.9 2.2 2.6 1.8 2.3 6.2 9.1 7.9 8.5 9.7 9.1 9.3 9.5 8.9 9.3 2.0 2.4 2.4 3.0 ... 2.5 2.7 2.6
8.6 ... 8.6
includes Burundi, COte d'Ivoire, Egypt, Ghana, Kenya, Malawi, Mauritania, Morocco, Namibia, Senegal, South Africa, Tanzania, Tunisia, and Zaire. Asia average includes Fiji, India, Indonesia, Korea, Malaysia, Nepal, Pakistan, Papua New Guinea, Philippines, Sri Lanka, Taiwan (China), Thailand, and Turkey. Except for industrial economies, three-year moving average estimates were used, in case of missing observations, to complete our time series.
b. W eighred averages were obtained using GDP in current U.S. dollars as weights. c. See specific country note. d. Selected major state-owned enterprises only. e. Financial state-owned enterprises are included.
287
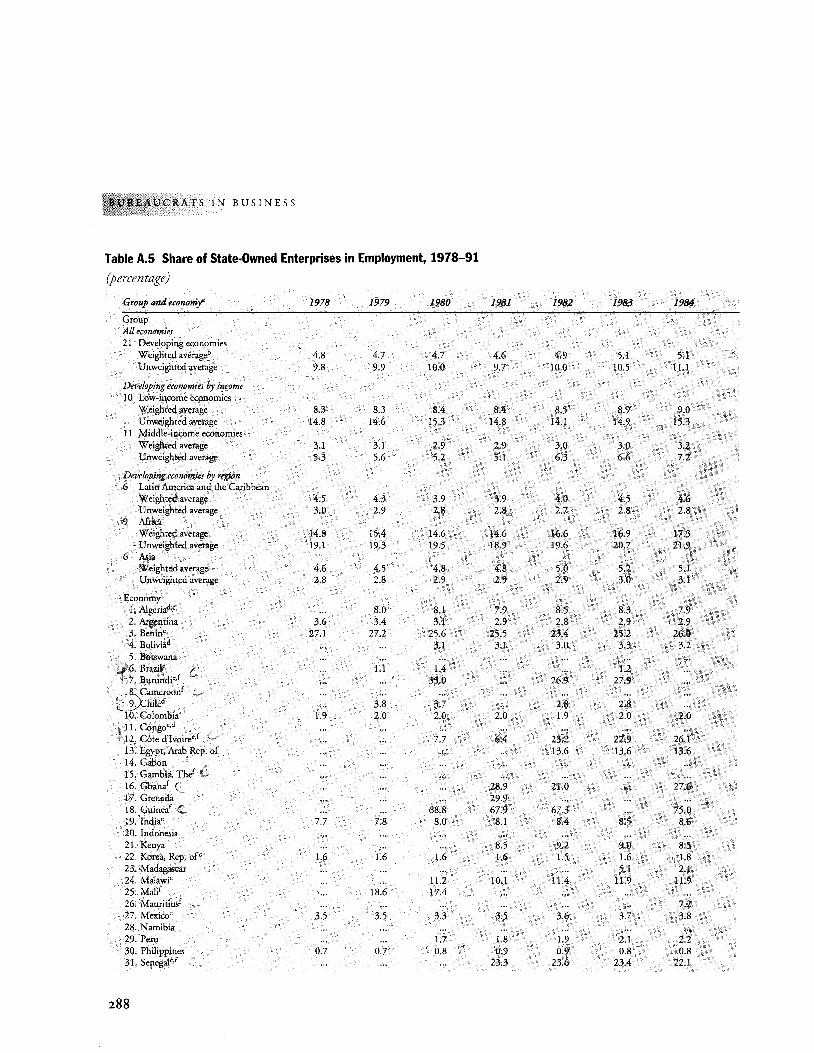
\U.CRATS IN BUSINESS
Table A.S Share of State-Owned Enterprises in Employment, 1978-91
(percentage)
Group and economj' 1978 1979 1980 1981 1982 1983 1984
Group All economies 2 I Developing economies
Weighted average~' 4.8 4.7 4.7 4.6 4.9 5.1 5.1 Unweighted average 9.8 9.9 10.0 9.7 IO.O 10.5 11.1
Developing economies by income 10 Low-income economies
Weighted average 8.3 8.3 8.4 8.4 8.5 8.9 9.0 Unweighred average 14.8 14.6 15.3 14.8 I4.1 14.9 15.3
II Middle-income economies Weighted average 3.1 3.1 2.9 2.9 3.0 3.0 3.2 Unweighted average 5.3 5.6 5.2 5.1 6.3 6.6 7.2
Developing economies by region 6 Latin America and the Caribbean
Weighted average 4.5 4.3 3.9 3.9 4.0 4.5 4.6 U nweighted average 3.0 2.9 2.8 2.8 2.7 2.8 2.8
9 Mrica Weighted average 14.8 15.4 14.6 14.6 I6.6 16.9 17.3 Unweighted average 19.1 19.3 19.5 18.9 19.6 20.7 21.9
6 Asia Weighted average 4.6 4.5 4.8 4.8 5.0 5.2 5.1 Unweighted average 2.8 2.8 2.9 2.9 2.9 3.0 3.1
l;conomy I. Algeriad,c ... 8.0 8.1 7.9 8.5 8.3 7.9 2. Argentina 3.6 3.4 3.1 2.9 2.8 2.9 2.9 3. Benin' 27.1 27.2 25.6 25.5 23.4 25.2 26.0 4. Boliviad ... . .. 3.1 3.1 3.0 3.3 3.2
1 .. 5. Botswana :~i'6. Brazil< C ... 1.1 1.4 ... ... 1.2 li7. Burundie,f ... . .. 35.0 ... 26.9 27.9 ::~ameroonf ~- hiJed ... 3.8 3.7 ... 2.8 2.8
10. Colombia 1.9 2.0 2.0 2.0 1.9 2.0 2.0 11. Congo'•d
L12. Cote d'Ivoire<.f ... . .. 7.7 6.4 23.2 22.9 26.1 13. Egypt, Arab Rep. of ... ... ... ... 13.6 13.6 13.6 14. Gabon I5. Gambia, Thef 16. Ghani C ... ... . .. 28.9 21.0 ... 27.6 17. Grenada ... ... ... 29.9 18. Guinel ... . .. 68.8 67.9 67.3 . .. 75.0 19. India' 7.7 7.8 8.0 8.1 8.4 8.5 8.6 20. Indonesia 21. Kenya ... ... . .. 8.5 9.2 9.0 8.5 22. Korea, Rep. of' 1.6 1.6 !.6 1.6 1.5 1.6 1.8 23. Madagascar ... ... . .. . .. ... 5.1 2.1 24. Malawi' ... ... 11.2 10.1 11.4 11.9 11.9 25. MaJif ... 18.6 17.4 26. Mauritiusf ... . .. ... ... ... . .. 7.2 27. Mexico' 3.5 3.5 3.3 3.5 3.6 3.7 3.8 28. Namibia 29. Peru ... . .. 1.7 1.8 1.9 2.I 2.2 30. Philippines 0.7 0.7 0.8 0.9 0.9 0.8 0.8 31. Sepegal<,f ... ... ... 23.3 23.6 23.4 22.1
288
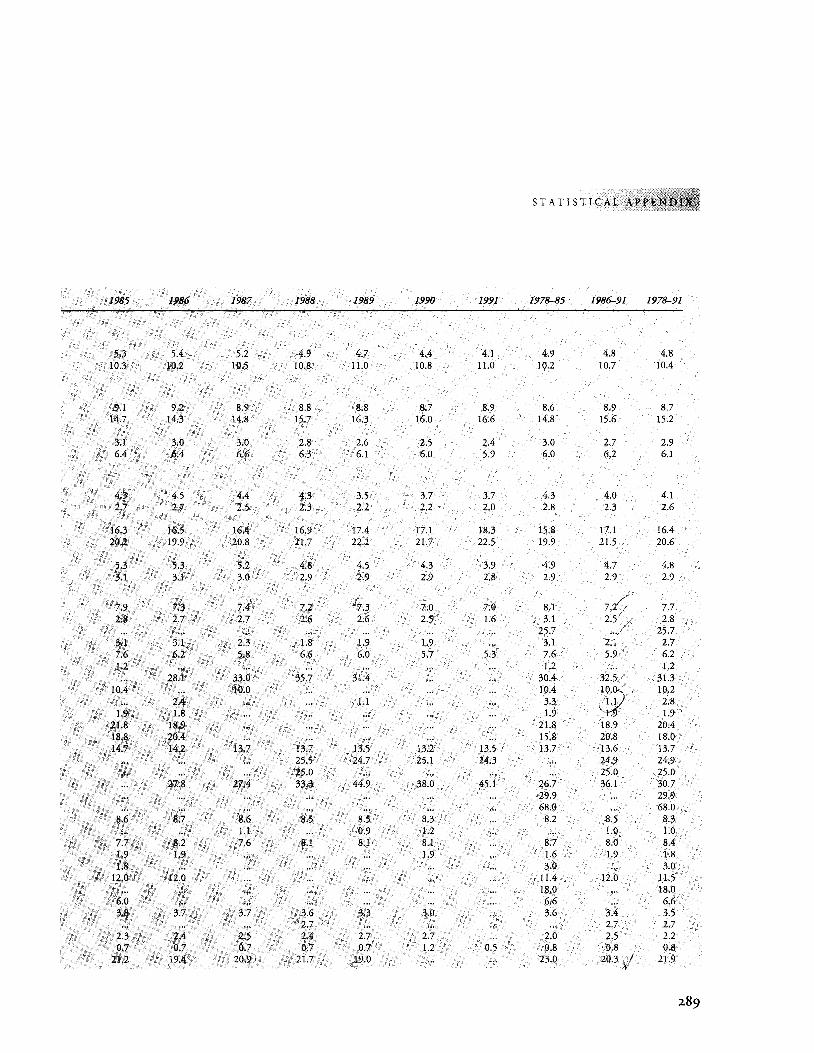
STATISTICAL APP!N!)? ..
1!185 1986 1!187 1!188 1989 1!1!10 1991 1!178-85 1986-91 1978-91
5.3 5.4 5.2 4.9 4.7 4.4 4.1 4.9 4.8 4.8 10.3 10.2 10.5 10.8 11.0 10.8 11.0 10.2 10.7 10.4
9.1 9.2 8.9 8.8 8.8 8.7 8.9 8.6 8.9 8.7 14.7 14.3 14.8 15.7 16.3 16.0 16.6 14.8 15.6 15.2
3.1 3.0 3.0 2.8 2.6 2.5 2.4 3.0 2.7 2.9 6.4 6.4 6.6 6.3 6.1 6.0 5.9 6.0 6.2 6.1
4.3 4.5 4.4 4.3 3.5 3.7 3.7 4.3 4.0 4.1 2.7 2.7 2.5 2.3 2.2 2.2 2.0 2.8 2.3 2.6
16.3 16.5 16.4 16.9 17.4 17.1 18.3 15.8 17.1 16.4 20.2 19.9 20.8 21.7 22.2 21.7 22.5 19.9 21.5 20.6
5.3 5.3 5.2 4.8 4.5 4.3 3.9 4.9 4.7 4.8 3.1 3.1 3.0 2.9 2.9 2.9 2.8 2.9 2.9 2.9
/"
7.:i 7./; 7.9 7.3 7.4 7.:}. 7.0 7.0 8.1 7.7 2.8 2.7 2.7 2.6 2.6 2.5 1:6 3.1 2.5/ 2.8
25.7 25.7 ,3.1 3.1 2.3 1.8 1.9 1.9 ... 3.1 2.1 . 2.7 7.6 6.2 5.8 6.6 6.0 5.7 5.3 7.6 5.9 6.2 1.2 ... ... . .. ... .. . . .. 1.2 .. . 1.2
28.1 33.0 35.7 31.4 ... ... 30.4 32.5. 31.3 10.4 ... 10.0 ... ... ... ... 10.4
1!¥ 10.2
2.4 ... ... 1.1 .. . ... 3.3 \.1:1 2.8 1.9 1.8 ... ... . .. ... . .. 1.9 1.9
21.8 18.9 ... ... ... ... .. . 21.8 18.9 2o.4 18.8 20.4 ... . .. ... .. . ... 15.8 20.8 18.0 14.7 14.2 13.7 13.7 13.5 13.2 13.5 13.7 13.6 13.7
25.5 24.7 25.1 24.3 ... 24.9 24.9 25.0 ... ... ... ... 25.0 25.0
27.8 27.4 33.3 44.9 38.0 45.1 26.7 36.1 30.7 •29.9 ... 29.9
... ... . .. . .. ... ... .. . 68.0 ... 68.0 8.6 8.7 8.6 8.5 8.5 8.3 ... 8.2 8.5 8.3
1.1 ... 0.9 1.2 . .. . .. 1.0 1.0 7.7 8.2 7.6 8.1 8.1 8.1 ... 8.7 8.0 8.4 1.9 1.9 ... ... .. . 1.9 ... 1.6 1.9 1.8 1.8 ... ... . .. . .. ... . .. 3.0 ... 3.0
12.0 12.0 ... ... ... ... .. . 11.4 12.0 11.5 18.0 ... 18.0
6.0 ... ... ... ... ... . .. 6.6 .. . 6.6 3.8 3.7 3.7 3.6 3.3 3.0 ... 3.6 3.4 3.5 ... . .. ... ~i7 ) . .. ... . .. . .. 2.7 2.7
2.3 2.4 2.5 2.4 2.7 2.7 ... 2.0 2.5 2.2 0.7 .0.7 0.7 0.7 0.7 1.2 0.5 0.8 0.8 0.8
21.2 J9.4 ? 20.9 2L7 . ,19.0/ ... ... 23.0 .2Q.3 21.9
289
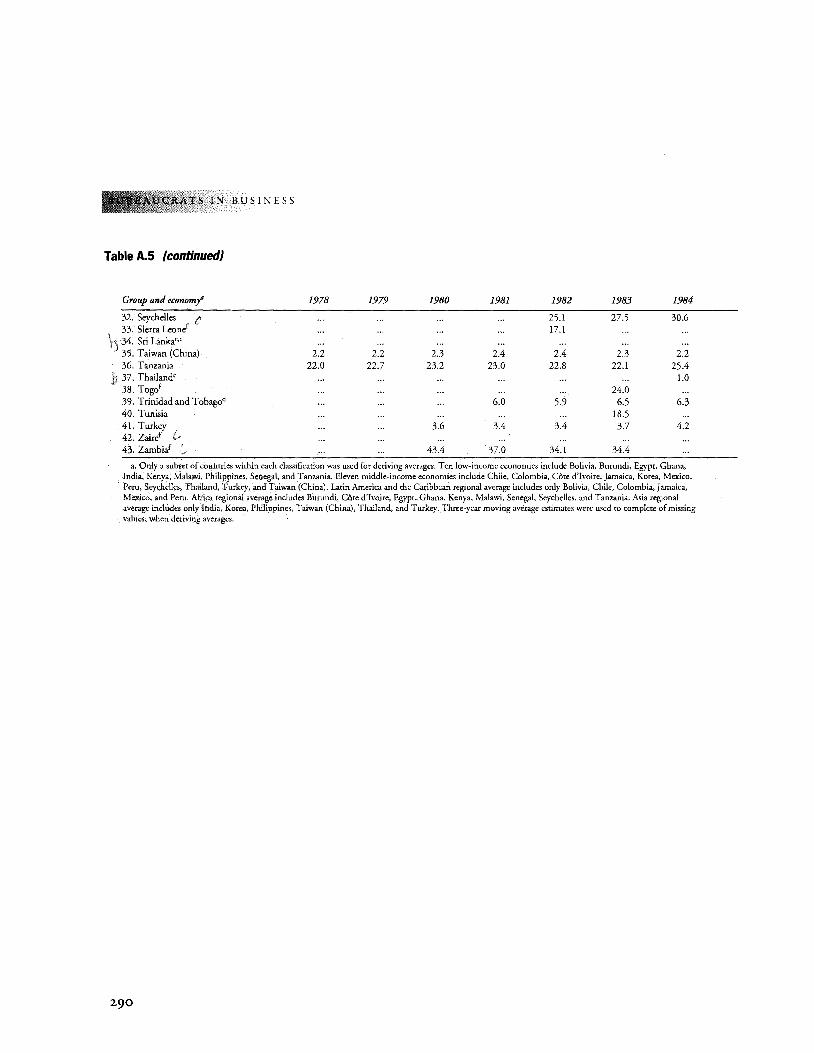
IN BUSINESS
Table A.S (continued}
Group and economj'
32. Seychelles 33. Sierra Leoni 34. Sri Lanka'·• 35. Taiwan (China) 36. Tanzania 37. Thailand• 38. Togof 39. Trinidad and Tobagod 40. Tunisia 41. Turkey 42. Zairef 43. ZambiJ
1978
2.2 22.0
1979
2.2 22.7
1980
2.3 23.2
3.6
43.4
1981
2.4 23.0
6.0
3.4
37.0
1982 1983 1984
25.1 27.5 30.6 17.1
... 2.4 2.3 2.2
22.8 22.1 25.4 1.0
24.0 ... 5.9 6.5 6.3
18.5 3.4 3.7 4.2
... . .. 34.1 34.4
a. Only a subset of couotties within each classification was used for deriving averages. Ten low-income economies include Bolivia, Burundi, Egypt, Ghana, India, Kenya, Malawi, Philippines, Senegal~ and Tanzania. Eleven middle-income economies include Chile, Colombia, COte d'Ivoire, Jamaica, Korea, Mexico, Peru, Seychelles, Thailand, Turkey, and Taiwan (China). Latin Arnerica and the Caribbean regional average includes only Bolivia, Chile, Colombia, Jamaica, Mexico, and Peru. Mrica regional average includes Burundi, Core d'lvoire, Egypt, Ghana, Kenya, Malawi, Senegal, Seychelles, and Tanzania. Asia regional average includes only India, Korea, Philippines, Taiwan (China), Thailand, and Turkey. Three-year moving average estimates were used to complete of missing values, when deriving averages.
290
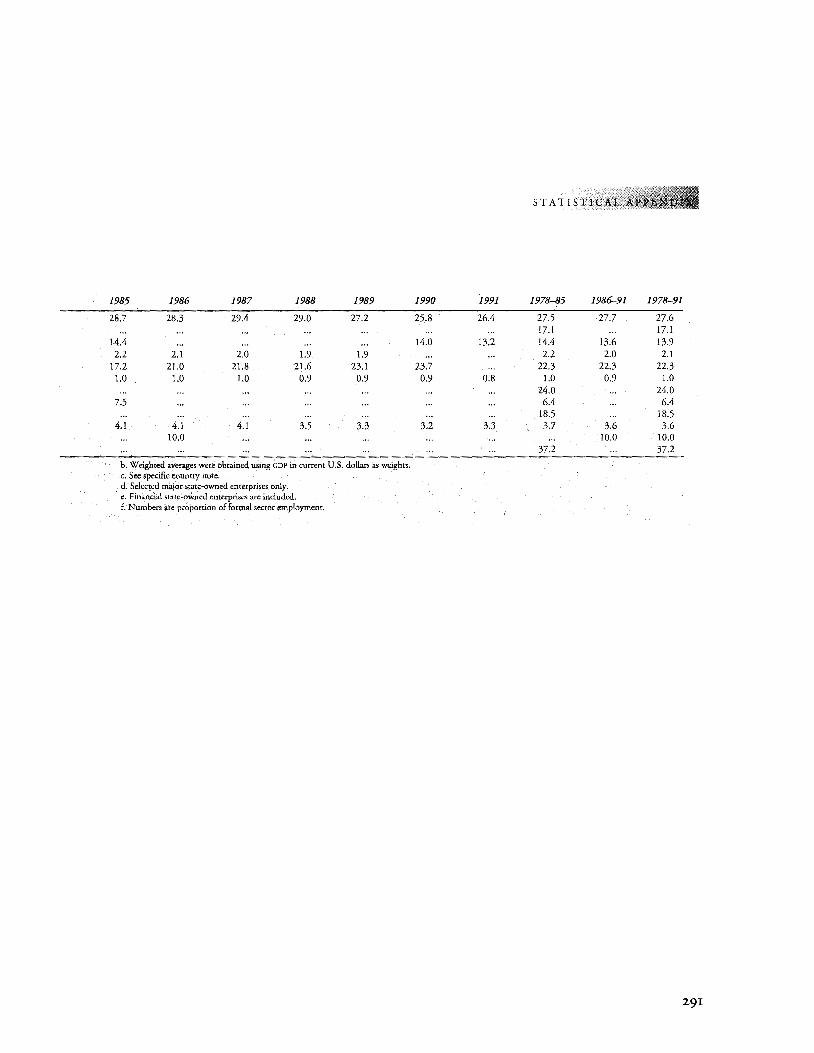
STATISTICAL
1985 1986 1987 1988 1989 1990 1991 1978-85 1986-91 1978-91
28.7 28.3 29.4 29.0 27.2 25.8 26.4 27.5 27.7 27.6 17.1 ... 17.1
14.4 ... ... . .. . .. 14.0 13.2 14.4 13.6 13.9 2.2 2.1 2.0 1.9 1.9 ... ... 2.2 2.0 2.1
17.2 21.0 21.8 21.6 23.1 23.7 ... 22.3 22.3 22.3 1.0 1.0 1.0 0.9 0.9 0.9 0.8 1.0 0.9 1.0
24.0 ... 24.0 7.5 ... ... ... . .. . .. ... 6.4 ... 6.4
18.5 ... 18.5 4.1 4.1 4.1 3.5 3.3 3.2 3.3 3.7 3.6 3.6
10.0 ... ... . .. ... . .. .. . 10.0 10.0 37.2 ... 37.2
b. Weighted averages were obtained using GDP in current U.S. dollars as weights. c. See specific country note. d. Selected major state-owned enterprises only. e. Financial state-owned enterprises are included. f. Numbers are proportion of formal sector employment.
291
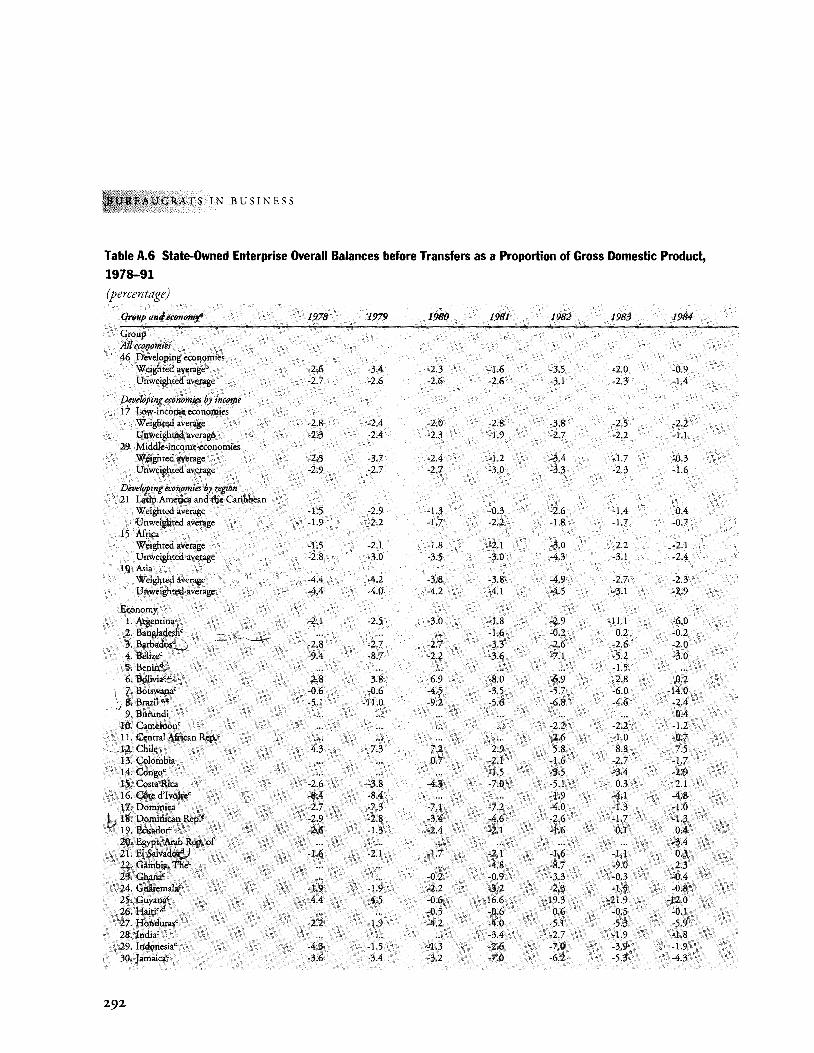
RATS I N B US IN E S S
Table A.G State-Owned Enterprise Overall Balances before Transfers as a Proportion of Gross Domestic Product, 1978-91 (percentage)
Group and economy" 1978 1979 1980 1981 1982 1983 1984
Group All economies 46 Developing economies
Weighted average~' -2.6 -3.4 -2.3 -1.6 -3.5 -2.0 -0.9 U nweighted avetage -2.7 -2.6 -2.6 -2.6 -3.1 -2.3 -1.4
Developing economies by income 17 Low-income economies
Weighted average -2.8 -2.4 -2.0 -2.8 -3.8 -2.5 -2.2 Unweighred average -2.3 -2.4 -2.3 -1.9 -2.7 -2.2 -l.l
29 Middle-income economies Weighted average ....2.5 -3.7 -2.4 -1.2 -3.4 -1.7 -0.3 Unweighted average -2.9 -2.7 -2.7 -3.0 -3.3 -2.3 -1.6
Developing economi•s by region 21 Latin America and the Caribbean
Weighted average -1.5 -2.9 -1.3 -0.3 -2.6 -1.4 0.4 Unweighted average -1.9 -2.2 -1.7 -2.2 -1.8 -1.7 -0.7
15 Africa Weighted average -1.5 -2.1 -1.8 -2.1 -3.0 -2.2 -2.1 Unweighted average -2.8 -3.0 -3.5 -3.0 -4.3 -3.1 -2.4
10 Asia Weighted average -4.4 -4.2 -3.8 -3.8 -4.9 -2.7 -2.3 Unweighted average -4.4 -4.0 -4.2 -4.1 -4.5 -3.1 -2.9
Economy 1. Argentina -2.1 -2.5 -3.0 -1.8 -2.9 -11.1 -6.0 2. Bangia~< -- ... ... . .. -1.6 -0.2 0.2 -0.2 3.Barbad~ - -2.8 -2.7 -2.7 -3.3 -2.6 -2.6 -2.0 4. Beli~" -9.4 -8.7 -2.2 -3.6 -7.1 -5.2 -3.0 5. Beniu2,J ... ... .. . ... .. . -1.5 6. Bolivi~t!L 2.8 3.8 6.9 8.0 6.9 2.8 0.2
\ 7. Borswana< -0.6 -0.6 -4.5 -3.5 ·5.7 -6.0 -14.0 · . 8. Brazil c.• -5.1 -11.0 -9.2 -5.6 -6.8 -4.6 -2.4 "9. Burundi ... ... . .. . .. . .. .. . 0.4 l 0. Cametoon< ... ... ... .. . -2.2 -2.2 -1.2 I 1. Central African Rep. c ... ... . .. . .. -2.6 -1.0 -0.7
-12. Chile 4.3 7.3 7.2 2.9 5.8 8.8 7.5 13. Colombia ... ... 0.7 -2.1 -1.6 -2.7 -1.7 14. Congo< ... ... .. . ·1.5 -3.5 -3.4 -2.9 15. Costa Rica -2.6 -3.8 -4.3 •7.0 ·5.1 0.3 2.1 16. C6te d'Ivoire" -8.4 -8.4 ... ... -1.9 -4.1 -4.8 17. Dominica -2.7 -7.3 -7.1 -7.2 -4.0 -1.3 -1.0 b 18. Dominican Rep.< -2.9 -2.8 -3.4 -4.6 -2.6 -1.7 -1.3 19. Ecuador -2.6 -1.3 -2.4 -2.1 -1.6 0.1 0.4 20. Egypt, Ar~p. of ... ... ... . .. ... .. . -3.4 21. El Salvad -1.6 -2.1 -1.7 -2.1 -1.6 -1.1 0.3 22. Gambia, The" ... . .. . .. -4.8 -8.7 -9.0 2.3 23. Ghana< ... . .. -0.2 -0.9 -3.3 -0.3 -0.4 24. Guatemala< -1.9 -1.9 -2.2 -3.2 -2.3 -1.5 -0.8 25. Guyana< 4.4 4.5 -0.6 -16.6 -19.3 -21.9 -12.0 26. HaJti<,d ... ... ·0.5 -0.6 0.6 -0.5 -0.1 27. Honduras< -2.2 -1.9 -4.2 -4.0 -5.1 -5.3 -5.9 28. India" ... ... ... -3.4 -2.7 -1.9 -1.8 29. I ndonesia0 -4.3 -1.5 -1.3 -2.6 -7.0 -3.9 -1.9 30. Jamaica< -3.6 -3.4 -3.2 -7.0 -6.2 ·5.3 -4.3
292
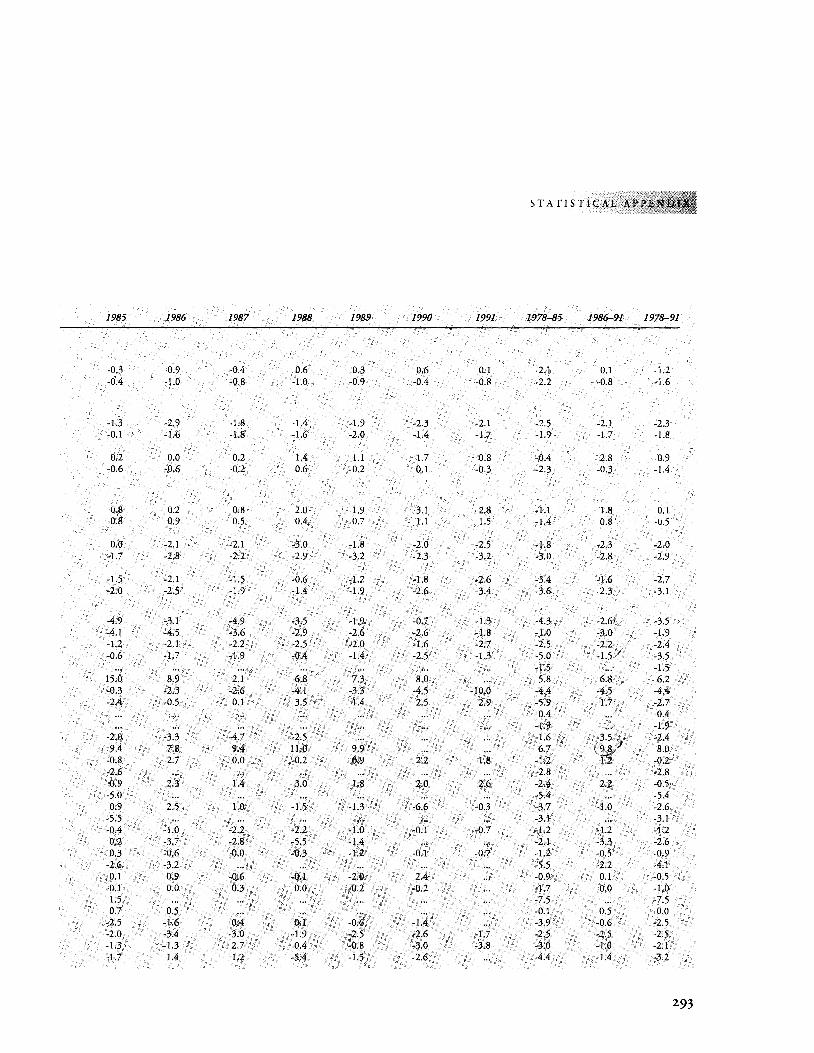
STATISTICAL A
1985 1986 1987 1988 1989 1990 1991 1978-85 1986-91 1978-91
-0.3 -0.9 -0.4 0.6 0.3 0.6 0.1 -2.1 0,1 -1.2 -0.4 -1.0 -0.8 -1.0 -0.9 -0.4 -0.8 -2.2 -0.8 -1.6
-1.3 -2.9 -1.8 -1.4 -1.9 -2.3 -2.1 -2.5 -2.1 -2.3 -0.1 -1.6 -1.8 -1.6 -2.0 -1.4 -1.7 -1.9 -1.7 -1.8
0.2 0.0 0.2 1.4 1.1 1.7 0.8 -0.4 2.8 0.9 -0.6 -0.6 -0.2 -0.6 -0.2 0.1 -0.3 -2.3 -0.3 -1.4
0.8 0.2 0.8 2.0 1.9 3.1 2.8 -1.1 1.8 0.1 0.8 0.9 0.5 0.4 0.7 1.1 1.5 -1.4 0.8 -0.5
0.0 -2.1 -2.1 -3.0 -1.8 ·2.0 -2.5 -1.8 -2.3 -2.0 -1.7 -2.8 ·2.2 -2.9 -3.2 -2.3 -3.2 -3.0 -2.8 -2.9
-1.5 -2.1 -1.5 -0.6 -1.2 -1.8 -2.6 -3.4 -1.6 -2.7 -2.0 -2.5 -1.9 -1.4 -1.9 -2.6 -3.4 -3.6 -2.3 -3.1
-4.9 -3.1 -4.9 -3.5 -1.9 -0.7 -1.3 -4.3 -2.6i -3.5 -4.1 -4.5 -3.6 -2.9 -2.6 -2.6 -1.8 -1.0 -3.0' -1.9 -1.2 -2.1 -2.2 -2.5 -2.0 -1.6 -2.7 -2.5 -2.2 -2.4 -0.6 -1.7 -1.9 -0.4 -1.4 -2.5 -1.3 -5.0 -1.5· -3.5
-1.5 ... -1.5 15.0 8.9 2.1 6.8 7.3 8.0 ... 5.8 6.8 6.2 -0.3 -2.3 -2.6 -4.1 -3.3 -4.5 -10.0 -4.4 -4.5 -4.4 -2.4 -0.5 0.1 3.5 1.4 2.5 2.9 -5.9 1.7' -2.7
0.4 ... 0.4 -1.9 ... -1.9
-2.0 -3.3 -4.7 -2.5 ... ... ... -1.6 -35~ -2.4 9.4 7.8 9.4 11.0 9.9 ... ... 6.7 ~~ 8.0
-0.8 2.7 0.0 -0.2 0.9 2.2 1.8 -1.2 1.2 -0.2 -2.6 ... ... ... ... ... .. . -2.8 ... -2.8 0.9 2.3 1.4 3.0 1.8 2.0 2.6 -2.4 2.2 -0.5
-5.0 ... ... ... ... ... ... -5.4 . .. -5.4 0.9 2.5 1.0 -1.5 -1.3 -6.6 -0.3 -3.7 -1.0 -2.6
-5.5 ... ... ... ... ... .. . -3.1 . .. -3.1 -0.4 -1.0 -2.2 -2.2 -1.0 -0.1 -0.7 -1.2 -1.2 -1.2 0.2 -3.7 -2.8 -5.5 -1.4 ... ... -2.1 -3.3 -2.6 0.3 -0.6 0.0 -0.3 -1.2 ·0.1 -0.7 -1.2 -0.5 -0.9
-2.6 -3.2 ... ... ... ... .. . -5.5 -2.2 -4.1 0.1 0.9 -0.6 -0.1 -2.0 2.4 ... -0.9 0.1 -0.5
-0.1 0.0 0.3 0.0 -0.2 -0.2 ... -1.7 0.0 -1.0 1.5 ... ... .. . ... ... ... -7.5 ... -7.5 0.7 0.5 ... . .. ... ... .. . -0.1 0.5 0.0
-2.5 -1.6 0.4 0.1 -0.6 -1.4 ... -3.9 -0.6 -2.5 -2.0 -3.4 -3.0 -1.9 -2.5 ·2.6 -1.7 -2.5 -2.5 -2.5 -1.3 -1.3 2.7 0.4 -0.8 -3.0 -3.8 -3.0 -1.0 -2.1 -1.7 1.4 1.2 -5.4 -1.5 -2.6 ... -4.4 -1.4 -3.2
293
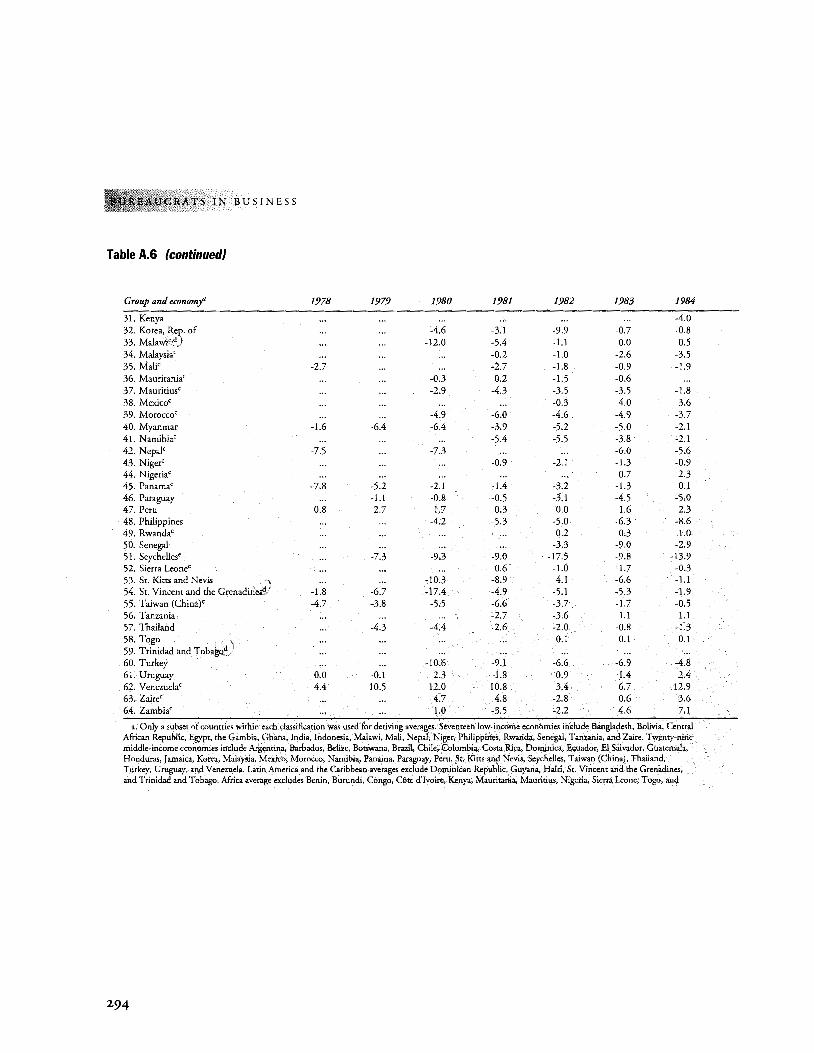
ATS IN BUSINESS
Table A.G (continued}
Group and economj' 1978 1979 1980 1981 1982 1983 1984
31. Kenya ... . .. ... . .. ... . .. -4.0 32. Korea, Rep. of ... . .. -4.6 -3.1 -9.9 -0.7 -0.8 :33. Mala~":.d) ... . .. -12.0 -5.4 -I.l 0.0 0.5 :34. Malaysia' ... . .. . .. -0.2 -1.0 -2.6 -3.5 35. Mali' -2.7 ... ... -2.7 -1.8 -0.9 -1.9 36. Mauritania' ... . .. -0.3 0.2 -1.5 -0.6 37. Mauritius' ... . .. -2.9 -4.3 -3.5 -3.5 -1.8 38. Mexico' ... . .. ... . .. -0.3 4.0 3.6 39. Morocco' ... . .. -4.9 -6.0 -4.6 -4.9 -3.7 40. Myanmar -1.6 -6.4 -6.4 -3.9 -5.2 -5.0 -2.1 41. Namibia' ... . .. . .. -5.4 -5.5 -3.8 -2.1 42. Nepal' -7.5 ... -7.3 ... . .. -6.0 -5.6 43. Niger' ... . .. ... -0.9 -2.1 -1.3 -0.9 44. Nigeria< ... ... . .. . .. ... 0.7 2.3 45. Panama' -7.8 -5.2 -2.1 -1.4 -3.2 -1.3 0.1 46. Paraguay ... -Ll -0.8 -0.5 -3.1 -4.5 -5.0 47. Peru 0.8 2.7 1.7 0.3 0.0 1.6 2.3 48. Philippines ... ... -4.2 -5.3 -5.0 -6.3 -8.6 49. Rwanda' ... . .. . .. ... 0.2 0.3 1.0 50. Senegal ... ... ... ... -3.3 -9.0 -2.9 5 I. Seychelles' ... -7.3 -9.3 -9.0 -17.5 -9.8 -13.9 52. Sierra Leone< ... . .. ... 0.6 -1.0 -1.7 -0.3 53. St. Kitts and Nevis .. , ... ... -10.3 -8.9 4.1 -6.6 -Ll 54. St. Vincent and the Grenadinbs?/ -1.8 -6.7 -17.4 -4.9 -5.1 -5.3 -1.9 55. Taiwan (China)' -4.7 -3.8 -5.5 -6.6 -3.7 -1.7 -0.5 56. Tanzania ... ... ... -2.7 -3.6 1.1 1.1 57. Thailand ... -4.3 -4.4 -2.6 -2.0 -0.8 -1.3 58. Togo .. -, ... . .. ... .. . 0.1 0.1 0.1 59. Trinidad and Toba~d/ ... ... ... .. . ... . .. .. . 60. Turkey ... . .. -10.6 -9.1 -6.6 -6.9 -4.8 61. Uruguay 0.0 -0.1 2.3 1.8 0.9 1.4 2.4 62. Venezuela' 4.4 10.5 12.0 10.8 3.4 6.7 12.9 63. Zaire< ... . .. 4.7 4.8 -2.8 0.6 3.6 64. Zambia< ... ... 1.0 -3.5 -2.2 4.6 7.1
a. Only a subset of countries within eacb classification was used for deriving averages. Seventeen low-income economies include Bangladesh, Bolivia, Central African Republic, Egypt, the Gambia, Ghana, India, Indonesia, Malawi, Mali, Nepal, Niger, Philippines, Rwanda, Senegal, Tanzania, and Zaire. Twenty-nine middle-income economies include Argentina, Barbados, Belize, BotsWana, Brazil, Chile, Colombia, Costa Rica, Dominica, Ecuador, El Salvador, Guatemala, Honduras, Jamaica, Korea, Malaysia, Mexico, Morocco, Namibia, Panama, Paraguay, Peru, St. Kitts and Nevis, Seychelles, Taiwan (China), Thailand, Turkey, Uruguay, and Venezuela. Latin America and the Caribbean averages exclude Dominican Republic, Guyana, Haiti, St. Vincent and the Grenadines, and Trinidad and Tobago. Africa average excludes Benin, Burundi, Congo, Cote d'lvoire, Kenya, Mauritania, Mauritius, Nigeria, Sierra Leone, Togo, and
294
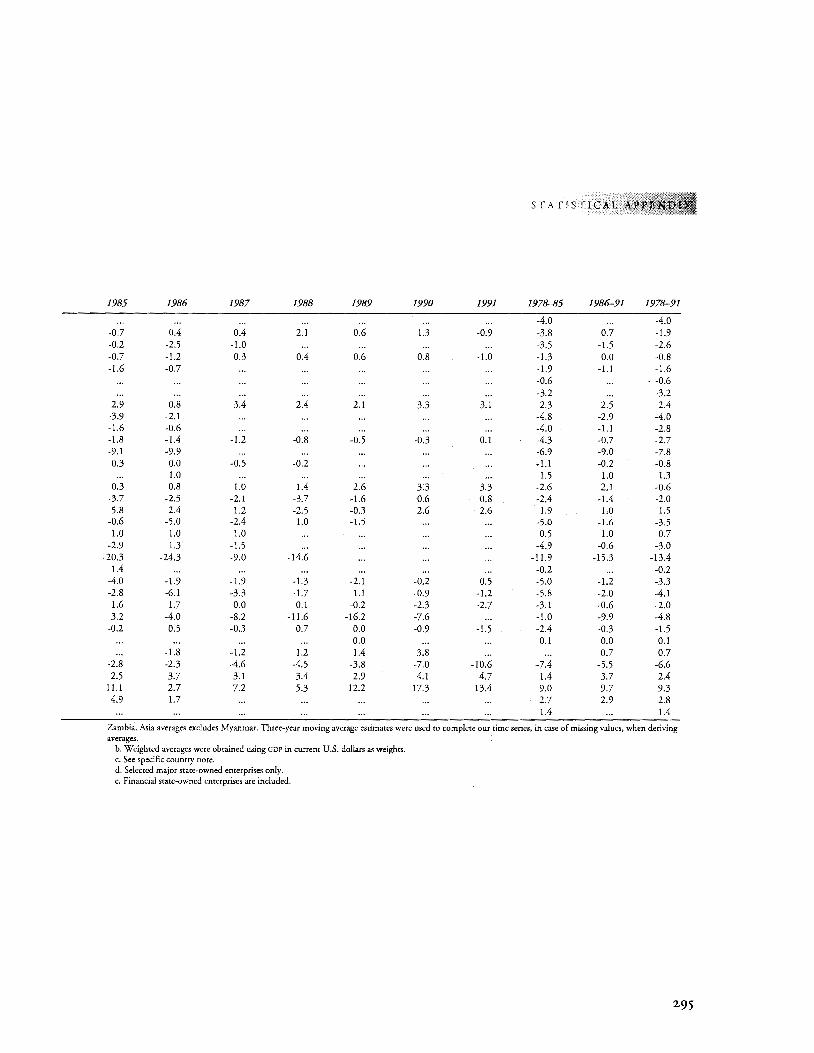
STATISTICAL APP£
1985 1986 1987 1988 1989 1990 1991 1978-85 1986-91 1978-91
-4.0 ... -4.0 -0.7 0.4 0.4 2.1 0.6 1.3 -0.9 -3.8 0.7 -1.9 -0.2 -2.5 -1.0 ... . .. . .. . .. -3.5 -1.5 -2.6 -0.7 -1.2 0.3 0.4 0.6 0.8 -1.0 -1.3 0.0 -0.8 -1.6 -0.7 ... . .. . .. . .. . .. -1.9 -1.1 -1.6
-0.6 ... . -0.6 -3.2 ... -3.2
2.9 0.8 3.4 2.4 2.1 3.3 3.1 2.3 2.5 2.4 -3.9 -2.1 ... . .. . .. . .. . .. -4.8 -2.9 -4.0 -1.6 -0.6 ... . .. . .. . .. -4.0 -1.1 -2.8 -1.8 -1.4 -1.2 -0.8 -0.5 -0.3 0.1 -4.3 -0.7 -2.7 -9.1 -9.9 ... . .. . .. . .. . .. -6.9 -9.0 -7.8 0.3 0.0 -0.5 -0.2 ... ... . .. -1.1 -0.2 -0.8
1.0 ... ... ... ... ... 1.5 1.0 1.3 0.3 0.8 1.0 1.4 2.6 3.3 3.3 -2.6 2.1 -0.6
-3.7 -2.5 -2.1 -3.7 -1.6 0.6 0.8 -2.4 -1.4 -2.0 5.8 2.4 1.2 -2.5 -0.3 2.6 2.6 1.9 1.0 1.5
-0.6 -5.0 -2.4 1.0 -1.5 ... ... -5.0 -1.6 -3.5 1.0 1.0 1.0 ... . .. . .. ... 0.5 1.0 0.7
-2.9 1.3 -1.5 ... ... . .. ... -4.9 -0.6 -3.0 -20.3 -24.3 -9.0 -14.6 ... . .. . .. -11.9 -15.3 -13.4
1.4 ... ... ... ... ... ... -0.2 ... -0.2 -4.0 -1.9 -1.9 -1.3 -2.1 -0.2 0.5 -5.0 -1.2 -3.3 -2.8 -6.1 -3.3 -1.7 1.1 -0.9 -1.2 -5.8 -2.0 -4.1 1.6 1.7 0.0 0.1 -0.2 -2.3 -2.7 -3.1 -0.6 -2.0 3.2 -4.0 -8.2 -11.6 -16.2 -7.6 ... -1.0 -9.9 -4.8
-0.2 0.5 -0.3 0.7 0.0 -0.9 -1.5 -2.4 -0.3 -1.5 0.0 ... ... 0.1 0.0 0.1
-1.8 -1.2 1.2 1.4 3.8 ... ... 0.7 0.7 -2.8 -2.3 -4.6 -4.5 -3.8 -7.0 -10.6 -7.4 -5.5 -6.6 2.5 3.7 3.1 3.4 2.9 4.1 4.7 1.4 3.7 2.4
11.1 2.7 7.2 5.3 12.2 17.3 13.4 9.0 9.7 9.3 4.9 1.7 ... . .. . .. ... . .. 2.7 2.9 2.8
1.4 ... 1.4
Zambia. Asia averages excludes Myanmar. Three~year moving average estimates were used to complete our time series, in case of missing values, when deriving averages.
b. Weighted averages were obtained using GDP in current U.S. dollars as weights. c. See specific country note. d. Selected major state-owned enterprises only. e. Financial state~owned enterprises are included.
295
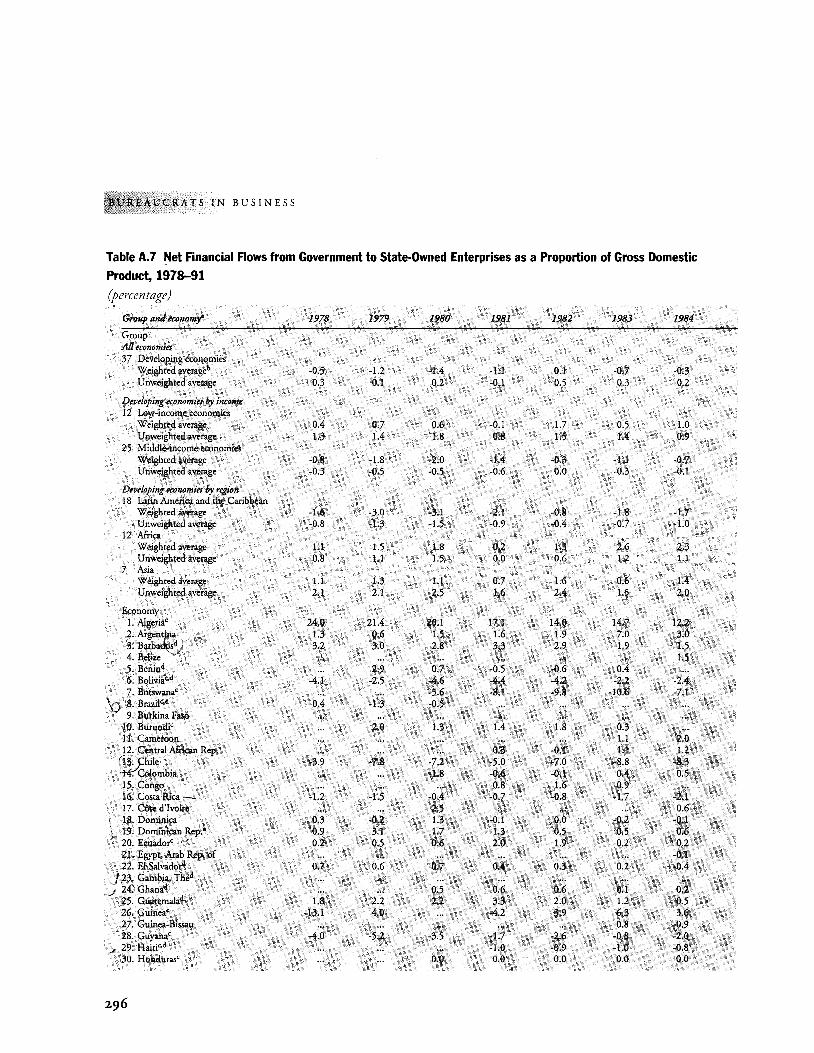
.;~EA U C RATS IN BUS I N E S S
Table A.7 Net Financial Flows from Government to State-Owned Enterprises as a Proportion of Gross Domestic Product, 1978-91
(percentage)
Group and economj' 1978 1979 1980 1981 1!)82 1983 1984
Group All economies 3 7 Developing economies
Weighted average'> -0.5 -1.2 -!.4 -1.1 0.1 -0.7 -0.3 Unweighted average 0.3 0.1 0.2 -0.1 0.5 0.3 0.2
Developing economies by income 12 Low-income economies
Weighted average 0.4 0.7 0.6 -0.1 1.7 0.5 1.0 Unweighted average 1.3 1.4 1.8 0.8 1.5 1.4 0.9
25 Middle-income economies Weighted average -0.8 -1.8 -2.0 -1.4 -Q.3 -1.1 -0.7 Unweighted average -0.3 -0.5 ·0.5 -0.6 0.0 ·0.3 -0.1
Developing economies by region 18 Latin America and the Caribbean
Weighted average -1.6 ·3.0 -3.1 -2.1 -0.8 -1.8 -1.7 Unweighted average -0.8 -1.3 -1.5 -0.9 -0.4 -0.7 -1.0
12 Mrica Weighted average 1.1 1.5 1.8 0.2 1.3 2.6 2.3 Unweighted average 0.8 1.1 1.5 0.0 0.6 1.2 l.l
7 Asia Weighted average 1.1 1.3 1.1 0.7 1,6 0.6 1.4 Unweighted average 2.1 2.1 2.5 1.6 2.4 1.5 2.0
Economy I. Algeria' 24.0 21.4 20.1 17.1 14.0 14.7 12.2 2. Argentina· 1.3 0.6 !.5 1.6 1.9 7.0 3;0 3. Barba~:}'· 3.2 3.0 2.8 3.3 2.9 1.9 !.5 4. Belize · ... . .. ... . .. . .. . .. 1.5 5. Benind ... 2.9 0.7 ·0.5 -0.6 o.4 "~~~
6. Bo!ivia0•d -4.1 -2.5 -4.6 -4.4 -4.2 -2.2 -2.4 7. Botswana< ... . .. -5.6 -8.1 ·9.8 -10.6 -7.1 8. Brazil<·• 0.4 -!.3 -0.5 9. Burkina Faso ... ... . ..
10. Burundi' ... 2.0 1.3 1.4 1.8 0.3 II. Cameroon ... . .. ... . .. .. . 1.1 2.0 12, Central African Rep. ... ... . .. Q.3 -0.! ·u 1.2
~hile -3.9 -7.8 ·7.2 .;:o -7.0 -8.8 -8.3 . Colombia ... ... ·1.8 ..0.6 ·0.1 0.4 0.5
15. Congo ... ... . .. 0.8 t6 0.9 16, Costa Rica- -1.2 ·1.5 -0.4 -0.7 -0.8 -1.7 -2.1 17. Cllte d'Ivoire ... . .. 2.5 ... ... ... 0.6
\ 18. Dominica 0.3 -0.2 1.3 -0.1 o.o ..0.2 ·O.l 0 19. Dominican Rep.• 0.9 3.1 1.7 1..3 05 0.5 .0~6
20. Ecuador< 0.2 0.5 0~6 2.0 1.9 0.2 0.2 2!. Egypt, Arab Rep. of ... ... ... ... ... ,H"' ..0:.1 22. El Salvadord 0.7 0.6 0~7 0.4 0.3 0.2 .()~~
"f ~3. Gambia, The<i ... ... . .. ... ... . .. .. . . J 24. Ghanad ... ... 0.5 0.6. 0.6 0,1 0.2
25. Guatemalad 1.8 2.2 2.2 3.3 2.0 1.2 Q.5 26. Guinea< ·13.1 4.0 ... -4.2 3;9 6.3 3.6 27. Guinea-Bissau ... ... ... ... .. . 0.8 "0.9 28. Guyana< -4.0 -5.2 -3.5 -1.7 -2.6 -0.8 -2~0
~ 29. Hairi"'d ... ... . .. -1.0 -0 . .9 -LO -0.8 · 30. Honduras" ... ... o.o o.o o.o 0.0 o.o
296
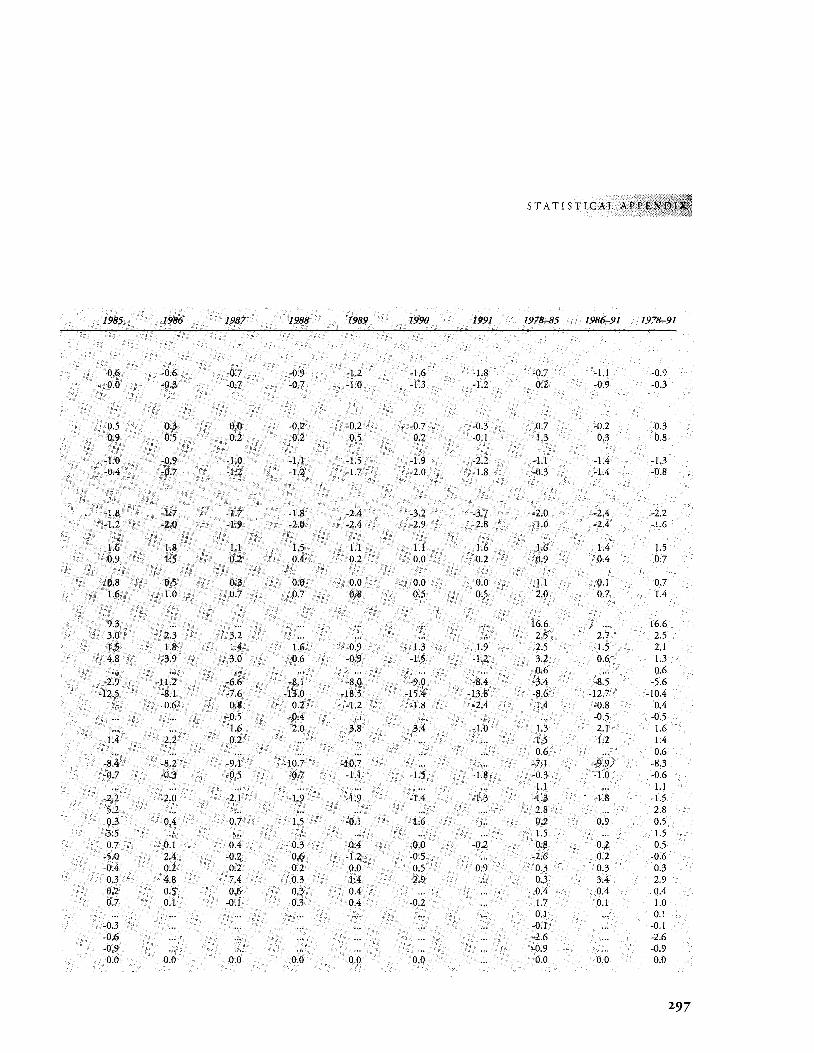
STATISTICAL APPENt:h~ ·~'a
1985 1986 1987 1988 1989 1990 1991 1978--85 1986-91 1978-91
-0.6 -0.6 -0.7 -0.9 -1.2 -1.6 -1.8 -0.7 -1.1 -0.9 0.0 -0.3 -0.7 -0.7 -1.0 -1.3 -1.2 0.2 -0.9 -0.3
0.5 0.3 0.0 -0.2 -0.2 -0.7 -0.3 0.7 -0.2 0.3 0.9 0.5 0.2 0.2 0.5 0.2 -0.1 1.3 0.3 0.8
-1.0 -0.9 -1.0 -1.1 -1.5 -1.9 -2.2 -1.1 -1.4 -1.3 -0.4 -0.7 -1.2 -1.2 -1.7 -2.0 -1.8 -0.3 -1.4 -0.8
-1.8 -1.7 -1.7 -1.8 -2.4 -3.2 -3.7 -2.0 -2.4 -2.2 -1.2 -2.0 -1.9 -2.0 ·2.4 -2.9 -2.8 -1.0 -2.4 -1.6
1.6 1.8 1.1 1.5 1.1 1.1 1.6 1.6 1.4 1.5 0.9 1.5 0.2 0.4 0.2 0.0 0.2 0.9 0.4 0.7
0.8 0.5 0.3 0.0 0.0 0.0 0.0 1.1 0.1 0.7 1.6 1.0 0.7 0.7 0.8 0.5 0.5 2.0 0.7 1.4
9.3 ... ... ... . .. ... . .. 16.6 )· ... 16.6 3.0 2.3 3.2 ... ... ... ... 2.5 2.7 2.5 1.5 1.8 1.4 1.6 0.9 1.3 1.9 2.5 1.5 2.1 4.8 3.9 3.0 0.6 -0.9 -1.5 -1.2 3.2 0.6 1.3
0.6 ... 0.6 -2.9 -11.2 -6.6 -8.1 -8.0 -9.0 -8.4 -3.4 -8.5 -5.6
-12.5 -8.1 -7.6 ·13.0 -18.5 -15.4 -13.8 -8.6 -12.7 -10.4 -0.6 0.8 0.2 -1.2 -1.8 -2.4 1.4 -0.8 0.4
-0.5 -0.4 ... . .. ... ... -0.5 -0.5 1.6 2.0 3.8 3.4 -1.0 1.3 2.1 1.6
1.4 2.2 0.2 ... ... ... . .. 1.5 1.2 1.4 ... . .. ... . .. . .. ... .. . 0.6 0.6
-8.4 -8.2 -9.1 -10.7 -10.7 ... ... -7.1 . -9.'V -8.3 0.7 -0.3 -0.5 -0.7 -1.1 -1.5 -1.8 -0.3 ··:co -0.6
1.1 ... 1.1 -2.2 -2.0 -2.1 -1.9 -1.9 -1.4 -1.3 -1.3 . -1.8 -1.5 5.2 ... ... ... ... . .. .. . 2.8 . .. 2.8 0.3 0.4 0.7 1.5 -0.1 1.6 ... 0.2 0.9 0.5 3.5 ... ... ... ... ... ... 1.5 .. . 1.5 0.7 0.1 0.4 0.3 0.4 0.0 -0.2 0.8 0.2 0.5
-5.0 2.4 -0.2 0.6 -1.2 -0.5 ... -2.6 0.2 -0.6 -0.4 0.2 0.2 0.2 0.0 0.5 0.9 0.3 0.3 0.3 0.3 4.8 7.4 0.3 1.4 2.9 ... 0.3 3.4 2.9 0.2 0.5 0.6 0.3 0.4 ... ... 0.4 0.4 0.4 0.7 0.1 -0.1 0.3 0.4 -0.2 ... 1.7 0.1 1.0
0.1 ... 0.1 -0.3 ... ... . .. . .. ... .. . -0.1 ... -0.1 -0.6 ... ... ... ... . .. ... -2.6 ... -2.6 -0.9 ... ... . .. ... ... ... -0.9 . .. -0.9 0.0 0.0 0.0 0.0 0.0 0.0 ... 0.0 0.0 0.0
297
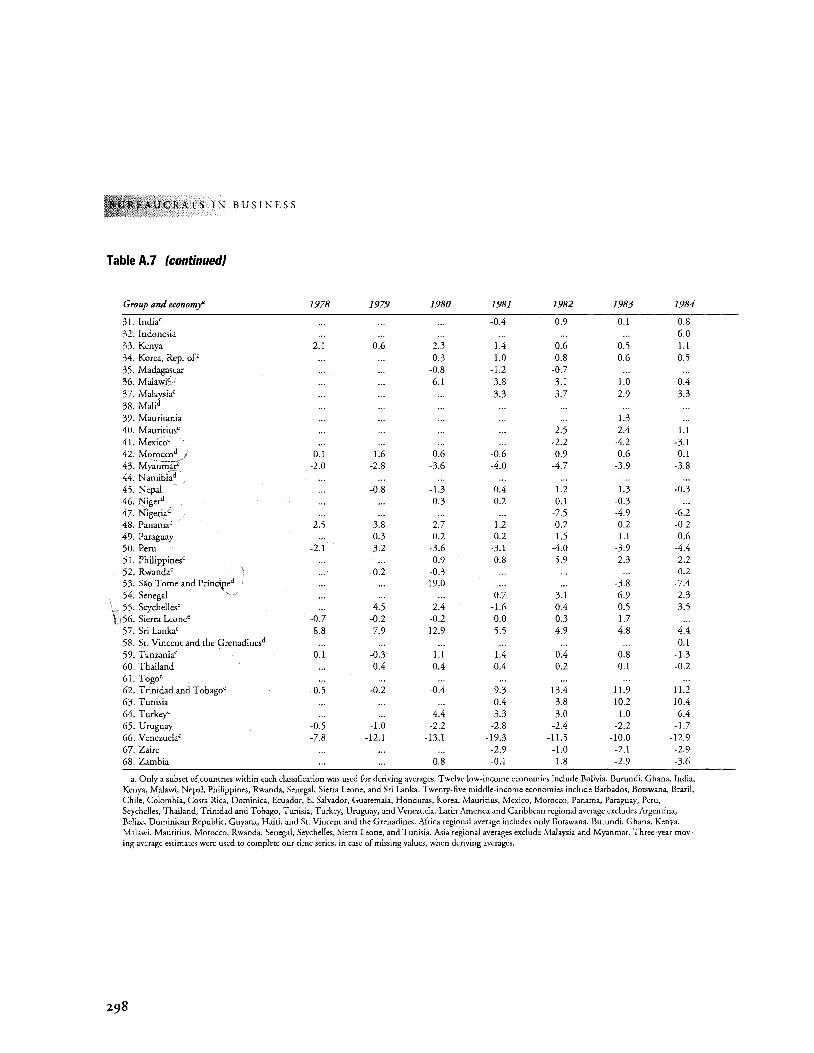
C RATS IN B US I N E S S
Table A.7 (continued}
Group and economj' 1978 1979 1980 1981 1982 1983 1984
31. Indd ... . .. . .. -0.4 0.9 0.1 0.8 32. Indonesia ... ... . .. . .. . .. . .. 6.0 33. Kenya 2.1 0.6 2.3 1.4 0.6 0.5 1.1 34. Korea, Rep. of' ... . .. 0.3 1.0 0.8 0.6 0.5 35. Madagascar ... . .. -0.8 -1.2 -0.7 36. Malawid ... . .. 6.1 3.8 3.1 1.0 0.4 37. Malaysia' ... . .. . .. 3.3 3.7 2.9 3.3 38. Malid 39. Mauritania ... . .. . .. ... 1.3 40. Mauritius' ... ... . .. . .. 2.5 2.4 1.1 41. Mexico' ... . .. ... . .. -2.2 -4.2 -3.1 42. Moroccod ) 0.1 1.6 0.6 -0.6 0.9 0.6 0.1 43. Myanmar<' -2.0 -2.8 -3.6 -4.0 -4.7 -3.9 -3.8 44. Namibiad ... . .. . .. . .. ... 45. Nepal -0.8 -1.3 0.4 1.2 1.3 -0.3 46. Nige~ ... ... 0.3 0.2 0.1 -0.3 47. Nigeri~d ... . .. . .. . .. -7.5 -4.9 -6.2 48. Panama" 2.5 3.8 2.7 1.2 0.2 0.2 -0.2 49. Paraguay ... 0.3 0.2 0.2 1.5 1.1 0.6 50. Peru -2.1 -3.2 -3.6 -3.1 -4.0 -3.9 -4.4 51. Philippines' ... 0.9 0.8 5.9 2.3 2.2 52. Rwanda' ... -0.2 -0.3 ... . .. 0.2
53. Sao Tome and Princ\ped ... . .. -19.0 . .. . .. -3.8 -7.4 54. Senegal · ... ... . .. 0.7 3.1 6.9 2.3 55. Seychelles' ... 4.5 2.4 -1.6 0.4 0.5 3.5
L 56. Sierra Leone' -0.7 -0.2 -0.2 0.0 0.3 1.7 57. Sri Lanka' 8.8 7.9 12.9 5.5 4.9 4.8 4.4 58. St. Vincent and the Grenadinesd ... . .. ... . .. . .. . .. 0.1 59. Tanzania' 0.1 -0.3 1.1 1.4 0.4 0.8 -1.3 60. Thailand ... 0.4 0.4 0.4 0.2 0.1 -0.2 61. Togo' 62. Trinidad and Tobago' -0.5 -0.2 -0.4 9.3 13.4 11.9 11.2 63. Tunisia ... ... ... 0.4 3.8 10.2 10.4 64. Turkey' ... ... 4.4 3.3 3.0 1.0 6.4 65. Uruguay -0.5 -1.0 -2.2 -2.8 -2.4 -2.2 -1.7 66. Venezuela' -7.8 -12.1 -13.1 -19.3 -11.5 -10.0 -12.9 67. Zaire ... ... .. . -2.9 -1.0 -2.1 -2.9 68. Zambia ... ... 0.8 -0.1 1.8 -2.9 -3.6
a. Only a subset of countries within each classification was used for deriving averages. Twelve low-income economies include Bolivia, Burundi, Ghana, India, Kenya, Malawi, Nepal, Philippines, Rwanda, Senegal, Sierra Leone, and Sri Lanka. Twenty-five middle-income economies include Barbados, Botswana, Brazil, Chile, Colombia, Costa Rica, Dominica, Ecuador, El Salvador, Guatemala, Honduras, Korea, Mauritius, Mexico, Morocco, Panama, Paraguay, Peru, Seychelles, Thailand, Trinidad and Tobago, Tunisia, Turkey, Uruguay, and Venezuela. Latin America and Caribbean regional average excludes Argentina, Belize, Dominican Republic, Guyana, Haiti, and St. Vincent and the Grenadines. Africa regional average includes only Botswana, Burundi, Ghana. Kenya, Malawi, Mauritius, Morocco, Rwanda, Senegal, Seychelles, Sierra Leone, and Tunisia. Asia regional averages exclude Malaysia and Myanmar. Three-year mov-ing average estimates were used to complete our time series, in case of missing values, when deriving averages.
298
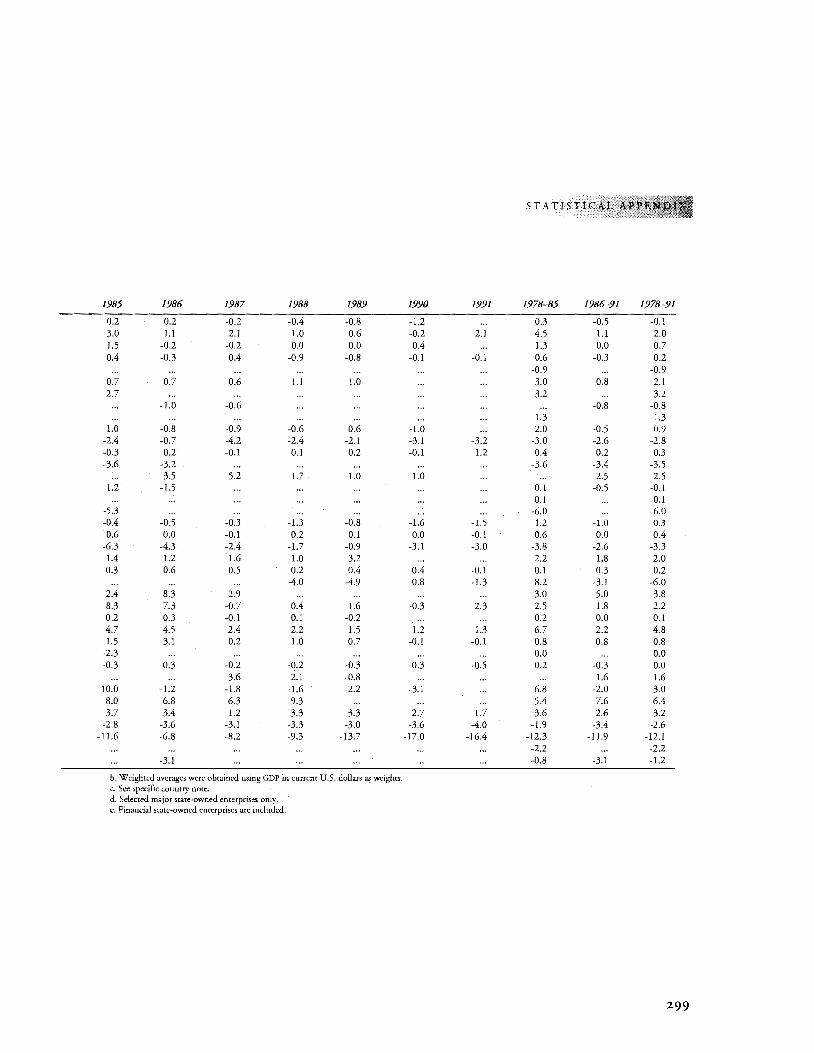
STATISTICAL AP
1985 1986 1987 1988 1989 1990 1991 1978-85 1986-91 1978-91
0.2 0.2 -0.2 -0.4 -0.8 -1.2 ... 0.3 -0.5 -0.1 3.0 1.1 2.1 1.0 0.6 -0.2 2.1 4.5 1.1 2.0 1.5 -0.2 -0.2 0.0 0.0 0.4 ... 1.3 0.0 0.7 0.4 -0.3 0.4 -0.9 -0.8 -0.1 -0.1 0.6 -0.3 0.2
-0.9 ... -0.9 0.7 0.7 0.6 1.1 1.0 ... ... 3.0 0.8 2.1 2.7 ... . .. ... 3.2 . .. 3.2
-1.0 -0.6 ... ... . .. . .. -0.8 -0.8 1.3 1.3
1.0 -0.8 -0.9 -0.6 0.6 -1.0 ... 2.0 -0.5 0.9 -2.4 -0.7 -4.2 -2.4 -2.1 -3.1 -3.2 -3.0 -2.6 -2.8 -0.3 0.2 -0.1 0.1 0.2 -0.1 1.2 0.4 0.2 0.3 -3.6 -3.2 ... . .. . .. . .. -3.6 -3.4 -3.5
3.5 5.2 1.7 1.0 1.0 ... 2.5 2.5 1.2 -1.5 ... . .. . .. ... . .. 0.1 -0.5 -0.1
0.1 ... 0.1 -5.3 ... . .. . .. ... . .. -6.0 . .. -6.0 -0.4 -0.5 -0.3 -1.3 -0.8 -1.6 -1.5 1.2 -1.0 0.3 0.6 0.0 -0.1 0.2 0.1 0.0 -0.1 0.6 0.0 0.4
-6.3 -4.3 -2.4 -1.7 -0.9 -3.1 -3.0 -3.8 -2.6 -3.3 1.4 1.2 1.6 1.0 3.2 ... . .. 2.2 1.8 2.0 0.3 0.6 0.5 0.2 0.4 0.4 -0.1 0.1 0.3 0.2
-4.0 -4.9 -0.8 -1.3 -8.2 -3.1 -6.0 2.4 8.3 2.9 ... . .. ... . .. 3.0 5.0 3.8 8.3 7.3 -0.7 0.4 1.6 -0.3 2.3 2.5 1.8 2.2 0.2 0.3 -0.1 0.1 -0.2 ... ... 0.2 0.0 0.1 4.7 4.5 2.4 2.2 1.5 1.2 1.3 6.7 2.2 4.8 1.5 3.1 0.2 1.0 0.7 -0.1 -0.1 0.8 0.8 0.8
-2.3 ... . .. . .. . .. 0.0 0.0 -0.3 -0.3 -0.2 -0.2 -0.3 -0.3 -0.5 0.2 -0.3 0.0
3.6 2.1 -0.8 ... ... . .. 1.6 1.6 10.0 -1.2 -1.8 -1.6 -2.2 -3.1 ... 6.8 -2.0 3.0 8.0 6.8 6.3 9.3 ... . .. ... 5.4 7.6 6.4 3.7 3.4 1.2 3.3 3.3 2.7 1.7 3.6 2.6 3.2
-2.8 -3.6 -3.1 -3.3 -3.0 -3.6 -4.0 -1.9 -3.4 -2.6 -11.6 -6.8 -8.2 -9.3 -13.7 -17.0 -16.4 -12.3 -11.9 -12.1
-2.2 ... -2.2 -3.1 ... . .. . .. ... . .. -0.8 -3.1 -1.2
b. Weighted averages were obtained using GDP in current U.S. dollars as weights. c. See specific country note. d. Selected major state-owned enterprises only. e. Financial state-owned enterprises are included.
299
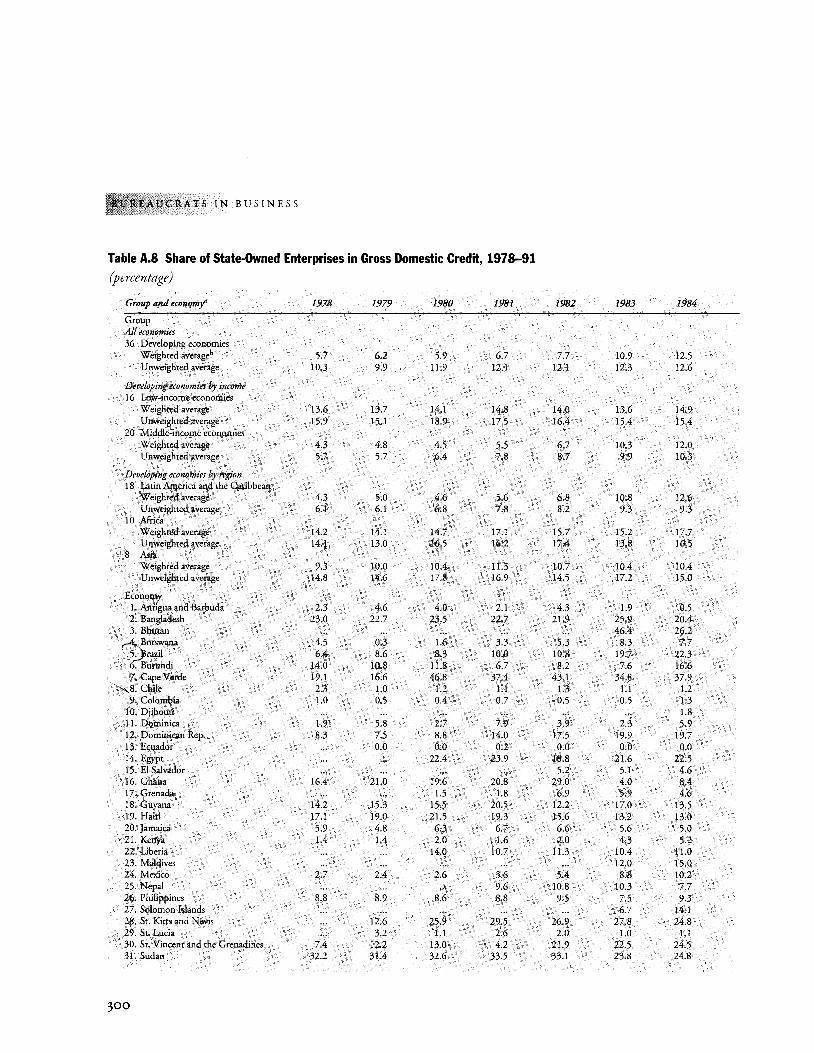
PCRATS IN BUSINESS
Table A.S Share of State-Owned Enterprises in Gross Domestic Credit, 1978-91 (percentage)
Group and economj' 1978 1979 1980 1981 1982 1983 1984
Group All economies 36 Developing economies
Weighted averageh 5.7 6.2 5.9 6.7 7.7 10.9 12.5 Unweighted average 10.3 9.9 11.9 12.1 12.1 12.3 12.6
Developing economies by income 16 Low"income economies
Weighted average 13.6 13.7 14.1 14.8 14.0 13.6 14.9 U nweighted average 15.9 15.1 18.9 17.5 16.4 15.4 15.4
20 Middle-income economies Weighted average 4.3 4.8 4.5 5.5 6.7 10.3 12.0 Unweighted average 5.7 5.7 6.4 7.8 8.7 9.9 10.3
Developing economies by region 18 Larin America and the Caribbean
Weighted average 4.3 5.0 4.6 5.6 6.8 10.8 12.6 Unweighted average 6.1 6.1 6.8 7.8 8.2 9.3 9.3
10 Africa Weighted average !4.2 14.1 14.7 17.1 15.7 15.2 17.7 Unweighted average 14.1 13.0 16.5 16.2 17.4 13.8 16.5
8 Asia Weighted average 9.3 10.0 10.4 11.3 10.7 10.4 10.4 Unweighted average 14.8 14.6 17.8 16.9 14.5 17.2 15.0
Economy 1. Antigua and Barbuda 2.3 4.6 4.0 2.1 4.3 1.9 0.5 2. Bangladesh 23.0 22.7 23.5 22.7 21.9 25.9 20.4 3. Bhutan ... ... . .. ... ... 46.4 26.2
(}Botswana 4.5 0.3 1.6 3.3 5.3 8.3 7.7 2Jrazil 6.4 8.6 8.3 10.0 10.8 19.7 22.3 6. Burundi 14.0 10.8 11.8 6.7 8.2 7.6 16.6 7. Cape Verde 19.1 16.6 46.8 37.4 43.1 34.8 37.9
··,s. Chile 2.3 1.0 !.2 J.1 1.3 1.1 1.2 9. Colombia 1.0 0.5 0.4 0.7 0.5 0.5 1.3
10. Djibouti ... ... . .. ... .. . ... 1.8 11. Dominica 1.9 5.8 2.7 7.9 3.9 2.3 5.9 12. Dominican Rep. 8.3 7.5 8.8 14.0 17.5 19.9 19.7 13. Ecuador ... 0.0 0.0 0.2 0.0 0.0 0.0 14. Egypt ... ... 22.4 23.9 18.8 21.6 22.5 15. El Salvador ... ... ... .. . 5.2 5.1 4.6 16. Ghana 16.4 21.0 19.6 20.8 29.0 4.0 8.4 17. Grenada ... ... !.5 1.8 6.9 5.9 4.6 18. Guyana 14.2 15.3 15.5 20.5 12.2 17.0 13.5 19. Haiti 17.1 19.0 21.5 19.3 15.6 13.2 13.0 20. Jamaica 5.9 4.8 6.3 6.7 6.6 5.6 5.0 2!. Kenya 1.4 1.4 2.0 1.6 2.0 4.3 5.2 22. Liberia ... ... 14.0 10.7 11.3 10.4 11.0 23. Maldives ... ... ... ... ... 12.0 15.0 24. Mexico 2.7 2.4 2.6 3.6 5.4 8.8 10.2 25. Nepal ... ... ... 9.6 10.8 10.3 7.7 26. Philippines 8.8 8.9 8.6 8.8 9.5 7.5 9.3 27. Solomon Islands ... ... ... . .. ... 6.7 14.1 28. St. Kitts and Nevis ... 12.6 25.9 29.5 26.9 27.8 24.8 29. St. Lucia ... 3.2 1.1 2.6 2.0 1.0 1.1 30. St. Vincent and the Grenadines 7.4 12.2 13.0 4.2 21.9 22.5 24.5 31. Sudan 32.2 31.4 32.6 33.5 33.1 23.8 24.8
300
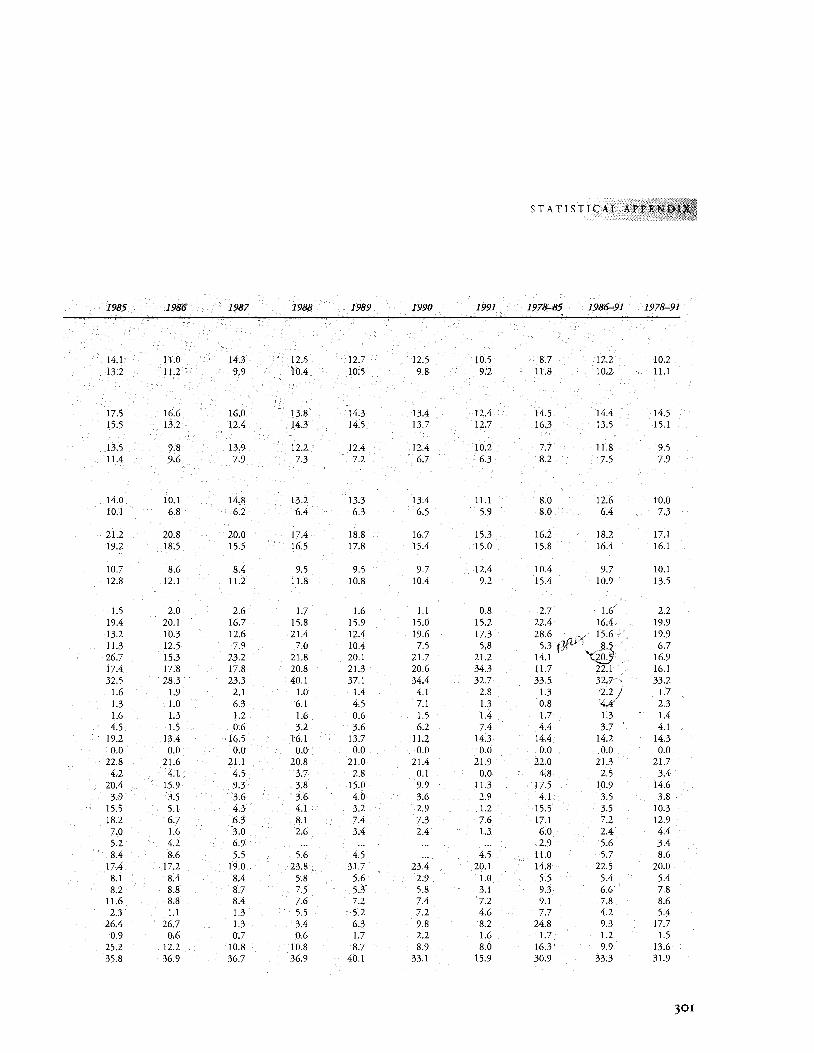
STATISTICAL AP
1985 1986 1987 1988 1989 1990 1991 1978-85 1986-91 1978-91
14.1 11.0 14.3 12.5 12.7 12.5 10.5 8.7 12.2 10.2 13.2 11.2 9.9 10.4 10.5 9.8 9.2 11.8 10.2 11.1
17.5 16.6 16.0 13.8 14.3 13.4 12.4 14.5 14.4 14.5 15.5 13.2 12.4 14.3 14.5 13.7 12.7 16.3 13.5 15.1
13.5 9.8 13.9 12.2 12.4 12.4 10.2 7.7 11.8 9.5 11.4 9.6 7.9 7.3 7.2 6.7 6.3 8.2 7.5 7.9
14.0 10.1 14.8 13.2 13.3 13.4 11.1 8.0 12.6 10.0 10.1 6.8 6.2 6.4 6.3 6.5 5.9 8.0 6.4 7.3
21.2 20.8 20.0 17.4 18.8 16.7 15.3 16.2 18.2 17.1 19.2 18.5 15.5 16.5 17.8 15.4 15.0 15.8 16.4 16.1
10.7 8.6 8.4 9.5 9.5 9.7 12.4 10.4 9.7 10.1 12.8 12.1 11.2 11.8 10.8 10.4 9.2 15.4 10.9 13.5
1.5 2.0 2.6 1.7 1.6 1.1 0.8 2.7 1.6/ 2.2 19.4 20.1 16.7 15.8 15.9 15.0 15.2 22.4 16.4 19.9 13.2 10.3 12.6 21.4 12.4 19.6 17.3 28.6 L/X 15.6. 19.9 11.3 12.5 7.9 7.0 10.4 7.5 5.8 5.3 tJef ~· 6.7 26.7 15.3 23.2 21.8 20.1 21.7 21.2 14.1 0. 16.9 17.4 17.8 17.8 20.8 21.3 20.6 34.3 11.7 22.1 16.1 32.5 28.3 23.3 40.1 37.1 34.4 32.7 33.5
3tp 33.2
1.6 1.9 2.1 1.0 1.4 4.1 2.8 1.3 (2.2 1.7 1.3 1.0 6.3 6.1 4.5 7.1 1.3 0.8 2.3 1.6 1.3 1.2 1.6 0.6 1.5 1.4 1.7 1.3 1.4 4.5 1.5 0.6 3.2 3.6 6.2 7.4 4.4 3.7 4.1
19.2 13.4 16.5 16.1 13.7 11.2 14.3 14.4 14.2 14.3 0.0 0.0 0.0 0.0 0.0 0.0 0.0 0.0 0.0 0.0
22.8 21.6 21.1 20.8 21.0 21.4 21.9 22.0 21.3 21.7 4.2 4.1 4.5 3.7 2.8 0.1 0.0 4.8 2.5 3.4
20.4 15.9 9.3 3.8 15.0 9.9 11.3 17.5 10.9 14.6 3.9 3.5 3.6 3.6 4.0 3.6 2.9 4.1 3.5 3.8
15.5 5.1 4.3 4.1 3.2 2.9 1.2 15.5 3.5 10.3 18.2 6.7 6.3 8.1 7.4 7.3 7.6 17.1 7.2 12.9 7.0 1.6 3.0 2.6 3.4 2.4 1.3 6.0 2.4 4.4 5.2 4.2 6.9 ... ... ... ... 2.9 5.6 3.4 8.4 8.6 5.5 5.6 4.5 ... 4.5 11.0 5.7 8.6
17.4 17.2 19.0 23.8 31.7 23.4 20.1 14.8 22.5 20.0 8.1 8.4 8.4 5.8 5.6 2.9 1.0 5.5 5.4 5.4 8.2 8.8 8.7 7.5 5.3 5.8 3.1 9.3 6.6 7.8
11.6 8.8 8.4 7.6 7.2 7.4 7.2 9.1 7.8 8.6 2.3 1.1 1.3 5.5 5.2 7.2 4.6 7.7 4.2 5.4
26.4 26.7 1.3 3.4 6.3 9.8 8.2 24.8 9.3 17.7 0.9 0.6 0.7 0.6 1.7 2.2 1.6 1.7 1.2 1.5
25.2 12.2 10.8 10.8 8.7 8.9 8.0 16.3 9.9 13.6 35.8 36.9 36.7 36.9 40.1 33.1 15.9 30.9 33.3 31.9
301
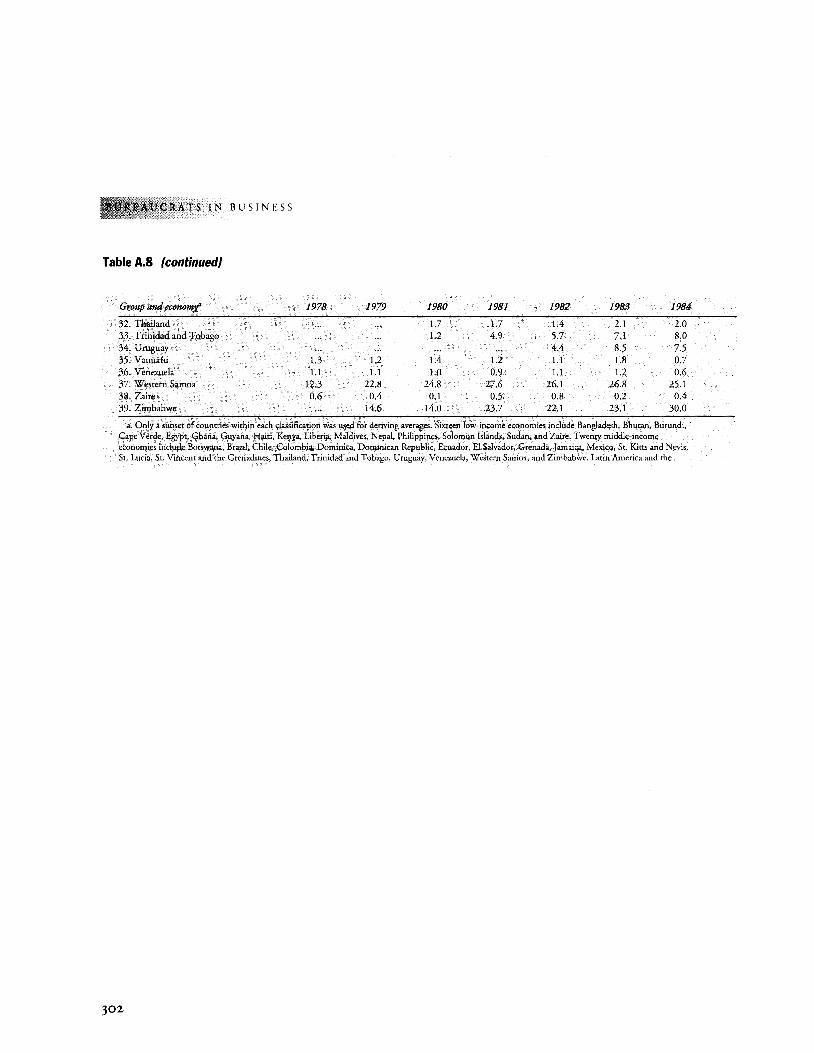
ATS IN BUSINESS
Table A.8 (continued}
Group and economj' 1978 1979 1980 1981 1982 1983 1984
32. Thailand 1.7 1.7 1.4 2.1 2.0 33. Trinidad and Tobago 1.2 4.9 5.7 7.1 8.0 34. Uruguay 4.4 8.5 7.5 35. Vanuatu 1.3 1.2 1.4 1.2 1.1 1.8 0.7 36. Venezuela 1.1 1.1 1.0 0.9 1.1 1.2 0.6 37. Western Samoa 12.3 22.8 24.8 27.6 26.1 26.8 25.1 38. Zaire 0.6 0.4 0.1 0.5 0.8 0.2 0.4 39. Zimbabwe 14.6 14.0 23.7 22.1 23.1 30.0
a. Only a subset of countries within each classification was used for deriving averages. Sixteen low-income economies include Bangladesh, Bhutan, Burundi, Cape Verde, Egypt, Ghana, Guyana, Haiti, Kenya, Liberia, Maldives, Nepal, Philippines, Solomon Islands, Sudan, and Zaire. Twenty middle-income economies include Botswana, Brazil, Chile, Colombia, Dominica, Dominican Republic, Ecuador, El Salvador, Grenada, Jamaica, Mexico, St. Kitts and Nevis, St. Lucia, St. Vincent and the Grenadines, Thailand, Trinidad and Tobago, Uruguay, Venezuela, Western Samoa, and Zimbabwe. Latin America and the
302
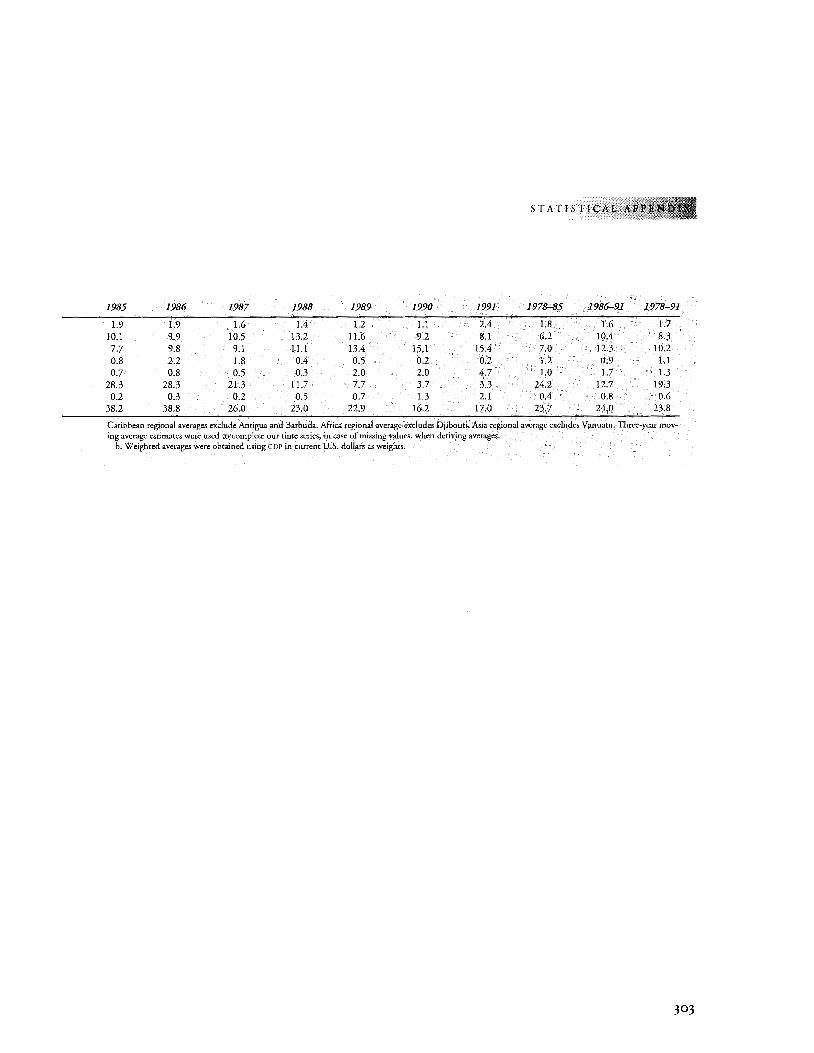
STATISTICAL
1985 1986 1987 1988 1989 1990 1991 1978-85 1986-91 1978-91
1.9 1.9 1.6 1.4 1.2 1.1 2.4 1.8 1.6 1.7 10.1 9.9 10.5 13.2 11.6 9.2 8.1 6.2 10.4 8.3 7.7 9.8 9.1 11.1 13.4 15.1 15.4 7.0 12.3 10.2 0.8 2.2 1.8 0.4 0.5 0.2 0.2 1.2 0.9 1.1 0.7 0.8 0.5 0.3 2.0 2.0 4.7 1.0 1.7 1.3
28.3 28.3 21.3 11.7 7.7 3.7 3.3 24.2 12.7 19.3 0.2 0.3 0.2 D.5 0.7 1.3 2.1 0.4 0.8 0.6
38.2 38.8 26.0 23.0 22.9 16.2 17.0 23.7 24.0 23.8
Caribbean regional averages exclude Antigua and Barbuda. Africa regional average excludes Djibouti. Asia regional average el<cludes Vanuatu. Three-year mov-ing average estimates were used to complete our time series, in case of missing values, when deriving averages.
b. Weighted averages were obtained using GDP in current U.S. dollars as weights.
303
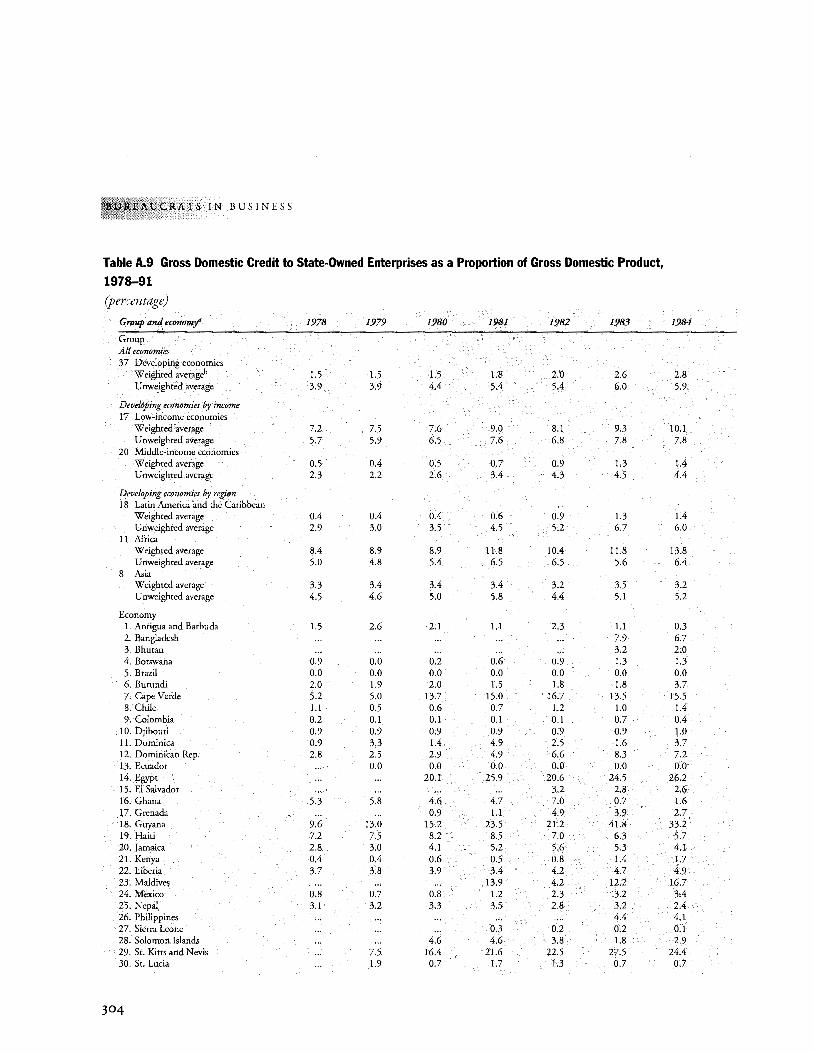
UCRATS IN BUSINESS
Table A.9 Gross Domestic Credit to State-Owned Enterprises as a Proportion of Gross Domestic Product,
1978-91
(percentage)
Group and economj' 1978 1979 1980 1981 1982 1983 1984
Group All economies 37 Developing economies
Weighted averageb 1.5 1.5 1.5 1.8 2.0 2.6 2.8 Unweighted average 3.9 3.9 4.4 5.4 5.4 6.0 5.9
Developing economies by income 17 Low-income economies
Weighted average 7.2 7.5 7.6 9.0 8.1 9.3 10.1 U nweighted average 5.7 5.9 6.5 7.6 6.8 7.8 7.8
20 Middle-income economies Weighted average 0.5 0.4 0.5 0.7 0.9 1.3 1.4 Unweighted average 2.3 2.2 2.6 3.4 4.3 4.5 4.4
Developing economies by region 18 Latin America and the Caribbean
Weighted average 0.4 0.4 0.4 0.6 0.9 1.3 1.4 Unweighred average 2.9 3.0 3.5 4.5 5.2 6.7 6.0
II Mrica Weighted average 8.4 8.9 8.9 11.8 10.4 11.8 13.8 U nweighted average 5.0 4.8 5.4 6.5 6.5 5.6 6.4
8 Asia Weighted average 3.3 3.4 3.4 3.4 3.2 3.5 3.2 Unweighted average 4.5 4.6 5.0 5.8 4.4 5.1 5.2
Economy I. Antigua and Barbuda 1.5 2.6 2.1 1.1 2.3 1.1 0.3 2. Bangladesh ... ... ... .. . . .. 7.9 6.7 3. Bhutan ... ... ... .. . . .. 3.2 2.0 4. Botswana 0.9 0.0 0.2 0.6 0.9 1.3 1.3 5. Brazil 0.0 0.0 0.0 0.0 0.0 0.0 0.0 6. Burundi 2.0 1.9 2.0 1.5 1.8 1.8 3.7 7. Cape Verde 5.2 5.0 13.7 15.0 16.7 13.5 15.5 8. Chile 1.1 0.5 0.6 0.7 1.2 1.0 1.4 9. Colombia 0.2 0.1 0.1 0.1 0.1 0.7 0.4
10. Djibouti 0.9 0.9 0.9 0.9 0.9 0.9 1.0 11. Dominica 0.9 3.3 1.4 4.9 2.5 1.6 3.7 12. Dominican Rep. 2.8 2.5 2.9 4.9 6.6 8.3 7.2 13. Ecuador ... 0.0 0.0 0.0 0.0 0.0 0.0 14. Egypt ... ... 20.1 25.9 20.6 24.5 26.2 15. El Salvador ... ... ... ... 3.2 2.8 2.6 16. Ghana 5.3 5.8 4.6 4.7 7.0 0.7 1.6 17. Grenada ... ... 0.9 1.1 4.9 3.9 2.7 18. Guyana 9.6 13.0 15.2 23.5 21.2 41.8 33.2 19. Haiti 7.2 7.5 8.2 8.5 7.0 6.3 5.7 20. Jamaica 2.8 3.0 4.1 5.2 5.6 5.3 4.1 21. Kenya 0.4 0.4 0.6 0.5 0.8 1.4 1.7 22. Liberia 3.7 3.8 3.9 3.4 4.2 4.7 4.9 23. Maldives ... ... .. . 13.9 4.2 12.2 16.7 24. Mexico 0.8 0.7 0.8 1.2 2.3 3.2 3.4 25. Nepal 3.1 3.2 3.3 3.5 2.8 3.2 2.4 26. Philippines ... ... ... .. . ... 4.4 4.1 27. Sierra Leone ... ... .. . 0.3 0.2 0.2 0.1 28. Solomon Islands ... ... 4.6 4.6 3.8 1.8 2.9 29. St. Kitts and Nevis ... 7.5 16.4 21.6 22.5 27.5 24.4 30. St. Lucia ... 1.9 0.7 1.7 1.3 0.7 0.7
304
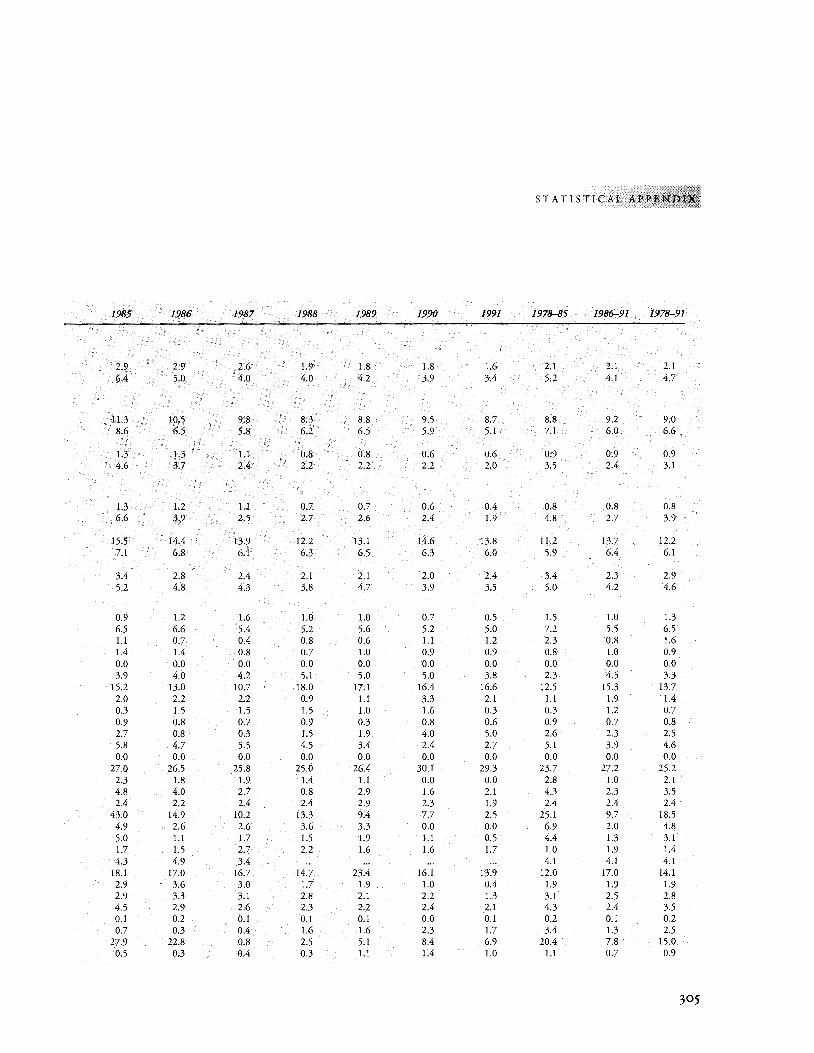
STATISTICAL APPIN
1985 1986 1987 1988 1989 1990 1991 1978-85 1986-91 1978-91
2.9 2.9 2.6 1.9 1.8 1.8 1.6 2.1 2.1 2.1 6.4 5.0 4.0 4.0 4.2 3.9 3.4 5.2 4.1 4.7
11.3 10.5 9.8 8.3 8.8 9.5 8.7 8.8 9.2 9.0 8.6 6.5 5.8 6.2 6.5 5.9 5.1 7.1 6.0 6.6
1.3 1.3 Ll 0.8 0.8 0.6 0.6 0.9 0.9 0.9 4.6 3.7 2.4 2.2 2.2 2.2 2.0 3.5 2.4 3.1
1.3 1.2 1.1 0.7 0.7 0.6 0.4 0.8 0.8 0.8 6.6 3.9 2.5 2.7 2.6 2.4 1.9 4.8 2.7 3.9
15.5 14.4 13.9 12.2 13.1 14.6 13.8 11.2 13.7 12.2 7.1 6.8 6.1 6.3 6.5 6.3 6.0 5.9 6.4 6.1
3.4 2.8 2.4 2.1 2.1 2.0 2.4 3.4 2.3 2.9 5.2 4.8 4.3 3.8 4.7 3.9 3.5 5.0 4.2 4.6
0.9 1.2 1.6 1.0 1.0 0.7 0.5 1.5 1.0 !.3 6.5 6.6 5.4 5.2 5.6 5.2 5.0 7.2 5.5 6.5 1.1 0.7 0.4 0.8 0.6 L1 1.2 2.3 0.8 1.6 1.4 1.4 0.8 0.7 1.0 0.9 0.9 0.8 1.0 0.9 0.0 0.0 0.0 0.0 0.0 0.0 0.0 0.0 0.0 0.0 3.9 4.0 4.2 5.1 5.0 5.0 3.8 2.3 4.5 3.3
15.2 13.0 10.7 18.0 17.1 16.4 16.6 12.5 15.3 13.7 2.0 2.2 2.2 0.9 1.1 3.3 2.1 1.1 1.9 1.4 0.3 1.5 1.5 1.5 1.0 !.6 0.3 0.3 1.2 0.7 0.9 0.8 0.7 0.9 0.3 0.8 0.6 0.9 0.7 0.8 2.7 0.8 0.3 !.5 1.9 4.0 5.0 2.6 2.3 2.5 5.8 4.7 5.5 4.5 3.4 2.4 2.7 5.1 3.9 4.6 0.0 0.0 0.0 0.0 0.0 0.0 0.0 0.0 0.0 0.0
27.0 26.5 25.8 25.0 26.4 30.1 29.3 23.7 27.2 25.2 2.3 1.8 1.9 1.4 1.1 0.0 0.0 2.8 1.0 2.1 4.8 4.0 2.7 0.8 2.9 1.6 2.1 4.3 2.3 3.5 2.4 2.2 2.4 2.4 2.9 2.3 1.9 2.4 2.4 2.4
43.0 14.9 10.2 13.3 9.4 7.7 2.5 25.1 9.7 18.5 4.9 2.6 2.6 3.6 3.3 0.0 0.0 6.9 2.0 4.8 5.0 1.1 1.7 1.5 1.9 1.1 0.5 4.4 1.3 3.1 !.7 1.5 2.7 2.2 !.6 1.6 1.7 1.0 1.9 1.4 4.3 4.9 3.4 ... ... ... ... 4.1 4.1 4.1
!8.1 17.0 16.7 14.7 23.4 16.1 13.9 12.0 17.0 14.1 2.9 3.6 3.0 1.7 1.9 1.0 0.4 1.9 1.9 1.9 2.9 3.3 3.1 2.8 2.1 2.2 1.3 3.1 2.5 2.8 4.5 2.9 2.6 2.3 2.2 2.4 2.1 4.3 2.4 3.5 0.1 0.2 0.1 0.1 0.1 0.0 0.1 0.2 0.1 0.2 0.7 0.3 0.4 1.6 1.6 2.3 1.7 3.4 1.3 2.5
27.9 22.8 0.8 2.5 5.1 8.4 6.9 20.4 7.8 15.0 0.5 0.3 0.4 0.3 1.1 1.4 1.0 1.1 0.7 0.9
305
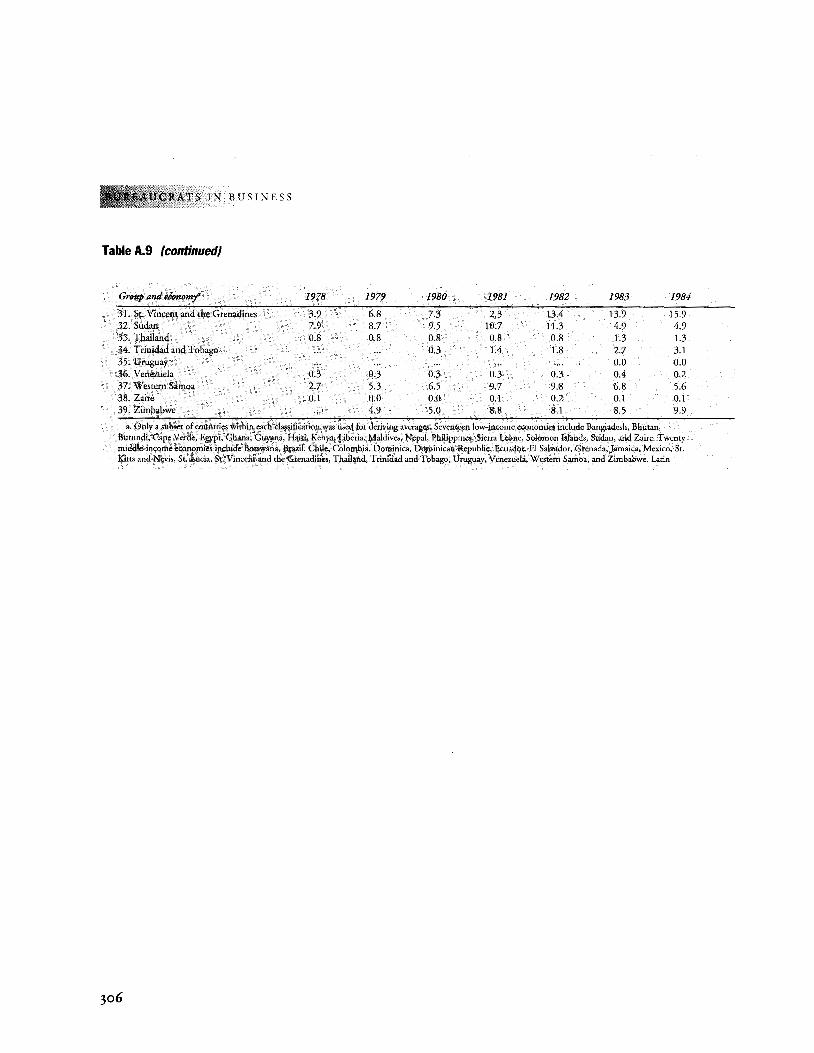
ATS IN BUSINESS
Table A.9 {continued}
Group and economj' 1978 1979 1980 1981 1982 1983 1984
31. St. Vincent and the Grenadines 3.9 6.8 7.3 2.3 13.4 13.9 15.9 32. Sudan 7.9 8.7 9.5 10.7 11.3 4.9 4.9 33. Thailand 0.8 0.8 0.8 0.8 0.8 1.3 1.3 34. Trinidad and Tobago ... ... 0.3 1.4 1.8 2.7 3.1 35. Uruguay ... ... . .. . .. . .. 0.0 0.0 36. Venezuela 0.3 0.3 0.3 0.3 0.3 0.4 0.2 37. Western Samoa 2.7 5.3 6.5 9.7 9.8 6.8 5.6 38. Zaire 0.1 0.0 0.0 0.1 0.2 0.1 0.1 39. Zimbabwe ... 4.9 5.0 8.8 8.1 8.5 9.9
a. Only a subset of countries within each classification was used for deriving averages. Seventeen low-income economies include Bangladesh, Bhutan, Burundi, Cape Verde, Egypt, Ghana, Guyana, Haiti, Kenya, Liberia, Maldives, Nepal, Philippines, Sierra Leone, Solomon Islands, Sudan, and Zaire. Twenty middle-income economies include Botswana, Brazil, Chile, Colombia, Dominica, Dominican Republic, Ecuador, El Salvador, Grenada, Jamaica, Mexico, St. Kirrs and Nevis, St. Lucia, Sr. Vincent and the Grenadines, Thailand, Trinidad and Tobago, Uruguay, Venezuela, Western Samoa, and Zimbabwe. Latin
J06
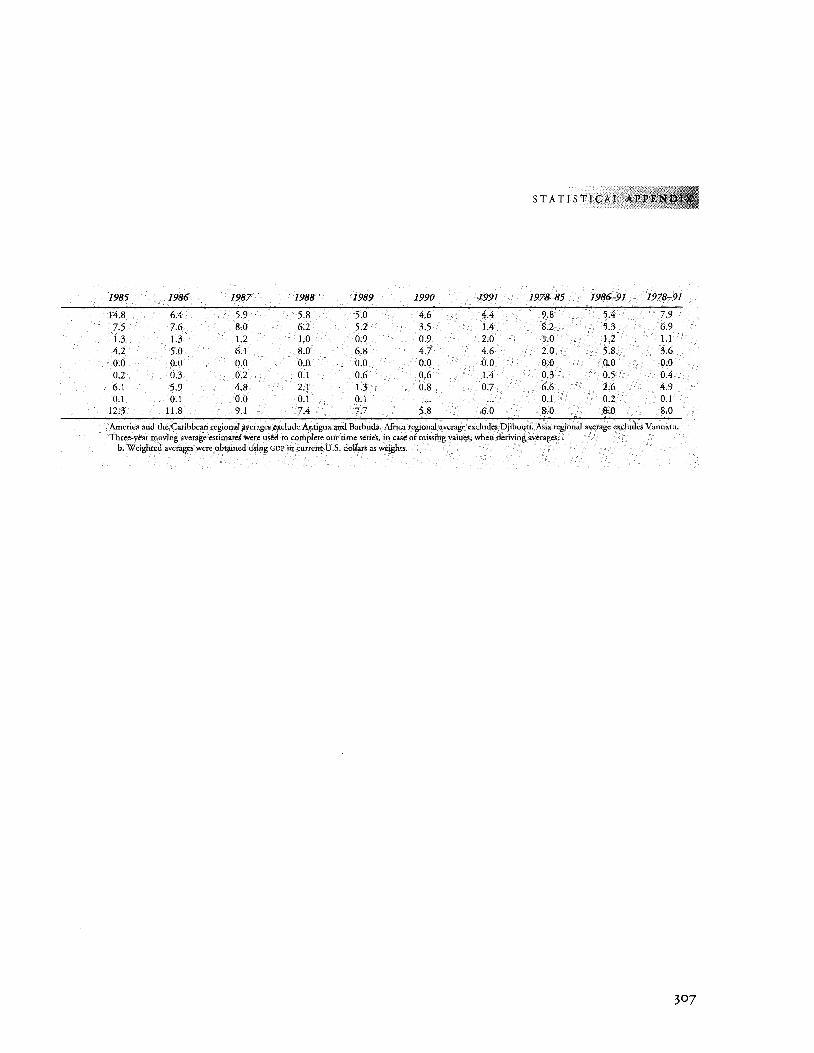
STATISTICAL
1985 1986 1987 1988 1989 1990 1991 1978-85 1986-91 1978-91
14.8 6.4 5.9 5.8 5.0 4.6 4.4 9.8 5.4 7.9 7.5 7.6 8.0 6.2 5.2 3.5 1.4 8.2 5.3 6.9 1.3 1.3 1.2 1.0 0.9 0.9 2.0 1.0 1.2 1.1 4.2 5.0 6.1 8.0 6.8 4.7 4.6 2.0 5.8 3.6 0.0 0.0 0.0 0.0 0.0 0.0 0.0 0.0 0.0 0.0 0.2 0.3 0.2 0.1 0.6 0.6 1.4 0.3 0.5 0.4 6.1 5.9 4.8 2.1 1.3 0.8 0.7 6.6 2.6 4.9 0.1 0.1 0.0 0.1 0.1 ... ... 0.1 0.2 0.1
12.3 11.8 9.1 7.4 7.7 5.8 6.0 8.0 8.0 8.0
America and the Caribbean regional averages el(Clude Antigua and Barbuda. Africa regional average excludes Djibouti. Asia regional average excludes Vanuatu. Three-year moving average estimates were used to complete our time series~ in case of missing values, when deriving averages~
b. Weighted averages were obtained using GDP in current U.S. dollars as weights.
307
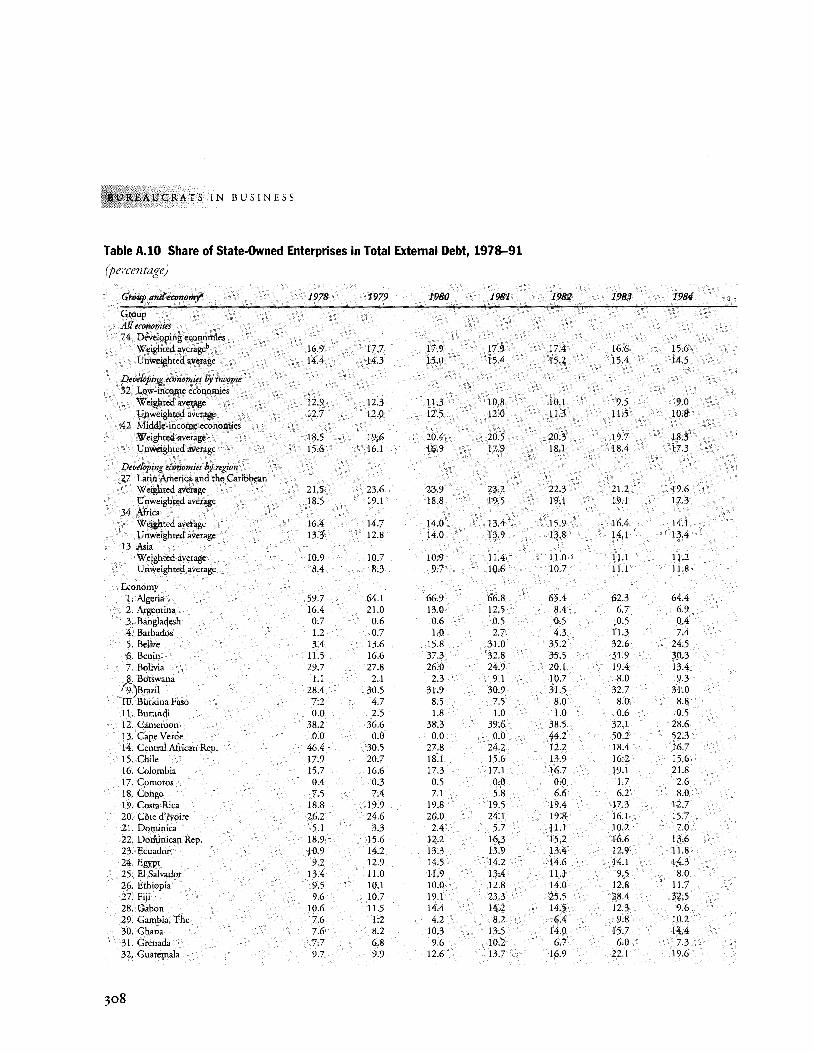
~'\kl!AUCRATS IN BUSINESS
Table A.10 Share of State-Owned Enterprises in Total External Debt, 1978-91
(percentage)
GroiiJ1 and economy' 1978 1979 1980 1981 1982 1983 1984
Group All economies 74 Developing economies
Weighted averageb 16.9 17.7 17.9 17.9 17.4 16.6 15.6 Unweighted average 14.4 14.3 15.0 15.4 15.2 15.4 14.5
Developing economies by income 32 Low-income economies
Weighted average 12.9 12.3 I !.3 10.8 10.1 9.5 9.0 Unweighted average 12.7 12.0 12.5 12.0 11.3 11.5 10.8
42 Middle-income economies Weighted average 18.5 19.6 20.4 20.5 20.3 19.7 18.3 Unweighted average 15.6 16.1 16.9 17.9 18.1 18.4 17.3
Developing economies by region 27 Latin America and the Caribbean
Weighted average 21.5 23.6 23.9 23.2 22.3 21.2 19.6 Unweighted average 18.5 19.1 18.8 19.5 19.1 19.1 17.3
34 Africa Weighted average 16.4 14.7 14.0 13.4 15.9 16.4 14.1 Unweighted average 13.3 12.8 14.0 13.9 13.8 14.1 13.4
13 Asia Weighted average 10.9 10.7 10.9 11.4 11.0 11.1 11.2 Unweighted average 8.4 8.3 9.7 10.6 10.7 11.1 11.8
Economy 1. Algeria 59.7 64.1 66.9 66.8 65.4 62.3 64.4
' 2. Argentina 16.4 21.0 13.0 12.5 8.4 6.7 6.9 · 3. Bangladesh 0.7 0.6 0.6 0.5 0.5 0.5 0.4
4. Barbados 1.2 0.7 1.0 2.7 4.3 11.3 7.4 5. Belize 3.4 13.6 15.8 31.0 35.2 32.6 24.5 6. Benin 11.5 16.6 37.3 32.8 35.5 31.9 30.3 7. Bolivia 29.7 27.8 26.0 24.9 20.1 19.4 13.4 8. Botswana L1 2.1 2.3 9.1 10.7 8.0 9.3
. f9.)Brazil 28.4 30.5 31.9 30.9 31.5 32.7 31.0 !IT. Burkina Paso 7.2 4.7 8.5 7.5 8.0 8.0 8.8 11. Burundi 0.0 2.5 1.8 1.0 1.0 0.6 0.5 12. Cameroon 38.2 36.6 38.3 39.6 38.5 32.1 28.6 13. Cape Verde 0.0 0.0 0.0 0.0 44.2 50.2 52.3 !4. Central African Rep. 46.4 30.5 27.8 24.2 12.2 18.4 16.7 15. Chile 17.9 20.7 18.1 15.6 13.9 16.2 15.6 16. Colombia 15.7 16.6 17.3 17.1 16.7 19.1 21.8 17. Comoros 0.4 0.3 0.5 0.0 0.0 1.7 2.6 18. Congo 7.5 7.4 7.1 5.8 6.6 6.2 8.0 19. Costa Rica 18.8 19.9 19.8 19.5 19.4 17.3 12.7 20. Cote d'Ivoire 262 24.6 26.0 24.1 19.8 16.1 15.7 2 I. Dominica 5.1 3.3 2.4 5.7 11.1 10.2 7.0 22. Dominican Rep. 18.9 15.6 12.2 16.3 15.2 16.6 13.6 23. Ecuador 10.9 14.2 13.3 13.9 13.4 12.9 ll.8 24. Egypt 9.2 12.9 14.5 14.2 14.6 14.1 14.3 25. El Salvador 13.4 11.0 11.9 13.4 11.1 9.5 8.0 26. Ethiopia 9.5 10.1 10.0 12.8 14.0 12.8 11.7 27. Fiji 9.6 10.7 19.1 23.3 25.5 28.4 32.5 28. Gabon 10.6 11.5 14.4 14.2 14.5 12.3 9.6 29. Gambia, The 7.6 1.2 4.2 8.2 6.4 9.8 10.2 30. Ghana 7.6 8.2 10.3 13.5 14.0 15.7 14.4 31. Grenada 7.7 6.8 9.6 10.2 6.7 6.0 7.3 32. Guatemala 9.7 9.9 12.6 13.7 16.9 22.1 19.6
308
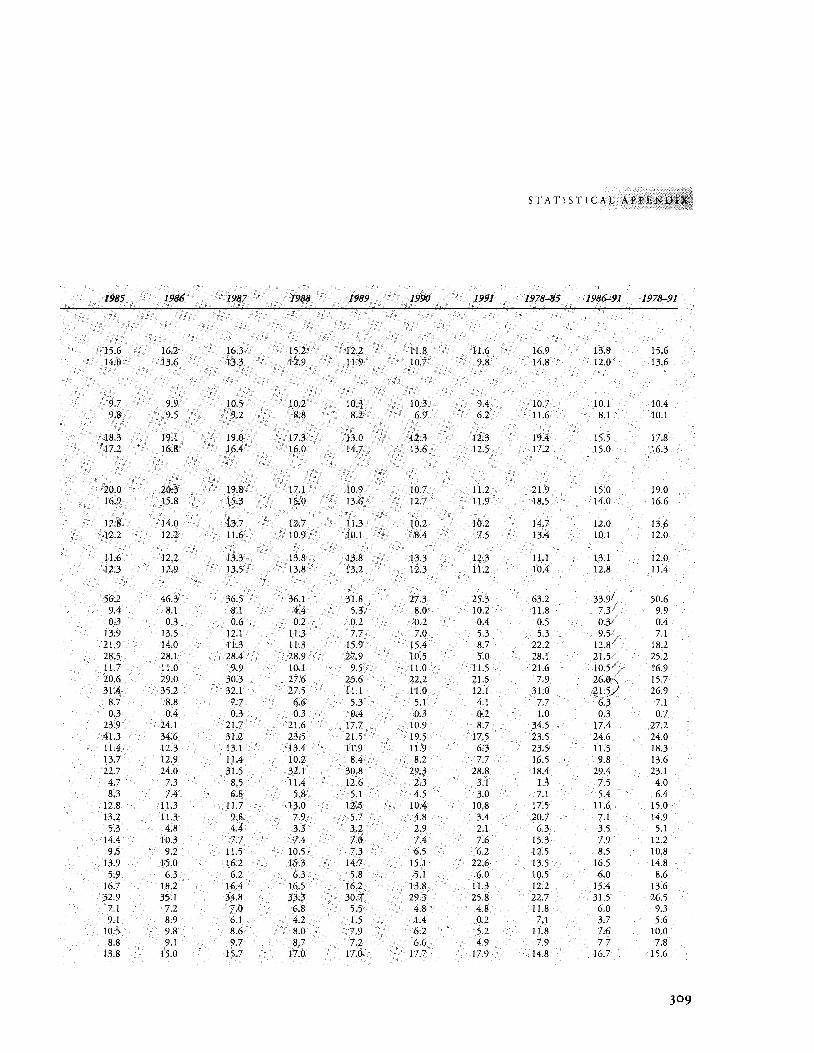
STATIST I CAL APPENDt~~
1985 1986 1987 1988 1989 1990 1991 1978-85 1986-91 1978-91
15.6 16.2 16.3 15.2 12.2 11.8 11.6 16.9 13.9 15.6 14.0 13.6 13.3 12.9 11.9 10.7 9.8 14.8 12.0 13.6
9.7 9.9 10.5 10.2 10.3 10.3 9.4 10.7 10.1 10.4 9.8 9.5 9.2 8.8 8.2 6.9 6.2 11.6 8.1 10.1
18.3 19.1 19.0 17.3 13.0 12.3 12.3 19.4 15.5 17.8 17.2 16.8 16.4 16.0 14.7 13.6 12.5 17.2 15.0 16.3
20.0 20.3 19.8 17.1 10.9 10.7 11.2 21.9 15.0 19.0 16.9 15.8 15.3 15.0 13.6 12.7 11.9 18.5 14.0 16.6
12.8 14.0 13.7 12.7 11.3 10.2 10.2 14.7 12.0 13.6 12.2 12.2 11.6 10.9 10.1 8.4 7.5 13.4 10.1 12.0
11.6 12.2 13.3 13.8 13.8 13.3 12.3 11.1 13.1 12.0 12.3 12.9 13.5 13.8 13.2 12.3 11.2 10.4 12.8 11.4
56.2 46.3 36.5 36.1 31.8 27.3 25.3 63.2 33.9/ 50.6 9.4 8.1 8.1 4.4 5.3 8.0 10.2 11.8 7.3/ 9.9 0.3 0.3 0.6 0.2 0.2 0.2 0.4 0.5 0.3/ 0.4
13.9 13.5 12.1 11.3 7.7 7.0 5.3 5.3 9.5, 7.1 21.9 14.0 11.3 11.3 15.9 15.4 8.7 22.2 12.8/ 18.2 28.5 28.1 28.4 28.9 27.9 10.5 5.0 28.1 21.5/ 25.2 11.7 11.0 9.9 10.1 9.5 11.0 11.5 21.6 10.'Y/ 16.9 20.6 29.0 30.3 27.6 25.6 22.2 21.5 7.9 205/ 15.7 31.4 35.2 32.1 27.5 11.1 11.0 12.1 31.0 Q-,1.5 26.9
8.7 8.8 7.7 6.6 5.3 5.1 4.1 7.7 6.3 7.1 0.3 0.4 0.3 0.3 0.4 0.3 0.2 1.0 0.3 0.7
23.9 24.1 21.7 21.6 17.7 10.9 8.7 34.5 17.4 27.2 41.3 34.6 31.2 23.5 21.5 19.5 17.5 23.5 24.6 24.0 11.4 12.3 13.1 13.4 11.9 11.9 6.3 23.5 ll.S 18.3 13.7 12.9 11.4 10.2 8.4 8.2 7.7 16.5 9.8 13.6 22.7 24.0 31.5 32.1 30.8 29.3 28.8 18.4 29.4 23.1 4.7 7.3 8.5 11.4 12.6 2.3 3.1 1.3 7.5 4.0 8.3 7.4 6.8 5.8 5.1 4.5 3.0 7.1 5.4 6.4
12.8 11.3 11.7 13.0 12.5 10.4 10.8 17.5 11.6 15.0 13.2 11.3 9.8 7.9 5.7 4.8 3.4 20.7 7.1 14.9 5.3 4.8 4.4 3.3 3.2 2.9 2.1 6.3 3.5 5.1
14.4 10.3 7.7 7.4 7.0 7.4 7.6 15.3 7.9 12.2 9.5 9.2 11.5 10.5 7.3 6.5 6.2 12.5 8.5 10.8
13.9 15.0 16.2 15.3 14.7 15.1 22.6 13.5 16.5 14.8 5.9 6.3 6.2 6.3 5.8 5.1 6.0 10.5 6.0 8.6
16.7 18.2 16.4 16.5 16.2 13.8 11.3 12.2 15.4 13.6 32.9 35.1 34.8 33.3 30.7 29.3 25.8 22.7 31.5 26.5 7.1 7.2 7.0 6.8 5.5 4.8 4.8 11.8 6.0 9.3 9.1 8.9 6.1 4.2 1.5 1.4 0.2 7.1 3.7 5.6
10.5 9.8 8.6 8.0 7.9 6.2 5.2 ll.8 7.6 10.0 8.8 9.1 9.7 8.7 7.2 6.6 4.9 7.9 7.7 7.8
13.8 15.0 15.7 17.0 17.0 17.7 17.9 14.8 16.7 15.6
309
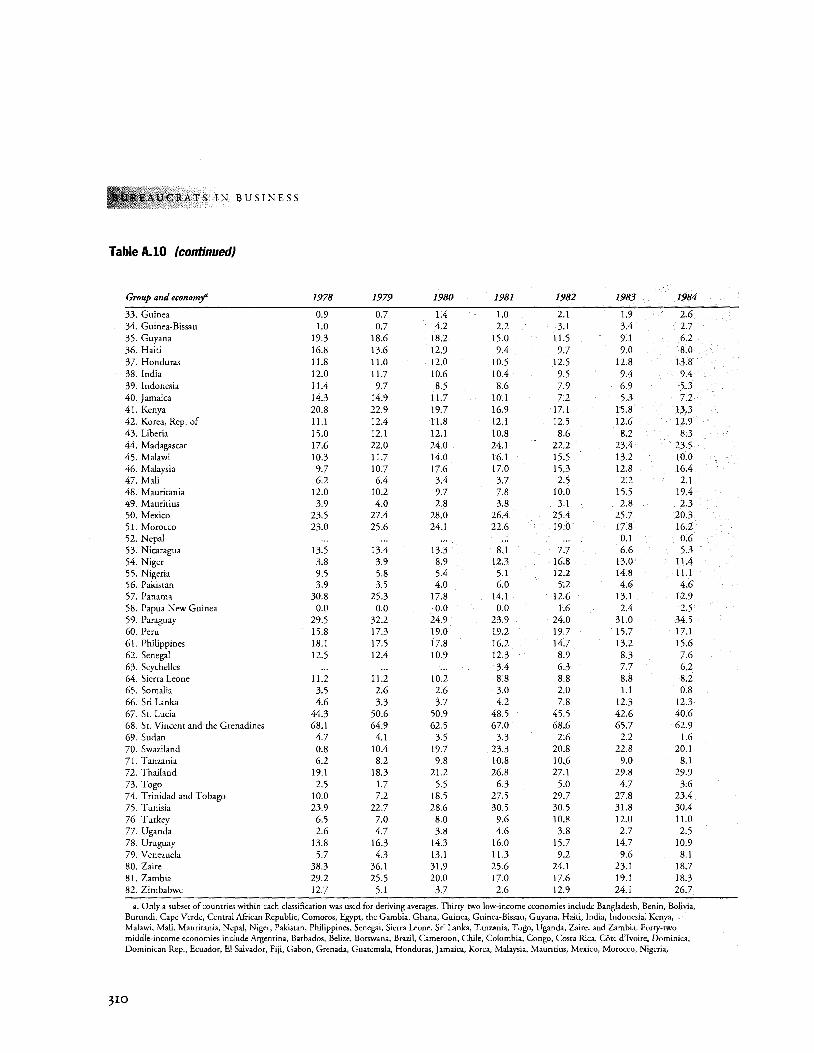
RATS I N B U S I N E S S
Table A.lO (continued)
Group and economj' 1978 1979 1980 1981 1982 1983 1984
33. Guinea 0.9 0.7 !.4 1.0 2.1 1.9 2.6 34. Guinea-Bissau 1.0 0.7 4.2 2.2 3.1 3.4 2.7 35. Guyana 19.3 18.6 18.2 15.0 11.5 9.1 6.2 36. Haiti 16.8 13.6 12.9 9.4 9.7 9.0 8.0 37. Honduras 11.8 11.0 12.0 10.5 12.5 12.8 13.8 38. India 12.0 11.7 10.6 10.4 9.5 9.4 9.4 39. Indonesia 11.4 9.7 8.5 8.6 7.9 6.9 5.3 40. Jamaica 14.3 14.9 11.7 10.1 7.2 5.3 7.2 41. Kenya 20.8 22.9 19.7 16.9 17.1 15.8 13.3 42. Korea, Rep. of 11.1 12.4 11.8 12.1 12.5 12.6 12.9 43. Liberia 15.0 12.1 12.1 10.8 8.6 8.2 8.3 44. Madagascar 17.6 22.0 24.0 24.1 22.2 23.4 23.5 45. Malawi 10.3 11.7 14.0 16.1 15.5 13.2 10.0 46. Malaysia 9.7 10.7 17.6 17.0 15.3 12.8 16.4 47. Mali 6.2 6.4 3.4 3.7 2.5 2.2 2.1 48. Mauritania 12.0 10.2 9.7 7.8 10.0 15.5 19.4 49. Mauritius 3.9 4.0 2.8 3.8 3.1 2.8 2.3 50. Mexico 23.5 27.4 28.0 26.4 25.4 25.7 20.3 51. Morocco 23.0 25.6 24.1 22.6 19.0 17.8 16.2 52. Nepal ... . .. ... . .. . .. 0.1 0.6 53. Nicaragua 13.5 13.4 13.3 8.1 7.7 6.6 5.3 54. Niger 3.8 3.9 8.9 12.3 16.8 13.0 11.4 55. Nigeria 9.5 5.8 5.4 5.1 12.2 14.8 11.1 56. Pakistan 3.9 3.5 4.0 6.0 5.2 4.6 4.6 57. Panama 30.8 25.3 17.8 14.1 12.6 13.1 12.9 58. Papua New Guinea 0.0 0.0 0.0 0.0 1.6 2.4 2.5 59. Paraguay 29.5 32.2 24.9 23.9 24.0 31.0 34.5 60. Peru 15.8 17.3 19.0 19.2 19.7 15.7 17.1 61. Philippines 18.1 17.5 17.8 16.2 14.7 13.2 15.6 62. Senegal 12.5 12.4 10.9 12.3 8.9 8.3 7.6 63. Seychelles ... . .. ... 3.4 6.3 7.7 6.2 64. Sierra Leone 11.2 11.2 10.2 8.8 8.8 8.8 8.2 65. Somalia 3.5 2.6 2.6 3.0 2.0 1.1 0.8 66. Sri Lanka 4.6 3.3 3.7 4.2 7.8 12.3 12.3 67. St. Lucia 44.3 50.6 50.9 48.5 45.5 42.6 40.6 68. St. Vincent and the Grenadines 68.1 64.9 62.5 67.0 68.6 65.7 62.9 69. Sudan 4.7 4.1 3.5 3.3 2.6 2.2 1.6 70. Swaziland 0.8 10.4 19.7 23.3 20.8 22.8 20.1 71. Tanzania 6.2 8.2 9.8 10.8 10.6 9.0 8.1 72. Thailand 19.1 18.3 21.2 26.8 27.1 29.8 29.9 73. Togo 2.5 1.7 5.5 6.3 5.0 4.7 3.6 74. Trinidad and Tobago 10.0 7.2 18.5 27.5 29.7 27.8 23.4 75. Tunisia 23.9 22.7 28.6 30.5 30.5 31.8 30.4 76 Turkey 6.5 7.0 8.0 9.6 10.8 12.0 11.0 77. Uganda 2.6 4.7 3.8 4.6 3.8 2.7 2.5 78. Uruguay 13.8 16.3 14.3 16.0 15.7 14.7 10.9 79. Venezuela 5.7 4.3 13.1 11.3 9.2 9.6 8.1 80. Zaire 38.3 36.1 31.9 25.6 24.1 23.1 18.7 81. Zambia 29.2 25.5 20.0 17.0 17.6 19.1 18.3 82. Zimbabwe 12.7 5.1 3.7 2.6 12.9 24.1 26.7
a. Only a subset of countries within each classification was used for deriving averages. Thirty-two low-income economies include Bangladesh, Benin, Bolivia, Burundi, Cape Verde, Central Mrican Republic, Comoros, Egypt, the Gambia, Ghana, Guinea, Guinea-Bissau, Guyana, Haiti, India, Indonesia, Kenya, Malawi, Mali, Mauritania, Nepal, Niger, Pakistan, Philippines, Senegal, Sierra Leone, Sri Lanka, Tanzania, Togo, Uganda, Zaire, and Zambia. Forty-two middle-income economies include Argentina, Barbados, Belize, Botswana, Brazil, Cameroon, Chile, Colombia, Congo, Costa Rica, COte d'Ivoire, Dominica, Dominican Rep., Ecuador, E1 Salvador, Fiji, Gabon, Grenada, Guatemala, Honduras, Jamaica, Korea, Malaysia, Mauritius, Mexico, Morocco, Nigeria,
JIO
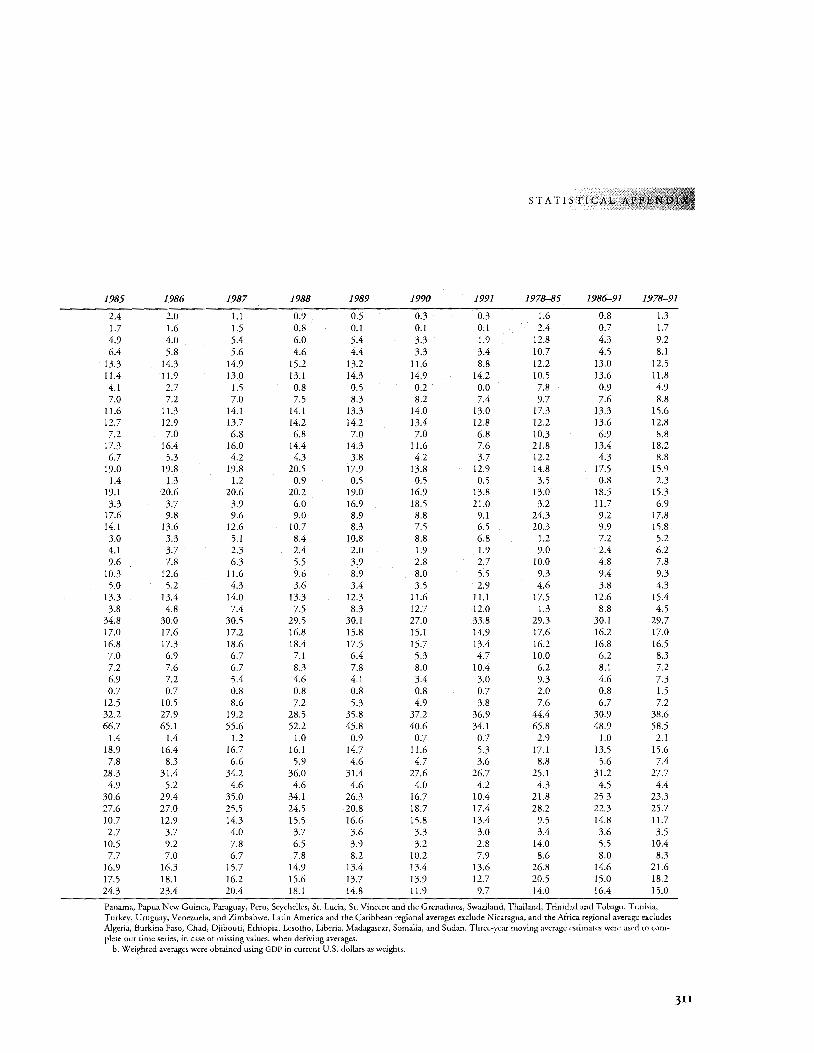
STATISTICAL Al'P
1985 1986 1987 1988 1989 1990 1991 1978-85 1986-91 1978-91
2.4 2.0 1.1 0.9 0.5 0.3 0.3 1.6 0.8 1.3 1.7 1.6 1.5 0.8 0.1 0.1 0.1 2.4 0.7 1.7 4.9 4.0 5.4 6.0 5.4 3.3 1.9 12.8 4.3 9.2 6.4 5.8 5.6 4.6 4.4 3.3 3.4 10.7 4.5 8.1
13.3 14.3 14.9 15.2 13.2 11.6 8.8 12.2 13.0 12.5 11.4 11.9 13.0 13.1 14.3 14.9 14.2 10.5 13.6 11.8 4.1 2.7 1.5 0.8 0.5 0.2 0.0 7.8 0.9 4.9 7.0 7.2 7.0 7.5 8.3 8.2 7.4 9.7 7.6 8.8
11.6 11.3 14.1 14.1 13.3 14.0 13.0 17.3 13.3 15.6 12.7 12.9 13.7 14.2 14.2 13.4 12.8 12.2 13.6 12.8 7.2 7.0 6.8 6.8 7.0 7.0 6.8 10.3 6.9 8.8
17.3 16.4 16.0 14.4 14.3 11.6 7.6 21.8 13.4 18.2 6.7 5.3 4.2 4.3 3.8 4.2 3.7 12.2 4.3 8.8
19.0 19.8 19.8 20.5 17.9 13.8 12.9 14.8 17.5 15.9 1.4 1.3 1.2 0.9 0.5 0.5 0.5 3.5 0.8 2.3
19.1 20.6 20.6 20.2 19.0 16.9 13.8 13.0 18.5 15.3 3.3 3.7 3.9 6.0 16.9 18.5 21.0 3.2 11.7 6.9
17.6 9.8 9.6 9.0 8.9 8.8 9.1 24.3 9.2 17.8 14.1 13.6 12.6 10.7 8.3 7.5 6.5 20.3 9.9 15.8 3.0 3.3 5.1 8.4 10.8 8.8 6.8 1.2 7.2 5.2 4.1 3.7 2.3 2.4 2.0 1.9 1.9 9.0 2.4 6.2 9.6 7.8 6.3 5.5 3.9 2.8 2.7 10.0 4.8 7.8
10.3 12.6 11.6 9.6 8.9 8.0 5.5 9.3 9.4 9.3 5.0 5.2 4.3 3.6 3.4 3.5 2.9 4.6 3.8 4.3
13.3 13.4 14.0 13.3 12.3 11.6 11.1 17.5 12.6 15.4 3.8 4.8 7.4 7.5 8.3 12.7 12.0 1.3 8.8 4.5
34.8 30.0 30.5 29.5 30.1 27.0 33.8 29.3 30.1 29.7 17.0 17.6 17.2 16.8 15.8 15.1 14.9 17.6 16.2 17.0 16.8 17.3 18.6 18.4 17.5 15.7 13.4 16.2 16.8 16.5 7.0 6.9 6.7 7.1 6.4 5.3 4.7 10.0 6.2 8.3 7.2 7.6 6.7 8.3 7.8 8.0 10.4 6.2 8.1 7.2 6.9 7.2 5.4 4.6 4.1 3.4 3.0 9.3 4.6 7.3 0.7 0.7 0.8 0.8 0.8 0.8 0.7 2.0 0.8 1.5
12.5 10.5 8.6 7.2 5.3 4.9 3.8 7.6 6.7 7.2 32.2 27.9 19.2 28.5 35.8 37.2 36.9 44.4 30.9 38.6 66.7 65.1 55.6 52.2 45.8 40.6 34.1 65.8 48.9 58.5
1.4 1.4 1.2 1.0 0.9 0.7 0.7 2.9 1.0 2.1 18.9 16.4 16.7 16.1 14.7 11.6 5.3 17.1 13.5 15.6 7.8 8.3 6.6 5.9 4.6 4.7 3.6 8.8 5.6 7.4
28.3 31.4 34.2 36.0 31.4 27.6 26.7 25.1 31.2 27.7 4.9 5.2 4.6 4.6 4.6 4.0 4.2 4.3 4.5 4.4
30.6 29.4 35.0 34.1 26.3 16.7 10.4 21.8 25.3 23.3 27.6 27.0 25.5 24.5 20.8 18.7 17.4 28.2 22.3 25.7 10.7 12.9 14.3 15.5 16.6 15.8 13.4 9.5 14.8 11.7 2.7 3.7 4.0 3.7 3.6 3.3 3.0 3.4 3.6 3.5
10.5 9.2 7.8 6.5 3.9 3.2 2.8 14.0 5.5 10.4 7.7 7.0 6.7 7.8 8.2 10.2 7.9 8.6 8.0 8.3
16.9 16.3 15.7 14.9 13.4 13.4 13.6 26.8 14.6 21.6 17.5 18.1 16.2 15.6 13.7 13.9 12.7 20.5 15.0 18.2 24.3 23.4 20.4 18.1 14.8 11.9 9.7 14.0 16.4 15.0
Panama, Papua New Guinea, Paraguay, Peru, Seychelles, St. Lucia, St. Vincent and the Grenadines, Swaziland, Thailand, Trinidad and Tobago, Tunisia, Turkey, Uruguay, Venezuela, and Zimbabwe. Latin America and the Caribbean regional averages exclude Nicaragua, and the Africa regional average excludes Algeria, Burkina Faso, Chad, Djibouti, Ethiopia, Lesotho, Liberia, Madagascar, Somalia, and Sudan. Three-year moving average estimates were used to com-plete our time series, in case of missing values, when deriving averages.
b. Weighted averages were obtained using GDP in current U.S. dollars as weights.
3II
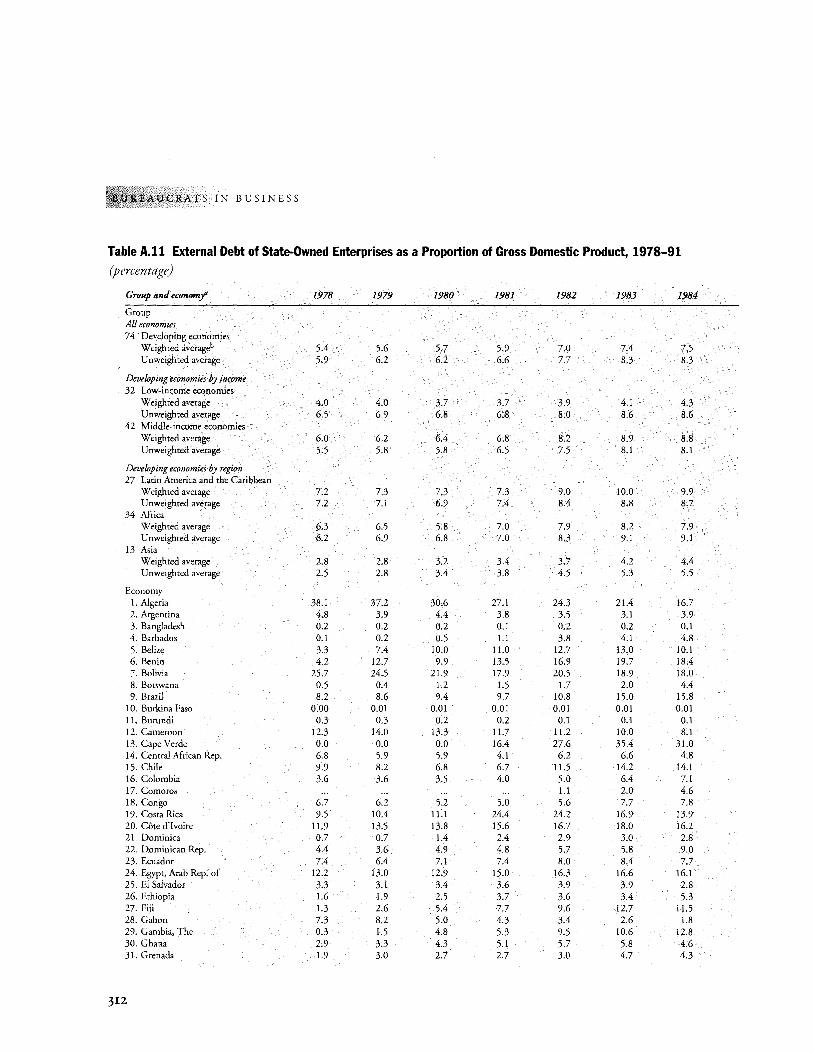
U C RAT S I N B U S I N E S S
Table A.ll External Debt of State-Owned Enterprises as a Proportion of Gross Domestic Product, 1978-91
(percentage)
Group and econom)f' 1978 1979 1980 1981 1982 1983 1984
Group All economies 74 Developing economies
Weighted averageb 5.4 5.6 5.7 5.9 7.0 7.4 7.5 Unweighted average 5.9 6.2 6.2 6.6 7.7 8.3 8.3
Developing economies by income 32 Low-income economies
Weighted average 4.0 4.0 3.7 3.7 3.9 4.1 4.3 U nweighted average 6.5 6.9 6.8 6.8 8.0 8.6 8.6
42 Middle-income economies Weighted average 6.0 6.2 6.4 6.8 8.2 8.9 8.8 Unweighted average 5.5 5.8 5.8 6.5 7.5 8.1 8.1
Developing economies by region 27 Latin America and the Caribbean
Weighted average 7.2 7.3 7.3 7.3 9.0 10.0 9.9 Unweighted average 7.2 7.1 6.9 7.4 8.4 8.8 8.7
34 Mrica Weighted average 6.3 6.5 5.8 7.0 7.9 8.2 7.9 U nweighted average 6.2 6.9 6.8 7.0 8.3 9.1 9.1
13 Asia Weighted average 2.8 2.8 3.2 3.4 3.7 4.2 4.4 Unweighted average 2.5 2.8 3.4 3.8 4.5 5.3 5.5
Economy I. Algeria 38.1 37.2 30.6 27.1 24.3 21.4 16.7 2. Argentina 4.8 3.9 4.4 3.8 3.5 3.1 3.9 3. Bangladesh 0.2 0.2 0.2 0.1 0.2 0.2 0.1 4. Barbados 0.1 0.2 0.5 1.1 3.8 4.1 4.8 5. Belize 3.3 7.4 10.0 11.0 12.7 13.0 10.1 6. Benin 4.2 12.7 9.9 13.5 16.9 19.7 18.4 7. Bolivia 25.7 24.5 21.9 17.9 20.5 18.9 18.0 8. Botswana 0.5 0.4 1.2 1.5 1.7 2.0 4.4 9. Brazil 8.2 8.6 9.4 9.7 10.8 15.0 15.8
10. Burkina Faso 0.00 0.01 0.01 0.01 0.01 0.01 0.01 11. Burundi 0.3 0.3 0.2 0.2 0.1 0.1 0.1 12. Cameroon 12.3 14.0 13.3 11.7 11.2 10.0 8.1 13. Cape Verde 0.0 0.0 0.0 16.4 27.6 35.4 31.0 14. Central Mrican Rep. 6.8 5.9 5.9 4.1 6.2 6.6 4.8 15. Chile 9.9 8.2 6.8 6.7 11.5 14.2 14.1 16. Colombia 3.6 3.6 3.5 4.0 5.0 6.4 7.1 17. Comoros ... ... ... .. . 1.1 2.0 4.6 18. Congo 6.7 6.2 5.2 5.0 5.6 7.7 7.8 19. Costa Rica 9.5 10.4 11.1 24.4 24.2 16.9 13.9 20. Cote d'Ivoire 11.9 13.5 13.8 15.6 16.7 18.0 16.2 21. Dominica 0.7 0.7 1.4 2.4 2.9 3.0 2.8 22. Dominican Rep. 4.4 3.6 4.9 4.8 5.7 5.8 9.0 23. Ecuador 7.4 6.4 7.1 7.4 8.0 8.4 7.7 24. Egypt, Arab Rep. of 12.2 13.0 12.9 15.0 16.3 16.6 16.1 25. El Salvador 3.3 3.1 3.4 3.6 3.9 3.9 2.8 26. Ethiopia 1.6 1.9 2.5 3.7 3.6 3.4 5.3 27. Fiji 1.3 2.6 5.4 7.7 9.6 12.7 11.5 28. Gabon 7.3 8.2 5.0 4.3 3.4 2.6 1.8 29. Gambia, The 0.3 1.5 4.8 5.3 9.5 10.6 12.8 30. Ghana 2.9 3.3 4.3 5.1 5.7 5.8 4.6 31. Grenada 1.9 3.0 2.7 2.7 3.0 4.7 4.3
JI2
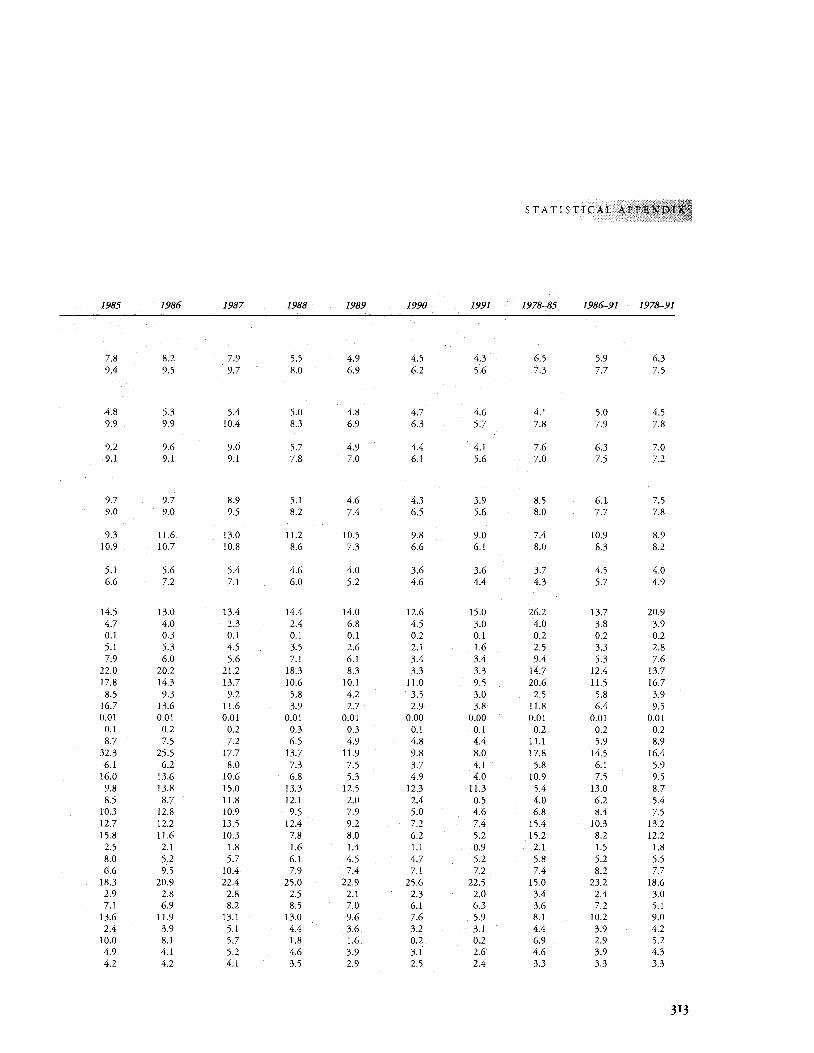
STATISTICAL AP
1985 1986 1987 1988 1989 1990 1991 1978-85 1986-91 1978-91
7.8 8.2 7.9 5.5 4.9 4.5 4.3 6.5 5.9 6.3 9.4 9.5 9.7 8.0 6.9 6.2 5.6 7.3 7.7 7.5
4.8 5.3 5.4 5.0 4.8 4.7 4.6 4.1 5.0 4.5 9.9 9.9 10.4 8.3 6.9 6.3 5.7 7.8 7.9 7.8
9.2 9.6 9.0 5.7 4.9 4.4 4.1 7.6 6.3 7.0 9.1 9.1 9.1 7.8 7.0 6.1 5.6 7.0 7.5 7.2
9.7 9.7 8.9 5.1 4.6 4.3 3.9 8.5 6.1 7.5 9.0 9.0 9.5 8.2 7.4 6.5 5.6 8.0 7.7 7.8
9.3 11.6 13.0 11.2 10.5 9.8 9.0 7.4 10.9 8.9 10.9 10.7 10.8 8.6 7.3 6.6 6.1 8.0 8.3 8.2
5.1 5.6 5.4 4.6 4.0 3.6 3.6 3.7 4.5 4.0 6.6 7.2 7.1 6.0 5.2 4.6 4.4 4.3 5.7 4.9
14.5 13.0 13.4 14.4 14.0 12.6 15.0 26.2 13.7 20.9 4.7 4.0 2.3 2.4 6.8 4.5 3.0 4.0 3.8 3.9 0.1 0.3 0.1 0.1 0.1 0.2 0.1 0.2 0.2 0.2 5.1 5.3 4.5 3.5 2.6 2.1 1.6 2.5 3.3 2.8 7.9 6.0 5.6 7.1 6.1 3.4 3.4 9.4 5.3 7.6
22.0 20.2 21.2 18.3 8.3 3.3 3.3 14.7 12.4 13.7 17.8 14.3 13.7 10.6 10.1 11.0 9.5 20.6 11.5 16.7 8.5 9.3 9.2 5.8 4.2 3.5 3.0 2.5 5.8 3.9
16.7 13.6 11.6 3.9 2.7 2.9 3.8 11.8 6.4 9.5 0.01 0.01 0.01 0.01 0.01 0.00 0.00 O.Ql 0.01 0.01
0.1 0.2 0.2 0.3 0.3 0.1 0.1 0.2 0.2 0.2 8.7 7.5 7.2 6.5 4.9 4.8 4.4 11.1 5.9 8.9
32.3 25.5 17.7 13.7 11.9 9.8 8.0 17.8 14.5 16.4 6.1 6.2 8.0 7.3 7.5 3.7 4.1 5.8 6.1 5.9
16.0 13.6 10.6 6.8 5.3 4.9 4.0 10.9 7.5 9.5 9.8 13.8 15.0 13.3 12.5 12.3 11.3 5.4 13.0 8.7 8.5 8.7 11.8 12.1 2.0 2.4 0.5 4.0 6.2 5.4
10.3 12.8 10.9 9.5 7.9 5.0 4.6 6.8 8.4 7.5 12.7 12.2 13.5 12.4 9.2 7.2 7.4 15.4 10.3 13.2 15.8 11.6 10.3 7.8 8.0 6.2 5.2 15.2 8.2 12.2 2.5 2.1 1.8 1.6 1.4 1.1 0.9 2.1 1.5 1.8 8.0 5.2 5.7 6.1 4.5 4.7 5.2 5.8 5.2 5.5 6.6 9.5 10.4 7.9 7.4 7.1 7.2 7.4 8.2 7.7
18.3 20.9 22.4 25.0 22.9 25.6 22.5 15.0 23.2 18.6 2.9 2.8 2.8 2.5 2.1 2.3 2.0 3.4 2.4 3.0 7.1 6.9 8.2 8.5 7.0 6.1 6.3 3.6 7.2 5.1
13.6 11.9 13.1 13.0 9.6 7.6 5.9 8.1 10.2 9.0 2.4 3.9 5.1 4.4 3.6 3.2 3.1 4.4 3.9 4.2
10.0 8.1 5.7 1.8 1.6 0.2 0.2 6.9 2.9 5.2 4.9 4.1 5.2 4.6 3.9 3.1 2.6 4.6 3.9 4.3 4.2 4.2 4.1 3.5 2.9 2.5 2.4 3.3 3.3 3.3
313
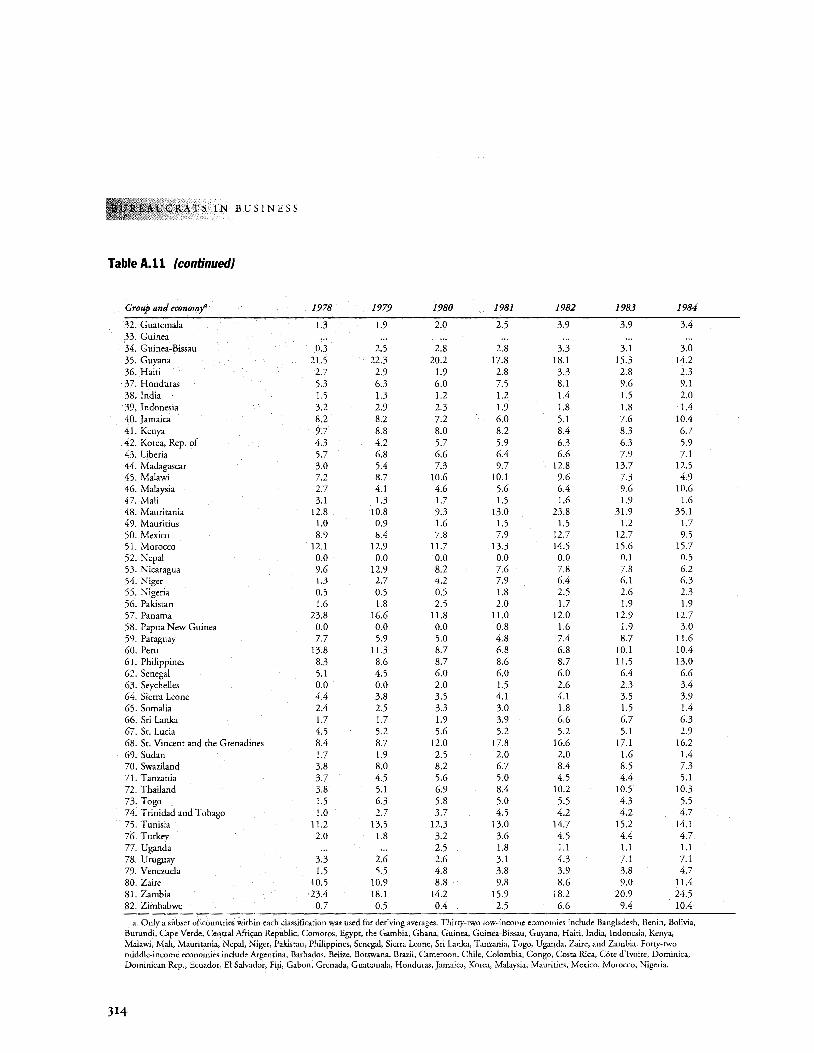
C RATS IN B US I N E S S
TableA.ll (continued)
Group and economy" !978 1979 1980 1981 1982 1983 1984
32. Guatemala 1.3 1.9 2.0 2.5 3.9 3.9 3.4 33. Guinea 34. Guinea-Bissau 0.3 2.5 2.8 2.8 3.3 3.1 3.0 35. Guyana 21.5 22.3 20.2 17.8 18.1 15.3 14.2 :36. Haiti 2.7 2.9 1.9 2.8 3.3 2.8 2.3 :37. Honduras 5.3 6.3 6.0 7.5 8.1 9.6 9.1 38. India 1.5 1.3 1.2 1.2 1.4 1.5 2.0 39. Indonesia 3.2 2.9 2.3 1.9 1.8 1.8 1.4 40. Jamaica 8.2 8.2 7.2 6.0 5.1 7.6 10.4 41. Kenya 9.7 8.8 8.0 8.2 8.4 8.3 6.7 42. Korea, Rep. of 4.3 4.2 5.7 5.9 6.3 6.3 5.9 43. Liberia 5.7 6.8 6.6 6.4 6.6 7.9 7.1 44. Madagascar 3.0 5.4 7.3 9.7 12.8 13.7 12.5 45. Malawi 7.2 8.7 10.6 10.1 9.6 7.3 4.9 46. Malaysia 2.7 4.1 4.6 5.6 6.4 9.6 10.6 47. Mali 3.1 1.3 1.7 1.5 1.6 1.9 1.6 48. Mauritania 12.8 10.8 9.3 13.0 23.8 31.9 35.1 49. Mauritius 1.0 0.9 1.6 1.5 1.5 1.2 1.7 50. Mexico 8.9 8.4 7.8 7.9 12.7 12.7 9.5 51. Morocco 12.1 12.9 11.7 13.3 14.5 15.6 15.7 52. Nepal 0.0 0.0 0.0 0.0 0.0 0.1 0.5 53. Nicaragua 9.6 12.9 8.2 7.6 7.8 7.8 6.2 54. Niger 1.3 2.7 4.2 7.9 6.4 6.1 6.3 55. Nigeria 0.5 0.5 0.5 1.8 2.5 2.6 2.3 56. Pakistan 1.6 1.8 2.5 2.0 1.7 1.9 1.9 57. Panama 23.8 !6.6 Il.8 11.0 12.0 12.9 12.7 58. Papua New Guinea 0.0 0.0 0.0 0.8 1.6 1.9 3.0 59. Paraguay 7.7 5.9 5.0 4.8 7.4 8.7 11.6 60. Peru 13.8 I 1.3 8.7 6.8 6.8 10.1 10.4 61. Philippines 8.3 8.6 8.7 8.6 8.7 11.5 13.0 62. Senegal 5.1 4.5 6.0 6.0 6.0 6.4 6.6 63. Seychelles 0.0 0.0 2.0 1.5 2.6 2.3 3.4 64. Sierra Leone 4.4 3.8 3.5 4.1 4.1 3.5 3.9 65. Somalia 2.4 2.5 3.3 3.0 1.8 1.5 1.4 66. Sri Lanka 1.7 1.7 1.9 3.9 6.6 6.7 6.3 67. St. Lucia 4.5 5.2 5.6 5.2 5.2 5.1 2.9 68. St. Vincent and the Grenadines 8.4 8.7 12.0 17.8 16.6 17.1 16.2 69. Sudan 1.7 1.9 2.5 2.0 2.0 1.6 1.4 70. Swaziland 3.8 8.0 8.2 6.7 8.4 8.5 7.3 71. Tanzania 3.7 4.5 5.6 5.0 4.5 4.4 5.1 72. Thailand 3.8 5.1 6.9 8.4 10.2 10.5 10.3 73. Togo 1.5 6.3 5.8 5.0 5.5 4.3 5.5 74. Trinidad and Tobago 1.0 2.7 3.7 4.5 4.2 4.2 4.7 75. Tunisia I 1.2 13.5 12.3 13.0 14.7 15.2 14.1 76. Turkey 2.0 1.8 3.2 3.6 4.5 4.4 4.7 77. Uganda ... ... 2.5 1.8 1.1 1.1 1.1 78. Uruguay 3.3 2.6 2.6 3.1 4.3 7.1 7.1 79. Venezuela 1.5 5.5 4.8 3.8 3.9 3.8 4.7 80. Zaire 10.5 10.9 8.8 9.8 8.6 9.0 11.4 81. Zambia 23.4 18.1 14.2 15.9 18.2 20.9 24.5 82. Zimbabwe 0.7 0.5 0.4 2.5 6.6 9.4 10.4
a. Only a subset of countries within each classification was used for deriving averages. Thirty-two low-income economies include Bangladesh, Benin, Bolivia, Burundi, Cape Verde, Central Mrican Republic, Comoros, Egypt, the Gambia, Ghana, Guinea, Guinea-Bissau, Guyana, Haiti, India, Indonesia, Kenya, Malawi, Mali, Mauritania, Nepal, Niger, Pakistan, Philippines, Senegal, Sierra Leone, Sri Lanka, Tanzania, Togo, Uganda, Zaire, and Zambia. Forry-rwo middle-income economies include Argentina, Barbados, Belize, Botswana, Brazil, Cameroon, Chile, Colombia, Congo, Costa Rica, COte d'Ivoire, Dominica, Dominican Rep., Ecuador, El Salvador, Fiji, Gabon, Grenada, Guatemala, Honduras, Jamaica, Korea, Malaysia, Mauritius, Mexico, Morocco, Nigeria,
314
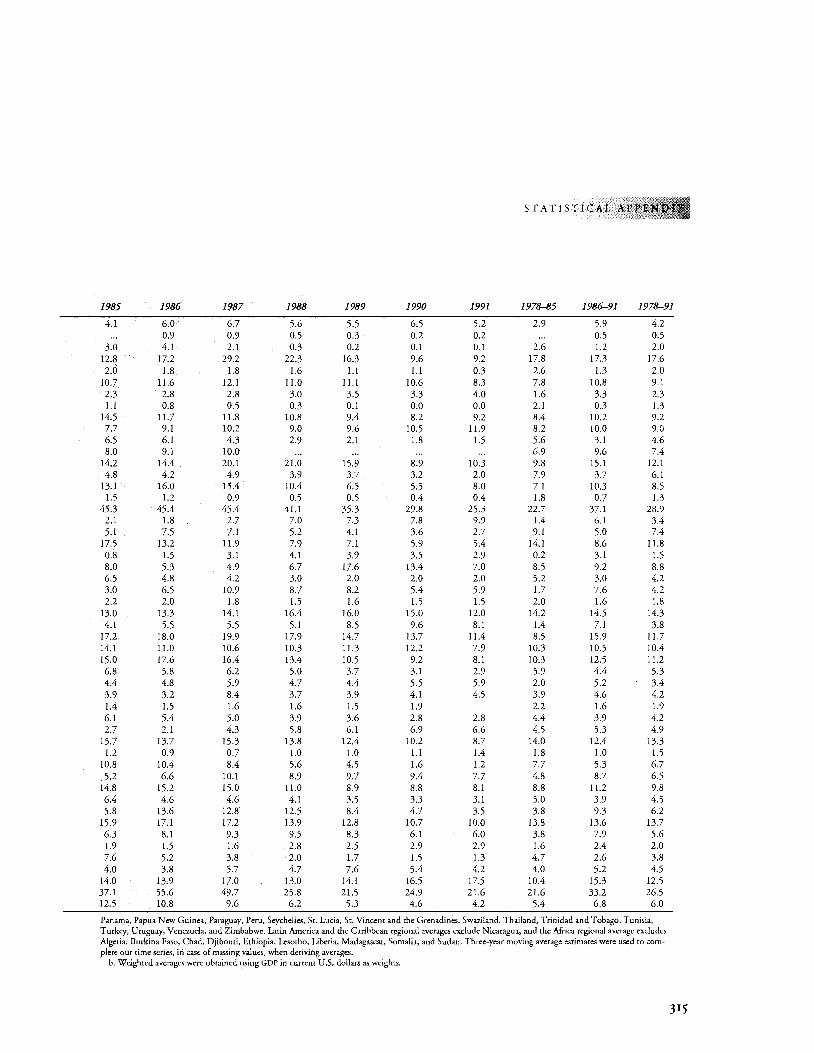
STATISTICAL AP
1985 1986 1987 1988 1989 1990 1991 1978-85 1986-91 1978-91
4.1 6.0 6.7 5.6 5.5 6.5 5.2 2.9 5.9 4.2 0.9 0.9 0.5 0.3 0.2 0.2 ... 0.5 0.5
3.0 4.1 2.1 0.3 0.2 0.1 0.1 2.6 1.2 2.0 12.8 17.2 29.2 22.3 16.3 9.6 9.2 17.8 17.3 17.6 2.0 1.8 1.8 1.6 1.1 1.1 0.3 2.6 1.3 2.0
10.7 11.6 12.1 11.0 11.1 10.6 8.3 7.8 10.8 9.1 2.3 2.8 2.8 3.0 3.5 3.3 4.0 1.6 3.3 2.3 1.1 0.8 0.5 0.3 0.1 0.0 0.0 2.1 0.3 1.3
14.5 11.7 11.8 10.8 9.4 8.2 9.2 8.4 10.2 9.2 7.7 9.1 10.2 9.0 9.6 10.5 11.9 8.2 10.0 9.0 6.5 6.1 4.3 2.9 2.1 1.8 1.5 5.6 3.1 4.6 8.0 9.1 10.0 ... . .. . .. . .. 6.9 9.6 7.4
14.2 14.4 20.1 21.0 15.9 8.9 10.3 9.8 15.1 12.1 4.8 4.2 4.9 3.9 3.7 3.2 2.0 7.9 3.7 6.1
13.1 16.0 15.4 10.4 6.5 5.5 8.0 7.1 10.3 8.5 1.5 1.2 0.9 0.5 0.5 0.4 0.4 1.8 0.7 1.3
45.3 45.4 45.4 41.1 35.3 29.8 25.3 22.7 37.1 28.9 2.1 1.8 2.7 7.0 7.3 7.8 9.9 1.4 6.1 3.4 5.1 7.5 7.1 5.2 4.1 3.6 2.7 9.1 5.0 7.4
17.5 13.2 11.9 7.9 7.1 5.9 5.4 14.1 8.6 11.8 0.8 1.5 3.1 4.1 3.9 3.5 2.9 0.2 3.1 1.5 8.0 5.3 4.9 6.7 17.6 13.4 7.0 8.5 9.2 8.8 6.5 4.8 4.2 3.0 2.0 2.0 2.0 5.2 3.0 4.2 3.0 6.5 10.9 8.7 8.2 5.4 5.9 1.7 7.6 4.2 2.2 2.0 1.8 1.5 1.6 1.5 1.5 2.0 1.6 1.8
13.0 13.3 14.1 16.4 16.0 15.0 12.0 14.2 14.5 14.3 4.1 5.5 5.5 5.1 8.5 9.6 8.1 1.4 7.1 3.8
17.2 18.0 19.9 17.9 14.7 13.7 11.4 8.5 15.9 11.7 14.1 11.0 10.6 10.3 11.3 12.2 7.9 10.3 10.5 10.4 15.0 17.6 16.4 13.4 10.5 9.2 8.1 10.3 12.5 11.2 6.8 5.8 6.2 5.0 3.7 3.1 2.9 5.9 4.4 5.3 4.4 4.8 5.9 4.7 4.4 5.5 5.9 2.0 5.2 3.4 3.9 3.2 8.4 3.7 3.9 4.1 4.5 3.9 4.6 4.2 1.4 1.5 1.6 1.6 1.5 1.9 2.2 1.6 1.9 6.1 5.4 5.0 3.9 3.6 2.8 2.8 4.4 3.9 4.2 2.7 2.1 4.3 5.8 6.1 6.9 6.6 4.5 5.3 4.9
15.7 13.7 15.3 13.8 12.4 10.2 8.7 14.0 12.4 13.3 1.2 0.9 0.7 1.0 1.0 1.1 1.4 1.8 1.0 1.5
10.8 10.4 8.4 5.6 4.5 1.6 1.2 7.7 5.3 6.7 5.2 6.6 10.1 8.9 9.7 9.4 7.7 4.8 8.7 6.5
14.8 15.2 15.0 11.0 8.9 8.8 8.1 8.8 11.2 9.8 6.4 4.6 4.6 4.1 3.5 3.3 3.1 5.0 3.9 4.5 5.8 13.6 12.8 12.5 8.4 4.7 3.5 3.8 9.3 6.2
15.9 17.1 17.2 13.9 12.8 10.7 10.0 13.8 13.6 13.7 6.3 8.1 9.3 9.5 8.3 6.1 6.0 3.8 7.9 5.6 1.9 1.5 1.6 2.8 2.5 2.9 2.9 1.6 2.4 2.0 7.6 5.2 3.8 2.0 1.7 1.5 1.3 4.7 2.6 3.8 4.0 3.8 5.7 4.7 7.6 5.4 4.2 4.0 5.2 4.5
14.0 13.9 17.0 13.0 14.1 16.5 17.5 10.4 15.3 12.5 37.1 55.6 49.7 25.8 21.5 24.9 21.6 21.6 33.2 26.5 12.5 10.8 9.6 6.2 5.3 4.6 4.2 5.4 6.8 6.0
Panama, Papua New Guinea, Paraguay, Peru, Seychelles, St. Lucia, St. Vincent and the Grenadines, Swaziland, Thailand, Trinidad and Tobago, Tunisia, Turkey, Uruguay, Venezuela, and Zimbabwe. Larin America and the Caribbean regional averages exclude Nicaragua, and the Mrica regional average excludes Algeria, Burkina Faso, Chad, Djibouti, Ethiopia, Lesotho, Liberia, Madagascar, Somalia, and Sudan. Three-year moving average estimates were used to com-plete our time series, in case of missing values, when deriving averages.
b. Weighted averages were obtained using GDP in current U.S. dollars as weights.
315
I'P&EAUCRATS IN BUSINESS ;;;!~-;''..',
Technical Notes
Latin America and the Caribbean
Argentina. Source: World Bank and IMF; Larrain
and Selowsky (1991). Barbados. Major nonfinancial SOEs only. Source:
IMF.
Belize. Nonfinancial SOEs since 1980. Source:
World Bank and IMF.
Bolivia. Data are for eight major nonfinancial SOEs
that in 1990 and 1991 accounted for more than
80 percent of all revenues, value added, and em
ployment generated by the SOE sector; overall bal
ance and net transfers figures for 1978-84 are
from Nair and Filippides. Source: World Bank
and IMF; Nair and Fillippides (1989).
BraziL All federal SOEs; overall balance figures for
1981-85 are from Nair and Fillippides. Source:
For 1981-85, Larrain and Selowsky (1991); for
1986-91, IMF, Nair and Fillippides (1989); some
1985 data from World Bank sources.
Chile. Employment figures for 1978-86 are from
Saez (1992) and refer to selected major SOEs, in
cluding Banco del Estado. Source: Budget Office,
Ministry of Finance, and World Bank; Larrain
and Selowsky (1991); Liiders (1990); and Ha
chette and Liiders (1993). Colombia. Source: IMF and World Bank.
Cost.t Rica. Data refer to the following nonfinancial
SOEs: ICE, RECOPE, CODESA, CNP, ICAA, FECOSA,
ESPH, JPSSJ (since 1981), FNL, INCOP, JASEMC,
JAPQ, and JAPDEVA. Source: IMF.
Dominica. Value added for 1990-91 derived as sum
of sectoral disaggregates; investment share re
ported as proportion of gross fixed capital forma
tion. Source: IMF.
Dominican Republic. All SOEs. Source: World Bank.
316
Ecuador. Nonfinancial SOEs covered are CEPE,
INECEL, ECUATORIANA, ENAC, ENPROVIT, FLOPEC,
IETEL, National Railroads, TAME, and TRANSNAVE
except in 1981 and 1982, when only CEPE and
INECEL are included. Data for 1988-91 include
PETROECUADOR, INECEL, ECUATORIANA, ENAC,
ENPROVIT, FLOPEC, EMETEL, ENFE, TAME, and
TRANSNAVE. Since 1990 eleven smaller nonfinan
cial SOEs have also been covered. SOE employment
numbers are reported as share of urban employ
ment. Overall balance before transfers is esti
mated as the overall balance after transfers for the
ten nonfinancial SOEs identified above minus net
transfers to eight major nonfinancial SOEs. Num
bers for net transfers are for eight major nonfi
nancial SOEs only. Source: IMF and World Bank.
El Salvador. Data are for eight major nonfinancial
SOEs. Source: IMF and World Bank.
Grenada. Data for 1986-92 cover five major nonfi
nancial SOEs only: Grenada Electricity Service,
Grenada Ports Authority, Water and Sewage Au
thority, Marketing and National Importing
Board, and Grenada Sugar Factory. Data for ear
lier years cover eleven major nonfinancial SOEs.
Source: IMF.
Guatemala. Data cover eleven nonfinancial SOEs:
INDECA, GNT, EPN, FEGUA, AVIATECA, EPQ,
GUATEL, INDE, PROLAC, ZOLIC, and EMPAGUA.
Source: IMF.
Guyana. Data are consolidated from disaggregated
accounts of GUYSUCO, GUYMINE, GREC, GLC, and
GUYSTAC. Value added for 1986-90 is estimated
using wage bill, cost of goods and services, and
other expenses based on their average share in op
erating expenses for 1978-85. Source: IMF.
Haiti. Data are for major SOEs only, including the
electric company, water authority, port authority,
telecom company, flour mill, and cement com
pany. Figures for overall balance, 1981-86, and
net transfers, 1982-86, are from Nair and Fillip
pides. Source: IMF; Nair and Fillippides (1989). Honduras. Nonfinancial SOEs include COHDEFOR,
ENEE, ENP, SANAA, FNH, INVA, COHBANA,
HONDUTEL, BANASUPRO, IHCAFE, and IHMA. Of
these, in 1989 HONDUTEL, ENEE, and SANAA ac
counted for 80 percent of all nonfinancial SOE in
come and expenditure, 65 percent of the nonfi
nancial SOE wage bill, and 68 percent of all
nonfinancial SOEs' capital formation. Overall bal
ance figures for 1978-79 are from Nair and Fil
lippides. Source: World Bank and IMF; Nair and
Fillippides (1989). Jamaica. Selected SOEs only. 1984 value added fig
ure is from Nair and Fillippides. SOE overall bal
ances are estimated as operating balance minus
capital expenditure. Source: IMF.
Mexico. Figures are for directly controlled nonfinan
cial SOEs, excluding social security institutes.
Source: World Bank; Direcci6n General de
Planeaci6n Hacendaria-Estadisticas de Finanzas
Publicas 1973-88. Panama. Data cover major nonfinancial SOEs, in
cluding Hydraulic Resources and Electricity Insti
tute (IHRE), National Telecommunications Insti
tute (INTEL), National Water and Sewerage
Institute (IDAAU), La Victoria Sugar Corporation,
Colon Free Zone, Civil Aviation Authority,
Tourism Institute, Bayano Cement Plant, and
Port Authority. Value added prior to 1989 is esti
mated using wage bill, cost of goods and services,
and other expenses based on their average share in
operating expenses for 1989-91. Source: IMF.
Paraguay. Source: World Bank and IMF.
Peru. Source: World Bank.
St. Kitts and Nevis. Source: IMF.
St. Lucia. Source: IMF.
St. Vincent and the Grenadines. Data cover nme
nonfinancial SOEs only. Source: IMF.
STATISTICAL APPE
Trinidad and Tobago. Value added figures are for
major nonfinancial SOEs only. Government trans
fers to enterprises refer to all state-owned enter
prises. Source: World Bank and IMF.
Uruguay. Source: World Bank and IMF.
Venezuela. Nonfinancial SOEs include those in the
petroleum and iron ore sectors. Source: World
Bank and IMF.
Africa
Algeria. There is a substantial difference between
our numbers and those reported in other sources,
in that the numbers we report refer to the entire state-owned sector, not just industrial SOEs. Em
ployment numbers are for industrial enterprises
only. Figures for net transfers for 1978-85 are
from Nair and Fillippides. Source: World Bank
and IMF; Nair and Fillipides (1989). Benin. Selected SOEs only. SOE employment was es
timated using the share of civil service employ
ment in SOEs and the share of total civil service
employment for 1981-83. Source: World Bank
and IMF.
Botswana. Nonfinancial SOEs covered include
Botswana Agricultural Marketing Board, Bots
wana Livestock Development Corporation,
Botswana Housing Corporation, Botswana Meat
Commission, Botswana Power Corporation,
Botswana Telephone Corporation, and Botswana
Water Utilities Corporation. Since 1988, Air
Botswana and Botswana Railways have also been
included. Overall balance figures for 1978-79 are
from Nair and Fillippides. Source: Bank of
Botswana Annual Report (various annual issues);
IMF; Nair and Fillipides (1989). Burkina Faso. Source: ADI (various issues).
Burundi. Value added numbers are from ADI and
other World Bank data. Employment numbers
317
TS IN BUSINESS
refer to share in formal sector employment;
1982-83 figures are from AD! and 1986-89 from
IMF. Source: AD! (various issues); World Bank and
IMF.
Cameroon. Employment numbers refer to share in
formal sector employment. In 1985, 50 percent
of SOE employment was in the agricultural sector.
Overall balance numbers are from AD!. Source:
AD! (various issues); World Bank.
Cape Verde. Data are for all SOEs. Figures for net
transfers are based on government-to-SO£ trans
fers only. Source: IMF.
Central Aftican Republic. Overall balance numbers
are from AD!. Source: AD! (various issues); World
Bank.
Comoros. Value added figures are for enterprises in
the trade sector (SCH, ONICOR, SOCOVIA), tourism (COMOTEL, airport M-H, NSCTA), state-owned
utilities (OPT, EEOC), and other (SNI, ECOPOR).
Source: World Bank and IMF.
Congo. Among major SOEs are AIC, Hydro-Congo,
SNE, SUCO, CIDOLOU/SOCICO, SNDE, and ONPT,
which includes the Postal Savings Bank.The
sharp increase in SOE contribution to GOP in
1986 is a result of a sharp contraction in GOP
rather than an increase in SOE value added. In
vestment figures are based on the government's
investment budget and thus exclude any SOE in
vestment carried out of the budget. Employment
numbers are from AD! and refer to share in formal
employment. Overall balance numbers are from
ADL Source: AD! (various issues); World Bank
and IMF.
Cote d'Ivoire. Value added figure is from Floyd,
Gray, and Short. Investment figures are for all
SOEs. Overall balance figures for 1978-79 are
from Floyd, Gray, and Short; for 1982-86, from
ADJ. Employment numbers are from AD! (various
issues) and refer to share in formal employment.
318
Source: AD! (various issues); World Bank; Floyd,
Gray, and Short (1984). Egypt. Data cover nonfinancial SOEs, including eco
nomic authorities. Value added series are esti
mated from three data points based on published
studies pointing to little change in the contribu
tion of SOEs to economic activiry. Investment fig
ures include financial and insurance SOEs, but
these represent a very small share of total SOE sec
tor investment. Source: Public Enterprise Infor
mation Center, Cairo; World Bank; Handoussa
and Potter (1991). Gabon. Source: AD! (various issues); World Bank.
Gambia, The. Data cover selected major nonfinan
cial SOEs: Telecom Co., River Transport Co., At
lantic Hotel, Cooperative Union, Gambia Air
ways, National Trading Co., Port Authority, Gambia Produce Marketing Board, Public Trans
port Corporation, Utiliry Corporation, Livestock
Marketing Board, and Wing Africa Ltd. Overall
balance figures are from AD!. Source: AD! (various
issues); World Bank.
Ghana. Value added numbers for 1984-87 are from
AD!; for 1988-91, estimated from the average
value added share of thirteen core nonfinancial
SOEs in total nonfinancial SOEs' value added for
1984-87. All other data except employment refer
to thirteen core nonfinancial SOEs: Water and
Sewerage Corporation, Electriciry Corporation,
Volta River Authoriry, Post and Telecommunica
tions Corporation, Airways Corporation, Supply
Commission, State Shipping Corporation, Ports
and Harbors Authoriry, Railways Corporation,
National Petroleum Corporation, Ghana Italian
Petroleum Co., Ghana Oil Co., and Cocoa
Board. Based on 1989 figures, there were close to
300 SOEs; the 14 core nonfinancial SOEs (the
above 13 plus the National Procurement Agency)
accounted for roughly 60 percent of total SOE em-
ployment, 72 percent of sales value, and 67 per
cent of value added. In 1991, the Cocoa Board ac
counted for 92 percent of all SOE investment. SOE
employment figures for 1981-82 are from AD!.
For 1986-91 they are for forty-two nonfinancial
SOEs. For 1986 and 1991, they were estimated
from the ratio of SOE employment in forty-two
nonfinancial SOEs to that in the seventeen nonfi
nancial SOEs for which figures were available for
1987-90 and 1986-91, respectively. Overall balance numbers for 1980-83 are from AD!. Source:
ADI (various issues); World Bank and IMF; State
Enterprises Commission; Ghana Quarterly Digest
of Statistics.
Guinea. The steep decline in the share of SOEs in
economic activity from 25 percent in 1981 to
about 9 percent in 1986 is apparently explained
by an overstatement of the 1981 figure because of
grossly overvalued exchange rates in the early
1980s rather than by any significant shrinking of
the SOE sector (see Fukui). Net transfer figures for
1978-84 are from Nair and Fillippides. Employ
ment numbers are from ADI and refer to share in
formal employment. Source: ADI (various issues);
World Bank; Fukui (1992); Nair and Fillippides
(1989).
Guinea-Bissau. Source: ADI (various issues); World
Bank.
Kenya. Employment figures are nonfinancial SOEs'
share of modern sector employment. Overall bal
ance numbers are estimated as operating balance
minus capital expenditure. Source: ADI (various
issues); World Bank and IMF; Investissement
Developpement Conseil (1993).
Madagascar. Employment numbers are from ADI
and refer to share in formal employment. Source:
ADI (various issues); World Bank.
Malawi. Data cover twelve major nonfinancial SOEs: ADMARC, Malawi Railways, ESCOM, Development
STATIS\ICAL AP
Corporation, Housing Corporation, Air Malawi,
Water Boards for Blantyre and Lilongwe, Malawi
Book Service, Wood Industries Corporation,
MIDCOR, and Malawi Dairy Industries. 1982-86
SOE employment is estimated based on a 15 per
cent share of SOE employment in aggregate SOE
and private sector employment. SOE overall bal
ances are estimated as operating balance minus
capital expenditure. Source: Malawi Economic Re
port (1991); Malawi Statistical Yearbook (1987);
World Bank.
Mali. Value added data are for twelve major nonfi
nancial SOEs: SOMIEX, OPAM, SCAER, Air Mali, COMATEX, EDM, ITEMA, PPM, SEPAMA, SEPOM, SMECMA, and SONATAM. Overall balance data are
from AD!. Employment numbers are from ADI
and refer to share in formal employment. Source:
ADI (various issues);World Bank.
Mauritania. Overall balance data are from Nair and
Fillippides. Source: ADI (various issues); World
Bank and IMF; Nair and Fillippides (1989).
Mauritius. Value added figures are from the national
accounts and refer to government enterprises in
the manufacturing, construction, transport, and
communication sectors. Data for SOE overall bal
ances and net transfers for 1980-84 are from Nair
and Fillippides. Employment numbers are from
ADI and refer to share in formal employment.
Source: National Accounts of Mauritius (various
years); ADI (various issues); World Bank; Nair and
Fillippides ( 1989).
Morocco. Net transfers data for 1985-90 are for ten
major nonfinancial SOEs that account for over 80
percent of SOE investment: OCP (phosphates),
ONE (electricity), ONEP (water), ONPT (telecom), ONCF (railways), ONDA (airports), ODEP (ports),
RAM (airline), COMANAV (shipping), and BRAM
(mining). Figures for SOE operating balances and
investment for 1982-85 are for nine major non-
319
UCRATS IN BUSINESS
financial SOEs. Source: AD! (various issues); World
Bank.
Namibia. Data cover only nine major nonfinancial
SOEs: NBC, NEITH, NFC, SWAWEK, TransNamib,
FNDC, NAMCOR, Meat Co., and NHE. Investment
share is derived as the sum of investment by state
owned business enterprises and state-owned cor
porations. SOE overall balances are estimated as
operating balance minus capital expenditure.
Source: IMF.
Niger. Data are for major nonfinancial SOEs. Of
forty-two nonfinancial SOEs, the major ones are
OPVN (cereals), NIGELEC (electricity and water),
SONICHAR (power generation), RINI (rice process
ing), SONITEXTIL (textiles), SONIDEP (petroleum),
OPT (post and telecom), SONARA (groundnut ex
port), SNC (cement), and Air Niger. Overall bal
ance data are from AD!. Source: AD! (various is
sues); World Bank and IMF.
Nigeria. Data cover only four major nonfinancial
SOEs that accounted for 31 percent of cumulative
government investment in the SOE sector. A 1990 World Bank study estimates that the SOE sector
contributes 35 percent of GDP and accounts for a
20 percent share of modern sector employment.
Excluding the petroleum sector, the SOE sector
was estimated to account for about 10 percent of
GDP. Investment and overall balance numbers are
from ADI. Source: ADI (various issues); World
Bank; Swanson and Wolde-Semait (1989). Rwanda. Data are for sixty-two SOEs, of which
thirty-two are wholly government owned, twelve
are mixed, with at least 50 percent government
ownership, and eighteen have majority private
ownership. The value added share of wholly
government-owned SOEs only is about 2 to 3 per
cent of GDP. SOE employment data are given as
share of formal employment. Overall balance data
are from ADI. For net transfers to SOEs, transfers
320
from SOEs to government comprise only SOE divi
dends to the government. Source: ADI (various is
sues); World Bank and IMF.
Sao Tome and Principe. Data cover eleven major non
financial SOEs, including ROSEMA (brewery),
EMAG (printing), EMAE (electric and water author
ity), ECOMEX, Ecomin-Trading Enterprise,
TRANSCOLMAR, TERRESTRE (public transport),
CONSTRUCTORA (construction), EMAVE (poultry),
and EMSERA (bricks). Source: IMF.
Senegal Figures for 1987, 1988, and 1989 were es
timated based on the share of nonfinancial SOEs
in total investment and employment in 1987. SOE
employment figures are reported as a share of for
mal sector employment (civil service plus cucr es
timates). Source: Controle Financier (CFP); AD!
(various issues); World Bank and IMF. Seychelles. Data refer to all SOEs. Source: IMF.
Sierra Leone. Data refer to all SOEs. Overall balance
and employment numbers that refer to share in
formal employment are from ADI. Source: ADI
(various issues); World Bank and IMF.
South Africa. Source: South African Statistics
(1990); Quarterly Bulletin, South African Reserve
Bank (1992); IMF.
Sudan. The value added numbers are estimated
based on World Bank studies suggesting that the
contribution of the SOE sector, 48-50 percent of
GDP, remained almost constant throughout the
decade. Source: AD! (various issues); World Bank.
Tanzania. The 65 percent spurt in SOE investment
for 1989 is attributed to a steep increase in water
sector investments from 587 million shillings in
1988 to 34,160 million shillings in 1989. Net
transfers figures for 1978-80 are from Nair and
Fillippides. For later years, SOE-to-government
transfers include dividends from the Bank ofTan
zania from 1986-87 onward. This dividend was
estimated to be 200 million shillings that year but
had not been paid in the past. Source: Tanzania Economic Survey, 1988-90; ADI (various issues);
World Bank.
Togo. Investment data are for eight major SOEs. Em
ployment numbers are from ADI and refer to share
in formal employment. Overall balance numbers
are taken from ADI. Data for net transfers are ob
tained from country sources. Source: ADI (various
issues); World Bank and IMF; Ministere de l'industrie et des societes d'Etat (1991).
Tunisia. Value added for 1981, 1982, and 1986 is
estimated from figures for share of SOE sector in
GOP for 1983-85 and value added figures for
forty major SOEs for 1981, 1982, and 1986. Investment numbers are from World Bank BESD
database. Source: ADI (various issues); World
Bank.
Zaire. Figures for value added, overall balance, and
employment (which refers to share in formal em
ployment) are from ADI. Figures for net transfers
for 1981-84 are from Nair and Fillippides. Over
all balance numbers are from ADI. Source: AD!;
World Bank; Nair and Fillippides (1989).
Zambia. Value added figures for 1987-91 are esti
mated based on share of ZIMCO in SOE value
added for 1981-84. ZIMCO alone averaged a 14.3
percent share of GOP for 1987-92. 1980-84 fig
ures, overall balances, and net transfers data are
from ADI. Source: ADI (various issues); IMF.
Zimbabwe. Data cover twelve major SOEs. Employ
ment numbers are from ADI and refer to share in
formal employment. Overall balance numbers are
from ADI. Source: ADI (various issues); IMF.
Asia
Bangladesh. Data for 1985-91 are for ten major
nonfinancial SOEs. 1981-84 data are for five
major nonfinancial SOEs only. SOE overall bal-
STATISTICAL APPE'N.
ances are estimated as operating balance minus
capital expenditure. The overall deficit of twenty
five major nonfinancial SOEs excluding railways,
post office, and telecom was about 5 percent of
GOP for 1986-90. Source: World Bank and IMF.
Flj'i. All state-owned corporations; investment num
bers are from World Bank BESD database. Source:
World Bank.
India. All data except employment figures cover nonfinancial SOEs owned by central, state, and
local governments. Employment figures are for
central nonfinancial SOEs only, which represented
70 percent of nonfinancial SOEs' value added in 1980-81 and 53 percent in 1989-90. Overall balances and net transfers data are for central
nonfinancial SOEs only. Source: India National Accounts Statistics (1989, 1992); Public Enterprise Survey (various issues); World Bank.
Indonesia. SOE overall balances are estimated as oper
ating balance minus capital expenditure. Source:
World Bank and IMF; Indonesian Business Data ,
Center; Premchand and Wijayasuriya (1987).
Korea, Republic of Source: Economic Planning.
Board; Korean Development Institute; Economic
Statistics Yearbook; Korea Statistical Yearbook;
Ministry of Finance and Economy; Shirley (1991).
Malaysia. Value added figure is from Shaikh (1987).
Data are for fifty nonfinancial SOEs for 1990,
fifty-two to fifty-four nonfinancial SOEs for
1986-89, and thirty-six nonfinancial SOEs for
1980-8 5. SOE overall balances are estimated as
operating balance minus capital expenditure.
Data for net transfers for 1981-85 are from Nair
and Fillippides. Source: World Bank and IMF;
Malaysia Quarterly Bulletin of Statistics; Nair and Fillipides (1989); Shaikh (1991b).
Myanmar. Includes financial SOEs. Data for net
transfers for 1978-86 are from Nair and Fillippi
des. Source: IMF; Nair and Fillipides (1989).
321
ATS IN BUSINESS
NepaL Employment figures refer to share of nona
gricultural employment. SOE overall balances are
estimated as operating balance minus capital ex
penditure. Source: Ministry of Finance: Eco
nomic Survey, 1987-88; Performance Review of
SOEs in Nepal (1981); IMF.
Pakistan. Value added series are estimated from
three data points based on published studies
pointing to little change in contribution of SOEs
to economic activity. Source: Pakistan Statistical
Yearbook (1989); Ministry of Production: Public
Sector Industries-Annual Reports (1988-89, 1985-86); World Bank and IMF; Shirley (1989); Shaikh (1991 a).
Papua New Guinea. Source: World Bank and IMF.
Philippines. Besides financial SOEs, SOEs in the educational, social, civic, cultural, and research sector are also excluded. Since no data are available for
1985, all figures for 1985 are estimated. Invest
ment figures are for fourteen major nonfinancial
government owned corporations (NFGOCs),
which in 1989 accounted for 90 percent of total
SOE investment. Source: Commission on Audit
Annual Financial Report on Government Owned
and Controlled Corporations (various years);
World Bank and IMF; Manasan and Buenaventura
(1986). Sri L,znka. Data for 1981-85 exclude some smaller
nonfinancial SOEs. Value added figures are for
thirty state-owned manufacturing enterprises
(SMEs), including the three largest-Ceylon Pe
troleum, National Textiles, and Sri Lanka Ce
ment-which account for 70 percent of all SME
output. Investment figures for 1980-81 are from
Nair and Fillippides. Employment figures for
1981-90 include government agencies and finan
cial institutions. Prior to 1987, transfers to state
owned corporations include transfers to stateowned institutions, as no disaggregated data are
322
available. Since 1987, data for net transfers are for
eleven monitored state-owned corporations. Cap
ital transfers for 1986 are estimated. Source: Cen
tral Bank of Sri Lanka; World Bank and IMF.
Taiwan (China). Overall balance figures are esti
mated as operating balance minus capital expen
diture. Source: Yearbook of Financial Statistics
(1991); Taiwan Statistical Databook (1994); Sta
tistical Yearbook (1994).
fhailand. Data for value added are for aifso£5; in
/ eluding financial SOEs. Source: World Bank and
L IMF; Charoenloet (1989). ______-/ Turkey. Data include nonfinancial SOEs tp~ere
under privatization schemes. Source: World Bank
and IMF.
Western Samoa. Data for 1989-92 cover fifteen SOEs and statutory corporations; data for 1985-89 cover thirty-five SOEs and statutory corporations.
Source: IMF.
Industrial Countries
Australia. SOE investment numbers refer to all state
owned corporate and quasi-corporate enterprises,
including financial SOEs as defined in the OECD
National Accounts Statistics. Source: OECD Na
tional Accounts Statistics.
Austria. SOE value added and investment numbers
for 1978-79 include "nationalized industry,"
"other state holdings," and "mixed holdings" as
reported by Centre Europeen de 1' entreprise
publique (CEEP 1981). Figure for 1988 is an esti
mate for all (including municipal and provincial)
nonfinancial SOEs (CEEP 1990). Source: CEEP (var
ious years).
Belgium. Selected major SOEs only. Value added
numbers are for SOEs in transport and communi
cations only. SOE investment numbers are for SOEs
in gas and electricity, water, transport, post, tele-
graph, telecom, radio, and TV only. Generally,
SOEs are defined as including financial, housing,
public administration, and hospitals.The figures
have been adjusted where possible and annotated
when not possible. To overcome the problem of
missing observations, 1983 value added and in
vestment figures are substituted when deriving re
spective industrial country averages for 1982. Source: CEEP (various years).
Denmark. SOE value added and investment numbers
include regional and municipal SOEs. Source:
CEEP (various years).
France. Generally, SOEs are defined as including
agricultural, local, and municipal SOEs but excluding housing and financial SOEs. Value added
and investment numbers for 1978-79 include fi
nancial SOEs. Source: CEEP (various years).
Germany. Refers to preunification Federal Republic
of Germany. No postunification numbers were
available. SOE value added and investment figures
reported here include figures for SOEs in trans
port, industry, and commerce and exclude SOEs
in housing, credit, and insurance. County and
local SOEs are included. To overcome the prob
lem of missing observations, a 1985 value added
figure is substituted when deriving the industrial
economy average for 1988. Source: CEEP (various
years).
Greece. Value added numbers for 1986-89 are esti
mated. No figures are available for 1981-8 5. SOE
investment numbers for 1978-79 and 1986-89 are for all nonfinancial SOEs. 1981-8 5 figures
refer to fifty SOEs under the General Secretariat
for Public Enterprise. To overcome the problem
of missing observations when deriving averages
for industrial economies the 1982 value added
figure is estimated as the average of 1979 and
1986, and 1986 value added figures are substi
tuted for 1985. Source: CEEP (various years).
STATISTICAL
Ireland Figures include all SOEs, as disaggregation
was not available. Source: CEEP (various years).
Italy. Municipal SOEs are included. To overcome the
problem of missing observations when deriving
industrial economies' averages, the 198 5 value
added figure is estimated as the average of 1982 and 1988, and 1978 value added and investment
figures are substituted for 1979. Source: CEEP (various years).
japan. SOE investment numbers are for all state
owned corporate and quasi-corporate enterprises,
including financial SOEs as defined by OECD Na
tional Accounts Statistics. Source: OECD National
Accounts Statistics.
Netherlands. SOE investment numbers are for se
lected enterprises: Dutch Railways, KLM, PTT,
DSM, and Gas Union. Agriculture and public ser
vices are not included. Source: CEEP (various
years).
Norway. SO£ investment numbers are for all state
owned corporate and quasi-corporate enterprises,
including financial SOEs as defined by OECD Na
tional Accounts Statistics. Source: OECD National
Accounts Statistics.
Portugal. Value added numbers for 1983-84 in
clude financial SOEs. For all other years, both
value added and investment numbers are for non
financial SOEs. To overcome the problem of miss
ing observations, a 1983 value added figure is
substituted when deriving the industrial country
average for 1979 and 1982. Source: CEEP (various
years).
Spain. Nonfinancial SOEs include industry, trans
port and communications, energy and mines, and
commerce and services. Financial and housing are
excluded. Source: CEEP (various years).
Sweden. Numbers refer to all SOEs as defined by the
UN National Accounts Statistics. Source: UN Na
tional Accounts Statistics.
323
~UCRATS IN BUSINESS
United Kingdom. SOE investment numbers are for all
state-owned corporate and quasi-corporate enter
prises, including financial SOEs as defined by
OECD National Accounts Statistics. Source: OECD National Accounts Statistics.
United States. Value added numbers refer to the "sta
tistical discrepency" in the UN National Accounts
Statistics and are identified in the footnote as gov
ernment enterprises. SOE investment numbers are
324
for all state-owned corporate and quasi-corporate enterprises, including financial SOEs as defined by
OECD National Accounts Statistics. To overcome
the problem of missing observations, 1980 and
1987 value added figures are substituted when de
riving the industrial country average for 1979 and
1988, respectively. Source: OECD National Ac
counts Statistics; UN National Accounts Statistics.
References
Aharoni, Yair. 1986. The Evolution and Management of State Owned
Enterprises. Cambridge, Mass.: Ballinger. Arriagada Herrera, Genera, and Carol Graham. 1994. "Chile: Sustain
ing Adjustment during Democratic Transition." In Haggard, S., and
S. Webb. eds., Voting for Reform: Democracy, Political Liberalization,
and Economic Adjustment. New York: Oxford University Press.
Aspe, Pedro. 1991. "Thoughts on Structural Transformation in Mexico: The Case of Privatization of Public Sector Enterprises." Address
given at the World Affairs Council in Los Angeles.
Ayubi, Nazih. 1991. The State and Public Policies in Egypt since Sadat.
Reading, U.K.: Ithaca Press.
Baer, Herbert, and Cheryl Gray. 1994. "Debt as a Control Device in Transitional Economies: The Experiences of Hungary and Poland."
Presentation to a Joint Conference of the World Bank and the Central European University, Privatization Project, Washington, D.C.
Banerji, Arup, and Richard H. Sabot. 1994. "Wage Distortions, Over
manning, and Reform in Developing Country Public Enterprises."
Background Paper. Policy Research Department, World Bank, Washington, D.C.
Baron, David. 1988. "Regulation and Legislative Choice." RAND jour
nal of Economics 19 (3):553-68. Barra, Robert J. 1991. "Economic Growth in a Cross-Section of Coun
tries." Quarterly journal of Economics 106:407-444. Bates, R. H., and A. 0. Krueger. 1993. Political and Economic Interac
tions in Economic Policy Reform. Cambridge, Mass: Blackwell. Bennett, James T., and Manuel H. Johnson. 1979. "Public versus Pri
vate Provision of Collective Goods and Services: Garbage Collection Revisited." Public Choice. 34(1):55-63.
325
.SIN BUSINESS
326
Berg, Eliot. 1993. "Privatization in Sub-Saharan Mrica: Results,
Prospects, and New Approaches." Consultant Report. Development Alternatives Inc., Bethesda, Md.
Besanko, David, and David Sappington. 1987. Designing Regulatory
Policy with Limited Information. New York: Harwood Academic Publishers.
Bishop, Matthew, and John Kay. 1988. Does Privatization Work?
Lessons from the UK London: London Business School. Boardman, Anthony E., and Aidan R. Vining. April1989. "Ownership
and Performance in Competitive Environments: A Comparison of the Performance of Private, Mixed, and State-Owned Enterprises." Journal of Law and Economics 32:1-33.
Bokil, S. V. 1990. "A Study of Liberalization in the Southern Cone Countries of Latin America: Lessons for India." In Ashok Cunha, ed., Economic Liberalization, Industrial Structure, and Growth in
India. Delhi: Oxford University Press. Borcherding, E., W W Pommerehne, and F. Schneider. 1982. "Com
paring the Efficiency of Private and Public Production: The Evidence from Five Countries." Zeitschrift for Nationalokonomie. Supplement 2:127-56.
Boycko, Maxim, Andrei Shleifer, and Robert W Vishny. 1993. ''A Theory of Privatization." Mimeo.
Brada, Josef, and A. E. King. 1993. "Sequencing Measures for the Transformation of Socialist Economies to Capitalism: Is There a ]-Curve for Economic Reforms?" InK. Poznanski, ed., Stabilization
and Transformation of the Polish Economy. Boston: Kluwer Academic Publishers.
Brada, Josef, A. E. King, and Chia Ying Ma. 1993. "Industrial Economics of the Transition: Determinants of Enterprise Efficiency in Czechoslovakia and Hungary." Policy Research Paper EE-RPS. World Bank, Washington, D.C.
Broadman, Harry. 1995. Meeting the Challenge of Chinese Enterprise Re
form. Discussion Paper 283. Washington, D.C.: World Bank. Brown, L., M. Einhorn, and I. Vogelsang. 1991. "Toward Improved
and Practical Incentive Regulation." journal of Regulatory Economics
3:323-38. Bruno, M., S. Fischer, E. Helpman, N. Liviatan, and L. Meridor, eds.
1991. Lessons of Economic Stabilization and Its Aftermath. Cambridge, Mass.: MIT Press.
Bruno, M., and William Easterly. 1994. "Inflation Crises and LongRun Growth." Draft. Policy Research Department, Macroeconomic
and Growth Division. World Bank, Washington, D.C. Caillaud, B., R. Guesnerie, P. Rey, and]. Tirole. 1988. "Government
Intervention in Production and Incentives Theory: A Review of Recent Contributions." RAND journal of Economics 19 (1):1-26.
Candoy-Sekse, Rebecca. 1988. Techniques of Privatization of State
Owned Enterprises. Technical Paper 90, Vol III. Washington, D.C.: World Bank.
Caves, D. W, and L. R Christensen. 1980. "The Relative Efficiency of Public and Private Firms in a Competitive Environment: The Case of the Canadian Railroads." journal of Public Economy
88:958-76. CEEP (Centre europeen de l'entreprise publique). Various years. Annales
du CEEP. Bruxelles. Ceska, Roman. 1993. "Privatization in the Czech Republic." In An
dreja Bohm and Marko Simoneti, eds., Privatization in Central and
Eastern Europe. Ljubljana, Slovenia: Central and Eastern European Privatization Network.
CETESB (Companhia de Technologia de Saneamento Ambiental). 1994. "Acao de CETESB em Cubatao: Situadio em Junho de 1994." Sao Paulo, Brazil.
Charoenloet, Voravidh. 1989. "The Crisis of State Enterprise in Thailand." journal of Contemporary Asia 19:206-217.
Clemente, Lino. 1994. "Efectividad de la reforma de empresas publicas en Venezuela: La privatizaci6n de la Compafi{a An6nima Nacional Telefonos de Venezuela, CANTY." Office of Evaluation, InterAmerican Development Bank, Washington, D.C.
Cordon, Roberto. 1993a. "The Political Framework of Privatization in Chile." Background Paper. Policy Research Department, World Bank: Washington, D.C. Obtainable from the author at Escuela de Administraci6n, Pontificia Universidad Cat6lica de Chile.
-- 1993b. "The Reform of Mexican Public Enterprises." Background Paper. Policy Research Department, World Bank, Washington, D.C. Obtainable from the author at Escuela de Administraci6n, Pontificia Universidad Cat6lica de Chile.
Dabrowski, J., M. Federowicz, and A. Levitas. 1991. "Polish State Enterprises and the Properties of Performance: Stabilization, Marketization, Privatization." Politics and Society 19 ( 4).
RE
327
<:;RATS IN BUSINESS
328
Dabrowski, J., M. Federowicz, and J. Szomburg. 1992. "Privatization of the Polish State-Owned Enterprises." Economic Transformation
29. The Gdansk Institute for Market Economies. Daily Graphic. 1992. "More Election Results Declared." Accra, Ghana. De Gregorio, Jose. 1993. "Inflation, Taxation, and Long Run
Growth." journal of Monetary Economics 31 (June):271-98. de Keijzer, ]. Th. A. 1993. ''Aiming for See-Through Laws." In Privati
sation in Emerging Markets. London: IFR Publishing.
Dekle, Robert, and Kenneth Sokoloff 1990. "Patterns of Productivity
Growth in South Korean Manufacturing Industries 1963-1979." journal of Economic Development 33:309-327.
Demirgii<;:-Kunt, Asli, and Ross Levine. 1994. "The Financial System and Public Enterprise Reform: Concepts and Cases." Policy Research Working Paper 1319. World Bank, Washington, D.C.
Dewatripont, M., and G. Roland. 1993. Design of Reform Packages
under Uncertainty. Discussion Paper 860:1-32. U.K.: Centre for Economic Policy Research.
Dittus, Peter. 1993. "Finance and Corporate Governance in Eastern Europe." Bank for International Settlements, Basle, Switzerland.
Dyer Cisse, Nichola. 1994. "The Impact of Performance Contracts on Public Enterprise Performance." Background paper. Policy Research Department, World Bank, Washington, D.C.
Easterly, William, Carlos Alfredo Rodriguez, and Klaus SchmidtHebbel, eds. 1994. Public Sector Deficits and Macroeconomic Perfor
mance. New York: Oxford University Press. Easterly, William, and Sergio Rebelo. 1993. "Fiscal Policy and Eco
nomic Growth: An Empirical Investigation." Journal of Monetary
Economics 32 (3):417-58. Edwards, S., and G. Tabellini. 1991. "The Political Economy of Fiscal
Policy and Inflation in Developing Countries: An Empirical Analysis." Policy Research Working Paper 703. World Bank, Washington, D.C.
Einhorn, Michael A., ed. 1990. Price Caps and Incentive Regulation in
Telecommunications. Boston: Kluwer Academic Publishers. EIU (Economist Intelligence Unit). 1992. "The Czech Republic Coun-
try Profile." London. --. 1993. "Turkey Country Profile." London. --. 1994. "Ghana Country Profile." London. --. 1994-95. "Poland Country Profile." London.
El-Issawy, Ibrahim H. 1983. Labour Force, Employment, and Unemployment. Employment Opportunities and Equity in Egypt Papers 4. Geneva: International Labor Office.
Esfahani, Hadi. 1994. "Regulations, Institutions, and Economic Performance: The Political Economy of the Philippines' Telecommuni
cations Sector." Policy Research Working Paper 1294. World Bank, Washington, D.C.
Estrin, Saul, Alan Gelb, and Inderjit Singh. 1993. "Restructuring, Viability, and Privatization: A Comparative Study of Enterprise Adjustment in Transition." Policy Research Paper EE-RPS 31. World Bank, Washington, D.C.
Estrin, Saul, Mark Schaffer, and Inderjit Singh. 1993. "Enterprise Adjustments in Transition Economies: Czechoslovakia, Hungary, and Poland." Policy Research Paper EE-RPS 8. World Bank, Washington, D.C.
Etievent, Alain & Associes. 1993. "Analyse de Ia SOTRAC." Consultant report commissioned by the World Bank and Cooperation franc;:aise. Grenoble, France.
Europa World Yearbook. 1994. London: Europa Publications. European Bank for Reconstruction and Development. 1994. Annual
Economic Review. London: Libra Group Limited. Fischer, Stanley. 1993. "Role of Macroeconomic Factors in Growth."
journal of Monetary Economics 32 (December):485-512. Floyd, Robert, Clive Gray, and R. P. Short. 1984. Public Enterprise in
Mixed Economies: Some Macroeconomic Aspects. Washington, D.C.: International Monetary Fund.
Fukui, Ryu. 1992. Study on the Historical Performance of the Public Enterprise Sector in Guinea. Tokyo: Japan Economic Research Institute.
Gala!, Ahmed. 1991. Public Enterprise Reform: Lessons from the Past and Issues for the Future. Discussion Paper 119. Washington, D.C.: World Bank.
--. 1992. "Chile." In Ahmed Gala! and others, eds., We/fore Consequences of Selling Public Enterprises: Case Studies from Chile, Malaysia, Mexico, and the UK Washington, D.C.: World Bank.
--. 1994. "Regulation and Commitment in the Development of Telecommunications in Chile." Policy Research Working Paper 1278. World Bank, Washington, D.C.
Gala!, Ahmed, Leroy Jones, Pankaj Tandon, and Ingo Vogelsang. 1994. We/fore Consequences of Selling Public Enterprises: An Empirical Analysis. New York: Oxford University Press.
REF
329
RATS IN B US I N E S S
330
Galal, Ahmed, and Bharat Nauriyal. 1995. Forthcoming. "Regulation
of Telecom in Developing Countries: Outcomes, Incentives, and
Commitment." Policy Research Paper. World Bank, Washington,
D.C.
Ganguly, Bengendu, and Mira Ganguly. 1982. Dimensions of Electoral Behavior. Calcutta: Pearl Publishers.
Gelb, Alan, Erika Jorgensen, and lnderjit Singh. 1992. "Life after
the Polish 'Big Bang': Episodes of Preprivatization Enterprise Be
havior." In Ayre Hillman and Branko Milanovic, eds., The Transition ftom Socialism in Eastern Europe. Washington, D.C.: World
Bank. Gelb, Alan, and lnderjit Singh. 1994. "Public Enterprise Reforms in
Transitional Economies." Background paper. Policy Research Department, World Bank, Washington, D.C.
Gomulka, Stanislaw. 1994. "The Financial Situation of Polish Enter
prise (1992-1993) and Its Impact on Monetary and Fiscal Policies." The Economics a/Transition 2 (June).
Cora, Marek. 1993. "Industrial Employment Adjustment during
Transition: The Case of Polish Industry." Policy Research Paper EE
PB 7. World Bank, Washington, D.C.
Groves, Theodore, Yong-Miao Hong, John McMillan, and Barry Naughton. 1993. "Autonomy and Incentives in Chinese State En
terprises." Discussion Paper 93-16. Department of Economics, University of California, San Diego. Reprinted 1994 in the Quarterly journal of Economics 109 ( 1): 183-209.
Gurr, T., K. Jaggers, and W. Moore. 1989. Polity II Codebook. Assem
bled by ICPSR (Inter-University Consortium for Political and Social
Research). Ann Arbor: University of Michigan. Gylfason, T. 1991. "Endogenous Growth and Inflation." Seminar Pa
pers, 502. Institute for International Economic Studies, University
of Stockholm.
Hachette, Dominique. 1988. "Wage and Employment Policies m Chile." Mimeo. Universidad Cat6lica de Chile.
Hachette, Dominique, and Rolf Li.iders. 1992. La privatizaci6n en Chile. Centro internacional para el desarollo econ6mico (CINDE).
San Francisco: res Press.
Haggard, Stephen, and Steven B. Webb, eds. 1994. Votingfor Reform: Democracy, Political Liberalization, and Economic Adjustment. New York: Oxford University Press.
Handoussa, Heba A. 1983. Public Sector Employment and Productivity
in the Egyptian Economy. Employment Opportunities and Equity in
Egypt Papers 7. Geneva: International Labour Office.
Handoussa, H., and G. Potter, eds. 1991. Employment and Structural
Adjustment: Egypt in the 1990s. Cairo: American University in Cairo
Press.
Hegstad, Sven Olaf, and Ian Newport. 1987. Management Contracts:
Main Features and Design Issues. Technical Paper 65. Washington, D.C.: World Bank.
Herbst, Jeffrey. 1991. "Labor in Ghana under Structural Adjustment: The Politics of Acquiescence." In D. Rothchild, ed., Ghana-The
Political Economy of Recovery. Boulder: Lynne Rienner. Hettige, Hemamala, Mainul Huq, Sheoli Pargal, and David Wheeler.
1995. "Determinants of Pollution Abatement in Developing Countries: Evidence from South-East Asia." Paper presented at the ACAES
session of American Economic Association/ Allied Social Science As
sociation meetings, Washington, D.C. Hill, Alice, and Manuel Abdala. Forthcoming. "Regulation, Institutions,
and Commitment: Privatization and Regulation in the Argentine Telecommunications Sector." In Brian Levy and Pablo Spiller, eds.,
forthcoming, Regulations, Institutions, and Commitment: Comparative
Studies ofTelecommunications. New York: Cambridge University Press.
Hwa, Erh-Cheng. 1992. "Enterprise Reform in China: A Background Note." Draft paper. World Bank Mission, Beijing, China.
Ibrahim, Saad Eddin. 1994. "Governance and Structural Adjustment: The Egyptian Case." Paper presented at the World Bank Gover
nance and Successful Adjustment Conference, Washington, D.C.
ILO (International Labour Organization). Various years. Year Book of Labour Statistics. Geneva.
International Telecommunications Union. 1994. World Telecommuni
cations Development Report. Geneva. --. Various years. Yearbook of Common Carrier Telecommunications
Statistics. Geneva.
Investissement Developpement Conseil. 1993. "Kenya: Study of Subsidies and Other Financial Flows in Favor of Major PEs." Consultant report. Paris.
Jefferson, Gary. 1993. "Are China's Rural Enterprises Outperforming State-Owned Enterprises?" Policy Research Paper CH-RPS 24. World Bank, Washington, D.C.
331
'~~UCRATS 1 N BUSINESS
332
Jefferson, Gary, and Thomas Rawski. 1992. ''A Theory of Economic Reform." Policy Research Paper CH-RPS 15. World Bank, Washington, D.C.
Jefferson, Gary, Thomas Rawski, and Yuxin Zheng. 1992. "Growth, Efficiency, and Convergence in China's State and Collective Industry." Economic Development and Cultural Changes
40(2):239-66. --. 1993. "Innovation and Reform in Chinese Industry: A Prelimi
nary Analysis of Survey Data." Policy Research Paper CH-RPS 16. World Bank, Washington, D.C. Reprinted in Zhongguo shengchan
lubiandong qushi zhi yanjiu (Studies in the trend of productivity in China). Beijing: Shehui kexue wenxian chubanshe.
Jones, Leroy. 1975. Public Enterprise and Economic Development: The
Korean Case. Seoul: Korea Development Institute. --. 1981. "Towards a Performance Evaluation Methodology for
Public Enterprises: With Special Reference to Pakistan." Paper presented at the international symposium on Economic Performance of Public Enterprises, Islamabad.
--. 1985. "Public Enterprise for Whom? Perverse Distributional Consequences of Public Operational Decisions." Economic Develop
ment and Cultural Changes 33 (2):333-47. --. 1991. Performance Evaluation for Public Enterprises. Discussion
Paper 122. Washington, D.C.: World Bank. Jones, L., and E. Mason. 1982. "Role of Economic Factors in Deter
mining the Size and Structure of the Public Enterprise Sector in Less Developed Countries with Mixed Economies." In Leroy Jones, ed., Public Enterprise in Less Developed Countries. New York: Cambridge University Press.
Ka, Samba, and Nicolas van de Walle. 1994. "Senegal: Stalled Reform in a Dominant Party System." InS. Haggard and S. Webb, eds., Vot
ing for Reform: Democracy, Political Liberalization, and Economic Ad
justment. New York: Oxford University Press. Kaufman, Robert R., Carlos Bazdresch, and Blanca Heredia.1994.
"Mexico: Radical Reform in a Dominant Party System." In S. Haggard and S. Webb, eds., Voting for Reform: Democracy, Political Lib
eralization, and Economic Adjustment. New York: Oxford University Press.
Kikeri, Sunita, John Nellis, and Mary Shirley. 1992. Privatization: The
Lessons of Experience. Washington, D.C.: World Bank.
Kjellstrom, S. B. 1990. "Privatization in Turkey." Policy Research
Working Paper 532. World Bank, Washington, D.C.
Klaus, Vaclav. 1993. "Privatization Experience: The Czech Case." In
Andreja Bohm and Marko Simoneti, eds., Privatization in Central
and Eastern Europe. Ljubljana, Slovenia: Central and Eastern Euro
pean Privatization Network.
Knack, Stephen, and Philip Keefer. Forthcoming. "Institutions and
Economic Performance: Cross-Country Tests Using Alternative Institutional Measures." Economics and Politics.
Kornai, Jano. 1980. The Economics of Shortage. Amsterdam: North Holland.
--. 1990. The Road to a Free Economy. New York: W W Norton.
Kwesi, Jonah. 1993. "Political Parties, Party Tradition, and the Transition to Multiparty Politics in Ghana, 1991-93." Mimeo. University of Ghana, Legan.
Lall, Rajiv. 1994. Country Economic Memorandum. Report 13399-CHA. World Bank, Washington, D.C.
Larrain, F., and M. Selowsky, eds. 1991. The Public Sector and the Latin
American Crisis. San Francisco: ICS Press. Leith,]. Clark, and Michael F. Lofchie. 1993. "The Political Economy
of Structural Adjustment in Ghana." In Robert H. Bates and Anne
0. Krueger, eds., Political and Economic Interactions in Economic Pol
icy Reform. Cambridge, Mass; Oxford, U.K.: Blackwell. Levy, Brian, and Pablo Spiller, eds. Forthcoming. Regulations, Institu
tions, and Commitment: Comparative Studies ofTelecommunications.
New York: Cambridge University Press. L6pez-de-Silanes, F. 1993. "Determinants of Privatization Prices."
Mimeo. National Bureau of Economic Research (NBER), Harvard
University. Liiders, Rolf. 1990. "Chile's Massive SOE Divestiture Program,
1975-90: Failures and Successes." Paper presented at the World Bank Conference on Privatization and Ownership Changes in East
ern and Central Europe. Manasan, Rosario G., and C. Buenaventura. 1986. ''A Macroeconomic
Overview of Public Enterprises in the Philippines, 1975-84." Staff Paper 86-03. Philippine Institute for Development Studies, Manila.
Manasan, Rosario G., and Ponciano S. Intal, Jr. 1992. "Private SectorLed Development Strategy and the Role of Government in the Philippines." Prepared for the Senior Policy Forum on the Private
REFEREN,
333
TS IN BUSINESS
334
Sector-Led Development Strategy and the Role of Government in
Developing Countries, Korea Development Institute, Seoul.
Manion, Melanie. 1993. Retirement of Revolutionaries in China: Public Policies, Social Norms, Private Interests. Princeton: Princeton Univer
sity Press. Martin del Campo, Antonio, and Donald R. Winkler. 1991. "State
Owned Enterprise Reform in Latin America." Occasional Paper 2.
Latin America Technical Department, Public Sector Modernization
Division (LATPS). World Bank, Washington, D.C.
Megginson, William, Robert Nash, and Matthias van Randenborgh.
1994. "The Financial and Operating Performance of NewlyPrivatized Firms: An International Empirical Analysis." journal of Finance 49 (2):403-452.
Millward, R. 1982. "The Comparative Performance of Public and Private Ownership." In Lord E. Roll, ed., The Mixed Economy. New
York: Macmillan. Millward, R., and D. M. Parker. 1983. "Public and Private Enterprise:
Comparative Behavior and Relative Efficiency." In R. Millward,
D. M. Parker, L. Rosenthal, M. T. Summer, and N. Topman, eds.,
Public Sector Economics. London and New York: Longman. Milor, Vedat. 1994. "Political Economy of Public Enterprise Reform
and Privatization in the Czech Republic and Poland." Background
paper. Policy Research Department, World Bank, Washington, D.C. Molinar Horcasitas, Juan. 1991. El tiempo de fa legitimidad: Elecciones,
autoritarismo y democracia en Mexico. Mexico: Cal y Arena.
Molinar Horcasitas, Juan, and Jeffrey Weldon. 1990. "Elecciones de 1988 en Mexico: Crisis del autoritarismo." Revista Mexicana de So
ciologia 52 (4):229-62. Morin, Pierre. 1993. "Senegal: Towards the Next Stages in PE Reform
and Privatization." West Africa Department, Industry and Energy
Division, World Bank, Washington, D.C. Mukul. 1991. "Workers against Privatization." Economic and Political
Weekly 1781-5. India. Nair G., and A. Fillipides. 1989. "How Much Do State-Owned Enter
prises Contribute to Public Sector Deficits in Developing Countries
and Why?" Working Paper 45. World Bank, Washington, D.C.
Nellis, John. 1989. "Contract Plans and Public Enterprise Performance." Policy, Planning, and Research Working Paper 118. World Bank, Washington, D.C.
Ninsin, Kwame A. 1991. "The PNDC and the Problem of Legitimacy."
In D. Rothchild, ed., Ghana: The Political Economy of Recovery.
Boulder: Lynne Rienner.
North, Douglass C. 1990. Institutions, Institutional Change, and Eco
nomic Performance. New York: Cambridge University Press.
OECD (Organization for Economic Cooperation and Development).
1992. Integration of Developing Countries into the International Trad
ing System. Paris. --. Various years. National Accounts Statistics. Paris.
Onis, Ziya, and Steven B. Webb. 1992. "Political Economy of Policy Reform in Turkey in the 1980s." Policy Research Working Paper 1059. World Bank, Washington, D.C.
Pargal, Sheoli, and David Wheeler. 1995. "Informal Regulation oflndustrial Pollution in Developing Countries: Evidence from Indonesia." Policy Research Working Paper 1416. World Bank, Washington, D.C.
Pinto, B., M. Belka, and S. Krajewski. 1992. "Microeconomics of
Transformation in Poland: A Survey of State Enterprise Responses."
StaffWorking Paper 982. World Bank, Washington, D.C. --. 1993. "Transforming State Enterprise in Poland: Evidence on
Adjustment by Manufacturing Firms." Brookings Papers on Eco
nomic Activity 1:213-70.
Polity II dataset-See Gurr, Jaggers, and Moore (1989). Premchand, A., and P. M. W Wijaysuriya. 1987. Indonesia: Financial
Performance of State Enterprises, 1982-86 Fiscal Affairs Department, International Monetary Fund, Washington, D.C.
Privatisation Yearbook. 1992. London: Privatisation International.
Ranganathan, A. 1987. "Public Enterprise Preferences." Consultant report. New Dehli.
Rivlin, Paul. 1985. The Dynamics of Economic Policy-Making in Egypt.
New York: Praeger. Romer, Thomas, and Howard Rosenthal. 1987. Public Regulation: New
Perspectives on Institutions and Policies. MIT Press Series on the Regu
lation of Economic Activity 14. Cambridge, Mass.: MIT Press. Rosati, Dariusz. 1993. "The Impact of the Soviet Trade Shock on Out
put Levels in Central and Eastern European Economies." Paper presented at the conference on Output Declines in Eastern EuropeProspects for Recovery, International Institute for Applied Systems Analysis (IIASA). Austria.
REF
335
UCRATS IN BUSINESS
336
Ross, S. 1991. "The Economic Theory of Agency: The Principal's Problem." In Robert Kuenne, ed., Microeconomics: Theoretical and Applied. International Library of Critical Writings in Economics 2 (11). Aldershot, U.K. and Brookfield, Vt.: Elgar.
Roth, Gabriel. 1987. "The Private Provision of Public Services in Developing Countries." EDI Series in Economic Development. New York: Oxford University Press.
Rothchild, Donald, ed. 1991. Ghana: The Political Economy of Recovery. Boulder: Lynne Rienner.
Sachs, Jeffrey D., and Wing Thye Woo. 1994. "Structural Factors in the Economic Reforms of China, Eastern Europe, and the Former Soviet Union." Economic Policy 18 (April):101-145.
Sader, Frank. 1993. "Privatization and Foreign Direct Investment in the Developing World, 1988-92." Policy Research Working Paper 1202. World Bank, Washington, D.C.
--. 1994. "Privatization Techniques and Foreign Investment in Developing Countries, 1988-93." World Bank, Washington, D.C.
Saez, Raul E. 1992. ''An Overview of Privatization in Chile: The Episodes, the Results, and the Lessons." Consultant report. Contact author at CIEPLAN, Santiago, Chile.
Sappington, David E. M. 1991. "Incentives in Principal-Agent Relationships." journal of Economic Perspective 5 (2):45-66.
Sappington, David E. M., and Joseph E. Stiglitz. 1987. "Privatization, Information, and Incentives." National Bureau of Economic Re
search (NBER) Working Paper 2196. Harvard University, Cambridge, Mass.
Schaffer, Mark. 1993. "The Enterprise Sector and the Emergence of the Polish Fiscal Crisis, 1990-91." Policy Research Working Paper 1195. World Bank, Washington, D.C.
Schmalensee, R. and R. Willig, eds. 1989. Handbook of Industrial Organization. Amsterdam: North-Holland.
Sephton, Graham. 1993. "Dual Markets for Investors." In Privatization in Emerging Markets. Washington, D.C.: World EquitylrFC.
Shaikh, A. H. 1991a. "Financing Pakistan's Development through Improved Public Sector Management." In A. Nisam, ed., Financing Pakistan's Development in the Nineties. New York: Oxford University Press.
--. 1991 b. Malaysia's Public Enterprises: A Performance Evaluation. Development Discussion Paper 391. Cambridge, Mass.: Harvard Institute for International Development.
Shaikh, A. H., and M. Minovi. 1994. "Management Contracts: ARe
view oflnternational Experience." Background Paper. World Bank,
Policy Research Department, Washington, D.C.
Sherif, Khaled. 1992. "Egypt's Public Enterprise Experience." Pub
lished in Arabic. Cairo: Al-Ahram.
Sherif, Khaled, and Regina Soos. 1993. "Egypt's Liberalization Experi
ence and Its Impact on State-Owned Enterprise Industrial Performance." In Iliya Harik and Dennis Sullivan, eds., Privatization in the Middle East. Bloomington, Ind.: Indiana University Press.
Shirk, Susan L. 1993. The Political Logic of Economic Reform in China. Berkeley: University of California Press.
Shirley, Mary. 1989. "Evaluating the Performance of Public Enterprises in Pakistan." Policy, Planning, and Research Working Paper 160. World Bank, Washington, D.C.
--. 1991. "Improving Public Enterprise Performance: Lessons from
South Korea." Annales de l'economie publique sociale et cooperative 62 (1). De Boeck Universite, Brussels.
Shirley, Mary, and John Nellis. 1991. Public Enterprise Reform: The Lessons of Experience. Washington, D.C.: Economic Development Institute of the World Bank.
Siemens Aktiengesellschaft. 1993. "National Telephone Tariffs: World
wide Study Including Detailed Comparison." Munich.
Singh, Inderjit, and Gary Jefferson. 1993. "State Enterprises in China:
Down from the Commanding Heights." Transition 4 (8). World Bank, Washington, D.C.
Singh, lnderjit, Geng Xiao, and Dilip Ratha. 1994. "Nonstate Enter
prises as an Engine of Growth: An Analysis of Provincial Industrial
Growth in Postreform China." Policy Research Working Paper CH
RPS 20. World Bank, Washington, D.C. Societe Nationale des Telecommunications du Senegal (SPNATEL).
1989. "Rapport de suivi de !'execution du contrat plan 86-89 entre l'Etat et la SONATEL ala date du 30/06/1989." Dakar, Senegal.
Song, Dae Hee. 1988. "Korea Public Enterprise Performance Evaluation System." Asian Economic ]ournal106-138.
--. 1993. "The Political Economy of Public Enterprise Reform in Korea." Background paper. Policy Research Department, World Bank, Washington, D.C.
Spiller, Pablo, and Cezley Sampson. 1995. "Regulation, Institutions, and Commitment: The Jamaican Telecommunications Sector." In
REFER
337
ATS IN BUSINESS
338
Brian Levy and Pablo Spiller, eds., Regulations, Institutions, and
Commitment: Comparative Studies of Telecommunications. New York:
Cambridge University Press.
State Enterprises Commission (SEC). 1991. 1991 SOE Performance
Evaluation Report. Accra, Ghana.
--. 1993. The SOE Reform Program 1984/1992: Review and Recom
mendations. Accra, Ghana.
State Statistical Bureau of the People's Republic of China. Various years.
China Statistical Yearbook. Beijing: China Statistical Publishing House.
Stiglitz, Joseph E. 197 4. "Incentives and Risk Sharing in Sharecrop
ping." Review of Economic Studies 41:219-55. Svejnar, Jan, and Katherine Terrell. 1990. Labor Redundancy in the
Transport Sector: The Case of Chile. Washington, D.C.: World Bank. --. 1991. "Reducing Labor Redundancy in State-Owned Enter
prises." Policy Research and External Affairs Working Paper 792. World Bank, Washington, D.C.
Swanson, D., and T. Wolde-Semait. 1989. Aftica's Public Enterprise Sec
tor and Evidence of Reforms. Technical Paper 95. Washington, D.C.: World Bank.
Tandon, Pankaj. 1992. "Mexico." In Gala! and others, eds., We{fore
Consequences of Selling Public Enterprises: Case Studies ftom Chile,
Malaysia, Mexico, and the UK Washington, D.C.: World Bank.
Trivedi, Prajapati, ed. 1990. Memorandum of Understanding: An Ap
proach to Improving Public Enterprise Performance. New Delhi: International Management Publishers.
UNCTAD (United Nations Conference on Trade and Development).
1987. Handbook of Trade Control Measures of Developing Countries.
New York.
United Nations. Various years. Yearbook of National Accounts Statistics.
New York.
Valenzuela, Arturo. 1978. Breakdown ofDemocratic Regimes: Chile. Bal
timore: Johns Hopkins University Press. Vickers, J., and G. Yarrow. 1988. Privatization: An Economic Analysis.
Cambridge, Mass.: MIT Press.
Voravidh, Charoenloet. 1989. "Crisis of State Enterprises in Thailand." journal of Contemporary Asia 19 (2):206-217.
Waterbury, John. 1993. Exposed to Innumerable Delusions: Public Enter
prise and State Power in Egypt, India, Mexico, and Turkey. New York: Cambridge University Press.
Webster, Leila. 1993. The Emergence of Private Sector Manufacturing in
Poland. Technical Paper 237. Washington, D.C.: World Bank.
Wellenius, B., and P. Stern, eds. 1994. Implementing Reforms in the
Telecommunications Sector: Lessons from Experience. Washington, D.C.: World Bank.
Wijnbergen, Sweder van. 1991. "Should Price Reform Proceed Gradu
ally or in a 'Big Bang'?" Working Paper 702. Latin America and the Caribbean Regional Office, World Bank, Washington, D.C.
Williamson, Oliver. 1975. Markets and Hierarchies. New York: The Free Press.
--. 1976. "Franchise Bidding for Natural Monopolies-in General and with Respect to CATV." Bell journal of Economics 7 ( 1): 73-104.
World Bank. Various years. African Development Indicators. Washington, D.C.
--. 1990. "Mexico." Telecommunications Sector Technical Report
3207. Latin America and the Caribbean regional office, Country Operations Department, Washington, D.C.
--. 1991. Egypt: Alleviating Poverty during Structural Adjustment.
Country study. Washington, D.C. --. 1992. "Mexico, Public Enterprise Reform" Loan 3086. Program
Performance Audit Report. Operations Evaluations Department (OED). World Bank, Washington, D.C.
--. 1993a. ''Mrica Telecommunications Policy Study (Phase 1)." Malaysia Country Paper. Industry and Energy Department. Washington, D.C.
--. 1993b. "Regional Study on PE Reform and Privatization in Mrica." Mrica Technical Department. Washington, D.C.
--. 1993c. "Turkey: State-Owned Enterprise Sector Review," Re
port 10014 TU, Vol. II. Country Operations Division, Country Department I, Europe and Central Asia Region. Washington, D.C.
--. 1994a. "Performance Audit Report on Public Enterprise Sector Adjustment Project, Mali." Program Pension Audit Report. Operations Evaluation Department (OED). Washington, D.C.
--. 1994b. "World Bank Assistance to Privatization in Developing Countries." OED. Washington, D.C.
--. 1994c. World Debt Tables. (Disk.) Baltimore: Johns Hopkins University Press.
--. 1994d. World Development Report: Infrastructure for Develop
ment. New York: Oxford University Press.
RE
339
U C RAT S I N B US I N E S S
340
--. 1994e. World Tables. (Disk.) Baltimore: Johns Hopkins Univer
sity Press. Xiao, Geng. 1991. "What Is Special about China's Enterprises." Policy
Research Working Paper CH-RPS 13. World Bank, Washington, D.C.

Index
Africa, 227, 244, 246; African Management Services Company (AMSCO), 136, 147; contracts in, 112, 134-35, 143-44, 147; economic importance ofsoEs in,27,28,29,30,31
African Development Bank, 147 Aid and assistance, 14, 19, 100, 125, 145, 147, 177,
185, 221, 228, 259, 260, 261; decline in, 178, 184, 186; effect on SOE performance or reform of, 17, 183, 185, 186
Allende, Salvador, 165, 179, 180, 194, 195,222,227 Aquino, Corazon, 199, 219, 227 Arbitration, 8, 9, 111, 144, 163, 169. See also Dispute
resolution and settlement Argentina, 20, 160; divestiture in, 30, 243, 244, 245;
regulatory contracts in, 158, 160, 161-62, 163, 165, 166, 167, 249; telecommunications in, 9, 155, 156
Arrears, 82, 83, 85, 98, 99, 100, 111, 126, 128, 256, 261
Asia, 27, 28, 29, 30, 32, 41, 90, 112. See also by country name
Auctions, 110, 140, 157, 158, 169. See also Bidding, competitive
Autonomy, managerial, 5, 7, 22, 66, 74, 94, 95, 125, 127, 130, 131, 141, 143, 150, 164, 189, 190, 238, 255,256
Bangladesh, 1, 38 Banks, 5, 18, 47, 88, 101; privatization of, 5, 88, 89, 92,
99, 101, 195, 239, 243; state-owned, 47, 65, 69, 86, 87, 89,90,92,99,101,243,255
Barriers to entry, 17, 18, 77, 88, 260 Bidding, competitive, 8, 9, 20, 21, 72, 98, 140, 158,
162 Bonuses, 7, 124, 125, 130, 131, 133 Brazil, 41 Burden of state-owned enterprises, 19, 42, 43, 46, 48,
49, 75, 86, 183, 238; contribution to budget, 42, 43. See also Savings-investment (S-1) deficit
Capital, 20, 30 Capital markets, 87, 101 Capital transfers, 23, 36, 42, 45, 52, 82, 83, 84, 97, 98,
255 Central Europe, 46, 64, 65, 86. See also Eastern Europe Chile, 3, 4, 9, 38, 39, 57, 84, 88, 97, 101, 177,214,215,
217, 228, 239, 254; credibility of government in, 205, 207, 210-11, 224, 228, 236; divestiture in, 69, 70, 73, 80, 92, 93, 103, 243, 248; performance of SOEs in, 58, 60, 61, 63, 64, 77; political desirability of SOE reform in, 11, 179, 218; political feasibility of SOE reform in, 12, 192, 194-97, 221-22; regulatory contracts in, 167, 169, 249
China, 3, 64, 65, 66, 74, 81, 86, 92, 100,237, 255; credibility of government in, 187, 188-90; divestiture in, 71; performance of SOEs in, 4, 65-66, 73, 75, 76; political desirability of SOE reform in, 214, 224, 226; political feasibility of SOE reform in, 200, 202; performance contracts in, 256
Commitment of government, 6, 7, 8, 9, 19, 21, 24, 36, 108, 109, 111, 113, 128-30, 145-51, 154, 156, 161, 163-68, 171, 204, 224, 235, 238, 241, 243, 245, 250,251,253,254,256
Compensation: promises of, 12; severance pay, 191, 193, 196, 198, 211-12, 213, 248; to reform losers, 10, 176, 194-95, 197, 199, 201, 203, 204, 214, 215, 221-22,223,228,235,245
Competition, 3, 4, 8, 9, 23, 55, 67, 76, 80, 85, 87, 95, 248, 249, 256; barriers to or restrictions on, 19, 81, 177, 242, 254-55; foreign, 72, 79-81, 101, 102, 140; introducing or fostering, 5, 9, 21, 22, 39, 65, 72, 77-79, 80, 81, 84, 87, 93, 97-100, 190, 232, 238, 241,242,244,249,254-55
Competitive bidding. See Bidding, competitive Compulsion, overcoming resistance through, 12, 191,
194,197,198,221,222,235 Consumer benefit or satisfaction, 21, 38, 39, 152, 154,
156, 160, 168, 228, 238, 249
341
Contract enforcement, 7, 8, 9, 111, 112, 128-30, 134, 1•14, 145, 149, 150, 163, 164, 165, 168, 210, 226, 250. See also Reneging
Contracts, 2, 5, 6, 7, 8, 9, 21, 22, 23, 166-70,222,224, 225, 256. See also Management contracts; Performance contracts; Regulatory contracts
Credibility, 10, 13, 17, 19, 36, 108, 176, 191,203-15, 228; of regulatory regimes, 20, 21, 159, 164, 166, 167, 204, 233, 248, 250; and reputation of governments, 19, 36, 204-07, 210-14, 224, 225,233, 235, 236,237,238,240,241,243,251
Credit, 1, 9, 17, 18, 22, 42, 43, 45, 47, 91, 92, 93, 98, 100, 101, 259. See also Loans
Crisis, fiscal or economic, 178, 179, 181, 184, 185-86, 195-97,203,215,216-17,219,221,227,234,243, 259
Cross-debts, 85, 99. See also Arrears Czech Republic, 3, 58, 64, 65, 81, 86, 89, 100, 102,
177, 217, 254; credibility of government in, 214, 215, 224; divestiture in, 71, 242; performance ofSOEs in, 4; political desirability of SOE reform in, 187-88, 194, 221; political feasibility of SOE reform in, 200-02,205,223
Debt: bad debt, 16, 86, 92, 237, 239, 255; public as-sumption or write-off of, 17, 20, 83-85, 99, 245
Debt crisis, 181 Decision tree, 4, 15, 19, 20, 22,231-32 Deficits: current account, 50, 227; fiscal, 2, 17, 18, 19,
46-49, 57, 58, 61-63, 66, 76, 99, 183, 184, 212, 218,219,220,228,234,238-39,247,260. See also Savings-investment (s-I) deficit
de Ia Madrid, Miguel, 181, 182, 224 Democratic government, 177, 178, 190, 191, 199,211 Deng Xiaoping, 188, 189, 228 Diou£; Abdou, 223 Disputeresolutionandsettlement, 8, 9, 111,145,163,
167, 168, 250, 253. See also Arbitration Divested firms, 2, 5, 27, 71, 80, 99; performance of, 9,
67 Divestiture, 2, 3, 5, 20, 21, 26-32, 37, 38, 39, 51, 55,
58,61,67-72, 75,99, 151,153,233,242,243,245, 246-47, 250, 251, 252, 254; of competitive or potentially competitive activities, 21, 22, 69, 70, 72, 80, 242, 252; economic benefits of, 2, 4, 9, 22, 30, 46, 70, 71, 247; of noncompetitive or monopoly activities, 9, 22, 24, 243; poorly designed or timed, 168,
342
169, 180, 195, 239, 244, 245, 259; revenues from, 28, 69, 181,221, 235, 247; welfare effects of, 38-39, 53, 248. See also Privatization; Reform of state-owned enterprise; and by country
Domestic restraints on policy reversal, 13, 17, 204-07, 210-14,217,224,225,226,236,241
Eastern Europe, 25, 26, 27, 28, 46, 51, 65, 202 Economic growth, 1, 3, 23, 25, 35, 42, 45, 46, 47, 50,
65. See also Productivity Efficiency, 2, 9, 18, 45, 76, 111, 115, 118, 175, 218,
220; incentives for, 124, 137, 144, 153, 159, 170; of private versus state-owned enterprises, 1, 25, 35, 36-40,50,69,75
Egypt, 1,2,3,6, 18, 58,63,67,69, 71, 75, 76,82, 84, 89, 95, 98, 101, 108, 141, 217, 255, 256, 259, 261; credibility of government in, 13, 211, 224-25; divestiture in, 46, 89; performance of SOEs in, 4, 58, 60, 61, 64; political desirability of SOE reform in, 178, 183-84, 199, 218, 220, 228; political feasibility of SOE reform in, 192, 197, 199,200,221-23,240
Electric utilities, 60, 136, 184, 191, 261; divestiture of, 6, 7,27,38-39,80, 108,196,241,249
Employment reduction, 32, 65, 235, 245. See also Labor Employment in state-owned enterprises, 12, 19, 22,
31-32,33,52,115,129,139,143,166,182,183,191, 195, 196, 198, 218, 219, 222, 223, 239, 240; overstaffing, 19, 58, 84, 190, 191-93, 194, 196, 198, 218, 222, 228, 235. See also Labor; Resistance to reform
European Union, 205, 225, 229 Exports, 131,207,210,211,213,214,225,230 Expropriation risk, 13, 36, 111, 151, 162, 165,203,
206, 225, 226, 241. See also Credibility: and reputation of government
External assistance. See Aid or assistance
Failed reform, 2, 4, 5, 6, 7, 11, 14, 15, 16, 55, 56, 57, 64, 67, 95, 231, 237. See also Reform of state-owned enterprise: failure of
Fees, 145-47; performance-linked, 8, 67, 110, 134, 140, 141-44,150,253-54
Finances of state-owned enterprise: 22, 25, 35, 42, 43, 47; hard budget, 2, 3, 4, 5, 22, 55, 67, 76, 80, 81-84, 86, 87, 89, 97, 98, 99, 100, 188, 189, 201' 238, 252, 255; soft budget, 85, 86. See also Credit; Savingsinvestment (s-I) deficit
Financial intermediaries, 18, 87, 90, 92
Financial sector, 3, 4, 5, 18, 86, 88-89, 92, 93, 95, 101-02,260
Foreignaidorassistance,2, 14, 15, 17,145. SeealsoAid or assistance
Foreign investment, 13, 246, 247, 250, 251 Foreign loans or borrowing, 13, 42, 43, 84, 98, 100,
127, 184
GATT (General Agreement on Tariffs and Trade), 205, 207,224,225,229
Ghana, 1, 3, 6, 76, 80, 84, 95, 98, 101, 108, 113, 121, 123,124,126,128,171, 172,261;credibilityofgovernment in, 211-12, 213, 217, 224, 225, 228, 255; performance ofSOEs in, 4, 7, 58, 61, 64; political desirability of SOE reform in, 11, 12, 183, 218, 219, 220, 227, 234, 237; political feasibility ofsOE reform in, 12, 192, 197-98, 199, 200,221,240
Government and SOEs, 3, 5, 6, 14; relationship with management, 93, 94, 95, 107, 111, 112. See also Commitment of government; Credibility; Policy reversal
Guarantees: external, 17, 21, 145, 171, 250, 251, 260-61; government, 36, 82, 83, 84, 85, 97-100, 111, 160, 204
Guinea, 144 Guyana, 110, 139, 147, 148
Hard budgets, 3, 4, 22, 189, 201,252, 255 Hungary, 30, 91
Import levies, 100, 261 Imports: competition for, 79; controls or restrictions on,
81, 97, 98, 99, 100, 254 Incentives, 3, 5, 7, 18, 22, 23, 107-09, 113, 158, 168,
169, 170, 254; manager's, 67, 93, 94, 108, 120, 121, 127, 128, 130, 133, 136, 137, 144, 159; bonuses as, 7, 124, 125, 130, 133, 256; distorted, 3, 7, 8, 36, 45, 46, 92, 145. See also Fees; Rewards and penalties
India, 1, 3, 38, 47, 76, 85, 89, 94, 99, 102, 177, 261; credibility of government in, 13, 213, 222-23, 256; performance of SOEs in, 4, 58, 64; political desirability ofsOE reform in, 178, 184, 185,218, 235; political feasibility of SOE reform in, 192, 199, 200, 206, 220,240
Indonesia, 2, 38, 40 Inefficiency of state-owned enterprises (examples), 33, 35 Inflation, 40, 46, 47, 159, 161, 163, 171, 174,219,220,
225
Information: addressing problem of, 109, 120, 121, 124, 130, 140, 145, 155, 156, 157, 167, 168, 238, 248, 249, 253; competition and, 6, 7, 8, 9, 21, 23, 76, 109, 110, 140, 151, 158,256
Infrastructure, 20, 27, 92, 108, 124, 136, 150, 170 Interest rates, 5, 82, 85, 88, 89, 92, 93, 99, 101 Investment, 9, 20, 28-31, 33, 37, 42, 43, 46, 57, 60, 72,
83, 87, 88, 99, 101, 103, 111, 126, 129, 134, 143, 145, 147, 150, 152, 153, 155, 156, 158, 159, 160, 162, 166-67, 168, 170, 182, 202, 204, 226, 230, 241, 245-48, 251, 253, 260-61. See also Foreign investment
Jamaica, 153, 155-56, 157, 162, 250; regulatory contracts in, 9, 158, 159-60, 163, 164, 165, 166-67
Japan, 20
Kenya, management contracts in, 110, 139, 141, 143, 147
Klaus, Vaclav, 201, 202 Korea, Republic of, 3, 25, 76, 79, 88, 92, 95, 97, 101,
121-22,123-24,126-28,129,171, 172,217;credibility of government in, 205, 206, 207, 210, 211, 212, 224, 226, 256; divestiture in, 68, 69, 71; performance of SOEs in, 4, 58, 60, 61, 63, 64, 77; political desirability of SOE reform in, 178, 179, 183, 218-19; political feasibility of SOE reform in, 194, 221, 222
Labor, 10, 11, 12, 19, 143, 147, 180, 182, 183, 191, 195, 197, 221, 222, 223; disputes, 21, 139, 245. See also Unions
Labor productivity, 9, 113, 115, 117, 118, 130, 139, 153, 156
Layoffs, 12, 19, 21, 36, 58, 143. See also Employment reduction
Liquidation, 15, 58, 67, 68, 71, 74, 75, 91, 98, 99, 147, 184,186,244,246,260
Loans, 36,86-88,97,99, 100, 101, 128, 184,251. See also Foreign loans or borrowing
Macroeconomic policies, 16, 19, 39, 47, 181, 205, 206, 207, 210, 212, 213, 214, 217, 219, 224, 225, 227, 236,237-38
Malaysia, 153, 155, 156, 227; divestiture in, 38-39, 247; regulatory contracts in, 9, 158
Mali, 1
343
Management contracts, 8, 22, 108, 110; components of successful, 8, 148, 149, 150; defined, 6, 134
Managers: incentives, 3, 5, 7, 8, 17, 22, 36, 67, 93, 94, 108, 120, 121, 127, 128, 130, 133, 136, 137, 144, 159, 254, 255; private, 5, 6, 9, 22, 45, 108, 109, L33, 135, 143, 150, 168, 170. See also Government and SOEs; Autonomy, managerial
Mao Zedong, 188 Marcos, Ferdinand, 148, 166, 177, 199,212,213,219 Marcos, Imelda, 148, 173 Market failure, 36, 76 Markets, 170; contestability of, 36-38; liberalization of,
69, 80, 81, 84, 97-100, 238; relaxing of barriers to, 238,254
Mexico, I, 3, 9, 20, 47, 60, 73, 88, 92, 95, 97, 101, 110, 121, 122, 128, 129, 152, 155, 158, 160-62, 165, 166-67, 215, 217; credibility of government in, 207, 210, 212, 214, 224, 249; divestiture in, 29, 30, 38-39, 69, 80,245, 247; performance ofSOEs in, 4, 7, 58, 60, 61, 63, 64, 77; political desirability of SOE reform in, 11, 179, 181, 182, 185, 186, 218, 227, 234; political feasibility of SOE reform in, 194, 221-22, 223, 235
Monopolies, 35, 36, 38, 40, 50, 80, 81,84-85,98, 101; divestiture of, 3, 9, 21, 26, 28, 68, 72, 110, 150, 167, 169, 238, 242, 248; natural, 6, 8, 20-21, 23, 108, 152, 156, 232-33, 241, 249, 250; pricing policies for, 82, 84, 129, 160; splitting off competitive portions of, 69, 80, 157, 242. See also Regulatory contracts; Regulatory framework
Nontariffbarriers (NTBs), 98, 261
Objectives: conflicting, 36; noncommercial or social, 36,60, 76,100
Oil, I, 41, 58, 76, 99, 103, 122, 124, 136, 171, 172 Overstaffing, 19, 37, 58, 84, 190, 191-93, 194, 196,
198,218,222,228,235 Ownership, 39, 45-46, 60, 64, 65, 66; private, 6,
36--37, 41, 151-53, 221, 247, 248; public-private joint ventures, 66, 134
bzal, Turgut, 220,221,222, 223, 225, 230
Patronage, 149, 229 Pawlak, Waldemar, 214, 221 Performance contracts, 5, 6, 7-8, 17, 22-23, I 07,
112-33, 169-70, 171-73, 190, 222, 224, 238, 255-57,259;defined,6, 107,171
344
Performance evaluation, 172, 173 Personnel policy. See Labor; Autonomy, managerial Peru,2 Philippines, 3, 9, 76, 95, 98, 101, 122, 126, 127, 141,
147, 152, 153, 155, 156, 158, 159-60, 161-62, 163, 164, 166, 167, 173, 177, 217, 227, 229, 261; credibility of government in, 211-13, 224, 236; electric utilities in, 35, 123, 124, 127, 139; performance of SOEs in, 4, 42, 58, 61, 63, 64, 75, 78; political desirability of SOE reform in, 183, 218, 219-20; political feasibility of SOE reform in, 197, 199,221,229
Pinochet, Augusto, 177, 179, 181, 194, 211 Poland, 3, 46, 58, 64, 65, 81, 86, 89, 91, 100, 134, 177,
217, 254; credibility of government in, 205, 214-15, 224; divestiture, 30, 71, 7 4; performance of SOEs in, 4; political desirability of SOE reform in, 187-88, 221; political feasibility ofsoE reform in, 200,201, 221,223-24
Policy reversal, 13, 17, 19, 70, 80, 81, 99, 166, 213, 229, 236, 243. See also Credibility
Political costs, 10, 12, 16, 23, 129, 145, 149, 175, 178, 181,205,218,219,253,257
Pollution, 2, 41 Preferences, purchasing or bidding, 85, 98 Price caps, 159-61, 249 Price controls and regulations, 9, 21, 35, 36, 42, 60, 81,
83, 85, 98, 110, 116, 125, 141, 144, 158, 159-62, 219, 249; deregulation or liberalization of, 58, 60, 65,77,80,97,98,99, 100,219,224,242
Private sector growth, 19, 32, 38, 46, 68, 71, 73-75 Privatization, 2, 9, 12, 21, 41. See also Divestiture Productivity, 4, 8, 38-39, 42, 51, 57, 58, 60, 61,
65-66,70,75,86,101,109,123,130,131,136-39, 148, 152, 153, 155, 156, 160, 162, 167, 184, 190, 249,252;labor, 9, 113,115,117-18,130,139,153, 156; total factor (TFP), 7, 57, 61, 66, 76, 101, 102, 113,115,118,126,153, 171, 172
Profitability, 8; private, 52, 85, 204; public, 42, 58, 123-24,173,184,252
Railroads, 97, 99, 150, 198, 249; in Chile, 84, 103, 196; in the Philippines, 139,140,141,143,144,148,173
Rateofreturn, 152,155,156,158,159,163,165,171, 248-51; on assets (ROA), 7, 113, 161; guaranteed, 204; regulation of, 159-60
Rawlings, Jerry, 212, 219
Readinesstoreform,4, 11, 13, 14, 15, 16, 17,177,213, 216,233,234,236,237
Reform of state-owned enterprise: components of successful, 4, 5, 10, 15, 175, 176; costs versus benefits of, 9, 10, 15, 17, 21, 23, 60, 178, 179, 183, 218, 219; decision tree for, 4, 15, 19, 20, 22, 231-32; design and sequencing of, 5, 6, 9, 20, 92, 193,210, 211; failure of, 4, 5, 11, 55, 56, 57, 64, 67, 95; foreign assistance affecting, 11, 17, 111, 128, 133, 178, 183, 184, 185, 186, 187, 228; obstacles to, 2, 4, 10, 23, 176, 184, 188, 199, 223; political credibility of, 10, 13, 17, 19, 36, 108; political desirability of, 10, 11, 15, 16, 17, 178-90, 227; political feasibility of, 10, 11, 13, 16, 17, 18, 190-203;predictorsofsuccessin, 13, 14,175,176,177,179,191,193,206,215-17,229. See also Resistance to reform; and by country
Regime change or shift, 10, 11, 178, 179, 183, 184, 187,215-20,227,234,260
Regulation: financial, 5, 18, 86, 88, 89, 90, 92, 93, 101-02, 238, 239, 243, 250; rate of return, 84; price, 5, 9, 21, 82, 84, 85, 129, 144, 151, 158-62, 163, 165, 169, 249
Regulatory contracts, 6, 9, 21, 108, 112, 150-68, 169, 170,250,251,256;defined,9, 72,108
Regulatory framework, 20, 38, 40, 46, 101, 233, 238, 241,242,248-50
Regulatory reform, 97, 152-53,239 Reneging, 7, 23, 111, 126-27, 128-29, 130, 133, 165,
172,204,205,211,236,238,251,255 Resistance to reform: ability or means of reducing, 178,
194, 195, 199, 200, 221, 222, 223, 235; from SOE employees, 12, 19, 139, 187, 191, 193, 200, 203, 223,240
Restitution. See Compensation Return on assets. See Rate of return Reversal. See Policy reversal Rewards and penalties, 6, 94, 108, 109, 110-11, 112,
113; in management contracts, 8, 134, 139, 140, 141-43, 253; performance contracts and, 7, 23, 120, 122, 124-25, 128, 130, 255-56; regulatory contracts and, 9, 151, 153, 156, 158-62, 167, 168,238, 248-50
Risk: of expropriation, 13, 36, 111, 151, 162, 165, 206, 210; investment, 13, 21, 150, 169, 170, 204, 206, 211, 229. See also Expropriation risk
Salaries of SOE workers. See Wages of SOE workers
Sale of state-owned enterprises. See Divestiture Salinas, Carlos, 221, 224 Savings-investment (s-r) deficit, 4, 42, 47, 49 Senegal, 1, 2, 3, 76, 85, 95, 98-99, 102, 172, 227,
259, 261; credibility of government in, 213, 224, 225, 255; performance of SOEs in, 58, 63, 64; political desirability ofsOE reform in, 184-87,218,227, 235; political feasibility of SOE reform in, 200, 223, 229
Severance pay, 12, 21, 191, 196, 198, 211, 212, 213, 245,246,248
Share distribution, 12, 13, 17, 28, 71, 102, 149, 166, 201, 205, 210, 215, 224, 225, 228, 235, 236, 243, 245,246-47,248,260
S-I deficit. See Savings-investment (s-I) deficit Social objectives, 36, 60, 76, 100. See also Objectives:
Noncommercial or social; Welfare effects of divestiture SOE. See State-owned enterprise (SOE) Soft budget, 85, 86 Soft or directed credit, 17, 18, 22, 65, 83, 84, 86, 88,
89,92,98,238,239,242,254,255 Sri Lanka, 6, 108, 134, 136, 138, 140, 143, 146, 149,
173 State-owned enterprise (SOE): defined, 26; financial
performance of, 57, 58, 59, 60, 65, 66; government transfers to, 23, 36, 42, 45, 52, 82, 83; investment in, 20, 28, 29, 30, 33, 36, 42, 46; patronage in, 183; performance compared with private firms, 25, 35-40, 50, 51, 69, 71, 75; share of economy or GDP, 1, 2, 5, 30, 31, 33; share of external debt, 43; share of total employment, 31, 32, 33. See also Reform of state-owned enterprise; Savings-investment (s-r) deficit; and by country names
Stock markets, 88, 90, 102, 226, 246 Strikes or demonstrations, 12, 137, 140, 190, 191,
193-98,222,223,227,235 Sub-Saharan Africa. See Africa Subsidies, 1, 11, 22, 25, 36, 47, 52, 60, 70, 75, 81-86,
89-91,97-100,178,183,189,190,205,220,225, 239, 242, 259; implicit, 82, 83, 84-85, 159, 160, 239, 240, 259; interest rate, 19; reduction or ending o( 5, 10, 17,80,86,228,229,238,254,255
Suchocka, Hanna, 221
Tanzania, 1, 35, 47 Taxation, 83, 90,98-99, 101; SOE exempt from, 52, 81,
85,86,244,254
345
Telecommunications, 6, 27, 38, 39, 108, 136, 150-53, 156, 157, 159, 162, 191, 196, 241, 247; in Argentina, 110, 161, 163, 165, 166, 167, 249; in Chile, 161-62, 163-67, 169, 171, 173, 197, 248, 249; in Jamaica, 159-60, 162, 163, 164, 165, 166-67, 250; in Korea, 122, 124, 127, 171; in Mexico, 69, 152, 161-62, 165, 166, 167,221, 249; in the Philippines, 152, 155, 159, 160, 162, 163, 164, 166, 167; in Senegal, 7, 116, 117-18, 123, 126, 171, 172; in Turkey, 225; in the United Kingdom, 165
Total factor productivity (TFP), 7, 57, 61, 66, 76, 102, 1 L), 115, 118, 123-24, 126-27, 130-31, 153, 171, 172; defined, 101
Totalitarian or authoritarian government, 177, 188, 191,217
Trade: barriers to, 205; import levies on, 80, 81, 1 00; liberalization of, 5, 17, 18, 31, 77, 80, 81, 98, 100,210, 224, 225, 229, 230, 238, 239, 242, 260; nontariff barriers (NTBs) on, 81, 98, 100
Trade liberalization, 5, 17, 18, 31, 77, 80, 81, 98, 100, 210,224,225,229,238,239,242,260
Transaction costs, 8, 36, 149 Transfers. See Capital transfers Transition economies, 19, 30, 74, 75, 81, 86, 89, 90, 91,
100, 130, 131, 134. See also by region and country Transparency of transactions, 20, 21, 140, 233, 238,
241,242,244,248 Transport, 19, 69, 80, 85, 97, 98, 99, 108, 136, 196 Tunisia, 20, 47
Turkey,2,3,33,47,64, 76,80,95,99-100,102,215, 227, 261; credibility of government in, 213, 224, 225-26; divestiture in, 81; performance of SOEs in, 4, 42, 58, 61, 63, 64, 76; political desirability of SOE reform in, 11, 178, 184-85, 218, 220-21, 235, 237; political feasibility of SOE reform in, 192, 199, 200, 223
Undercapitalization, 92 Unions, 188, 196, 197, 198 United Kingdom: divestiture in, 26, 38, 39 Utilities. See Electric utilities; Telecommunications;
Water utilities
Value added, 30-31, 98, 156-58, 225, 229 V elver Revolution, 11 Venezuela, 155, 245, 249; regulatory contracts in, 9,
158, 160, 161-62, 163, 165, 166-67 Voucher privatization, 188,201,202
Wages ofSOE workers, 19, 60, 116, 125, 143, 179, 181, 184,218,220,221,234,240
Water utilities, 6, 8, 22, 27, 36, 103, 108, 136, 138, 140, 148, 150
Welfare effects of divestiture, 38-39, 53, 248 World Bank, 15, 41, 52, 81, 113, 127-29, 140, 148,
171, 173 World Trade Organization. See GATT
The complete backlist of publications from the World Bank is shown in the annual Index of Publications, which contains an alphabetical title list and indexes of subjects, authors, and countries and regions. The latest edition is available free of charge from the Distribution Unit, Office of the Publisher, The World Bank, 1818 H Street, N.W., Washington, D.C. 20433, or from Publications, The World Bank, 66, avenue d'Iena, 75116 Paris, France.
346
•
Top Related